


Abstract
Metronidazole (MNZ) is a nitroimidazole antibiotic that is poorly removed by conventional biological wastewater treatment, motivating interest in microalgae-based tertiary treatment strategies. This study characterizes the concentration-dependent toxicity, degradation kinetics, and removal mechanism of MNZ by Tetradesmus obliquus monoculture, and examines whether external carbon supplementation can enhance its degradation capacity. Across a concentration range of 1–9 mg/L, MNZ inhibited T. obliquus growth and photosynthetic pigment content in a dose-dependent manner, while degradation efficiency declined correspondingly, from 25.5% at 1 mg/L to 12.8% at 9 mg/L. Dark-condition controls combined with reactive oxygen species quenching showed that MNZ removal was dominated by extracellular organic matter (EOM)-mediated indirect photodegradation, with triplet-state EOMs (3EOM*) identified as the dominant reactive species. Supplementation with exogenous glucose (0–200 mg/L) induced a heterotrophic metabolic shift that enhanced MNZ photodegradation in a dose-dependent manner; EEM-PARAFAC fluorescence analysis linked this enhancement to selective enrichment of protein-like, tryptophan/tyrosine-associated EOM components rather than a uniform increase in total EOM content. These findings indicate that the carbon-responsive enhancement of EOM photoreactivity previously reported for a methanotroph–T. obliquus co-culture system reflects a conserved algal metabolic response rather than a phenomenon contingent on bacterial partnership, and establish a mechanistic and kinetic baseline for algal-mediated antibiotic photodegradation independent of bacterial co-culture.
1. Introduction
The occurrence of persistent pharmaceutical contaminants in municipal wastewater treatment plant (WWTP) effluents is a major route by which emerging organic contaminants enter aquatic ecosystems, posing risks to environmental and public health [1]. Among these, the nitroimidazole antibiotic metronidazole (MNZ) is of particular concern because of its widespread clinical and veterinary use, high aqueous solubility, and pronounced resistance to conventional biological treatment. Reported removal efficiencies in activated-sludge systems vary widely with plant configuration and operating conditions, but are frequently well below those achieved for more readily biodegradable pharmaceuticals. Residual MNZ concentrations of up to several μg/L have been measured in WWTP influents and effluents [2,3,4]. This recalcitrance largely stems from the nitro-heterocyclic structure of MNZ, which is poorly recognized by common microbial enzymatic degradation pathways, allowing the compound to persist through conventional secondary treatment and enter receiving water bodies [5,6].
To address the limitations of conventional biological treatment, advanced oxidation processes (AOPs) and adsorption-based technologies have been widely explored for the tertiary removal of recalcitrant antibiotics such as MNZ [7]. However, these approaches present notable trade-offs: AOPs are energy-intensive and may generate toxic transformation byproducts, while adsorption merely transfers the pollutant to a solid phase without achieving true degradation, creating a secondary waste-disposal burden [7]. These limitations have motivated growing interest in microalgae-based treatment systems as a sustainable alternative, owing to their low operational cost, minimal chemical input, and potential for simultaneous nutrient recovery and carbon sequestration [1,8].
Microalgae can contribute to antibiotic removal through several concurrent pathways, including biosorption, bioaccumulation, biodegradation, direct photolysis, and—critically—indirect photodegradation mediated by algal-secreted extracellular organic matter (EOMs) [5]. Upon light exposure, chromophoric and protein-like fractions of EOMs can be excited to reactive triplet states (3EOM*), which subsequently generate reactive oxygen species capable of oxidizing structurally recalcitrant pollutants that otherwise resist direct biological attack [9,10]. This EOM-mediated pathway has been demonstrated for a range of antibiotics and algal species, including the photodegradation of chlortetracycline by EOMs secreted from Chlorella vulgaris [11], suggesting that deliberately enhancing the quantity and photoreactivity of secreted EOMs may be an effective strategy for improving algal-based antibiotic removal.
Tetradesmus obliquus (formerly Scenedesmus obliquus) is a robust, mixotrophic green microalga widely used in wastewater treatment and biofuel applications, capable of switching between photoautotrophic and heterotrophic metabolism depending on the availability of exogenous organic carbon [8]. This metabolic flexibility has recently been exploited in a methanotroph–T. obliquus co-culture system, in which metabolites secreted by Methylocystis bryophila induced a mixotrophic shift in the alga and substantially enhanced the secretion of photoreactive EOMs. The resulting synergistic MNZ degradation exceeded that of either monoculture [12]. That study established the synergistic potential of the co-culture, but did not resolve how the alga’s own carbon status regulates the quantity and molecular composition of its secreted EOMs, independently of the bacterial partner.
Resolving this question has practical relevance beyond the co-culture context. If the carbon-responsive enhancement of EOM photoreactivity reflects a conserved metabolic response of T. obliquus rather than a phenomenon contingent on bacterial signaling, external carbon supplementation could enhance algal-based antibiotic photodegradation without any bacterial partner. A concentration-resolved, mechanistically verified characterization of MNZ removal by T. obliquus alone would also provide a quantitative reference point for interpreting the magnitude of synergy achieved in more complex consortia.
In this study, we systematically investigate MNZ degradation by T. obliquus monoculture across a 1–9 mg/L concentration gradient, combining growth and photosynthetic-pigment inhibition assays, pseudo-first-order degradation kinetics, mechanistic verification through dark-condition and reactive-oxygen-species quenching experiments, and glucose-induced carbon supplementation coupled with EEM-PARAFAC fluorescence analysis. By establishing a detailed mechanistic and kinetic baseline for MNZ removal by T. obliquus alone, this work provides both a standalone characterization of algal-mediated antibiotic photodegradation and a quantitative reference point for interpreting the synergistic contribution of bacterial partners in more complex methanotroph–microalga consortia.
2. Materials and Methods
2.1. Microalga Strain and Standard Culture Conditions
The green microalga Tetradesmus obliquus (FACHB-416, formerly known as Scenedesmus obliquus) was used throughout this study. Stock cultures were maintained in Nitrate Mineral Salts (NMS) medium, pH 6.2, prepared as originally described by Whittenbury et al. [13] and used in the same formulation as in our companion co-culture study [12]. Prior to inoculation, cells in the exponential growth phase were washed three times with sterile NMS medium by centrifugation to remove residual metabolites.
2.2. Effects of Metronidazole on the Growth and Photosynthesis of T. obliquus
To evaluate the concentration-dependent toxicity of metronidazole (MNZ) toward T. obliquus, 200 mL of NMS medium was added to 500 mL transparent serum bottles sealed with aluminum-plastic composite caps. The headspace was evacuated to −0.1 MPa using a vacuum pump and backfilled with a premixed gas of 50% N2 and 50% CO2. The bottles were autoclaved (121 °C, 30 min) and cooled to room temperature prior to inoculation.
T. obliquus was inoculated at an initial cell density of approximately 1 × 10⁶ cells/mL. MNZ (>99% purity, Sigma-Aldrich, St. Louis, MO, USA) was added from a concentrated stock solution (600 mg/L) at volumes of 0, 0.33, 1, 2, and 3 mL to achieve final concentrations of 0, 1, 3, 6, and 9 mg/L, respectively. This range lies above the ng/L to low µg/L concentrations reported for municipal effluents [3,4], and was selected so that residual MNZ could be quantified by direct HPLC injection and so that both toxicity and degradation kinetics could be resolved across a measurable dose range. Cultures were incubated at 25 ± 1 °C under a 12 h/12 h light/dark cycle with magnetic stirring at 200 rpm. Illumination was provided by T8 linear fluorescent lamps (20 W), giving an incident illuminance of 10,000 lux at the bottle wall (approximately 135–145 µmol photons m−2 s−1 of photosynthetically active radiation) with emission confined to the visible range, approximately 400–700 nm. All treatments were performed in triplicate.
Biomass was monitored every 48 h by measuring optical density at 680 nm (OD680). In parallel, 1 mL aliquots were filtered through 0.45 μm membranes and stored at 4 °C for subsequent quantification of MNZ by high-performance liquid chromatography (HPLC). At the end of cultivation, 10 mL of algal suspension was collected for photosynthetic pigment analysis.
2.3. Degradation Kinetics of Metronidazole at Different Initial Concentrations
Degradation kinetics of MNZ by T. obliquus were evaluated across the concentration gradient described in Section 2.2 (1, 3, 6, and 9 mg/L). Time-course MNZ concentrations were fitted to a pseudo-first-order kinetic model to obtain the apparent degradation rate constant (kobs) for each treatment.
2.4. Two-Stage Experiment to Elucidate the Dominant Degradation Mechanism
To determine the primary mechanism responsible for MNZ removal in the T. obliquus system—biosorption, bioaccumulation, biodegradation, or EOM-mediated photodegradation—a two-stage experiment was designed.
Stage 1 (Scale-up phase): T. obliquus was cultivated as described in Section 2.2 without MNZ addition until reaching the exponential growth phase (day 9), to accumulate sufficient biomass and metabolic activity.
Stage 2 (Dark phase): At the end of the light cycle on day 9, serum bottles were wrapped in aluminum foil to exclude light. Glucose (150 mg/L) was simultaneously supplied to sustain cellular activity by supporting heterotrophic metabolism, given that the cells retained photosynthetically fixed carbon reserves from the preceding stage. MNZ was then added to a final concentration of 3 mg/L, and its removal was monitored under complete darkness. All treatments were performed in triplicate.
2.5. Identification of Dominant Reactive Oxygen Species via Chemical Quenching
To identify the reactive oxygen species (ROS) responsible for EOM-mediated photodegradation of MNZ, EOMs were extracted from T. obliquus cultures during the late exponential growth phase. Thirty milliliters of the extracted EOM solution was transferred into 100 mL transparent serum bottles, sealed with aluminum-plastic composite caps, and equilibrated with ambient air in the headspace. Metronidazole was added from a concentrated stock solution (600 mg/L) at a volume of 150 μL to achieve a final concentration of 3 mg/L, consistent with the concentration used in the main degradation experiments (Section 2.2, Section 2.3 and Section 2.4).
Chemical quenchers were added to parallel treatments to intercept specific reactive species: 2 mM sorbic acid (SA) for triplet-state EOMs (3EOM*), 20 mM isopropyl alcohol (IPA) for hydroxyl radicals (·OH), and 8 mM furfuryl alcohol (FFA) for singlet oxygen (1O2). These concentrations follow values established in the dissolved- and extracellular-organic-matter photochemistry literature [9,11,14] and correspond to a molar excess of more than two orders of magnitude over MNZ (17.5 µM). None of these scavengers is strictly selective: FFA reacts with ·OH as well as with 1O2, IPA can quench excited triplet states, and sorbate reacts efficiently only with the higher-energy fraction of the triplet pool [14]. The resulting inhibitions are therefore used to rank the reactive species rather than to partition the degradation rate among them. A quencher-free control (EOM + MNZ) was included for comparison. All bottles were incubated on a magnetic stirrer at 200 rpm and maintained at 25 ± 1 °C under a 12 h/12 h light/dark cycle at a light intensity of 10,000 lux. Liquid samples (1 mL) were withdrawn every 48 h to monitor MNZ concentration by HPLC. All treatments were performed in triplicate.
2.6. Glucose Supplementation to Enhance Heterotrophic Metabolism and Photodegradation
To investigate the effect of an external carbon source on the heterotrophic metabolism and MNZ-degrading capacity of T. obliquus, glucose was supplied at five concentrations (0, 50, 100, 150, and 200 mg/L). Cultures were established as described in Section 2.2, with the MNZ concentration fixed at 3 mg/L. All treatments were performed in triplicate. Samples were collected periodically to monitor optical density (OD680) and residual glucose concentration. At the end of cultivation, photosynthetic pigment content, EOM concentration, and EOM spectral/fluorescence properties were determined.
2.7. Analytical Procedures
Metronidazole quantification. MNZ concentration was determined by high-performance liquid chromatography (HPLC, Hitachi L-2000, Tokyo, Japan) using an Agilent ZORBAX SB-C18 column (4.6 × 250 mm, 5 μm) and a UV detector set to 318 nm. The mobile phase consisted of methanol and ultrapure water (30:70, v/v) at a flow rate of 1.0 mL/min, with a column temperature of 30 °C and an injection volume of 20 μL; the retention time of MNZ was 4.5 min. Samples were filtered through 0.45 µm membranes before injection, so all concentrations reported here refer to the dissolved fraction. External calibration used standards spanning 0.1–10 mg/L (7 levels, r2 = 0.999), with limits of detection and quantification, defined as three and ten times the signal-to-noise ratio, of 0.03 and 0.1 mg/L.
Photosynthetic pigment content. Chlorophyll a, chlorophyll b, and carotenoid contents of T. obliquus were determined by an ethanol-extraction spectrophotometric method [15]. Briefly, 5 mL of algal suspension was centrifuged at 10,000 rpm for 8 min and the supernatant discarded. An equal volume of 95% ethanol was added, and the mixture was vortexed and incubated in a 75 °C water bath for 15 min, followed by cooling to room temperature. After centrifugation, the absorbance of the supernatant was measured at 470, 649, and 665 nm. Pigment concentrations were calculated as follows:
Chl a (mg/L) = 13.95 × OD665 − 6.88 × OD649
Chl b (mg/L) = 24.96 × OD649 − 7.32 × OD665
Carotenoid (mg/L) = (1000 × OD470 − 2.05 × Chl a − 114.8 × Chl b)/245
Isolation and bulk characterisation of EOMs. EOMs were isolated from the culture medium by centrifugation and 0.22 μm filtration. Background signals of fresh NMS medium were subtracted from all UV–Vis and EEM measurements. The total organic carbon (TOC) content of the EOMs was measured using a TOC analyzer (Aurora 1030 W, OI Analytical, College Station, TX, USA).
UV–Vis and fluorescence spectroscopy. Absorbance spectra were recorded from 200 to 800 nm at 1 nm intervals in a 1 cm quartz cuvette on a UV–Vis spectrophotometer (UV-2700, Shimadzu, Kyoto, Japan). Three-dimensional excitation–emission matrices (EEMs) were acquired on a Cary Eclipse fluorescence spectrophotometer (Agilent Technologies, Santa Clara, CA, USA) over excitation wavelengths of 200–450 nm in 5 nm increments and emission wavelengths of 250–600 nm in 2 nm increments, with excitation and emission slit widths of 5 nm and a scan speed of 1200 nm min−1. Each EEM was corrected for inner-filter effects using the absorbance spectrum of the corresponding sample and normalised to the area of the water Raman peak at an excitation wavelength of 350 nm, so that intensities are expressed in Raman units. Regions affected by first- and second-order Rayleigh and Raman scattering were excised and treated as missing values before modelling.
PARAFAC modelling. Models were fitted in MATLAB (R2024b) using the drEEM toolbox with non-negativity constraints on all three modes, following the tutorial of Stedmon and Bro [16]. The dataset comprised 10 corrected EEMs covering the full glucose gradient and all replicates, screened for outliers by leverage analysis. Models with two to five components were compared on the basis of core consistency, split-half validation and the spectral structure of the residuals; the two-component model was retained, with a core consistency of 99.27%. Validation outputs are given in the Supplementary Material (Figures S1 and S2, Table S1).
Glucose quantification. Residual glucose concentration in the culture medium was determined by HPLC (Hitachi L-2000, Tokyo, Japan) equipped with a refractive index detector and an ion-moderated partition chromatography column (Aminex HPX-87H), using 5 mM H2SO4 as the isocratic mobile phase at 0.6 mL min−1 and a column temperature of 65 °C.
2.8. Statistical Analysis
All experiments were performed in triplicate, and results are presented as mean ± standard deviation. Statistical significance between treatment groups was determined by one-way analysis of variance (ANOVA) with Tukey’s post-hoc test, with p < 0.05 considered statistically significant.
3. Results
3.1. Concentration-Dependent Effects of Metronidazole on the Growth and Photosynthesis of T. obliquus
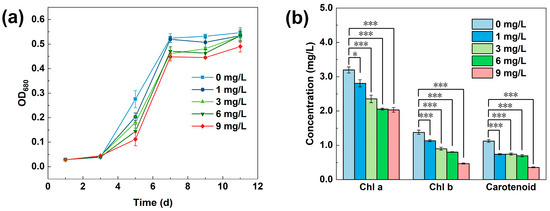
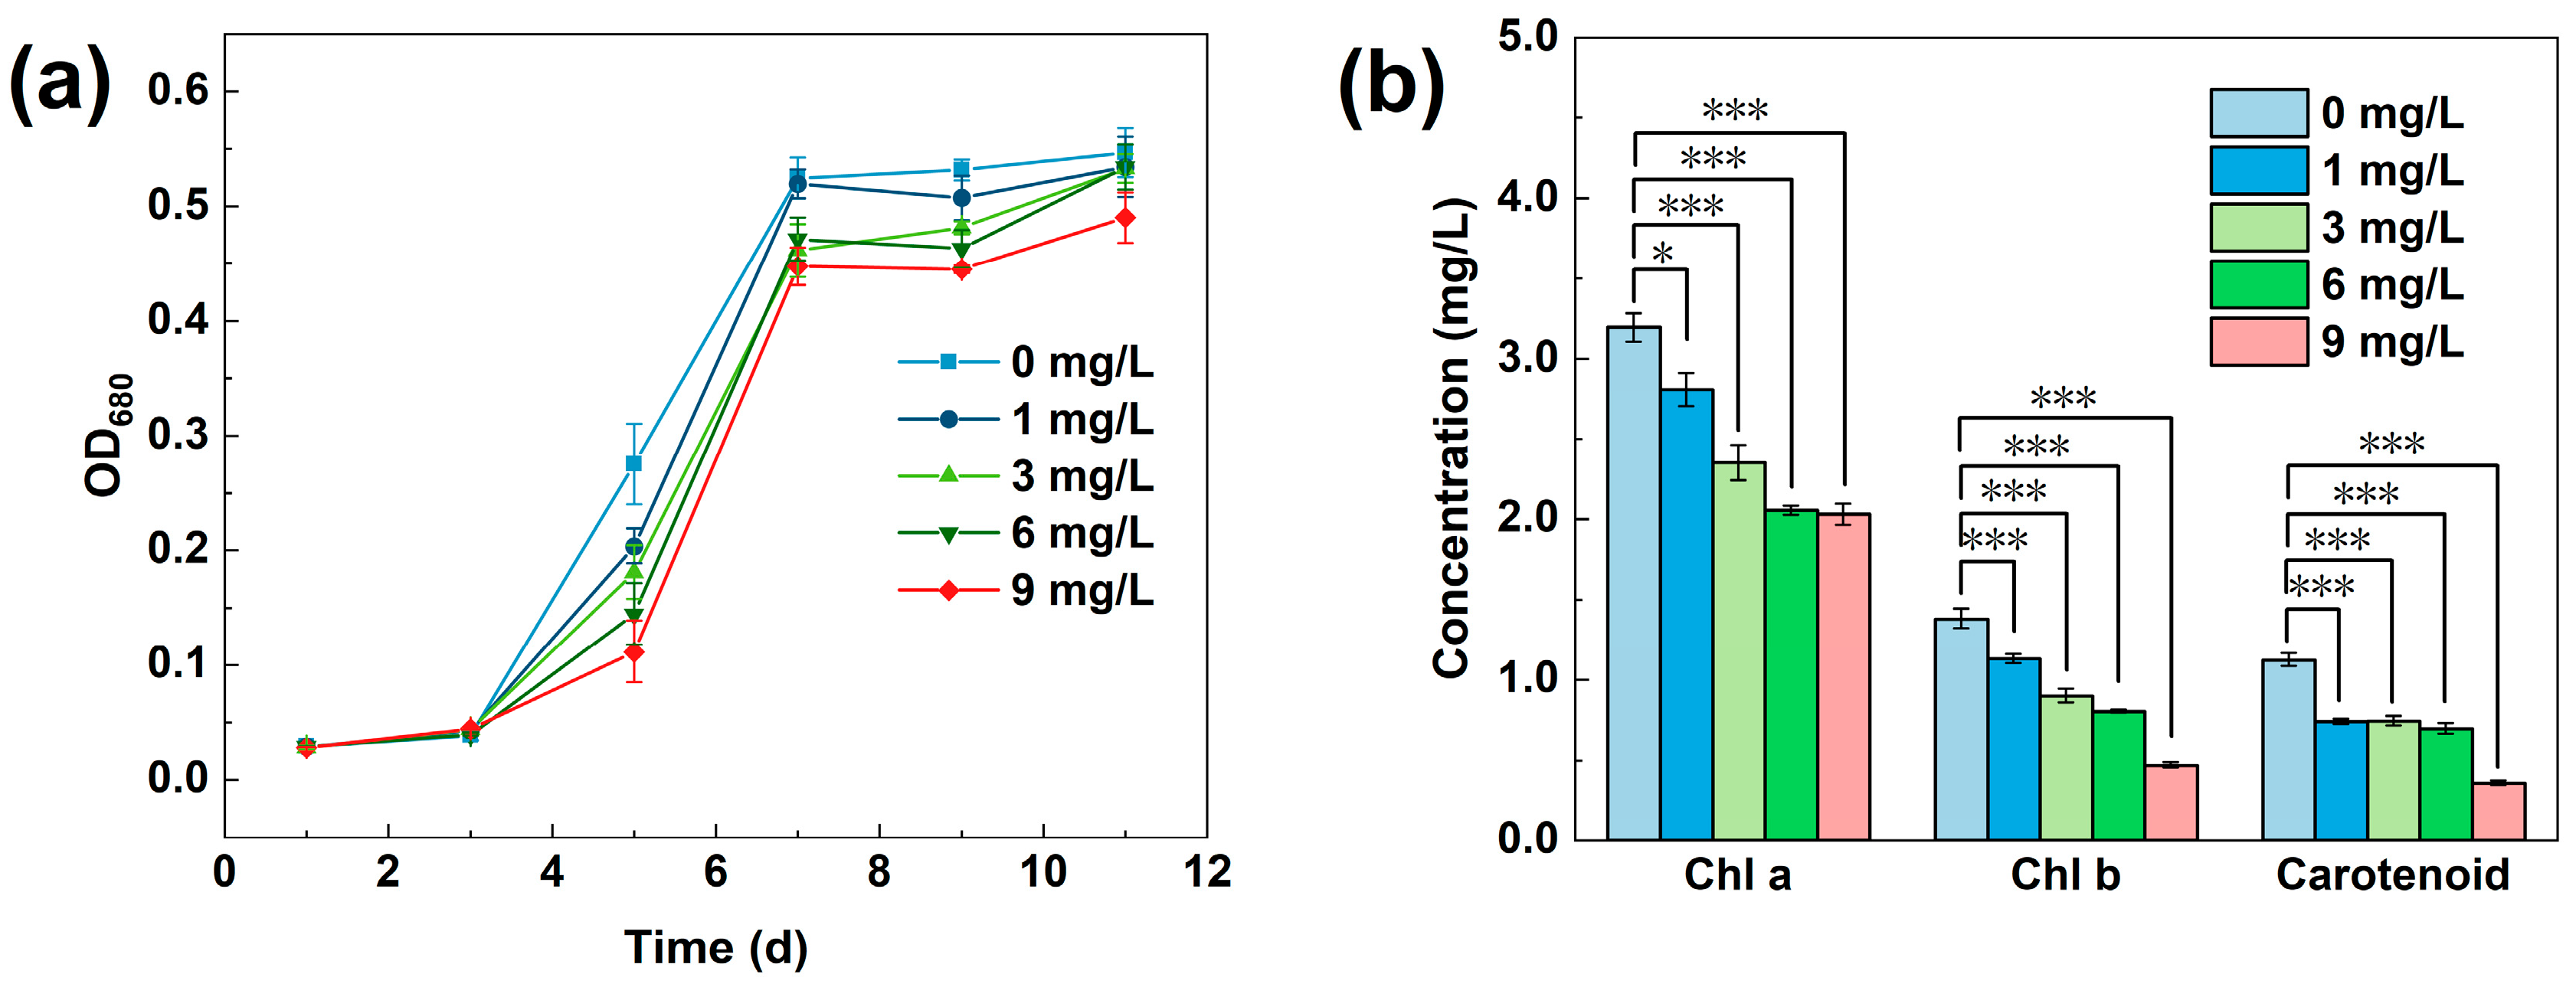
The proliferation of T. obliquus was inhibited by metronidazole (MNZ) in a concentration-dependent manner (Figure 1a). While the untreated control entered the exponential growth phase on day 2, the onset of exponential growth was delayed in all MNZ-amended treatments, reflecting the toxic effect of the antibiotic. The specific growth rate decreased progressively with increasing MNZ concentration, with inhibition rates of 5.39%, 6.08%, 8.73%, and 12.10% at 1, 3, 6, and 9 mg/L, respectively. Cell density at the stationary phase was likewise reduced relative to the control across all treatments, confirming that elevated MNZ concentrations significantly suppressed the proliferation of T. obliquus.
Figure 1.
Concentration-dependent effects of metronidazole on T. obliquus physiology. (a) Biomass accumulation over time under 0, 1, 3, 6, and 9 mg/L MNZ, corresponding to inhibition rates of the specific growth rate of 5.39%, 6.08%, 8.73%, and 12.10%, respectively. (b) Photosynthetic pigment content (chlorophyll a, chlorophyll b, and carotenoid) at the end of cultivation across the same concentration gradient; at 3 mg/L MNZ, inhibition rates reached 26.33%, 34.79%, and 33.87% for chlorophyll a, chlorophyll b, and carotenoid, respectively, increasing to 36.42%, 65.94%, and 67.99% at 9 mg/L. Data are presented as mean ± standard deviation (n = 3); asterisks indicate significant differences from the untreated control (* p < 0.05, *** p < 0.001).
Photosynthetic pigment content followed a similar concentration-dependent decline (Figure 1b). Chlorophyll a and chlorophyll b are the principal pigments responsible for light harvesting and energy transfer during photosynthesis, whereas carotenoids serve a photoprotective role by mitigating photooxidative damage. As MNZ concentration increased, the contents of chlorophyll a, chlorophyll b, and carotenoids all decreased in parallel with the observed reduction in biomass. At 3 mg/L MNZ, the inhibition rates of chlorophyll a, chlorophyll b, and carotenoid content reached 26.33%, 34.79%, and 33.87%, respectively, increasing further to 36.42%, 65.94%, and 67.99% at 9 mg/L. Chlorophyll b and carotenoids were thus more sensitive to MNZ exposure than chlorophyll a, indicating that MNZ toxicity affected the photosynthetic pigment pools unevenly.
3.2. Degradation Kinetics of Metronidazole by T. obliquus at Different Initial Concentrations
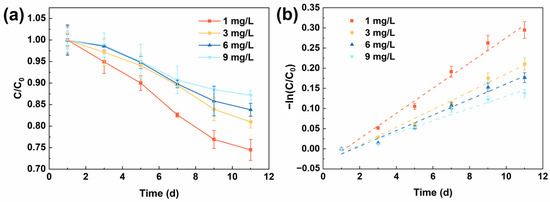
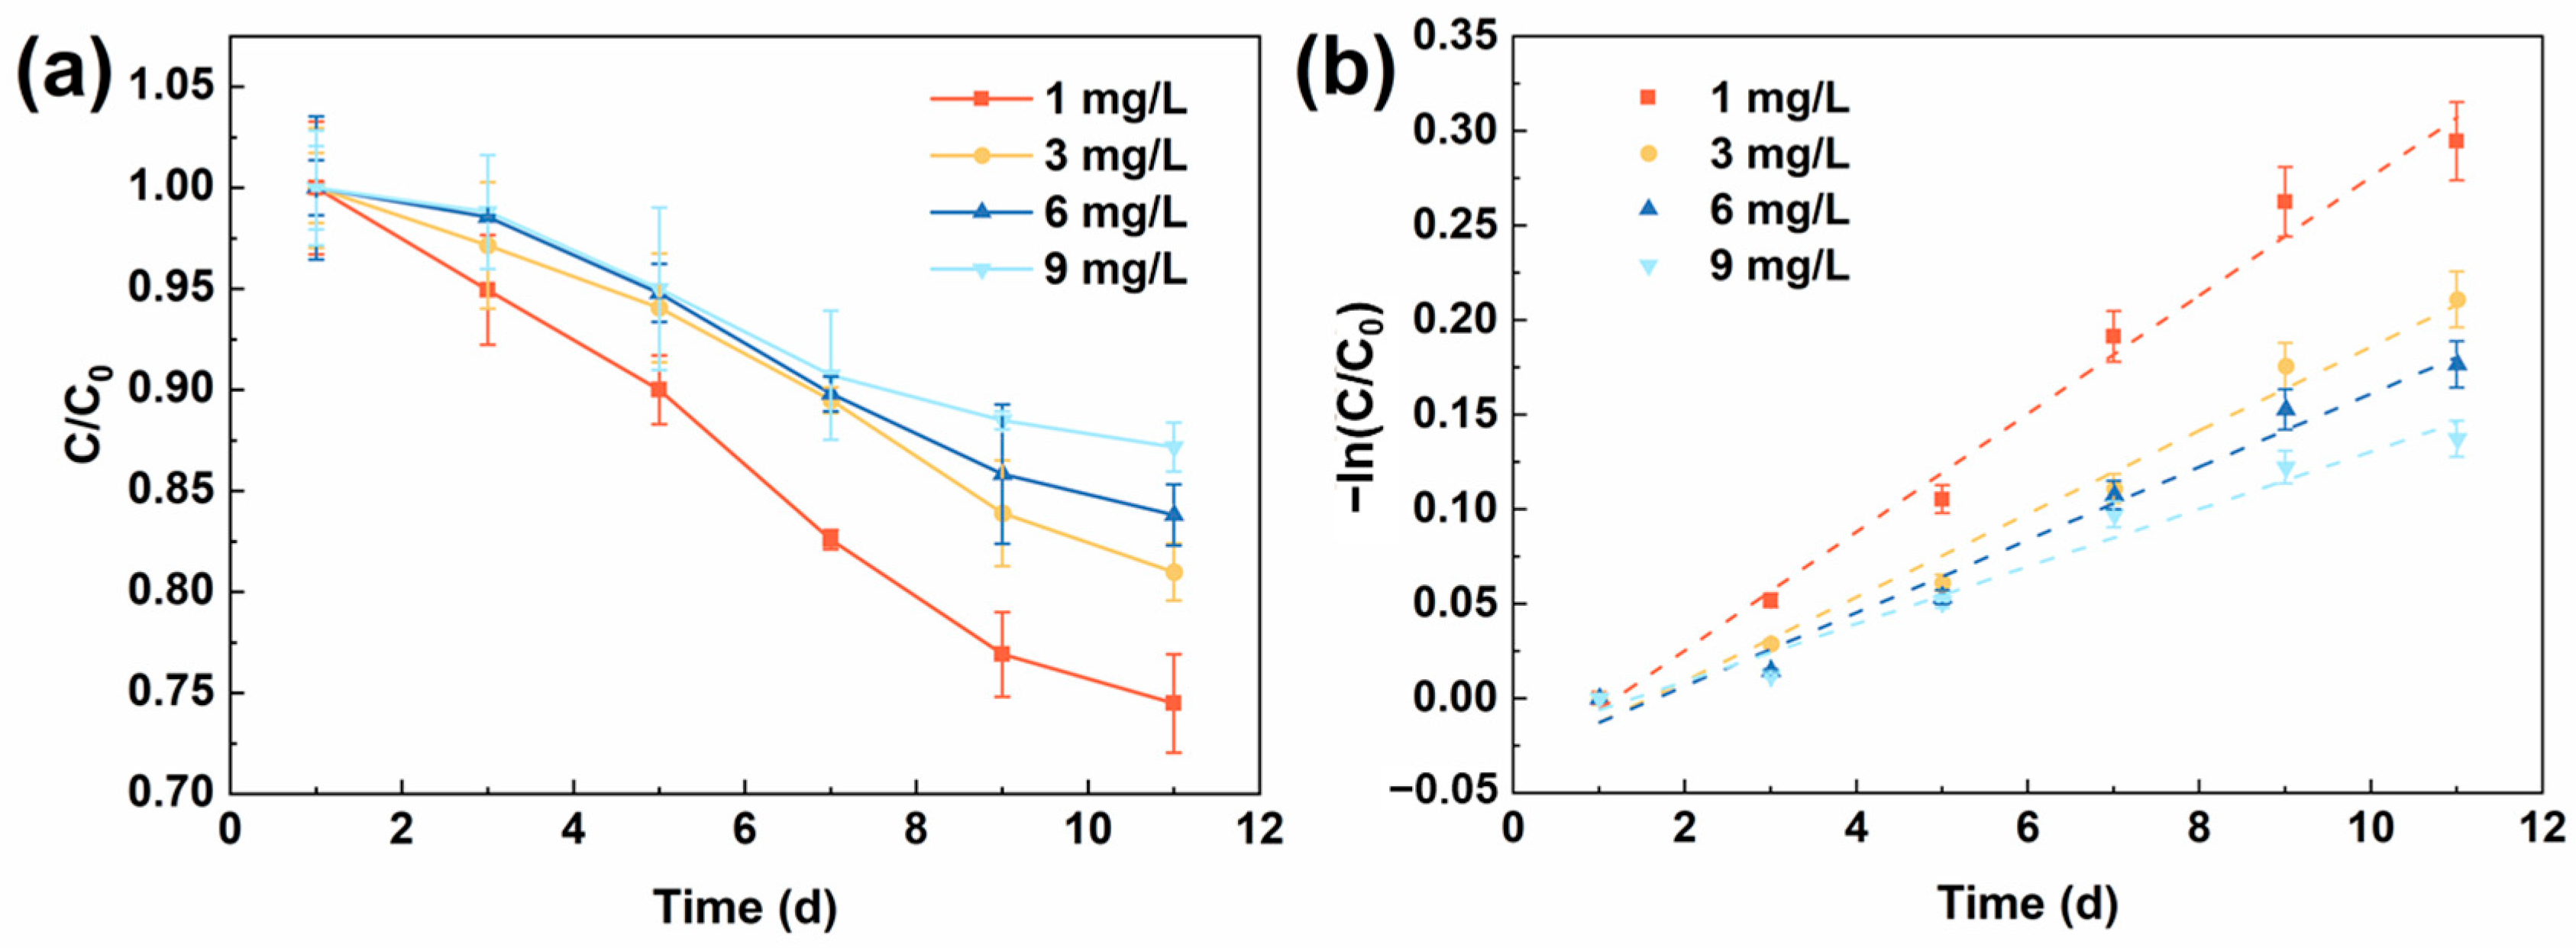
The degradation of MNZ by T. obliquus monoculture varied markedly across the tested concentration range (Figure 2a). At an initial concentration of 1 mg/L, MNZ removal reached 25.5%, confirming that the T. obliquus system was capable of degrading MNZ. Degradation efficiency declined progressively with increasing initial concentration, reaching 19.0%, 16.2%, and 12.8% at 3, 6, and 9 mg/L, respectively.
Figure 2.
Degradation of metronidazole by T. obliquus monoculture at varying initial concentrations. (a) Time-course removal of MNZ (1, 3, 6, and 9 mg/L), with degradation efficiencies of 25.5%, 19.0%, 16.2%, and 12.8%, respectively, over the cultivation period. (b) Corresponding pseudo-first-order kinetic fits, yielding rate constants (kobs) of 0.031, 0.022, 0.019, and 0.015 d−1 (R2 = 0.99, 0.98, 0.97, and 0.96) for 1, 3, 6, and 9 mg/L MNZ, respectively. Data are presented as mean ± standard deviation (n = 3).
The degradation process at each concentration was well described by a pseudo-first-order kinetic model (Figure 2b), yielding R2 values of 0.99, 0.98, 0.97, and 0.96 for 1, 3, 6, and 9 mg/L MNZ, respectively. The apparent degradation rate constant (kobs) was highest at 1 mg/L (0.031 d−1) and decreased consistently with increasing MNZ concentration, reaching 0.022, 0.019, and 0.015 d−1 at 3, 6, and 9 mg/L, respectively.
The consistent fit to pseudo-first-order kinetics across all tested concentrations suggests that MNZ degradation proceeded through a similar underlying process regardless of initial concentration. However, the mechanism responsible remained unclear at this stage. Antibiotic removal by microalgae can proceed via biosorption, bioaccumulation, biodegradation, direct photolysis, or EOM-mediated indirect photodegradation, and the dominant pathway varies with the antibiotic and the algal species [5]. Identifying which of these operates here was therefore the necessary next step.
3.3. Photodegradation, Rather than Bioaccumulation, Drives Metronidazole Removal by T. obliquus
To elucidate the dominant mechanism underlying MNZ removal by T. obliquus, a two-stage experiment was designed to isolate the contribution of light-independent processes from photodegradation (Figure 3).
Figure 3.
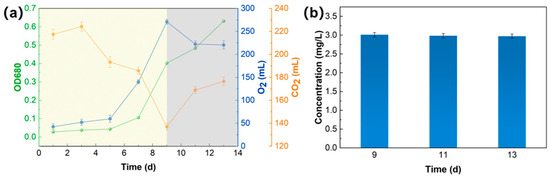
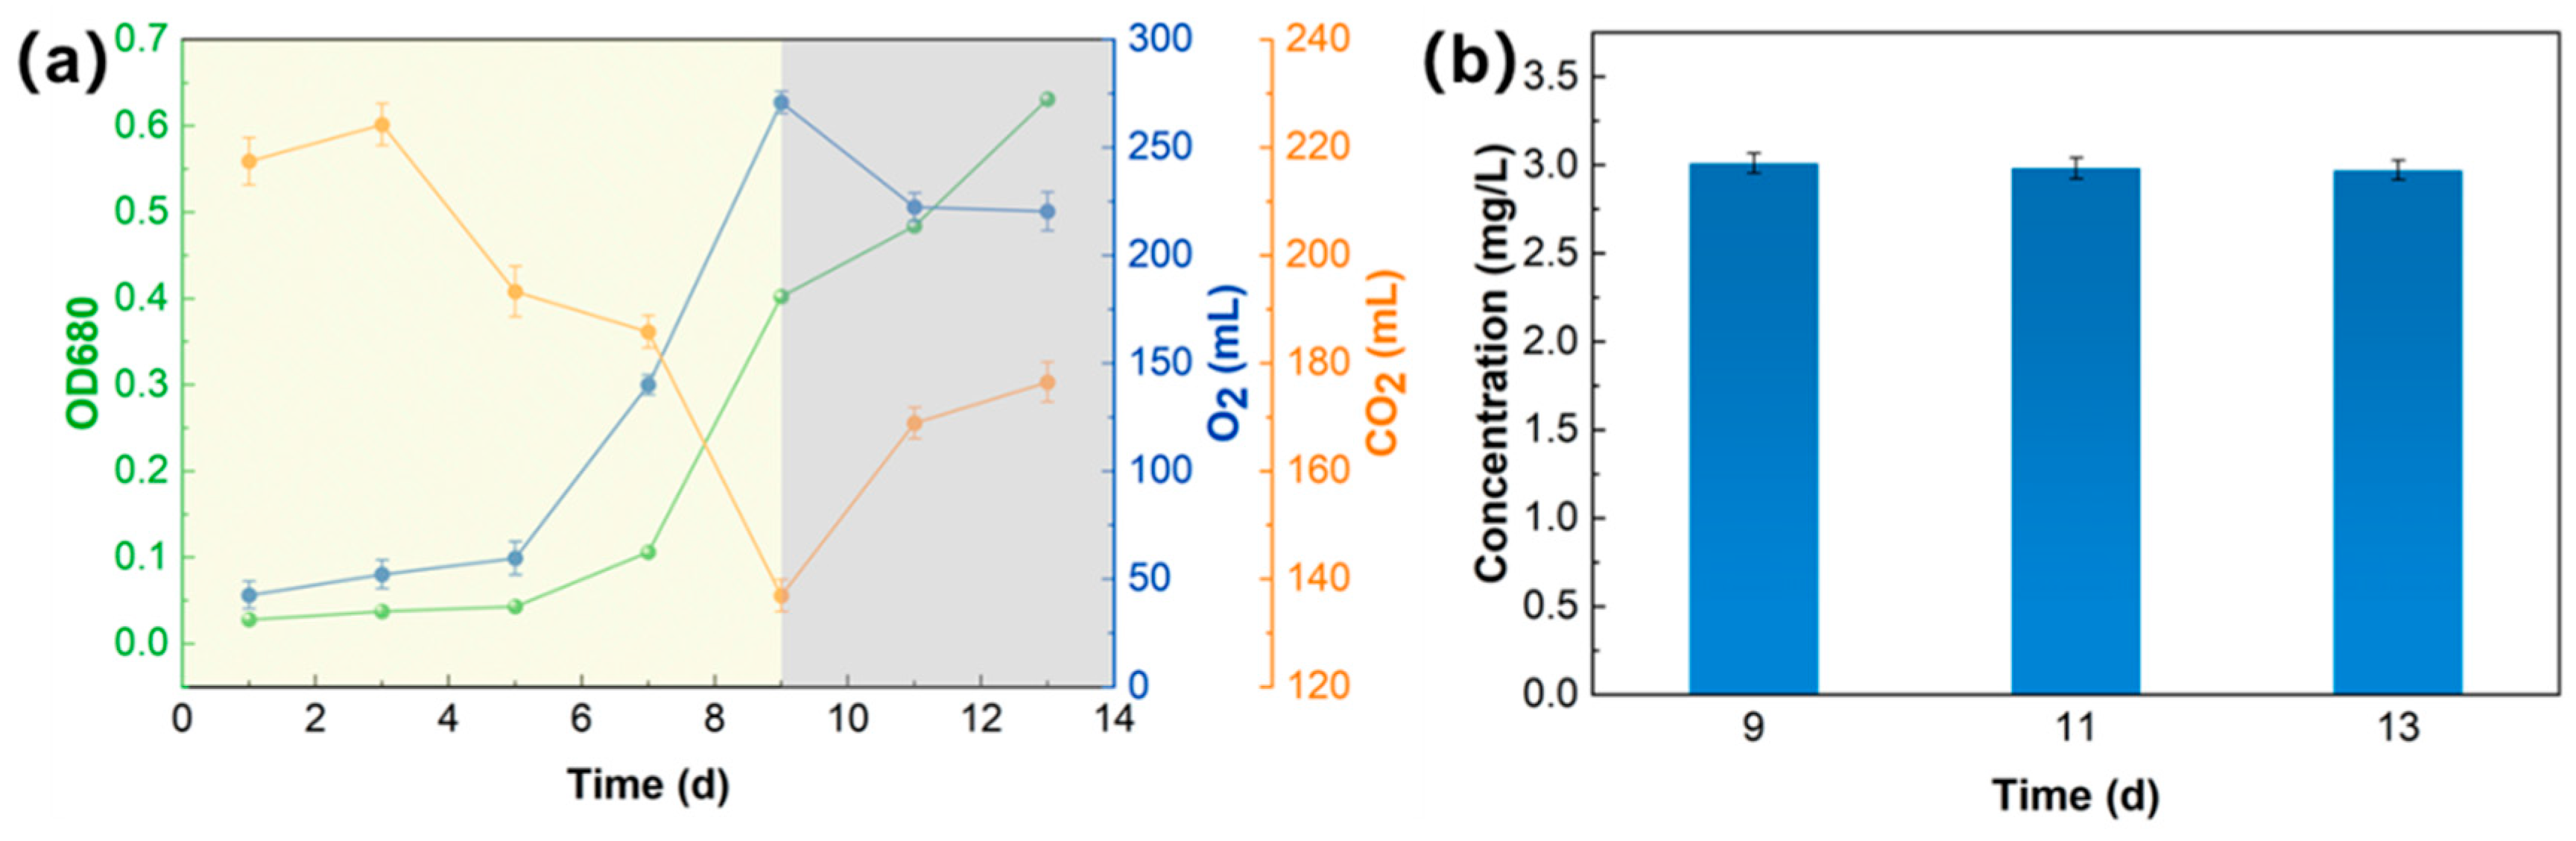
Physiological dynamics and dark-condition control confirm a photodegradation-dominated removal mechanism. (a) Growth (biomass), O2, and CO2 profiles of T. obliquus during autotrophic cultivation, followed by glucose (150 mg/L) supplementation and dark treatment initiated on day 9; Axis colors match their corresponding curves for clarity. (b) Metronidazole concentration under dark conditions following glucose and MNZ co-addition on day 9, demonstrating negligible removal in the absence of light despite sustained heterotrophic metabolic activity.
T. obliquus was first cultivated under the same light/dark cycle and light intensity as in Section 3.2. The culture exhibited typical photoautotrophic behavior during days 1–9, fixing CO2 through photosynthesis and releasing O2 (Figure 3a). Growth was slow during the initial adaptation phase (days 1–5), after which the culture entered the exponential phase, reaching an OD680 of 0.40 by day 9. At this point, MNZ (3 mg/L) was introduced together with glucose (150 mg/L) to sustain heterotrophic metabolic activity, and the culture was simultaneously shifted to complete darkness to exclude any photodegradation contribution. Under these dark, glucose-amended conditions, biomass continued to increase, with OD680 rising from 0.40 on day 9 to 0.48 on day 11 and further to 0.63 on day 13. Concurrently, CO2 content increased from 136.9 mL to 176.5 mL, while O2 content decreased from 270.9 mL to 220.5 mL over the same period, indicating that active aerobic respiration and substantial metabolic activity persisted throughout the dark incubation.
Despite this sustained biological activity, the dissolved MNZ concentration remained essentially unchanged under dark conditions (Figure 3b), remaining around 3.0 mg/L throughout the 4-day dark incubation period. Because samples were membrane-filtered before analysis, MNZ partitioned onto or into cells would have registered as a loss from solution; the absence of any decline therefore indicates that biosorption, bioaccumulation and biodegradation together removed little MNZ from the aqueous phase. This is consistent with the recalcitrance of MNZ to biological attack and with its high hydrophilicity (logKow ≈ −0.02), which disfavours partitioning into biomass. Direct photolysis is likewise unlikely to have contributed appreciably. MNZ absorbs weakly and photolyses inefficiently, with a molar absorption coefficient of 2645.44 M−1cm−1 and a quantum yield of 5.9 × 10⁻³ mol Einstein−1 under 254 nm irradiation [17]; its absorption band is centred near 320 nm and falls to negligible values beyond about 380 nm, and therefore overlaps little with the visible emission of the light source used here (Section 2.2). Consistent with this, an abiotic control containing MNZ in NMS medium alone—no cells, no EOMs—incubated in the same 500 mL serum bottles under the same illuminance and photoperiod, showed 4% removal over 12 days [12]. Taken together, these results indicate that EOM-mediated indirect photodegradation is the principal mechanism responsible for MNZ removal in the T. obliquus system.
3.4. EOM-Mediated Photodegradation and Identification of Dominant Reactive Oxygen Species
To further characterize the EOM-mediated photodegradation pathway and identify the reactive oxygen species (ROS) responsible for MNZ removal, EOMs secreted by T. obliquus were extracted and subjected to photodegradation experiments under the same light conditions used in the whole-culture system, with selective chemical quenchers added to probe the contribution of individual reactive species (Figure 4).
Figure 4.
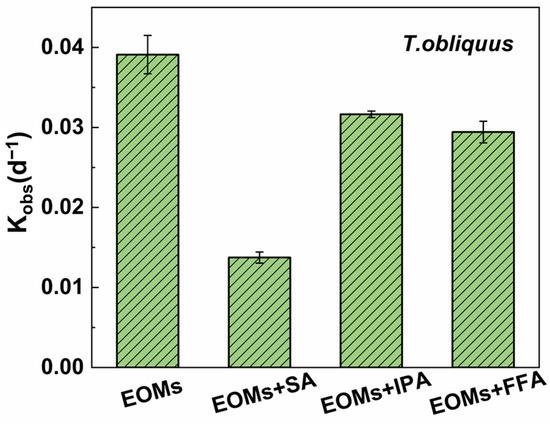
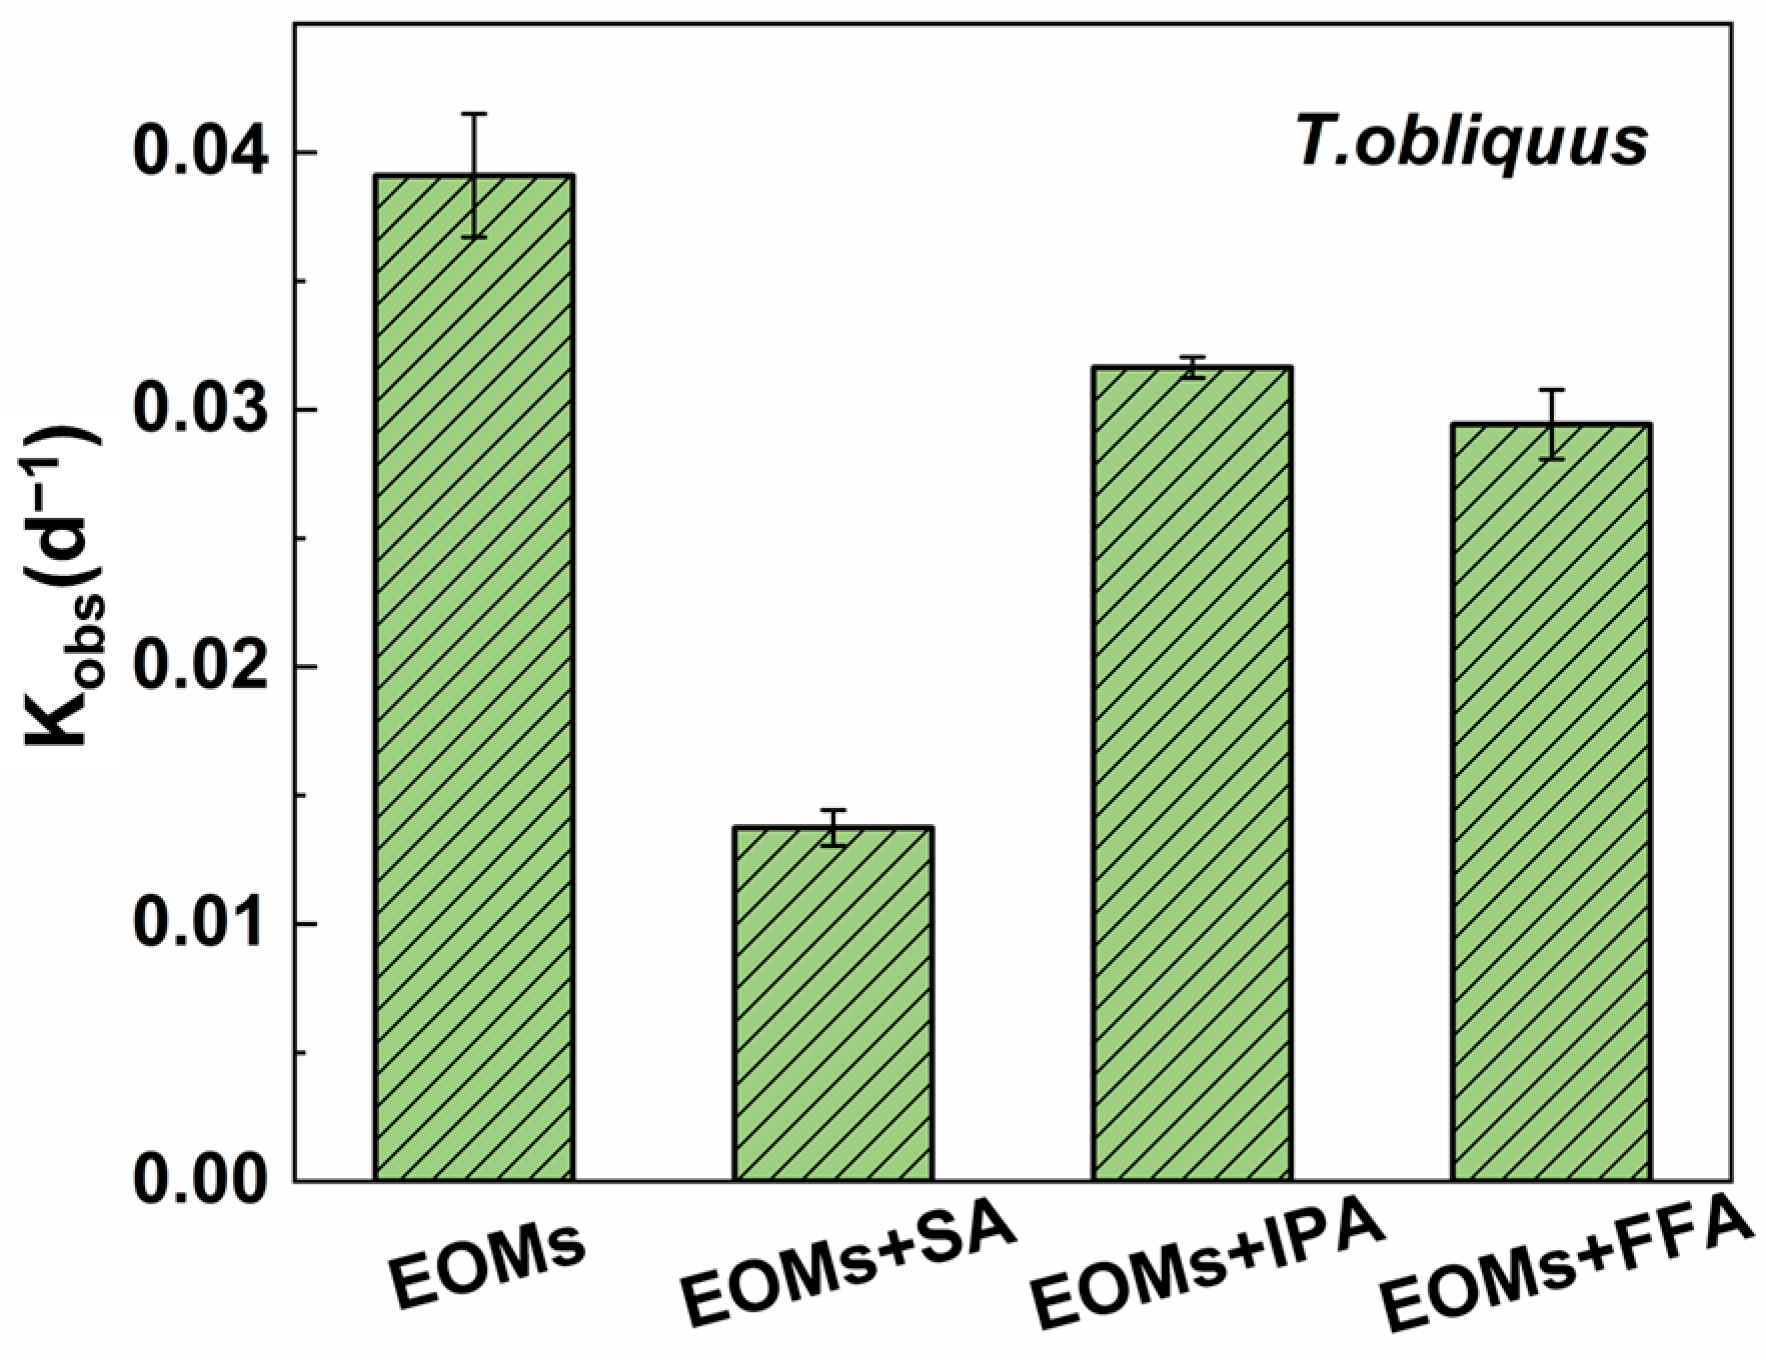
EOM-mediated indirect photodegradation of metronidazole and identification of the dominant reactive oxygen species. Degradation rate constants of cell-free T. obliquus EOM filtrates spiked with MNZ, with and without the addition of specific ROS scavengers (SA for 3EOM*, IPA for ·OH, FFA for 1O2), showing the relative contribution of each reactive species to photodegradation. Data are presented as mean ± standard deviation (n = 3).
In the absence of any quencher, the EOM filtrate alone degraded MNZ with a rate constant of 0.039 d−1, notably higher than the kobs of 0.022 d−1 observed for the whole T. obliquus culture at the same MNZ concentration (Section 3.2). This difference is attributable to the light-shielding effect of algal cells in the whole-culture system, together with competition for photon absorption between cellular photosynthetic pigments and the secreted EOMs [11].
The addition of chemical quenchers produced varying degrees of inhibition relative to the quencher-free EOM control. SA, a scavenger of 3EOM*, produced the largest reduction in the degradation rate constant, at 64.9%, while FFA and IPA, scavengers of 1O2 and ·OH, caused smaller reductions of 24.8% and 19.1%, respectively. Given the partial overlap in scavenger reactivity (Section 2.5), these values rank rather than partition the contributing species; on that basis 3EOM* was the dominant reactive species driving MNZ photodegradation, with 1O2 and ·OH in secondary roles.
3.5. Glucose Supplementation Enhances Heterotrophic Metabolism and Metronidazole Photodegradation
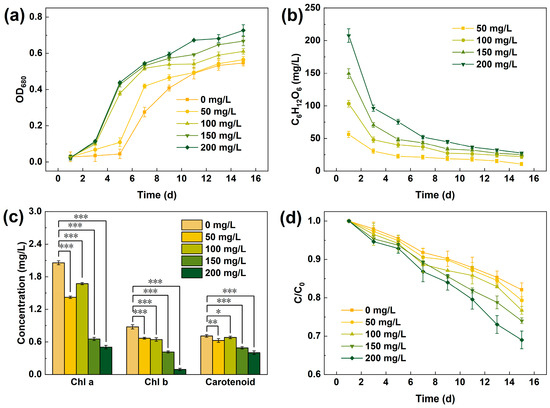
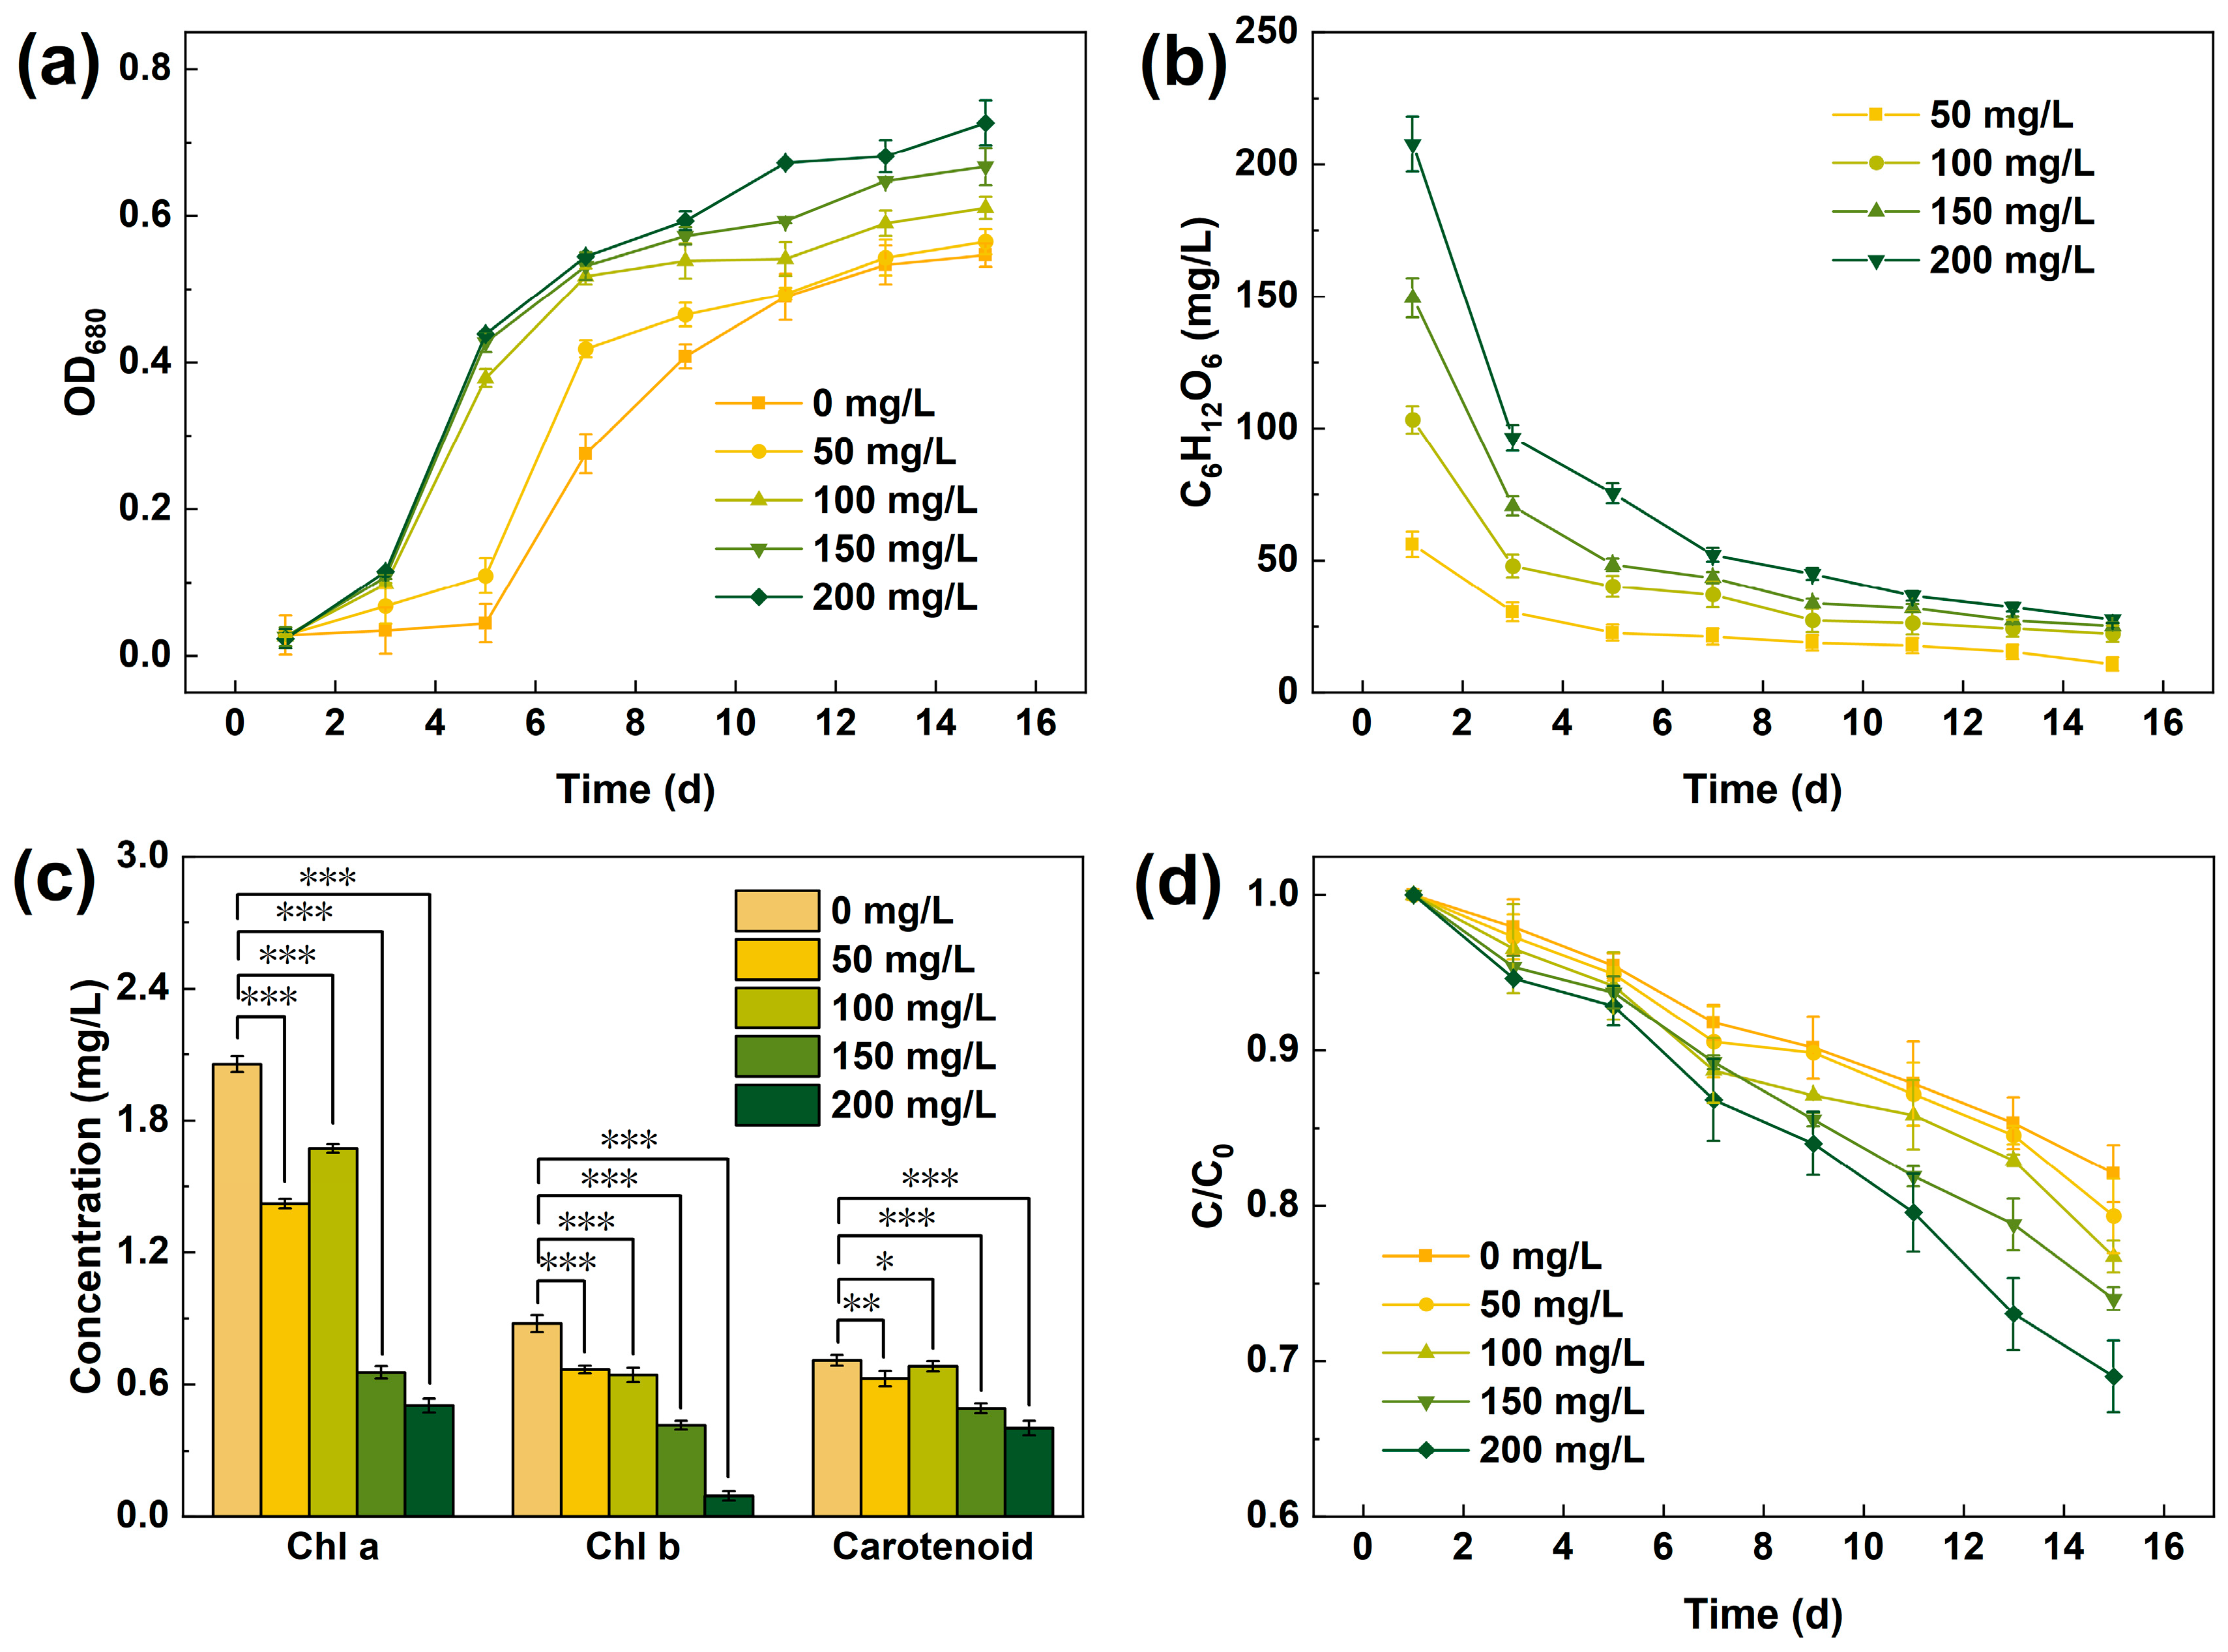
T. obliquus is a mixotrophic microalga capable of both photoautotrophic growth via photosynthesis and heterotrophic assimilation of exogenous organic carbon. To investigate whether stimulating heterotrophic metabolism could enhance MNZ degradation, glucose was supplied as an external carbon source across a concentration gradient (0–200 mg/L), and its effects on algal growth, photosynthetic pigment content, and MNZ removal were evaluated (Figure 5).
Figure 5.
Glucose supplementation induces a heterotrophic metabolic shift in T. obliquus that enhances metronidazole photodegradation. (a) Cell proliferation under 0–200 mg/L glucose. (b) Corresponding glucose consumption. (c) Photosynthetic pigment content at the end of cultivation. (d) Metronidazole degradation efficiency across the glucose gradient. Data are presented as mean ± standard deviation (n = 3); asterisks indicate significant differences from the no-glucose control (* p < 0.05, ** p < 0.01, *** p < 0.001).
Glucose supplementation markedly altered the growth dynamics of T. obliquus (Figure 5a). While the glucose-free control entered the exponential growth phase on day 5, all glucose-amended treatments began rapid proliferation as early as day 3. The specific growth rate (μ), calculated from the exponential-phase biomass data in Figure 5a, increased with glucose concentration, reaching 0.202, 0.215, 0.224, 0.232, and 0.246 d−1 at 0, 50, 100, 150, and 200 mg/L, respectively—corresponding to increases of 6.4%, 10.9%, 14.9%, and 21.9% relative to the glucose-free control. By the end of cultivation, biomass accumulation was also enhanced at higher glucose concentrations, with the 200 mg/L treatment reaching an OD680 of 0.73, a 35.2% increase over the glucose-free control (OD680 = 0.54). Glucose consumption over time (Figure 5b) confirmed that T. obliquus readily assimilated the supplemented glucose, with rapid depletion occurring during the early cultivation period, consistent with its capacity for heterotrophic carbon utilization. These results indicate that glucose supplementation stimulated heterotrophic metabolism in T. obliquus, enhancing both proliferation rate and biomass accumulation, broadly consistent with previous reports that mixotrophic cultivation with exogenous glucose can substantially increase the biomass of Scenedesmus/Tetradesmus species relative to autotrophic cultivation—for example, a 2.8-fold biomass increase was reported for S. obliquus grown mixotrophically with 4 g/L glucose [18].
Despite the enhanced biomass under glucose supplementation, photosynthetic pigment content declined progressively with increasing glucose concentration (Figure 5c), with chlorophyll a, chlorophyll b, and carotenoid content all decreasing relative to the glucose-free control. This decline is consistent with reports that exogenous organic carbon suppresses photosynthetic activity and reduces the accumulation of light-harvesting complexes in mixotrophic microalgae, as cells reallocate resources away from light capture toward the assimilation of readily available carbon substrates [8]. A likely consequence of this reduction in pigment content is a lower photosynthetic light demand, which would ease competition for photons between algal pigments and secreted EOMs and leave a greater share of the incident light available for EOM-driven generation of reactive oxygen species.
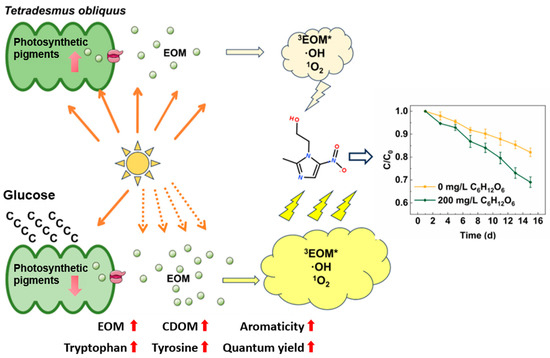
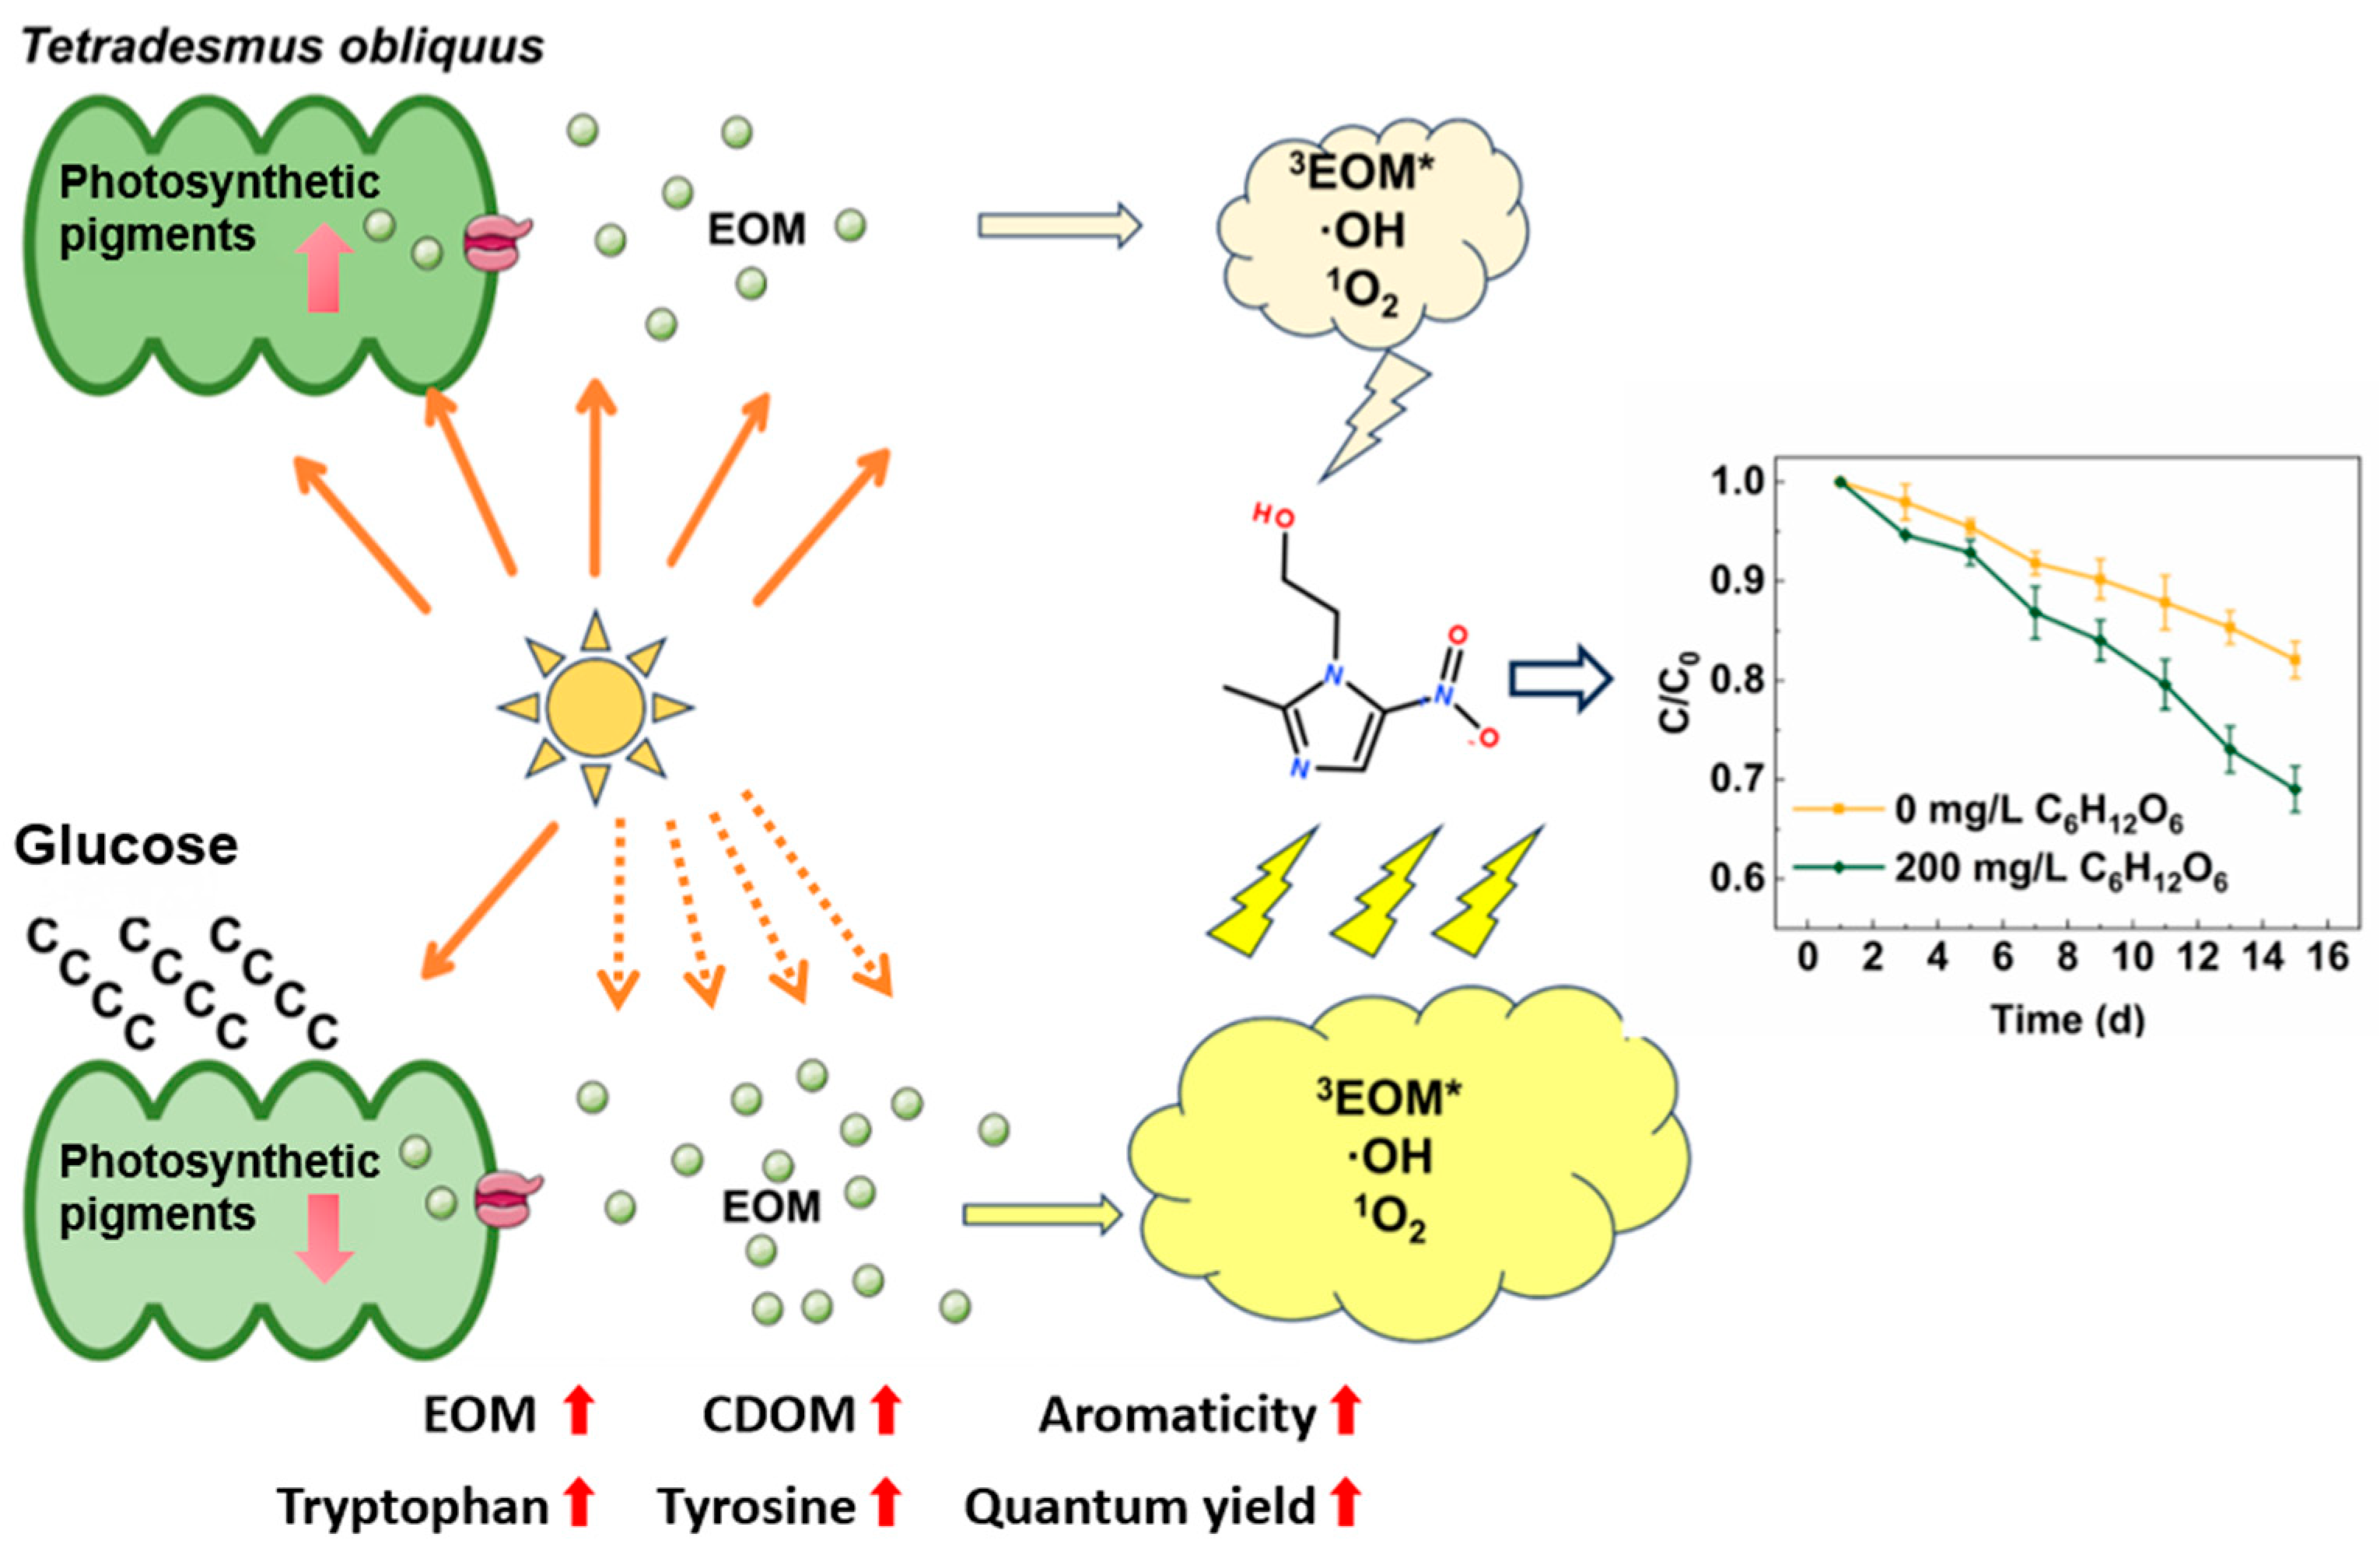
MNZ degradation efficiency increased progressively with glucose concentration (Figure 5d), with the residual MNZ fraction (C/C0) at day 15 declining from 0.82 in the glucose-free control to as low as 0.69 at 200 mg/L glucose. This dose-dependent enhancement indicates that stimulating heterotrophic metabolism through external carbon supplementation improved the EOM-mediated photodegradation capacity of T. obliquus. These improvements in photodegradation efficiency were accompanied by both quantitative and qualitative changes in the EOMs secreted by T. obliquus, including increased EOM concentration and enhanced spectral indicators of photoreactivity. The fluorescence-based molecular composition of these EOMs is examined below.
3.6. Fluorescence Characteristics of EOMs Reveal Selective Enrichment of Protein-like Components
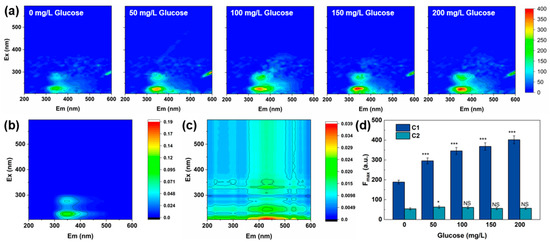
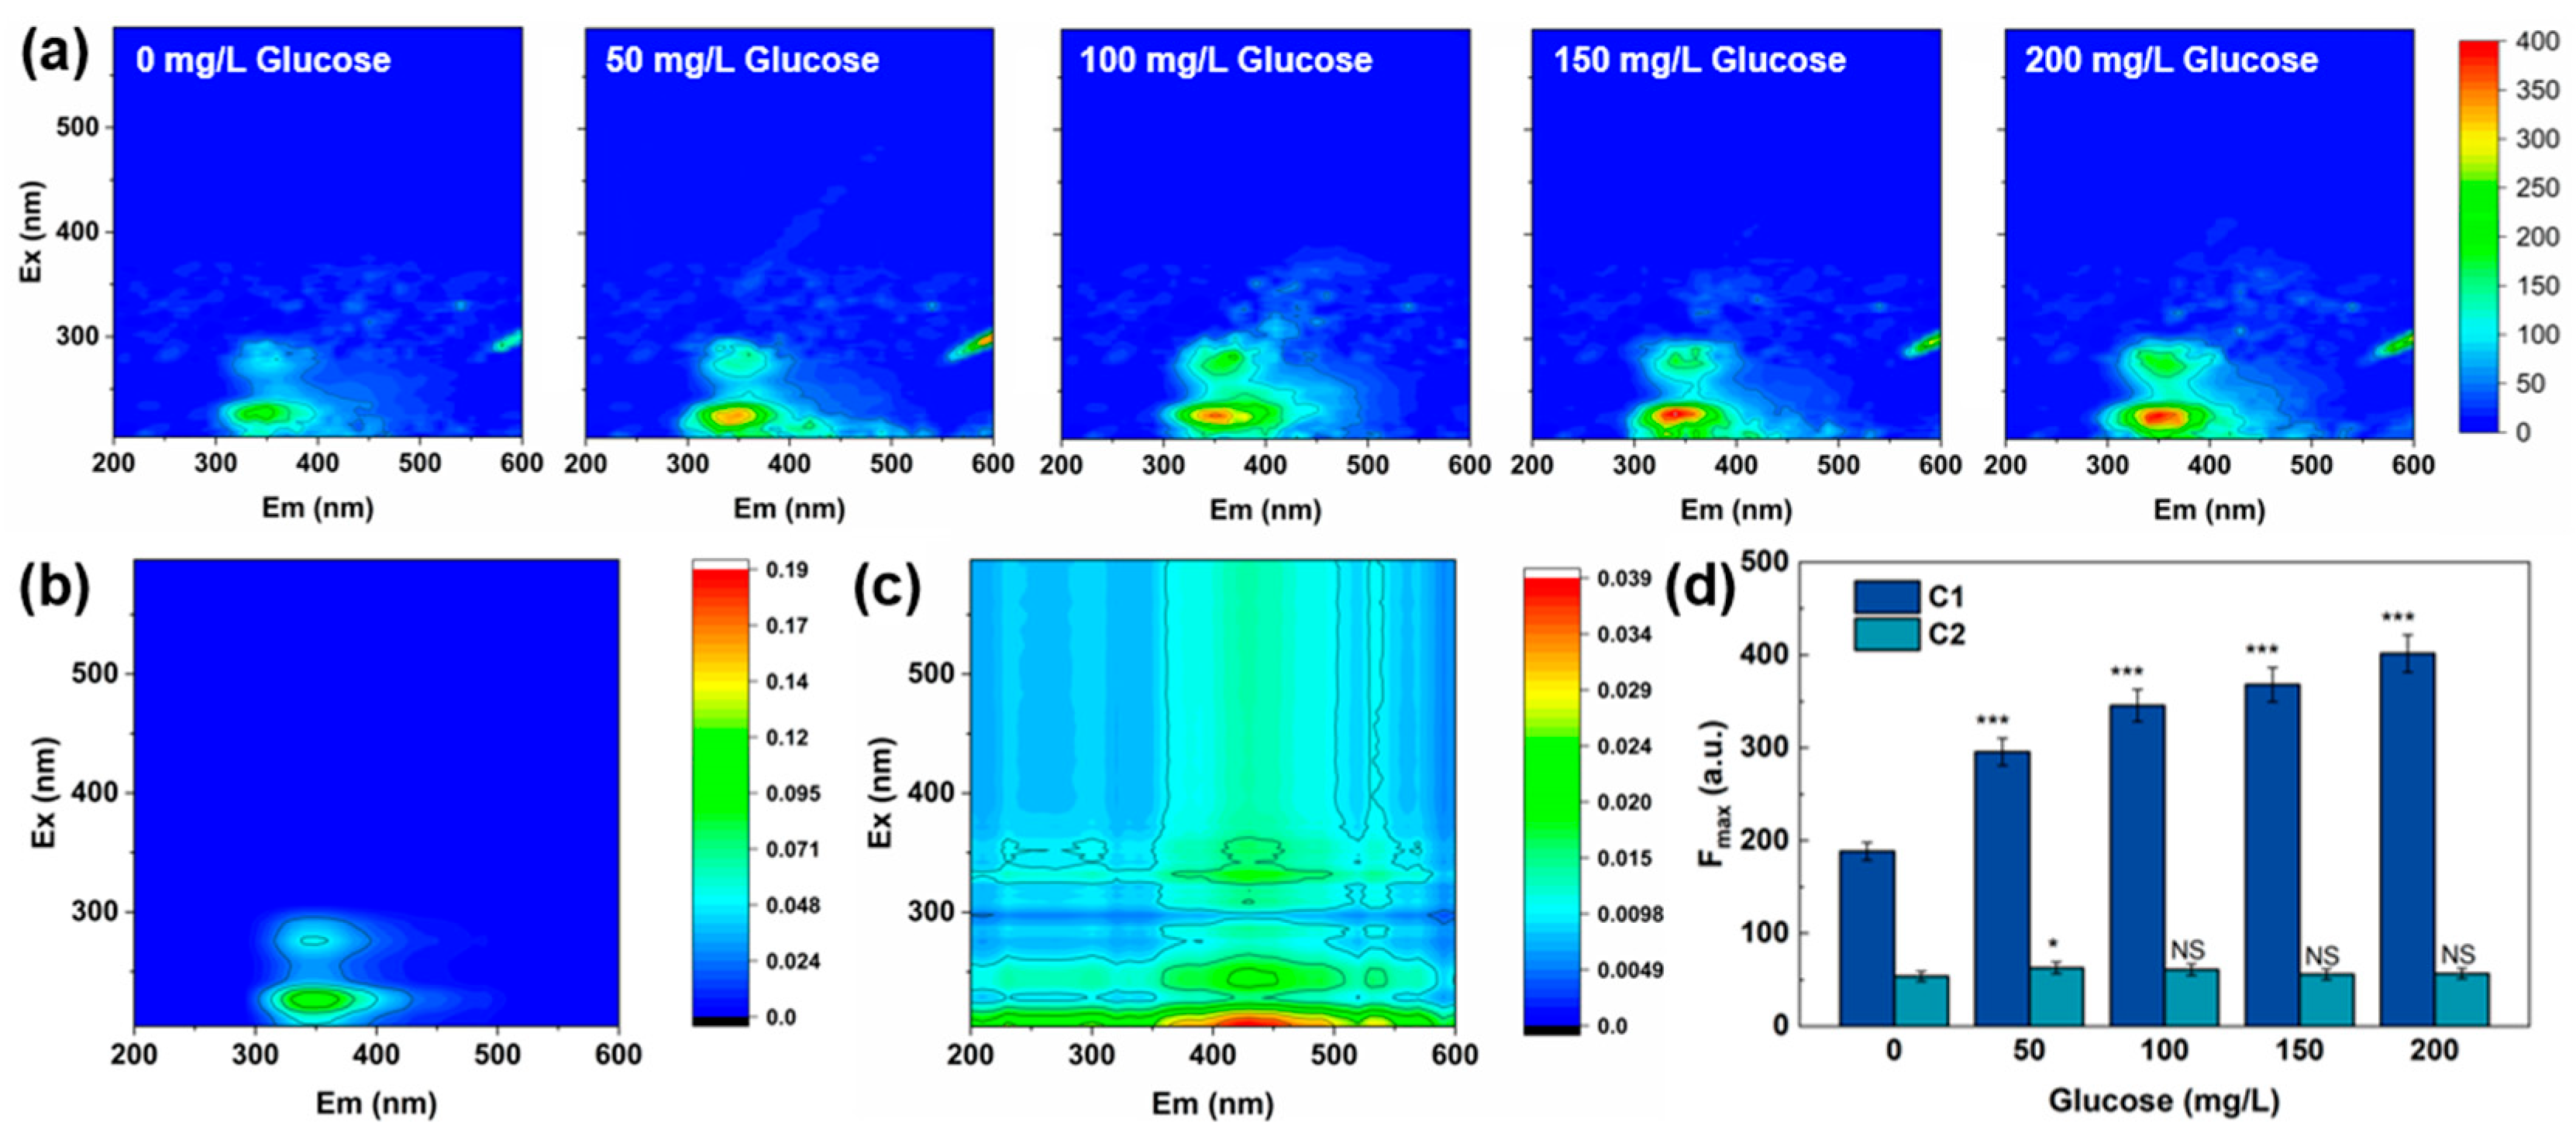
To further resolve the molecular-level changes in EOM composition induced by glucose supplementation, three-dimensional excitation–emission matrix (EEM) fluorescence spectroscopy combined with parallel factor (PARAFAC) analysis was performed (Figure 6).
Figure 6.
Fluorescence characteristics of EOMs secreted by T. obliquus under varying glucose supplementation. (a) Representative 3D excitation–emission matrix (EEM) spectra across the glucose gradient (0–200 mg/L). (b) PARAFAC-derived fluorescent component C1 (protein-like, characteristic of tryptophan and tyrosine). (c) PARAFAC-derived fluorescent component C2 (fulvic-like). (d) Maximum fluorescence intensity (Fmax) of C1 and C2 as a function of glucose concentration, showing a selective, dose-dependent enrichment of the protein-like component C1. Asterisks indicate significant differences from the no-glucose control (* p < 0.05, *** p < 0.001; NS, not significant).
Representative EEM spectra across the glucose gradient (0–200 mg/L) consistently revealed two fluorescence peaks: Peak A (Ex/Em ≈ 220/350 nm), corresponding to aromatic protein-like substances (tryptophan and tyrosine), and Peak B (Ex/Em ≈ 210/420 nm), corresponding to fulvic-like substances (Figure 6a). Peak A exhibited markedly higher intensity than Peak B across all treatments and increased visibly with glucose concentration, whereas Peak B intensity remained comparatively low and largely unchanged.
Bulk optical indicators of EOM photoreactivity across this glucose gradient (A355, SUVA254 and E2/E3) have been reported previously [12]; the analysis below resolves the underlying fluorescent components. PARAFAC modeling resolved these overlapping signals into two independent fluorescent components: a protein-like component C1 (Figure 6b), corresponding to Peak A, and a fulvic-like component C2 (Figure 6c), corresponding to Peak B. Split-half validation and core consistency diagnostics for the two-component model are provided in the Supplementary Material (Figures S1 and S2, Table S1). The maximum fluorescence intensity (Fmax) of each component across the glucose gradient is shown in Figure 6d. C2 intensity remained low and did not differ significantly among glucose treatments (p > 0.05), except for a marginal difference at 50 mg/L (p < 0.05). In contrast, C1 intensity increased substantially and significantly with glucose concentration relative to the glucose-free control (p < 0.001 at 50, 100, 150, and 200 mg/L), and represented the dominant fluorescent component of the EOMs secreted by T. obliquus across all treatments.
Given that C1 corresponds to aromatic protein-like substances known to serve as photoreactive components, these results indicate that the glucose-induced enhancement of MNZ photodegradation efficiency (Section 3.5) is primarily attributable to the selective, dose-dependent enrichment of tryptophan- and tyrosine-like substances within the secreted EOMs, rather than to an overall, non-selective increase in EOM fluorescent content.
4. Discussion
4.1. Metronidazole Removal by T. obliquus Is Governed by a Concentration-Dependent Toxicity–Degradation Trade-Off
The results presented in Section 3.1 and Section 3.2 reveal an inverse relationship between MNZ concentration and its degradation efficiency by T. obliquus, occurring alongside a concentration-dependent suppression of algal growth and photosynthetic pigment content. This pattern suggests that MNZ removal in this system is shaped by a trade-off between substrate availability and the antibiotic’s inhibitory effect on the organism responsible for its degradation.
On one hand, the observed decline in kobs with increasing MNZ concentration (from 0.031 d−1 at 1 mg/L to 0.015 d−1 at 9 mg/L) is consistent with a kinetic constraint commonly observed in photosensitized degradation processes: because the flux of reactive oxygen species generated under a fixed light intensity and EOM pool is essentially constant, an increasing substrate load results in proportionally less reactive species available per unit of pollutant, lowering the apparent pseudo-first-order rate constant [9].
On the other hand, the parallel dose-dependent suppression of growth and photosynthetic pigment content (Section 3.1) indicates that higher MNZ concentrations also impose direct physiological stress on T. obliquus. Because MNZ removal in this system proceeds primarily via EOM-mediated indirect photodegradation (Section 3.3 and Section 3.4), any toxicity-induced reduction in algal metabolic activity or EOM secretion capacity could compound the decline in degradation efficiency at higher MNZ concentrations, beyond what would be expected from substrate loading alone. This raises the possibility that the concentration-dependent decline in kobs reflects not only a kinetic ceiling imposed by a finite reactive-oxygen-species flux, but also a self-limiting feedback loop in which antibiotic toxicity progressively impairs the biological process responsible for its own removal.
These findings indicate that the degradation capacity of T. obliquus-based systems is not a fixed property, but is constrained by the balance between pollutant loading and the physiological resilience of the algal population. This matters for real wastewater matrices, where antibiotic concentrations may fluctuate substantially [3].
4.2. EOM-Mediated 3EOM*-Dominated Photodegradation as the Primary Removal Pathway
The dark-condition control (Section 3.3) and the ROS quenching experiment (Section 3.4) together indicate that MNZ removal by T. obliquus is dominated by EOM-mediated indirect photodegradation, with only minor contributions from light-independent processes and from direct photolysis. This finding is consistent with the broader recognition that nitroimidazole antibiotics such as MNZ are inherently resistant to conventional biological degradation pathways, owing to their nitro-heterocyclic structure, which is poorly recognized by common microbial enzymatic systems [5].
Among the reactive oxygen species examined, triplet-state EOMs (3EOM*) were identified as the dominant contributor to MNZ photodegradation, accounting for the majority of the observed rate reduction upon quenching, with singlet oxygen (1O2) and hydroxyl radicals (·OH) playing comparatively minor roles. This hierarchy is consistent with the established photosensitization behavior of dissolved organic matter. Triplet excited states, generated via intersystem crossing from chromophoric moieties, typically provide the primary oxidative pathway for electron-rich organic pollutants, while 1O2 and ·OH arise as secondary products of subsequent energy- and electron-transfer reactions [9,10,19]. The same predominance has been reported for algal-derived EOMs acting on structurally diverse antibiotics, including chlortetracycline degradation by EOMs from Chlorella vulgaris [11,20].
Notably, the degradation rate constant of the cell-free EOM filtrate alone (0.039 d−1) exceeded that of the intact T. obliquus culture at the same MNZ concentration (0.022 d−1, Section 3.2), despite both systems containing EOMs derived from the same source. This discrepancy points to a distinction between the photoreactive potential of EOMs in isolation and their functional performance within a living algal system. The most parsimonious explanation is an inner-filter effect, in which intracellular photosynthetic pigments compete with secreted EOMs for incident light and attenuate the flux available to drive EOM-mediated photochemistry; cells may additionally scatter light and act as sinks for reactive species. On this interpretation, lowering pigment content—whether through MNZ-induced physiological stress or through a glucose-induced metabolic shift—would raise the realised photodegradation efficiency of the whole culture even without a net increase in intrinsic EOM photoreactivity, which is what Section 3.5 shows.
Although removal was quantified here as the loss of the parent compound, the transformation products of MNZ in this system have been identified in our companion study, in which five products were detected in the T. obliquus monoculture by UPLC-QTOF-MS [12]. Degradation proceeded through loss of the hydroxyethyl side chain to M141, demethylation to M127, substitution of the nitro group to M116, and ring opening to M118 and M88. This is consistent with the reactive species identified above, since density functional theory places the highest occupied molecular orbital of MNZ on the imidazole ring carbons bearing the methyl and nitro groups, marking them as the sites most susceptible to oxidative attack [12,21]. Two of the intermediates, M141 and M127, were predicted to be more toxic than MNZ itself [12]; loss of the parent compound therefore does not by itself constitute detoxification, a distinction that matters at the removal efficiencies achieved here, where most of the initial MNZ remains unaltered. Whether carbon supplementation alters the distribution of these products, rather than only the rate at which the parent compound is consumed, remains to be established.
4.3. Carbon-Induced Metabolic Shift as an Engineering Strategy to Enhance EOM Photoreactivity
The results presented in Section 3.5 and Section 3.6 demonstrate that external glucose supplementation enhanced MNZ photodegradation not by increasing the overall quantity of EOMs indiscriminately, but through a more targeted mechanism: a metabolic shift toward heterotrophy that simultaneously reduced competition for light and selectively enriched the most photoreactive EOM component.
The reduction in photosynthetic pigment content under glucose supplementation (Section 3.5) is consistent with the well-documented phenomenon whereby exogenous organic carbon availability downregulates photosynthetic activity and light-harvesting complex assembly in mixotrophic microalgae, as cells reallocate resources away from light capture toward the assimilation of readily available carbon substrates [8]. Building on the inner-filter effect discussed in Section 4.2, this pigment reduction would be expected to increase the fraction of incident light reaching secreted EOMs, complementing the parallel increase in EOM concentration and bulk photoreactivity indicators previously established for this system [12].
More strikingly, the PARAFAC analysis (Section 3.6) revealed that this glucose-induced enhancement was compositionally selective rather than uniform: the protein-like component C1, associated with tryptophan- and tyrosine-like aromatic moieties, increased substantially with glucose concentration, whereas the fulvic-like component C2 remained largely unchanged. This selective enrichment suggests that the overflow metabolism induced by heterotrophic carbon assimilation preferentially channels surplus carbon and energy toward the synthesis and secretion of protein-like extracellular substances, rather than uniformly amplifying all classes of extracellular organic matter. Protein-like, tryptophan/tyrosine-associated fluorophores are effective generators of triplet excited states, owing to their aromatic, electron-rich structure [9]. This compositional shift therefore explains why glucose supplementation enhanced 3EOM*-driven photodegradation specifically, rather than simply increasing the total EOM pool [20].
Carbon-source supplementation therefore offers a lever for tuning the composition of microalgal EOMs toward higher photodegradation efficiency: surplus organic carbon simultaneously suppresses pigment synthesis and steers metabolic overflow toward photoreactive protein-like substances. Figure 7 summarises this proposed sequence, from carbon supplementation through pigment suppression and selective EOM enrichment to enhanced 3EOM*-mediated photodegradation.
Figure 7.
Proposed mechanism by which external carbon supplementation enhances EOM-mediated photodegradation of metronidazole in T. obliquus. Glucose-induced heterotrophic metabolism increases the secretion of protein-like, photoreactive EOMs while concurrently reducing photosynthetic pigment content, which would be expected to alleviate intracellular competition for light and to increase the light energy available for EOM-driven reactive oxygen species generation. Solid arrows denote relationships measured in this study; dashed arrows denote inferred steps.
4.4. Benchmarking the Monoculture Baseline Against the Synergistic Co-Culture System
The mechanistic and quantitative findings established in this study provide an important baseline for interpreting the synergistic degradation performance previously reported for a methanotroph–T. obliquus co-culture system targeting the same pollutant [12]. In that companion study, the co-culture achieved a degradation rate constant of 0.067 d−1 at 3 mg/L MNZ, a 3.72-fold enhancement over the T. obliquus monoculture value of 0.018 d−1 obtained there over a 12-day incubation [12]. The present study, fitting an 11-day time course, gives 0.022 d−1 for the monoculture; the two are consistent in terms of removal efficiency (19.1% and 19.0%, respectively, at 3 mg/L) and differ only in the fitting interval. The present study offers a detailed mechanistic account of that monoculture baseline, showing that its degradation capacity is governed by a concentration-dependent toxicity–degradation trade-off (Section 4.1), is driven dominated by 3EOM*-mediated indirect photodegradation rather than biological assimilation (Section 4.2), and can be deliberately enhanced through carbon-induced modulation of EOM composition (Section 4.3). The companion study described T. obliquus as largely immune to MNZ; the present data qualify that description, since MNZ inhibited the specific growth rate by 5.4–12.1% and carotenoid content by up to 68.0% across 1–9 mg/L. The alga is tolerant rather than unaffected.
These findings help clarify the specific contribution of T. obliquus within the reciprocal synergistic amplification model proposed for the co-culture system [12], in which bacterial metabolites were shown to induce a mixotrophic shift in the alga, thereby stimulating the secretion of more photoreactive EOMs. The present results indicate that this bacterially induced shift operates through the same fundamental mechanism identified here for glucose-induced mixotrophy: a reduction in photosynthetic pigment competition for light, coupled with a selective enrichment of protein-like, tryptophan/tyrosine-associated EOM components. This convergence suggests that the alga’s contribution to the co-culture synergy is not contingent on a unique bacterium-specific signaling pathway, but instead reflects a more general mixotrophic response that can be reproduced and quantitatively characterized in isolation.
At the same time, the quantitative comparison underscores the substantial additional degradation capacity contributed by the bacterial partner in the co-culture system. Even under the most favorable carbon-supplementation condition examined here, the monoculture degradation efficiency remained well below that reported for the co-culture, indicating that algal-driven photodegradation alone—however optimized—cannot fully account for the synergistic enhancement observed when T. obliquus is paired with M. bryophila. This gap likely reflects the parallel, complementary contribution of the sMMO-mediated co-metabolic pathway operating within the bacterial partner, which proceeds independently of light and targets a distinct set of transformation intermediates [12]. Isolating the algal contribution therefore provides a reference point against which the incremental benefit of bacterial co-metabolism can be evaluated.
4.5. Practical Implications and Limitations
Two implications follow for the design of microalgae-based treatment. First, because MNZ removal is governed by EOM-mediated photodegradation rather than by biological assimilation, and because the cell-free EOM filtrate outperformed the intact culture, reactor configurations that maximise the light reaching the secreted EOM pool—shallow depth, moderate optical density, or separation of an EOM-rich phase from dense biomass—should be more effective than designs optimised for biomass retention alone. Second, external carbon supplementation provides a means of enhancing that pathway without a bacterial partner, although its practical value depends on where the carbon comes from.
The carbon balance sets the terms. Supplying 200 mg/L glucose adds roughly 213 mg COD/L, several times the chemical oxygen demand of a typical secondary effluent, and raised MNZ removal from approximately 18% to 31% over 15 days at 3 mg/L. Dosing purified carbon on that scale to remove a micropollutant would create a larger treatment burden than it relieves. Two features of the system nevertheless leave room for a workable configuration. The glucose was almost entirely consumed within the first week (Figure 5b), so the added carbon leaves the aqueous phase as biomass rather than as effluent COD, converting a soluble organic load into a solids-separation duty. And the effect does not appear to require a refined substrate: in the companion co-culture system, acetate secreted by the bacterial partner at 1–2 mM elicited essentially the same algal response [12]. Waste-derived carbon—fermentation liquor and volatile fatty acids from sludge hydrolysis, food-processing and molasses-based effluents, or crude glycerol from biodiesel production [8]—is therefore the realistic input. The 15-day contact time points to the same conclusion about where such a process would sit: not in a mainstream tertiary unit, but in systems where long residence times are already standard, such as high-rate algal ponds, waste stabilisation ponds and polishing lagoons. One caution that the present axenic system cannot capture is that organic carbon added to a real matrix would also stimulate heterotrophic bacteria competing with the alga.
Several limitations bear on how far these results can be extrapolated. First, the MNZ concentrations examined (1–9 mg/L) exceed those of real effluents [3,4] by two to three orders of magnitude; this range was necessary for reliable quantification and kinetic resolution, but the concentration-dependent trends of Section 4.1 should be confirmed at environmentally relevant levels. Second, the dark incubation bounds the combined contribution of biosorption, bioaccumulation and biodegradation rather than resolving them individually, since no mass balance on cell-associated MNZ was performed. Third, the chemical scavengers used to identify reactive species are not strictly selective, and saturation of inhibition at the concentrations used was not verified by a concentration series, so the reported inhibitions rank rather than quantify the contributing species. Fourth, the inner-filter interpretation, although consistent with all of the observations reported here, rests on inference: light partitioning between intracellular pigments and secreted EOMs was not measured, and testing it directly would require spectral irradiance measurements through cultures of differing pigment content. Fifth, the abiotic photolysis control underpinning Section 3.3 was established in the companion study rather than repeated here. Finally, the work used a single carbon source, a defined synthetic medium and a monoculture, and the toxicity of the treated solution was not assessed.
Future work should therefore establish whether carbon supplementation alters the distribution of transformation products as well as the rate of parent-compound loss, validate the strategy at pilot scale using waste-derived carbon at environmentally relevant MNZ concentrations, measure light partitioning directly, and test whether the link between heterotrophic metabolic shift and selective EOM enrichment generalises to other microalgae and other classes of recalcitrant antibiotic.
5. Conclusions
This study provides a concentration-resolved, mechanistically verified characterization of metronidazole (MNZ) removal by Tetradesmus obliquus monoculture. MNZ toxicity and degradation efficiency were inversely related across a 1–9 mg/L concentration range, with degradation dominated by EOM-mediated indirect photodegradation—principally via triplet-state EOMs (3EOM*)—rather than by biosorption, bioaccumulation, biodegradation, or direct photolysis. External glucose supplementation enhanced this photodegradation pathway not through a uniform increase in EOM output, but through a selective mechanism: a heterotrophy-induced reduction in photosynthetic pigment content, which would be expected to ease competition for light, coupled with the preferential enrichment of protein-like, tryptophan/tyrosine-associated EOM components. This carbon-responsive enhancement mirrors the mixotrophic shift previously reported to underlie the synergistic performance of a methanotroph–T. obliquus co-culture system, suggesting that the alga’s response to an external carbon cue—whether bacterially derived or exogenously supplied—reflects a conserved metabolic behavior rather than a co-culture-specific phenomenon. Together, these findings establish a quantitative mechanistic baseline for algal-mediated MNZ photodegradation and indicate that external carbon supplementation offers a route to enhancing EOM-driven antibiotic removal in microalgae-based treatment systems independently of a bacterial partner, subject to the carbon being drawn from a waste stream and to the long contact times involved. Future work should validate these findings at environmentally relevant MNZ concentrations and in complex wastewater matrices, and should establish whether the distribution of transformation products is also altered.
Supplementary Materials
The following supporting information can be downloaded at: https://www.mdpi.com/article/10.3390/environments13090514/s1, Figure S1: Split-half validation of the selected two-component PARAFAC model. Excitation and emission loading profiles of C1 and C2 obtained independently from the complementary datasets in the three S4C6T3 comparisons (AB-CD, AC-BD, and AD-BC) are overlaid. All matched excitation and emission loading profiles showed Tucker congruence coefficients (TCCs) ≥ 0.95, with an overall minimum TCC of 0.971, confirming the reproducibility of the two-component solution.; Figure S2: Spectral loadings and residual diagnostics of the selected two-component PARAFAC model. (a) Normalized excitation loading spectra and (b) normalized emission loading spectra of C1 and C2. C1 exhibited excitation/emission maxima at approximately 226/350 nm, whereas C2 exhibited maxima at approximately 204/430 nm. (c) Mean residual excitation-emission matrix after reconstruction by the selected two-component model; Table S1: Comparison of two- to five-component PARAFAC models based on explained variance, core consistency (CORCONDIA), and S4C6T3 split-half validation. The two-component model was selected because it combined high explained variance, high core consistency, and complete split-half reproducibility. Split-half validation was considered satisfactory when all matched excitation and emission loading profiles had TCC ≥ 0.95.
Author Contributions
Conceptualization, Y.L.; methodology, C.D., X.Y. and D.N.; software, Z.L. and K.L.; validation, C.D., X.Y., D.N. and J.Y.; formal analysis, Y.L., C.D. and Z.L.; investigation, Y.L., C.D., K.L. and J.Y.; resources, J.Y. and G.Z.; data curation, C.D., X.Y. and D.N.; writing—original draft preparation, Y.L. and C.D.; writing—review and editing, Y.L., J.Y. and G.Z.; visualization, C.D., Z.L. and K.L.; supervision, J.Y. and G.Z.; project administration, Y.L., J.Y. and G.Z.; funding acquisition, Y.L., J.Y. and G.Z. All authors have read and agreed to the published version of the manuscript.
Funding
This research was funded by the National Natural Science Foundation of China (52670221, 52170153), the Nagqu Regional Scientific and Technological Collaborative Innovation Special Project (NQKJ-2025-QY-02), and the Key Research and Development Program of Xizang (XZ202501ZY0067).
Institutional Review Board Statement
Not applicable. This study did not involve humans or animals.
Data Availability Statement
The data presented in this study are available on request from the corresponding author.
Conflicts of Interest
Authors Xin Yang, Da Qingning, Liu Zhixin, Cole and Yang Junling are employed by Naqu Public Utilities (Group) Co., Ltd. The remaining authors declare that the research was conducted in the absence of any commercial or financial relationships that could be construed as a potential conflict of interest.
Abbreviations
The following abbreviations are used in this manuscript:
| MNZ | Metronidazole |
| WWTP | Wastewater treatment plant |
| EOC | Emerging organic contaminant |
| AOP | Advanced oxidation process |
| EOM | Extracellular organic matter |
| 3EOM* | Triplet-state extracellular organic matter |
| ROS | Reactive oxygen species |
| ·OH | Hydroxyl radical |
| 1O2 | Singlet oxygen |
| SA | Sorbic acid |
| IPA | Isopropyl alcohol |
| FFA | Furfuryl alcohol |
| NMS | Nitrate Mineral Salts (medium) |
| HPLC | High-performance liquid chromatography |
| TOC | Total organic carbon |
| EEM | Excitation–emission matrix |
| PARAFAC | Parallel factor analysis |
| OD680 | Optical density at 680 nm |
| Kobs | Apparent (pseudo-first-order) degradation rate constant |
| sMMO | Soluble methane monooxygenase |
References
- Zhou, T.; Zhang, Z.; Liu, H.; Dong, S.; Nghiem, L.D.; Gao, L.; Chaves, A.V.; Zamyadi, A.; Li, X.; Wang, Q. A review on microalgae-mediated biotechnology for removing pharmaceutical contaminants in aqueous environments: Occurrence, fate, and removal mechanism. J. Hazard. Mater. 2023, 443, 130213. [Google Scholar] [CrossRef] [Scilit]
- Verlicchi, P.; Galletti, A.; Petrovic, M.; Barceló, D.; Al Aukidy, M.; Zambello, E. Removal of selected pharmaceuticals from domestic wastewater in an activated sludge system followed by a horizontal subsurface flow bed—Analysis of their respective contributions. Sci. Total Environ. 2013, 454–455, 411–425. [Google Scholar] [CrossRef] [Scilit]
- Giebułtowicz, J.; Nałęcz-Jawecki, G.; Harnisz, M.; Kucharski, D.; Korzeniewska, E.; Płaza, G. Environmental risk and risk of resistance selection due to antimicrobials’ occurrence in two Polish wastewater treatment plants and receiving surface water. Molecules 2020, 25, 1470. [Google Scholar] [CrossRef] [Scilit]
- Majidi, S.; Pourzamani, H.R.; Ebrahimpour, K. Estimating release of the antibiotic metronidazole into the environment from hospital effluents and assessment of the associated ecological risk: A case study in Isfahan, Iran (2023). Hum. Ecol. Risk Assess. 2024, 30, 699–712. [Google Scholar] [CrossRef] [Scilit]
- Xiong, Q.; Hu, L.-X.; Liu, Y.-S.; Zhao, J.-L.; He, L.-Y.; Ying, G.-G. Microalgae-based technology for antibiotics removal: From mechanisms to application of innovational hybrid systems. Environ. Int. 2021, 155, 106594. [Google Scholar] [CrossRef] [Scilit]
- Yu, X.; Mao, C.; Wang, W.; Kulshrestha, S.; Zhang, P.; Usman, M.; Zong, S.; Hilal, M.G.; Fang, Y.; Han, H.; et al. Reduction of metronidazole in municipal wastewater and protection of activated sludge system using a novel immobilized Aspergillus tabacinus LZ-M. Bioresour. Technol. 2023, 369, 128509. [Google Scholar] [CrossRef] [Scilit]
- Kanafin, Y.; Satayeva, A.; Arkhangelsky, E.; Poulopoulos, S. Treatment of a biological effluent containing metronidazole. Chem. Eng. Trans. 2021, 86, 595–600. [Google Scholar] [CrossRef] [Scilit]
- Msanne, J.; Polle, J.; Starkenburg, S. An assessment of heterotrophy and mixotrophy in Scenedesmus and its utilization in wastewater treatment. Algal Res. 2020, 48, 101911. [Google Scholar] [CrossRef] [Scilit]
- McNeill, K.; Canonica, S. Triplet state dissolved organic matter in aquatic photochemistry: Reaction mechanisms, substrate scope, and photophysical properties. Environ. Sci. Process. Impacts 2016, 18, 1381–1399. [Google Scholar] [CrossRef] [Scilit]
- Kiki, C.; Yan, X.; Elimian, E.A.; Jiang, B.; Sun, Q. Deciphering the role of microbial extracellular and intracellular organic matter in antibiotic photodissipation: Molecular and fluorescent profiling under natural radiation. Environ. Sci. Technol. 2024, 58, 11661–11674. [Google Scholar] [CrossRef] [Scilit]
- Tian, Y.; Zou, J.; Feng, L.; Zhang, L.; Liu, Y. Chlorella vulgaris enhance the photodegradation of chlortetracycline in aqueous solution via extracellular organic matters (EOMs): Role of triplet state EOMs. Water Res. 2019, 149, 35–41. [Google Scholar] [CrossRef] [Scilit]
- Lu, Y.-Z.; Sha, H.-Y.; Di, C.; Zhu, G.-C. A cross-kingdom survival strategy: A methanotroph recruits a microalga for synergistic detoxification of metronidazole. J. Hazard. Mater. 2026, 503, 141127. [Google Scholar] [CrossRef] [Scilit]
- Whittenbury, R.; Phillips, K.C.; Wilkinson, J.F. Enrichment, isolation and some properties of methane-utilizing bacteria. J. Gen. Microbiol. 1970, 61, 205–218. [Google Scholar] [CrossRef] [Scilit]
- Moor, K.J.; Schmitt, M.; Erickson, P.R.; McNeill, K. Sorbic acid as a triplet probe: Triplet energy and reactivity with triplet-state dissolved organic matter via 1O2 phosphorescence. Environ. Sci. Technol. 2019, 53, 8078–8086. [Google Scholar] [CrossRef] [Scilit]
- Lichtenthaler, H.K.; Wellburn, A.R. Determinations of total carotenoids and chlorophylls a and b of leaf extracts in different solvents. Biochem. Soc. Trans. 1983, 11, 591–592. [Google Scholar] [CrossRef] [Scilit]
- Stedmon, C.A.; Bro, R. Characterizing dissolved organic matter fluorescence with parallel factor analysis: A tutorial. Limnol. Oceanogr. Methods 2008, 6, 572–579. [Google Scholar] [CrossRef] [Scilit]
- Su, R.; Dai, X.; Wang, H.; Wang, Z.; Li, Z.; Chen, Y.; Luo, Y.; Ouyang, D. Metronidazole degradation by UV and UV/H2O2 advanced oxidation processes: Kinetics, mechanisms, and effects of natural water matrices. Int. J. Environ. Res. Public Health 2022, 19, 12354. [Google Scholar] [CrossRef] [Scilit]
- Yang, S.; Liu, G.; Meng, Y.; Wang, P.; Zhou, S.; Shang, H. Utilization of xylose as a carbon source for mixotrophic growth of Scenedesmus obliquus. Bioresour. Technol. 2014, 172, 180–185. [Google Scholar] [CrossRef] [Scilit]
- Peng, J.; Pan, Y.; Zhou, Y.; Lei, X.; Guo, Y.; Lei, Y.; Kong, Q.; Cheng, S.; Yang, X. Mechanistic aspects of photodegradation of deoxynucleosides induced by triplet state of effluent organic matter. Environ. Sci. Technol. 2024, 58, 4751–4760. [Google Scholar] [CrossRef] [Scilit]
- Hu, J.; Wei, L.; Zeng, M.; Liang, H.; Lu, J. Photosensitization mechanisms and detoxification effect of extracellular organic matters and intracellular organic matters in antibiotics photodegradation: A case of Microcystis aeruginosa. J. Clean. Prod. 2024, 464, 142788. [Google Scholar] [CrossRef] [Scilit]
- Sun, J.; Chu, R.; Khan, Z.U.H. A theoretical study on the degradation mechanism, kinetics, and ecotoxicity of metronidazole (MNZ) in •OH− and SO4•−-assisted advanced oxidation processes. Toxics 2023, 11, 796. [Google Scholar] [CrossRef] [Scilit]
Disclaimer/Publisher’s Note: The statements, opinions and data contained in all publications are solely those of the individual author(s) and contributor(s) and not of MDPI and/or the editor(s). MDPI and/or the editor(s) disclaim responsibility for any injury to people or property resulting from any ideas, methods, instructions or products referred to in the content. |
© 2026 by the authors. Licensee MDPI, Basel, Switzerland. This article is an open access article distributed under the terms and conditions of the Creative Commons Attribution (CC BY) license.