


Abstract
This study develops an interpretable and validated XGBoost–SHAP framework integrating multisource geospatial data and historical flood observations, with model performance evaluated using independent validation and future projections driven by bias-corrected CMIP6 climate scenarios to characterize the spatiotemporal variations and contributions of flood driving factors across three regions of Kazakhstan (2000–2025). The results demonstrate pronounced spatial differences in flood-driving factors: delayed snowmelt coupled with orographic rainfall dominates flood variability in the mountainous Almaty Region; hydrological memory effects regulate flood responses in the Akmola plains; and socioeconomic exposure shows an increasing contribution to flood risk evolution in Turkestan. Future multi-scenario simulations indicate that the flood-affected area in the Almaty Region is projected to increase by 10.8% under SSP2-4.5, which is associated with enhanced snowmelt processes, whereas the Akmola Region may experience a 23.2% reduction under SSP5-8.5, which is associated with changes in evaporation–soil moisture interactions. The interaction between socioeconomic development and natural hazards results in divergent risk trajectories: urban expansion in Akmola and Turkestan may offset declining hydroclimatic hazards, creating a potential risk paradox, whereas mountainous regions remain sensitive to concurrent increases in hazard intensity and exposure. These findings indicate that flood risk evolution in the studied regions of arid Central Asia is being increasingly influenced by socioeconomic dynamics in addition to natural hazards, highlighting the importance of differentiated adaptive planning strategies.
1. Introduction
Against the backdrop of global warming, the accelerated hydrological cycle is reshaping the global disaster landscape. As global temperatures rise due to greenhouse gas emissions, the water-holding capacity of the atmosphere increases, leading to dramatic fluctuations and extremes in precipitation patterns [1,2]. Studies have shown that since the mid-1970s, global warming has not only prolonged the warm season but also altered the snowmelt timing of seasonal snow cover, leading to a significant increase in the frequency, intensity, and duration of extreme hydrological events [3,4]. This change is particularly dramatic in arid and semi-arid regions, overturning the traditional perception that “arid areas have little rainfall.” As a result, these ecologically fragile areas are facing unprecedented and complex flood threats (such as rainstorms and torrential rains occurring simultaneously, or snowmelt and extreme precipitation overlapping) [5,6]. The socioeconomic losses and health risks (such as mortality) caused by floods are showing a nonlinear growth trend [7,8,9].
As a typical arid/semi-arid inland region, Central Asia’s water resource systems rely primarily on meltwater from mountain glaciers and snow, making them extremely sensitive and vulnerable to climate fluctuations [10,11]. As the most expansive country in Central Asia, Kazakhstan’s diverse topography, ranging from northern plains to southeastern mountains, drives significant spatial heterogeneity in regional flood mechanisms [12,13], with distinct driving mechanisms emerging at sub-regional scales; this highlights the necessity of moving beyond national-scale analyses toward more localized assessments to accurately capture flood processes and risks [14]. In recent years, Kazakhstan has experienced increasingly frequent and severe flood events, exemplified by the catastrophic spring floods of 2024—the most extreme in the past 70 years—driven by rapid snowmelt, extreme precipitation, and antecedent frozen soil conditions. However, these flood risks exhibit pronounced spatial heterogeneity across different geomorphic units. In the northern plains (e.g., the Akmola Region), floods are primarily dominated by the interaction of seasonal snowmelt and extreme precipitation over flat terrain, leading to widespread inundation and substantial threats to agricultural systems [15]. In contrast, the southern and southeastern mountainous regions (e.g., the Almaty Region and Turkestan Region), which are influenced by the Tian Shan and Pamir-Alai ranges [12,16], are characterized by multi-mechanism flood regimes, including glacial meltwater surges, rainfall-induced flash floods, and debris flows, with strong sensitivity to climatic warming [17,18]. This contrast highlights that flood characteristics, impacts, and driving mechanisms are fundamentally shaped by underlying geomorphic and climatic gradients, underscoring the necessity of region-specific flood risk assessments. Despite increasing governmental investment, the lack of high-resolution and long-term datasets remains a critical limitation for accurately capturing such spatially differentiated flood dynamics [19].
It is worth noting that the transformation of floods from natural hydrological events into disasters results from the interaction between flood hazards and human systems. In general, flood risk is determined by the combined effects of hazard, exposure, and vulnerability, where hazard represents the probability and intensity of flood events, exposure refers to the population and assets potentially affected, and vulnerability reflects the sensitivity and adaptive capacity of affected systems. This study selects the Akmola Region, Almaty Region, and Turkestan Region as study areas based on the fact that these three regions not only represent distinctly different natural geographical units in Kazakhstan, but are also the country’s most densely populated, economically active, and disaster-prone risk hotspots. The Akmola Region surrounding the national capital, Astana, is the political heart of the country and a major grain-producing region in the north. Its plains are directly threatened by snowmelt and flooding, which threatens national food security and core infrastructure. The Almaty Region, as the country’s largest economic, cultural, and financial center, boasts the highest population density and GDP contribution. Floods in its mountainous–urban transition zone are highly likely to trigger cascading socio-economic losses. The Turkestan Region, located in the densely populated oasis agricultural belt in the south, is a historical and cultural center and one of the fastest-growing regions. Since it is highly dependent on transboundary rivers such as the Syr Darya, it faces the complex challenges of interlinked flooding and water scarcity [14,20]. This high concentration of population and economy results in a significant “natural–social” and complex flood risk. On the one hand, the disastrous effects of floods are primarily manifested in their destructive effects on the socio-economic system. With the population growth and the concentration of economic assets in flood-prone areas (such as floodplains) in the three core regions mentioned above, the exposure of exposed populations and assets increases significantly [21,22]. In these study areas, the complex relationship between aging infrastructure, energy facilities, and water management systems serves as both a driving force for regional development and a vulnerability to flooding [23,24]. Attribution analysis based on machine learning has also confirmed that indicators representing the intensity of human activity, such as nighttime light intensity (NTL), population density (PD), and gross domestic product (GDP), have become important drivers of changes in flood risk in these regions in recent years [14]. On the other hand, human activities have profoundly altered surface hydrological processes. Intensive land-use changes (such as agricultural reclamation and urban expansion) and the construction of water conservancy projects (such as dams and irrigation canals) have significantly altered the natural runoff generation and collection mechanisms of watersheds, weakening the ecosystem’s natural capacity to regulate runoff [25,26]. In particular, in the urbanization process in arid areas, the increased proportion of impermeable surfaces on the land surface significantly amplifies the stormwater runoff effect [27]. Therefore, the aim of studying these three regions is not only to analyze natural attribution, but also to clarify the key role of human society in the dual process of hazard generation and disaster exposure.
To address the increasingly complex flood risks, the scientific community has conducted long-term research in flood simulation and prediction. Traditional hydrological and hydrodynamic models, such as SWIM, HBV, HEC-RAS, and integrated models incorporating remote sensing data, are widely used in runoff simulation and climate change impact assessment due to their well-defined physical mechanisms [15,16,28]. Furthermore, stochastic models for simulating large-scale floods have also shown potential in regions with scarce data [29]. However, physical models typically require high-quality and complete input data, the parameter calibration process is complex, and the computational cost is high when dealing with nonlinear relationships, which limits their application in regions like Kazakhstan where monitoring stations are sparse [30]. In contrast, with the improvement of computing power and the widespread availability of remote sensing big data, machine learning (ML) methods have gradually become a new paradigm in flood research. Ensemble learning algorithms (such as XGBoost and Random Forest (RF)) and deep learning models (such as CNN, LSTM, and Bayesian neural networks) have shown superior performance compared to traditional statistical models in flood sensitivity assessment, runoff prediction, and urban waterlogging depth prediction [31,32,33]. In particular, hybrid models that combine algorithms such as particle swarm optimization (PSO) further improve prediction accuracy [34]. The introduction of remote sensing data (such as MODIS, Landsat, and Sentinel-1 radar data) has further compensated for the shortcomings of ground-based observations, making it possible to conduct all-weather flood monitoring and long-term series analysis on a large scale [35,36,37].
However, traditional machine learning (ML) models are often referred to as “black boxes” because their decision-making processes lack transparency. Therefore, integrating interpretable machine learning approaches is essential for not only measuring predictive performance but also identifying the underlying drivers of flood evolution. To overcome this deficiency, explainable AI (XAI) techniques, particularly the SHAP (SHapley Additive exPlanations) method, have been introduced into hydrological research. The SHAP method can quantify the marginal contribution of each feature to the model output, revealing the nonlinear relationships and interactions between floods and key driving factors such as precipitation, topography, and vegetation [38,39]. Recent studies have successfully combined XGBoost with SHAP to identify runoff driving mechanisms at different spatiotemporal scales, demonstrating the framework’s significant potential in improving model transparency and scientific rigor [30].
Despite significant progress in flood simulation and ML applications, key gaps remain in understanding the comprehensive risk in specific regions of Kazakhstan: First, there is limited research on the spatiotemporal heterogeneity of driving mechanisms. The existing literature largely focuses on analyses of single river basins (such as the Zabai River) or single types of disasters [15], and there is a lack of systematic comparisons of flood drivers between different climatographic regions of Kazakhstan (northern plains and southern mountains). Are floods in different regions primarily driven by snowmelt, torrential rain, or a combination of both? What are the differences in their spatiotemporal evolution patterns? These questions require further detailed analysis using interpretable machine learning models [14]. Second, future scenario forecasts need to be comprehensive. Although some studies have used CMIP6 data to assess the impact of changes in meteorological elements on runoff [16], research on multi-dimensional (climate + human) scenario simulations of future flood risks combining shared socio-economic pathways (SSPs) is still relatively rare in Kazakhstan. How the decline in snow cover and the increase in extreme precipitation will alter the frequency and intensity of future floods in the context of global warming still requires further quantification. Third, there is no comprehensive risk assessment framework. Current flood assessments often emphasize either physical flood processes or socioeconomic consequences separately, while integrated approaches that simultaneously consider hazard, exposure, and vulnerability remain limited. A comprehensive risk analysis combining digital data, geographical features, and demographic and economic data is crucial for developing precise disaster prevention and mitigation policies [40,41].
Based on the aforementioned background and research gaps, this study selects the Akmola Region, Almaty Region, and Turkestan Region of Kazakhstan as representative study areas, aiming to construct a systematic research framework that integrates driving force analysis, future trend prediction, and comprehensive risk assessment. This study first constructs a high-quality dataset using multi-source remote sensing data fusion techniques (such as STARFM). By building an XGBoost machine learning model and introducing the SHAP interpretability method, we can quantitatively analyze and compare the key driving factors and their spatiotemporal heterogeneity in flood occurrence in different geographic units, revealing the complex nonlinear “precipitation–snowmelt–underlying surface” interaction mechanism [14,30]. Based on this framework, and using the latest SSP2-4.5 and SSP5-8.5 scenarios from CMIP6, combined with future socio-economic development trends, this study projects future changes in flood-related environmental conditions and vulnerability patterns under different SSP scenarios in the near term (2040) and long term (2070–2100), in order to fill the gap in future flood risk scenario analysis for this region [16,42]. Finally, taking into account the hazard of hazard factors, the exposure of exposed populations and assets (population, GDP, and infrastructure), and regional vulnerability, this study conducts regional flood risk assessment by integrating flood-related hazards, exposure, and vulnerability indicators. This study aims to provide scientific basis and decision support for sustainable development, water security, and disaster risk management in Kazakhstan and similar arid and semi-arid regions [10].
2. Data and Methods
This study integrated multiple dimensions, including inventory construction, meteorological and hydrological driving mechanisms, geomorphological features, and socioeconomic exposure, to construct a comprehensive geospatial database of flood risk. To address the spatial scale mismatch between multi-source remote sensing and reanalysis data and ensure the spatial accuracy of the analysis results, this study systematically standardized all raster layers spatially. All data were resampled to a uniform 30 m resolution and projected to the WGS84 coordinate system, thus constructing a spatially consistent dataset, laying a solid data foundation for revealing the spatiotemporal evolution of flood risk.
2.1. The Study Area
Kazakhstan’s vast span forms a complex “mountain–plain–desert” geomorphological system. To analyze the spatial heterogeneity of flood drivers in arid Central Asia, this study focused on three core regions (Akmola, Almaty, and Turkestan) along the “north–southeast–south” climatic and geomorphological gradient (Figure 1). Together, these three regions span climatic conditions from semi-humid to hyper-arid and account for approximately 40% of Kazakhstan’s population and 50% of its economic output, thereby representing areas where interactions between human activities and water-related hazards are increasingly pronounced [10,14].
Figure 1.
Study area.
For practical analysis, the study defined the research area based on administrative boundaries rather than physical watersheds. Although flood processes are governed by catchment-scale hydrology, effective risk assessment requires integrating physical hazard layers with socioeconomic indicators, such as census data, gross regional product, and built environment datasets. Socioeconomic data are generally aggregated by jurisdiction, and interpolating them to natural basins may introduce errors and cross-boundary inconsistencies [43]. Furthermore, in Central Asia, flood mitigation and climate adaptation measures are implemented by regional governments, making administrative-level assessments more relevant for policy.
The Akmola Region, in north-central Kazakhstan, lies within a humid continental–semi-arid transition zone and is characterized by low-relief plains and major river systems (Ishim, Nura), whose relatively gentle longitudinal gradients favor widespread overbank inundation under high-flow conditions. As a key agricultural region hosting Astana, its land use is dominated by dryland farming [44]. Flooding is primarily driven by spring snowmelt, where rapid warming over frozen, low-permeability soils generates extensive runoff [15], while antecedent soil moisture critically controls flood thresholds under extreme precipitation.
The Almaty Region, in southeastern Kazakhstan along the northern Tian Shan foothills, is characterized by a steep (>4000 m) elevation gradient and strong altitudinal climatic zonation. River systems (e.g., Ili) are dominated by glacier melt and orographic precipitation, making runoff highly temperature-sensitive [45]. Flood regimes are multi-mechanistic, with orographic variability and accelerated cryospheric melting amplifying compound flood risks [46].
The Turkestan Region, located in southern Kazakhstan, is an arid, river-dependent system dominated by irrigated agriculture along the Syr Darya. Flood regimes are controlled by upstream hydroclimatic inputs (snowmelt and extreme precipitation) and intensive human regulation [47], with altered flow regimes and rapid urban expansion jointly amplifying flood exposure [48].
The southeastern Almaty Region is characterized by mountain hydrological processes strongly influenced by snowmelt and glacier melt and orographic precipitation, whereas the northern Akmola plains are dominated by snowmelt- and precipitation-driven flooding over flat agricultural landscapes. The arid Turkestan Region represents a contrasting river-dependent and irrigation-dominated system, where upstream hydroclimatic inputs interact with intensive human regulation and rapidly changing exposure. This mountain–plain and irrigation–dryland contrast provides a natural framework for disentangling the spatiotemporal heterogeneity of flood driving mechanisms in arid Central Asia.
2.2. Data Acquisition and Preprocessing
This study constructed a comprehensive geospatial database that includes historical flood inundation extent, meteorological and hydrological driving forces, topographic features, and socioeconomic exposure (Table 1). To ensure spatial consistency of the multi-source data, all raster data were resampled to a uniform 30 m resolution and projected into a common coordinate system.
Table 1.
Summary of the datasets.
- Flood cataloging and sample construction
The accuracy of historical flood samples directly determines the predictive performance of machine learning models. This study utilized the flood mapping framework based on multi-source remote sensing data proposed by Liu et al. to construct a historical flood catalog for key areas in Kazakhstan [14]. This method is based on Sentinel-1 GRD SAR data and leverages its all-weather and day-night observation capability to overcome the susceptibility of optical imagery to cloud interference. The data preprocessing workflow includes precise orbit correction, thermal noise removal, and radiometric calibration. Building upon this, an improved adaptive threshold segmentation algorithm was employed, combined with auxiliary data, to effectively eliminate permanent water bodies and achieve high-precision automated extraction of flood-inundated areas. To address the impact of imbalanced positive and negative samples on model training, this study referenced the construction strategy of the FloodCastBench dataset and randomly generated non-flood samples (negative samples) in a 1:1 ratio in the non-flooded area [49]. The selection of negative samples strictly avoids the historical maximum inundation range, and combines slope and elevation thresholds to exclude areas that are unlikely to flood, such as extremely high altitudes, thereby ensuring that the model can accurately learn the boundary conditions for flood occurrence.
- B.
- Selection of flood driving factors
Considering the complexity of flood formation in the study area, this study selected key driving factors from four dimensions: topography, hydrology, meteorology, and human activities. Topography and hydrological factors are the fundamental determinants of flood susceptibility. This study first selected indicators such as elevation, slope, aspect, and distance to rivers. These data were derived from SRTM DEM and directly control the runoff flow velocity and direction of surface runoff [40]. Given the dominant role of snowmelt floods in the region, this study specifically introduced snow cover-related factors in addition to conventional precipitation indicators. Unlike liquid precipitation, which generates immediate runoff, snow accumulation, as a solid reservoir, exhibits significant time lag and nonlinear characteristics in its transformation into river runoff—that is, snowmelt from winter snow accumulation is often delayed until spring when temperatures rise before being released in a concentrated manner to form flood peaks. Existing studies have confirmed that changes in snow phenology (such as earlier snowmelt time and changes in snowmelt rate) under the background of global warming have become key variables that alter the peak and timing of floods, which are even more decisive than changes in precipitation alone. Therefore, this study used ERA5-Land reanalysis data to calculate the spring snowmelt rate (SWE) and snow water equivalent as input features, and incorporated soil moisture data to characterize the moderating effect of antecedent soil moisture on runoff generation mechanisms [16,50,51]. Finally, to quantify the impact of human activities on the underlying surface and potential flood exposure, the Nighttime Light Index (NTL) and Land-Use Type (LULC) were selected as socioeconomic proxy variables. These factors not only reflect the distribution of impervious surfaces but also indicate the vulnerability of regional exposed socioeconomic assets [52].
- C.
- Future climate scenario data
To assess the long-term impacts of climate change on future flood risk, this study used output data from the Sixth Coupled Model Intercomparison Project (CMIP6). Based on the research findings of Kalashnikova et al. in the mountainous regions of Central Asia and surrounding watersheds, we selected two scenarios: SSP2-4.5 (moderately forced pathway) and SSP5-8.5 (high-emission pathway). SSP2-4.5 represents an intermediate development and emission pathway, reflecting historical trends and serving as a plausible near-to-mid-term baseline. In contrast, SSP5-8.5 depicts an extreme, fossil-fueled development trajectory with high radiative forcing, providing an upper bound for hazard exposure [16]. Selecting these contrasting scenarios brackets the range of plausible climate stress—from a realistic baseline to a worst-case scenario—thereby capturing how cryospheric melt and altered precipitation patterns drive regional flood anomalies under different carbon forcing levels [53]. Considering the climate characteristics of the Kazakhstan region, the GCM, which performs well in this region, was selected. The Delta method was used to correct biases in the output temperature and precipitation data, so as to correct the systematic deviations between the model simulation values and historical observation records and ensure the reliability of future scenario data.
2.3. Methodology
The workflow (Figure 2) begins with the integration of multisource geospatial data and the extraction of annual historical flood-affected areas for 2000–2025, which were used to construct the historical flood inventory and target variable. Following feature screening and normalization, the XGBoost model was calibrated through hyperparameter optimization and subsequently validated using k-fold cross-validation, an independent test set, and extreme-event performance assessment. SHAP analysis was then applied to quantify the global importance and interannual evolution of flood driving factors. Subsequently, the core mechanisms of “topographic–thermal synergy” and “hydrological memory” were elucidated through multidimensional interaction analyses. Finally, future flood susceptibility was projected under SSP2-4.5 and SSP5-8.5 using bias-corrected CMIP6 climate data and projected exposure variables. The resulting hazard, sensitivity, and vulnerability indicators were subsequently integrated within the HSV framework to assess future comprehensive flood risk. The entropy weight method and coupling coordination degree model were then applied to quantify the comprehensive risk level and the interactions among the hazard, sensitivity, and vulnerability subsystems.
Figure 2.
Technological approach to spatiotemporal heterogeneity and integrated analysis of flood risk.
- XGBoost–SHAP
This study develops an integrated XGBoost (Extreme Gradient Boosting)–SHAP framework to model flood susceptibility and elucidate driving mechanisms. Negative samples were generated from non-inundated areas outside the maximum historical flood extent, while temporal consistency was considered by matching samples with corresponding annual environmental conditions to avoid seasonal inconsistency and spurious correlations. The resulting observations were organized as pixel-year samples for model construction. Predictors were first screened for multicollinearity using the variance inflation factor (VIF) and Pearson correlation, after which the retained variables were resampled and co-registered to a common 30 m spatial resolution and normalized using min–max scaling. Compared to traditional statistical models, XGBoost effectively controls model complexity by introducing a regularization term, exhibiting higher prediction accuracy and robustness when dealing with nonlinear relationships and high-dimensional data [54]. Model calibration was performed through hyperparameter optimization using grid search combined with k-fold cross-validation. Candidate combinations of model parameters were systematically evaluated during the training stage, and the parameter set achieving the best cross-validation performance was selected to construct the final optimized model. This procedure was designed to reduce overfitting and improve the robustness of model performance across different samples. To enhance interpretability, SHAP was employed to quantify the contribution of each driving factor, and the absolute SHAP values (|SHAP|) were averaged annually to quantify the relative importance of each predictor, while the original SHAP values were retained to interpret the direction of influence. Using this method, this study not only achieved a global importance ranking of driving factors, but also quantitatively revealed the dynamic evolution trends of key driving forces (such as rainfall, snowmelt, and topographic factors) across different years and the interannual switching characteristics of their main controlling factors [55]. The optimized model was evaluated using both k-fold cross-validation and an independent test set that was not involved in model training or parameter optimization. Model performance was quantified using the coefficient of determination (R2), root mean square error (RMSE), and mean absolute error (MAE). Cross-validation was used to assess model stability during calibration, whereas the independent test set was used to evaluate the generalization capability of the final model. The coefficient of determination (R2), root mean square error (RMSE), and mean absolute error (MAE) were calculated to assess the predictive capability and generalization performance of the optimized XGBoost model. This validation procedure was also applied to ensure the reliability of subsequent future scenario projections.
- B.
- Flood susceptibility prediction under future scenarios
To explore the future flood evolution trends under the combined effects of climate change and human activities, this study established a prediction framework that ranges from “multi-scenario driven” to “seasonal trend quantification”. First, CMIP6 simulations for the historical period were compared with corresponding historical climate observations to quantify systematic biases in temperature and precipitation. The Delta method was then applied to bias-correct the CMIP6 climate data, and the corrected historical series were used to assess the consistency of climate-driven simulations with historical flood conditions before the corrected projections were extended to the SSP2-4.5 and SSP5-8.5 scenarios. Although this method effectively corrects mean climate biases, uncertainties associated with changes in precipitation variability and extremes remain, which are discussed in the uncertainty analysis [16]. Meanwhile, cellular automata–Markov models were applied to simulate the spatial distribution of land use/cover (LULC) in the corresponding years to capture the potential impact of future urbanization on the runoff generation and routing processes [52]. Subsequently, the corrected future meteorological data, simulated LULC data, and unchanged topographic static factors were uniformly input into the optimized XGBoost regression model. Based on the nonlinear mapping rules established in historical periods, the monthly flood inundation area for the future (2025–2100) was predicted [54].
Given the seasonal differences in flood occurrence, this study also developed a quantitative analysis method for seasonal evolution trends for two key periods: spring (March–May) and summer (June–July). By automatically identifying the peak months of flood inundation area in future years, and using the least squares method to perform linear trend fitting on the peak data from 2025 to 2100, the slope of change and the overall growth rate were calculated. This step aims to quantitatively characterize whether there are significant long-term trends of increasing or decreasing flood risk in different seasons under the background of climate warming, thereby revealing the potential drift of seasonal flood patterns [50,51].
- C.
- Integrated flood risk and coupling coordination assessment
To quantitatively assess the comprehensive impact of flood disasters on the coupled human–natural system under future scenarios, this study constructed a comprehensive risk assessment framework based on “hazard-sensitivity-vulnerability” (HSV) and introduces a coupling coordination degree model (CCD) to reveal the nonlinear interaction mechanism between the subsystems [56].
- (1)
- Construction of HSV indicator system
Based on the characteristics of the study area and data availability, key indicators were selected to construct an assessment system, which was divided into three subsystems. In this system, the hazard subsystem (H) selects flood forecast area and annual precipitation as positive indicators to directly characterize the intensity and scale of hazard factors; the sensitivity subsystem (S) uses ecological indices calculated based on future land-use data as negative indicators to reflect the ecosystem’s buffering and regulation capacity against floods by assigning differentiated ecological service values to different land types; and the vulnerability subsystem (V) selects built-up land area and nighttime light index (NTL) as positive indicators to characterize the exposed populations and assets.
- (2)
- Calculation of comprehensive risk index
After normalization of each indicator, the Entropy Weight Method (EWM) is used to objectively determine the weight of each indicator. The information entropy of each indicator is calculated to measure the data variability, thereby determining the weight coefficient to avoid subjective bias in weighting. Finally, the annual comprehensive risk index (FRI) is calculated through weighted summation to quantify the overall flood risk level of the region.
- (3)
- Construction of coupling coordination degree model
To explore the interactions among the three subsystems of hazard, sensitivity, and vulnerability, this study introduces a coupling coordination degree model. First, the coupling degree is calculated using the following formula:
In the formula, represent the comprehensive scores of the three subsystems: hazard, sensitivity, and vulnerability, respectively. The coupling coordination degree D is then calculated to reflect the coordination consistency of the various elements during the system’s development:
In this study, equal weights were initially assigned to the three subsystems (α = β = γ = 1/3) to maintain comparability among hazard, sensitivity, and vulnerability components. The limitation of this assumption is discussed in the uncertainty analysis. Since both the coupling degree (C) and coordination index (T) are normalized between 0 and 1, the resulting coupling coordination degree (D) is theoretically bounded between 0 and 1, where larger values indicate stronger coordination among subsystems. A higher D value indicates that the subsystems (such as flood enhancement, urban sprawl, and ecological degradation) are in a highly mutually reinforcing state, meaning that the system faces more complex and compound risks and challenges, requiring more comprehensive management measures [54].
3. Results
3.1. Spatiotemporal Evolution Characteristics of Flood Inundation Range
The spatiotemporal evolution analysis of flood inundation revealed significant differences in the flood occurrence mechanisms among the three study areas of the Almaty Region, Akmola Region, and Turkestan Region. By integrating the annual variation in flood inundation extent and seasonal distribution characteristics from 2000 to 2025 (Figure 3), three distinct regional flood response patterns were identified. These patterns reflect differences in hydroclimatic conditions, topographic constraints, and underlying surface characteristics among the three regions.
Figure 3.
Temporal variation in annual flood-affected area in Kazakhstan (2000–2025).
- Almaty Region: Topographic lag effect and thermal driving mechanism
Due to the mountainous terrain in the southeast, flood events in the Almaty Region exhibit a significant “seasonal tail” characteristic, with flood peaks often lagging behind the snowmelt season in the plains. As can be seen from the vertical structure of the stacked bar chart (Figure 3), the flood layer in this region exhibits an unusual thickness in certain years, forming a significant “inverted” proportion with the snowmelt season. Statistics show that in typical years such as 2002, 2003, and 2010, the inundated area during the rainy season (May–July) was significantly higher than that during the snowmelt season (February–April). Taking 2003 as an example, while floodwaters generally receded in other areas, the Almaty Region experienced consecutive flooding peaks in May and June, with a total inundated area of 4101.6 km2 during the rainy season, approximately 2.1 times that of the snowmelt season (1902.5 km2). This anomalous seasonal distribution suggests that delayed snow and glacier melt processes may contribute substantially to summer flood formation, supporting the identified “topographic–thermal synergy” mechanism. From the spatiotemporal evolution of the inundation range (Figure A1), the floods in the Almaty Region have obvious spatial clustering, mainly distributed in the Ili River Delta in the northwest and the southern shore of Lake Balkhash. In terms of time series, the region has experienced three evolutionary stages: 2000–2010 was a relatively stable period, with floods mainly following the edges of natural water bodies, manifesting as seasonal flooding at the lake inlets; 2015 was a period of significant expansion, with dark blue inundated patches rapidly increasing in density and widening in the delta region, indicating strong wetting cycles or extreme flood events during this period; the last five years (2020–2025) have been a period of high-level maintenance, especially the observation results in 2025, which show that the area of wetlands and floodplains around the lake inlets remains at a high level. Overall, the floods in this region are typical of the “deltaic overflow type,” subject to the dual regulation of water from the upstream Ili River and glacial meltwater, resulting in highly concentrated areas of change.
- B.
- Akmola Region: Combined effect of plains retention and rainy season enhancement
As the region with the largest and longest-lasting floods, the Akmola Region exhibits unique “plain retention” hydrological characteristics. From the perspective of seasonal distribution (Figure 3), this region not only has a high capacity for expansion during the snowmelt season (February to April), but its inundated area during the rainy season (May–July) also remains at a high level for a long time. Taking the typical snowmelt flood in April 2006 as an example, the inundated area reached 5130.1 km2, and formed a large-scale floodplain along the Ishim River and a group of low-lying lakes. An even more unusual event occurred in 2024, when the region experienced its worst flooding on record, with the area submerged during the rainy season (7318.5 km2), far exceeding that of the snowmelt season (4640.3 km2). This unusual “high value during the rainy season” is not simply driven by summer precipitation, but is caused by the superposition of poor drainage due to the micro-topography of the plains and the “hydrological memory effect” formed by the accumulation of snowmelt in the early stage. This also confirms that soil saturation has a significant nonlinear amplification effect on runoff generation, meaning that the earlier snowmelt provided high antecedent water levels for the rainy season floods. Analysis of the long-term evolution of the flooded area (Figure A1) shows that the Akmola Region has experienced a significant wet–dry transition process. The period from 2000 to 2005 was a relatively dry period, with sparse and scattered flood patches and a small natural water area. The period from 2010 to 2015 was a period of sudden change, with an explosive increase in floods and water area, filling numerous previously dry depressions and significantly expanding existing lakes. The period from 2020 to 2025 was a period of high-level fluctuations. Although it had slightly decreased compared to the peak in 2015, the overall water area and potential inundation area were still much larger than in the early 2000s. Overall, the region represents a typical plain depression water-accumulation system, showing a clear trend of “becoming wetter” and is highly sensitive to precipitation fluctuations and snowmelt processes.
- C.
- Turkestan Region: Early spring outbreak characteristics resonate with systemic risk
Located at the southernmost part of Kazakhstan, the Turkestan Region is controlled by low-latitude heat conditions and is most sensitive to temperature rises, exhibiting a distinct “early spring outbreak” characteristic. According to statistics, in March 2024, while the Akmola Region in the north was still frozen, it had already experienced significant flooding due to rapid snowmelt. It is worth noting that in years of extreme weather, this region is highly susceptible to triggering cross-regional “risk resonance”. For example, in April 2017, the inundated area during the snowmelt season in the Turkestan Region reached a record high (3139.1 km2), while the Akmola Region and Almaty Region in the north were also at high water levels. This pattern of “simultaneous flooding in northern and southern regions” reflects the increasing influence of interactions between hydrological processes and human activities on regional flood dynamics in different geographical units due to extreme atmospheric circulation anomalies, which reflects the spatial linkage characteristics of complex disasters. According to the spatiotemporal evolution diagram of the inundation range (Figure A1), the floods in this area are mainly controlled by the Syr Darya main stream and surrounding water systems. Between 2000 and 2010, the extent of flooding remained relatively stable; around 2015, the water area increased significantly, with the increase mainly concentrated in the floodplains along the riverbanks; and in the last five years, it has remained at a certain size. Unlike the northern depression-type floods, the Turkestan Region is a typical “riverside flood type”. Its flood evolution is not only driven by climate, but is also greatly affected by human intervention, such as water volume regulation of the transboundary river (Syr Darya) and the upstream reservoir scheduling strategy, and has stronger water infrastructure regulation characteristics.
3.2. Spatiotemporal Heterogeneity Analysis of Flood Driving Mechanisms
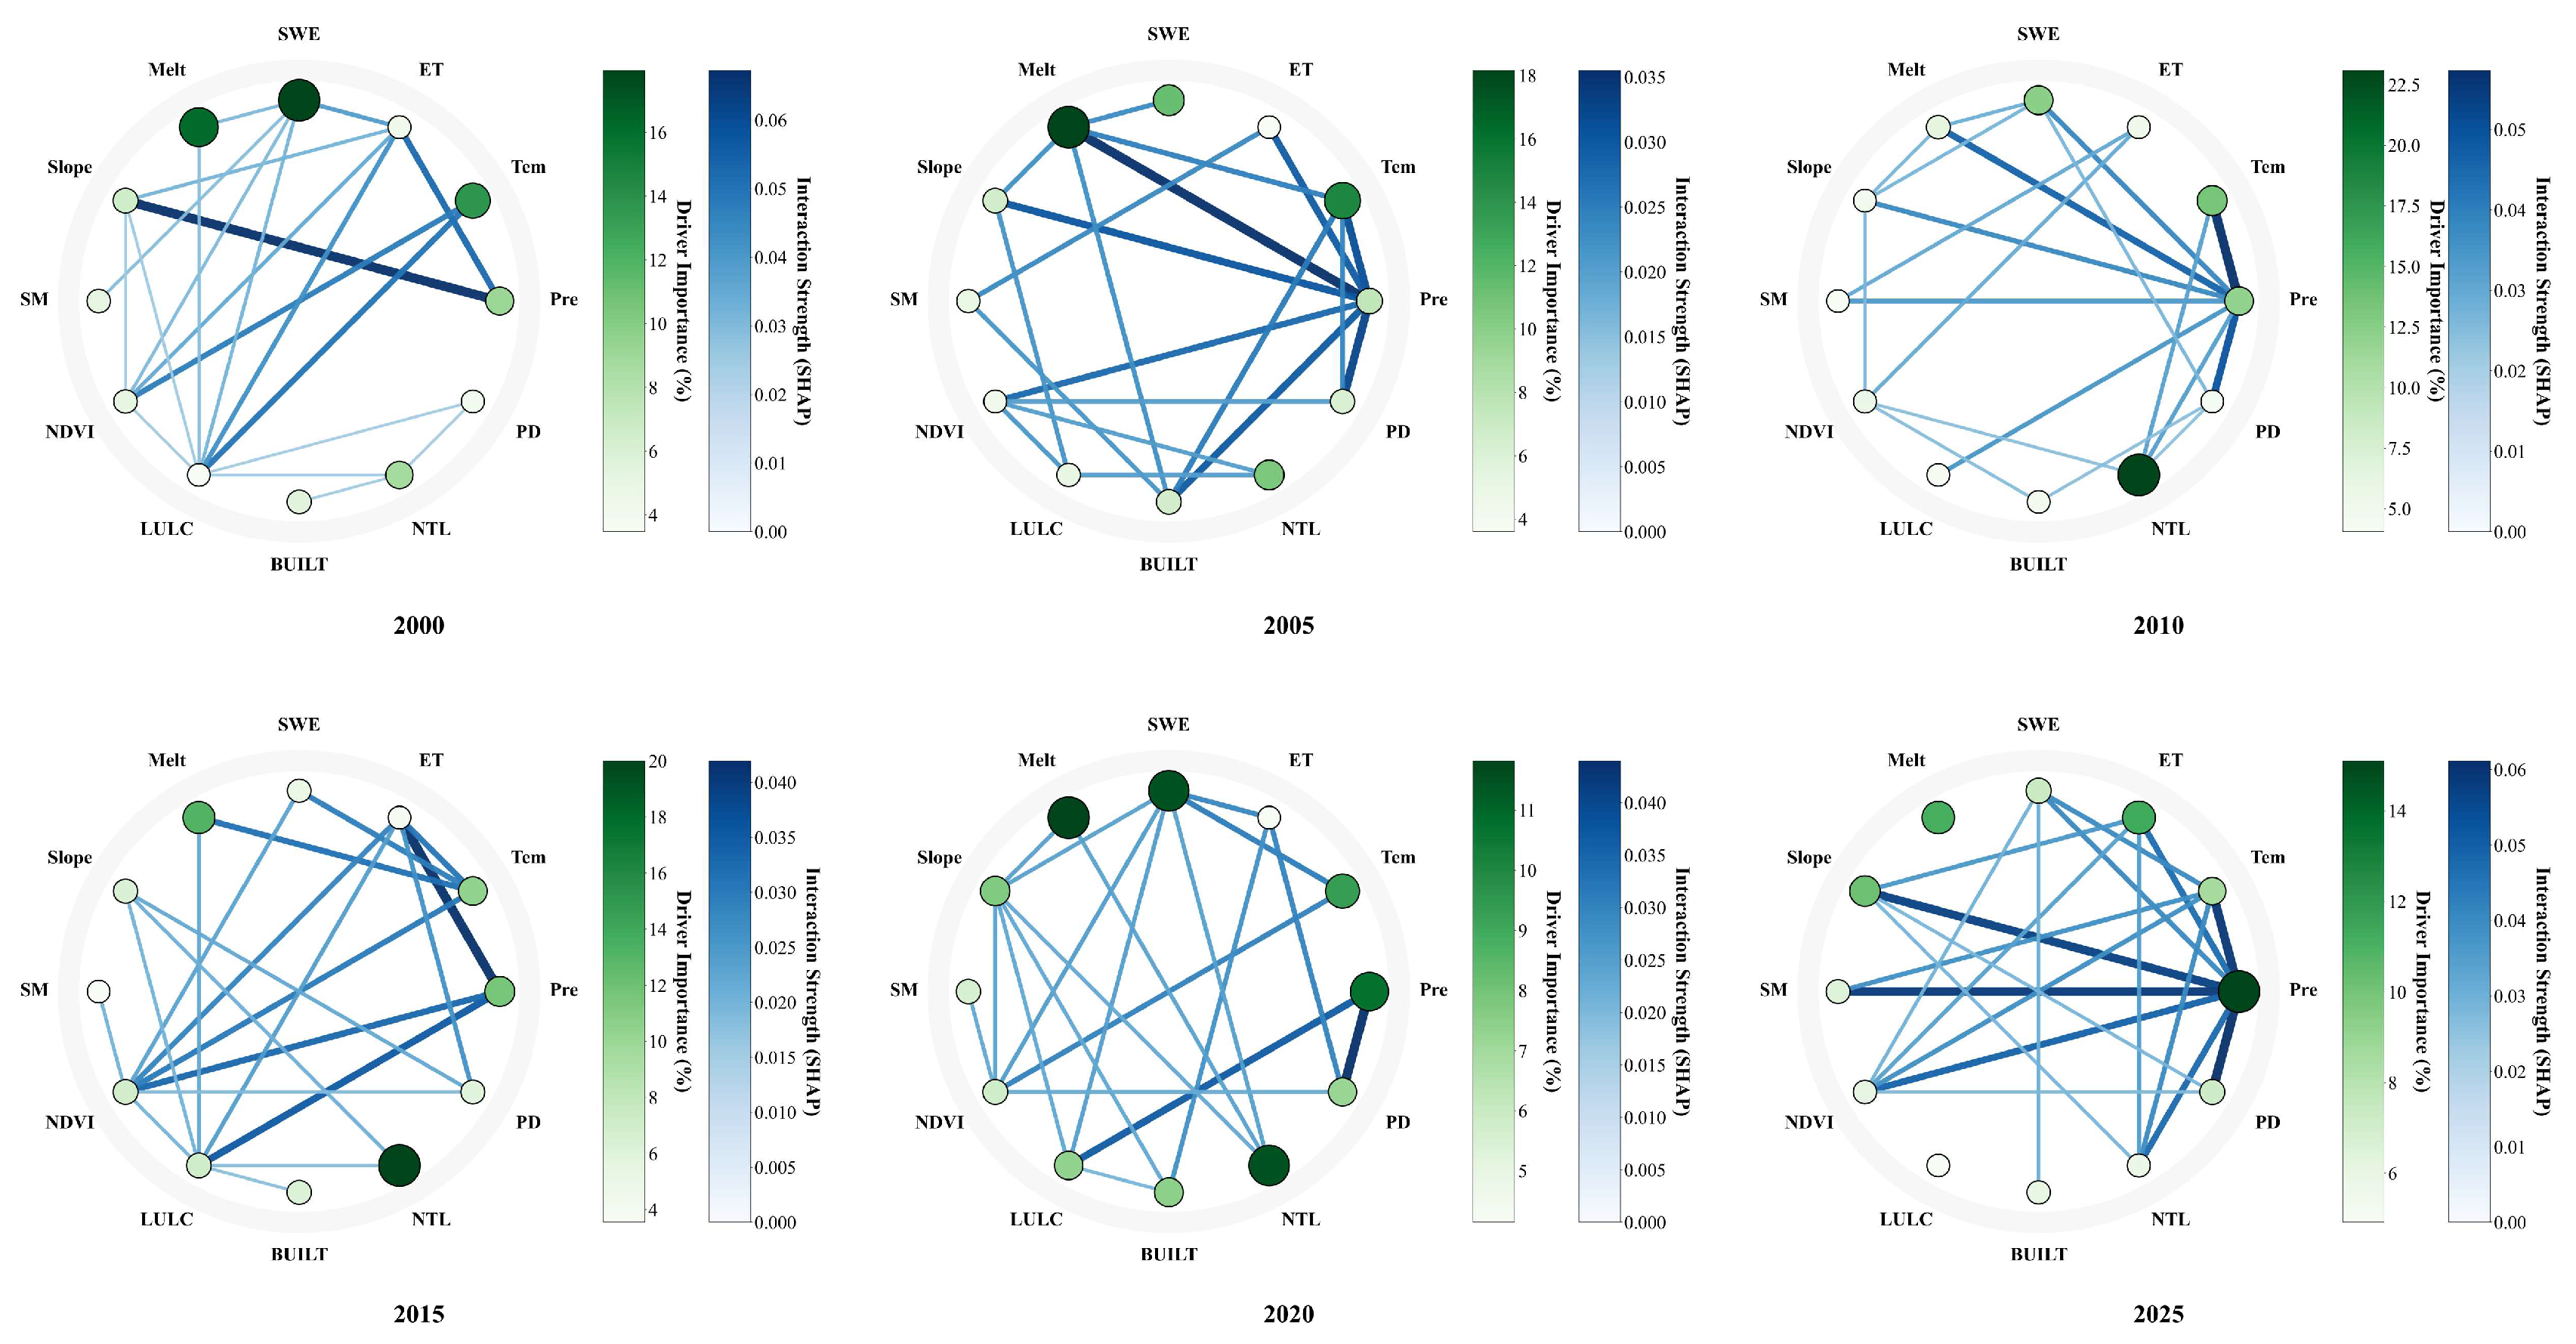
To systematically analyze the spatiotemporal heterogeneity of flood drivers across different geographical units of Kazakhstan, this study compared the temporal characteristics of the five dominant drivers in the Almaty Region, Akmola Region, and Turkestan Region from 2000 to 2025 (Table 2), together with the multi-factor coupling mechanism networks (Figure 4, Figure 5 and Figure 6). The results reveal pronounced regional differentiation in both the relative importance and temporal evolution of dominant flood drivers, indicating distinct flood driving mechanisms across the three study regions.
Table 2.
Temporal characteristics of the five dominant flood drivers in the three study regions (2000–2025).
Figure 4.
Almaty Region multi-factor coupling mechanism network.
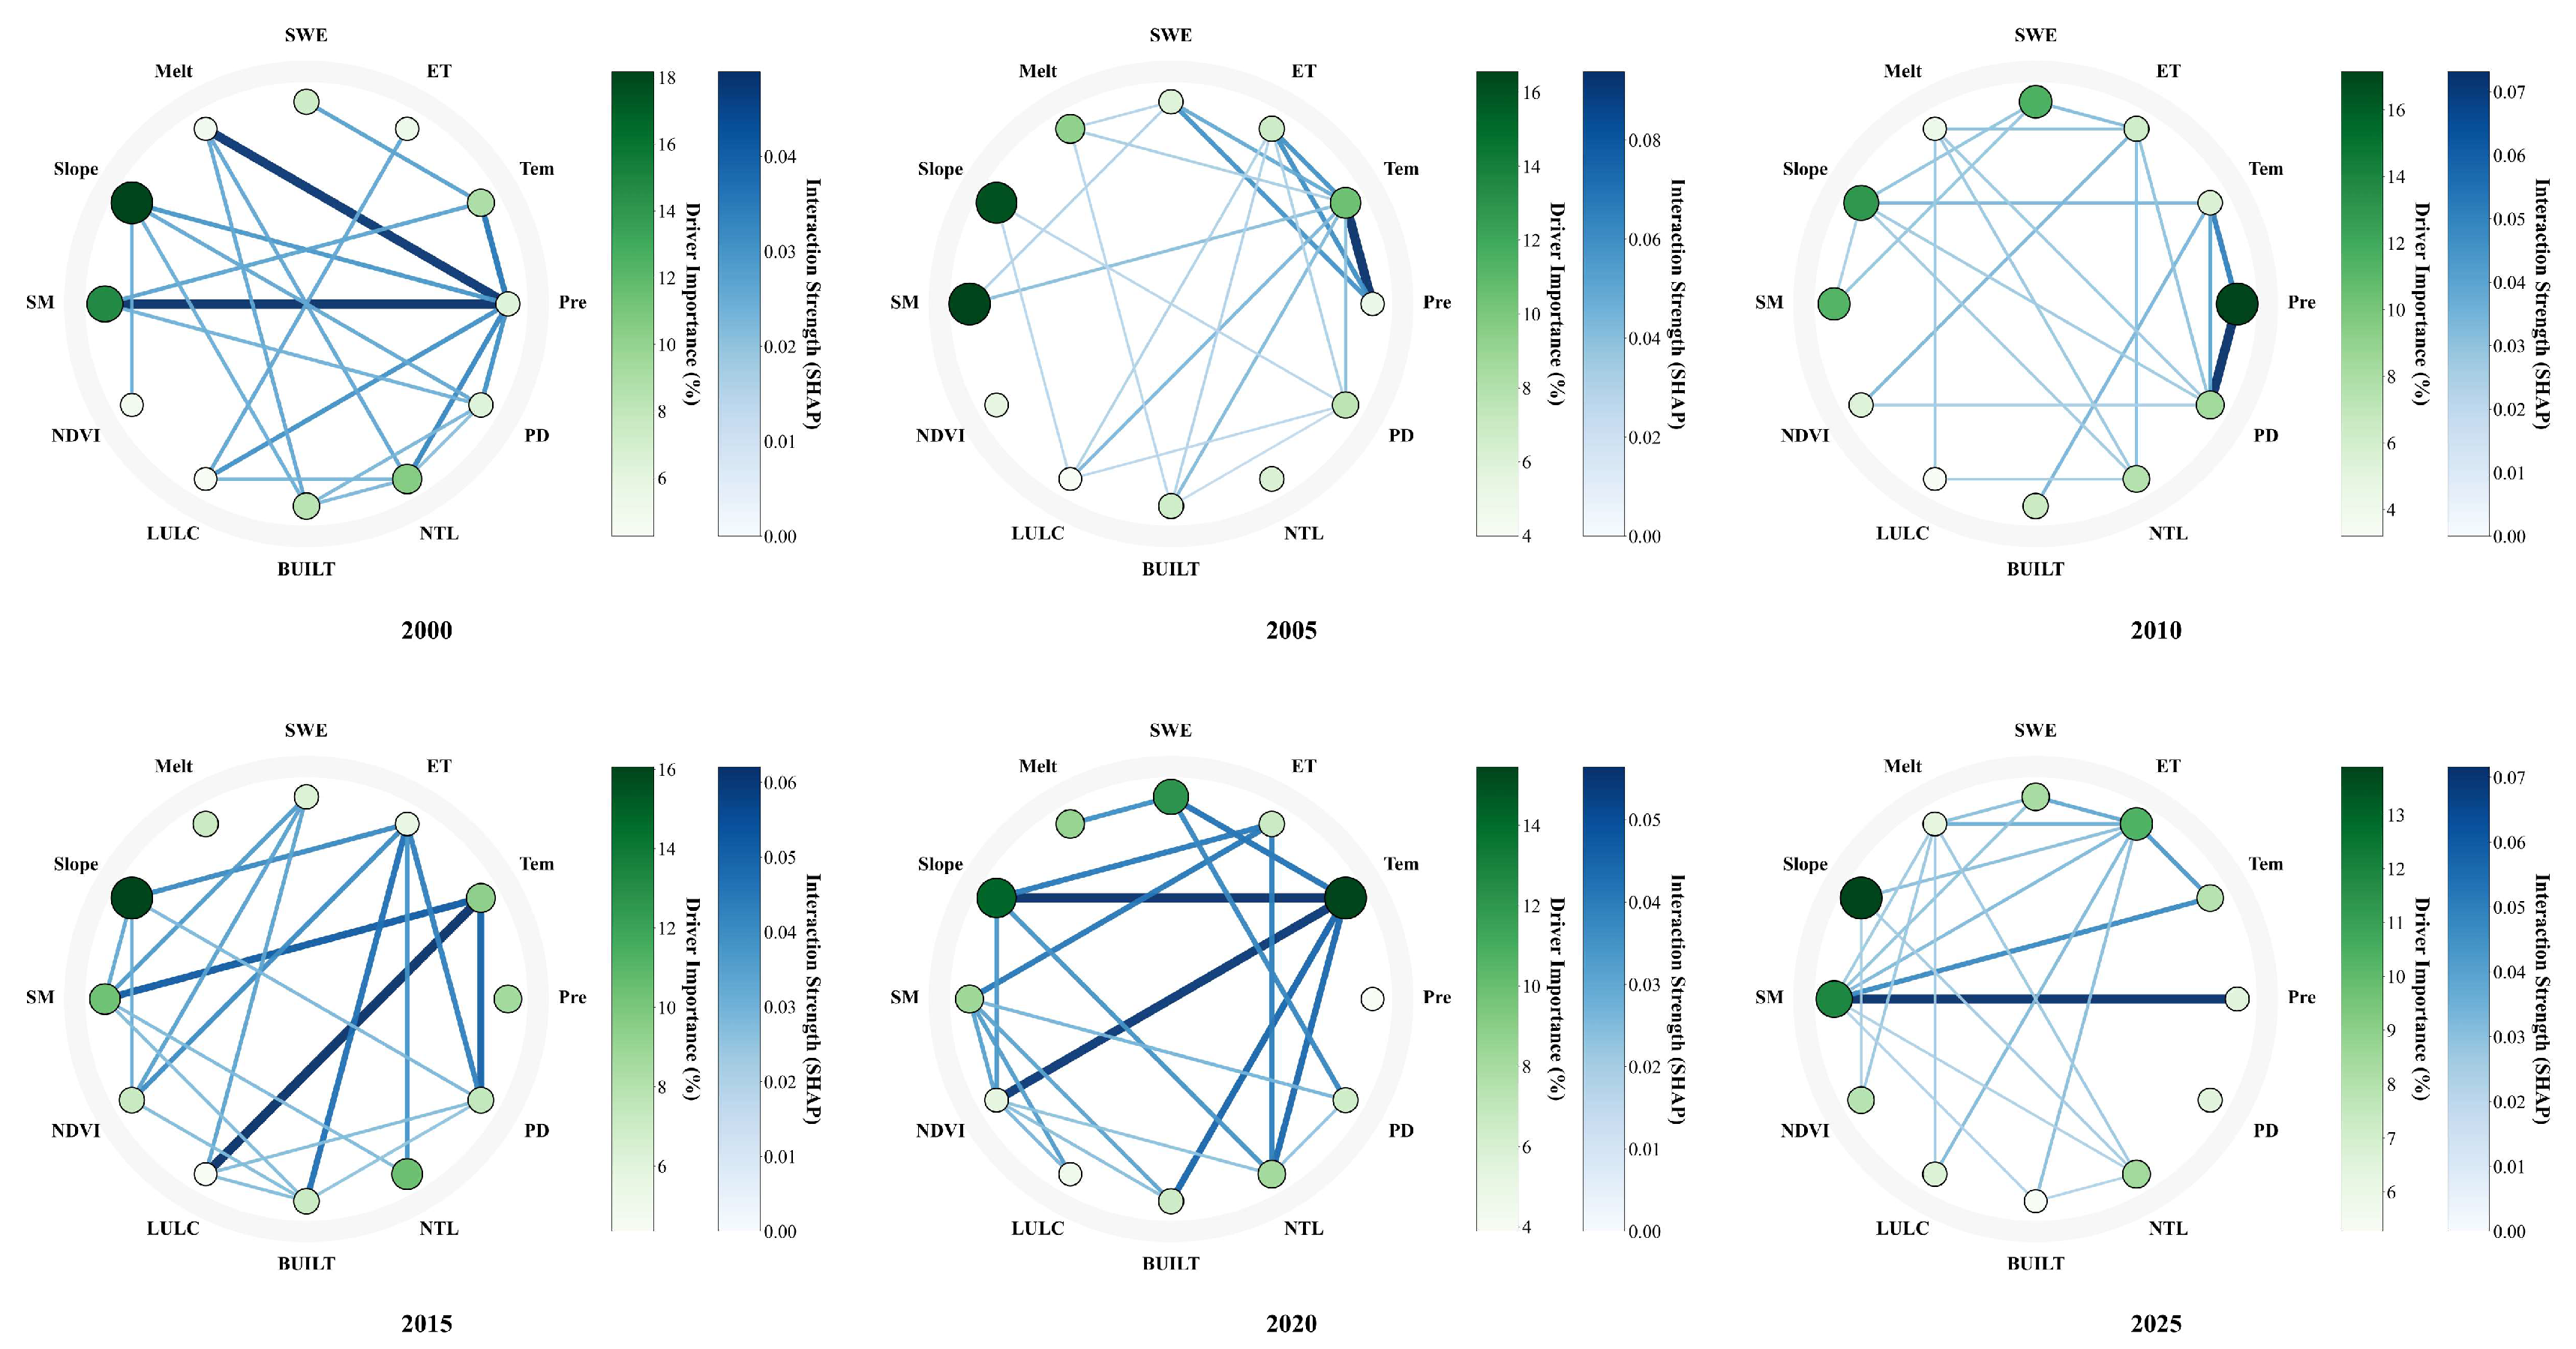
Figure 5.
Akmola Region multi-factor coupling mechanism network.
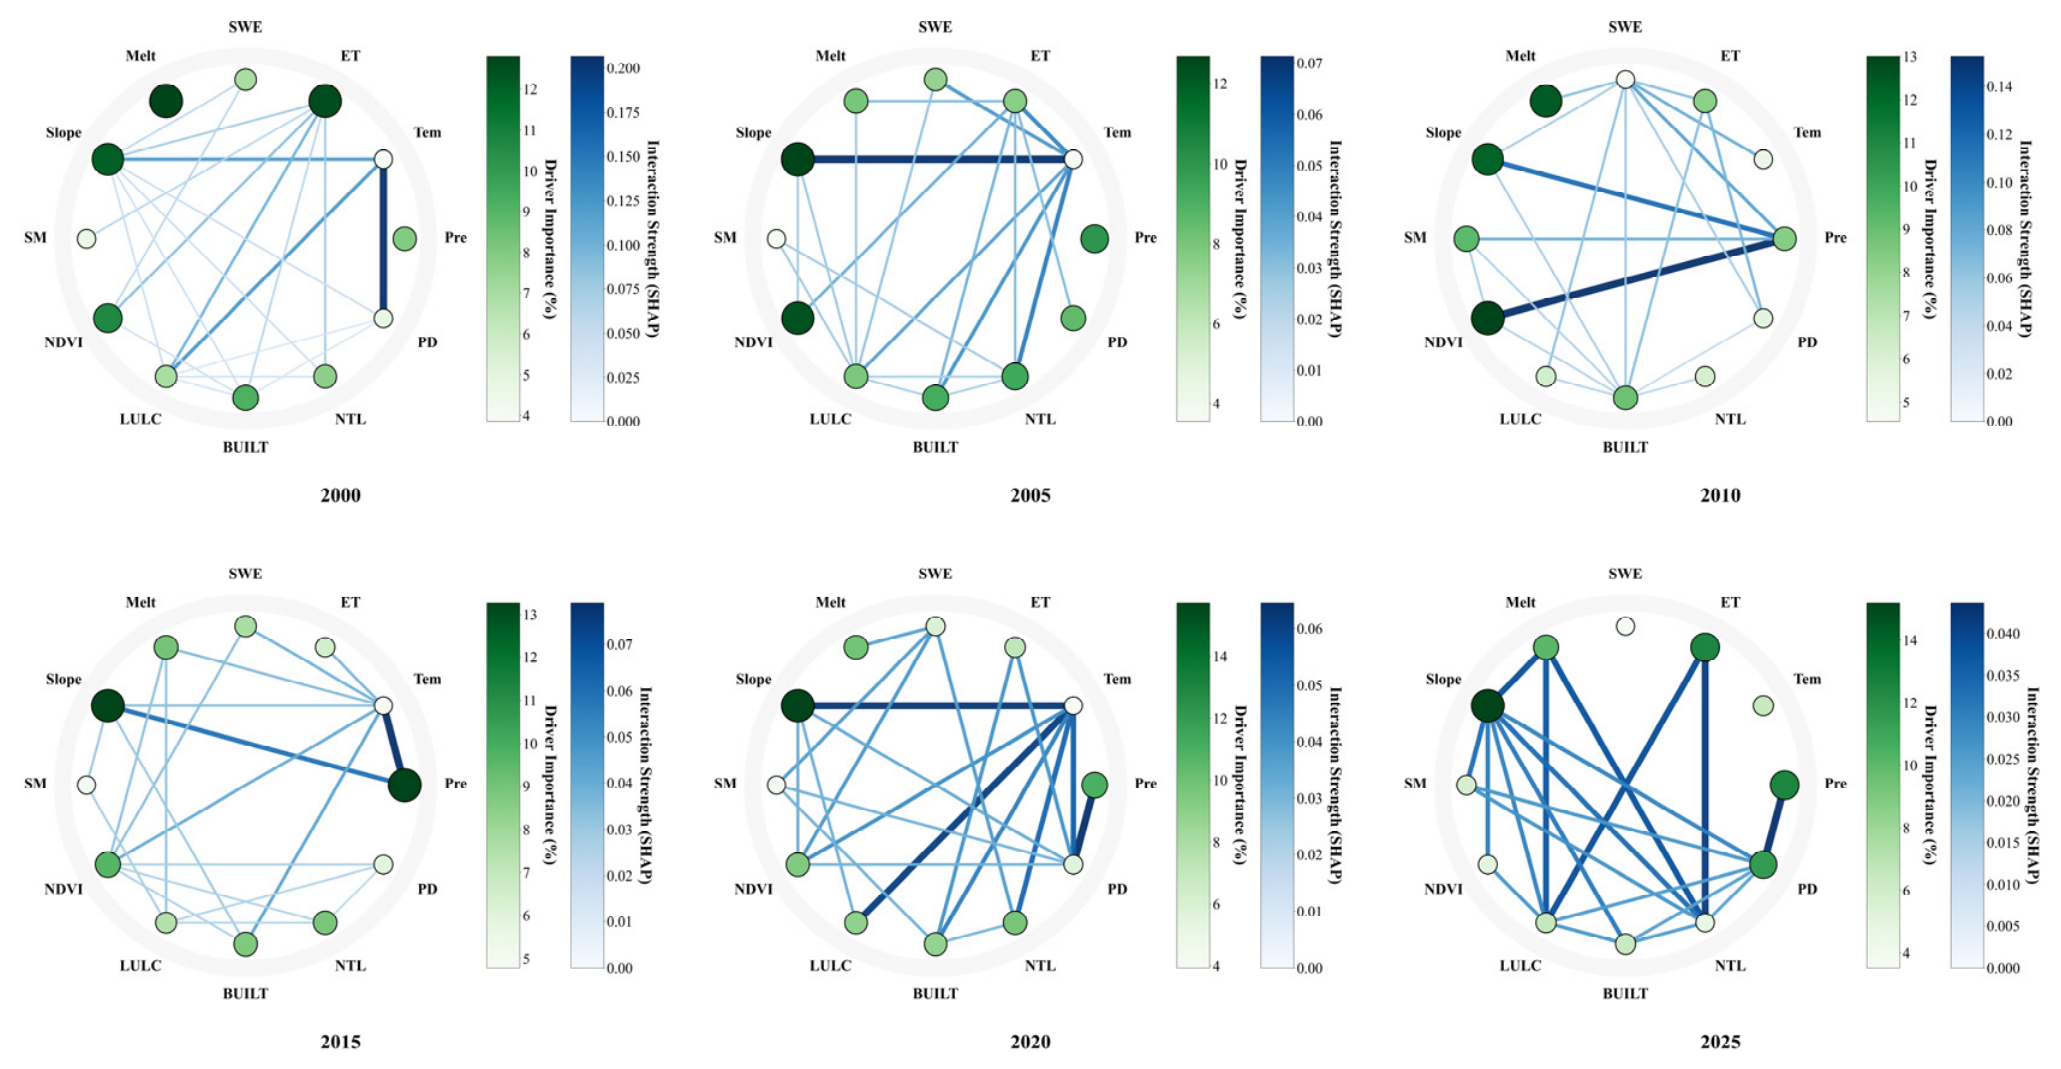
Figure 6.
Turkestan Region multi-factor coupling mechanism network.
- Regional differentiation of driving factor importance
By comparing the mean importance rankings and temporal characteristics of the five dominant drivers in the three study areas (Table 2), significant regional differences in flood driving factors were identified. Specifically, the Almaty Region exhibits a clear topographic influence, with slope ranking first among all drivers and accounting for the highest mean importance (13.02%) during 2000–2025. Moreover, its contribution showed a highly significant increasing trend (p < 0.01), indicating an increasing role of topographic control in the regional flood driving system. Precipitation and NDVI ranked second and third, with mean importance values of 12.15% and 10.48%, respectively, although both exhibited decreasing tendencies over time, with the decline in NDVI being statistically significant (p < 0.05). In contrast, the Akmola Region exhibits mixed topographic–hydrological control, with slope ranking first in mean importance (15.67%) and soil moisture (SM) ranking second (11.93%). Notably, SM showed a highly significant decreasing trend in importance (p < 0.01), suggesting that the contribution of antecedent water-storage conditions to flood variability has changed substantially over the study period. Meanwhile, the remaining dominant drivers, including SWE, temperature, and NTL, showed fluctuating temporal patterns without statistically significant long-term trends.
The Turkestan Region exhibits a more complex hydroclimatic–socioeconomic driver structure. NTL ranked first in mean importance (13.22%), followed by snowmelt (12.89%) and temperature (11.75%), demonstrating the joint influence of socioeconomic and hydroclimatic factors on regional flood variability. Temperature and SWE both exhibited significant decreasing trends in importance (p < 0.05), whereas precipitation showed an increasing tendency without statistical significance, indicating that the relative contribution of different hydroclimatic processes has evolved over time. Overall, the high ranking of NTL in Turkestan indicates that socioeconomic conditions have become an important component of the regional flood driving system, although its long-term temporal trend was not statistically significant.
- B.
- Almaty Region: Steady-state network controlled by geological energy
Analysis of the coupling network in the Almaty Region (Figure 6) reveals that the driving mechanism in this region exhibits extremely high temporal stability. Slope is not only the most important node, but also the hub of the network topology. In the networks of 2000, 2015, and 2020, the slope–Pre connection was consistently the thickest in the entire network. This interaction pattern is consistent with an orographic rainfall-related flood mechanism, where steep terrain may enhance runoff concentration and modify precipitation–runoff relationships. Although Tem and ET (evapotranspiration) play a certain moderating role in the network, they do not altered the core coupling axis of “topography–precipitation”. This structure suggests that the flood risk in the Almaty Region depends primarily on the spatial overlap between the rainfall center and the steep terrain, and is relatively less sensitive to climate fluctuations.
- C.
- Akmola Region: Soil hydrological memory and runoff threshold effect
The coupling network in the Akmola Region (Figure 7) further confirms the dominance of the “saturation runoff” mechanism. In most years, SM (soil moisture) acts as a central node, maintaining a strong connection with slope. This indicates that in the northern plains/hilly areas, the runoff concentration effect of micro-topography is only significantly activated after the soil moisture reaches the saturation threshold. It is worth noting that a significant structural change occurred in the network structure in 2010: Pre (precipitation) suddenly became the absolute core node and formed a strong interactive connection with PD (population density). This anomaly corresponds to the extreme rainstorm event that occurred that year, proving that under extreme weather conditions, high-intensity instantaneous precipitation can exceed the buffering capacity of the soil and directly form disastrous runoff. Overall, flooding in the region is controlled by the long-term cumulative effect of SM (hydrological memory), rather than by a single instantaneous meteorological factor.
Figure 7.
Accuracy verification scatter plot.
- D.
- Turkestan Region: Transition from thermal-driven to socio-hydrological composite-driven
The coupling network in the Turkestan Region (Figure 8) reveals the most dramatic mechanistic remodeling process in the three study areas. In the early stages of the study (2000–2005), the network topology exhibited a single natural hydrological driving pattern. The strong dark line between Tem and Melt confirmed its typical seasonal thermal characteristics, namely that floods were mainly controlled by the snow melting process caused by the rapid warming in early spring. During the transition period from 2010 to 2020, the driving network underwent structural and qualitative changes. The significant increase in the importance of NTL nodes signifies a leap in the weight of socioeconomic factors. In particular, in 2020, the high-intensity triangular interaction structure formed by NTL, Pre, and SM profoundly revealed the “ exposure-driven effect” of flood risk. This shift is primarily attributed to the rapid urbanization in the Syr Darya basin, which has led to a high degree of overlap between human activity areas and high-risk flood zones, thereby significantly enhancing the explanatory power of social factors in the causes of disasters. The prediction network for 2025 exhibits multiple strong interaction characteristics for Pre-SM-ET, indicating that the driving mechanism of the region will evolve into a mixed mode of superposition of “extreme precipitation” and “pre-soil saturation” in the future, and the vulnerability of the regional system will continue to exist under the background of existing human activities.
Figure 8.
Scenario simulation prediction results (a represents the Almaty Region, b represents the Akmola Region, and c represents the Turkestan Region; number 1 represents the SSP2-4.5 scenario and 2 represents the SSP5-8.5 scenario).
3.3. Flood Scale Prediction Under Future Scenario
- Model accuracy verification and robustness assessment
Validation results based on historical flood observations (Figure 9) demonstrate that the improved XGBoost model achieves reliable predictive performance across different geographic units. The coefficients of determination (R2) for the Almaty Region, Akmola Region, and Turkestan Region were 0.8651, 0.9292, and 0.8150, respectively, indicating that the model effectively captured the nonlinear relationships between flood occurrence and its driving factors across diverse environmental settings, ranging from the northern plains to the southern arid zone. Furthermore, the model performance was further evaluated through cross-validation analysis to assess its generalization capability and reduce the potential risk of overfitting. These results confirm the suitability of the optimized XGBoost framework for reconstructing historical flood patterns and provide a reliable basis for applying the model to future flood scenario simulations under CMIP6 projections.
Figure 9.
Evolution trajectory of scenario risk (Almaty Region).
- B.
- Regional differentiation of future flood risk evolution trajectory
The scenario simulation-based predictions reveal significant spatial differentiation in the response of different geographical units in Kazakhstan to climate warming, presenting an overall polarized pattern of increased flood risk in the southeastern mountains and declining flood risk in the central and western plains (Figure 10).
Figure 10.
Evolution trajectory of scenario risk (Akmola Region).
- (1)
- Southeastern mountains (Almaty Region): Risk expansion driven by snowmelt
The scenario simulation-based predictions reveal significant spatial differentiation in the response of different geographical units in Kazakhstan to climate warming, presenting an overall polarized pattern of “increased risk in the southeastern mountains and drought and decline in the central and western plains.” As the only risk expansion area in this pattern, the Almaty Region in the southeastern mountains is projected to become a potential hotspot of future flood control pressure. In particular, under the SSP2-4.5 scenario, the maximum inundation area during the snowmelt season (February–April) shows a significant upward trend, with a growth rate of 10.8% (linear trend: +1.04 km2/yr). Its unique “humidifying” risk expansion is mainly attributed to the “topographic–thermal synergy” described in Section 3.2. The rising temperatures in the future will significantly accelerate the melting rate of high-altitude snow and ice resources, while the steep terrain of the region will allow the increased meltwater to rapidly converge into flood flows. This rapid confluence effect far exceeds the evaporation loss caused by the warming, resulting in a simultaneous expansion of the flood peak flow and the inundation area.
- (2)
- Northern steppes (Akmola Region): Significant aridification driven by evaporation
In stark contrast to the southeastern mountains, the Akmola Region in the northern steppes exhibits the most dramatic trend of hydrological decline, indicating that the region is undergoing a systemic shift from “seasonal flooding” to “hydrological drought.” The simulation results show that the scale of floods will decrease significantly during both the snowmelt season and the rainy season: under the SSP2-4.5 scenario, the flood area during the snowmelt season decreases by 8.1%, while under the extremely warm and dry SSP5-8.5 scenario, this decrease accelerates further to 23.2%. The significant decline is mainly controlled by the “evaporation–soil moisture feedback” mechanism. In water-limited grassland environments, the surge in potential evaporation (ET) caused by climate warming depletes soil moisture, forcing the soil into a state of chronic deficit. The dry soil layer acts as a huge buffer “sponge,” absorbing large amounts of snowmelt and precipitation, thereby effectively inhibiting the formation of surface runoff. This result confirms that in the northern plains, the evaporation effect of warming far outweighs the impact of precipitation changes, dominating the future aridification process.
- (3)
- Southern arid region (Turkestan Region): Mild recession due to resource depletion
The Turkestan region, located in the arid southern region, presents an intermediate state between the severe drought in the north and the increased humidity in the east, exhibiting a moderate downward trend due to resource constraints. Under the SSP2-4.5 scenario, the scale of floods during the snowmelt season in this region shows a moderate decrease of 6.0% (linear trend: −0.55 km2/yr), and a similar reduction is observed during the rainy season. This trend profoundly reflects the “snowmelt source depletion effect” unique to arid regions. Unlike the north, where floods are controlled by soil moisture thresholds, floods in the south depend directly on seasonal snow reserves (water supply). Rising temperatures lead to a decrease in snowfall and prevent effective accumulation of snow at low altitudes, resulting in a reduction in the natural supply of total runoff. Although the “exposure effect” caused by human activities was pointed out in the previous section (Section 3.2), the long-term reduction in total natural runoff has dominated the trend, which has made the overall flood risk more moderate. However, this also warns of the potential crisis of water shortage in the region in the future.
3.4. Future Flood Risk Evolution and System Coordination Analysis
Based on an integrated assessment model using the flood risk index (FRI) and coupling coordination degree (CCD), this study plotted the risk evolution trajectory of the three study areas under different climate scenarios from 2026 to 2100 (Figure 9, Figure 10 and Figure 11). The results show that although the trends in the scale of natural floods vary greatly across regions, the overall flood risk level in all regions will significantly increase against the backdrop of rapid socio-economic development.
Figure 11.
Evolution trajectory of scenario risk (Turkestan Region).
- Almaty Region: Risk resonance driven by the synergistic effect of “Disaster-Causing Factors and Exposure”
The risk evolution trajectory of the Almaty Region is characterized by the superposition of natural disasters and social vulnerability, making it an “the highest-risk region” for future regional flood control security. As shown in Figure 9, the FRI in this region exhibits the steepest upward slope across the entire area. In particular, under the SSP5-8.5 high emission scenario, the FRI is expected to break through the critical threshold of 0.75 around 2085, officially entering the severe risk zone. The explosive growth of risks in Almaty is essentially due to the “risk resonance” effect of “hazard exposure”. On the one hand, as confirmed in Section 3.2, the region faces a natural threat of a significant increase (+10.8%) in snowmelt floods; on the other hand, CCD (shown as a dashed line in the figure) is steadily rising, reflecting the continued expansion of the region’s urbanization level and economic size. When the ever-expanding stock of urban assets encounters the increasing frequency of extreme floods, the two produce a strong synergistic amplification effect, ultimately leading to an exponential increase in systemic risk.
- B.
- Akmola and Turkestan regions: The Risk paradox under “Exposure Dominance”
The assessment results for the Akmola and Turkestan regions reveal a profound “risk paradox”: although the flood magnitude in these two regions is predicted to decrease significantly (−6.0% to −23.2%) due to climate aridification as mentioned above (Section 3.3), their FRI is rising against the trend, and will even approach the “severe risk” level by the end of the 21st century (Figure 10 and Figure 11). This paradox is particularly evident in Akmola, where the risk curve and CCD curve exhibit a high degree of synchronicity. This indicates that in the northern plains, with the rapid expansion of the capital region (Astana and its surrounding areas), the growth rate of socioeconomic exposure has far exceeded the decline rate of natural disaster-causing factors; in this context, even small- to medium-sized flood events, once projected onto a highly dense asset network, can transform into huge disaster loss risks, establishing an “exposure-driven” risk growth pattern. Turkestan Oblast exhibited the strongest risk volatility, with the risk level under the SSP5-8.5 high-emission scenario being significantly higher than that under the SSP2-4.5 scenario. This phenomenon further confirms the assertion in Section 3.2 regarding the “NTL” driving mechanism, namely that the excessive concentration of human activities in riverside oases has artificially created high-risk areas. In this context, the relative importance of socioeconomic exposure in determining future flood risk has increased, gradually shifting from a “natural attribute” simply controlled by hydrological fluctuations to a “social attribute” defined by the intensity of human activities.
- C.
- Scenario differences and safe operating space
By comparing the two pathways, SSP2-4.5 (medium emissions) and SSP5-8.5 (high emissions) (Figure 9, Figure 10 and Figure 11), it can be clearly observed that climate mitigation policies have significant marginal benefits in terms of risk control. First, from the perspective of the time dimension of the critical point, all three study areas show a consistent early onset characteristic: the risk curve under the SSP5-8.5 scenario reaches the “hazard level (FRI > 0.5)” time point 10–15 years earlier than under the SSP2-4.5 scenario, which means that the high emission path will significantly compress the time window for social systems to make adaptive adjustments. Looking ahead to the final state at the end of the 21st century, the risk index under the SSP2-4.5 scenario mostly remains in the “dangerous” range, while under the SSP5-8.5 scenario, it generally climbed and locked into the “severe” range. This striking scenario differentiation profoundly demonstrates that, without proactive external emission reduction and climate adaptation measures, simply relying on improved regional system coordination (CCD) is insufficient to offset the risk of systemic collapse caused by extreme weather events under high-emission scenarios.
4. Discussion
4.1. Representative Examples of Typical Natural Geographical Gradients
This study selected three research areas—the Akmola Region, Almaty Region, and Turkestan Region—and constructed a representative natural geographical gradient framework along a southeast–north–south transect, profoundly reflecting the interactive characteristics of “latitudinal zonation” and “vertical zonation” in Central Asia [57]. The Almaty Region serves as representative example of vertical zonation of the arid zone’s “water tower” system. Its “topographic–thermal synergy” mechanism precisely characterizes the snowmelt lag effect prevalent in high-altitude areas, and foreshadows the complex future flood risks that the “Asian Water Tower” may face under future climate warming [58]. As a typical example of a high-latitude plain system, the Akmola Region reveals the unique runoff mechanisms of low-relief geomorphic systems through its “hydrological memory” effect and “geomorphic retention” mechanism. Specifically, flood occurrence depends on the previous soil saturation threshold and the water-blocking effect of permafrost. This has universal value for understanding snowmelt floods on the southern edge of the West Siberian Plain. The Turkestan Region represents the typical human–environment coupling paradigm observed in arid oasis systems. Its transformation from a mechanism driven by “ temperature forcing” to one dominated by “socioeconomic exposure” essentially reflects the “risk paradox” between water scarcity in arid regions and the aggregation of riverine oases, a phenomenon highly common in the inland river regions of Central Asia [59]. In summary, these three geographical units, through the combination of “plains–mountains–oasis”, fully cover the hydrometeorological gradient from a heat-limited type (snowmelt in the north) to water-limited type (drought in the south), as well as the disaster evolution gradient from natural-dominated systems to human activity-dominated systems. This study, as a study on a representative microcosm of the Central Asian arid system, not only clarifies the heterogeneity of floods within Kazakhstan, but also provides a predictable scientific paradigm for understanding the water security pattern in the broader Central Asian arid region under climate change.
4.2. Spatiotemporal Heterogeneity of Flood Driving Mechanisms and Their Explanation
This study, based on the SHAP framework, reveals significant spatial differentiation in the flood drivers of Kazakhstan, namely, “topographic–thermal synergy” in the southeastern mountains, “hydrological memory” in the northern steppes, and “social exposure dominance” in the southern arid region. This finding confirms that in the complex geographical environment of Central Asia, a single flood-generation model is insufficient, and the heterogeneity of watershed characteristics must be considered. The Almaty Region (southeastern mountains) exhibits steady-state topographic control characteristics, consistent with the research findings of Ta et al. on the spatiotemporal patterns of wet–dry patterns in Central Asia, indicating that high-altitude topography plays a crucial role in the interception and redistribution of moisture [46]. The region’s sensitivity to temperature also confirms Kim et al.’s view that global warming will significantly alter the hydrological processes in snowmelt-fed watersheds [45]. Flooding in the Akmola Region (northern steppe) is highly dependent on antecedent soil moisture (SM), exhibiting a significant “hydrological memory” effect. Chernykh et al. also found a similar pattern in their study in eastern Kazakhstan, indicating that soil texture and antecedent moisture content are key thresholds determining whether precipitation can be converted into runoff [44]. In flat grassland areas, infiltration-excess or saturation-excess runoff mechanisms are only activated when the soil moisture content reaches the saturation threshold. This explains why the contribution of SM in the SHAP results of this region has remained high for a long time. The shift of the driving mechanism towards social factors (NTL) in the Turkestan Region (southern arid region) profoundly reflects the alterations to the water cycle in arid areas by human activities. Wang et al. pointed out that the water crisis in Central Asia is being increasingly driven by population growth and urbanization, rather than just climate change [47]. In the Syr Darya basin, changes in agricultural irrigation methods (such as shifting from flood irrigation to drip irrigation) also significantly affect evapotranspiration and groundwater recharge [48], thereby altering the underlying surface conditions for flood occurrence. The increase in the NTL weight in this study essentially quantifies the coupling effect of the natural–social coupled water cycle.
4.3. “Dry–Wet Differentiation” and Nonlinear Response Under the Background of Global Warming
The CMIP6 scenario simulations show that the scale of future floods will exhibit a polarized pattern of “increased humidity and danger in the southeast, and increased drought in the northwest.” This result corrects the traditional linear inference that “warming means wetter,” revealing the nonlinear consequences of the interaction between evaporation and precipitation. The physical mechanism underlying the predicted significant hydrological decline in the Akmola Region can be explained by a mechanism related to the “evaporation paradox”. Although Huang et al. predicted an increase in extreme precipitation in Central Asia based on the CMIP6 model [60], in the semi-arid northern steppe, the rate of increase in potential evapotranspiration (PET) driven by warming far exceeded the rate of increase in precipitation. Scheff and Frierson’s research indicates that the increase in PET caused by the greenhouse effect is widespread and significant on land [61]. When the increase in PET depletes soil moisture and disrupts the saturation conditions required for runoff production, the “warming–drying” phenomenon will occur. This trend also aligns with Cong et al.’s discussion on the relationship between evaporation and precipitation, namely that under specific water supply constraints, increased evaporation capacity will dominate the hydrological balance. The increase in flooding in the Almaty Region is consistent with the “peak water” theory. Under the SSP2-4.5 scenario, rising temperatures accelerate the production of snow and ice meltwater, leading to increased runoff. Under the SSP5-8.5 scenario, the rate of increase slows down, suggesting a depletion effect of snow reserves. This temperature-dominated nonlinear response was foreshadowed in Brutsaert and Parlange’s early theory of terrestrial evaporation, in which the intensification of the hydrological cycle manifests as a dual increase in evaporation and runoff in humid (or snow-covered) regions [62]. Furthermore, Bai et al.’s research on rapid shifts between drought and flood suggests that the volatility of such extreme hydrological events may become more pronounced in transitional zones (such as the Turkestan Region) [63].
4.4. A Paradigm Shift from Disaster-Causing Factor-Driven to Exposure-Driven
This study, through empirical analysis, reveals a significant “risk paradox” between the Akmola Region and Turkestan Region, a finding that explains the phenomenon of a continuously rising comprehensive risk index against the backdrop of reduced predictions of natural flood magnitude in the region. This phenomenon strongly demonstrates that the driving force of flood risk is shifting from being dominated by natural hazard drivers to being dominated by social exposure. This finding aligns closely with the “paradox of secure development” proposed by Haer et al. They point out that improved flood control measures often mislead the public, attracting more population and assets to floodplains, thereby increasing potential disaster losses over the long term [57]. Devitt et al.’s global analysis also confirms this trend, namely that human settlements tend to expand in flood-prone areas, and this expansion pattern is particularly pronounced in developing regions [58]. In this study, the strong synchronicity between the risk curve and CCD in the Akmola Region directly quantifies the contribution of population growth to risk. Shu et al.’s study on the coupling of climate change and population projections indicates that future risk assessments will be severely underestimated if flood exposure is not incorporated into population planning [64]. In addition, Kaźmierczak and Cavan highlighted the amplifying effect of urban surface features (such as impermeable surfaces) on flood vulnerability [65], which explains why the Nighttime Light Index (representing urbanization) in the Turkestan Region became a key explanatory variable for risk. This complex contradiction involving “humans, water, and land” indicates that simple engineering-based disaster mitigation is insufficient to address future systemic risks. As demonstrated by Qin et al. through their human–land coupled system model, understanding the two-way feedback between human activities (such as adaptive behavior and land-use decisions) and flood dynamics is key to developing effective disaster mitigation strategies [59]. Mazzorana et al. also called for the introduction of a dynamic perspective into flood risk assessment, focusing on the evolution of social systems over time [66].
4.5. Uncertainty and Limitations
While this study provides new insights into regional flood evolution, several uncertainties associated with data sources, model representation, and future climate projections should be acknowledged. First, the integration of multisource datasets with different spatial resolutions may introduce uncertainties during spatial harmonization. Although all variables were resampled to a unified 30 m resolution to facilitate pixel-based analysis, coarse-resolution datasets such as climate simulations and socioeconomic indicators may not fully represent local-scale heterogeneity. Therefore, the derived spatial patterns should be interpreted as regional-scale characteristics rather than exact representations of fine-scale flood processes. Second, uncertainties remain in the future climate projections. Although the Delta method can effectively correct the mean bias of temperature and precipitation simulations, it cannot fully reproduce changes in precipitation variability and extreme events. This limitation is particularly important for flood assessment because extreme precipitation events often control the magnitude of severe floods. Therefore, the future flood projections should be interpreted as scenario-based estimates rather than deterministic predictions [60]. Third, although the XGBoost model demonstrated satisfactory overall performance, uncertainties may exist in representing rare extreme flood events. Extreme floods usually have limited observational samples compared with moderate inundation events, which may lead to insufficient representation of tail distributions during model training and consequently cause underestimation of extreme values. Future studies incorporating more extreme-event samples, hydrological simulations, and ensemble machine learning approaches may further improve the representation of flood extremes. Fourth, uncertainties may also originate from satellite-derived flood inundation observations. Sentinel-1 SAR-based flood mapping can be affected by speckle noise, terrain distortion, vegetation conditions, and mixed pixels, particularly in mountainous and heterogeneous landscapes. Although preprocessing and validation procedures were applied, these factors may influence the accuracy of historical flood inventories and subsequently affect model training. Fifth, in the setting of the socioeconomic scenarios (SSPs), the socioeconomic scenarios mainly represent regional-scale development pathways and may not fully capture local adaptive responses, such as migration patterns, land-use regulations, and flood management strategies. In addition, utilizing administrative perimeters inherently introduces spatial boundary constraints, which may artificially dissect continuous fluvial processes and generate localized clipping effects in transboundary river networks [43]. To reduce these uncertainties, future research could integrate the CHANS framework proposed by Qin et al. and develop agent-based models incorporating human adaptive behavior to better capture the feedback between socioeconomic dynamics and flood processes. Future research could draw on the CHANS framework of Qin et al. [59] to construct various agent-based models that include human adaptive behavior in order to more accurately capture the micro-scale feedback mechanisms under the “risk paradox”.
5. Conclusions
This study systematically evaluated the spatiotemporal evolution of flood driving mechanisms and future flood risk trajectories across three representative regions of Kazakhstan using an optimized XGBoost–SHAP framework and multisource geospatial data from 2000 to 2025. Historical flood observations revealed substantial regional differences in the evolution of flood-affected areas, reflecting the combined influences of hydroclimatic conditions, topography, and human activities. Model validation demonstrated satisfactory predictive performance, supporting the reliability of the framework for analyzing regional flood driving mechanisms and future scenario-based projections.
Findings indicate that flood driving mechanisms are strongly shaped by geographical background, while human activities influence their evolution. Three regional patterns were identified: (1) a steady-state topographic control paradigm in the Almaty Region; (2) a threshold-sensitive hydrological memory paradigm in Akmola; and (3) an anthropogenic exposure-dominated paradigm in the Turkestan Region. The temporal evolution of the five dominant drivers further indicates that these mechanisms are not static but change over time under the combined influences of hydroclimatic variability and human activities. Future projections reveal a clear mountain–plain differentiation. The flood extent in the Almaty Region is projected to increase by 10.8% under SSP2-4.5, which is associated with enhanced mountain hydroclimatic processes, whereas the Akmola Region is projected to experience a 23.2% reduction under SSP5-8.5, reflecting changes in evaporation–soil moisture interactions. These contrasting trajectories contribute to a general pattern of “risk divergence” in which socioeconomic exposure increasingly influences regional flood risk relative to changes in physical hazards. Notably, urbanization in plains creates a “risk paradox” by masking declining runoff, while mountainous areas experience compounded risk due to the simultaneous intensification of hazards and expansion of exposure.
Nevertheless, future projections should be interpreted as scenario-based estimates rather than deterministic predictions because uncertainties remain in climate projections, bias corrections, the representation of rare extreme flood events, multisource data integration, and future socioeconomic assumptions.
Consequently, disaster mitigation should follow a differentiated “driver–response” principle. For the Almaty Region, priority should be given to engineering-based measures such as hydraulic infrastructure and glacial lake early-warning systems. For the Akmola Region and Turkestan Region, mitigation should focus on spatial planning and land-use regulation to limit population and industrial concentration in floodplains, particularly in riverside oases. More broadly, this study provides a transferable framework for understanding flood-risk transitions in arid regions under climate change.
Author Contributions
W.L.: Methodology, Data Curation, Formal Analysis, Visualization, Writing—Original Draft. A.S.: Conceptualization, Investigation, Validation, Resources, Supervision, Project Administration, Funding Acquisition. Y.L.: Data Curation, Validation. J.A.: Supervision, Writing—Review and Editing. D.S.: Investigation, Validation. All authors have read and agreed to the published version of the manuscript.
Funding
This work was supported by Chinese Academy of Sciences Overseas Science and Education Cooperation Center Project (No. 1117007001) and the Regional Collaborative Innovation Special Program of Xinjiang Uygur Autonomous Region—the Shanghai Cooperation Organization (SCO) Science and Technology Partnership Program (No. 2025E01042).
Data Availability Statement
Please add the corresponding content of this part.
Conflicts of Interest
The authors declare no conflicts of interest.
Appendix A
Figure A1.
Spatiotemporal evolution of flood inundation range in Almaty (column 1), Akmola (column 2) and Turkestan (column 3) states.
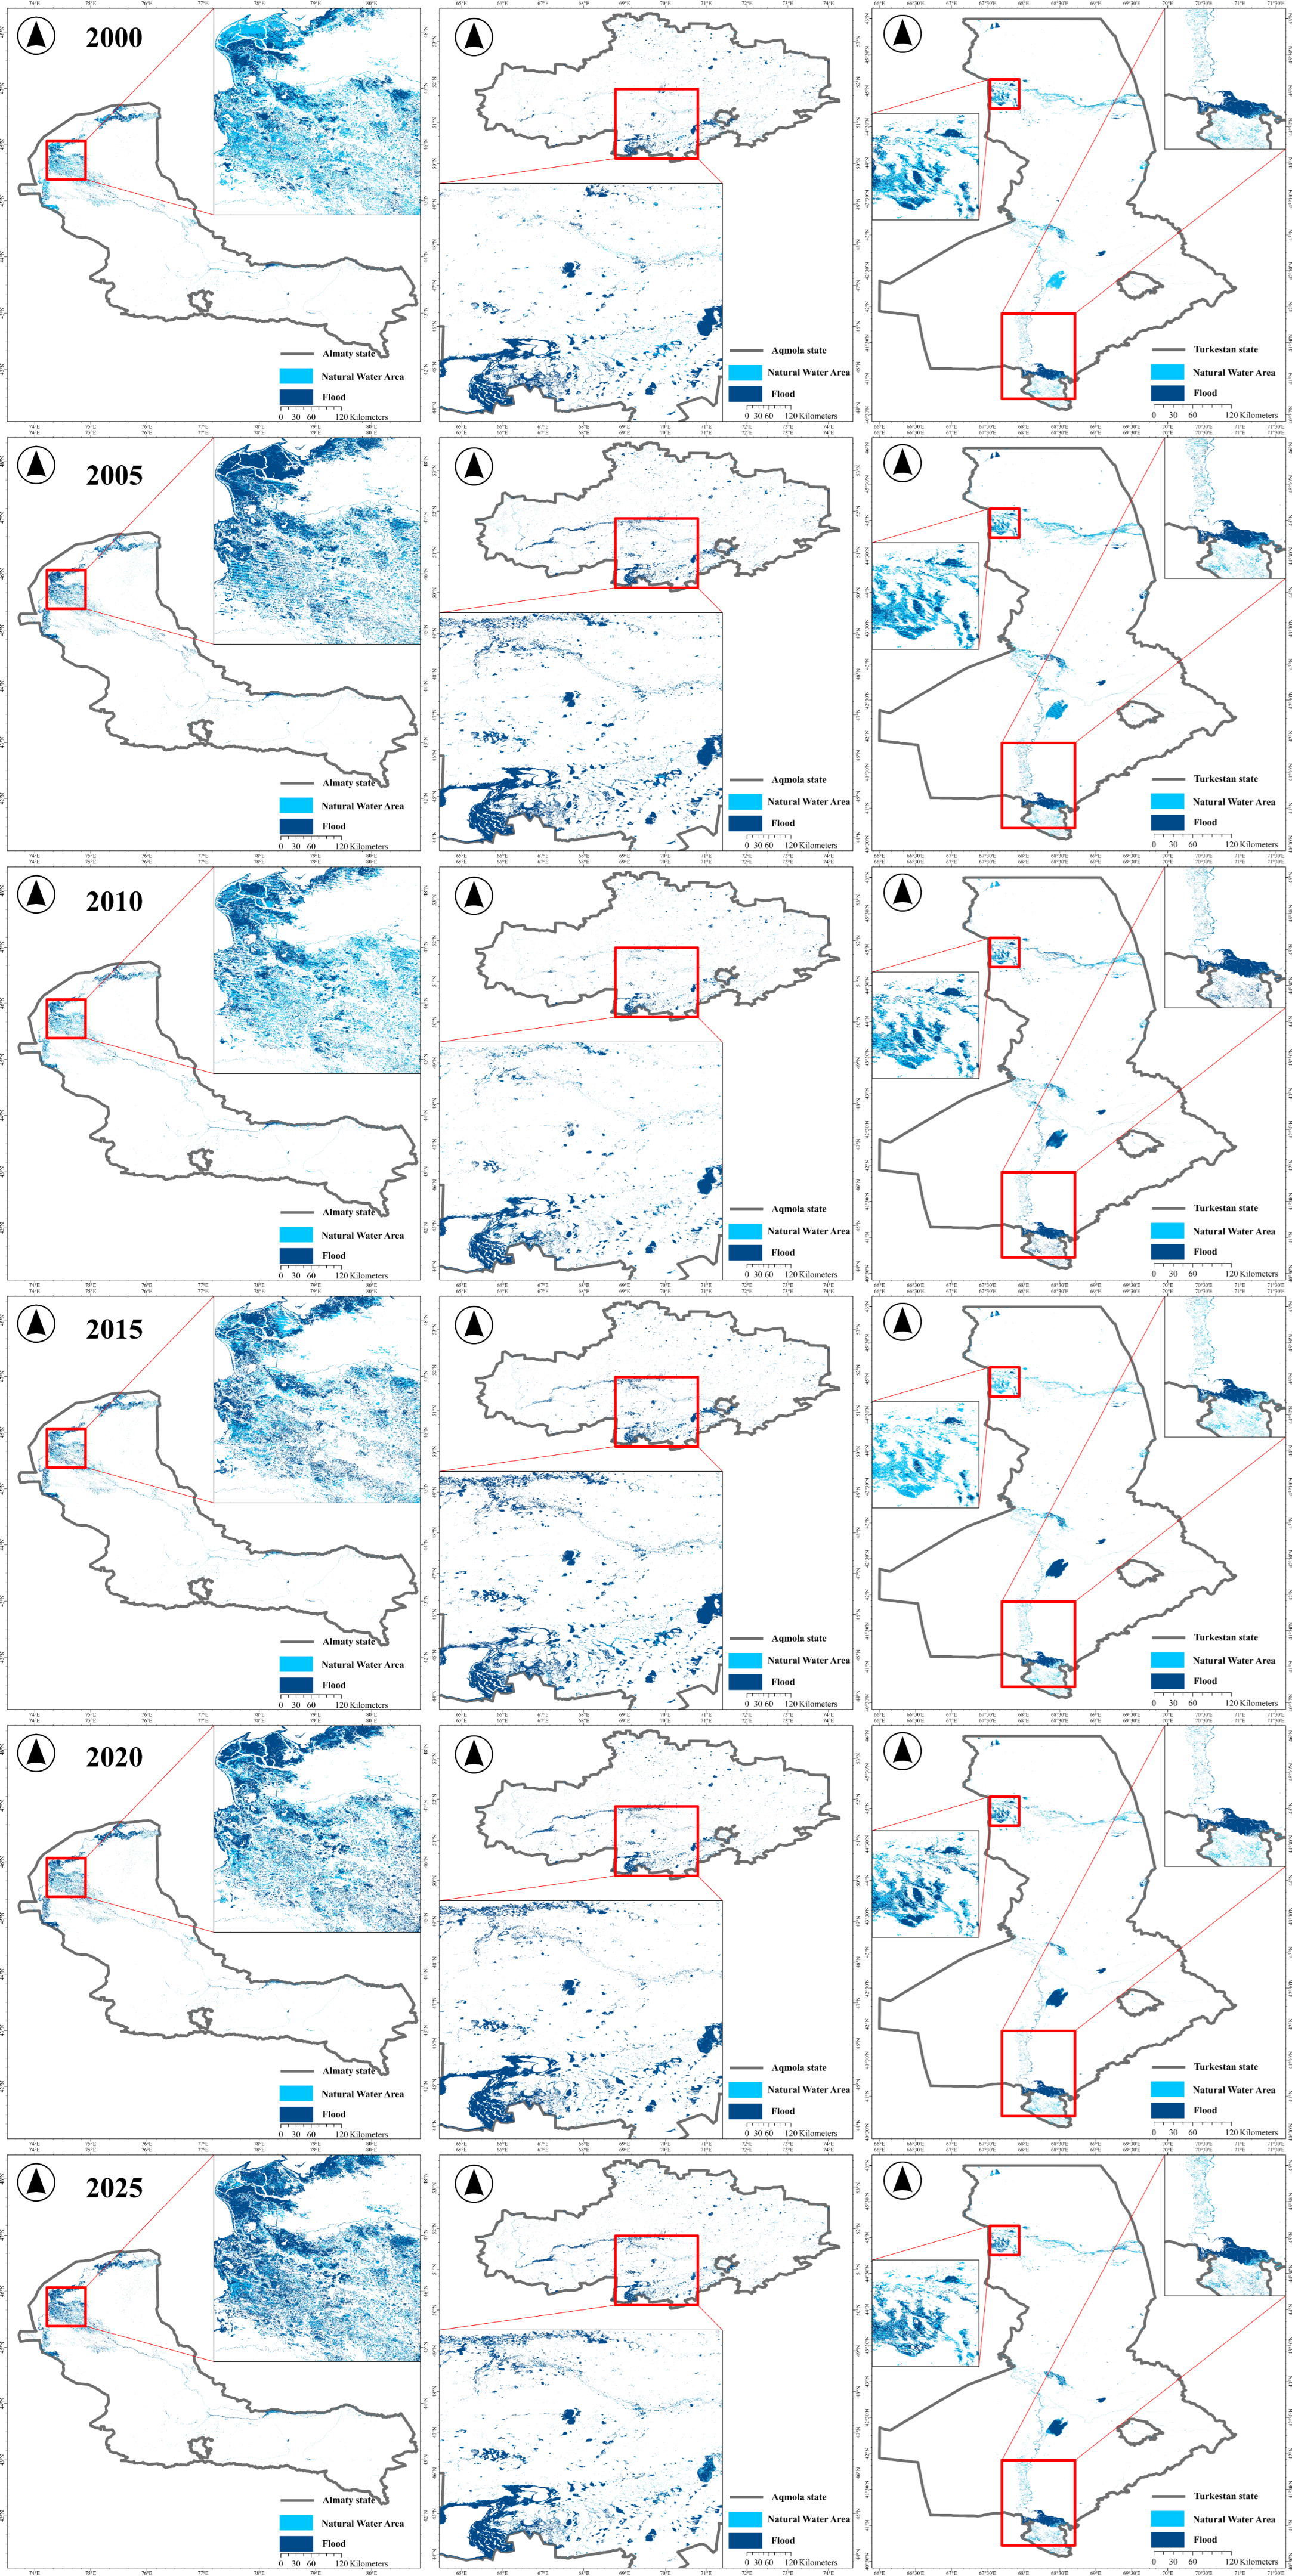
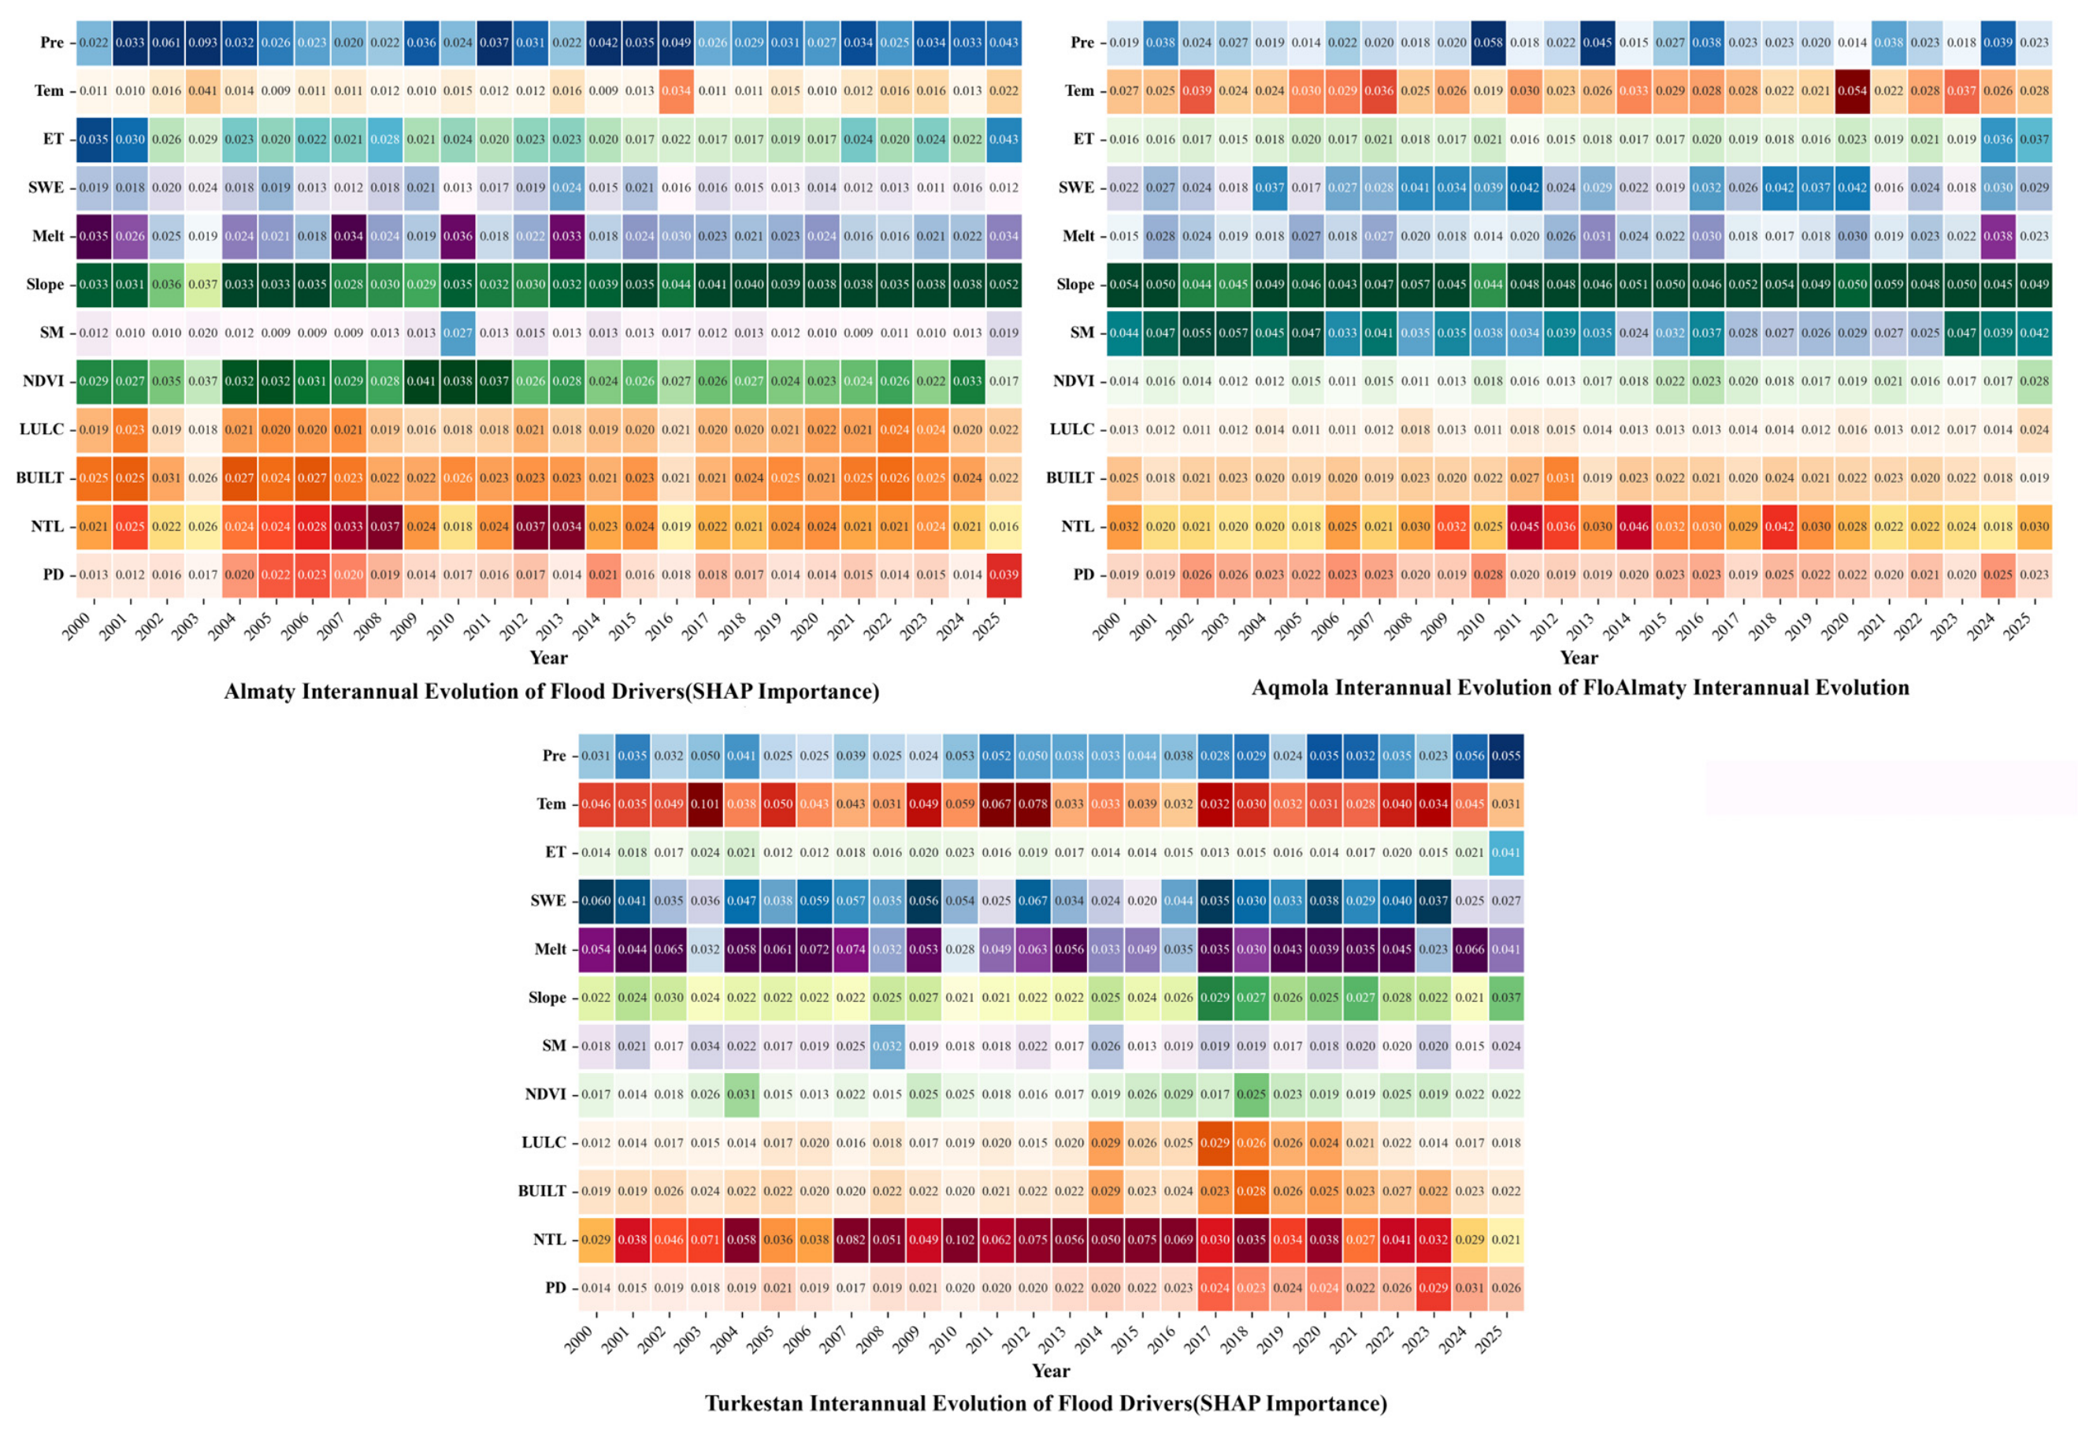
Figure A2.
Spatiotemporal evolution of normalized annual SHAP importance of flood driving factors.
References
- Zhang, W.; Li, L.; Zhou, T.; Brody, M.; He, Q.; Xu, M.; Madibekov, A. Central Asian Compound Flooding in 2024 Contributed by Climate Warming and Interannual Variability. Adv. Atmos. Sci. 2025, 42, 2195–2202. [Google Scholar] [CrossRef] [Scilit]
- Tabari, H. Climate change impact on flood and extreme precipitation increases with water availability. Sci. Rep. 2020, 10, 13768. [Google Scholar] [CrossRef] [Scilit]
- Najibi, N.; Devineni, N. Recent trends in the frequency and duration of global floods. Earth Syst. Dynam. 2018, 9, 757–783. [Google Scholar] [CrossRef] [Scilit]
- Yukiko Hirabayashi, R.M.; Koirala, S.; Konoshima, L.; Yamazaki, D.; Kim, H.; Kanae, S. Global flood risk under climate change. Nat. Clim. Change 2013, 3, 816–821. [Google Scholar] [CrossRef] [Scilit]
- Wahl, T.; Jain, S.; Bender, J.; Meyers, S.D.; Luther, M.E. Increasing risk of compound flooding from storm surge and rainfall for major US cities. Nat. Clim. Change 2015, 5, 1093–1097. [Google Scholar] [CrossRef] [Scilit]
- Jiang, S.; Tarasova, L.; Yu, G.; Zscheischler, J. Compounding effects in flood drivers challenge estimates of extreme river floods. Sci. Adv. 2024, 10, eadl4005. [Google Scholar] [CrossRef] [Scilit]
- Swain, D.L.; Wing, O.E.J.; Bates, P.D.; Done, J.M.; Johnson, K.A.; Cameron, D.R. Increased Flood Exposure Due to Climate Change and Population Growth in the United States. Earth’s Future 2020, 8, e2020EF001778. [Google Scholar] [CrossRef] [Scilit]
- Liu, Q.; Du, M.; Wang, Y.; Deng, J.; Yan, W.; Qin, C.; Liu, M.; Liu, J. Global, regional and national trends and impacts of natural floods, 1990–2022. Bull. World Health Organ. 2024, 102, 410–420. [Google Scholar] [CrossRef] [Scilit]
- Jonkman, S.N.; Vrijling, J.K. Loss of life due to floods. J. Flood Risk Manag. 2008, 1, 43–56. [Google Scholar] [CrossRef] [Scilit]
- Issakov, Y.; Sarkytkan, K.; Gajić, T.; Akhmetova, A.; Berdygulova, G.; Zhoya, K.; Razia, T.; Matigulla, B. Climate-Induced Transboundary Water Insecurity in Central Asia: Institutional Challenges, Adaptation Responses, and Future Research Directions. Water 2025, 17, 1795. [Google Scholar] [CrossRef] [Scilit]
- Sun, K.; Yang, P.; Xia, J.; Huang, H.; Chen, Y.; Zhu, Y.; Wang, C.; Yao, P.; Chen, L.; Song, J.; et al. Spatiotemporal correlations and driving factors of multiple drought in Central Asia. Atmos. Res. 2025, 324, 108199. [Google Scholar] [CrossRef] [Scilit]
- Grokhotov, Y.; Toguzova, M.M.; Assylkhanova, Z.A.; Kapasov, A.K. Use of Remote Sensing Data for the Rational Use of Precipitation and Meltwater in the East Kazakhstan Region. Int. Arch. Photogramm. Remote Sens. Spat. Inf. Sci. 2025, 48, 29–34. [Google Scholar] [CrossRef] [Scilit]
- Chlachula, J. Geoheritage of East Kazakhstan. Geoheritage 2020, 12, 91. [Google Scholar] [CrossRef] [Scilit]
- Liu, Y.; Samat, A.; Du, P.; Chen, J.; Abuduwaili, J.; Luo, K.; Zhu, E.; Shokparova, D. High-resolution spatiotemporal analysis and driver attribution of floods in Kazakhstan using SHAP and remote sensing integration. Clim. Risk Manag. 2025, 51, 100783. [Google Scholar] [CrossRef] [Scilit]
- Nurbatsina, A.; Salavatova, Z.; Tursunova, A.; Didovets, I.; Huthoff, F.; Rodrigo-Clavero, M.-E.; Rodrigo-Ilarri, J. Flood Modelling of the Zhabay River Basin Under Climate Change Conditions. Hydrology 2025, 12, 35. [Google Scholar] [CrossRef] [Scilit]
- Kalashnikova, O.Y.; Radchenko, I.; Kretova, Z. Mudflow and Flood Hazard Risk Evaluation in Kyrgyzstan Using Hydrological Modeling and CMIP6 Models. Earth Syst. Environ. 2025, 10, 2463–2490. [Google Scholar] [CrossRef] [Scilit]
- Chepashev, D.; Nurakynov, S.; Sharma, D.; Sydyk, N.; Kabdulova, G. Mapping fire hazard potential in Kazakhstan: A machine learning and remote sensing perspective. Int. J. Wildland Fire 2025, 34, WF24232. [Google Scholar] [CrossRef] [Scilit]
- Cao, D.; Wen, S. Dynamic Change and Attribution Regarding Fractional Vegetation Coverage in Mengdong River Basin. Forests 2024, 15, 746. [Google Scholar] [CrossRef] [Scilit]
- Ceresa, P.; Bussi, G.; Denaro, S.; Coccia, G.; Bazzurro, P.; Martina, M.; Fagà, E.; Avelar, C.; Ordaz, M.; Huerta, B.; et al. Large-scale flood risk assessment in data-scarce areas: An application to Central Asia. Nat. Hazards Earth Syst. Sci. 2025, 25, 403–428. [Google Scholar] [CrossRef] [Scilit]
- Yuan, J.; Chen, J.; Sciusco, P.; Kolluru, V.; Saraf, S.; John, R.; Ochirbat, B. Land Use Hotspots of the Two Largest Landlocked Countries: Kazakhstan and Mongolia. Remote Sens. 2022, 14, 1805. [Google Scholar] [CrossRef] [Scilit]
- Amos, H.M.; Skaff, N.K.; Uz, S.S.; Policelli, F.S.; Slayback, D.; Macorps, E.; Jo, M.J.; Patel, K.; Keller, C.A.; Abue, P.; et al. Public Health Data Applications Using the CDC Tracking Network: Augmenting Environmental Hazard Information With Lower-Latency NASA Data. Geohealth 2023, 7, e2023GH000971. [Google Scholar] [CrossRef] [Scilit]
- Zhang, Y.; Li, Z.; Xu, H.; Ge, W.; Qian, H.; Li, J.; Sun, H.; Zhang, H.; Jiao, Y. Impact of floods on the environment: A review of indicators, influencing factors, and evaluation methods. Sci. Total Environ. 2024, 951, 175683. [Google Scholar] [CrossRef] [Scilit]
- Kieval, M.; Miravalle, G. The diverging nuclear histories and futures of Kazakhstan and Uzbekistan. Renew. Sustain. Energy 2025, 3, 4. [Google Scholar] [CrossRef] [Scilit]
- Shahzad, U.; Miao, C. Assessing the impact of digitalization, geography, and digital mobility on air pollution in Europe & Central Asia: A climate change perspective. Sci. Total Environ. 2025, 1001, 180507. [Google Scholar] [CrossRef] [Scilit]
- Aloui, S.; Zghibi, A.; Mazzoni, A.; Elomri, A.; Al-Ansari, T. Identifying suitable zones for integrated aquifer recharge and flood control in arid Qatar using GIS-based multi-criteria decision-making. Groundw. Sustain. Dev. 2024, 25, 101137. [Google Scholar] [CrossRef] [Scilit]
- Kim, J.; Kang, J. Development of hazard capacity factor design model for net-zero: Evaluation of the flood adaptation effects considering green—gray infrastructure interaction. Sustain. Cities Soc. 2023, 96, 104625. [Google Scholar] [CrossRef] [Scilit]
- Rahman, M.T.; Aldosary, A.S.; Nahiduzzaman, K.M.; Reza, I. Vulnerability of flash flooding in Riyadh, Saudi Arabia. Nat. Hazards 2016, 84, 1807–1830. [Google Scholar] [CrossRef] [Scilit]
- Lubczynski, M.W.; Leblanc, M.; Batelaan, O. Remote sensing and hydrogeophysics give a new impetus to integrated hydrological models: A review. J. Hydrol. 2024, 633, 130901. [Google Scholar] [CrossRef] [Scilit]
- Olcese, G.; Bates, P.D.; Neal, J.C.; Sampson, C.C.; Wing, O.E.J.; Quinn, N.; Beck, H.E. Use of Hydrological Models in Global Stochastic Flood Modeling. Water Resour. Res. 2022, 58, e2022WR032743. [Google Scholar] [CrossRef] [Scilit]
- Wang, S.; Peng, H. Multiple spatio-temporal scale runoff forecasting and driving mechanism exploration by K-means optimized XGBoost and SHAP. J. Hydrol. 2024, 630, 130650. [Google Scholar] [CrossRef] [Scilit]
- Liu, Y.; Wang, H.; Guan, X.; Meng, Y.; Xu, H. Urban Flood Depth Prediction and Visualization Based on the XGBoost-SHAP Model. Water Resour. Manag. 2024, 39, 1353–1375. [Google Scholar] [CrossRef] [Scilit]
- Wang, Z.; Lai, C.; Chen, X.; Yang, B.; Zhao, S.; Bai, X. Flood hazard risk assessment model based on random forest. J. Hydrol. 2015, 527, 1130–1141. [Google Scholar] [CrossRef] [Scilit]
- Gao, W.; Liao, Y.; Chen, Y.; Lai, C.; He, S.; Wang, Z. Enhancing transparency in data-driven urban pluvial flood prediction using an explainable CNN model. J. Hydrol. 2024, 645, 132228. [Google Scholar] [CrossRef] [Scilit]
- Kanani-Sadat, Y.; Safari, A.; Nasseri, M.; Homayouni, S. A novel explainable PSO-XGBoost model for regional flood frequency analysis at a national scale: Exploring spatial heterogeneity in flood drivers. J. Hydrol. 2024, 638, 131493. [Google Scholar] [CrossRef] [Scilit]
- Misra, A.; White, K.; Nsutezo, S.F.; Straka, W., 3rd; Lavista, J. Mapping global floods with 10 years of satellite radar data. Nat. Commun. 2025, 16, 5762. [Google Scholar] [CrossRef] [Scilit]
- Mohammadi, A.; Costelloe, J.F.; Ryu, D. Application of time series of remotely sensed normalized difference water, vegetation and moisture indices in characterizing flood dynamics of large-scale arid zone floodplains. Remote Sens. Environ. 2017, 190, 70–82. [Google Scholar] [CrossRef] [Scilit]
- Huete, R.; Batchily, K.; van Leeuwen, W. A Comparison of Vegetation Indices over a Global Set of TM Images for EOS-MODIS. Remote Sens. Environ. 1995, 59, 440–451. [Google Scholar]
- Chu, W.; Zhang, C.; Li, H.; Zhang, L.; Shen, D.; Li, R. SHAP-powered insights into spatiotemporal effects: Unlocking explainable Bayesian-neural-network urban flood forecasting. Int. J. Appl. Earth Obs. Geoinf. 2024, 131, 103972. [Google Scholar] [CrossRef] [Scilit]
- Tang, X.; Tian, J.; Huang, X.; Shu, Y.; Liu, Z.; Long, S.; Xue, W.; Liu, L.; Lin, X.; Liu, W. A novel machine learning-based framework to extract the urban flood susceptible regions. Int. J. Appl. Earth Obs. Geoinf. 2024, 132, 104050. [Google Scholar] [CrossRef] [Scilit]
- Almouctar, M.A.S.; Wu, Y.; An, S.; Yin, X.; Qin, C.; Zhao, F.; Qiu, L. Flood risk assessment in arid and semi-arid regions using Multi-criteria approaches and remote sensing in a data-scarce region. J. Hydrol. Reg. Stud. 2024, 54, 101862. [Google Scholar] [CrossRef] [Scilit]
- Wang, X.; Liu, R.; Sun, C.; Zhai, X.; Ding, L.; Liu, X.; Zhang, X. Optimizing flood resilience in China’s mountainous areas: Design flood estimation using advanced machine learning techniques. J. Hydrol. Reg. Stud. 2025, 59, 102345. [Google Scholar] [CrossRef] [Scilit]
- Tan, X.Z.; Li, Y.; Wu, X.X.; Dai, C.; Zhang, X.L.; Cai, Y.P. Identification of the key driving factors of flash flood based on different feature selection techniques coupled with random forest method. J. Hydrol. Reg. Stud. 2024, 51, 101624. [Google Scholar] [CrossRef] [Scilit]
- Winsemius, H.C.; Jongman, B.; Veldkamp, T.I.E.; Hallegatte, S.; Bangalore, M.; Ward, P.J. Disaster risk, climate change, and poverty: Assessing the global exposure of poor people to floods and droughts. Environ. Dev. Econ. 2018, 23, 328–348. [Google Scholar] [CrossRef] [Scilit]
- Chernykh, D.; Biryukov, R.; Bondarovich, A.; Lubenets, L.; Pavlenko, A.; Rakhymbek, K.; Revenko, D.; Zhantassova, Z. Spatiotemporal Analysis of Soil Moisture Variability and Precipitation Response Across Soil Texture Classes in East Kazakhstan. Land 2025, 14, 1136. [Google Scholar] [CrossRef] [Scilit]
- Kim, J.H.; Sung, J.H.; Shahid, S.; Chung, E.S. Future Hydrological Drought Analysis Considering Agricultural Water Withdrawal Under SSP Scenarios. Water Resour. Manag. 2022, 36, 2913–2930. [Google Scholar] [CrossRef] [Scilit]
- Ta, Z.; Yu, R.; Chen, X.; Mu, G.; Guo, Y. Analysis of the Spatio-Temporal Patterns of Dry and Wet Conditions in Central Asia. Atmosphere 2018, 9, 7. [Google Scholar] [CrossRef] [Scilit]
- Wang, X.; Chen, Y.; Fang, G.; Li, Z.; Liu, Y. The growing water crisis in Central Asia and the driving forces behind it. J. Clean. Prod. 2022, 378, 134574. [Google Scholar] [CrossRef] [Scilit]
- Pool, S.; Francés, F.; Garcia-Prats, A.; Pulido-Velazquez, M.; Sanchis-Ibor, C.; Schirmer, M.; Yang, H.; Jiménez-Martínez, J. From Flood to Drip Irrigation Under Climate Change: Impacts on Evapotranspiration and Groundwater Recharge in the Mediterranean Region of Valencia (Spain). Earth’s Future 2021, 9, e2020EF001859. [Google Scholar] [CrossRef] [Scilit]
- Xu, Q.; Shi, Y.; Zhao, J.; Zhu, X.X. FloodCastBench: A Large-Scale Dataset and Foundation Models for Flood Modeling and Forecasting. Sci. Data 2025, 12, 431. [Google Scholar] [CrossRef] [Scilit]
- Guo, Y.; Yang, Y.; Yang, D.; Zhang, L.; Zheng, H.; Xiong, J.; Ruan, F.; Han, J.; Liu, Z. Warming leads to both earlier and later snowmelt floods over the past 70 years. Nat. Commun. 2025, 16, 3663. [Google Scholar] [CrossRef] [Scilit]
- Gu, X.; Cheng, N.; Guan, Y.; Kong, D. Seasonal diversity of global flood changes and their drivers. J. Hydrol. 2025, 662, 133976. [Google Scholar] [CrossRef] [Scilit]
- Qin, X.; Wang, S.; Meng, M.; Long, H.; Zhang, H.; Shi, H. Enhancing urban resilience through machine learning-supported flood risk assessment: Integrating flood susceptibility with building function vulnerability. npj Urban Sustain. 2025, 5, 19. [Google Scholar] [CrossRef] [Scilit]
- O’Neill, B.C.; Kriegler, E.; Ebi, K.L.; Kemp-Benedict, E.; Riahi, K.; Rothman, D.S.; van Ruijven, B.J.; van Vuuren, D.P.; Birkmann, J.; Kok, K.; et al. The roads ahead: Narratives for shared socioeconomic pathways describing world futures in the 21st century. Glob. Environ. Change 2017, 42, 169–180. [Google Scholar] [CrossRef] [Scilit]
- Wang, Y.; Zhang, P.; Xie, Y.; Chen, L.; Li, Y. Toward explainable flood risk prediction: Integrating a novel hybrid machine learning model. Sustain. Cities Soc. 2025, 120, 106140. [Google Scholar] [CrossRef] [Scilit]
- Mujungu, L.; Museru, R.N.; Nikoo, M.R.; Karimi, M. Improving disaster resilience with causal machine learning for flood damage estimation. Sci. Total Environ. 2025, 995, 180121. [Google Scholar] [CrossRef] [Scilit]
- Yang, W.; Chen, J.; Ding, T.; Li, Y.; Gong, W. Probabilistic assessment for drought risk: Integrating drought hazard, ecological sensitivity, economic vulnerability, and their coupling coordination. J. Hydrol. 2026, 664, 134451. [Google Scholar] [CrossRef] [Scilit]
- Haer, T.; Husby, T.G.; Botzen, W.J.W.; Aerts, J.C.J.H. The safe development paradox: An agent-based model for flood risk under climate change in the European Union. Glob. Environ. Change 2020, 60, 102009. [Google Scholar] [CrossRef] [Scilit]
- Devitt, L.; Neal, J.; Coxon, G.; Savage, J.; Wagener, T. Flood hazard potential reveals global floodplain settlement patterns. Nat. Commun. 2023, 14, 2801. [Google Scholar] [CrossRef] [Scilit]
- Qin, H.; Liang, Q.; Chen, H.; De Silva, V. A High-Performance Coupled Human And Natural Systems (CHANS) Model for Flood Risk Assessment and Reduction. Water Resour. Res. 2024, 60, e2023WR036269. [Google Scholar] [CrossRef] [Scilit]
- Huang, X.; Wang, Y.; Ma, X. Simulation of extreme precipitation changes in Central Asia using CMIP6 under different climate scenarios. Theor. Appl. Climatol. 2023, 155, 3203–3219. [Google Scholar] [CrossRef] [Scilit]
- Frierson, D.M.W.; Scheff, J. Scaling Potential Evapotranspiration with Greenhouse Warming. J. Clim. 2014, 27, 1539–1558. [Google Scholar] [CrossRef] [Scilit]
- Brutsaert, W.; Parlange, M.B. Hydrologic cycle explains the evaporation paradox. Nature 1998, 396, 30. [Google Scholar] [CrossRef] [Scilit]
- Bai, X.; Zhao, C.; Tang, Y.; Zhang, Z.; Yang, B.; Wang, Z. Identification, physical mechanisms and impacts of drought–flood abrupt alternation: A review. Front. Earth Sci. 2023, 11, 1203603. [Google Scholar] [CrossRef] [Scilit]
- Shu, E.G.; Porter, J.R.; Hauer, M.E.; Sandoval Olascoaga, S.; Gourevitch, J.; Wilson, B.; Pope, M.; Melecio-Vazquez, D.; Kearns, E. Integrating climate change induced flood risk into future population projections. Nat. Commun. 2023, 14, 7870. [Google Scholar] [CrossRef] [Scilit]
- Kaźmierczak, A.; Cavan, G. Surface water flooding risk to urban communities: Analysis of vulnerability, hazard and exposure. Landsc. Urban Plan. 2011, 103, 185–197. [Google Scholar] [CrossRef] [Scilit]
- Mazzorana, B.; Levaggi, L.; Keiler, M.; Fuchs, S. Towards dynamics in flood risk assessment. Nat. Hazards Earth Syst. Sci. 2012, 12, 3571–3587. [Google Scholar] [CrossRef] [Scilit]
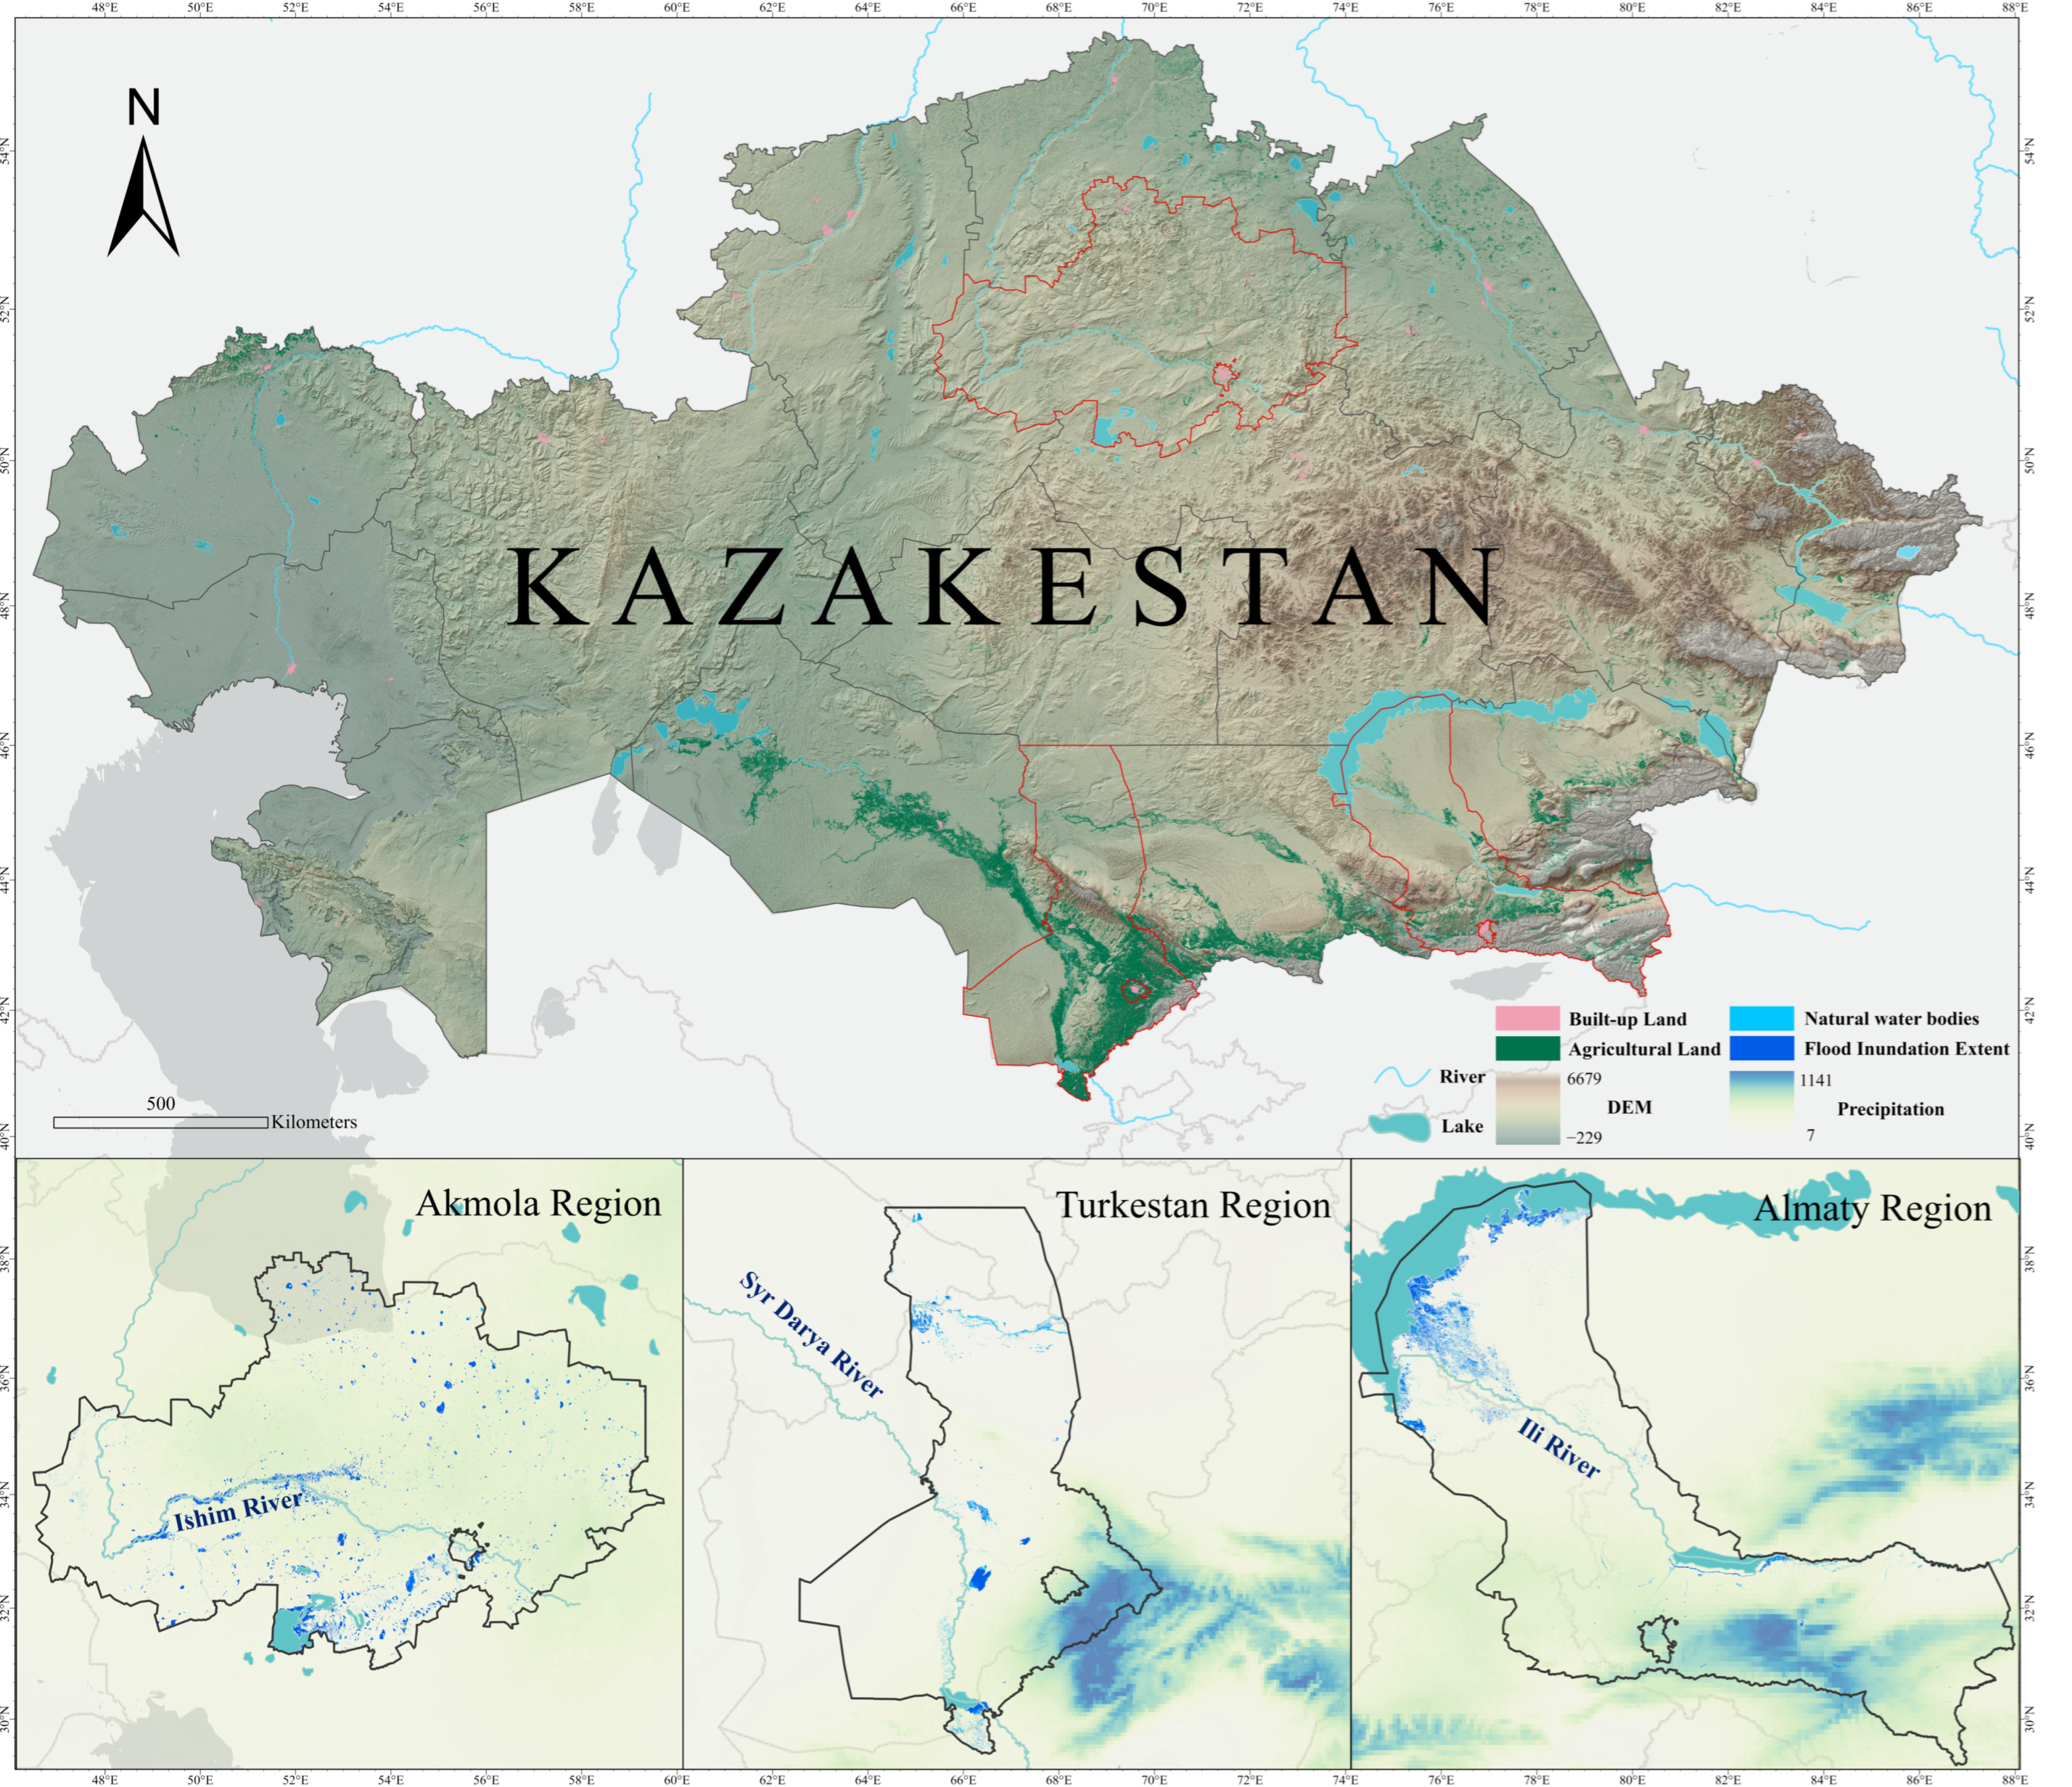
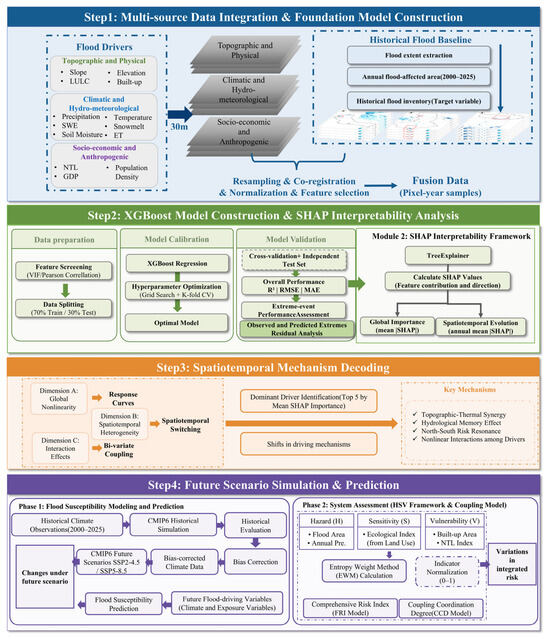
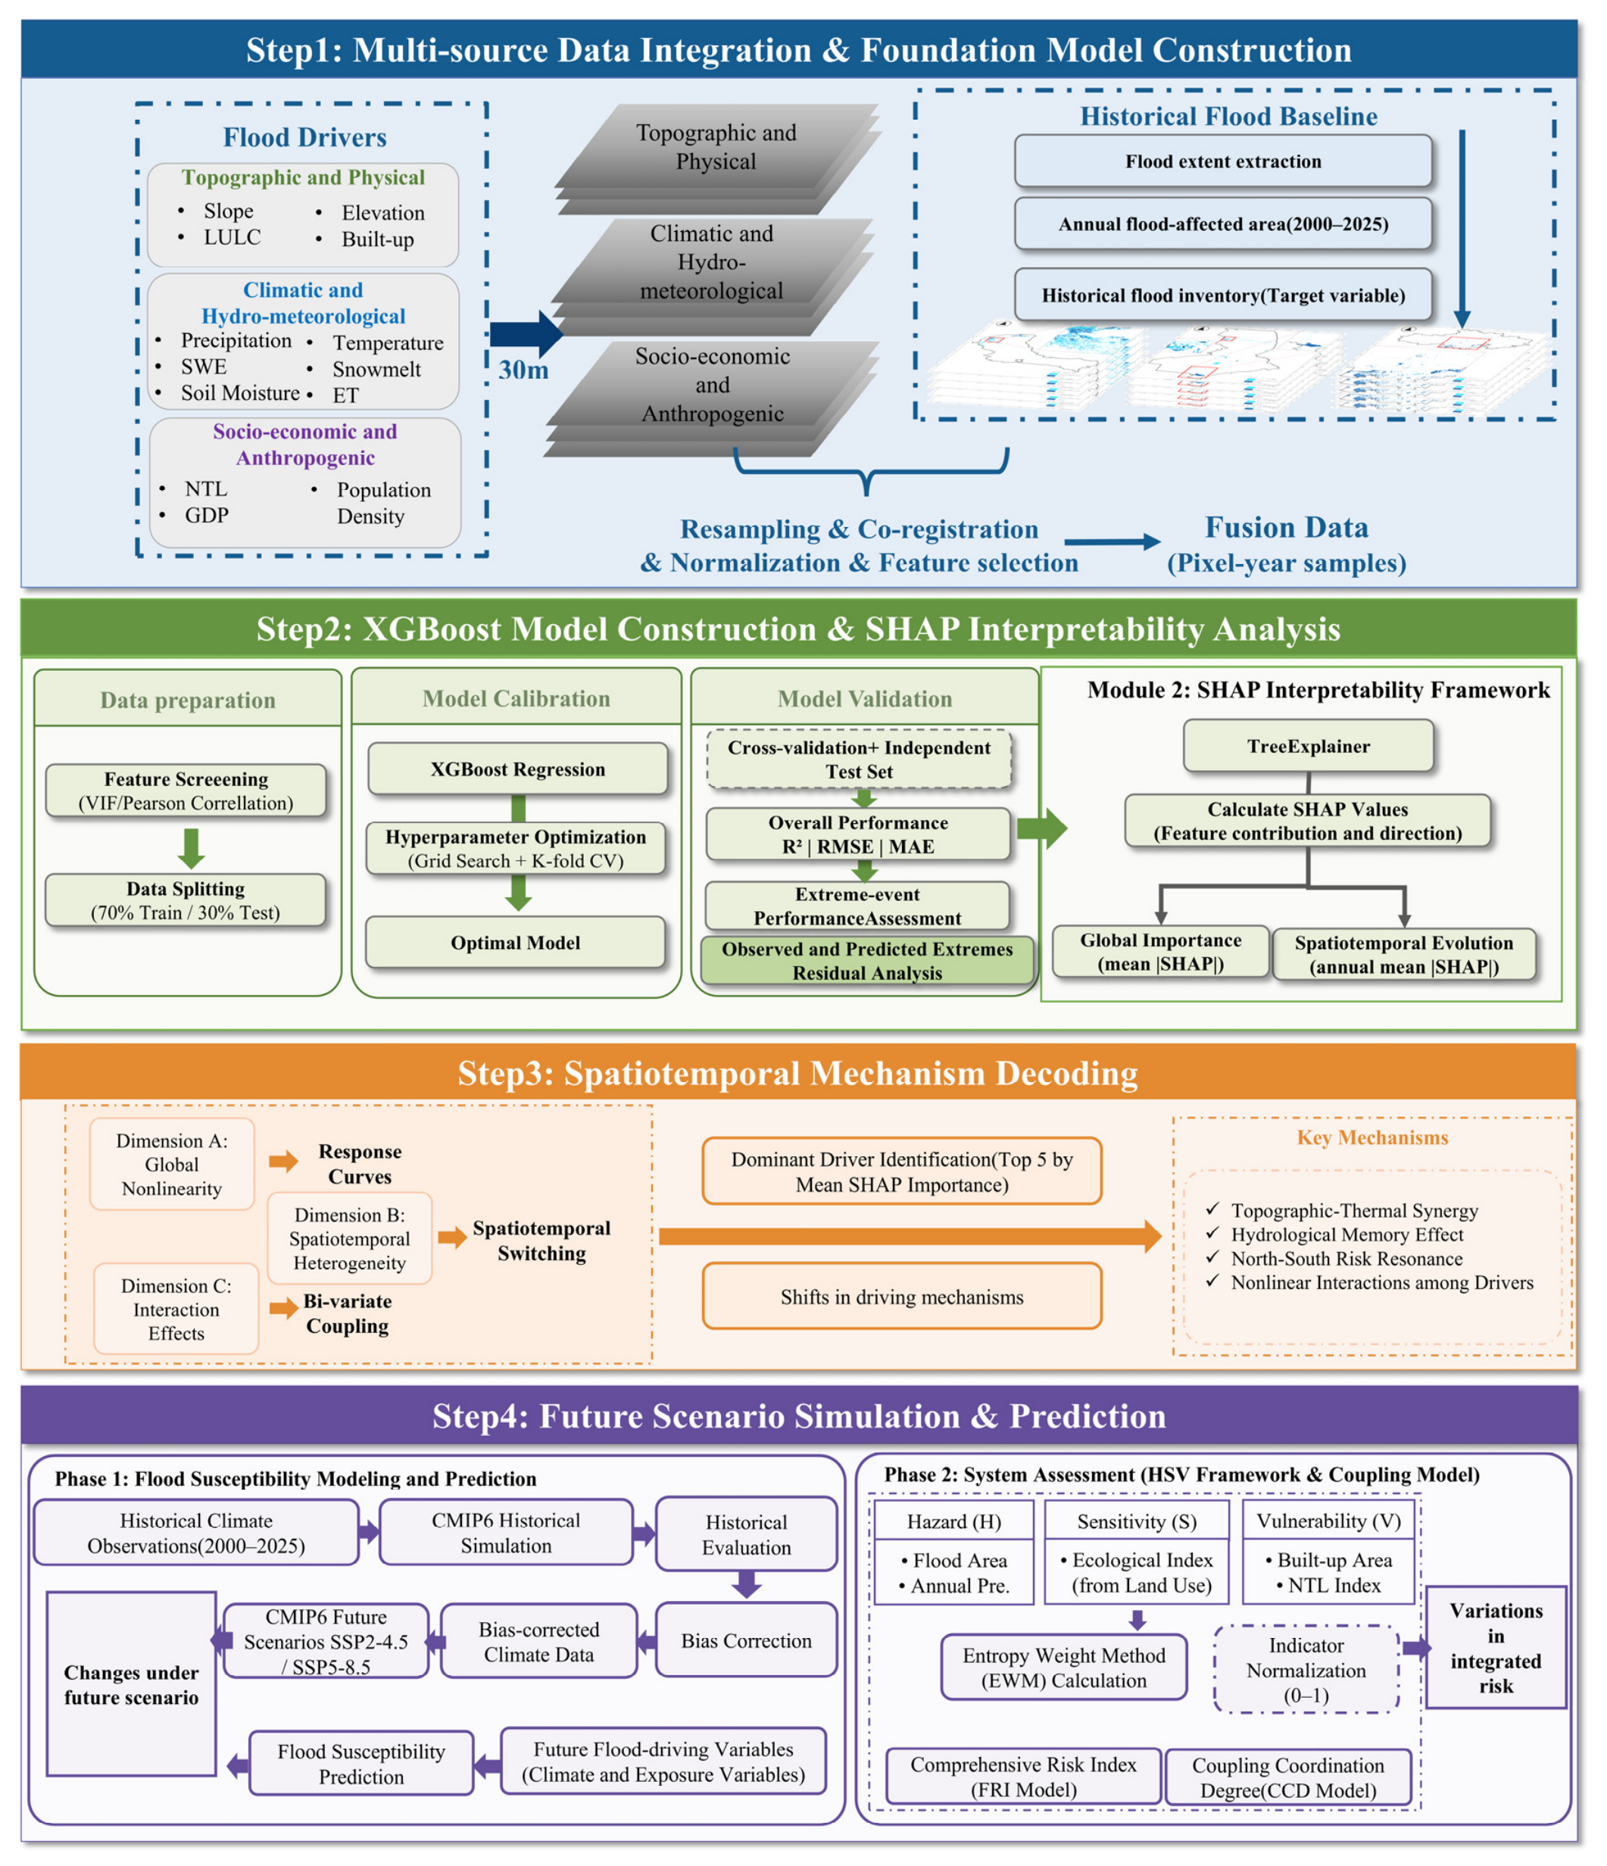
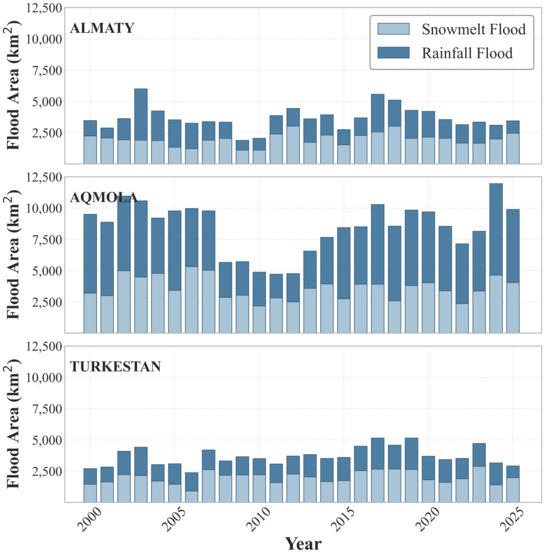
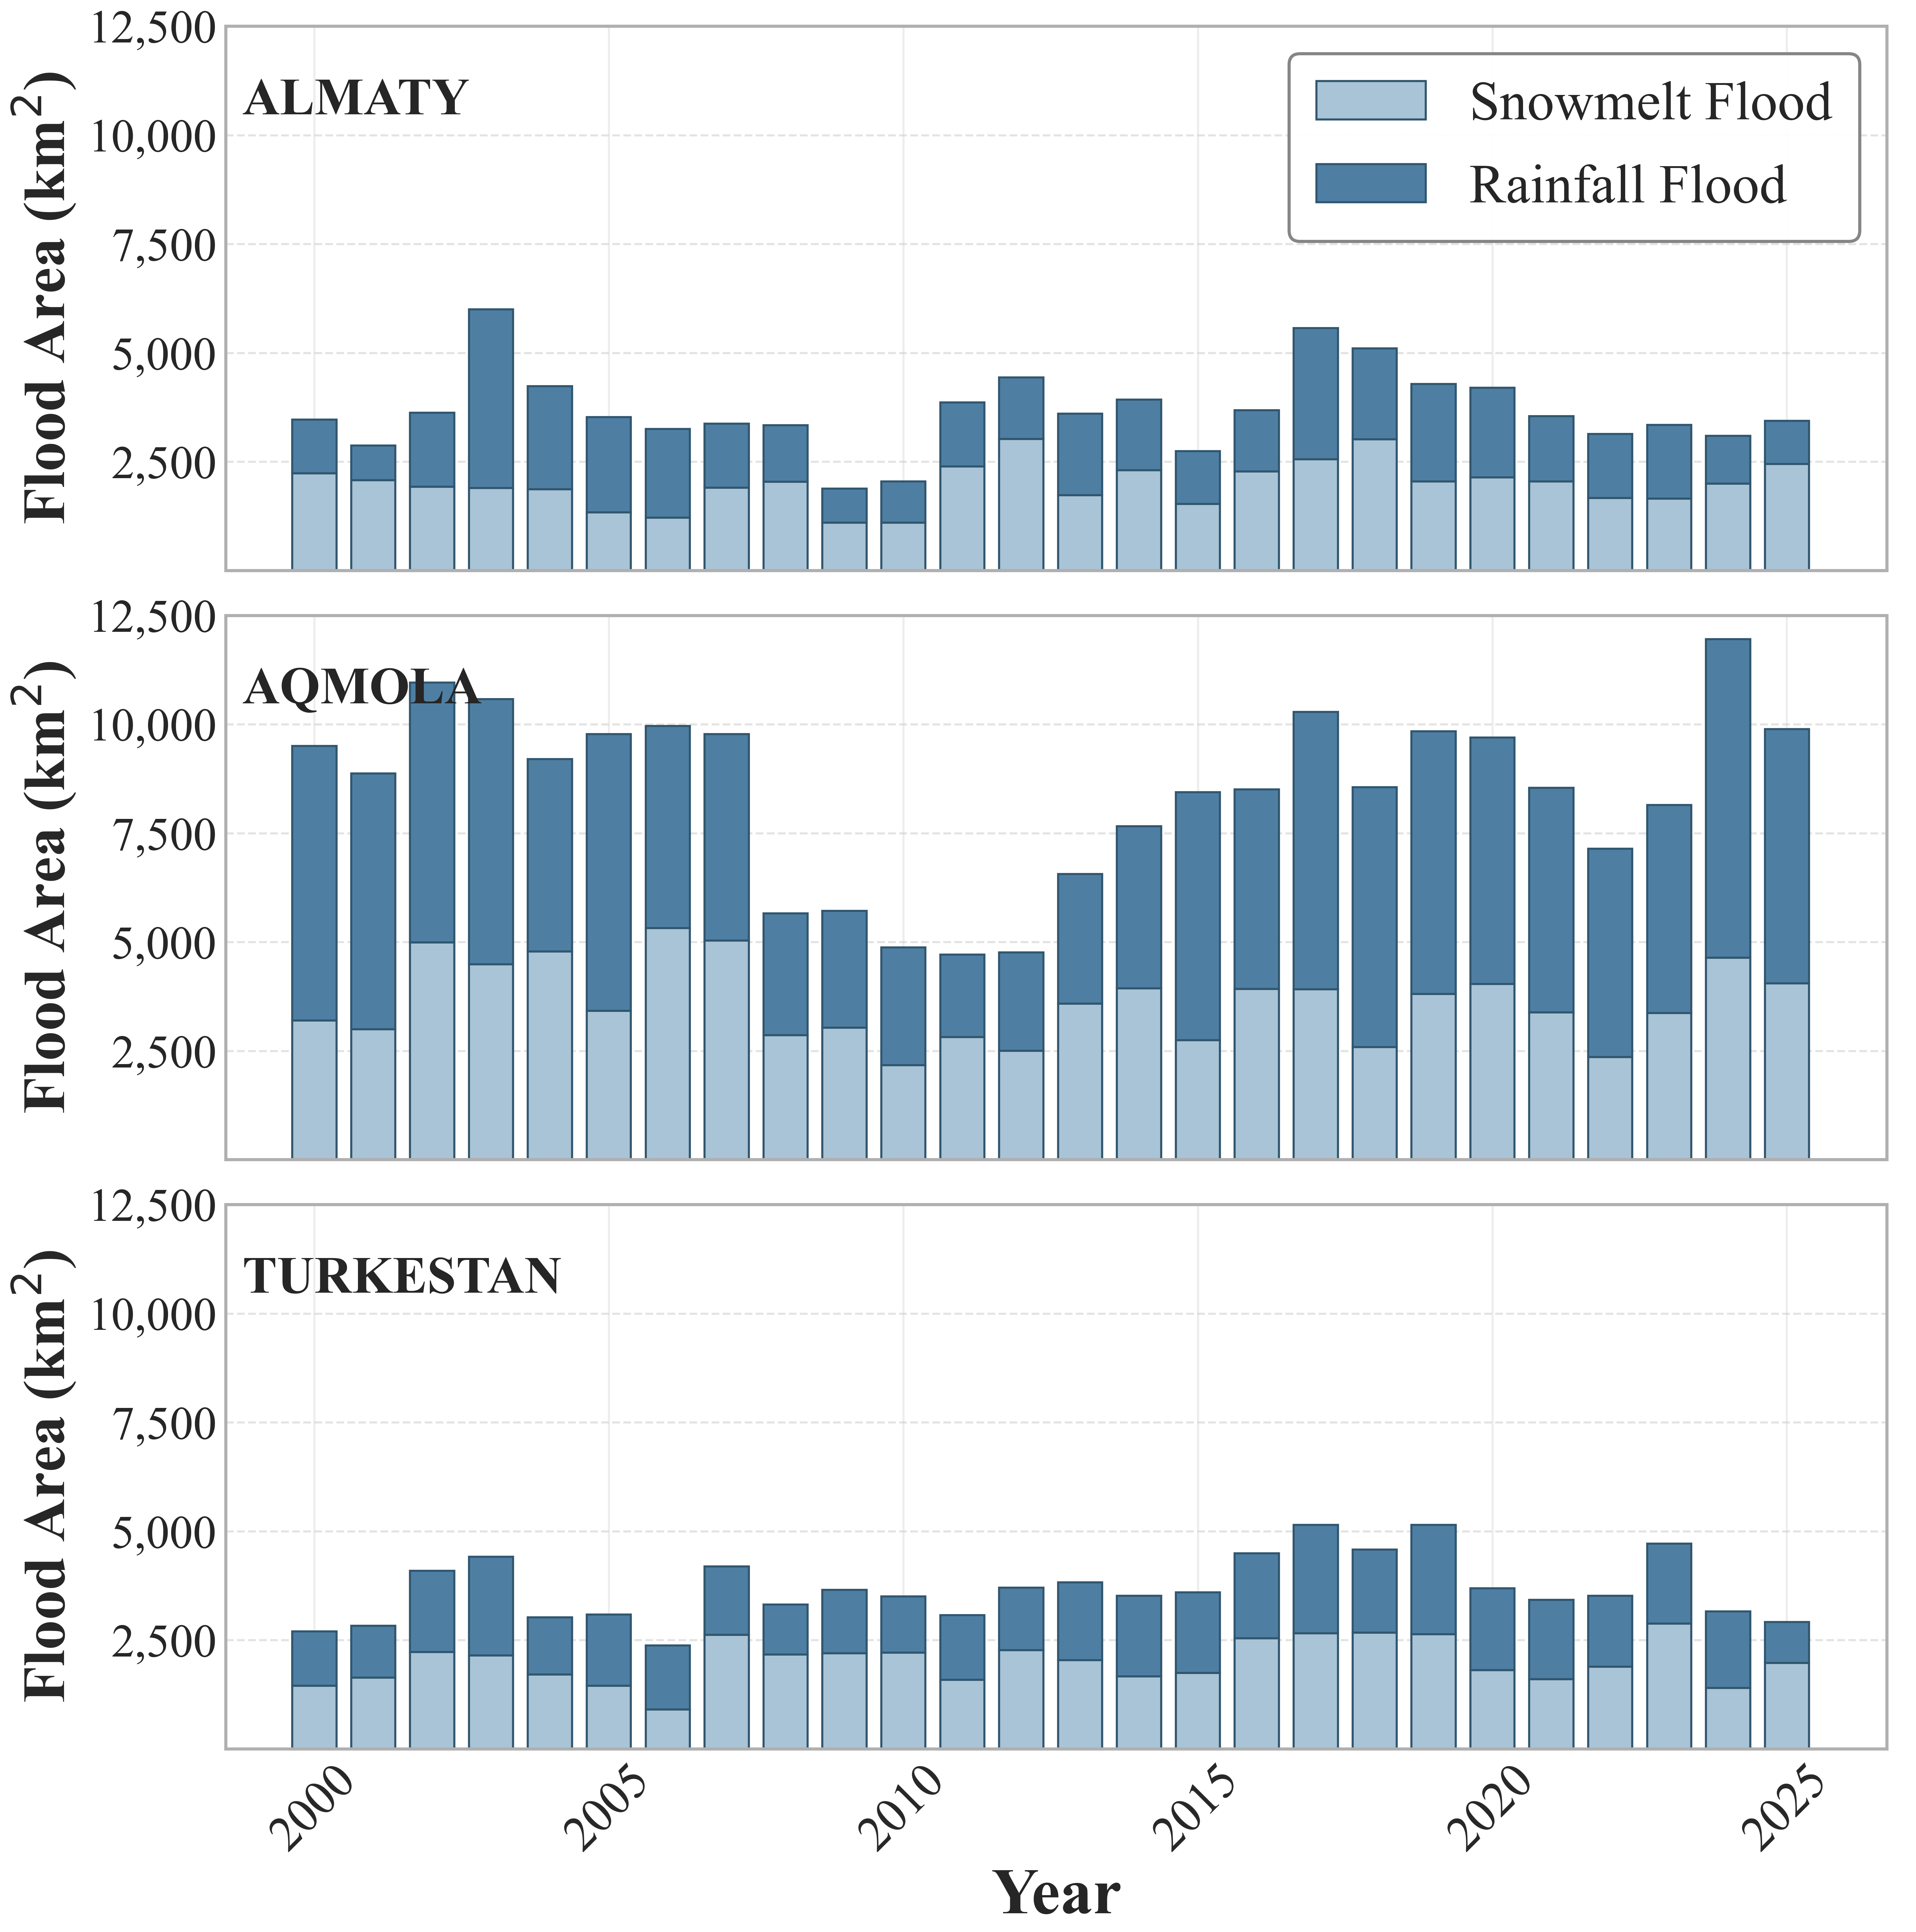
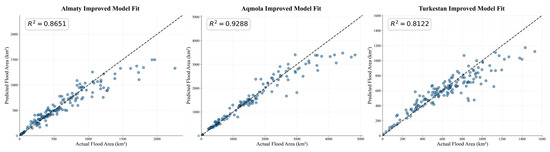
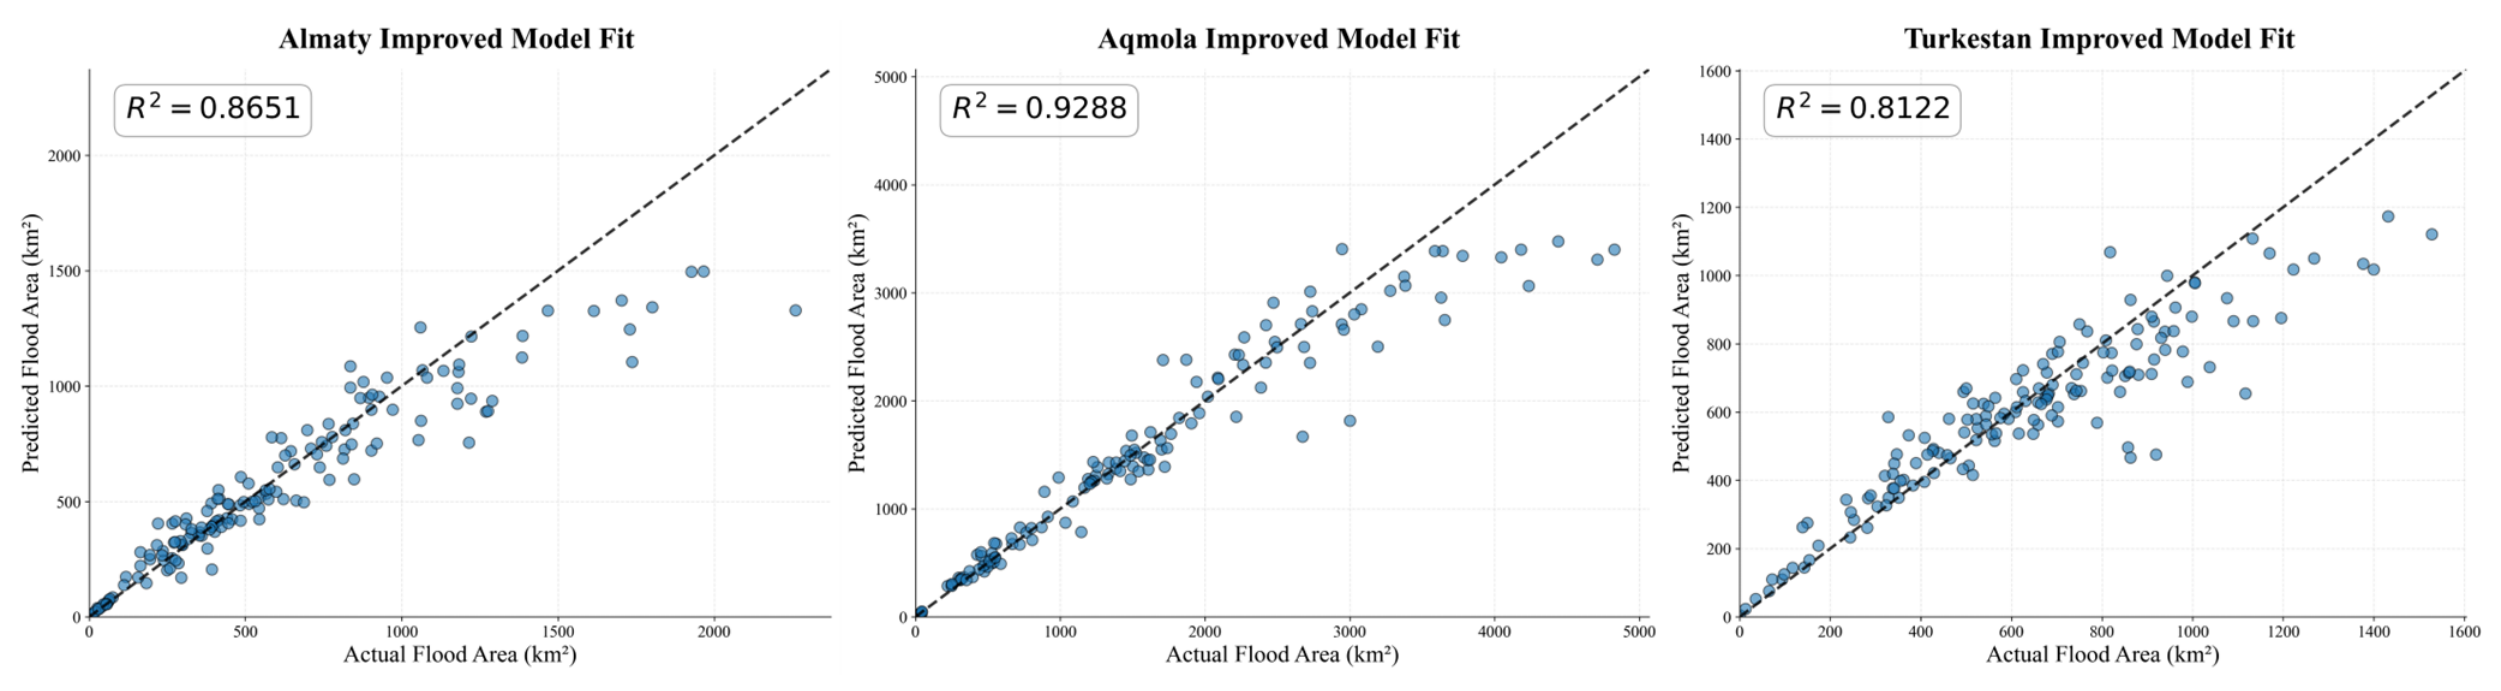
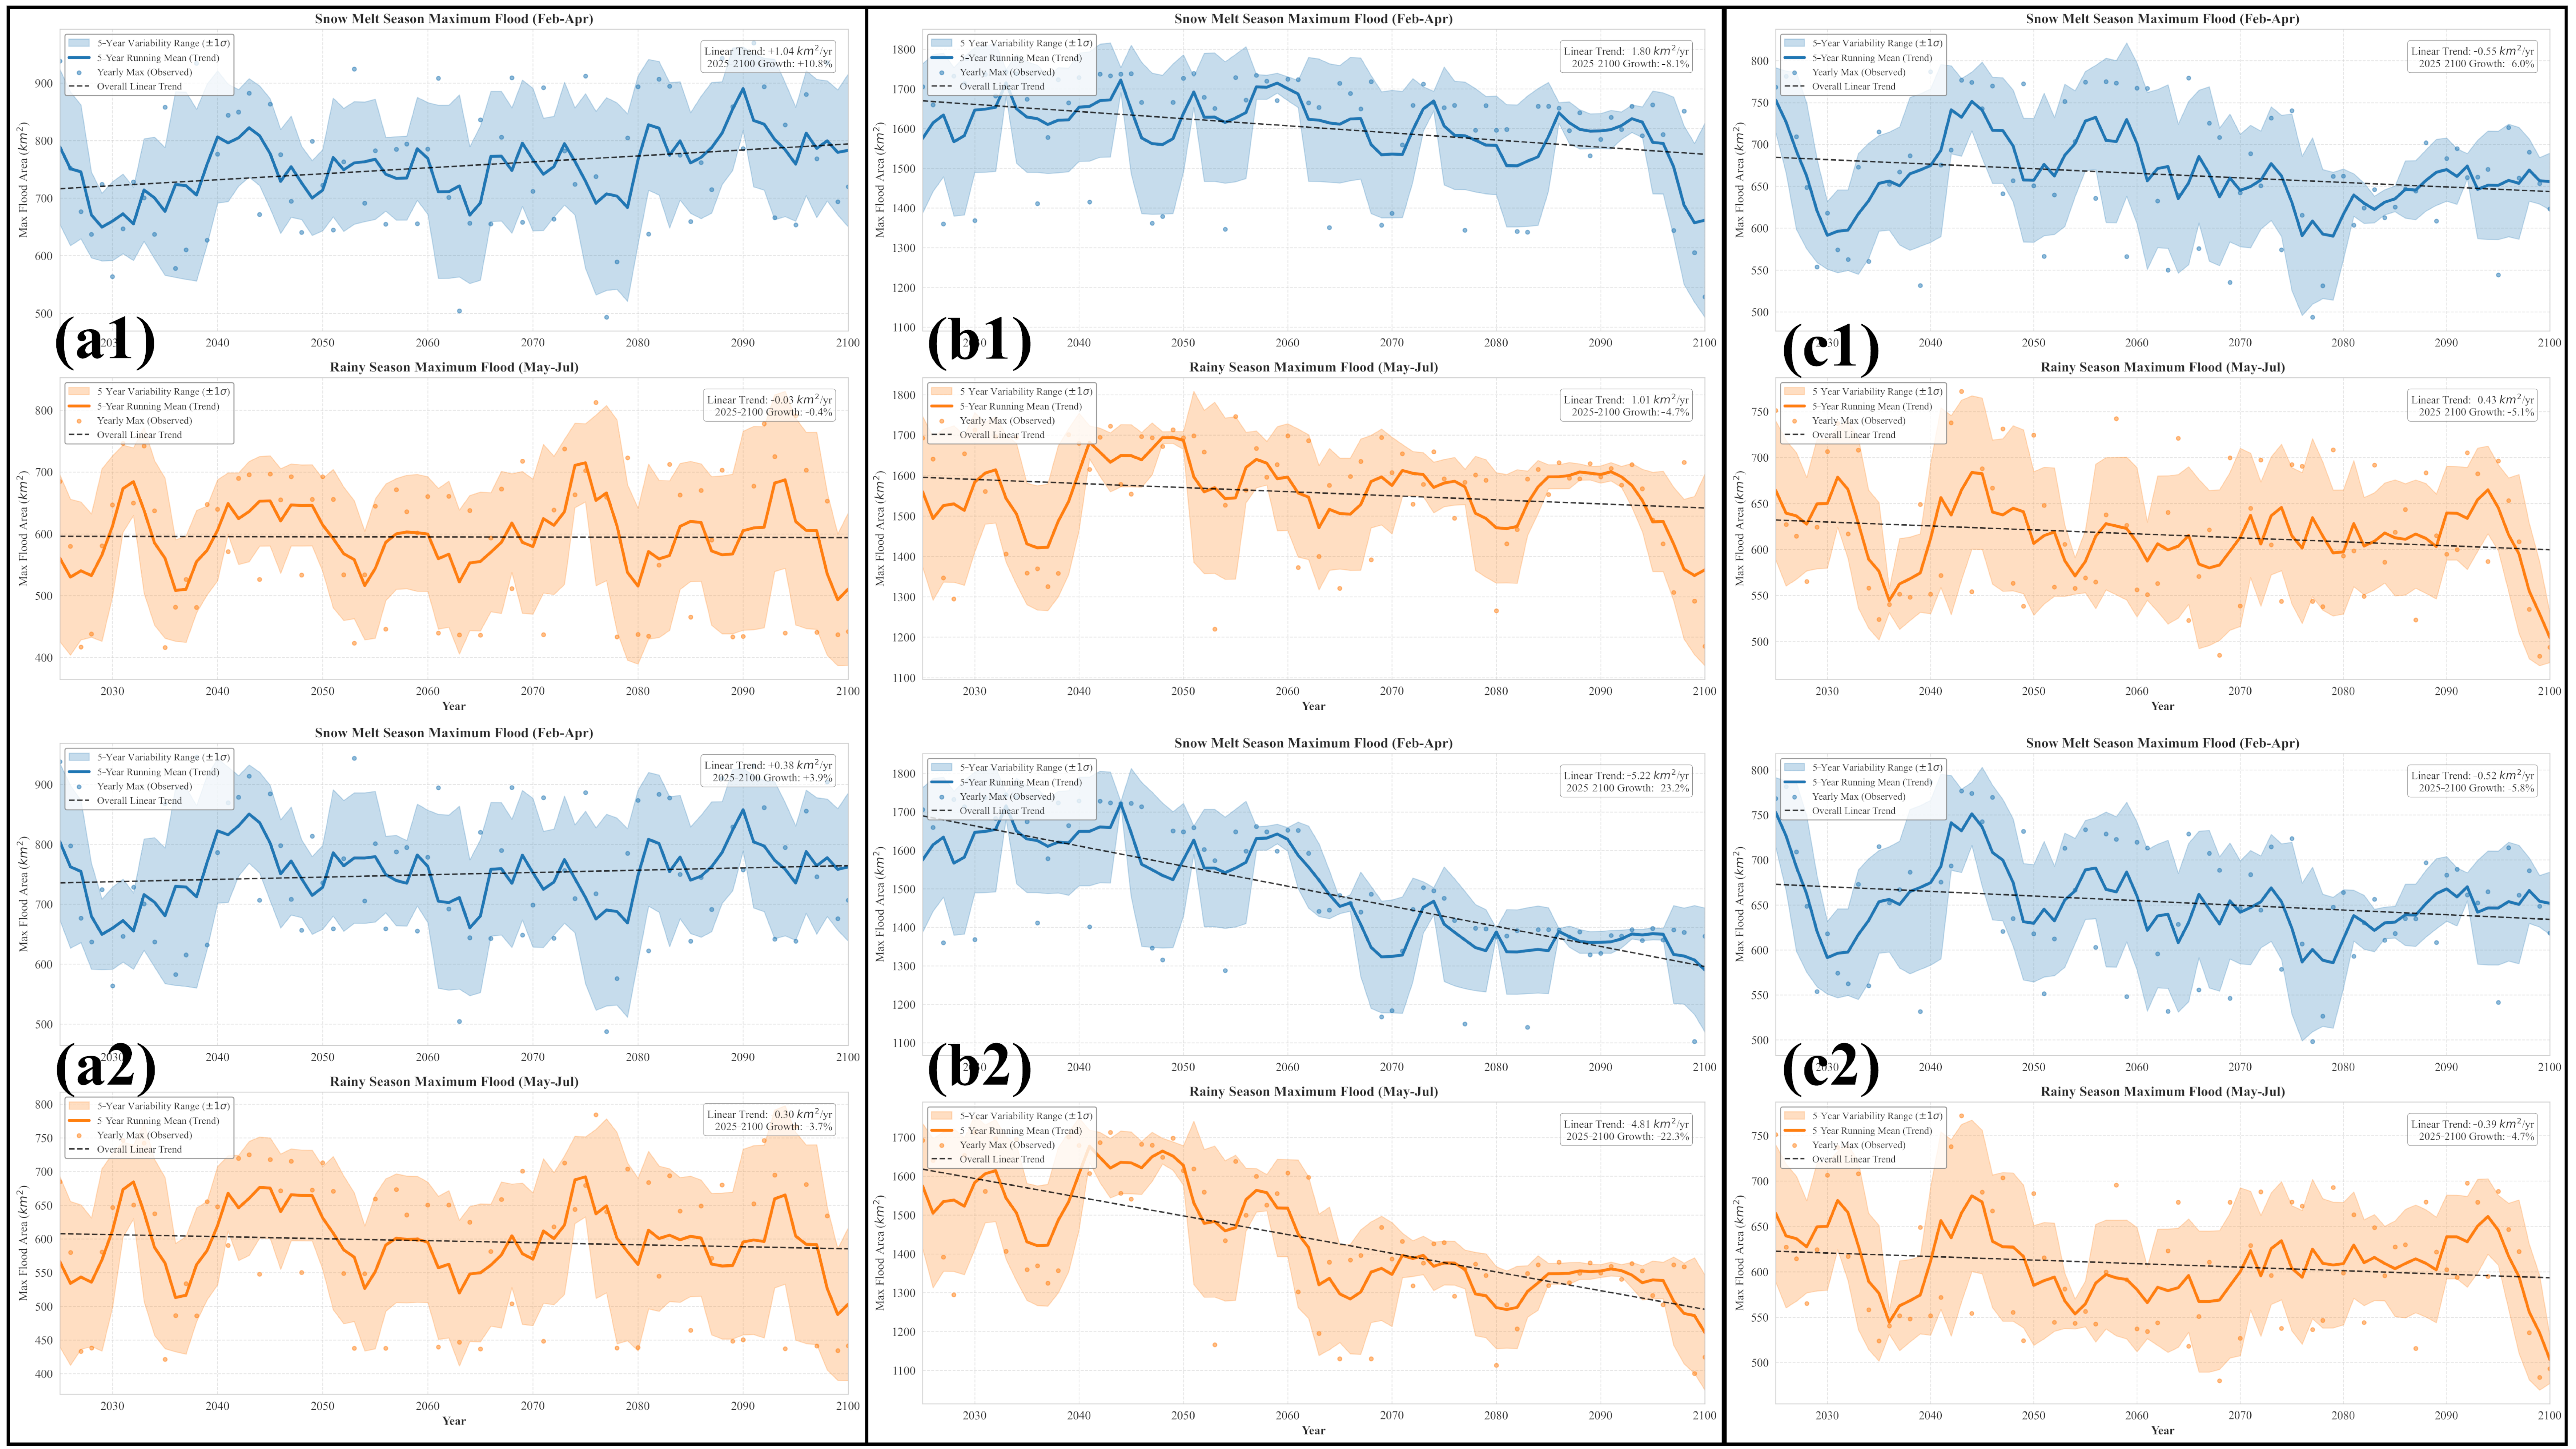
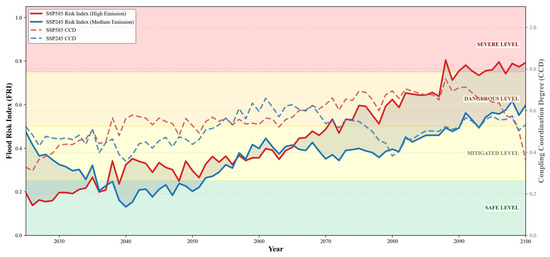
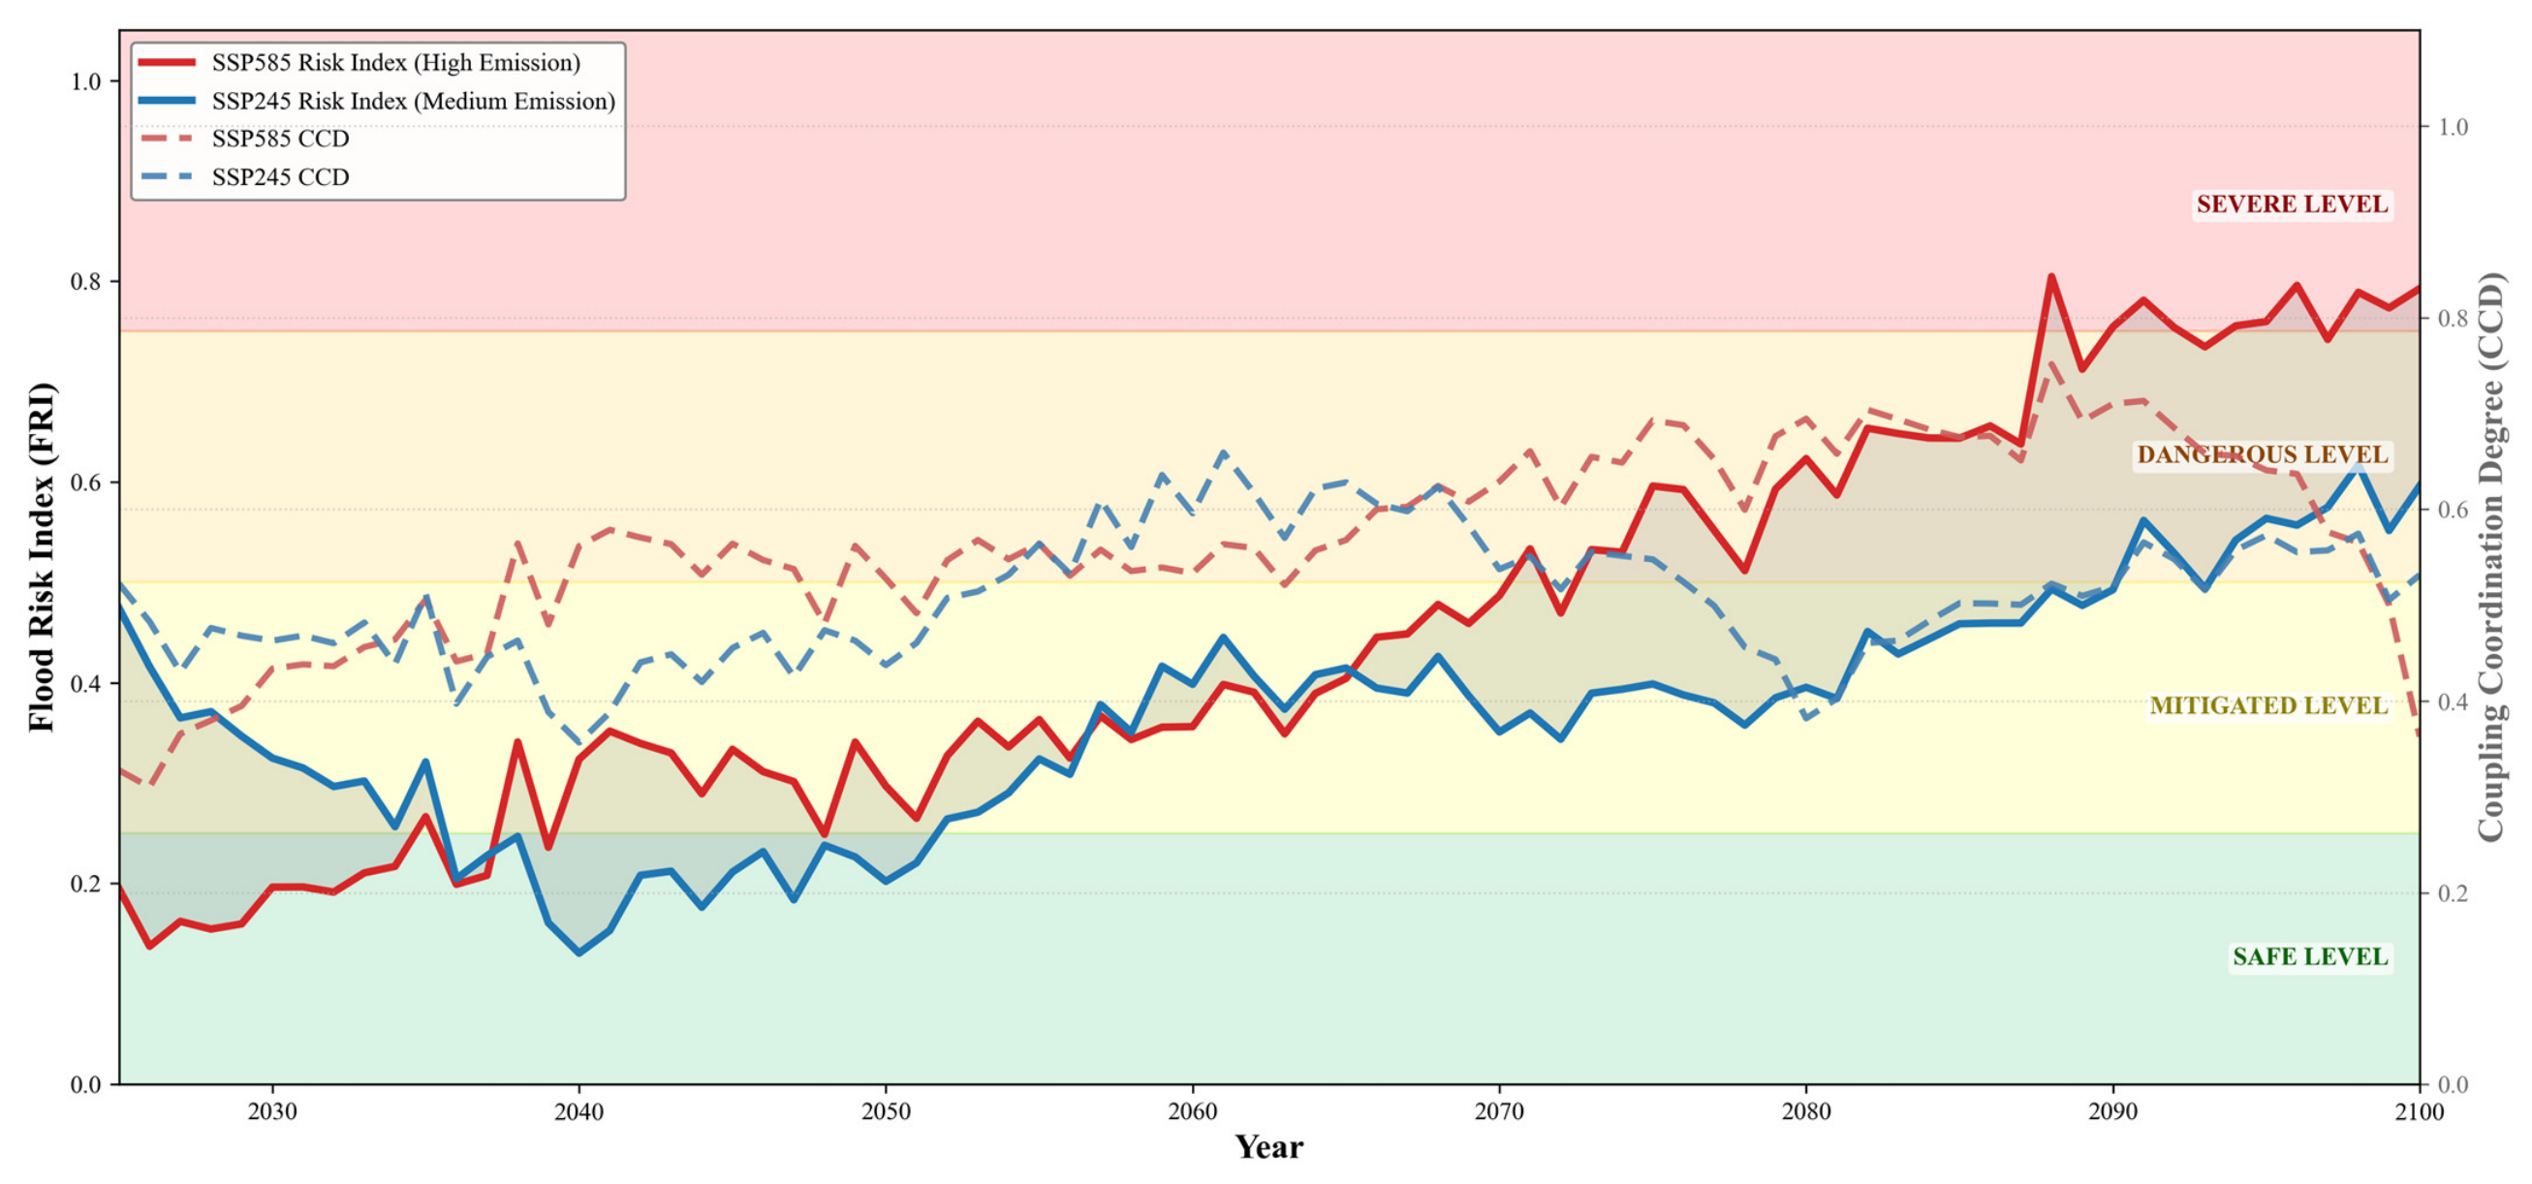
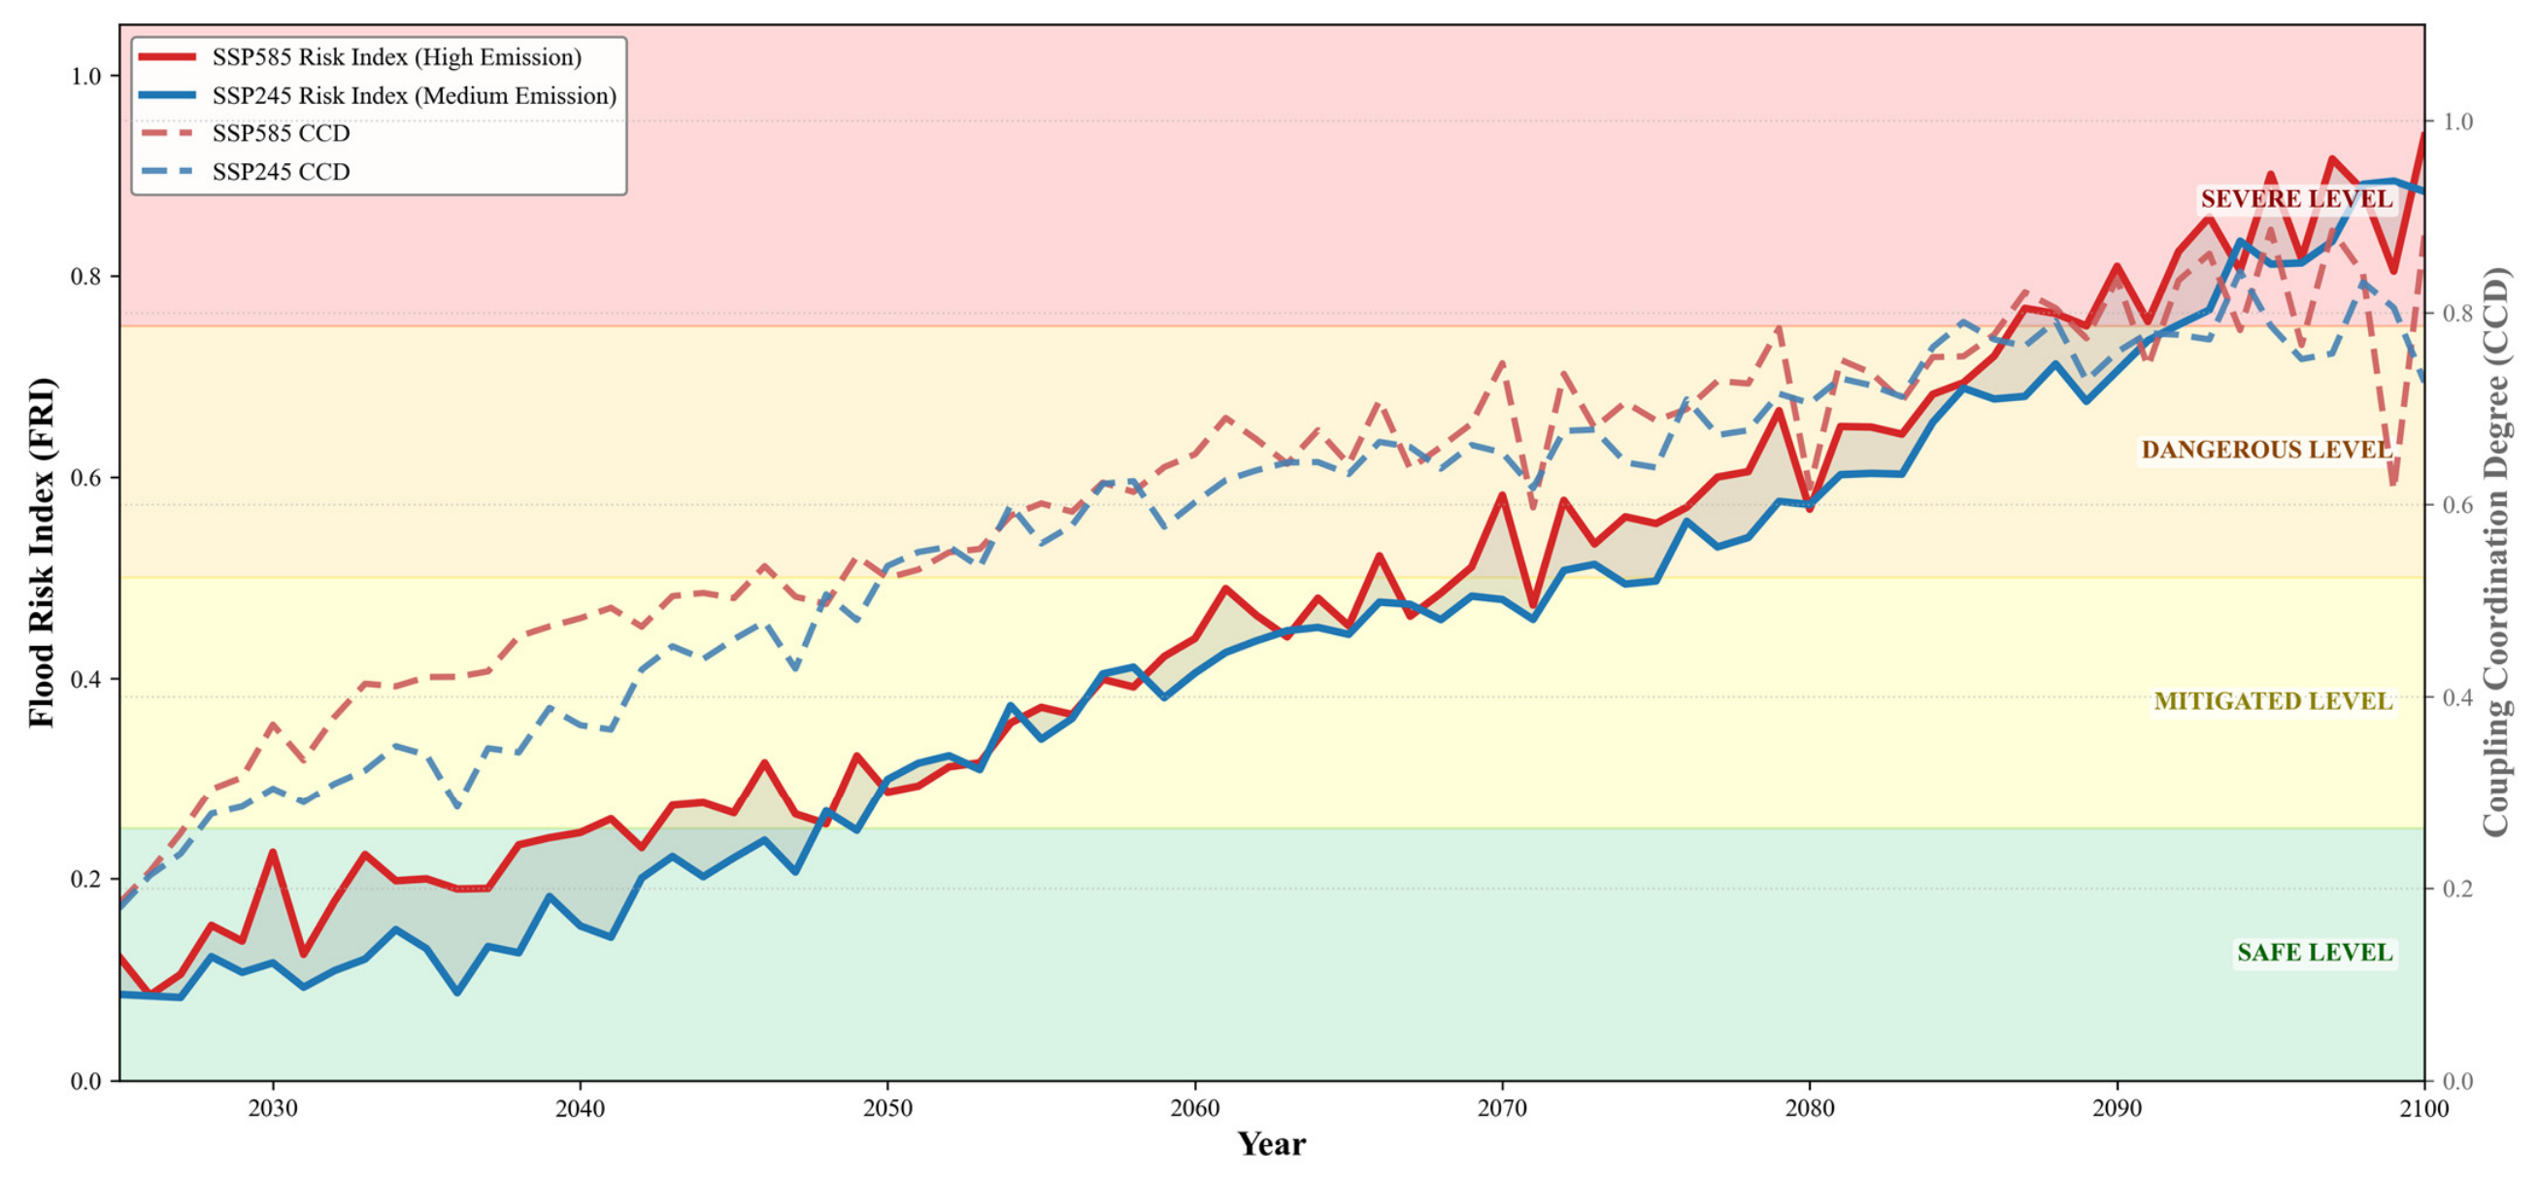
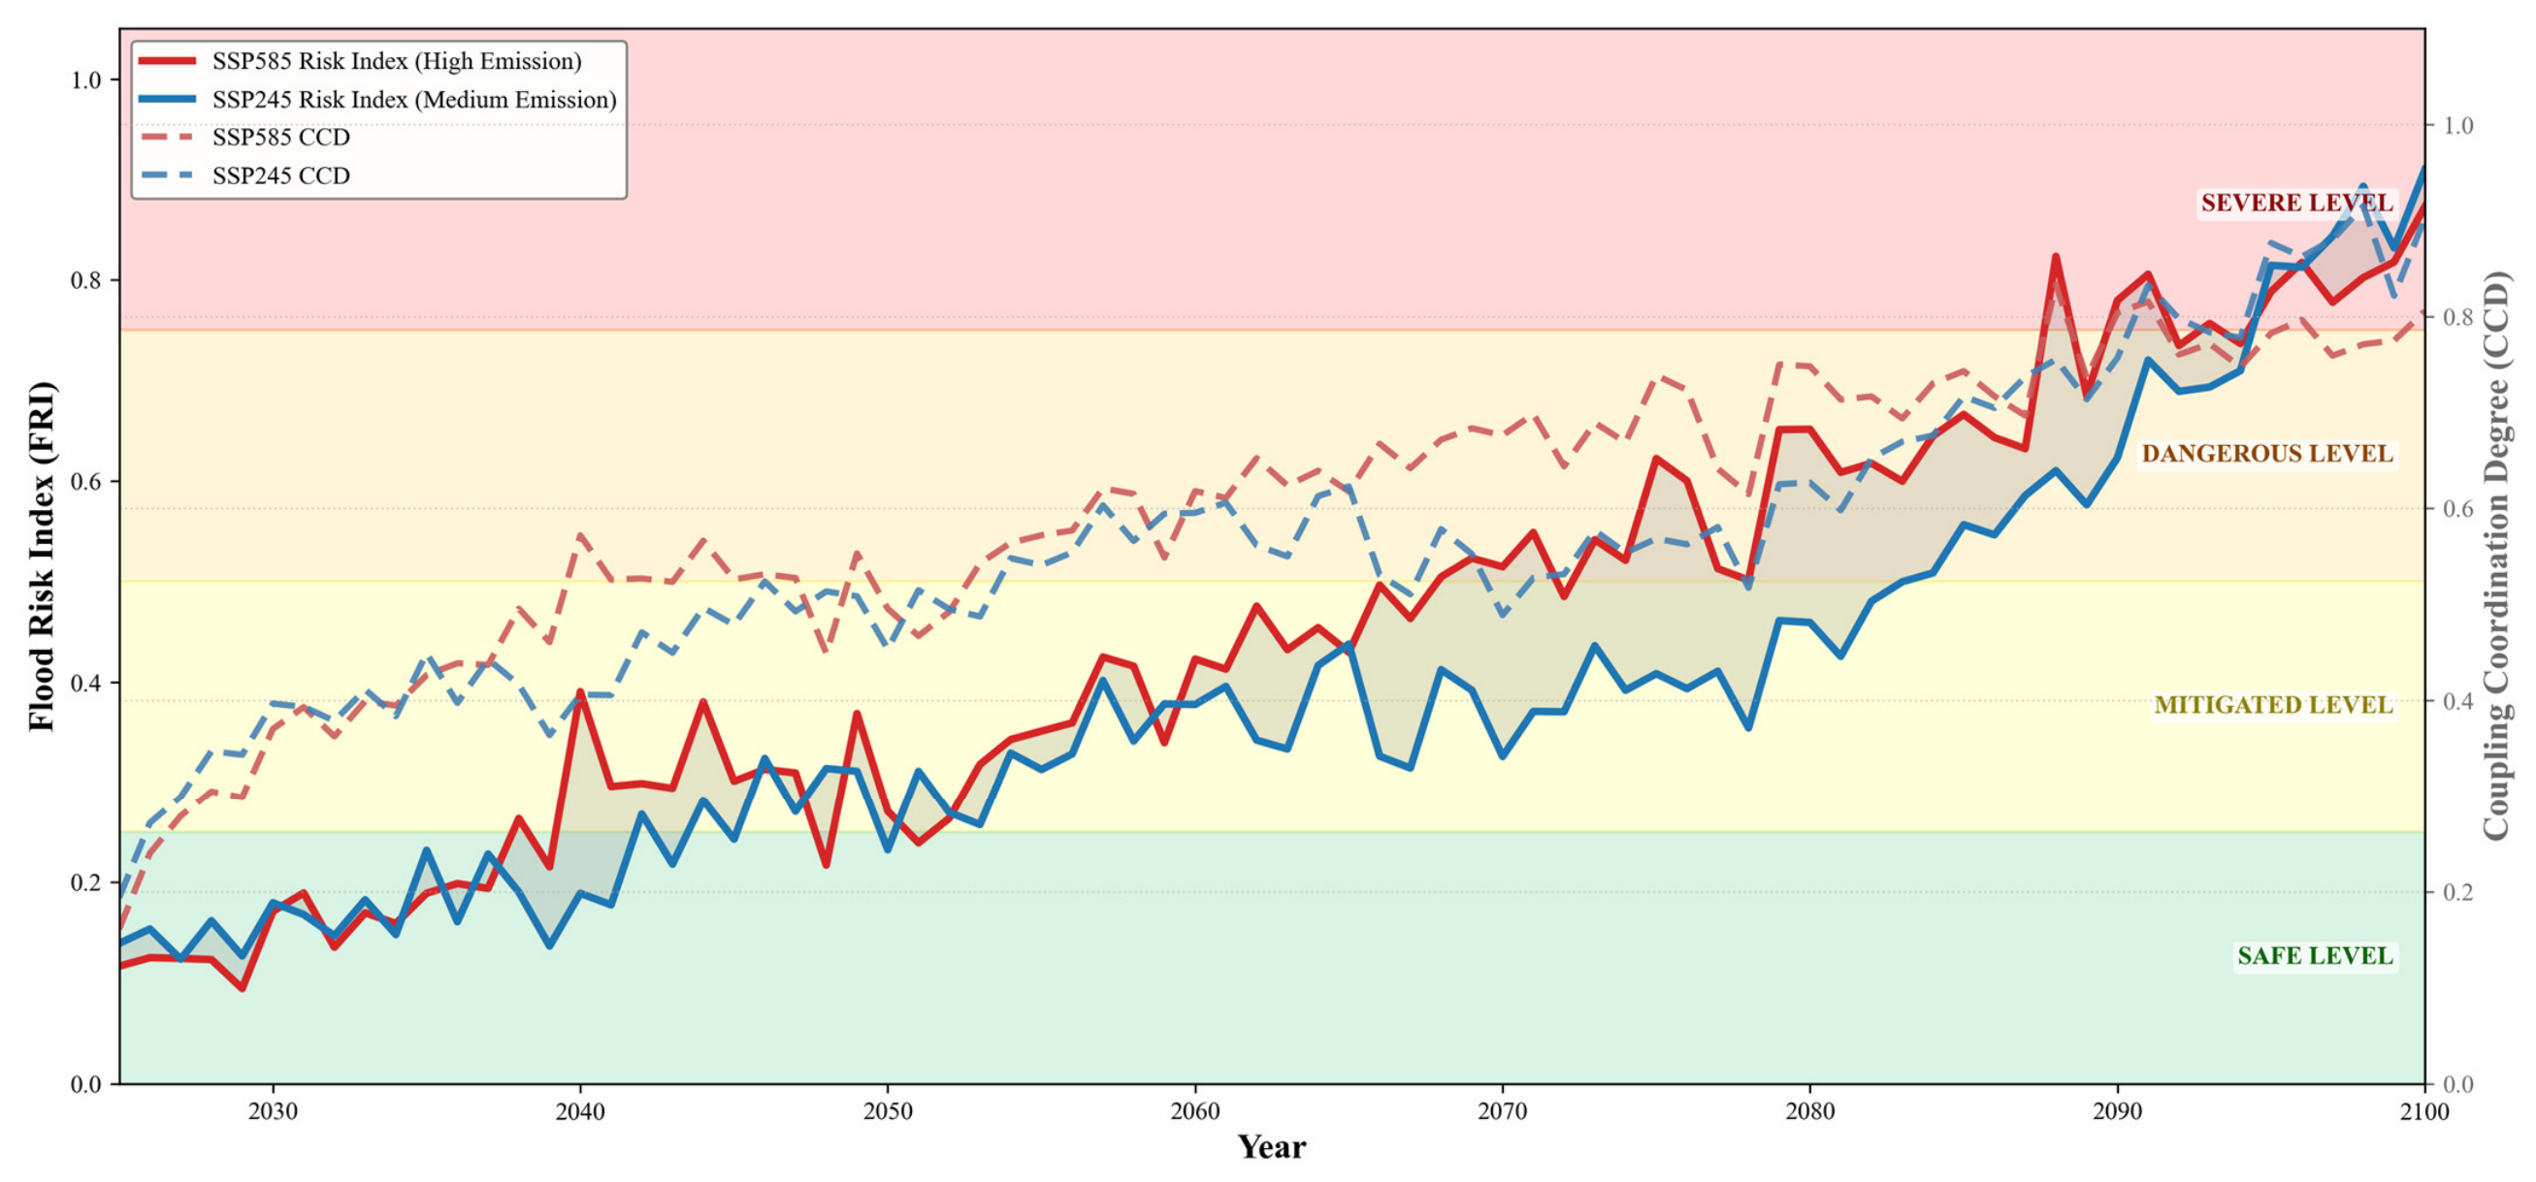

Disclaimer/Publisher’s Note: The statements, opinions and data contained in all publications are solely those of the individual author(s) and contributor(s) and not of MDPI and/or the editor(s). MDPI and/or the editor(s) disclaim responsibility for any injury to people or property resulting from any ideas, methods, instructions or products referred to in the content. |
© 2026 by the authors. Licensee MDPI, Basel, Switzerland. This article is an open access article distributed under the terms and conditions of the Creative Commons Attribution (CC BY) license.