


Abstract
Owing to their widespread occurrence, pharmaceutical and personal care products (PPCPs) have emerged as a global environmental concern; however, research on PPCP pollution in karst tourist cities remains limited. This study investigated the concentrations and spatial distribution of 43 PPCPs in the Lijiang River Basin and identified their primary sources together with the associated ecological and health risks. In total, 43 target PPCPs were detected in the Lijiang River Basin in Guangxi, China, with concentrations ranging from 68.6 to 3170 ng/L in wastewater, 53.2 to 1400 ng/L in surface water, and 32.0 to 505 ng/L in groundwater. Caffeine (CAF), 1,7-dimethylxanthine (1,7-DIM), 4-acetaminophenol (APAP), and metformin (MFM) were the predominant contaminants across all three matrices. Notably, concentrations in tributaries exceeded those in the main stem. Principal component analysis (PCA) revealed that domestic sewage and hospital wastewater constitute the principal sources of PPCPs in the Lijiang River. Certain effluents and river reaches containing 1,7-DIM and MFM posed a moderate ecological risk (0.1 < risk quotient (RQ) < 1). The PPCPs detected in groundwater did not exceed health-based thresholds, indicating no direct risk to human health. These findings advance our understanding of PPCP contamination in karst landscapes and provide a scientific basis for water quality management in the Lijiang River Basin.
1. Introduction
With the increasing detection of pharmaceuticals and personal care products (PPCPs) across diverse environmental media [1], concerns regarding their potential adverse effects on ecosystems and human health are intensifying [2]. Fang et al. [3] identified 113 PPCPs and 201 pesticides in European rivers. Similarly, Lee et al. [4] detected 15 antibiotics in groundwater throughout South Korea, at concentrations ranging from below the limit of detection to 49.3 ng/L. As one of the world’s largest producers and consumers of pharmaceuticals, China accounts for approximately 45% of global annual antibiotic consumption [5]. Xu et al. [6] analysed 130 PPCP compounds across China’s seven major river basins, reporting mean concentrations ranging from 0.02 to 333 ng/L. Ma et al. [7] detected seven antibiotic compounds in groundwater across northern China, at concentrations ranging from below the limit of quantification to 128 ng/L. Conventional wastewater treatment plants (WWTPs) frequently fail to completely remove PPCPs, resulting in their continuous release into the aquatic environment [8]. Consequently, rivers have become the principal environmental sink for PPCP inputs [9]. Furthermore, PPCPs may percolate through the soil profile into groundwater aquifers, thereby contributing to groundwater contamination [10]. Nevertheless, research on the distribution and fate of PPCPs in karst river and groundwater systems remains scarce. As an internationally renowned tourist destination with high population mobility, Guilin represents an important study area, particularly given that PPCP concentrations typically vary with population density.
Karst landscapes cover approximately 10% of the Earth’s land surface [11] and supply drinking water to around 25% of the global population. The distinctive dual-flow mechanism, which integrates fissure–conduit transport with rapid hydraulic connectivity, facilitates the accumulation and rapid migration of organic pollutants into groundwater [12]. The Lijiang River, flowing through Guilin, is situated within a representative karst region [13]. Owing to urbanisation, together with the expansion of tourism, industry and agriculture, the water quality of the Lijiang River has been substantially degraded, posing a considerable threat to the local aquatic ecosystem. Zhang et al. [14] detected 29 of the 30 target PPCPs in the Lipu River basin. Dodgen et al. [12] reported that PPCPs were present in 89% of groundwater samples collected from karst terrain in the United States. The network of subsurface channels characteristic of karst terrain can directly connect surface water with underlying aquifers, enabling pollutants to migrate rapidly into groundwater via preferential infiltration [15].
Despite the aforementioned findings, comprehensive regional investigations into PPCP transport in karst tourist areas and river–groundwater interactions under complex hydrogeological conditions remain scarce. Principal component analysis (PCA) is a multivariate statistical technique widely employed for source apportionment of environmental pollutants. By quantifying pollutant compositions and their relative contributions, PCA offers substantial advantages in identifying pollution origins and has been extensively applied across diverse contaminant classes. For example, Tang et al. [16] employed PCA to identify the principal components of per- and polyfluoroalkyl substances (PFASs) in surface soils of Ningbo City, attributing them primarily to fluorochemical industry emissions, domestic wastewater discharge, atmospheric deposition and electrochemical fluorination processes. Similarly, Khan et al. [2] applied PCA to investigate PPCP sources in groundwater used for drinking in Pakistan, concluding that domestic wastewater discharge was the dominant influencing factor. Nevertheless, existing PPCP source-apportionment studies have typically focused on individual water bodies, rarely elucidating the broader fate and distribution of pollutants across entire river basins and groundwater systems. To address this knowledge gap, the present study adopts a PCA-based, multi-matrix source-apportionment approach to identify the origins of PPCPs and their environmental fate within the Lijiang River Basin.
River water and groundwater samples were collected throughout the Lijiang River Basin and analysed for 43 target PPCPs. The specific objectives were to: (1) determine PPCP concentrations in river water and groundwater; (2) characterise their spatial distribution patterns; (3) examine relationships between PPCP levels and water quality parameters; (4) identify principal pollutant components and infer their sources using principal component analysis (PCA); and (5) assess ecological risks for river water and health risks for groundwater. These findings advance our understanding of PPCP contamination in karst river basins and inform the development of evidence-based water quality management strategies. Furthermore, they provide baseline data for comparative assessments of PPCP pollution in analogous karst landscapes.
2. Materials and Methods
2.1. Sampling Locations and Sample Collection
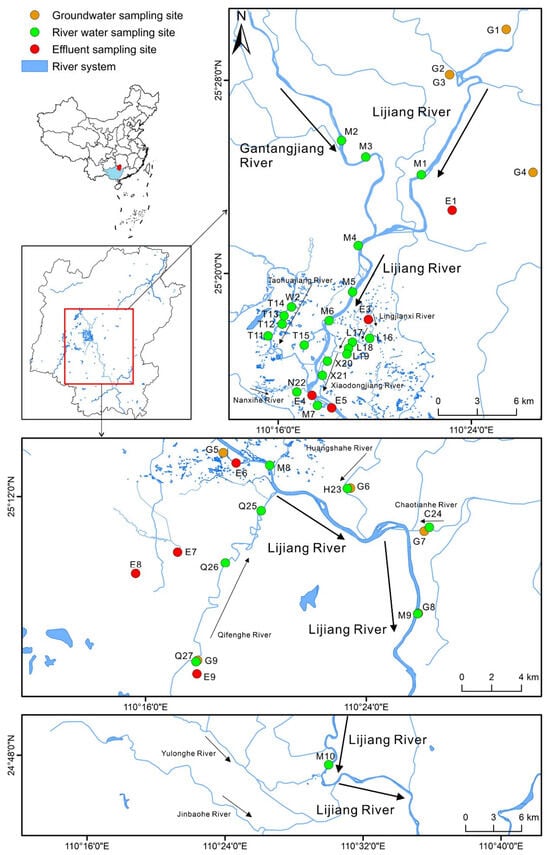
Sampling sites were selected to capture pollution sources and key reaches along the main stem and tributaries of the Lijiang River. A total of 45 samples were collected in April 2023. Nine effluent sampling sites (E1–E9) were located downstream of wastewater treatment plants, near hospitals and industrial parks, and in river reaches receiving livestock and poultry manure discharges. Within the basin, 10 main-stem (M1–M10), 17 tributary and 9 groundwater (G1–G9) sampling sites were established. Detailed coordinates for each site are provided in Table S1, and the spatial distribution of river and groundwater sampling sites is shown in Figure 1. Water samples (500 mL) for PPCP analysis were collected in amber glass bottles to which 2.5 mL of methanol was added. Additionally, water samples (1 L) were collected for routine water quality parameter analysis. All samples were stored at low temperature and transported to the laboratory on the same day for further processing. Given the limited number of sampling sites and restricted sampling period, a snapshot sampling approach was adopted. This resulted in an insufficient number of replicate samples, precluding the construction of confidence intervals to quantify uncertainty. Furthermore, the study is subject to limitations associated with tourism activity and seasonal precipitation variability; nevertheless, the results remain representative.
Figure 1.
Distribution map of effluent, river, and groundwater sampling points.
2.2. Reference Standards and Reagents
2.3. Sample Preparation and Instrumental Analysis
A portable multi-functional water quality analyzer (Fort Collins, CO, USA) measured routine parameters at each sampling point, including pH, electrical conductivity (EC), dissolved oxygen (DO), oxidation-reduction potential (ORP), and total dissolved solids (TDS). Collected water samples were transported to the laboratory for analysis of total organic carbon (TOC), chemical oxygen demand (COD), nitrite nitrogen (NO2-N), ammonia nitrogen (NH3-N), nitrate nitrogen (NO3-N), total phosphorus (TP), total nitrogen (TN), and permanganate index (CODMn).
Spiked recovery experiments were conducted to validate the analytical method for PPCPs in water samples. Details of the key instruments and reagents are provided in Table S4. For sample preparation, water samples were filtered through membrane filters, fortified with 50 ng of surrogate standard, amended with Na2EDTA, and adjusted to the appropriate pH using dilute hydrochloric acid. HLB solid-phase extraction (SPE) cartridges were conditioned with 6 mL of methanol followed by 6 mL of deionised water. After sample loading, the cartridges were washed with deionised water and dried under vacuum to remove residual moisture. Target compounds were eluted with 5 mL of methanol. The eluate was evaporated to near dryness under a gentle nitrogen stream, and the residue was reconstituted in methanol and 0.1% (v/v) formic acid in water. The solution was filtered through a 0.22 μm membrane filter prior to instrumental analysis. A 50 ng aliquot of ciprofloxacin-d8 (CIP-d8) internal standard was added to the injection vial and vortex-mixed(Bohemia, NY, USA) to ensure homogeneity.
Sample analysis was performed by ultra-performance liquid chromatography–tandem mass spectrometry (UPLC–MS/MS)(Milford, MA, USA). Chromatographic separation was achieved on an ACQUITY UPLC BEH C18 column (2.1 × 100 mm, 1.7 μm) with electrospray ionisation (ESI) in positive mode using multiple reaction monitoring (MRM). The mobile phase consisted of 0.1% (v/v) formic acid in ultrapure water (eluent A) and methanol (eluent B). The column temperature was maintained at 30 °C, the injection volume was 5 μL and the flow rate was 0.25 mL min−1. The mass spectrometer was operated with the following parameters: capillary voltage, 3.5 kV; ion source temperature, 150 °C; desolvation temperature, 600 °C; desolvation gas flow, 1000 L h−1; cone gas flow, 50 L h−1; and cone voltage, 15 V. The gradient elution programme, retention times, mass spectrometric parameters, calibration curves, limits of detection (LODs) and limits of quantification (LOQs) are detailed in Tables S5–S7.
2.4. Risk Assessment
Ecological risks were quantified using the risk quotient (RQ) method. Risks were categorised into four levels: RQ < 0.01 (no significant risk), 0.01 < RQ < 0.1 (low risk), 0.1 < RQ < 1 (moderate risk) and RQ > 1 (high risk). Toxicity data for the most sensitive species associated with the target PPCPs are provided in Table S8. The procedures for calculating the predicted no-effect concentration (PNEC) and the RQ for individual compounds are detailed in Equations (1) and (2), respectively.
The RQ method was employed to assess potential human health risks posed by PPCPs in the study area. This approach quantifies risk according to pollutant exposure levels across different age groups. An RQ exceeding 1 indicates significant risk; values between 0.2 and 1 warrant further assessment; and RQ values of 0.2 or below indicate negligible risk. The procedures for calculating RQ and the drinking water equivalent level (DWEL) are detailed in Equations (3) and (4), respectively.
In Equations (3) and (4), DWI denotes daily water intake (L d−1), AB represents the gastrointestinal absorption rate (assumed to be 1) and FOE denotes the exposure frequency factor (dimensionless), calculated as the ratio of annual exposure days to total days (350/365 ≈ 0.96). Corresponding body weight (BW) and DWI values are provided in Table S9.
2.5. Quality Assurance and Quality Control
The limits of detection (LODs) and quantification (LOQs) were defined as concentrations corresponding to signal-to-noise ratios of 3 and 10, respectively. For every ten field samples, quality control (QC) samples comprising one duplicate, one procedural blank and one spiked blank were analysed. All 43 target PPCPs exhibited good linearity over the concentration range of 1–400 μg/L (R2 > 0.99). Method performance and matrix effects were evaluated by spiked blank recovery tests. LODs ranged from 0.02 to 1.31 ng/L and LOQs from 0.07 to 4.37 ng/L. Recoveries for all target PPCPs exceeded 60%, with relative standard deviations (RSDs) below 20%.
2.6. Statistical Analysis
Spatial distribution maps were generated in ArcMap 10.8. Data visualisation was performed in Origin 2021. Statistical significance was assessed using SPSS 26 via the Mann–Whitney U test. Correlations between surface water and groundwater PPCP concentrations were examined using R version 4.5.3, with results presented as correlation heatmaps. Source apportionment of PPCPs in river water and groundwater was conducted using PCA plugin in Origin.
3. Results
3.1. PPCP Profiles in Various Waters
The concentrations of detected PPCPs in the Lijiang River Basin are presented in Table S11. All 43 target compounds were detected across the basin, with total concentrations (∑43PPCPs) ranging from 32.0 to 3170 ng/L and a mean concentration of 438 ng/L. Detection frequencies (DFs) of CAF, 1,7-DIM, APAP, TMP, PEN-G and CIP exceeded 90%, indicating their widespread occurrence throughout the watershed. According to Table S11, concentrations of ∑43PPCPs in effluent were 68.6–3170 (734) ng/L, approximately twice those in river water 53.2–1400 (416) ng/L and five times those in groundwater 32.0–505 (179) ng/L (U test, p > 0.05). Due to factors such as limited sample size, spatial variability in contaminant concentrations within the study area and intermittent contaminant input, noticeable numerical differences in mean values were observed; however, the results have not yet attained statistical significance. Nevertheless, the detected concentrations in effluents were lower than those in Brazilian hospital effluent (1.17–213 µg/L) [17] (Table S10), probably indicating that, compared with Brazil’s arid climate and limited river flow, Guilin has abundant rainfall and a denser river network, with plentiful river water effectively diluting pollutants.
3.1.1. Effluent
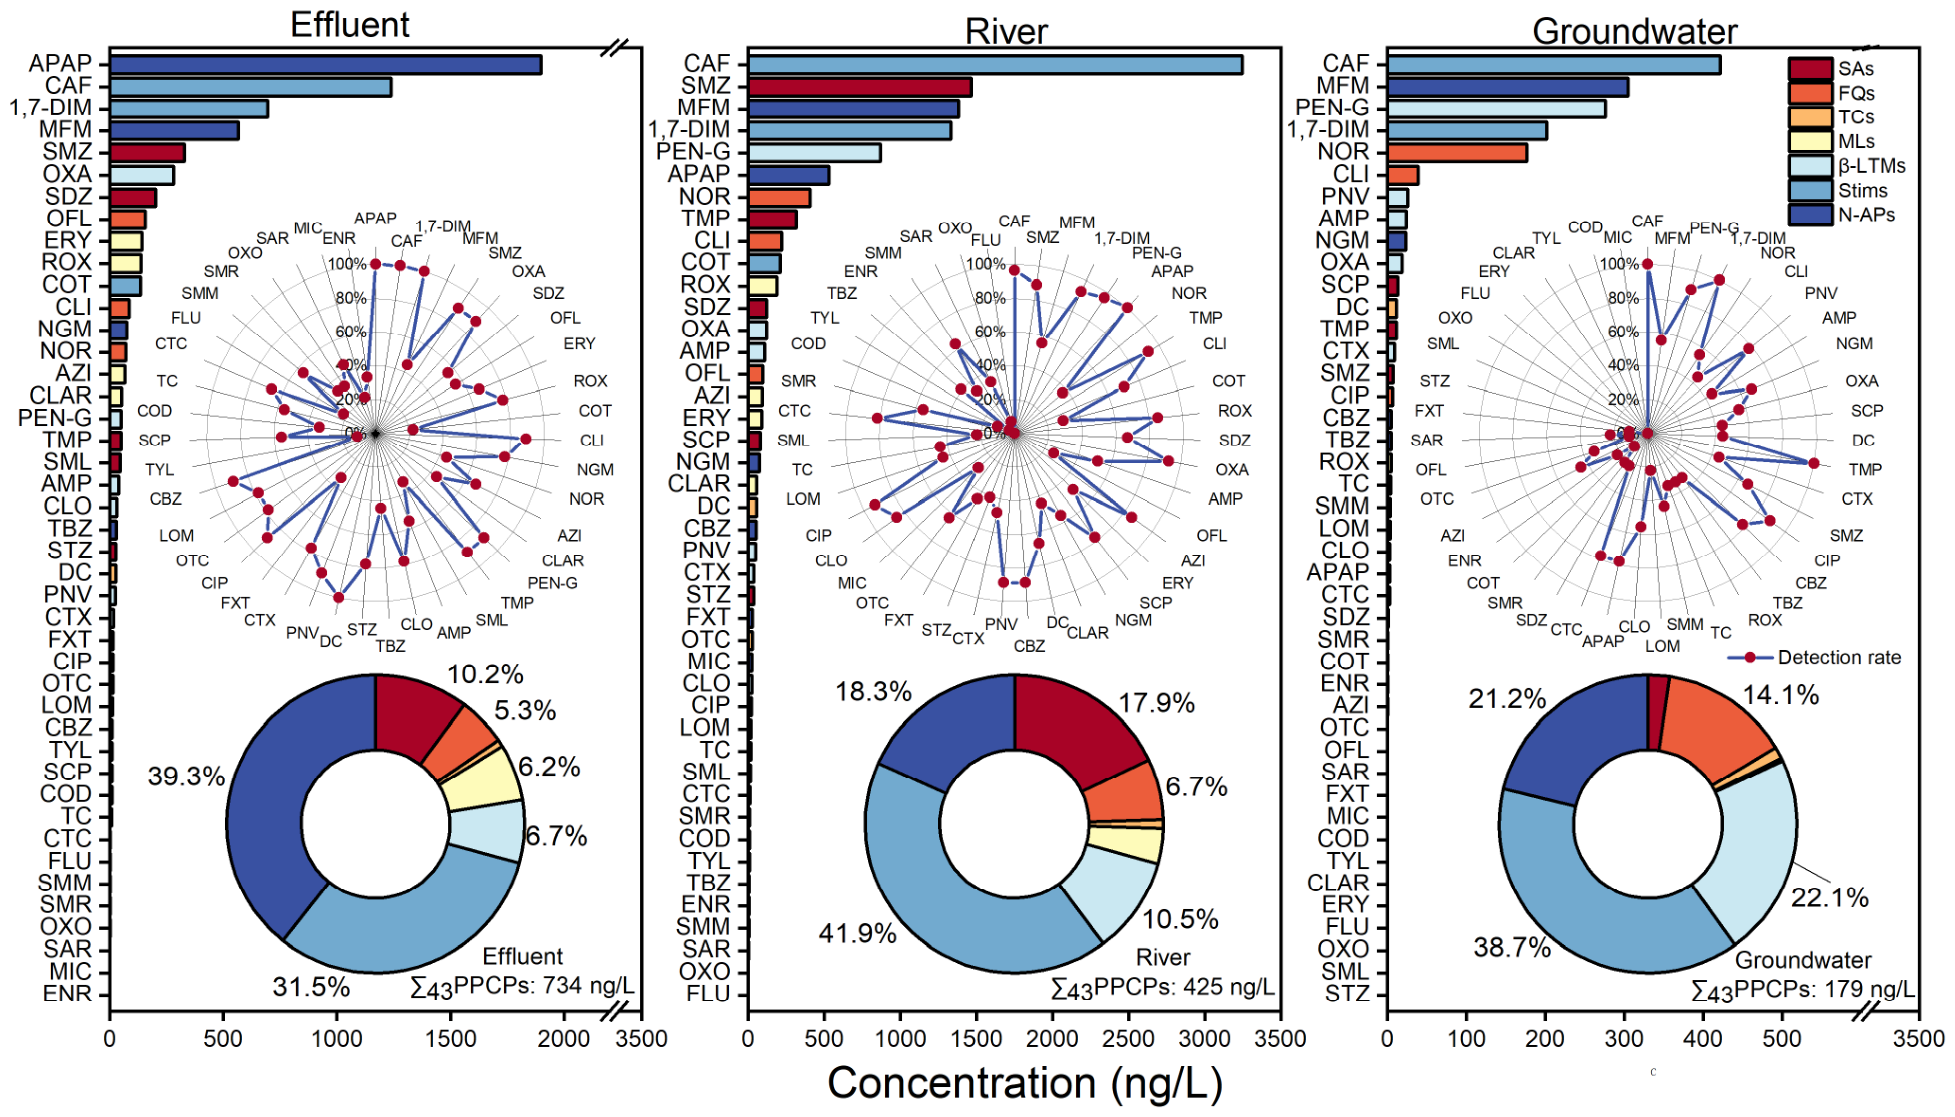
As shown in Figure 2 and Table S10, PPCPs were categorised into seven main types according to their chemical structural formula, while their proportions in effluent decreased as N-APs (39.3%) > Stims (31.5%) > SAs (10.2%) > β-LTMs (6.74%) > MLs (6.20%) > FQs (5.27%) > TCs (0.789%).
Figure 2.
Cumulative concentrations, detection rates, and proportional distribution of 43 types of PPCPs in effluent, river, and groundwater.
Concentrations of ∑Stims in effluents were 8.79–757 (231) ng/L, with CAF and 1,7-DIM ubiquitously detected (DFs = 100%). Concentrations of CAF, 1,7-DIM and COT were 2.59–538 (138) ng/L, 1.17–235 (77.4) ng/L, and ND (Not Detected)–136 (15.1) ng/L, respectively. CAF concentrations measured herein exceeded those reported for a WWTP in Shenzhen, China (0.6–2.0 ng/L) [18] and a Vietnamese WWTP (20 ng/L) [19]. By contrast, COT concentrations were lower than those reported for urban wastewater treatment plants in Jilin Province, China (1.05–2.40 µg/L) [20]. The contrasting occurrence patterns of CAF and COT may be attributed to lifestyle differences; specifically, Guilin’s thriving tourism industry and substantial visitor numbers are associated with elevated local coffee consumption, thereby increasing CAF inputs.
Concentrations of ∑N-APs in effluents were 0.758–2140 (289) ng/L, with APAP, CBZ and NGM frequently detected (DFs > 75%). APAP and MFM concentrations were ND–473 (63.0) ng/L and ND–1660 (211) ng/L, respectively, whereas TBZ, CBZ, FXT and MIC were rarely detected (mean concentrations < 5 ng/L). APAP concentrations measured herein exceeded those reported for Italian WWTP effluent (ND–444 ng/L) but were lower than those reported for Chinese WWTP effluent (0–8300 ng/L) [21] and Chinese hospital effluent 10,076 ng/L [22]. Concentrations of ∑SAs in effluents were 0.62–321 (74.7) ng/L, with SMZ, TMP and STZ frequently detected (DFs > 75%). SDZ and SMZ concentrations were ND–147 (22.5) ng/L and ND–302 (36.7) ng/L, respectively, whereas SMR, SMM, SCP and STZ were rarely detected (mean concentrations < 5 ng/L). Concentrations of ∑β-LTMs in effluents were 8.51–275 (49.2) ng/L, with PEN-G, PNV, OXA, CTX and CLO frequently detected (DFs > 75%). OXA concentrations were ND–248 (31.3) ng/L, whereas AMP was rarely detected (mean concentrations < 5 ng/L). Concentrations of ∑MLs in effluents were ND–230 (45.5) ng/L, with ROX frequently detected (DFs > 75%). ERY and ROX concentrations were ND–62.1 (15.8) ng/L and ND–87.6 (15.2) ng/L, respectively, whereas CLAR, AZI and TYL were rarely detected (mean concentrations < 5 ng/L). Concentrations of ∑FQs in effluents were 1.98–99.3 (38.7) ng/L, with CIP, LOM and CLI frequently detected (DFs > 75%). OFL concentrations were ND–84.5 (17.4) ng/L, whereas ENR, OXO, FLU and SAR were rarely detected (mean concentrations < 5 ng/L). Concentrations of ∑TCs in effluents were 2.70–19.2 (5.80) ng/L, with DC and OTC frequently detected (DFs > 75%), whereas TC and CTC were rarely detected (mean concentrations < 5 ng/L).
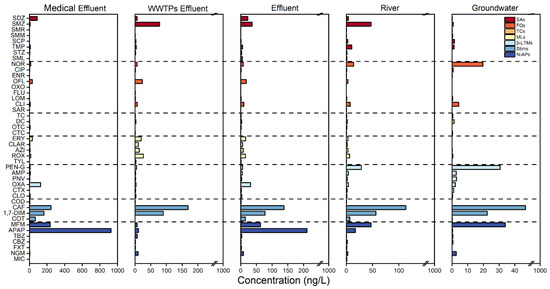
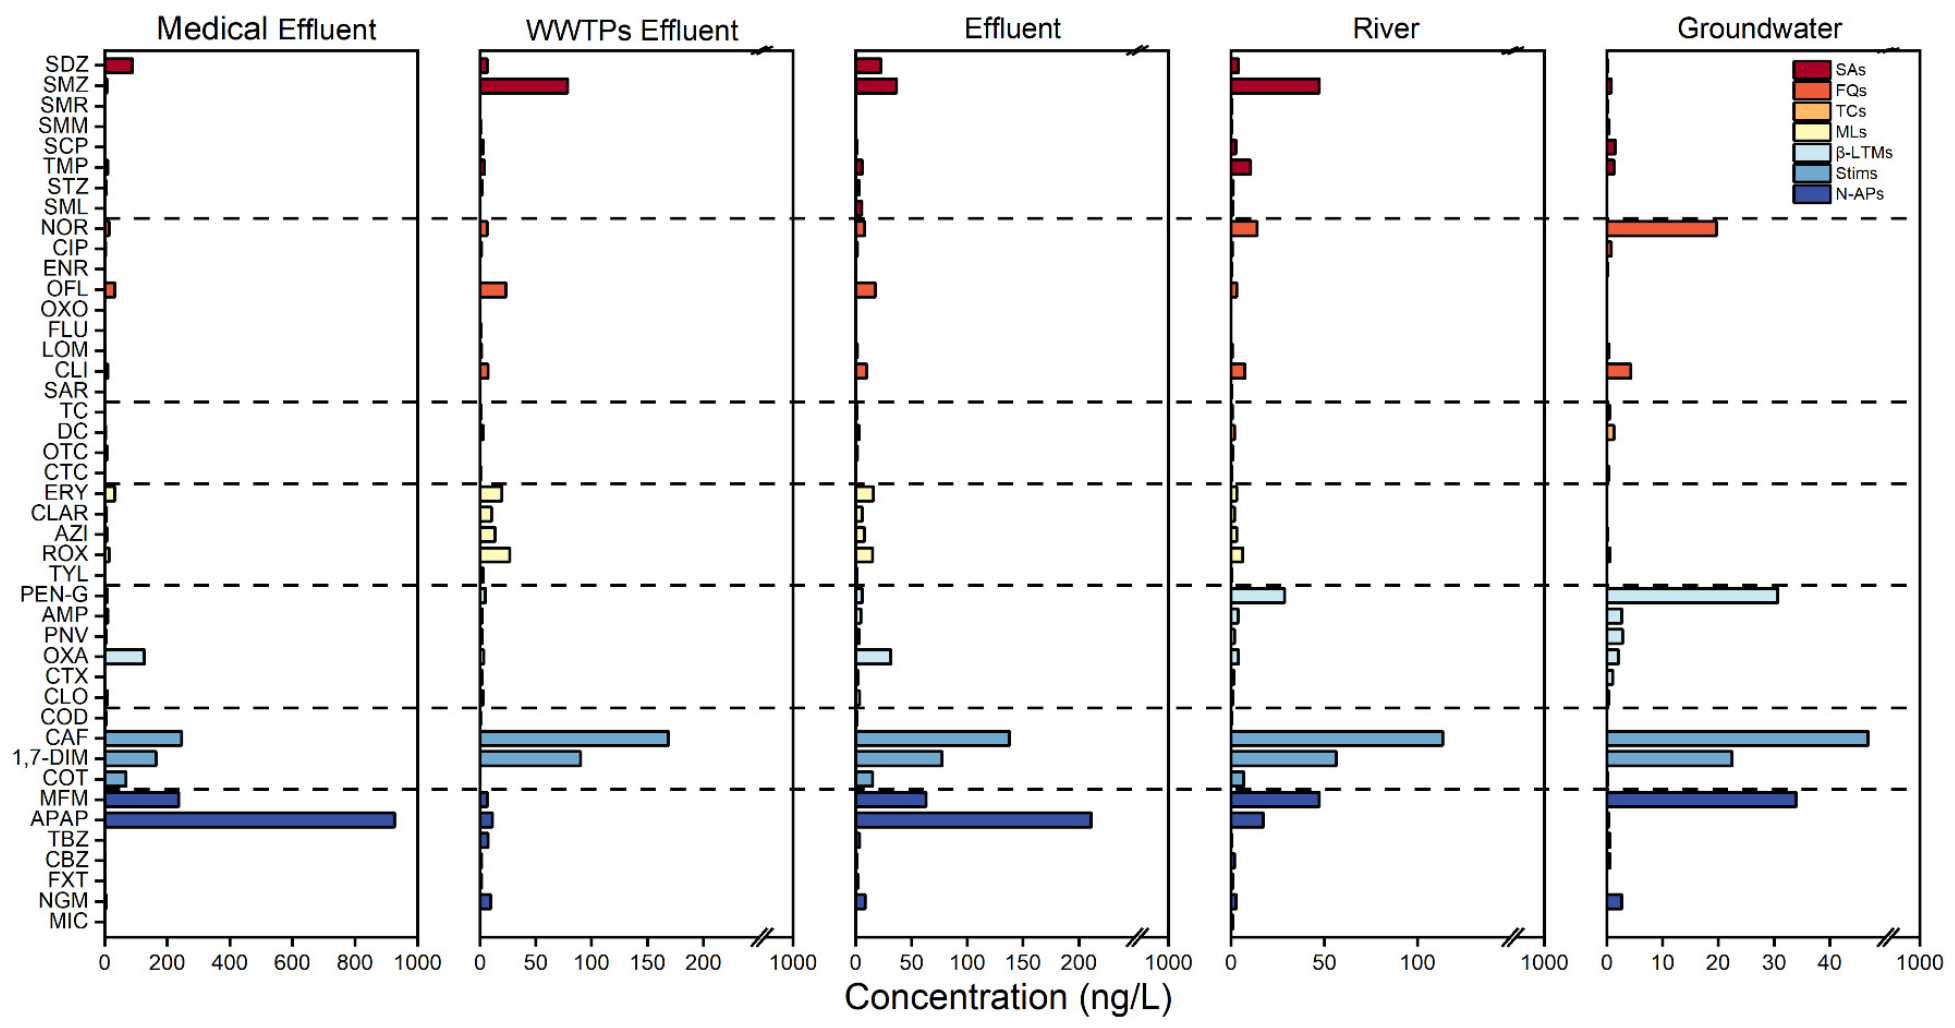
Medical effluent and WWTP effluent represent the primary sources (Figure 3 and Table S11), whereas industrial and aquaculture effluents contribute to a lesser extent. Elevated concentrations of APAP, CAF, MFM, 1,7-DIM and OXA were identified in medical effluent, with mean concentrations of 926, 247, 237, 164 and 126 ng/L, respectively. APAP exhibited the highest concentration, attributable to its extensive use [23]. CAF also showed elevated levels, reflecting its prevalence in numerous pharmaceuticals [24]. MFM is a first-line medication for type II diabetes [25], whereas OXA is a penicillinase-resistant penicillin antibiotic widely used in hospital settings. A comparable pattern has been reported for a hospital in southeastern Brazil [26]. Guilin City hosts a considerable number of medical institutions (5066 facilities), with an estimated daily effluent discharge of approximately 6830 tons. (2.5) Based on the mean PPCP concentration in medical wastewater measured in this study (1900 ng/L), together with the estimated daily discharge volume derived from other sources, the daily PPCP load discharged into the Lijiang River Basin is estimated at approximately 13.0 g, exerting considerable pressure on the aquatic ecosystem.
Figure 3.
Average concentration map of 43 PPCPs in medical effluent, WWTP effluent, effluent, river, and groundwater.
As shown in Figure 3, CAF (169 ng/L) was the dominant contaminant in WWTP effluent, with concentrations approximately twice those of 1,7-DIM (90.3 ng/L) and SMZ (78.4 ng/L). Both compounds were present at lower concentrations than in medical effluent, likely owing to dilution by domestic sewage. CAF concentrations exceeded those reported for Polish WWTP effluent 0.08 µg/L [27] and Australian WWTP effluent 113 ng/L [28]. CAF has been detected at elevated levels in various tourist cities, including Aswan, Egypt 23.7 µg/L [29], and Sydney, Italy (1.20–5.80 µg/L) [30]. Furthermore, CAF concentrations vary markedly between off-peak and peak tourist seasons within the same city. For instance, in Sanya, Hainan, China, CAF levels increased from 1.47–3.98 µg/L during the off-season to 0.06–0.19 mg/L during the peak season [31], indicating that tourism strongly influences PPCP sources and distribution. According to municipal statistics, Guilin’s average daily effluent discharge is approximately 802,200 tonnes. Combined with the CAF concentration of 169 ng/L measured herein, the estimated daily CAF load discharged into receiving waters is approximately 136 g.
3.1.2. River
As shown in Figure 2 and Table S12, the concentrations of ∑43PPCPs in the river were higher than those in the Hong Kong river (7.90–114 ng/L) [32]. The proportions of the seven main types decreased as Stims (41.9%) > N-APs (18.3%) > SAs (17.9%) > β-LTMs (10.6%) > FQs (6.69%) > MLs (3.79%) > TCs (0.961%), which were different from those in effluents, where N-APs (39.3%) were dominant.
Concentrations of ∑Stims in river water were 3.08–887 (178) ng/L, with CAF and 1,7-DIM frequently detected (DFs > 75%) and COD rarely detected (DFs < 25%). CAF and 1,7-DIM concentrations were ND–632 (120) ng/L and ND–333 (49.7) ng/L, respectively, whereas COD was rarely detected (mean concentration < 5 ng/L). CAF concentrations measured herein exceeded those reported for Dalong Lake, Xuzhou, China (71.0 ng/L) [33] and the Yangtze River, China (20.0 ng/L) [34].
Concentrations of ∑N-APs in river water were 0.36–363 (75.9) ng/L, with APAP and NGM ubiquitously detected (DFs = 100%) and CBZ frequently detected (DFs > 75%). APAP and MFM concentrations were ND–306 (55.2) ng/L and 0.36–219 (19.7) ng/L, respectively, whereas TBZ, FXT and MIC were rarely detected (mean concentrations < 5 ng/L). CAF concentrations measured herein were lower than those reported for Lake Constance, Germany (102 ng/L) [35]. Concentrations of ∑SAs in river water were 0.28–429 (75.9) ng/L, with SMZ, SCP and TMP frequently detected (DFs > 75%), whereas SML was rarely detected (DFs < 25%). SMZ concentrations were ND–398 (54.3) ng/L, whereas SDZ, SMR, SMM, STZ and SML were rarely detected (mean concentrations < 5 ng/L). SMZ concentrations measured herein exceeded those reported for the Liaohe River basin (6.70–173 ng/L) [36], and the Baisha River, Qingdao, China (8.20 ng/L) [37]. Concentrations of ∑β-LTMs in river water were 8.62–321 (44.8) ng/L, with PEN-G, PNV, OXA and CLO frequently detected (DFs > 75%). PEN-G concentrations were ND–319 (32.3) ng/L, whereas AMP and CTX were rarely detected (mean concentrations < 5 ng/L). Concentrations of ∑FQs in river water were 0.37–94.2 (28.4) ng/L, with CIP frequently detected (DFs > 75%) and OXO rarely detected (DFs < 25%). NOR concentrations were ND–91.4 (15.1) ng/L, whereas ENR, OFL, OXO, LOM and SAR were rarely detected (mean concentrations < 5 ng/L). Concentrations of ∑MLs in river water were ND–63.1 (16.1) ng/L, with AZI and ROX frequently detected (DFs > 75%) and TYL rarely detected (DFs < 25%). ERY, CLAR and TYL were rarely detected (mean concentrations < 5 ng/L). Concentrations of ∑TCs in river water were ND–17.9 (4.08) ng/L, with CTC frequently detected (DFs > 75%), whereas TC, DC and OTC were rarely detected (mean concentrations < 5 ng/L).
3.1.3. Groundwater
As shown in Figure 2 and Table S13, the concentrations of ∑43PPCPs in groundwater were higher than those in the groundwater of the Jazan region of Saudi Arabia (0.001–0.02 µg/L) [38]. The proportions of the seven main types decreased as Stims (38.7%) > β-LTMs (22.1%) > N-APs (21.2%) > FQs (14.1%) > SAs (2.33%) > TCs (1.22%) > MLs (0.34%).
Concentrations of ∑Stims in groundwater were 0.30–278 (69.4) ng/L, with CAF and 1,7-DIM ubiquitously detected (DFs = 100%) and COT rarely detected (DFs < 25%). CAF and 1,7-DIM concentrations were 0.17–160 (46.8) ng/L and 0.13–118 (22.4) ng/L, respectively, whereas COT was rarely detected (mean concentration < 5 ng/L).
Concentrations of ∑β-LTMs in groundwater were 11.2–134 (39.6) ng/L, with PEN-G and PNV frequently detected (DFs > 75%). PEN-G concentrations were ND–128 (30.6) ng/L, whereas AMP, OXA, CTX and CLO were rarely detected (mean concentrations < 5 ng/L). PEN-G concentrations measured herein exceeded those reported for groundwater in rural North Carolina (<LOD) [39]. Concentrations of ∑N-APs in groundwater were 1.97–138 (38.0) ng/L, with APAP and CBZ frequently detected (DFs > 75%) and FXT rarely detected (DFs < 25%). MFM concentrations were ND–135 (33.9) ng/L, whereas TBZ and NGM were rarely detected (mean concentrations < 5 ng/L). MFM concentrations measured herein exceeded those reported for groundwater in northern China (5–25 ng/L) [40]. Concentrations of ∑FQs in groundwater were 0.797–59.3 (25.3) ng/L, with CIP frequently detected (DFs > 75%) and ENR, OFL, LOM and SAR rarely detected (DFs < 25%). NOR concentrations were 0.36–42.7 (19.6) ng/L, whereas CLI was rarely detected (mean concentration < 5 ng/L). Concentrations of ∑SAs in groundwater were 0.08–22.8 (4.18) ng/L, with TMP frequently detected (DFs = 75%) and SDZ and SMR rarely detected (DFs < 25%). SMZ, SMM and SCP were rarely detected (mean concentrations < 5 ng/L). Concentrations of ∑TCs in groundwater were ND–4.79 (2.18) ng/L, with CTC frequently detected (DFs > 75%), whereas TC, DC and OTC were rarely detected (mean concentrations < 5 ng/L). Concentrations of ∑MLs in groundwater were ND–3.03 (0.61) ng/L, with AZI and ROX rarely detected (mean concentrations < 5 ng/L).
Surface karst layers, soil adsorption, biodegradation and comparatively long groundwater residence times act collectively to attenuate PPCP concentrations during percolation, resulting in low pollutant levels in groundwater. Furthermore, the distinctive channel–matrix dual-medium structure of the karst aquifer governs pollutant migration behaviour. Karst geological conditions regulate seepage pathways, pollutant retention times and attenuation efficiency, thereby fundamentally influencing PPCP migration between surface water and groundwater, as well as their spatial distribution.
Table S14 presents pollution levels of various water bodies in other regions.
3.2. Spatial Distribution Profiles
3.2.1. River
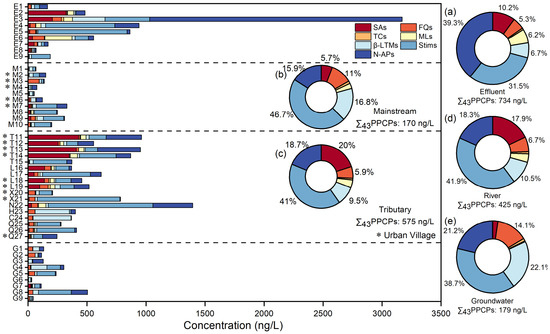
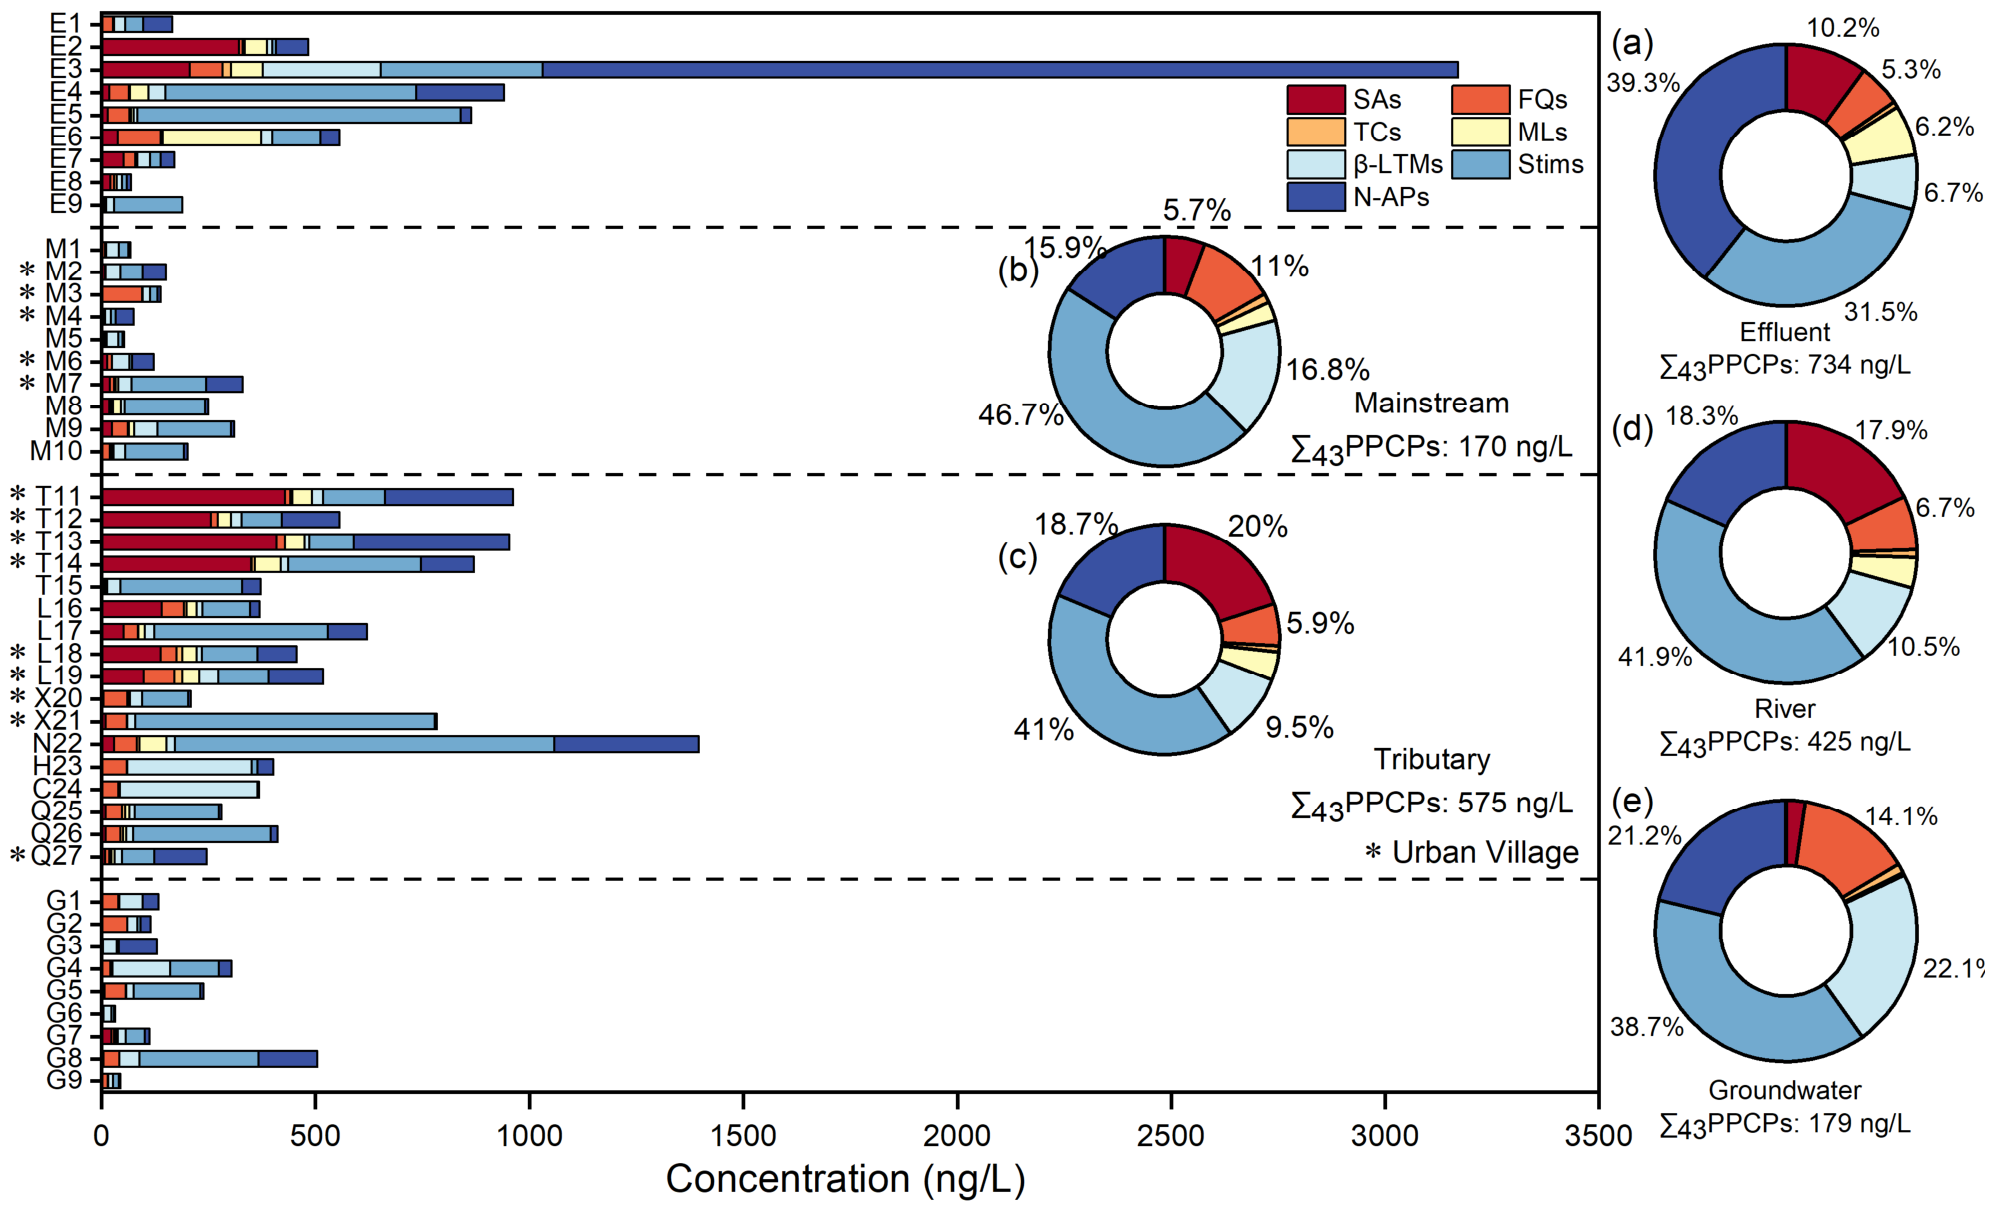
As shown in Figure 4, PPCP concentrations in the main river (53.1–330 (169) ng/L) and groundwater (32.0–505 (179) ng/L) were comparable, with stimulants being the dominant compounds in both matrices; these concentrations were lower than those in tributaries (209–1320 (575) ng/L). As the groundwater samples were collected primarily near tributaries, this pattern may indicate either that PPCP attenuation during infiltration from river to groundwater was the dominant process, or that PPCPs migrated freely from the surface to the subsurface. It has been demonstrated that karst topography provides direct and rapid seepage pathways for pollutants, facilitating their migration from river to groundwater [41]. The dominant components varied significantly among tributaries: SAs predominated in the Taohua River (T11–T15), whereas stimulants predominated in the lower reaches of the Xiaodongjiang (X21) and Nanxi River (N22). Based on location data, sampling points T11–T14 are located near E2, downstream of a WWTP serving a densely populated urban village. The presence of high concentrations and diverse PPCP types poses substantial treatment challenges. The primary pollutant, SMZ, exhibits low removal efficiencies at WWTPs, typically ranging from 20% to 74%; consequently, SMZ concentrations remain elevated in effluent [42]. In contrast, T15 is located near the main river channel, where high flow velocities promote dilution and dispersion of pollutants. Compared with the Taohua River (T11–T15) and other urban village areas, Lingjian Creek (L16–L19) and the Qifeng River (Q25–Q27) are less densely populated, resulting in lower PPCP levels. Studies indicate that, within the same city and river system, a population surge alone can increase pharmaceutical concentrations by two orders of magnitude [30]. Sampling points X21 and N22 are located upstream of E4, near a large hospital and densely populated residential areas that serve as significant sources of CAF and APAP [43]. The primary pollutants at these sites are CAF and its metabolite 1,7-DIM, which are typical chemical tracers of urban river pollution [44]. Medical institutions discharge substantial volumes of pharmaceutical effluent, complicating sewage treatment processes. Sampling points H23 and C24 are located near agricultural fields used for livestock farming. PEN-G, the primary compound detected, is widely used in animal husbandry for disease prevention and control [45].
Figure 4.
Concentrations of seven categories of PPCPs, and the proportion of PPCPs in effluent (a), mainstream and tributary river bodies (b,c), rivers (d), and groundwater (e); the dash lines indicate the boundaries between different bodies of water.
Spatially, tributaries consistently exhibited higher PPCP concentrations than the mainstream, consistent with findings reported by Yu et al. [14] for the middle–lower reaches of the Yellow River (Henan section). This suggests that PPCP distribution is influenced by human settlement density [14]. This may be attributable to the fact that, although tributary areas support larger, more dispersed populations, elevated PPCP usage and inadequate wastewater treatment facilities result in higher concentrations [46]. Furthermore, the mainstream’s faster flow velocity and larger water volume enable rapid dilution of PPCPs, whereas tributaries’ slower flow and smaller volume result in poorer dilution, facilitating pollutant accumulation [47].
PPCP concentrations in the upper reaches (T1–T6) of the Lijiang River main stem were 53.2–150 (101) ng/L, whereas those in the lower reaches (T7–T10) were 197–330 (330) ng/L (Mann–Whitney U test, p > 0.05). Factors such as limited sample size, significant spatial heterogeneity in pollutant concentrations within the study area and intermittent pollutant inputs may explain why, despite clear numerical differences in mean values, the results have not yet attained statistical significance. PPCP concentrations in the lower reaches of the Lijiang River consistently exceeded those in the upper reaches. As a convergence zone, the downstream section receives PPCP inputs from upstream waters and tributaries. Similar phenomena have been observed in the Greater Miami River, United States (Miami Conservancy District, reported by Ekberg, M.; Pletsch, B. in 2011) and the Lipu River, China [48]. Furthermore, stimulant concentrations in downstream waters were elevated relative to upstream sections, reflecting a progressive increase in PPCP loads associated with urbanisation [49].
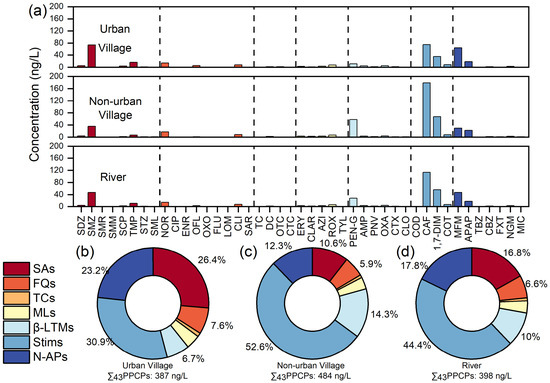
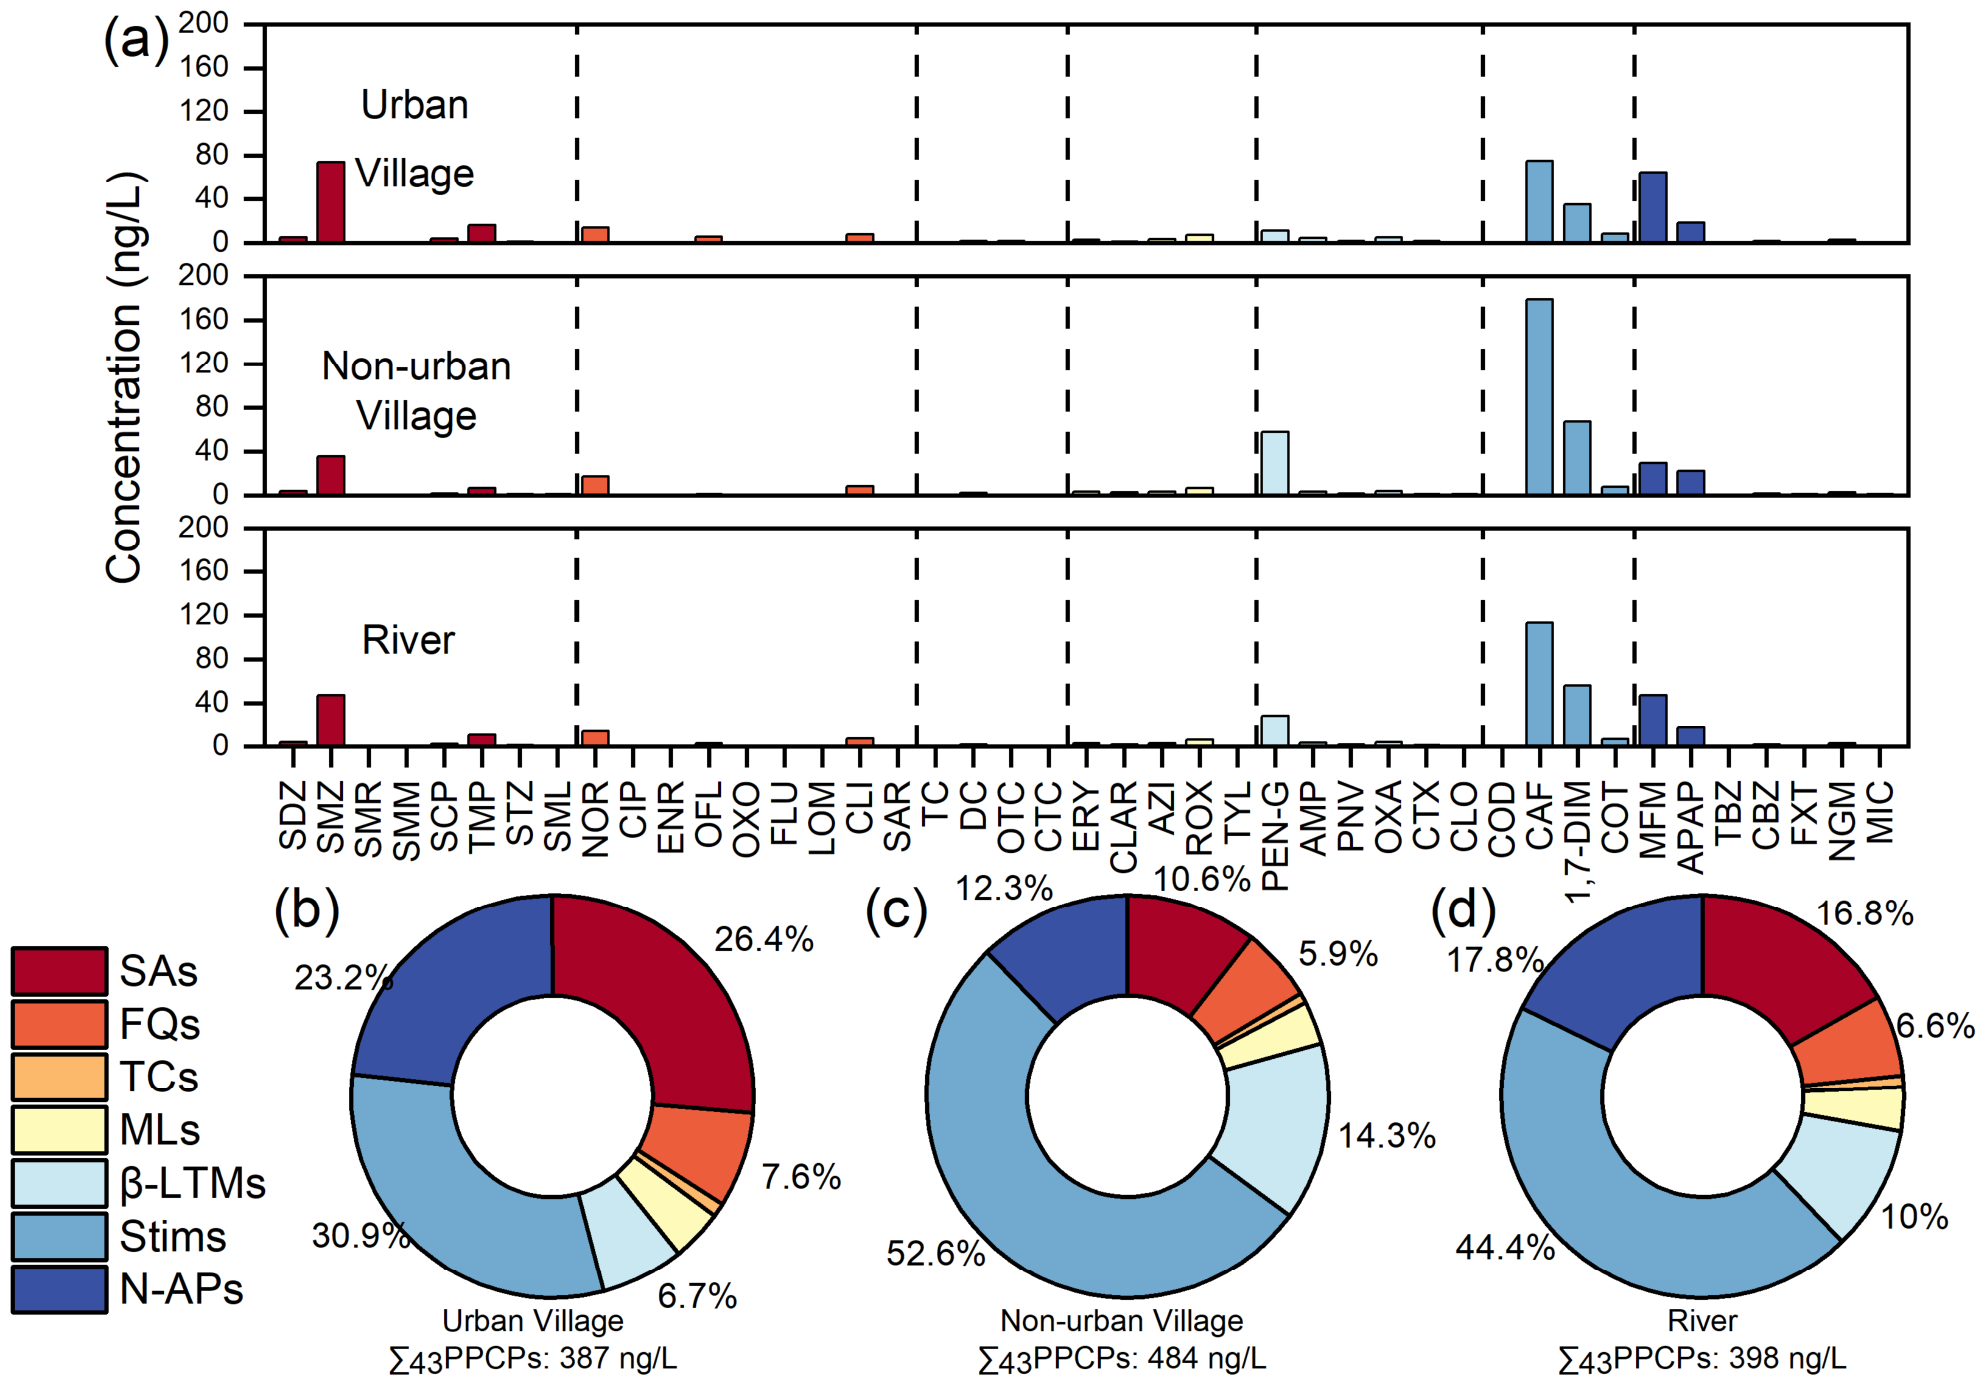
As shown in Figure 5b–d, the proportional contributions of SAs (26.4%) and N-APs (23.2%) in urban villages exceeded those in non-urban villages (10.6% and 12.3%, respectively) (Mann–Whitney U test, p > 0.05). Figure 5a indicates that SMZ is the predominant active ingredient in SAs, whereas N-APs are dominated by MFM. Both compounds are commonly used in daily medication and exhibit high consumption rates. Following administration, they are excreted and enter the sewage system. Urban villages are characterised by high population densities, contributing to elevated water pollution. Research has demonstrated a positive correlation between population density and water pollution indicators [50]. Coupled with relatively underdeveloped infrastructure, this places considerable pressure on sewage treatment systems. Conversely, the proportional contributions of β-LTMs (6.7%) and Stims (14.3%) in urban villages were lower than those in non-urban villages (30.9% and 52.6%, respectively). Figure 5a reveals that β-LTMs are dominated by PEN-G, whereas Stims are dominated by CAF. PEN-G is predominantly used in livestock farming, which is more prevalent in areas with dispersed populations and less common in urban villages, resulting in lower concentrations in non-urban village water bodies. Research indicates that CAF concentrations correlate closely with the intensity and patterns of human activity [51]. Non-urban village areas feature substantial pedestrian traffic and well-developed commercial sectors, including restaurants and hotels, where caffeinated beverages such as coffee and energy drinks are widely consumed. In contrast, urban villages primarily serve residential functions and exhibit a comparatively simple beverage consumption profile, with significantly lower commercial caffeine consumption than non-urban village areas.
Figure 5.
Detection concentrations of 43 PPCPs in urban villages, non-urban villages, and river (a) concentration; proportion of different types of PPCPs by concentration in Urban Villages; (b) in Non-Urban Villages (c); in River (d), the dash lines indicate the boundaries between different types of PPCPs.
3.2.2. Groundwater
As shown in Figure 4, PPCP concentrations and composition varied among groundwater sampling locations. Stimulants constituted a higher proportion at sites G4, G5 and G8 than at other sites. Site G4 is located near a village, G5 is adjacent to fish ponds and farmland, and G8 is situated close to an upstream petrol station. These findings suggest that stimulant occurrence is strongly linked to intensive human activity in the vicinity of the sampling sites. At G8, elevated levels of N-APs were observed, with MFM identified as the predominant compound. MFM is a widely used medication for blood glucose control in diabetes [52]. High concentrations of MFM were detected not only at G8 but also at several sewage outfalls and river sampling points, indicating ongoing dissemination of this pollutant from its source into groundwater. MFM is extensively used and is not metabolised by the human body, being excreted almost entirely unchanged in urine and faeces [53]. Its high water solubility prevents retention or deposition in soil, facilitating its migration and dispersion within aquatic environments. Additionally, PPCP concentrations at G8 exceeded those at the adjacent M9 site. Similar patterns were reported by Huang et al. [54] in southwest China, who speculated that this may be attributable to the high permeability of karst terrain, which allows surface runoff to rapidly infiltrate into groundwater via fissures or conduits. Although groundwater recharge is efficient in such settings, the self-purification capacity is limited, and surface water remains vulnerable to dilution and degradation processes.
3.3. Interrelationship
To determine the water quality parameters of the Lijiang River (pH, EC, DO, ORP, TOC, COD, TDS, NO2-N, NH3-N, NO3-N, TN, TP, and CODMn) on PPCPs distribution, this study conducted Pearson correlation analyses in Figures S1–S4 and redundancy analysis (RDA) on standardized PPCPs concentration data and environmental factor data. Specific values are presented in Tables S15–S17.
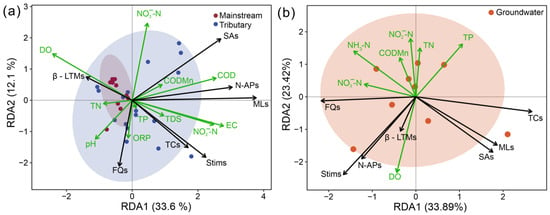
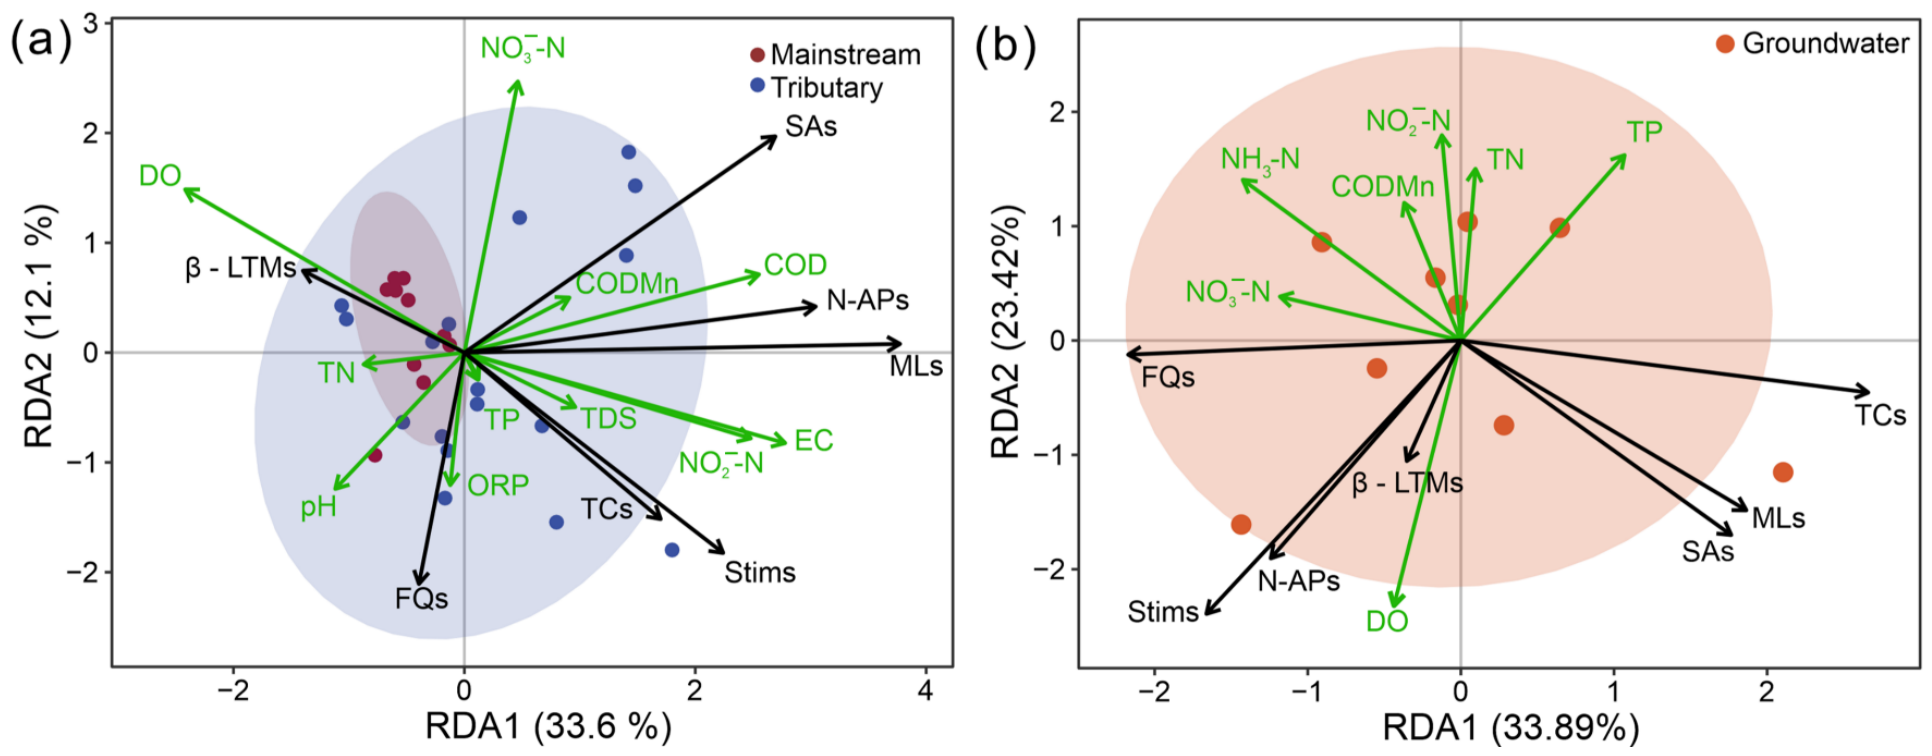
The results for river water are presented in Figure 6a and Table S18. RDA1 explained 33.6% of the variance, while RDA2 explained 12.1%. Collectively, the first two axes accounted for approximately 45.7% of the variance, effectively reflecting the relationships between antibiotics and water quality parameters, as well as the distribution patterns of the samples. SAs exhibited a significant positive correlation with COD (R2 = 0.64, p < 0.01). TCs showed significant positive correlations with EC and NH3-N (R2 = 0.52–0.72, p < 0.01). MLs demonstrated significant positive correlations with NH3-N, NO2-N, COD, TOC and EC (R2 = 0.51–0.62, p < 0.01). N-APs exhibited a significant positive correlation with NO2-N (R2 = 0.56, p < 0.01), indicating that some river sections serve as accumulation zones for nitrite nitrogen, organic pollutants and salinity-related contaminants. The source of these pollutants may be domestic sewage discharge, as tributaries typically receive more diffuse inputs within a watershed. Migration and consistency in pollution sources jointly influence the composition of PPCPs in water bodies [55]. DO exhibited significant negative correlations with TCs and MLs (R2 = −0.54 to −0.57, p < 0.01), consistent with findings reported elsewhere [56]. This may result from high DO concentrations oxidising and inactivating TCs [57]. Main-stem samples clustered in the negative direction of the RDA1 axis and showed positive correlations with β-LTMs, potentially linked to discharges of medical effluent and domestic sewage (containing antibiotic residues) along the main stem. Furthermore, β-LTMs exhibited varying degrees of positive correlation with DO, pH and TN, suggesting that alkaline or highly oxidising conditions may promote their accumulation.
Figure 6.
Redundancy analysis diagram of mainstream, tributary, and environmental factors (a); groundwater and environmental factors (b).
Groundwater results are presented in Figure 6b and Table S19. RDA1 explained 33.89% of the variance, whilst RDA2 explained 23.42%. Collectively, the first two axes accounted for approximately 57.31% of the variance. These axes effectively captured the relationships between antibiotics and water quality parameters, as well as the distribution patterns of the samples. PPCPs clustered negatively along the RDA2 axis and exhibited varying degrees of positive correlation with DO. This may stem from oxidation driven by elevated dissolved oxygen levels, which maintain specific PPCP forms and result in detectable concentrations that correlate positively with dissolved oxygen [58]. The correlations between various PPCPs in groundwater and water quality parameters differed from those observed in river water. This discrepancy may be attributable to the distinctive karst topography of the Lijiang River Basin, where groundwater rich in mineral ions influences PPCP concentrations and composition [7]. This indicates that water body type is a significant contextual factor contributing to variations in PPCP pollution. To gain a more accurate understanding of PPCP concentrations and their impact on water quality in the study area, comprehensive consideration of multiple environmental factors, together with detailed field investigations and laboratory analyses, is required for further research.
3.4. Component Characteristics
To determine the characteristics of the major components of PPCPs in rivers within the study area, this study used principal component analysis (PCA) to classify these major components. Prior to analysis, the KMO and Bartlett’s sphericity tests were conducted to confirm the applicability of PCA, ensuring the scientific validity of the final results. Bartlett’s sphericity significance value for river was 0.000 (p < 0.05), and for groundwater, it was 0.017 (p < 0.05), indicating that these indicators were suitable for PCA.
PCA effectively eliminates multicollinearity among pollutant variables and, by grouping homogeneous pollutants based on factor loadings, provides a preliminary distinction between pollution source types.
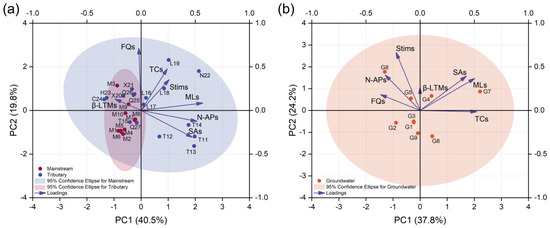
The PCA results for river water are presented in Figure 7a. As indicated in Table S20, the first three principal components (PCs) for river water had eigenvalues greater than 1, accounting for 75.74% of the cumulative variance. PC1 and PC2 individually explained 40.46% and 19.84% of the total variance, respectively, collectively accounting for 60.30%. The dominant components in PC1 were MLs, N-APs and SAs. Concentrations of these three PPCP categories were higher in tributaries than in the main stem, likely due to denser human populations and higher PPCP usage in tributary areas. As shown in Figure 2, ROX was the dominant ML component in river water; it is commonly used to treat respiratory and otolaryngological infections [59], and high residual concentrations are frequently detected in medical effluent. The dominant N-AP components were MFM and APAP, both common daily medications. As shown in Figure 5, concentrations in urban villages were significantly higher than in non-urban village areas, indicating that dense human habitation influences the distribution of these pharmaceuticals. The primary SA component was SMZ, which is used to treat and prevent numerous bacterial infections [60]. Furthermore, sampling points T11–T14 and L16–L19 in tributaries, located within urban villages, exhibited significantly higher SA concentrations than other river sampling points. As shown in Figure 1, a WWTP is located near T11–T14, and a hospital is situated near L16–L19. Therefore, PC1 primarily represents medical wastewater. The dominant components in PC2 were FQs, TCs and stimulants. Concentrations of these three PPCP categories were higher in tributaries with dense populations than in the main stem. As shown in Figure 2, the dominant FQ component in river water was NOR, which is commonly used to prevent human and animal diseases [61]. The dominant TC component was DC, widely used for antimicrobial and anti-infective applications. The dominant stimulant components were CAF and 1,7-DIM, detected at high levels across all river sampling sites. CAF and its metabolite 1,7-DIM are typical markers of domestic sewage, reflecting human dietary intake and excretion [62]. Therefore, PC2 primarily represents domestic wastewater.
Figure 7.
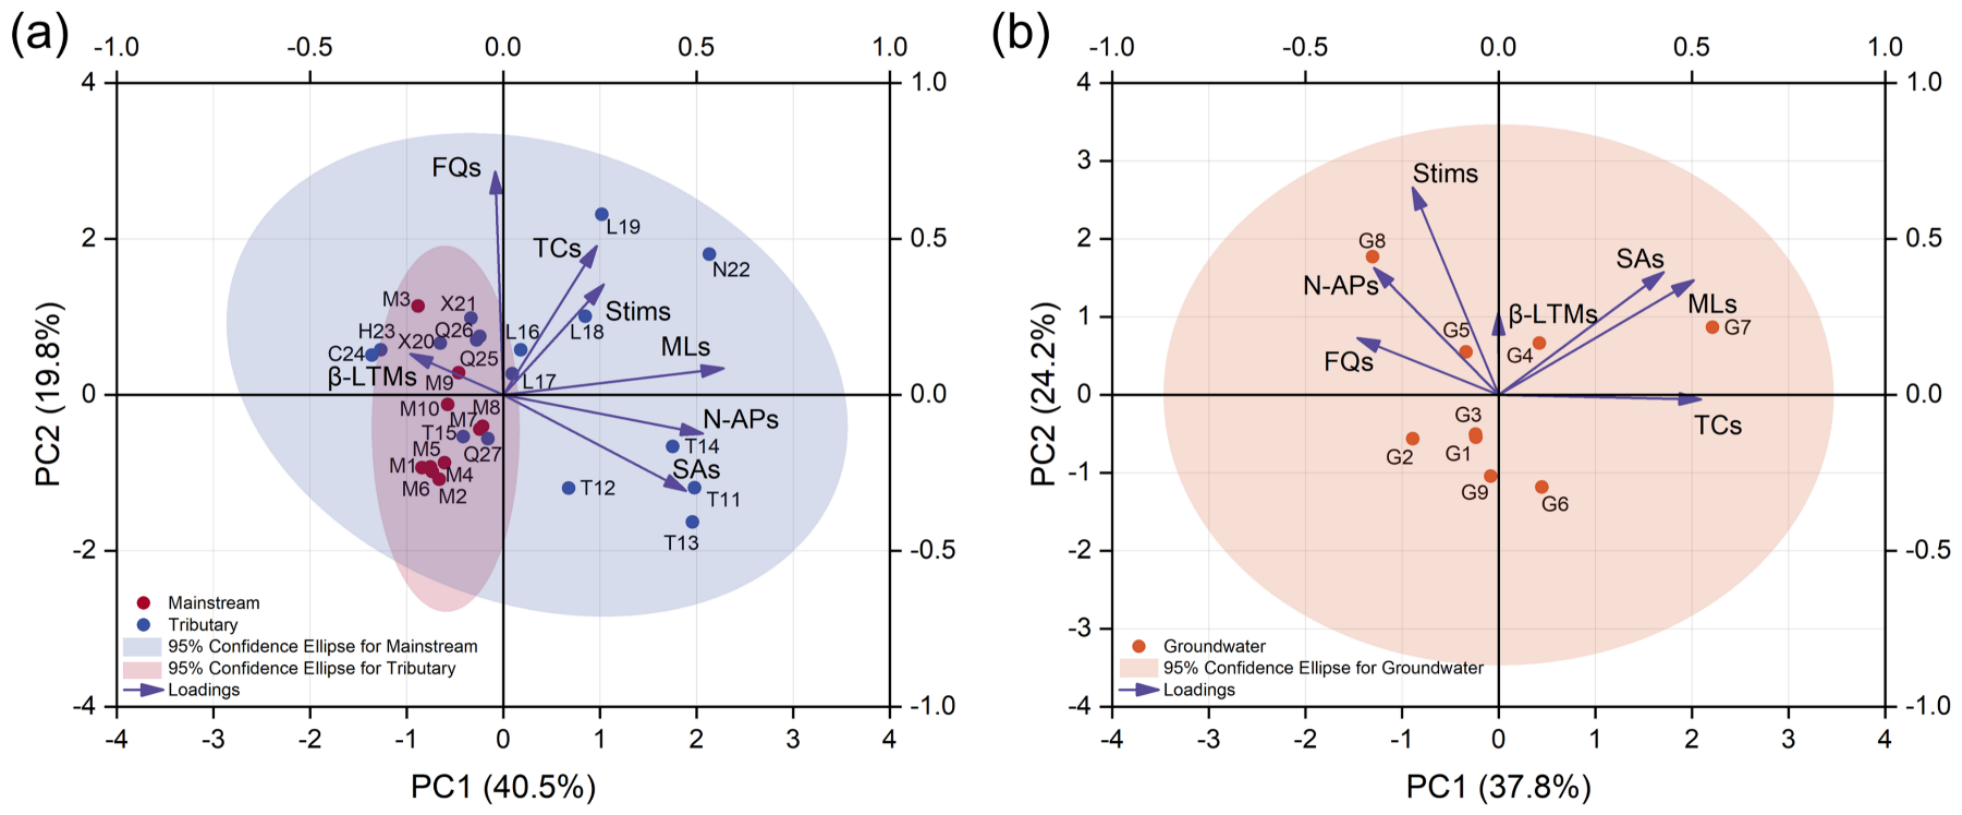
Principal component analysis diagrams for mainstream, tributary (a) and groundwater (b).
The PCA results for groundwater are presented in Figure 7b. As indicated in Table S21, the first three principal components (PCs) for groundwater had eigenvalues greater than 1, accounting for 82.15% of the cumulative variance. PC1 and PC2 individually explained 37.83% and 24.19% of the total variance, respectively, collectively accounting for 62.02%. The dominant components in PC1 were TCs, MLs and SAs. Integration with Figure 2 revealed that the dominant TC component in groundwater was DC, the dominant ML component was ROX and the dominant SA component was SCP, which is predominantly used for clinical infections. Based on the preceding analysis, PC1 primarily represents medical wastewater. The dominant components in PC2 were stimulants, N-APs, SAs and MLs. The dominant stimulant component in groundwater was CAF, the dominant N-AP component was MFM, the dominant SA component was SCP and the dominant ML component was ROX. As shown in Figure 1, sampling points G4 and G5 were located near villages and farmland, whereas sampling point G8 was situated upstream of a petrol station in a relatively densely populated residential area. Therefore, PC2 primarily represents domestic wastewater.
3.5. Ecological Implications
The risk quotient (RQ) method employed in this study constitutes a screening-level risk assessment for individual substances; it does not account for the combined toxicity of chemical mixtures, nor has any quantitative analysis been performed regarding the selective pressure on antibiotic resistance genes or the development of antimicrobial resistance resulting from chronic exposure to low concentrations of PPCPs.
3.5.1. Environmental Risk Assessment
Environmental risk assessments were conducted for six PPCPs (CAF, MFM, PEN-G, 1,7-DIM, and NOR) detected in rivers at rates exceeding 50% and concentrations above 15 ng/L, using algae, large water fleas, and fish as test organisms. Figure S5 panels a, b, and c illustrate the environmental risks of antibiotics in effluent to algae, large water fleas, and fish, respectively, while panels d, e, and f present the corresponding risks in rivers.
The results presented in Figure S5 indicate that environmental risk ranges for antibiotics in effluent to algae, large amphipods and fish were 0–0.93, 0–0.35 and 0–0.01, respectively. Specifically, 1,7-DIM at E4 and E5, and MFM at E1 and E3, posed moderate ecological risks to algae (0.1 < RQ < 1). CAF, 1,7-DIM, SMZ, MFM and APAP at certain sampling points posed low ecological risks to algae (0.01 < RQ < 0.1). At E3, MFM and APAP posed moderate ecological risks to large amphipods (0.1 < RQ < 1), whereas CAF, MFM and APAP at some sites posed low ecological risks to large amphipods (0.01 < RQ < 0.1). MFM at E3 posed a low ecological risk to fish (0.01 < RQ < 0.1). In river water, environmental risk ranges for antibiotics to algae, large amphipods and fish were 0–0.60, 0–0.23 and 0–0.01, respectively. Among these, 1,7-DIM at L17, N22 and Q26, and MFM at T11–T14, L18–L19, N22 and Q27, exhibited moderate ecological risks to algae (0.1 < RQ < 1), whereas CAF, 1,7-DIM, SMZ and MFM at some sites posed low ecological risks (0.01 < RQ < 0.1). MFM at T11 and T13 posed moderate ecological risks to large amphipods (0.1 < RQ < 1), whereas CAF, MFM and APAP at some sites posed low ecological risks to large amphipods (0.01 < RQ < 0.1). CAF at certain sites posed a low ecological risk to fish (0.01 < RQ < 0.1).
The environmental risks of the six PPCPs generally exhibited a decreasing trend along the food chain, consistent with the environmental risk assessment results for tetracycline reported by Xu et al. [63]. This may be attributed to metabolic transformation of certain PPCPs within organisms, thereby reducing the potential for trophic transfer. Although some PPCPs may not pose significant short-term ecological risks, they can accumulate within organisms and exert long-term effects. They may promote the persistence and accelerate the emergence of antibiotic resistance genes (ARGs) [64], ultimately posing risks to human health [65]. To better assess and manage these risks, further research is warranted on the behaviour and fate of PPCPs in the environment. This will inform the development of more effective management strategies to protect ecosystems and human health.
3.5.2. Health Risk Assessment
Health risk assessments were conducted for CAF, MFM, PEN-G, 1,7-DIM and NOR, which were detected in groundwater at frequencies exceeding 50% and concentrations above 15 ng/L. The results presented in Figure S6 indicate that RQ values for all five PPCPs across all age groups ranged from 0 to 0.01, all of which were below 0.2. These findings suggest that PPCPs in groundwater along the Guilin section of the Lijiang River are unlikely to pose significant direct health risks to humans via consumption of contaminated drinking water. Nevertheless, PPCPs can exhibit biological activity even at trace concentrations and may exert adverse effects on biological systems and the environment [66]. Furthermore, the toxicity of compound mixtures, chronic exposure risks and alternative exposure pathways remain insufficiently understood, which may result in underestimated health hazards. The human health risk assessment in this study considered only drinking water intake as a route of exposure, overlooking dermal exposure and accidental ingestion associated with recreational water use, as well as indirect exposure via agricultural irrigation (e.g., crop uptake and accumulation in the food chain). Therefore, the human health risk assessment results presented in this study likely underestimate the actual exposure risk to local residents.
4. Conclusions
This study investigated the concentrations, distribution and potential risks of PPCPs in surface water and groundwater within the Lijiang River Basin—a region characterised by karst topography—in a tourist city. The findings demonstrate that PPCPs are prevalent in both river water and groundwater, dominated by CAF, 1,7-DIM, APAP, MFM, SMZ and PEN-G. Spatial analysis revealed higher PPCP concentrations in tributaries than in the main stem. PCA identified domestic sewage and medical effluent as the primary sources of PPCPs in both river water and groundwater systems. Ecological risk assessment revealed that 1,7-DIM, MFM and APAP in certain effluents, as well as 1,7-DIM and MFM in certain river reaches, posed moderate ecological risks (0.1 < RQ < 1). Health risk assessments indicated that PPCPs in groundwater do not pose direct risks to human health. Overall, these results provide valuable insights into the occurrence and distribution of PPCPs in karst water bodies, thereby advancing our understanding of water quality in karst regions. Due to the complex topography of karst areas, more representative sampling is required to enable comprehensive assessments of PPCP contamination in such environments.
Supplementary Materials
The following supporting information can be downloaded at: https://www.mdpi.com/article/10.3390/environments13080455/s1, Table S1: Latitude and longitude information of the sampling points; Table S2: Basic information of PPCPs; Table S3: Main chemical reagents; Table S4: Experimental main equipment and materials; Table S5: Gradient elution procedure for PPCPs; Table S6: Mass spectrometry detection conditions for PPCPs compounds; Table S7: Correlation coefficient (R2), limit of detection (LOD) and limit of quantitation (LOQ) of 43 PPCPs; Table S8: Acute toxicity data: LC50 (EC50) values for target PPCPs to different aquatic organisms (mg/L); Table S9: Mean body weight (BW) and daily water intake (DWI) in different age groups; Table S10: Concentrations and detection rates of PPCPs detected in effluent; Table S11: Concentrations of PPCPs (ng/L) in effluents, river, and groundwater; Table S12: Concentrations and detection rates of PPCPs detected in river; Table S13: Concentrations and detection rates of PPCPs detected in groundwater; Table S14: Existence level of target PPCPs in water pollution source, surface water and groundwater; Table S15: Effluent quality indicator detection results; Table S16: River quality indicator detection results; Table S17: Groundwater quality indicator detection results; Table S18: RDA analysis results of mainstream and tributaries; Table S19: RDA analysis results of Groundwater; Table S20: PCA analysis results for river; Table S21: PCA analysis results for groundwater; Figure S1: Pearson correlation analysis of river and environmental parameters; Figure S2: Pearson correlation analysis of mainstream and environmental parameters; Figure S3: Pearson correlation analysis of tributary and environmental parameters; Figure S4: Pearson correlation analysis of groundwater and environmental parameters; Figure S5: Effluent and river ecological risk assessment; Figure S6: Groundwater health risk assessment. References in the Supplementary Materials are cited by [7,9,67,68,69,70,71,72,73,74,75,76,77,78].
Author Contributions
Conceptualization, Writing—Original Draft, Q.C.; Supervision, C.M.; Writing—Review and Editing, J.Q.; Resources, Q.W.; Supervision, L.Q.; Supervision, L.X.; Investigation, Writing—Review and Editing, Funding acquisition, Y.L. All authors have read and agreed to the published version of the manuscript.
Funding
This research was funded by the Natural Science Foundation of Guangxi Province (2026GXNSFAA00641047), and Guangxi Science and Technology Program (Guike AB25069502).
Institutional Review Board Statement
The study did not involve human subjects or animal experiments, and thus ethical approval was not required.
Informed Consent Statement
The study did not involve humans or human data, and thus informed consent is not applicable.
Data Availability Statement
The Lijiang river PPCPs date that support the findings of this study are available from Guilin University of Technology (GLUT), but restrictions apply to the availability of these data, which were used under licence for the current study and so are not publicly available. The data are, however, available upon request and with the permission of Guilin University of Technology (GLUT).
Acknowledgments
We acknowledge the support provided by the Guilin Agricultural Water and Soil Resources and Environment Observation and Research Station of Guangxi, Guilin Lijiang River Ecology and Environment Observation and Research Station of Guangxi, and the Collaborative Innovation Center for Water Pollution Control and Water Safety in the Karst areas of Guangxi and the financial support provided by the Natural Science Foundation of Guangxi Province (2026GXNSFAA00641047), Guangxi Science and Technology Program (Guike AB25069502).
Conflicts of Interest
The authors declare no conflicts of interest.
Abbreviations
| SAs | Sulfonamide Antibiotics |
| SDZ | Sulfadiazine |
| SMZ | Sulfamethoxazole |
| SMR | Sulfamerazine |
| SMM | Sulfamethazine |
| SCP | Sulfachloropyridazine |
| TMP | Trimethoprim |
| STZ | Sulfathiazole |
| SML | Sulfamethizole |
| FQs | Fluoroquinolone Antibiotics |
| NOR | Norfloxacin |
| CIP | Ciprofloxacin |
| ENR | Enrofloxacin |
| OFL | Ofloxacin |
| OXO | Oxolinic acid |
| FLU | Flumequine |
| LOM | Lomefloxacin Hydrochloride |
| CLI | Clinafloxacin |
| SAR | Sarafloxacin |
| TCs | Tetracycline Antibiotics |
| TC | Tetracycline |
| DC | Doxycycline |
| OTC | Oxytetracycline |
| CTC | Chlortetracycline |
| MLs | Macrolide Antibiotics |
| ERY | Erythromycin |
| CLAR | Clarithromycin |
| AZI | Azithromycin |
| ROX | Roxithromycin |
| TYL | Tylosin A Tartrate |
| β-LTMs | β-lactam antibiotics |
| PEN-G | Penicillin G Sodium |
| AMP | Ampicillin |
| PNV | Penicillin V |
| OXA | Oxacillin Sodium |
| CTX | Cefotaxime |
| CLO | Cloxacillin |
| Stims | Stimulants |
| COD | Codeine |
| CAF | Caffeine |
| 1,7-DIM | 1,7-Dimethylxanthine |
| COT | Cotinine |
| N-APs | Non-antibiotic Pharmaceuticals |
| MFM | Metformin |
| APAP | 4-acetamidophenol |
| TBZ | Thiabendazole |
| CBZ | Carbamazepine |
| FXT | Fluoxetine |
| NGM | Norgestimate |
| MIC | Miconazole |
References
- Osuoha, J.O.; Anyanwu, B.O.; Ejileugha, C. Pharmaceuticals and personal care products as emerging contaminants: Need for combined treatment strategy. J. Hazard. Mater. Adv. 2023, 9, 100206. [Google Scholar] [CrossRef] [Scilit]
- Khan, H.K.; Rehman, M.Y.A.; Junaid, M.; Lv, M.; Yue, L.; Haq, I.; Xu, N.; Malik, R.N. Occurrence, Source Apportionment and Potential Risks of Selected PPCPs in Groundwater Used as a Source of Drinking Water from Key Urban-Rural Settings of Pakistan. Sci. Total Environ. 2022, 807, 151010. [Google Scholar] [CrossRef] [Scilit] [PubMed]
- Fang, W.; Peng, Y.; Muir, D.; Lin, J.; Zhang, X. A Critical Review of Synthetic Chemicals in Surface Waters of the US, the EU and China. Environ. Int. 2019, 131, 104994. [Google Scholar] [CrossRef] [Scilit] [PubMed]
- Lee, H.-J.; Kim, K.Y.; Hamm, S.-Y.; Kim, M.; Kim, H.K.; Oh, J.-E. Occurrence and Distribution of Pharmaceutical and Personal Care Products, Artificial Sweeteners, and Pesticides in Groundwater from an Agricultural Area in Korea. Sci. Total Environ. 2019, 659, 168–176. [Google Scholar] [CrossRef] [Scilit] [PubMed]
- Lu, S.; Wang, J.; Wang, B.; Xin, M.; Lin, C.; Gu, X.; Lian, M.; Li, Y. Comprehensive profiling of the distribution, risks and priority of pharmaceuticals and personal care products: A large-scale study from rivers to coastal seas. Water Res. 2023, 230, 119591. [Google Scholar] [CrossRef] [Scilit] [PubMed]
- Xu, M.; Huang, H.; Li, N.; Li, F.; Wang, D.; Luo, Q. Occurrence and Ecological Risk of Pharmaceuticals and Personal Care Products (PPCPs) and Pesticides in Typical Surface Watersheds, china. Ecotoxicol. Environ. Saf. 2019, 175, 289–298. [Google Scholar] [CrossRef] [Scilit] [PubMed]
- Ma, L.; Liu, Y.; Yang, Q.; Jiang, L.; Li, G. Occurrence and distribution of Pharmaceuticals and Personal Care Products (PPCPs) in wastewater related riverbank groundwater. Sci. Total Environ. 2022, 821, 153372. [Google Scholar] [CrossRef] [Scilit] [PubMed]
- Ashraf, M.; Ahammad, S.Z.; Chakma, S. Advancements in the Dominion of Fate and Transport of Pharmaceuticals and Personal Care Products in the Environment—A Bibliometric Study. Environ. Sci. Pollut. Res. 2023, 30, 64313–64341. [Google Scholar] [CrossRef] [Scilit] [PubMed]
- Feng, G.; Lu, G.; Liu, J.; Gai, N.; Chen, H.; Tang, Q.; Yang, Y. Occurrence, migration, and risk assessment of PPCPs in water bodies and sediments of river-type drinking water sources in eastern China. China Geol. 2025, 8, 514–525. [Google Scholar] [CrossRef] [Scilit]
- Liu, M.; Qiao, P.; Shan, Y.; Zhang, Z.; Pan, P.; Li, Y. Migration and Accumulation Simulation Prediction of PPCPs in Urban Green Space Soil Irrigated with Recycled Water: A Review. J. Hazard. Mater. 2024, 476, 135037. [Google Scholar] [CrossRef] [Scilit] [PubMed]
- Shu, X.; Xu, L.; Yang, M.; Qin, Z.; Zhang, Q.; Zhang, L. Spatial Distribution Characteristics and Migration of Microplastics in Surface Water, Groundwater and Sediment in Karst Areas: The Case of Yulong River in Guilin, Southwest China. Sci. Total Environ. 2023, 868, 161578. [Google Scholar] [CrossRef] [Scilit] [PubMed]
- Dodgen, L.K.; Kelly, W.R.; Panno, S.V.; Taylor, S.J.; Armstrong, D.L.; Wiles, K.N.; Zhang, Y.; Zheng, W. Characterizing Pharmaceutical, Personal Care Product, and Hormone Contamination in a Karst Aquifer of Southwestern Illinois, USA, Using Water Quality and Stream Flow Parameters. Sci. Total Environ. 2017, 578, 281–289. [Google Scholar] [CrossRef] [Scilit] [PubMed]
- Chen, J.; Lu, M.; Dong, G.; Wu, S.; Xu, J.; Wang, S. Evaluating the metabolic structure and interrelationships of the Lijiang River Basin based on ecological network analysis. J. Hydrol. Reg. Stud. 2024, 51, 101631. [Google Scholar] [CrossRef] [Scilit]
- Zhang, Y.; Huang, G.; Zhang, Q.; Bi, X.; Chu, H.; Liu, Z.; Luo, J.; Bai, S.; Mo, S.; Wang, H.; et al. Occurrence, distribution, and ecological risk assessment of pharmaceuticals and personal care products in the surface water of Lipu River, China. Environ. Res. 2024, 252, 118908. [Google Scholar] [CrossRef] [Scilit] [PubMed]
- Lukač Reberski, J.; Terzić, J.; Maurice, L.D.; Lapworth, D.J. Emerging Organic Contaminants in Karst Groundwater: A Global Level Assessment. J. Hydrol. 2022, 604, 127242. [Google Scholar] [CrossRef] [Scilit]
- Tang, L.; Liu, X.; Yang, G.; Xia, J.; Zhang, N.; Wang, D.; Deng, H.; Mao, M.; Li, X.; Ni, B.-J. Spatial distribution, sources and risk assessment of perfluoroalkyl substances in surface soils of a representative densely urbanized and industrialized city of China. Catena 2021, 198, 105059. [Google Scholar] [CrossRef] [Scilit]
- von Mühlen, L.; Demarco, M.; Sirtori, C.; Zanella, R.; Prestes, O.D. Combining Analytical Strategies to Provide Qualitative and Quantitative Analysis and Risk Assessment on Pharmaceuticals and Metabolites in Hospital Wastewaters. Processes 2025, 13, 307. [Google Scholar] [CrossRef] [Scilit]
- Chen, L.; Fu, W.; Tan, Y.; Zhang, X. Emerging Organic Contaminants and Odorous Compounds in Secondary Effluent Wastewater: Identification and Advanced Treatment. J. Hazard. Mater. 2021, 408, 124817. [Google Scholar] [CrossRef] [Scilit] [PubMed]
- Nguyen, H.T.; Thai, P.K.; Kaserzon, S.L.; O’Brien, J.W.; Eaglesham, G.; Mueller, J.F. Assessment of Drugs and Personal Care Products Biomarkers in the Influent and Effluent of Two Wastewater Treatment Plants in Ho Chi Minh City, Vietnam. Sci. Total Environ. 2018, 631–632, 469–475. [Google Scholar] [CrossRef] [Scilit] [PubMed]
- Zheng, Q.-D.; Lin, J.-G.; Pei, W.; Guo, M.-X.; Wang, Z.; Wang, D.-G. Estimating Nicotine Consumption in Eight Cities Using Sewage Epidemiology Based on Ammonia Nitrogen Equivalent Population. Sci. Total Environ. 2017, 590–591, 226–232. [Google Scholar] [CrossRef] [Scilit] [PubMed]
- Wu, J.; Liu, Z.; Ma, Q.; Dai, L.; Dang, Z. Occurrence, Removal and Risk Evaluation of Ibuprofen and Acetaminophen in Municipal Wastewater Treatment Plants: A Critical Review. Sci. Total Environ. 2023, 891, 164600. [Google Scholar] [CrossRef] [Scilit] [PubMed]
- Tao, W.; Zheng, X.; Liu, P.; Zhang, Y.; Di, B.; Qiao, H. Occurrence and Removal of Pharmaceuticals in Hospital Wastewater and the Contribution to Wastewater Treatment Plants. Environ. Res. 2025, 279, 121752. [Google Scholar] [CrossRef] [Scilit] [PubMed]
- Vo, H.N.P.; Koottatep, T.; Chapagain, S.K.; Panuvatvanich, A.; Polprasert, C.; Nguyen, T.M.H.; Chaiwong, C.; Nguyen, N.L. Removal and Monitoring Acetaminophen-Contaminated Hospital Wastewater by Vertical Flow Constructed Wetland and Peroxidase Enzymes. J. Environ. Manag. 2019, 250, 109526. [Google Scholar] [CrossRef] [Scilit] [PubMed]
- Reddy, V.S.; Shiva, S.; Manikantan, S.; Ramakrishna, S. Pharmacology of Caffeine and Its Effects on the Human Body. Eur. J. Med. Chem. Rep. 2024, 10, 100138. [Google Scholar] [CrossRef] [Scilit]
- Xiao, Y.; Shao, X.-T.; Tan, D.-Q.; Yan, J.-H.; Pei, W.; Wang, Z.; Yang, M.; Wang, D.-G. Assessing the Trend of Diabetes Mellitus by Analyzing Metformin as a Biomarker in Wastewater. Sci. Total Environ. 2019, 688, 281–287. [Google Scholar] [CrossRef] [Scilit] [PubMed]
- da Silva, E.S.; Becker, R.W.; Starling, M.C.V.M.; Machado, E.C.; Reis, A.P.V.; Aguilar, A.P.; Mendes, T.A.d.O.; Sirtori, C.; Amorim, C.C. An Integrated Analysis of the Use and Potential Risks of Pharmaceutical Drugs in Hospital Wastewater: Consumption and Occurrence by Suspect Screening Analysis, and Antibiotic Resistance. Sci. Total Environ. 2025, 973, 179132. [Google Scholar] [CrossRef] [Scilit] [PubMed]
- Całus-Makowska, K.; Binkowski, Ł.J.; Grobelak, A. Pharmaceutical Residues in Wastewater Treatment Plants in Poland: Removal Efficiency and Risk Assessment. J. Environ. Manag. 2025, 394, 127480. [Google Scholar] [CrossRef] [Scilit] [PubMed]
- Weerasooriyagedara, M.; Partington, J.M.; Alghamdi, W.; Akele, M.L.; Freguia, S.; Clarke, B.O. Occurrence and Seasonal Variation of Contaminants of Emerging Concern (CECs) in Influent and Effluent of Four Australian Wastewater Treatment Plants (WWTPs). Chemosphere 2025, 392, 144752. [Google Scholar] [CrossRef] [Scilit] [PubMed]
- Tawfik, N.A.I.; El-Bakary, Z.A.; Abd El-Wakeil, K.F. Determination of Caffeine in Treated Wastewater Discharged in the Nile River with Emphasis on the Effect of Zinc and Physicochemical Factors. Environ. Sci. Pollut. Res. 2024, 31, 28124–28138. [Google Scholar] [CrossRef] [Scilit] [PubMed]
- Senta, I.; Gracia-Lor, E.; Borsotti, A.; Zuccato, E.; Castiglioni, S. Wastewater Analysis to Monitor Use of Caffeine and Nicotine and Evaluation of Their Metabolites as Biomarkers for Population Size Assessment. Water Res. 2015, 74, 23–33. [Google Scholar] [CrossRef] [Scilit] [PubMed]
- Ren, B.; Geng, J.; Wang, Y.; Wang, P. Emission and Ecological Risk of Pharmaceuticals and Personal Care Products Affected by Tourism in Sanya City, China. Environ. Geochem. Health 2021, 43, 3083–3097. [Google Scholar] [CrossRef] [Scilit] [PubMed]
- Liu, J.; Deng, W.-J.; Ying, G.-G.; Tsang, E.P.K.; Hong, H.-C. Occurrence and Distribution of Antibiotics in Surface Water. Ecotoxicology 2022, 31, 1111–1119. [Google Scholar] [CrossRef] [Scilit] [PubMed]
- Yu, H.; Cao, W. Assessment of Pharmaceutical and Personal Care Products (PPCPs) of Dalong Lake in Xuzhou by Concentration Monitoring and Bio-Effects Monitoring Process. Environ. Toxicol. Pharmacol. 2016, 43, 209–215. [Google Scholar] [CrossRef] [Scilit] [PubMed]
- Fan, D.; Zhang, Y.; Sun, S.; Zhang, B.; Liang, M.; Xu, J.; Wang, L. Occurrence, Spatial Distribution, Source Apportionment, and Risk Assessment of Antibiotics in Yangtze River Surface Water. Emerg. Contam. 2025, 11, 100437. [Google Scholar] [CrossRef] [Scilit]
- Iancu, V.-I.; Niculescu, M.; Puiu, D.; Galaon, T.; Petre, J.; Pascu, L. Determination of Hypoglycemic Agents in Surface Water Samples Using SPE-LC-MS/MS Method. Rev. Chim. 2020, 71, 337–346. [Google Scholar] [CrossRef] [Scilit]
- Jia, A.; Hu, J.; Wu, X.; Peng, H.; Wu, S.; Dong, Z. Occurrence and Source Apportionment of Sulfonamides and Their Metabolites in Liaodong Bay and the Adjacent Liao River Basin, North China. Environ. Toxicol. Chem. 2011, 30, 1252–1260. [Google Scholar] [CrossRef] [Scilit] [PubMed]
- Zheng, Y.; Lu, G.-H.; Shao, P.-W.; Piao, H.-T.; Gai, N.; Rao, Z.; Zhao, Q.-S.; Yang, Y.-L. Source Tracking and Risk Assessment of Pharmaceutical and Personal Care Products in Surface Waters of Qingdao, China, with Emphasis on Influence of Animal Farming in Rural Areas. Arch. Environ. Contam. Toxicol. 2020, 78, 579–588. [Google Scholar] [CrossRef] [Scilit] [PubMed]
- Al-Rajab, A.J.; Albratty, M.; Hakami, O.; Alhazmi, H.; Sharma, M.; Reddy, D. Investigation of the Presence of Pharmaceuticals and Personal Care Products (PPCPs) in Groundwater of Jazan Area, Saudi Arabia. Trop. J. Pharm. Res. 2019, 17, 2061. [Google Scholar] [CrossRef] [Scilit]
- Gray, A.D.; Todd, D.; Hershey, A.E. The Seasonal Distribution and Concentration of Antibiotics in Rural Streams and Drinking Wells in the Piedmont of North Carolina. Sci. Total Environ. 2020, 710, 136286. [Google Scholar] [CrossRef] [Scilit] [PubMed]
- Li, S.; Shi, W.; Li, H.; Xu, N.; Zhang, R.; Chen, X.; Sun, W.; Wen, D.; He, S.; Pan, J.; et al. Antibiotics in Water and Sediments of Rivers and Coastal Area of Zhuhai City, Pearl River Estuary, South China. Sci. Total Environ. 2018, 636, 1009–1019. [Google Scholar] [CrossRef] [Scilit] [PubMed]
- Ren, K.; Zeng, J.; Liang, J.; Yuan, D.; Jiao, Y.; Peng, C.; Pan, X. Impacts of Acid Mine Drainage on Karst Aquifers: Evidence from Hydrogeochemistry, Stable Sulfur and Oxygen Isotopes. Sci. Total Environ. 2021, 761, 143223. [Google Scholar] [CrossRef] [Scilit] [PubMed]
- Prasannamedha, G.; Kumar, P.S. A Review on Contamination and Removal of Sulfamethoxazole from Aqueous Solution Using Cleaner Techniques: Present and Future Perspective. J. Clean. Prod. 2020, 250, 119553. [Google Scholar] [CrossRef] [Scilit]
- Quyen, D.T.T.; Masahiro, O.; Otaki, Y.; Chaminda, T. Sewage Markers as Determinants to Differentiate Origins of Emerging Organic Pollutants in an Urban Sri Lankan Water Drainage Network. Water 2021, 13, 2898. [Google Scholar] [CrossRef] [Scilit]
- Scipioni, B.; de Azevedo, J.C.R.; Leonardi, I.R.; Filippe, T.C.; Peixoto, L.O.M.; Mizukawa, A. Caffeine as a Chemical Tracer for Contamination of Urban Rivers. RBRH 2019, 24, e29. [Google Scholar] [CrossRef] [Scilit]
- Wang, P.; Shen, C.; Cong, Q.; Liu, J.; Wang, X. Degradation of Penicillin G by Visible Light Irradiation-Assisted Biotransformation by Whole Cell Paracoccus Sp. Res. Sq. 2021. [Google Scholar] [CrossRef] [Scilit] [PubMed]
- Liu, S.; Wang, C.; Wang, P.; Chen, J.; Wang, X.; Yuan, Q. Anthropogenic Disturbances on Distribution and Sources of Pharmaceuticals and Personal Care Products throughout the Jinsha River Basin, China. Environ. Res. 2021, 198, 110449. [Google Scholar] [CrossRef] [Scilit] [PubMed]
- Tavernini, D.A.; Richardson, J.S. Effects of Tributary Size on the Resource Supply and Physical Habitat at Tributary Junctions along Two Mainstem Rivers. Can. J. Fish. Aquat. Sci. 2020, 77, 1393–1408. [Google Scholar] [CrossRef] [Scilit]
- Liu, Y.; Chen, L.; Li, H.; Song, Y.; Yang, Z.; Cui, Y. Occurrence of Organophosphorus Flame Retardants in Xiangjiang River: Spatiotemporal Variations, Potential Affecting Factors, and Source Apportionment. Chemosphere 2024, 355, 141822. [Google Scholar] [CrossRef] [Scilit] [PubMed]
- Ellis, J.B. Pharmaceutical and Personal Care Products (PPCPs) in Urban Receiving Waters. Environ. Pollut. 2006, 144, 184–189. [Google Scholar] [CrossRef] [Scilit] [PubMed]
- Rohmadi, E.; Sekine, M.; Setiawan, B. Impact of Slum Upgrading to River Water Quality in Yogyakarta City, Indonesia. J. Teknosains 2022, 12, 85. [Google Scholar] [CrossRef] [Scilit]
- Peeler, K.; Opsahl, S.; Chanton, J. Tracking Anthropogenic Inputs Using Caffeine, Indicator Bacteria, and Nutrients in Rural Freshwater and Urban Marine Systems. Environ. Sci. Technol. 2007, 40, 7616–7622. [Google Scholar] [CrossRef] [Scilit] [PubMed]
- Afshari, K.; Dehdashtian, A.; Haddadi, N.; Haj-Mirzaian, A.; Iranmehr, A.; Ebrahimi, M.; Tavangar, S.M.; Faghir-Ghanesefat, H.; Mohammadi, F.; Rahimi, N.; et al. Anti-Inflammatory Effects of Metformin Improve the Neuropathic Pain and Locomotor Activity in Spinal Cord Injured Rats: Introduction of an Alternative Therapy. Spinal Cord 2018, 56, 1032–1041. [Google Scholar] [CrossRef] [Scilit] [PubMed]
- Zheng, Y.; Shao, Y.; Zhang, Y.; Liu, Z.; Zhao, Z.; Xu, R.; Ding, J.; Li, W.; Wang, B.; Zhang, H. Metformin as an Emerging Pollutant in the Aquatic Environment: Occurrence, Analysis, and Toxicity. Toxics 2024, 12, 483. [Google Scholar] [CrossRef] [Scilit] [PubMed]
- Huang, F.; Zou, S.; Deng, D.; Lang, H.; Liu, F. Antibiotics in a Typical Karst River System in China: Spatiotemporal Variation and Environmental Risks. Sci. Total Environ. 2019, 650, 1348–1355. [Google Scholar] [CrossRef] [Scilit] [PubMed]
- Sui, Q.; Cao, X.; Lu, S.; Zhao, W.; Qiu, Z.; Yu, G. Occurrence, Sources and Fate of Pharmaceuticals and Personal Care Products in the Groundwater: A Review. Emerg. Contam. 2015, 1, 14–24. [Google Scholar] [CrossRef] [Scilit]
- Zhou, Q.; Liu, G.; Arif, M.; Shi, X.; Wang, S. Occurrence and Risk Assessment of Antibiotics in the Surface Water of Chaohu Lake and Its Tributaries in China. Sci. Total Environ. 2022, 807, 151040. [Google Scholar] [CrossRef] [Scilit] [PubMed]
- Hope, R.; Warner, M.; Mushtaq, S.; Ward, M.E.; Parsons, T.; Livermore, D.M. Effect of Medium Type, Age and Aeration on the MICs of Tigecycline and Classical Tetracyclines. J. Antimicrob. Chemother. 2005, 56, 1042–1046. [Google Scholar] [CrossRef] [Scilit] [PubMed]
- Hua, Z.; Guo, K.; Kong, X.; Lin, S.; Wu, Z.; Wang, L.; Huang, H.; Fang, J. PPCP Degradation and DBP Formation in the Solar/Free Chlorine System: Effects of pH and Dissolved Oxygen. Water Res. 2019, 150, 77–85. [Google Scholar] [CrossRef] [Scilit] [PubMed]
- Dong, Y.; Qi, X.; Lin, X.; Yu, M.; Zhang, H.; Sun, H. Efficacy of Roxithromycin with Gamma Globulin in Children with Mycoplasma Pneumonia and Its Effect on Immunity. Trop. J. Pharm. Res. 2022, 21, 1061–1066. [Google Scholar] [CrossRef] [Scilit]
- Kemnic, T.R.; Coleman, M. Trimethoprim Sulfamethoxazole. In StatPearls [Internet]; StatPearls Publishing: Treasure Island, FL, USA, 2022. [Google Scholar]
- Cai, W.; Huang, X.; Dai, L.; Sun, C.; Wu, X.; Yang, K. Enhance Removal of Norfloxacin from Water by Metal-Organic Framework-Stabilized Zero-Valent Iron Nanoparticles. Inorg. Chem. Commun. 2025, 177, 114346. [Google Scholar] [CrossRef] [Scilit]
- Edwards, Q.A.; Kulikov, S.M.; Garner-O’Neale, L.D. Caffeine in Surface and Wastewaters in Barbados, West Indies. SpringerPlus 2015, 4, 57. [Google Scholar] [CrossRef] [Scilit] [PubMed]
- Xu, L.; Zhang, H.; Xiong, P.; Zhu, Q.; Liao, C.; Jiang, G. Occurrence, Fate, and Risk Assessment of Typical Tetracycline Antibiotics in the Aquatic Environment: A Review. Sci. Total Environ. 2021, 753, 141975. [Google Scholar] [CrossRef] [Scilit] [PubMed]
- Wang, Y.; Yin, T.; Kelly, B.C.; Gin, K.Y.-H. Bioaccumulation Behaviour of Pharmaceuticals and Personal Care Products in a Constructed Wetland. Chemosphere 2019, 222, 275–285. [Google Scholar] [CrossRef] [Scilit] [PubMed]
- Liu, J.-L.; Wong, M.-H. Pharmaceuticals and Personal Care Products (PPCPs): A Review on Environmental Contamination in China. Environ. Int. 2013, 59, 208–224. [Google Scholar] [CrossRef] [Scilit] [PubMed]
- Snyder, S. Occurrence, Treatment, and Toxicological Relevance of EDCs and Pharmaceuticals in Water. Ozone-Sci. Eng. 2008, 30, 65–69. [Google Scholar] [CrossRef] [Scilit]
- Duan, X.; Zhao, X.; Wang, B.; Chen, Y.; Cao, S. Highlights of the Chinese Exposure Factors Handbook (Adults); Academic Press: Cambridge, MA, USA, 2015; pp. 67–68. ISBN 978-0-12-803125-4. [Google Scholar]
- Conceicao, K.C.; Villamar-Ayala, C.A.; Plaza-Garrido, A.; Toledo-Neira, C. Seasonal Behavior of Pharmaceuticals and Personal Care Products within Chilean Rural WWTPs under COVID-19 Pandemic Conditions. J. Environ. Chem. Eng. 2023, 11, 110984. [Google Scholar] [CrossRef] [Scilit]
- Chen, X.; Lei, L.; Liu, S.; Han, J.; Li, R.; Men, J.; Li, L.; Wei, L.; Sheng, Y.; Yang, L.; et al. Occurrence and Risk Assessment of Pharmaceuticals and Personal Care Products (PPCPs) against COVID-19 in Lakes and WWTP-River-Estuary System in Wuhan, China. Sci. Total Environ. 2021, 792, 148352. [Google Scholar] [CrossRef] [Scilit] [PubMed]
- Liu, J.; Ge, S.; Shao, P.; Wang, J.; Liu, Y.; Wei, W.; He, C.; Zhang, L. Occurrence and Removal Rate of Typical Pharmaceuticals and Personal Care Products (PPCPs) in an Urban Wastewater Treatment Plant in Beijing, China. Chemosphere 2023, 339, 139644. [Google Scholar] [CrossRef] [Scilit] [PubMed]
- Liu, Q.; Feng, X.; Chen, N.; Shen, F.; Zhang, H.; Wang, S.; Sheng, Z.; Li, J. Occurrence and Risk Assessment of Typical PPCPs and Biodegradation Pathway of Ribavirin in Wastewater Treatment Plants. Environ. Sci. Ecotechnol. 2022, 11, 100184. [Google Scholar] [CrossRef] [Scilit] [PubMed]
- Adomat, Y.; Grischek, T. Occurrence, Fate and Potential Risks of Pharmaceuticals and Personal Care Products (PPCPs) in Elbe River Water during Water Treatment in Dresden, Germany. Environ. Chall. 2024, 15, 100938. [Google Scholar] [CrossRef] [Scilit]
- Hu, Y.; Li, L.; Li, B.; Peng, L.; Xu, Y.; Zhou, X.; Li, R.; Song, K. Spatial Variations and Ecological Risks Assessment of Pharmaceuticals and Personal Care Products (PPCPs) in Typical Lakes of Wuhan, China. Process Saf. Environ. Prot. 2023, 174, 828–837. [Google Scholar] [CrossRef] [Scilit]
- Silori, R.; Mahapatra, D.M.; Tauseef, S.M.; Biswas, P.; Vellanki, B.P.; Goswami, R.; Leifels, M.; Mora, A.; Mahlknecht, J.; Kumar, M. Seasonality in Negative Removal of Pharmaceutical and Personal Care Products at the Himalayan Foothills Wastewater Treatment Plants. J. Environ. Chem. Eng. 2025, 13, 116803. [Google Scholar] [CrossRef] [Scilit]
- Lin, K.; Wang, R.; Han, T.; Tan, L.; Yang, X.; Wan, M.; Chen, Y.; Zhao, T.; Jiang, S.; Wang, J. Seasonal Variation and Ecological Risk Assessment of Pharmaceuticals and Personal Care Products (PPCPs) in a Typical Semi-Enclosed Bay—The Bohai Bay in Northern China. Sci. Total Environ. 2023, 857, 159682. [Google Scholar] [CrossRef] [Scilit] [PubMed]
- Sun, Q.; Li, M.; Ma, C.; Chen, X.; Xie, X.; Yu, C.-P. Seasonal and Spatial Variations of PPCP Occurrence, Removal and Mass Loading in Three Wastewater Treatment Plants Located in Different Urbanization Areas in Xiamen, China. Environ. Pollut. 2016, 208, 371–381. [Google Scholar] [CrossRef] [Scilit] [PubMed]
- Yang, L.; Wang, T.; Zhou, Y.; Shi, B.; Bi, R.; Meng, J. Contamination, Source and Potential Risks of Pharmaceuticals and Personal Products (PPCPs) in Baiyangdian Basin, an Intensive Human Intervention Area, China. Sci. Total Environ. 2021, 760, 144080. [Google Scholar] [CrossRef] [Scilit] [PubMed]
- Sun, Q.; Li, Y.; Li, M.; Ashfaq, M.; Lv, M.; Wang, H.; Hu, A.; Yu, C.-P. PPCPs in Jiulong River Estuary (China): Spatiotemporal Distributions, Fate, and Their Use as Chemical Markers of Wastewater. Chemosphere 2016, 150, 596–604. [Google Scholar] [CrossRef] [Scilit] [PubMed]
Disclaimer/Publisher’s Note: The statements, opinions and data contained in all publications are solely those of the individual author(s) and contributor(s) and not of MDPI and/or the editor(s). MDPI and/or the editor(s) disclaim responsibility for any injury to people or property resulting from any ideas, methods, instructions or products referred to in the content. |
© 2026 by the authors. Licensee MDPI, Basel, Switzerland. This article is an open access article distributed under the terms and conditions of the Creative Commons Attribution (CC BY) license.