


Abstract
The mining industry is a cornerstone of global energy security and industrial supply chains, yet its resilience to systemic disruptions such as COVID-19 has been critically overlooked. This disruption provided a rare opportunity to trace supply-chain impacts. Using an environmentally extended multi-regional input-output (EEMRIO) model integrated with a Criteria Importance Through Intercriteria Correlation (CRITIC) weighted approach. We compare pandemic trajectories with counterfactual no-pandemic trajectories: the no-pandemic model (calibrated on 2004–2018) projects 2019–2025, while the pandemic model (calibrated through 2023) projects 2023–2025, with 2023 serving as the observed baseline and transition year. Our findings reveal a transient reduction in mining water and carbon footprints, juxtaposed with stark economic contractions: mining value fell by 40% in China, 37% in India, and 13% in the United States. The weighted component among the water-carbon-value (WVC) analysis further uncovers a tripolar spatial pattern, categorizing countries into financial hubs with high value, such as Switzerland, carbon-locked exporters like Brunei, and water-stressed regions, including Cambodia. Despite absorbing substantial embodied environmental burdens, China maintained its position as the global value hub. These insights underscore the urgency of policies that enhance structural efficiency, decarbonize the power sector, and foster supply chain diversification to decouple economic value from environmental pressures while mitigating spatial inequalities.
1. Introduction
1.1. Background and Motivation
The mining industry (MI) is foundational to the deployment of clean-energy technologies and the restructuring of industrial systems, while imposing significant pressures on water and carbon budgets. Consequently, a growing literature examines the coupled dynamics of water, carbon, and economic output to disentangle global mining networks and reveal the cross-border transmission of environmental and economic linkages [1,2,3]. The shock of COVID-19 disrupted mineral supply chains and also affected the water-value-carbon (WVC) coupling system in the mining industry. This study develops and compares two scenarios, “with pandemic” and “without pandemic”, using comparative simulation analysis to assess the pandemic’s impact. The analysis aims not only to identify the “high water use, high carbon emissions, and low efficiency” development trap, but also to provide insights into strategies for strengthening mining supply chain resilience and aligning global energy security with ecological modernization. As such, it carries essential policy relevance for a green recovery in the post-pandemic era.
1.2. Literature Review
The MI is both resource-intensive and environment-intensive, and its sustainability faces two core challenges. First, substantial freshwater consumption in mining exerts persistent pressure on regional water resources. Empirical studies have shown a significant positive relationship between the level of industrialization and mining-related water use [4,5,6], underscoring the strategic importance of optimizing water consumption in the sector to ensure national and regional water security. Second, MI contributes 4% to 7% of global greenhouse gas emissions [7]. These emissions stem from extraction as well as auxiliary operations and large-scale raw material transport [8]. Therefore, a system-level analysis of interactions between water use and carbon emissions is essential to assess mining sustainability and guide the low-carbon transition.
External shocks, such as public health crises, exacerbate existing baseline pressures. The COVID-19 pandemic, for instance, has caused pronounced and persistent impacts on economic activity and the environment [9,10,11]. Mining is a central component of the energy supply system and plays a significant role in influencing energy supply, economic performance, and environmental outcomes. For instance, the implementation of stay-at-home policies increased residential energy demand, which contributed to a 2% rise in global energy demand by 2023, despite widespread industrial slowdowns [12]. Empirical evidence shows that the pandemic induced short-term emission reductions in some high-income economies [13], while carbon intensity and energy consumption rose in certain developing countries [14]. Country-level studies for China, the EU, Japan, the United Kingdom, and India document significant and lasting pandemic impacts on energy systems [15,16,17,18,19]. However, the net magnitude and persistence of these effects remain uncertain [20]. Given the mining sector’s deep integration into primary energy supply, particularly its dominant share of fossil fuels in the primary energy mix [21], pandemic-driven dynamics can be transmitted through systemic networks and threaten energy security, economic resilience, and environmental governance.
To quantify the multidimensional effects of COVID-19 on mining water use, carbon emissions, and value added, this study developed two scenarios, one with the pandemic and one without, and conducted comparative simulations. We employed the GM (1,1) Markov coupling model at the country level, which captures dominant trends in data-scarce, low-regularity systems, while the Markov component corrects stochastic fluctuations [22,23,24,25,26,27]. Considering the pronounced volatility and weak regularity of mining water use, value added, and emissions during the pandemic, the GM (1,1) Markov model is well-suited for scenario simulation and comparative assessment. Therefore, mapping the coupled dynamics of the mining economy, resource use, and environment is critical for informing policies that secure global energy supply and support a resilient green recovery. The no-pandemic scenario was calibrated on the pre-pandemic period 2004–2018 to represent the business-as-usual trajectory, while the pandemic scenario was calibrated on the full observed period through 2023 to capture pandemic-induced structural shifts and projected for 2024–2025. Both scenarios share the same model structure and data; their difference reflects pandemic-associated deviations.
1.3. Contribution
This study contributes to the quantitative analysis of the MI’s environment–economy nexus through three primary innovations: (i) Providing the first systematic assessment of trade-offs and regional disparities in global mining water footprint (MWF), mining carbon footprint (MCF) and mining output value (MV) during normalized COVID-19 management period (2023), establishing a baseline for further exogenous disturbances (pandemics, geopolitical events, climate extremes); (ii) Developing an objective weighting-driven ternary visualization to eliminate subjective bias in evaluating water–carbon–value interlinkages, using a novel method to map global MI’s three-dimensional coupling; (iii) Quantifying the shock impacts using a GM (1,1)-Markov model to contrast scenarios with and without COVID-19, differentiating MWF, MCF and MV under systemic shocks. These contributions provide a robust framework for tracing the evolution of resource-environmental footprints, offering theoretical and practical pathways for sustainable mining governance and low-carbon transition.
2. Materials and Methods
2.1. Methods
2.1.1. Environmentally Extended Multi-Regional Input-Output Model
This study aims to examine the overall impact of pandemic-induced disruptions on the global mining industry by employing a world-scale Environmentally Extended Multi-Regional Input-Output model (EEMRIO) covering 164 countries and 26 economic sectors. To ensure complete and internally consistent records, Eora-reported territories with at least one zero-valued or unreported mining footprint indicator were screened. Hong Kong and Macao, which are special administrative regions of China and are reported by Eora with zero mining water footprints, were consolidated with mainland China’s totals; the remaining 23 territories were excluded, together with the residual “rest of world” aggregate, yielding 164 country/regional units. The other excluded entries are predominantly historical or residual categories (e.g., the former Soviet Union and the Netherlands Antilles) or small economies with partial or negligible mining footprint records. Across the benchmark years, these excluded entries accounted for less than 0.5% of global mining output value, carbon emissions, and water footprints (0.29%, 0.45%, and 0.31% in 2023). The 164 retained units therefore capture more than 99.5% of global mining activity and footprints, indicating that the exclusions do not materially bias the results or alter global representativeness.
The balanced relationship in the MRIO system is expressed using the Leontief inverse matrix, as in Equation (1).
Here, denotes the total output matrix of MI, is the identity matrix, and represents the technical coefficient matrix defined as (), where indicates the intermediate demand of sector s in country , and corresponds to the total output of sector in country . The term constitutes the Leontief inverse matrix [28]. designates the final demand matrix for the MI.
Let denote the final demand of sector in country in the final demand matrix . Based on the water consumption and carbon emissions of sector in country , the water use intensity matrix and carbon emission intensity matrix are calculated as shown in Equations (2)–(4).
The EEMRIO model can quantify the resource and emissions footprints of different industries [29,30]. To distinguish on-site emissions and water use from supply-chain-embodied burdens, the quantified MWF and MCF were decomposed into direct and indirect components, as presented in Equation (4).
and denote the indirect water and carbon footprints of the MI, respectively, while and denote its direct water and carbon footprints, respectively; the overall flow diagram is illustrated in Figure S2.
2.1.2. CRITIC Method for Objective Weighting and Coupling Analysis of Water-Value-Carbon Nexus
To objectively reveal the intrinsic interactions and relative importance of resource consumption, output value, and carbon emissions, we applied the Criteria Importance Through Intercriteria Correlation (CRITIC) method to determine the weighting coefficients , and . This approach quantifies each indicator’s information content (standard deviation) and inter-indicator conflict (correlation), thus avoiding subjective bias [31]. It is especially suited to the pandemic-impacted weighted component among the water-carbon-value (WVC) system in mining, providing a robust basis for the WVC ternary diagram and coupling intensity model. The CRITIC method assumes an original dataset comprising objects and evaluation criteria, as shown in Equation (5).
Based on the dataset defined in Equation (5), the computation of the weighting coefficients, and via the CRITIC method proceeds in three steps. The three-step procedure—benefit/cost indicator normalization, estimation of each indicator’s information capacity from its standard deviation and its conflict with the other indicators, and the aggregation of the normalized information capacities into the final weights—is derived in detail in Equations (S1)–(S7) of the Supplementary Information; the resulting weights (Table S3) enter the WVC coupling model below.
Resource consumption, output value, and carbon emissions (WVC) in the mining industry are closely interrelated, forming an inherently coupled system. To investigate the internal linkages within this system, the present study developed a WVC coupling-analysis framework. It employed a ternary plot of correlation coefficients to visualize the pairwise relationships among its components. Correlation coefficients range from 0 to 1, with lower values indicating weaker associations. The mathematical formulation of the WVC coupling-analysis framework is given in Equations (6) and (7)
, , and are the relative coefficients for , , and , respectively; , and represent the mean values of , , and ; denotes the coupling intensity.
where , and are the normalization values of , , and . A larger value indicates greater significance of that factor in the system.
2.1.3. Structural Decomposition Analysis & Gini Coefficient
Structural decomposition analysis is an effective approach for identifying driving factors of different indicators [32]. Based on research into pandemic-induced disruptions, this study defined four factors to investigate feedback in the mining industry: (i) Intensity effect ; (ii) Structural linkages effect ; (iii) Population scale effect ; and (iv) Per capita demand effect .
Furthermore, to comprehensively uncover the overall impact of pandemic disturbances, we conducted a year-by-year driver analysis for the period 2018–2023, encompassing the pre-pandemic baseline, the pandemic interval, and the post-pandemic recovery phase, thereby providing a holistic characterization of fluctuation dynamics. The decomposition of driving factors based on structural decomposition analysis (SDA) was conducted as shown in Equation (9)
where represents emissions from the MI, and and represent the base year and changed year, respectively. When any one of the three factors in Equation (9) changes, the other two remain constant, enabling observation of emission variations across different indicators under distinct driving factors.
The SDA framework outlined above allowed us to disentangle the contribution of four factors to year-on-year changes in mining emissions. Meanwhile, in the context of the pandemic, this study examined the unequal global distribution of MWF and MCF by introducing the Gini coefficient as a quantitative metric, which was first proposed by Corrado Gini to measure inequality in specific indicators [33]. And it has been widely applied in resource and environmental inequality studies [34,35,36], offering a robust, interpretable, and comparable quantification of distributional disparities. The calculation process is shown in Equation (10).
G represents the Gini coefficient; represents the number of countries; represents the volume and of country ; and represents the cumulative share of MV across country . The Gini coefficient ranges between 0 and 1, where a higher value indicates more significant inequality in resource distribution or emissions for the given year.
2.1.4. The GM (1,1)–Markov Model
The GM (1,1)–Markov model, initially proposed by Deng and subsequently refined by Li et al., is a practical gray-system modelling approach that combines the GM (1,1) forecasting mechanism with a Markov-chain correction to improve short-term prediction accuracy for non-stationary series [23,37]. The original sequence which consists of the annual values of MWF, MV, and MCF, is transformed via a one-time accumulated generating operation (1-AGO) into a new series . Furthermore, the generated series can be closely modeled by the following first-order whitening differential equation in Equations (11)–(13)
Here, denotes the -step transition probability from state to state (). And it can be expressed by Equation (11):
As shown in Section 3.3, Predictive accuracy was assessed using three standard gray-model statistics—the mean relative error (MRE, Δ), the posterior deviation ratio (PDR, C), and the probability of small error (PSE, P)—classified into four quality grades (Excellent, Good, Qualified, and Unqualified). For all three indicators and countries, the GM (1,1)–Markov predictions passed the triple validation tests and outperformed the baseline GM (1,1) model, reducing Δ by roughly 18–43% across the eighteen country–indicator–scenario combinations. The full derivation, state-partitioning details, and validation statistics are provided in the Supporting Information (Text S1).
Two counterfactual scenarios were constructed to isolate pandemic-associated impacts. The no-pandemic scenario was calibrated on 2004–2018 and used to simulate the counterfactual trajectory for 2019–2025. The pandemic scenario was calibrated on 2004–2023 to incorporate the full pandemic-era regime and projected for 2024–2025; 2023, the final observed year and the transition toward normalized pandemic management, served as the observed reference year for calibration and comparison rather than as an out-of-sample forecast. Because the two scenarios share identical model structure, data sources, and sector aggregation, their difference quantifies the deviation of observed mining systems from the pre-pandemic trajectory. We interpret this difference as pandemic-associated rather than strictly causal, since other post-2018 developments, such as geopolitical conflicts, commodity-price cycles, and technological change, may overlap with pandemic effects. The no-pandemic projections for 2019–2025 and the pandemic projections for 2024–2025 are out-of-sample, and their reliability is supported by the validation statistics and the comparison with the baseline GM (1,1) model in Section 3.3, and the comparison with the baseline GM (1,1) model in Section 3.3, while the robustness of the model is further validated in Text S4.
2.2. Data Source
The primary data source for this study is the Eora26 database from 2004 to 2023 [38,39], which provides sectoral MRIO data for 189 countries/regions across 26 sectors. Numerous studies employing the Eora26 database have demonstrated its data quality and the cross-country comparability achievable after database harmonization [40,41,42]. The water-use and carbon-emission data are compiled by Eora from the Water Footprint Network (WFN) and Emissions Database for Global Atmospheric Research (EDGAR). The latest licensed Eora26 database was utilized. To reduce potential bias arising from incomplete resource or emissions coverage, several countries and regions exhibiting anomalous or insufficient information were removed from the initial set of 189 economies (see Table S2 in Supplementary Information). Population data were obtained from the World Bank Open Data, downloaded and processed for normalization and subsequent statistical analyses.
3. Results and Discussion
3.1. Post-Pandemic Mining Flows: Concentrated Value, Dispersed Water-Carbon Pressures
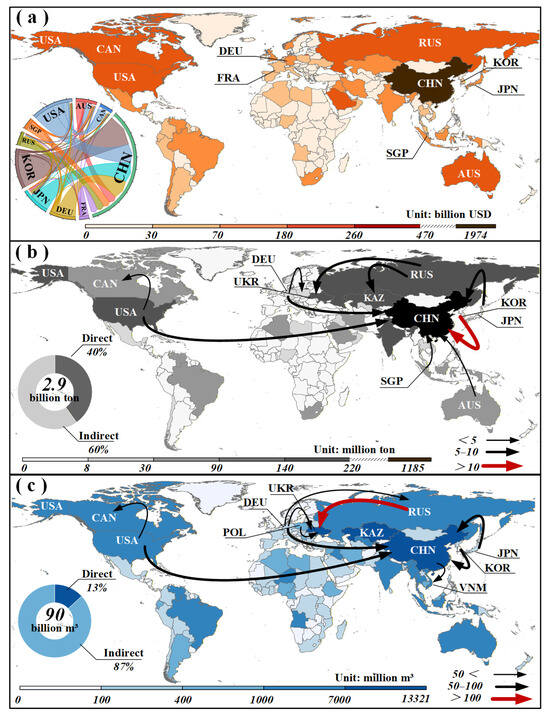
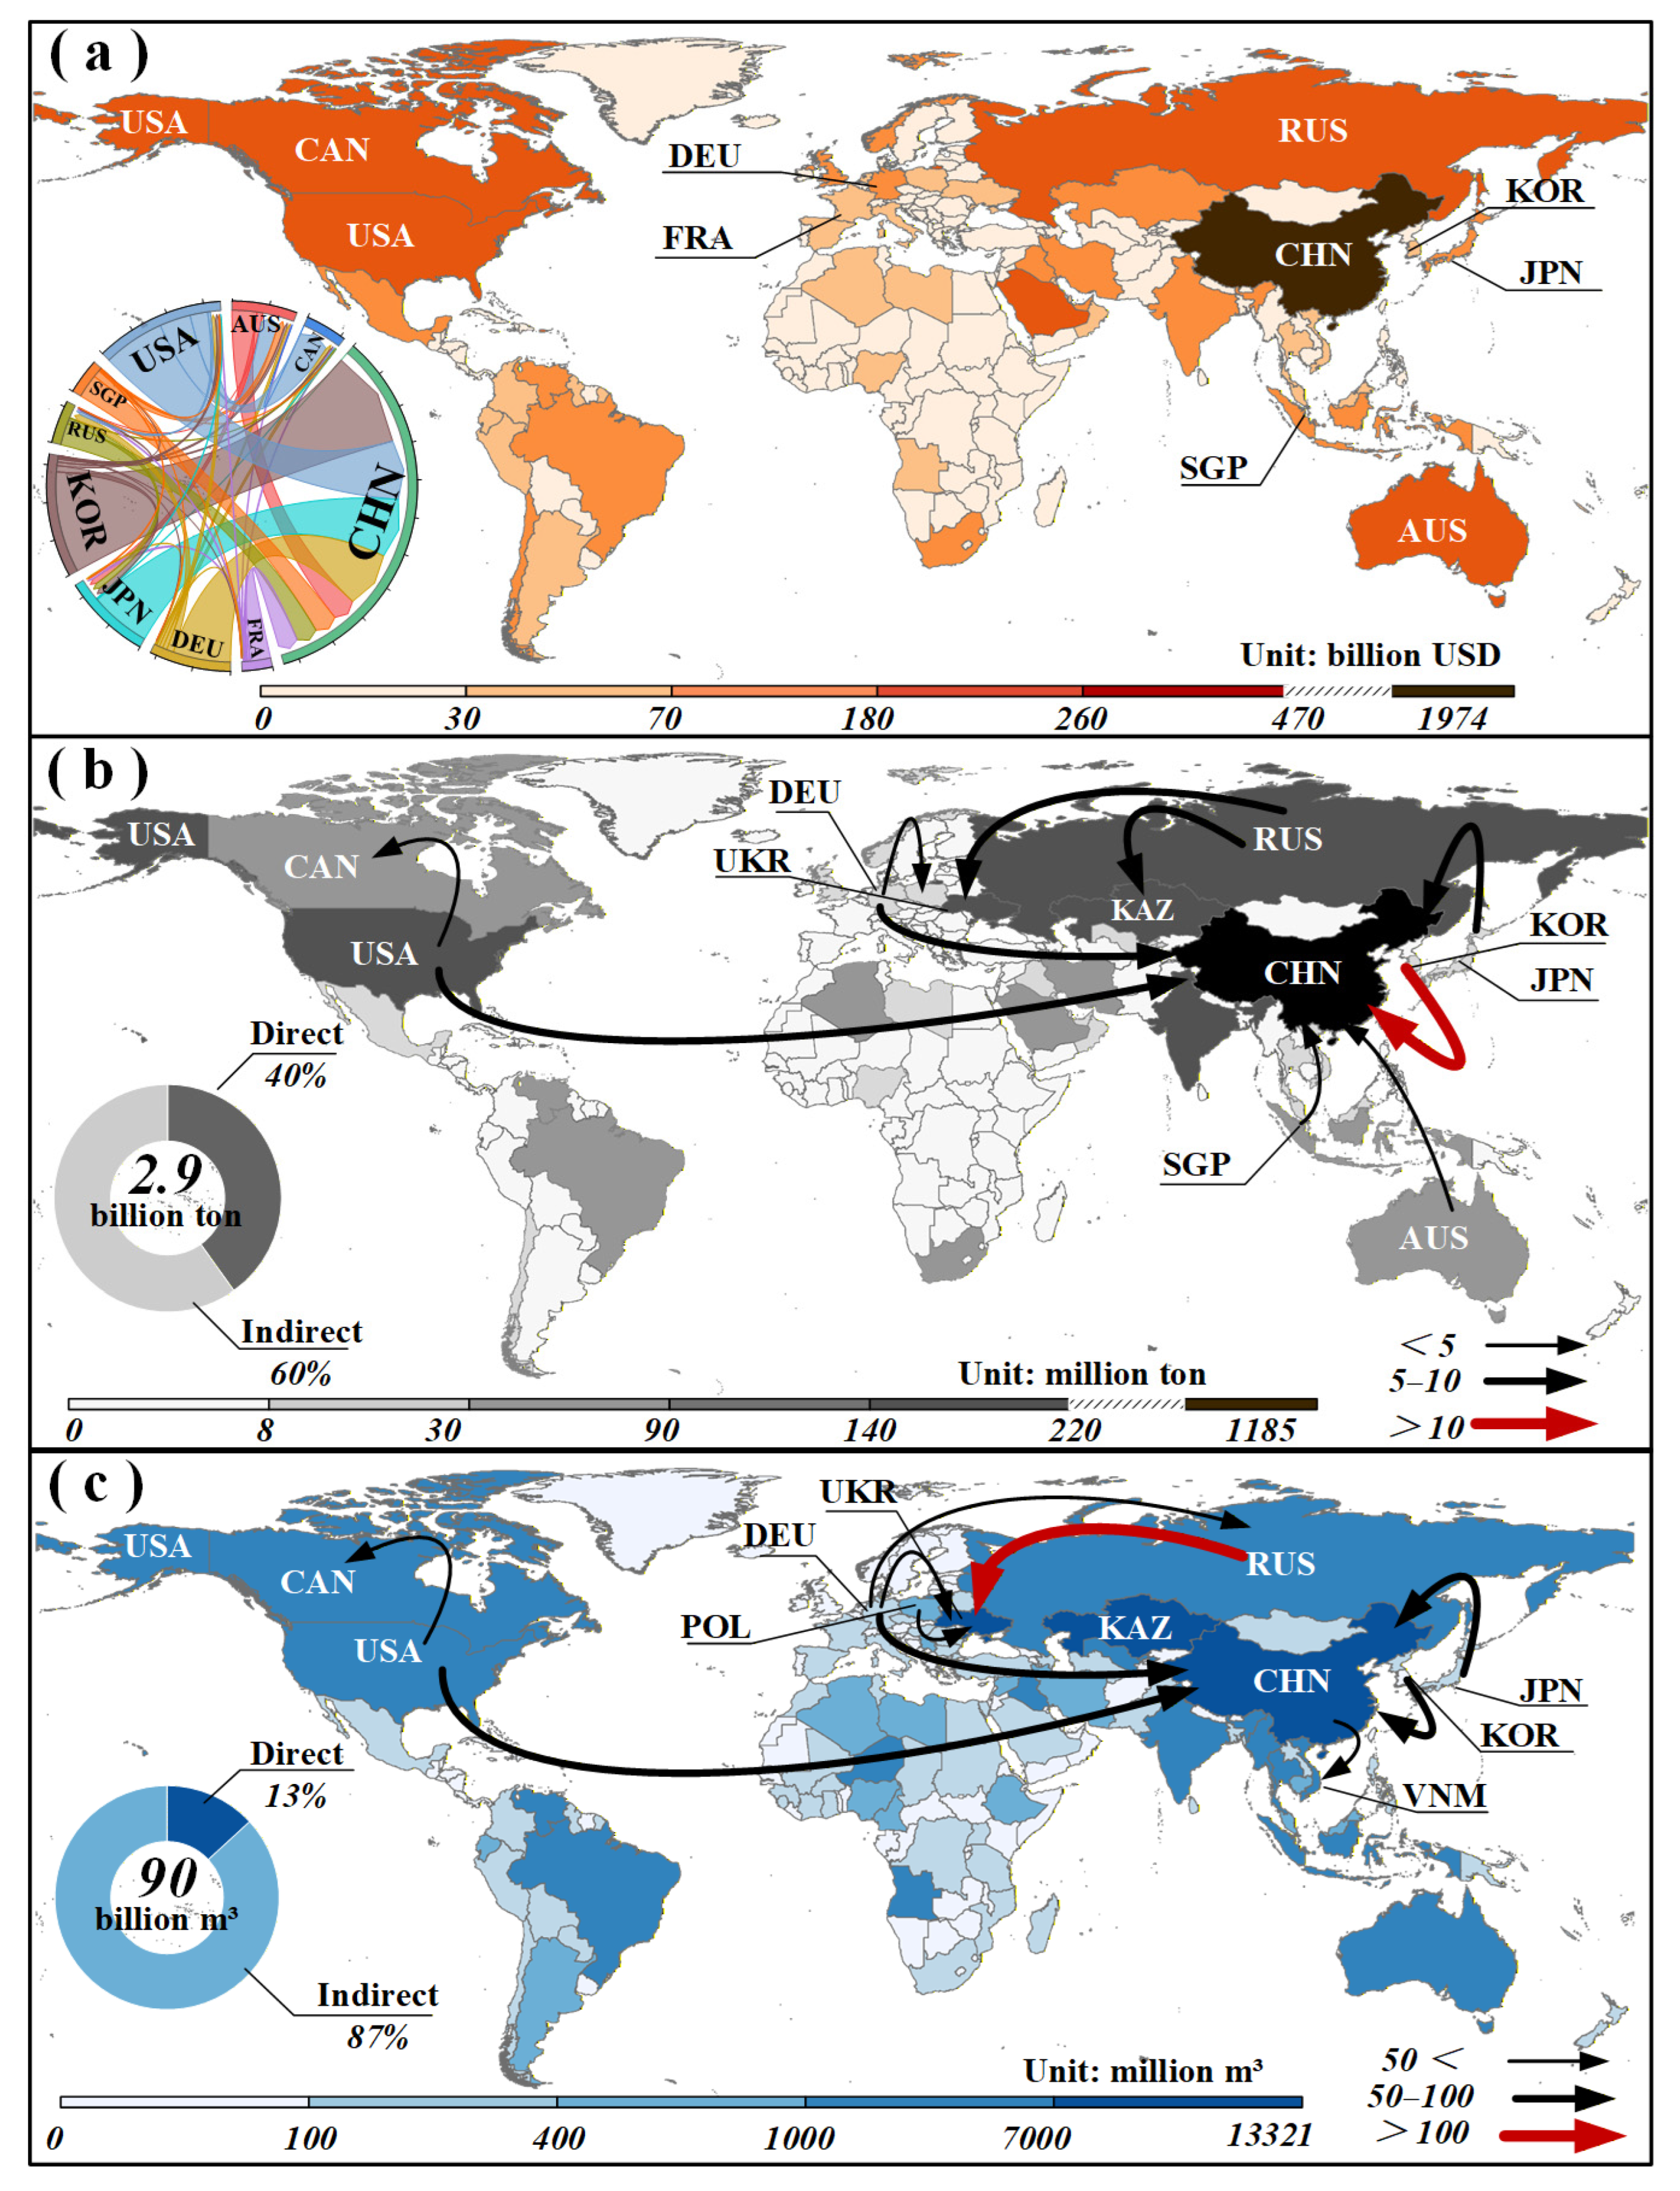
In 2023, as the world transitioned out of pandemic controls, China occupied a central position in the global mining industry. Figure 1a–c present the key features of the global MI’s water–carbon–value flows for that year. As shown in Figure 1a, China’s MV reached US$1.9 trillion, accounting for 30.1% of the global total, nearly four times that of the United States, placing China at the center of the global post-pandemic recovery. This central position is further emphasized by its extensive cross-border flow network: all the world’s top ten MV flows involve China. Among them, the US$28 billion flow from South Korea to China not only reflects the deep integration of Northeast Asia’s industrial chains but also exemplifies the ongoing restructuring of regional supply chains—a shift accelerated by the pandemic, as companies moved away from previous reliance on more distant or concentrated production bases (Global Critical Minerals Outlook 2025, 2024). Furthermore, this result indicates that geographically proximate trade networks in mining intermediate products tend to be more stable. Such resilience and timeliness, while always advantageous, became particularly pronounced during the pandemic transition phase compared to pre-pandemic periods, highlighting the adaptive capacity of regional supply configurations.
Figure 1.
Global distribution of MV, MCF, and MWF in 2023. Note: (a–c) represent the MV, MCF, and MWF, respectively; (b,c) show the top 10 pathways for MCF and MWF.
Figure 1b,c depict the characteristics of the MCF and the MWF, respectively. Each footprint concentrates among leading mining countries; however, the extent and distribution of burdens differ, revealing distinct spatial signatures. In the MCF, direct emissions account for 40%, highlighting the significant role of producer responsibility. Notably, South Korea’s transfer of 10.6 million tons of MCF to China reveals that although China gains substantial economic benefits from trade, these benefits are coupled with locked-in high carbon emissions. This situation poses challenges to deep decarbonization in both countries and reflects structural hurdles faced by traditional energy sectors under carbon neutrality goals. In contrast, MWF is dominated by indirect consumption, which accounts for 87%, revealing the supply-chain embedded nature of water resource use in mining activities. Kazakhstan ranks first globally in MWF with 13.3 billion m3, driven primarily by the S13. Electricity, Gas and Water sector, indicating its energy sector’s heavy reliance on water resources, followed by Ukraine (11.3 billion m3) and China (10.5 billion m3). While their spatial hotspots partially overlap (e.g., China, the US, Russia), the flows of value, carbon, and water differ markedly in direction, intensity, and structure. Economic linkages are multidirectional, in contrast to the carbon footprint, which is highly centralized in China and predominantly indirect. The water footprint, while also centered on China, is even more indirect and exhibits a distinct regional flow pattern, highlighting the system’s intricate spatial architecture. The significant spatial divergence among resource uses, emissions distribution and economic activity suggests a structural decoupling within the water–carbon–economy system.
In 2023, China’s domestic mining value added grew modestly by 2.3%, while value added from deep-processed products using imported mining intermediates increased by 5.0% [43]. This highlights China’s role as a hub for mining and manufacturing during the recovery period. While this model fosters value gains, it also amplifies the environmental pressure across supply chains. China not only bears domestic production emissions but also absorbs substantial cross-border embodied carbon emissions through mining supply chains, incurring high environmental costs. In Kazakhstan and Ukraine, mineral extraction activities, supported by weak infrastructure and rich mineral resources, contribute to large volumes of MWF [44,45]. These, combined with geopolitical conflicts, exacerbate regional water stress.
3.2. Tripolar Differentiation of Water, Carbon Footprint, and Output Value in the Mining Industry Across the Global Mining Network
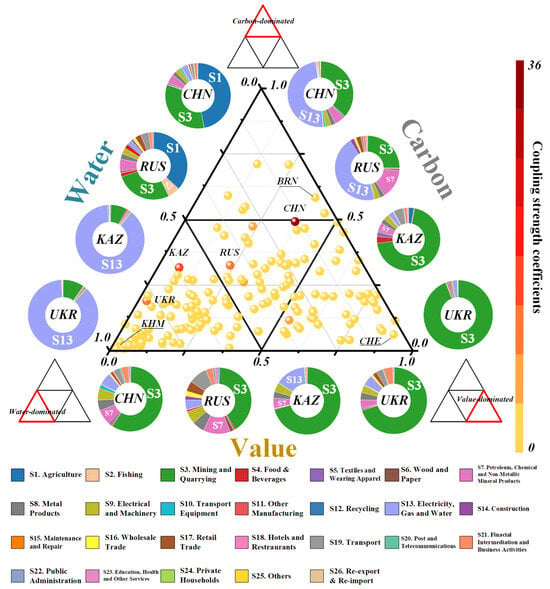
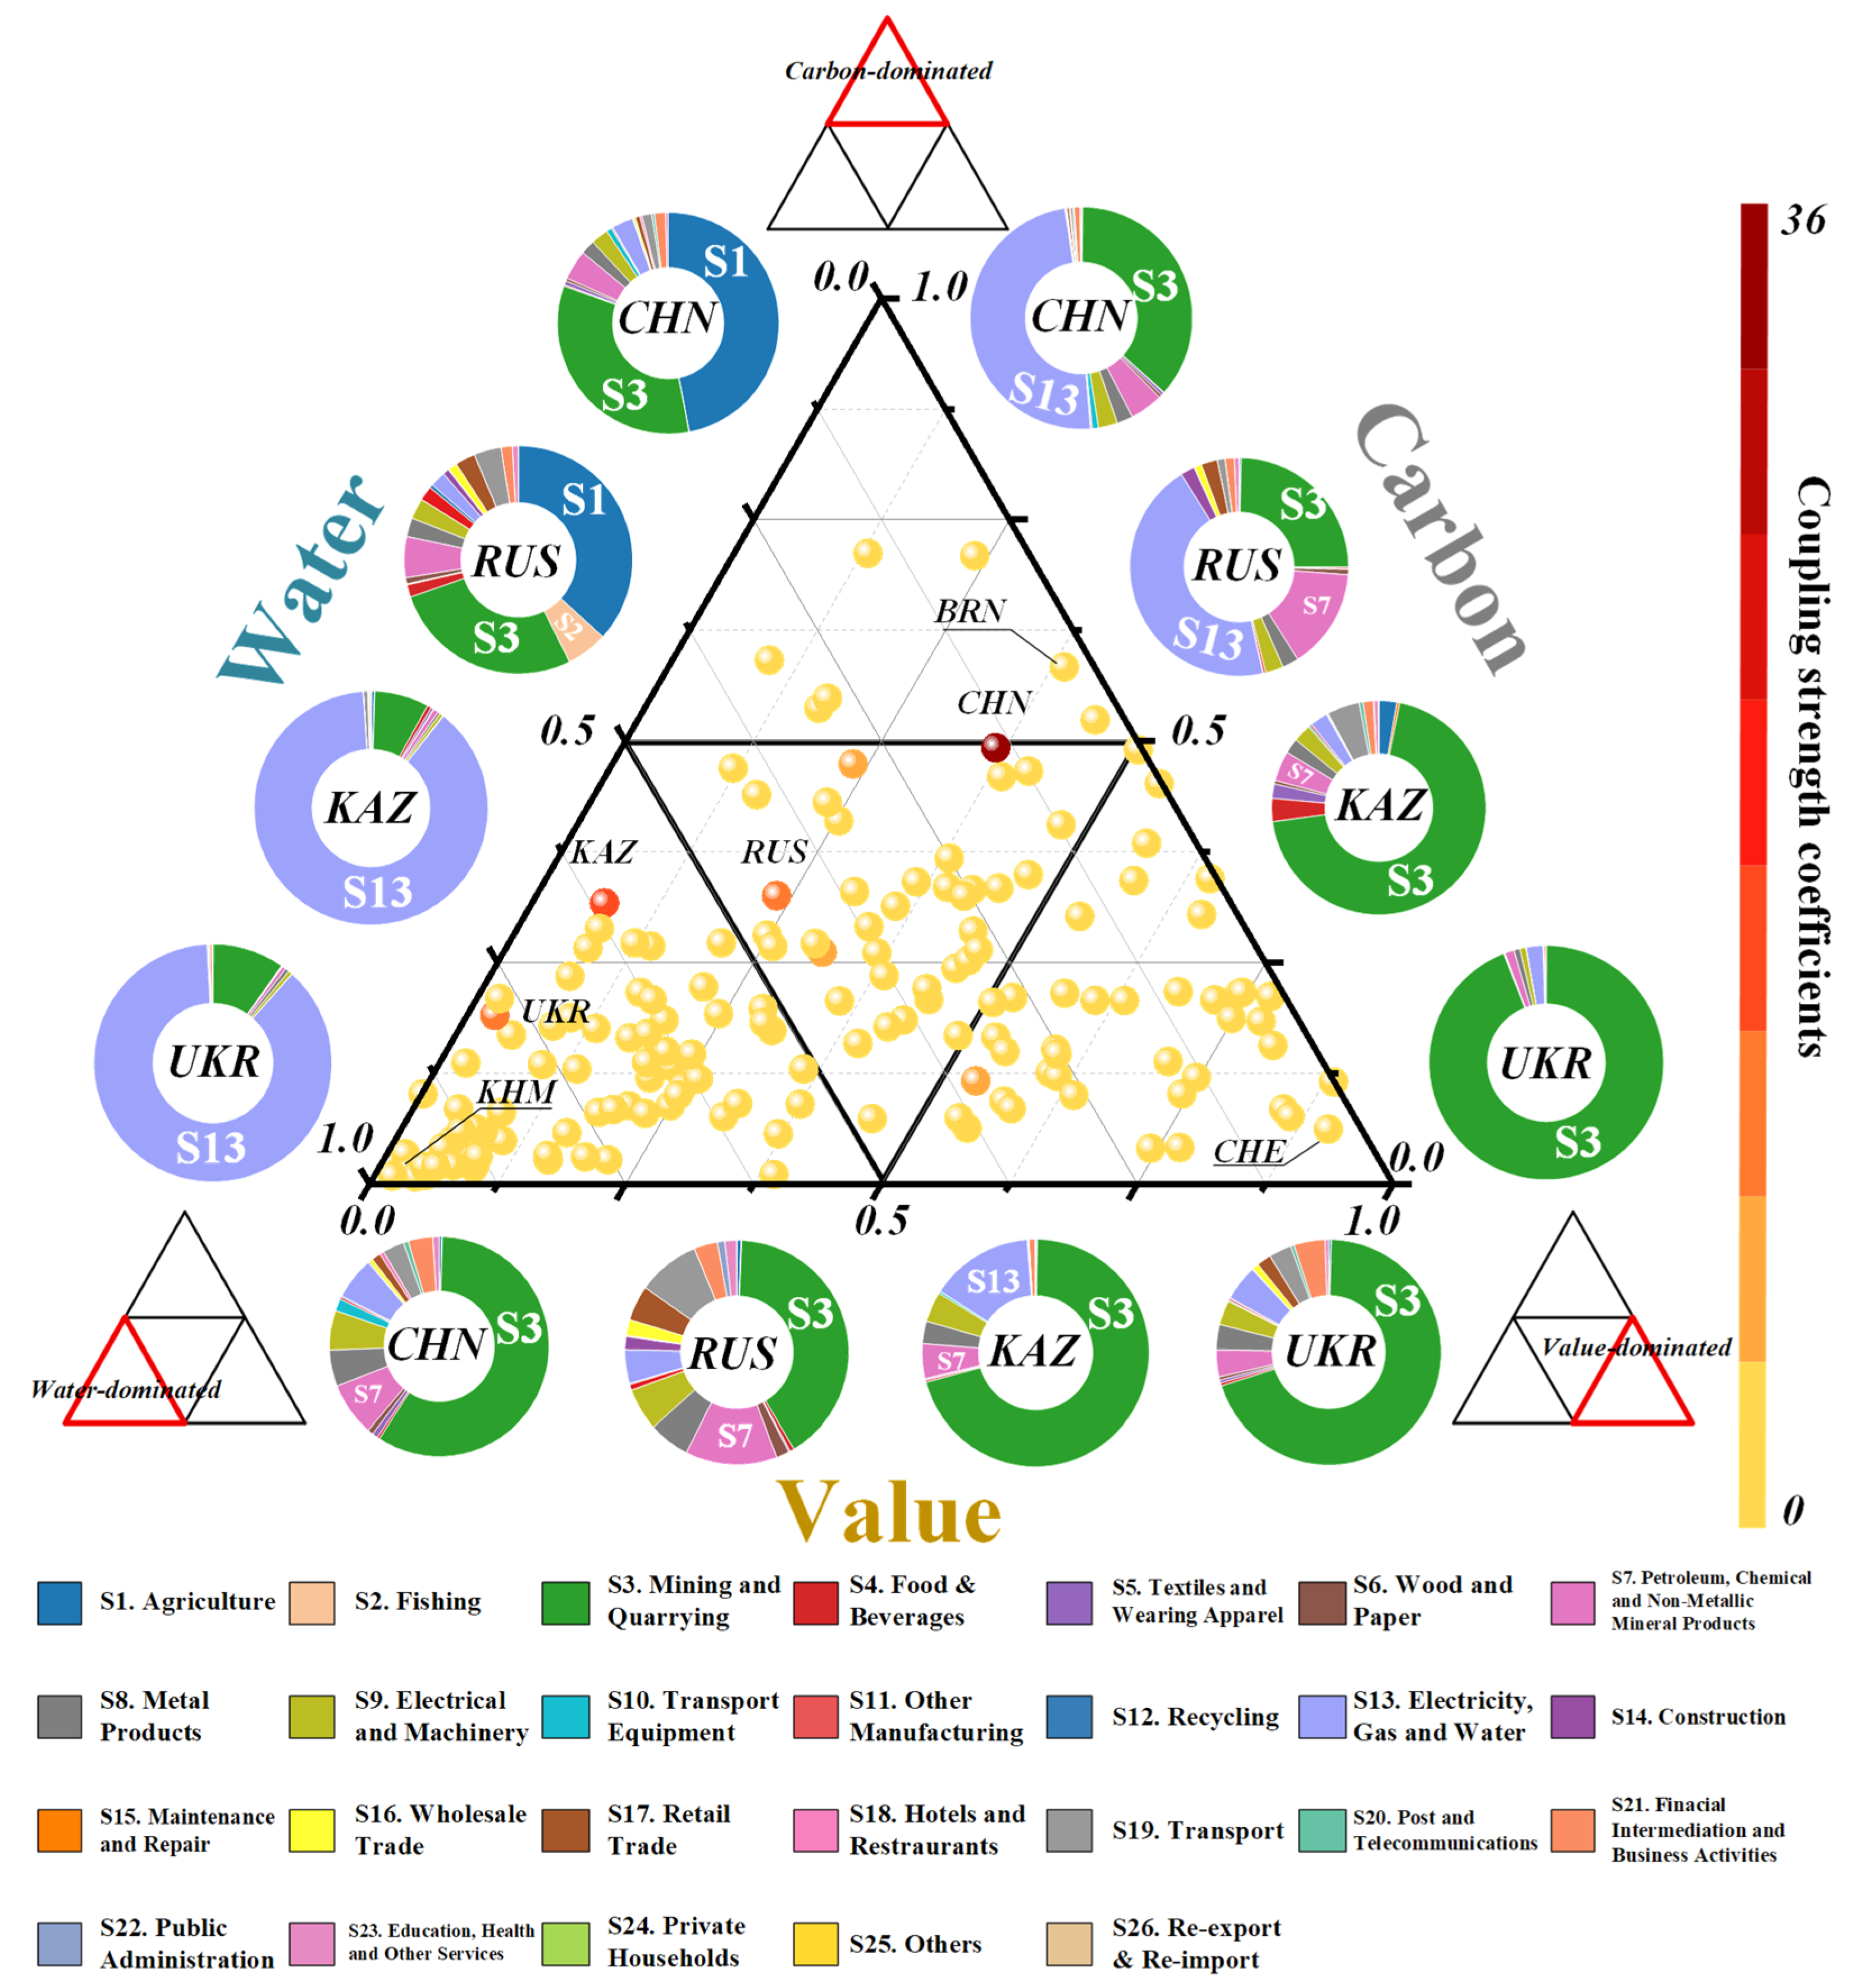
The WVC coupling model (Figure 2) reveals that a majority of countries cluster within the water-dominated quadrant. This finding is further corroborated by the CRITIC-based objective weighting method (Table S3); the CRITIC analysis measures indicator importance, i.e., the statistical contribution of each dimension to the composite WVC index, rather than coupling strength or the relative composition of individual country profiles. Water receives the highest statistical weight, indicating that the water dimension contributes most to cross-country differentiation in the WVC index. Collectively, these results therefore show that water is the most important discriminating dimension of mining-related environmental pressure across countries, rather than demonstrating by themselves that water scarcity is the most binding constraint. The water-dominated clustering in Figure 2 and this high weight together suggest that water-related pressure dominates the WVC index for most countries.
Figure 2.
Integrated assessment of the W–C–V nexus with objective weighting. Note: The ternary plot summarizes standardized indicators for MWF, MCF, and MV; colors denote the coupling strength coefficient (0–36). Corner schematics indicate archetypal poles, while annular charts report sectoral composition (S1–S26) for four representative mining economies (CHN, RUS, KAZ, UKR). This visualization links cross-country W–C–V positions to underlying industrial structures.
The spatial distribution of value creation, emissions, and water use exhibits a distinct tripolar pattern: one group, exemplified by Switzerland, is characterized by high value creation and low environmental consumption, functioning primarily as financial hubs in the mining value chain; the second group, represented by Brunei shows a close alignment between carbon emission and economic value, reflecting resource export driven economies and carbon lock-in effect; the third group, represented by Cambodia (KHM), shows extreme water stress, where mining-related water demand far exceeds its shares of value and carbon, posing severe local water security challenges via supply chain pathways.
China, Russia, Kazakhstan and Ukraine emerge as the four most significant countries in this mining coupling analysis. China and Russia exhibit a relatively balanced WVC structure. China shows a slight carbon-dominated bias, indicating substantial value creation accompanied by above-average carbon responsibility, while a comparatively lower water share indicates efficiency gains in water use across mining and related industries. Russia displays similar traits, consistent with its industrial scale and technological level in mining. Sectoral decomposition shows that most of the MV in China and Russia derives from the mining sector itself, supported by comprehensive downstream industrial linkages. Their MWF is primarily driven by agriculture. A concrete example of this mechanism is found in the supply chain for mining explosives. Key components like cotton and corn starch are agricultural products whose cultivation is highly water-intensive. The water used for their irrigation effectively becomes part of a mine’s indirect water footprint, forming an invisible “water bridge.” This means that a drought in farming areas can, via these supply chain linkages, pose operational risks to distant mining activities. Notably, electricity generation accounts for a large share of MCF in CHN and RUS, emphasizing the power sector as the key leverage point for MI decarbonization.
By contrast, KAZ and UKR exhibit an almost complete dependence of MV on the MI itself, accompanied by high environmental footprints and low value creation. Their MWF and MCF reveal a pronounced disconnect between environmental impact and economic benefit. In both countries, the MWF attributable to the Electricity, Gas, and Water sector even exceeds that of the Mining and Quarrying sector itself, accounting for 88.3% in KAZ and 87.6% in UKR. By comparison, the corresponding shares in CHN and RUS are only 3.1% and 2.2%, respectively. This marked disparity underscores a significant water lock-in dilemma in the mining sectors of Kazakhstan and Ukraine, reflecting not only constrained energy pathways but also the combined effect of water scarcity and insufficient institutional resilience in water governance. KAZ is in an arid region of Central Asia, whereas UKR has been considerably affected by military conflicts that have disrupted power grids. According to [46,47], between 2022 and 2026, large-scale attacks on Ukraine’s critical energy infrastructure generated systemic spillover risks within interconnected European electricity systems, propagating through electricity trade flows, balancing constraints, and price volatility across ENTSO-E countries. In response, Ukrainian energy operators have relied on resilience strategies such as modular backup power systems and digital monitoring and management solutions, while shifting toward alternative, more water-intensive electricity generation methods and thereby might elevate indirect water consumption. Heavy reliance on such energy-intensive and water-dependent power infrastructure exposes mining operations to pronounced vulnerabilities. The burden of water-intensive operations can directly increase operational expenditure and squeeze profits by raising electricity costs. Furthermore, water-induced disruptions can ripple across the entire mining value chain, from extraction to processing, threatening production, export revenues, and national income. Ultimately, this model might constrain industrial upgrading and lock their energy structure into a water scarcity trajectory, undermining their competitiveness and resilience in a world transitioning toward green energy.
3.3. Spatial Inequality and SDA Decomposition of Mining Water and Carbon Dynamics
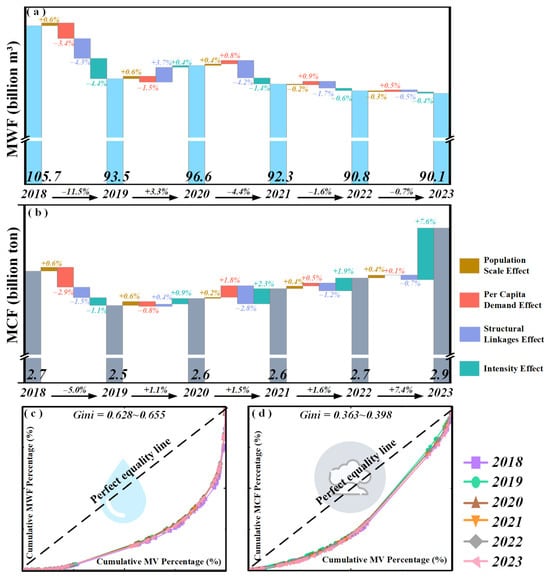
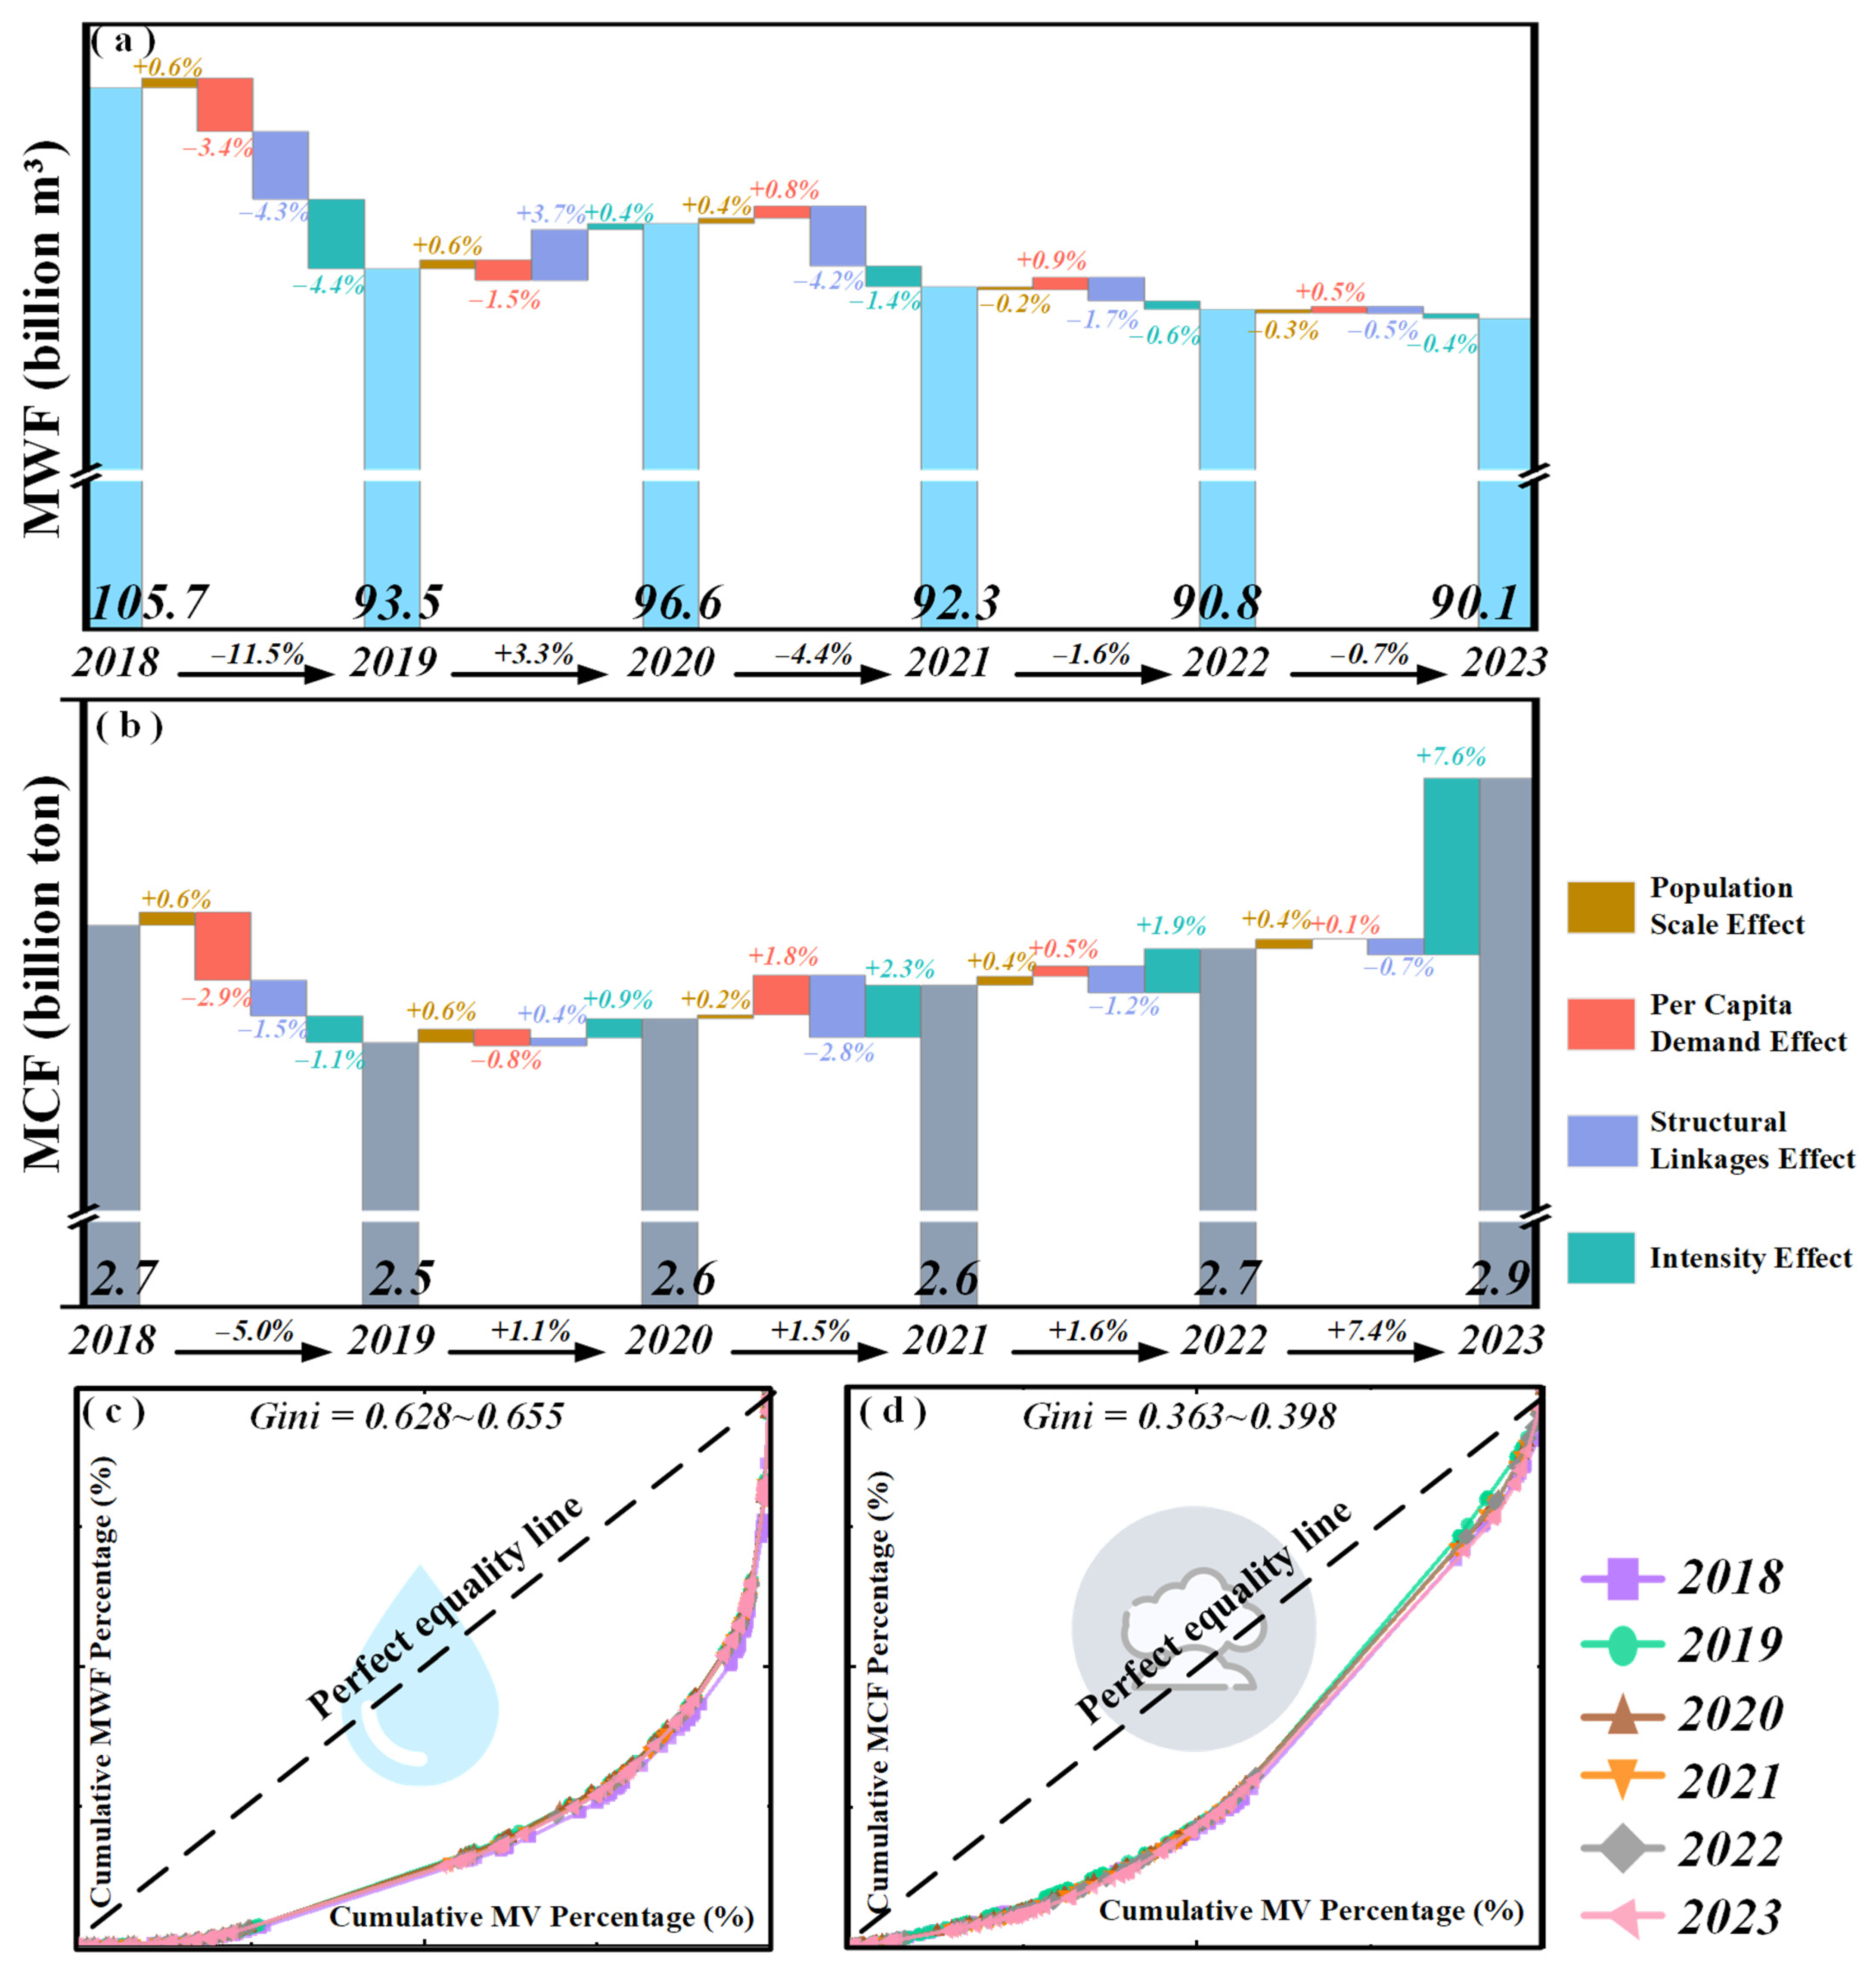
As shown in Figure 3, Gini coefficient analysis and SDA reveal deepening contradictions in the MI’s environment–economy system. From 2018 to 2023, the total MWF declined overall, whereas the MCF exhibited a V-shaped rebound, indicating a systemic divergence between improvement in water use efficiency and goals for carbon control. In Figure 3a,b, SDA decomposes the mechanisms behind these dynamics.
Figure 3.
Lorenz curves of global MI (a) MWF and (b) MCF for 2018–2023, alongside structural decomposition of (c) MWF and (d) MCF into population scale, per-capita demand, structural linkage, and intensity effects.
During the pandemic peak (2020–2021), structural linkage effects primarily drove reductions in MWF and MCF (MWF: −4.2%; MCF: −2.8%), while carbon intensity effects rose counterfactually (+2.3%), exposing the joint problem of industrial shutdowns and subsequent uncoordinated recovery in the mining industry. This indicates that the recovery was structurally unbalanced, prioritizing the restart of carbon-intensive upstream operations (like raw ore extraction) over more efficient downstream processing. This unbalanced the system’s production profile, causing the economic output to rebound in a more carbon-intensive manner, thereby decoupling the trends of water and carbon footprints.
During the recovery phase (2021–2023), especially for the MCF, the driving forces evolved markedly. The carbon intensity effect surged from +1.9% to +7.6% (2022–2023). In stark contrast, the contributions of the other three decomposed factors to the total MCF change remained marginal, fluctuating within a narrow range of approximately ±1% to ±2%. This pronounced disparity underscores that the intensified carbon intensity effect was the predominant driver of the carbon rebound. Simultaneously, the persistently positive per-capita demand effect signaled continued pressure on the MWF from residential energy end-use. Time-use evidence from 2019 to 2023 shows that pandemic-era shifts toward in-home activities and away from out-of-home activities and travel largely persisted, with most in-home activities remaining elevated in 2023 relative to the pre-pandemic period [48]. This sustained household demand, a legacy of stay-at-home habits, indirectly strains water resources by sustaining the production levels in the energy sector, which in turn relies on water-intensive mining operations for its fuel supply. These divergent drivers collectively shaped the distinct and uneven spatial patterns of environmental pressures documented in the subsequent spatial and regional analysis.
The specific Gini coefficients quantifying spatial disparity in Figure 3c,d are provided in Table S4. They reveal that the coefficient for MWF remained high (0.655 → 0.637), substantially exceeding that for MCF (0.395 → 0.398). This pattern indicates that water stress is highly concentrated in mining hub countries and implies rigid constraints from resource endowments and technological barriers on water management. The MCF’s Gini coefficient fell temporarily during the 2020–2021 mid-pandemic period (to 0.363) but rebounded to pre-pandemic levels by 2023 (0.398), empirically echoing IEA’s report on energy rebound in emerging economies [49].
Table 1 further clarifies continental heterogeneity. During the pandemic (2019–2021), the regions with the most pronounced fluctuations in MWF and MCF shifted from Europe (MWF: 32.1% → 9.8%) and North America (MCF:−131.2% → 0.1%) to Asia (MWF: 22.5% → 60.7%; MCF: 118.0% → 71.7%). This suggests that the pandemic significantly disrupted mining supply chains in Europe and America. Particularly in America, lockdowns and supply chain breakdowns caused a short-term demand shock (−130.3%) in the MI, with only a limited rebound in subsequent periods. These trends indicate that the pandemic initially severed or weakened supply chains centered on Europe and North America, which relied heavily on local energy-intensive mining.
Table 1.
Continental four-factor structural decomposition analysis of MWF and MCF.
Meanwhile, global demand and production capacity were reconfigured and reinforced along supply chains centered on Asian manufacturing. These pathways heavily depend on raw material and energy inputs sourced within Asia, thereby activating and amplifying upstream mining-related water and carbon footprint pathways. Europe and North America partially decoupled their environmental impacts through reductions in carbon intensity and lower demand. In contrast, South America and Oceania’s mining exports made carbon intensity particularly vulnerable to global demand fluctuation. These regional disparities highlight the need for integrated water–carbon governance and a more equitable distribution of mining-related environmental responsibility.
3.4. Pandemic-Induced Economic Suppression and Transient Environmental Gains in Major Energy Consumers
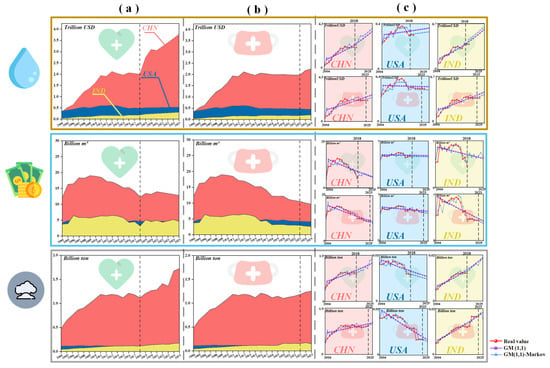
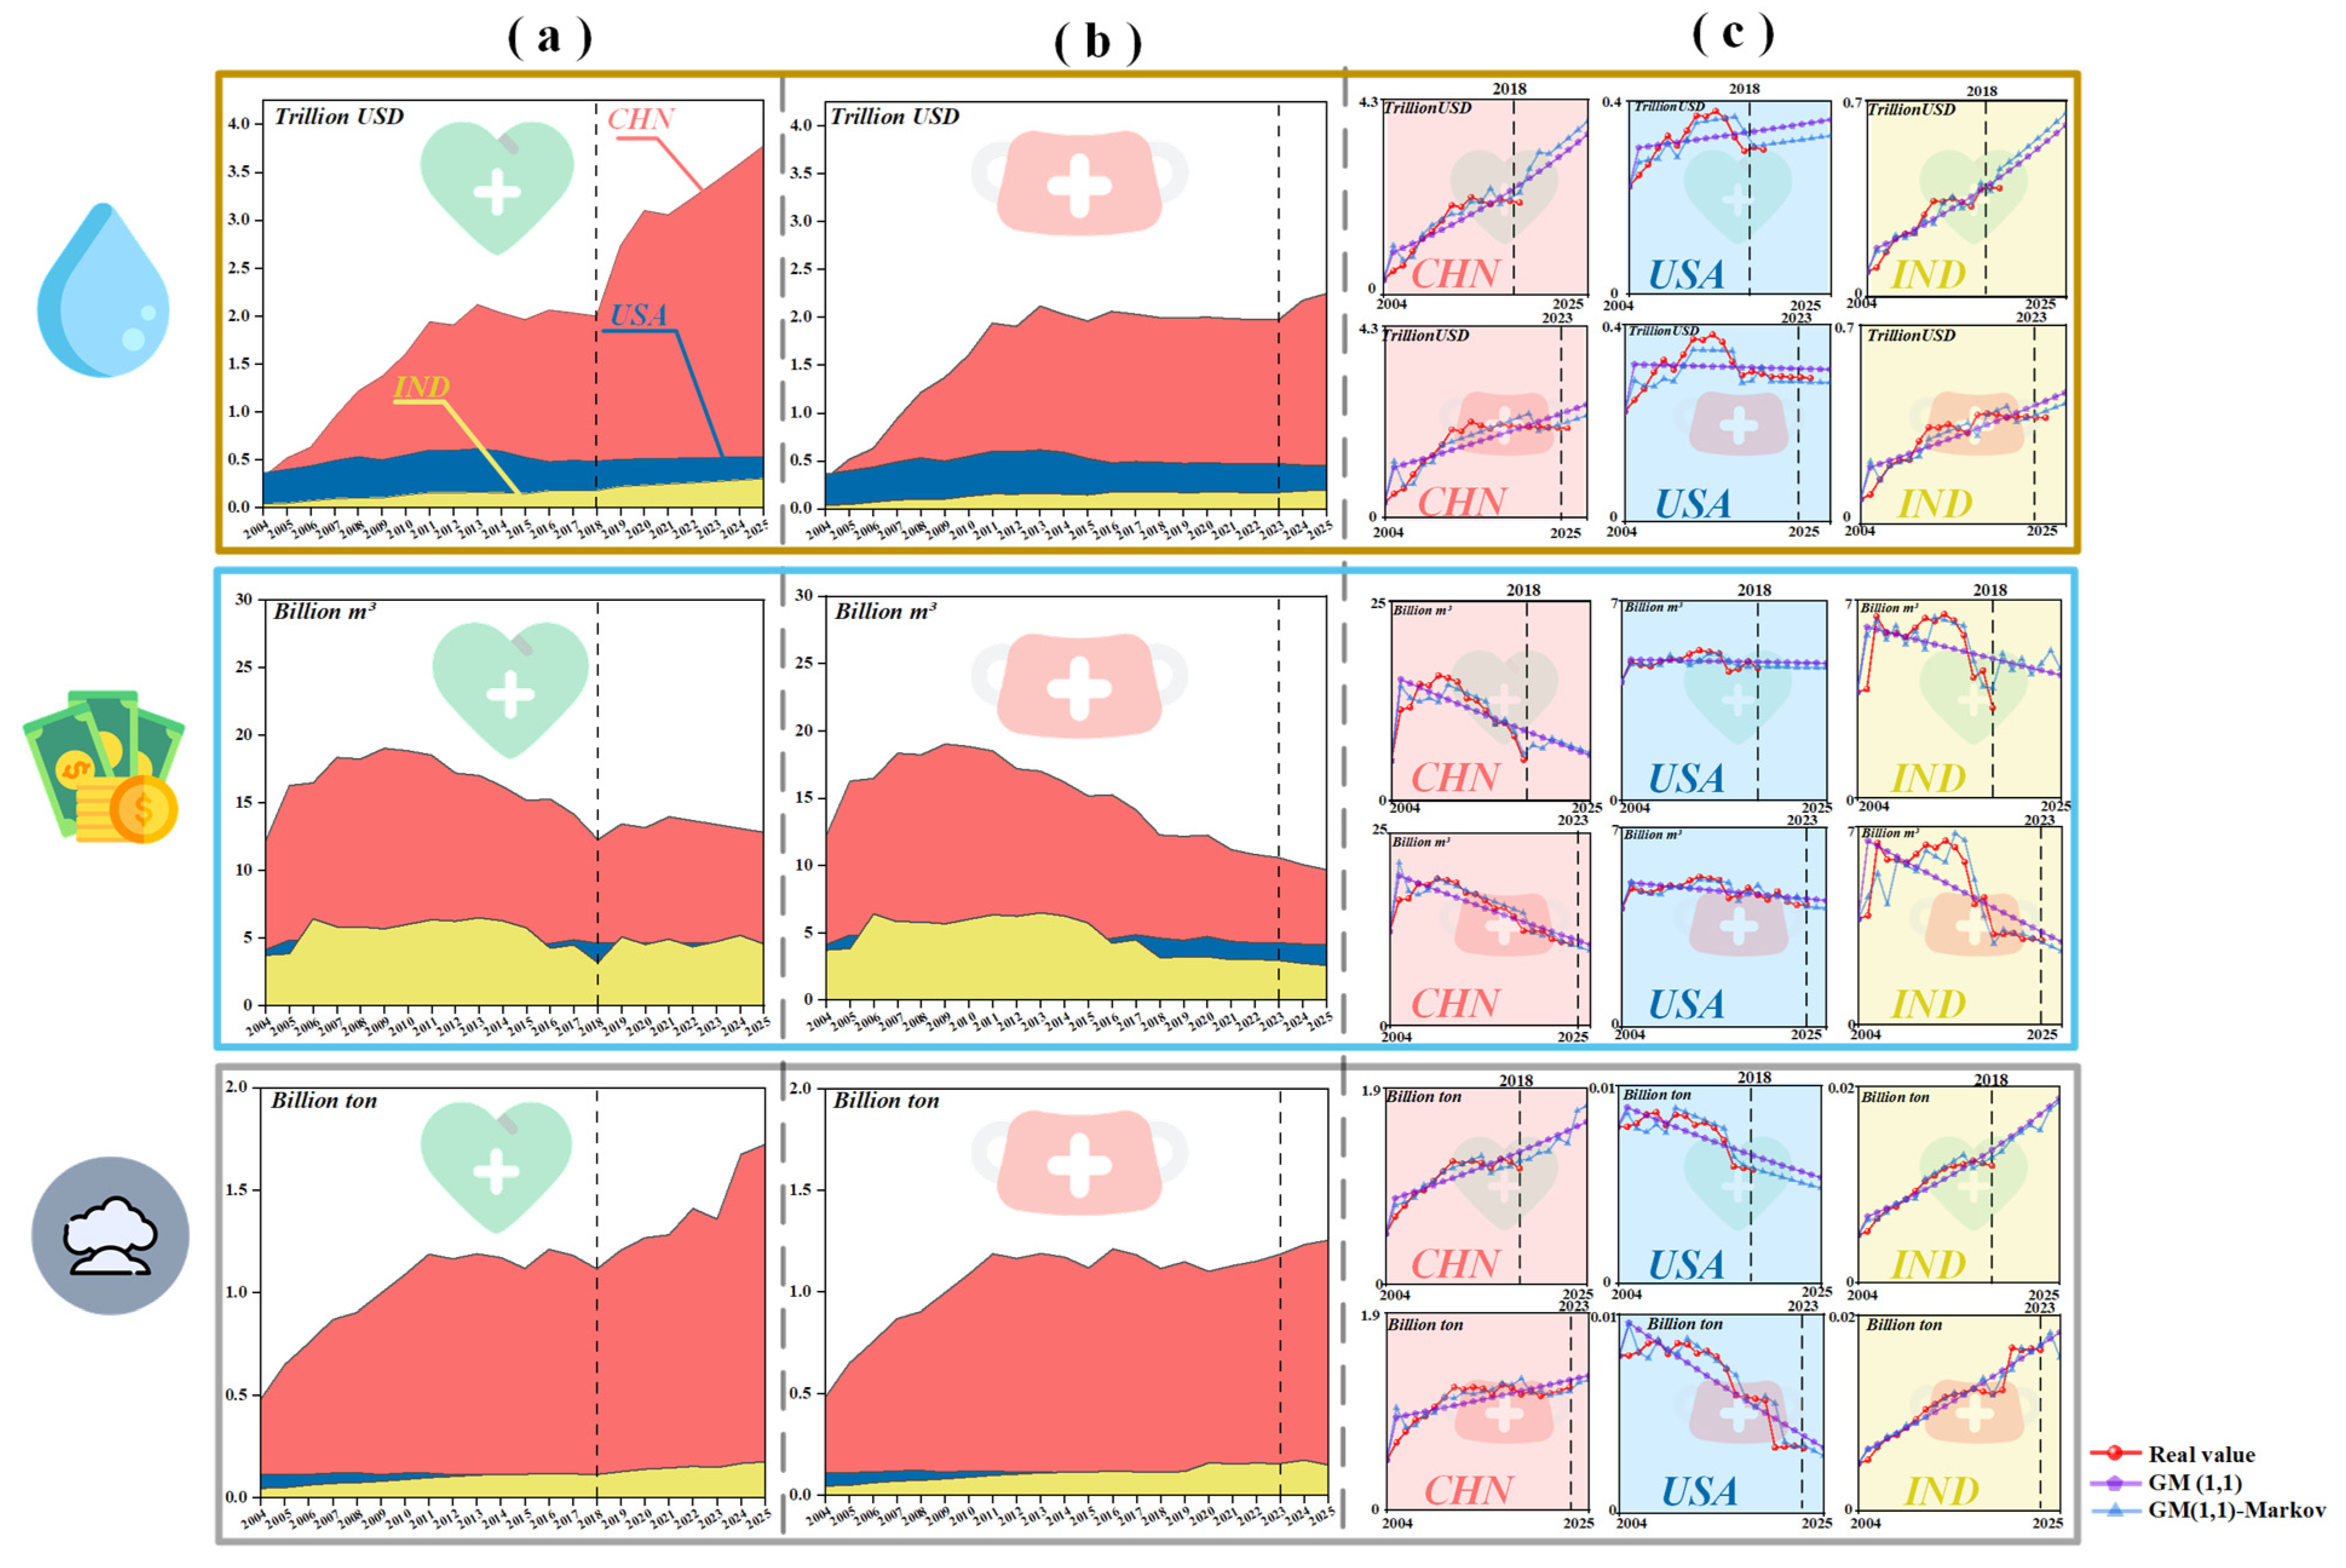
According to [21], China, the United States, and India have consistently ranked as the top three countries in terms of primary energy consumption. Based on the MI’s conditions of these three nations, two scenarios, with and without the pandemic, and the GM (1,1)-Markov model were employed to simulate the short-term impacts of this public health shock. As illustrated in Figure 4, the model’s goodness-of-fit passed the triple validation tests for predictive accuracy. In addition, comparison with the baseline GM (1,1) model indicates that the GM (1,1)-Markov approach substantially reduced prediction errors, with detailed results provided in Table 2 and Table 3. The two scenarios share the same model structure, data, and aggregation; therefore, the projected differences for 2025 quantify the pandemic-associated deviation from the pre-pandemic trajectory.
Figure 4.
Dual-scenario simulation of MWF, MV, and MCF of China, the United States, and India; (a) Simulated MWF, MV, and MCF under the no-pandemic scenario; (b) Simulated MWF, MV, and MCF under the pandemic scenario; (c) Actual values and modelled results (GM (1,1) and GM (1,1)–Markov) for all three indicators across the three countries. Note: The vertical dashed line marks the boundary between the training and simulation periods. Under the no-pandemic scenario, the model is calibrated on data from 2004 to 2018 and then used to simulate outcomes from 2019 through 2025; under the pandemic scenario, the model is calibrated on data from 2004 to 2023 and used to simulate outcomes for 2024–2025, with 2023 serving as the observed reference year.
Table 2.
Accuracy Assessment of GM (1,1) and GM (1,1)-Markov Predictions for China, the United States, and India under Pandemic and Non-Pandemic Scenarios.
Table 3.
Validation criteria for gray-model predictions: Δ, C, and P with quality grades.
As a key indicator of industrial activity, MV shows pronounced pandemic-induced effects, with impacts varying by each country’s position and resilience within the global mining supply chain. Under the no-pandemic scenario, China’s MV in 2025 is projected at USD 3.77 trillion. Under the pandemic scenario, it fell to USD 2.25 trillion, a decline of approximately 40%. This severe contraction reflects China’s central role in the global supply chain, where its position as the world’s manufacturing hub means that output fluctuations directly translate into substantial economic losses [50]. The United States, a capital-intensive economy with a diversified industrial structure, exhibits greater shock resistance, as seen in its more moderate MV fall from USD 0.53 trillion to USD 0.46 trillion (13%). This resilience is notable in light of evidence that economic policy uncertainty can exert long-term detrimental effects on environmental quality in the United States [51]. In contrast, India’s labor and resource-intensive mining sector, where precarious human labor often relies on extreme extractions [52,53], coupled with constrained public health capacity, rendered it more vulnerable to severe disruption. This vulnerability is evidenced by its MV contraction from USD 0.30 trillion to USD 0.19 trillion (37%). These findings not only highlight the substantial suppressive effect of the pandemic on global mining activities but also underscore the differentiated impacts arising from supply chain resilience.
Notably, the pandemic-induced economic slowdown concurrently generated temporary environmental co-benefits, manifested as substantial reductions in both MWF and MCF. The simulation results indicate a marked short-term decline in the environmental burdens of mining and related industries. This decline was driven by the abrupt suppression of energy demand and production activities during the public health crisis. India exhibited the largest reduction in MWF (43.2%), followed by China (24.3%) and the United States (10.6%). This decline may reflect India’s highly water-intensive extraction model, which relies on surface and groundwater and is particularly sensitive to operational disruptions. The pandemic-induced reduction in MCF was largest in the United States (40.2%), compared with China (27.3%) and India (15.1%). This outcome may reflect the United States’ diversified and highly globalized supply chain structure, implying that deeper international integration of production and logistics can strengthen the resilience of the economy-resource-environment system.
4. Conclusions and Policy Implications
4.1. Conclusions
This study constructed a WVC coupling framework for global MV, MWF, and MCF. By segmenting the timeline into pre-pandemic, peak-pandemic, and recovery intervals, and integrating SDA, Gini coefficients, and GM (1,1)–Markov scenario simulations, we systematically quantified the pandemic’s short-term impacts and changes in their spatial inequalities.
The principal findings are as follows: (i) China occupied a central role in the 2023 mining recovery. It not only bears substantial domestic environmental pressures from mining activities but also imports indirect environmental burdens through cross-border supply chains, underscoring its dual role as a global mining hub and environmental externality transmitter; (ii) Prominent mining economies and water leverage. China, Russia, Kazakhstan, and Ukraine stand out as prominent mining countries in 2023. Among them, improving water-use efficiency offers a practical pathway to improving overall MI’s sustainability; (iii) Drivers of mid-pandemic fluctuations and spatial disparity. Structural linkage and intensity effects were the primary drivers of mid-pandemic fluctuations in MWF and MCF. Moreover, spatial inequality in water stress remains significantly higher than that in carbon emissions, indicating persistent technological and resource constraints on water management; (iv) A diversified industrial structure significantly enhances resilience to systemic shocks. However, the temporary environmental gains observed during the pandemic proved unsustainable, revealing deep structural dependencies and vulnerabilities at national and global scales.
4.2. Policy Implications
The COVID-19 pandemic exposed critical fragilities within the global mining industry, revealing how systemic shocks can disrupt resource flows, amplify environmental pressures, and exacerbate spatial inequalities. Rather than treating pandemic-induced disruptions as temporary anomalies, policymakers should leverage these insights to build a more resilient and sustainable mining industry.
First, address the industry’s acute water dependency. Since objective weighting results confirm that water scarcity constitutes a more binding constraint than carbon emissions, policies should mandate water footprint accounting that covers both direct use [54,55,56] and supply-chain-embedded water and introduce tiered water-intensity reduction targets [57]. Fiscal incentives and green procurement criteria can accelerate the adoption of water-smart technologies, such as dry processing systems, mine-water recycling, and closed-loop circuits [58], particularly in water-stressed mining hubs like Kazakhstan and Ukraine. Second, tackle the carbon rebound effect observed during recovery. The post-lockdown surge in carbon intensity, especially across Asian supply chains, underscores the risk of reverting to carbon-intensive mining operations. Decarbonization should center on greening the electricity mix powering mining activities [59], supported by mine-site renewable integration, operational electrification [60], and carbon pricing mechanisms that penalize high-emission extraction [61]. Third, enhance supply chain resilience through spatial and structural diversification. The pandemic-triggered concentration of value in China, alongside embodied environmental burdens, highlights systemic vulnerability. Strategic stockpiling of critical minerals, nearshoring processing capacity, and regional cooperation on mineral supply agreements can mitigate single-point failure risks while distributing environmental responsibilities more equitably [62]. Finally, institutionalize global mechanisms for equitable environmental governance. Cross-border flows of embodied water and carbon call for transnational accountability. International agreements should incorporate footprint-based responsibility sharing, pairing technology transfer and climate finance with obligations for high-income mineral importers to support sustainable mining practices in resource-rich, capacity-constrained regions.
In the post-pandemic era, to prevent the mining industry from reverting to the fragile, resource-intensive development path, it is essential to guide the sector toward a “carbon-value” integrated transformation pathway. This is a core measure for achieving synergistic development of ecological security during the economic recovery process.
Supplementary Materials
The following supporting information can be downloaded at: https://www.mdpi.com/article/10.3390/environments13080454/s1, Text S1. The CRITIC method for objective weighting of the water-carbon-value nexus; Text S2. The GM(1,1)−Markov model: Full methodology, implementation, and validation; Text S3. Robust analysis of the results; Text S4. Limitation; Figure S1. Monte Carlo simulation of China’s MCF and MWF in 2023; Figure S2. Framework of the EEMRIO model; Table S1. Notation used in the GM(1,1)−Markov model; Table S2. List of the 164 countries included in the study with corresponding codes; Table S3. CRITIC-based evaluation results for MWF, MV, and MCF indicators; Table S4. Gini coefficients of MWF and MCF in the mining industry, 2018–2023; Table S5. 2004-2023: MVs, MCFs, and MWFs from China, the United States, and India; Table S6−S25. MV, MWF, and MCF from 164 countries over 2004−2023.
Author Contributions
Conceptualization, Z.W., X.Y. and L.-C.L.; methodology, Z.W., X.Y. and L.-C.L.; software, X.Y. and L.-C.L.; validation, Y.X. and J.Z.; formal analysis, L.L. and C.-H.L.; resources, X.Y. and L.-C.L.; data curation, X.Y. and L.-C.L.; writing—original draft preparation, X.Y.; writing—review and editing, X.Y., M.S.; visualization, X.Y. and L.-C.L.; supervision, Z.W., J.Z. and L.-C.L.; funding acquisition, Z.W., Y.X., J.Z. and L.-C.L. All authors have read and agreed to the published version of the manuscript.
Funding
This work was supported by the Science and Technology Research Project of Hubei Province (D20234501); The Foundation of Talent Introduction Project of Hubei Polytechnic University (23xjz05R); Natural Science Foundation of Hubei Province of China (2026AFC0771); The Key Research and Development Projects of Hubei Province (2023BCB142); The Open Fund of Hubei Key Laboratory of Mine Environmental Pollution Control and Remediation (2026KQHJR01); The Research Projects of China MCC17 Group Co., Ltd. (No. SQY2024CXY11).
Data Availability Statement
The original contributions presented in this study are included in the article. Further inquiries can be directed to the corresponding author.
Conflicts of Interest
The authors declare no conflicts of interest.
References
- Lahmiri, S. Price disorder and information content in energy and gold markets: The effect of the COVID-19 pandemic. Energy Nexus 2024, 16, 100343. [Google Scholar] [CrossRef] [Scilit]
- Siddique, A.; Shahzad, A.; Lawler, J.; Mahmoud, K.A.; Lee, D.S.; Ali, N.; Bilal, M.; Rasool, K. Unprecedented environmental and energy impacts and challenges of COVID-19 pandemic. Environ. Res. 2021, 193, 110443. [Google Scholar] [CrossRef] [Scilit] [PubMed]
- Gebreslassie, M.G. COVID-19 and energy access: An opportunity or a challenge for the African continent? Energy Res. Soc. Sci. 2020, 68, 101677. [Google Scholar] [CrossRef] [Scilit] [PubMed]
- Wang, B.; Zhang, J.; Wang, X.; Zhang, X. Assessing the impact of changing environment on coal mining water use in China. Water-Energy Nexus 2023, 6, 177–186. [Google Scholar] [CrossRef] [Scilit]
- Salem, J.; Amonkar, Y.; Maennling, N.; Lall, U.; Bonnafous, L.; Thakkar, K. An analysis of Peru: Is water driving mining conflicts? Resour. Policy 2021, 74, 101270. [Google Scholar] [CrossRef] [Scilit]
- Kazapoe, R.W.; Addai, M.O.; Amuah, E.E.Y.; Dankwa, P. Characterization of groundwater in southwest Ghana: Implications for sustainable agriculture and safe water supply in a mining-dominated zone. Environ. Sustain. Indic. 2024, 22, 100341. [Google Scholar] [CrossRef] [Scilit]
- Wang, G.; Wu, J.; Zhou, J. Multi-objective Optimization Research on the Achievement Path of Dual Carbon Goals in Mining Enterprises. Energy 2025, 333, 137194. [Google Scholar] [CrossRef] [Scilit]
- Enemuo, M.; Ogunmodimu, O. Transitioning the mining sector: A review of renewable energy integration and carbon footprint reduction strategies. Appl. Energy 2025, 384, 125484. [Google Scholar] [CrossRef] [Scilit]
- Yan, X.; Chen, J. Analysis of carbon emissions from social water cycle in the Pearl River Delta of COVID-19: Perspectives from water-energy-carbon nexus. J. Clean. Prod. 2024, 448, 141175. [Google Scholar] [CrossRef] [Scilit]
- Srinivasan, S.; Shrestha, S.; Harris, D.R.; Lewis, O.; Rock, P.; Silwal, A.; Pustz, J.; Oh, S.; Barboza-Salerno, G.; Stopka, T.J. Employment industry and opioid overdose risk: A pre-and post-COVID-19 comparison in Kentucky and Massachusetts 2018–2021. Spat. Spatio-Temporal Epidemiol. 2025, 52, 100701. [Google Scholar] [CrossRef] [Scilit] [PubMed]
- Naseri, M.; Delbosc, A.; Kamruzzaman, L. Did the built environment attenuate reductions in leisure walking during COVID-19? A quasi-panel study. J. Transp. Health 2025, 44, 102101. [Google Scholar] [CrossRef] [Scilit]
- International Energy Agency (IEA). Energy Technology Perspectives 2023. Available online: https://www.iea.org/reports/Energy-technology-perspectives-2023 (accessed on 3 July 2025).
- Wang, Q.; Li, S.; Li, R.; Jiang, F. Underestimated impact of the COVID-19 on carbon emission reduction in developing countries–a novel assessment based on scenario analysis. Environ. Res. 2022, 204, 111990. [Google Scholar] [CrossRef] [Scilit] [PubMed]
- Wang, Q.; Han, X. Spillover effects of the United States economic slowdown induced by COVID-19 pandemic on energy, economy, and environment in other countries. Environ. Res. 2021, 196, 110936. [Google Scholar] [CrossRef] [Scilit] [PubMed]
- Jia, Z.; Wen, S.; Lin, B. The effects and reacts of COVID-19 pandemic and international oil price on energy, economy, and environment in China. Appl. Energy 2021, 302, 117612. [Google Scholar] [CrossRef] [Scilit] [PubMed]
- Ata, B.; Pénzes, J.; Pakrooh, P.; Lotfata, A.; Mohammed, S. Comprehensive analysis of factors influencing EU-countries household energy consumption (2000–2022): Trends and vulnerability to COVID-19 and the Russia-Ukraine war. Energy Strategy Rev. 2025, 59, 101728. [Google Scholar] [CrossRef] [Scilit]
- Asaoka, R.; Umishio, W.; Kagi, N.; Hayashi, M.; Sawachi, T.; Ueno, T. Office environments and worker satisfaction with thermal and air environments during and after the COVID-19 pandemic in Japan. Build. Environ. 2025, 268, 112349. [Google Scholar] [CrossRef] [Scilit]
- Mayr, K.F.; Agnolucci, P. The impact of public health measures on household energy consumption: The case of the UK COVID-19 tier system. Energy Econ. 2024, 138, 107788. [Google Scholar] [CrossRef] [Scilit]
- Mao, Z.; Wang, H.; Bibi, S. Crude oil volatility spillover and stock market returns across the COVID-19 pandemic and post-pandemic periods. Resour. Policy 2024, 88, 104333. [Google Scholar] [CrossRef] [Scilit]
- Gillingham, K.T.; Knittel, C.R.; Li, J.; Ovaere, M.; Reguant, M. The short-run and long-run effects of Covid-19 on energy and the environment. Joule 2020, 4, 1337–1341. [Google Scholar] [CrossRef] [Scilit] [PubMed]
- Klynveld Peat Marwick Goerdeler (KPMG). Energy Institute Statistical Review of World Energy. Available online: https://kpmg.com/xx/en/our-insights/esg/statistical-review-of-world-energy.html (accessed on 4 July 2025).
- Ju-Long, D. Control problems of grey systems. Syst. Control Lett. 1982, 1, 288–294. [Google Scholar] [CrossRef] [Scilit]
- Li, G.D.; Yamaguchi, D.; Nagai, M. A GM (1, 1)–Markov chain combined model with an application to predict the number of Chinese international airlines. Technol. Forecast. Soc. Change 2007, 74, 1465–1481. [Google Scholar] [CrossRef] [Scilit]
- Du, X.; Wu, D.; Yan, Y. Prediction of electricity consumption based on GM (1, Nr) model in Jiangsu province, China. Energy 2023, 262, 125439. [Google Scholar] [CrossRef] [Scilit]
- Yao, H.; Zhang, Q.; Niu, G.; Liu, H.; Yang, Y. Applying the GM (1, 1) model to simulate and predict the ecological footprint values of Suzhou city, China: H. Yao et al. Environ. Dev. Sustain. 2021, 23, 11297–11309. [Google Scholar]
- Guo, J.; Wu, L.; Mu, Y. An optimized grey model for predicting non-renewable energy consumption in China. Heliyon 2023, 9, e17037. [Google Scholar] [CrossRef] [Scilit] [PubMed]
- Duan, H.; Lei, G.; Shao, K. Forecasting Crude Oil Consumption in China Using a Grey Prediction Model with an Optimal Fractional-Order Accumulating Operator. Complexity 2018, 2018, 3869619. [Google Scholar] [CrossRef] [Scilit]
- Leontief, W. Environmental repercussions and the economic structure: An Input-output approach. Rev. Econ. Stat. 1970, 52, 262–271. [Google Scholar] [CrossRef] [Scilit]
- Lee, L.C.; Wang, Y.; Zuo, J.; Ping, L.Y. Exploring the Inequality and Driving Factors in China’s Tourism Industry from the Perspective of Water-Energy Nexus. J. Environ. Inform. 2025, 45, 71. [Google Scholar] [CrossRef] [Scilit]
- Sun, Y.Y.; Faturay, F.; Lenzen, M.; Gössling, S.; Higham, J. Drivers of global tourism carbon emissions. Nat. Commun. 2024, 15, 1–10. [Google Scholar] [CrossRef] [Scilit] [PubMed]
- Zhang, Q.; Fan, J.; Gao, C. CRITID: Enhancing CRITIC with advanced independence testing for robust multi-criteria decision-making. Sci. Rep. 2024, 14, 25094. [Google Scholar] [CrossRef] [Scilit] [PubMed]
- Mi, Z.; Meng, J.; Guan, D.; Shan, Y.; Song, M.; Wei, Y.M.; Liu, Z.; Hubacek, K. Chinese CO2 emission flows have reversed since the global financial crisis. Nat. Commun. 2017, 8, 1712. [Google Scholar] [PubMed]
- Gini, C. Measurement of inequality of incomes. Econ. J. 1921, 31, 124–125. [Google Scholar] [CrossRef] [Scilit]
- Li, Y.; Zhang, L.; Zhang, P.; Li, X.; Hao, Y. Water-energy-food nexus in China: An interregional comparison. Agric. Water Manag. 2024, 301, 108964. [Google Scholar] [CrossRef] [Scilit]
- Oswald, Y.; Owen, A.; Steinberger, J.K. Large inequality in international and intranational energy footprints between income groups and across consumption categories. Nat. Energy 2020, 5, 231–239. [Google Scholar] [CrossRef] [Scilit]
- Mi, Z.; Zheng, J.; Meng, J.; Ou, J.; Hubacek, K.; Liu, Z.; Coffman, D.; Stern, N.; Liang, S.; Wei, Y.-M. Economic development and converging household carbon footprints in China. Nat. Sustain. 2020, 3, 529–537. [Google Scholar] [CrossRef] [Scilit]
- Kodors, S.; Zvaigzne, A.; Litavniece, L.; Lonska, J.; Silicka, I.; Kotane, I.; Deksne, J. Plate waste forecasting using the Monte Carlo method for effective decision making in Latvian schools. Nutrients 2022, 14, 587. [Google Scholar] [CrossRef] [Scilit] [PubMed]
- Lenzen, M.; Kanemoto, K.; Moran, D.; Geschke, A. Mapping the structure of the world economy. Environ. Sci. Technol. 2012, 46, 8374–8381. [Google Scholar] [CrossRef] [Scilit] [PubMed]
- Lenzen, M.; Moran, D.; Kanemoto, K.; Geschke, A. Building Eora: A Global Multi-regional Input-Output Database at High Country and Sector Resolution. Econ. Syst. Res. 2013, 25, 20–49. [Google Scholar] [CrossRef] [Scilit]
- Fang, G.; Huang, M.; Sun, C. Revealing the hidden carbon flows in global industrial sectors—Based on the perspective of linkage network structure. J. Environ. Manag. 2024, 356, 120531. [Google Scholar] [CrossRef] [Scilit] [PubMed]
- Kobayakawa, T. Estimating the carbon footprint of post-war reconstruction: Toward a ‘greener’ recovery of Ukraine. Environ. Res. Infrastruct. Sustain. 2025, 5, 015015. [Google Scholar] [CrossRef] [Scilit]
- Zhang, J.; Wang, X.; Keeley, A.R.; Managi, S. Does participation in China-US trade impede carbon emission reduction efforts? Ecol. Econ. 2025, 238, 108732. [Google Scholar] [CrossRef] [Scilit]
- The State Councilthe People’s Republic of China (TSC). The Statistical Communiqué on the National Economic and Social Development of the People’s Republic of China in 2023. Available online: https://www.gov.cn/lianbo/bumen/202402/content_6934935.htm (accessed on 3 July 2025).
- International Energy Agency. Global Critical Minerals Outlook 2025. IEA. Available online: https://www.iea.org/reports/global-critical-minerals-outlook-2025 (accessed on 3 July 2025).
- Yang, X.; Cui, W.; Yang, X. Europe’s energy transition is accelerated by the Russia-Ukraine war: A novel assessment based on two scenario simulations. Renew. Energy 2025, 255, 123823. [Google Scholar] [CrossRef] [Scilit]
- Siddiqui, F.N.A.; Uddin, S.S. World’s Supply Chain Disruption and the Energy Conflict Between Russia and Ukraine. Glob. Politics J. 2025, 3. [Google Scholar]
- Osadcha, N.; Zaverbnyj, A. Managing the Resilience of Ukrainian Energy Companies in the Context of Military Risks and Hybrid Threats. Eur. J. Sustain. Dev. 2026, 15, 989. [Google Scholar] [CrossRef] [Scilit]
- Morris, E.A.; Speroni, S.; Taylor, B.D. Going nowhere faster: Did the COVID-19 pandemic accelerate the trend toward staying home? J. Am. Plan. Assoc. 2025, 91, 361–379. [Google Scholar] [CrossRef] [Scilit]
- International Energy Agency (IEA). World Energy Outlook 2024. Available online: https://www.iea.org/reports/world-energy-outlook-2024 (accessed on 3 July 2025).
- Gereffi, G.; Bamber, P.; Fernandez-Stark, K. China’s evolving role in global value chains: Upgrading strategies in an era of disruptions and resilience. In China’s New Development Strategies: Upgrading from Above and from Below in Global Value Chains; Springer Nature: Singapore, 2022; pp. 1–29. [Google Scholar]
- Kilinc-Ata, N.; Camkaya, S.; Akca, M.; Topal, S. The impact of uncertainty in economic policy on the load capacity factors in China and the United States (US): New evidence from novel Fourier bootstrap ARDL approach. J. Sustain. Res. 2025, 7, e250002. [Google Scholar] [CrossRef] [Scilit]
- Narayanan, Y. Multispecies slavery–environment nexus in resource extraction and animals’ ecological politics: Coercive donkey labour in Indian river sand mining. Trans. Inst. Br. Geogr. 2025, 50, e70017. [Google Scholar] [CrossRef] [Scilit]
- Sinha, J.K. Mapping India’s Economic Transition: Sectoral Shifts, Labour Productivity, and Regional Inequality in a Policy Framework for Balanced Development. J. Behav. Econ. Policy 2025, 1, 28–50. [Google Scholar] [CrossRef] [Scilit]
- Matta, G.; Pal, R.; Gjyli, L.; Mmorabet, R.E. Water footprint for sustainability under Sustainable Development Goal 6 for rejuvenation, conservation, and preservation of water resources. In Water Footprints; Elsevier: Amsterdam, The Netherlands, 2025; pp. 65–85. [Google Scholar]
- Hoekstra, A.Y. The water footprint of industry. In Assessing and Measuring Environmental Impact and Sustainability; Elsevier: Burlington, NJ, USA, 2015; pp. 221–254. [Google Scholar]
- Hu, M.; Chen, S.; Wang, Y.; Xia, B.; Wang, S.; Huang, G. Identifying the key sectors for regional energy, water and carbon footprints from production-, consumption-and network-based perspectives. Sci. Total Environ. 2021, 764, 142821. [Google Scholar] [CrossRef] [Scilit] [PubMed]
- Dong, L.; Wang, Z.; Zhou, E.; Wang, X.; Li, G.; Fan, X.; Zhang, B.; Duan, C.; Chen, Z.; Luo, Z.; et al. A novel dry beneficiation process for coal. Int. J. Coal Prep. Util. 2022, 42, 1105–1125. [Google Scholar] [CrossRef] [Scilit]
- Sharma, K.; Nagabhooshanam, N.; Dasi, S.; Srinivas, B.; Kaur, K.; Rajaram, A. Design and implementation of closed-loop water reuse systems in urban and industrial settings for maximizing resource recovery and minimizing waste. Desalin. Water Treat. 2024, 320, 100850. [Google Scholar] [CrossRef] [Scilit]
- Onat, N.C.; Mandouri, J.; Kucukvar, M.; Kutty, A.A.; Al-Muftah, A.A. Driving Sustainable Business Practices With Carbon Accounting and Reporting: A Holistic Framework and Empirical Analysis. Corp. Soc. Responsib. Environ. Manag. 2025, 32, 2795–2814. [Google Scholar] [CrossRef] [Scilit]
- Zhao, X.; Benkraiem, R.; Abedin, M.Z.; Zhou, S. The charm of green finance: Can green finance reduce corporate carbon emissions? Energy Econ. 2024, 134, 107574. [Google Scholar] [CrossRef] [Scilit]
- Döbbeling-Hildebrandt, N.; Miersch, K.; Khanna, T.M.; Bachelet, M.; Bruns, S.B.; Callaghan, M.; Edenhofer, O.; Flachsland, C.; Forster, P.M.; Kalkuhl, M.; et al. Systematic review and meta-analysis of ex-post evaluations on the effectiveness of carbon pricing. Nat. Commun. 2024, 15, 4147. [Google Scholar] [CrossRef] [Scilit] [PubMed]
- Meng, B.; Liu, Y.; Gao, Y.; Li, M.; Wang, Z.; Xue, J.; Andrew, R.; Feng, K.; Qi, Y.; Sun, Y.; et al. Developing countries’ responsibilities for CO2 emissions in value chains are larger and growing faster than those of developed countries. One Earth 2023, 6, 167–181. [Google Scholar] [CrossRef] [Scilit]

Disclaimer/Publisher’s Note: The statements, opinions and data contained in all publications are solely those of the individual author(s) and contributor(s) and not of MDPI and/or the editor(s). MDPI and/or the editor(s) disclaim responsibility for any injury to people or property resulting from any ideas, methods, instructions or products referred to in the content. |
© 2026 by the authors. Licensee MDPI, Basel, Switzerland. This article is an open access article distributed under the terms and conditions of the Creative Commons Attribution (CC BY) license.