


Abstract
The COVID-19 pandemic created a unique natural experiment to evaluate the impact of reduced human activity on urban air quality. This study assessed the effects of lockdown measures on major air pollutants across three Georgian cities with contrasting emission profiles: traffic-dominated Tbilisi, coastal Batumi, and industrial Rustavi. Daily concentrations of NO2, SO2, PM2.5, PM10, and O3 were obtained from the National Environmental Agency’s automated monitoring network for March–June 2019–2022. Following systematic missing value imputation, meteorologically adjusted interrupted time-series (segmented regression) models, incorporating daily temperature and wind speed as covariates, were used as the primary analysis; Mann–Kendall trend analysis was retained as a secondary, descriptive measure. Results were evaluated against WHO 2021 Air Quality Guidelines. Tbilisi showed the strongest lockdown response: NO2 declined by 47.9% in 2020 (vs. 2019), before rebounding fully in 2022. PM2.5 and PM10 showed attenuated reductions, reflecting continued heating combustion and dust sources. Ground-level O3 increased in Tbilisi in 2020 (+25.0% vs. 2019). Rustavi exhibited no NO2 response and an O3 decrease of 43.2% in 2020, with partial recovery in 2021–2022. Batumi showed intermediate responses, with PM2.5 and PM10 increases in 2020. Meteorologically adjusted interrupted time-series models confirmed 11 of 30 city–pollutant effect estimates after false discovery rate correction, most robustly for NO2; several borderline ozone and SO2 findings did not survive correction and are reported as suggestive only. Lockdown measures were associated with source-specific and temporary air quality improvements, after accounting for meteorological conditions. Sustained reductions require structural interventions targeting traffic, residential combustion, and industrial emissions simultaneously.
Keywords:
COVID-19; air pollution; PM2.5; PM10; NO2; SO2; ozone; lockdown; urban air quality; Georgia 1. Introduction
Air pollution is one of the leading environmental risk factors affecting human health worldwide and is associated with substantial morbidity and premature mortality. Exposure to ambient air pollutants has been linked to respiratory diseases, cardiovascular disorders, metabolic dysfunction, adverse pregnancy outcomes, and certain types of cancer [1,2]. According to the World Health Organization (WHO), millions of premature deaths annually are attributable to air pollution exposure, even at concentrations below current regulatory standards in many countries [3]. Particulate matter (PM2.5 and PM10), nitrogen dioxide (NO2), sulfur dioxide (SO2), and ground-level ozone (O3) are among the pollutants most strongly associated with adverse health outcomes and environmental degradation [1,2,3].
The Republic of Georgia has experienced increasing air quality challenges in recent decades due to rapid urbanization, growing motorization, industrial activity, and insufficient environmental regulation enforcement [4,5]. Major emission sources include aging vehicle fleets, extensive diesel fuel use, industrial combustion processes, construction activities, and inefficient energy systems [4,6]. Although the Georgian government has introduced several measures to improve environmental sustainability—including implementation of Euro 5 fuel standards, promotion of hybrid and electric vehicles, and development of climate and transport policies—air pollution remains a significant public health concern [6,7].
Air pollution patterns differ substantially across Georgian cities due to variations in population density, industrial activity, transport infrastructure, and geographic conditions. Tbilisi, the capital and largest city, experiences severe traffic congestion and elevated concentrations of traffic-related pollutants, particularly nitrogen oxides and fine particulate matter [4,8]. Rustavi, one of the country’s major industrial centers, is characterized by high levels of particulate pollution associated with metallurgical and industrial activities [5,9]. Batumi, a rapidly developing coastal city on the Black Sea, presents a different pollution profile influenced by tourism, urban growth, maritime activity, and regional atmospheric conditions [10]. These contrasting urban environments provide an opportunity to evaluate how different emission sources respond to abrupt reductions in human activity.
The COVID-19 pandemic created an unprecedented natural experiment for investigating the relationship between anthropogenic activity and air quality. Following the first confirmed case of COVID-19 in Georgia on 26 February 2020, the government implemented a series of restrictive measures aimed at controlling viral transmission, including closure of educational institutions, suspension of international travel, restrictions on mobility, curfews, business shutdowns, and social distancing policies [11,12]. Similar interventions worldwide resulted in substantial reductions in road traffic, industrial activity, aviation, and energy consumption, leading to temporary improvements in air quality in many urban regions [13,14,15,16].
Numerous international studies reported marked declines in NO2 and PM2.5 concentrations during lockdown periods, particularly in traffic-dominated cities [13]. However, the magnitude and persistence of these changes varied considerably depending on local emission sources, meteorological conditions, industrial activity, and atmospheric chemistry [14]. In several cities, ozone concentrations increased despite reductions in primary pollutants, largely due to changes in nitrogen oxide titration and photochemical reactions [15]. Evidence from low- and middle-income countries (LMICs) has also demonstrated heterogeneous responses of PM10 and SO2 concentrations, reflecting the continued influence of industrial emissions, dust resuspension, and regional transport processes [14].
Despite increasing international evidence regarding the environmental effects of COVID-19 restrictions, relatively limited research has examined these impacts in the South Caucasus region, including Georgia. Understanding how pollutant concentrations changed during lockdown periods in cities with different emission structures may provide valuable insights for future environmental and public health policies [17,18,19,20].
Therefore, the aim of this study was to evaluate the impact of COVID-19 lockdown measures on ambient air quality in three Georgian cities—Tbilisi, Batumi, and Rustavi—between 2019 and 2022. Specifically, this study examined temporal trends in PM2.5, PM10, NO2, SO2, and O3 concentrations during pre-pandemic, lockdown, and post-lockdown periods and explored differences in pollutant responses according to dominant urban emission sources.
2. Materials and Methods
2.1. Study Design
This study employed an interrupted time-series (segmented regression) design, complemented by an across-year comparison, to evaluate changes in ambient air pollutant concentrations before, during, and after the COVID-19 lockdown period in Georgia. Daily concentrations of major atmospheric pollutants were analyzed across four consecutive years (2019–2022) to assess variations associated with mobility restrictions and changes in anthropogenic activity during the pandemic, adjusting for daily meteorological conditions (temperature and wind speed).
2.2. Study Area
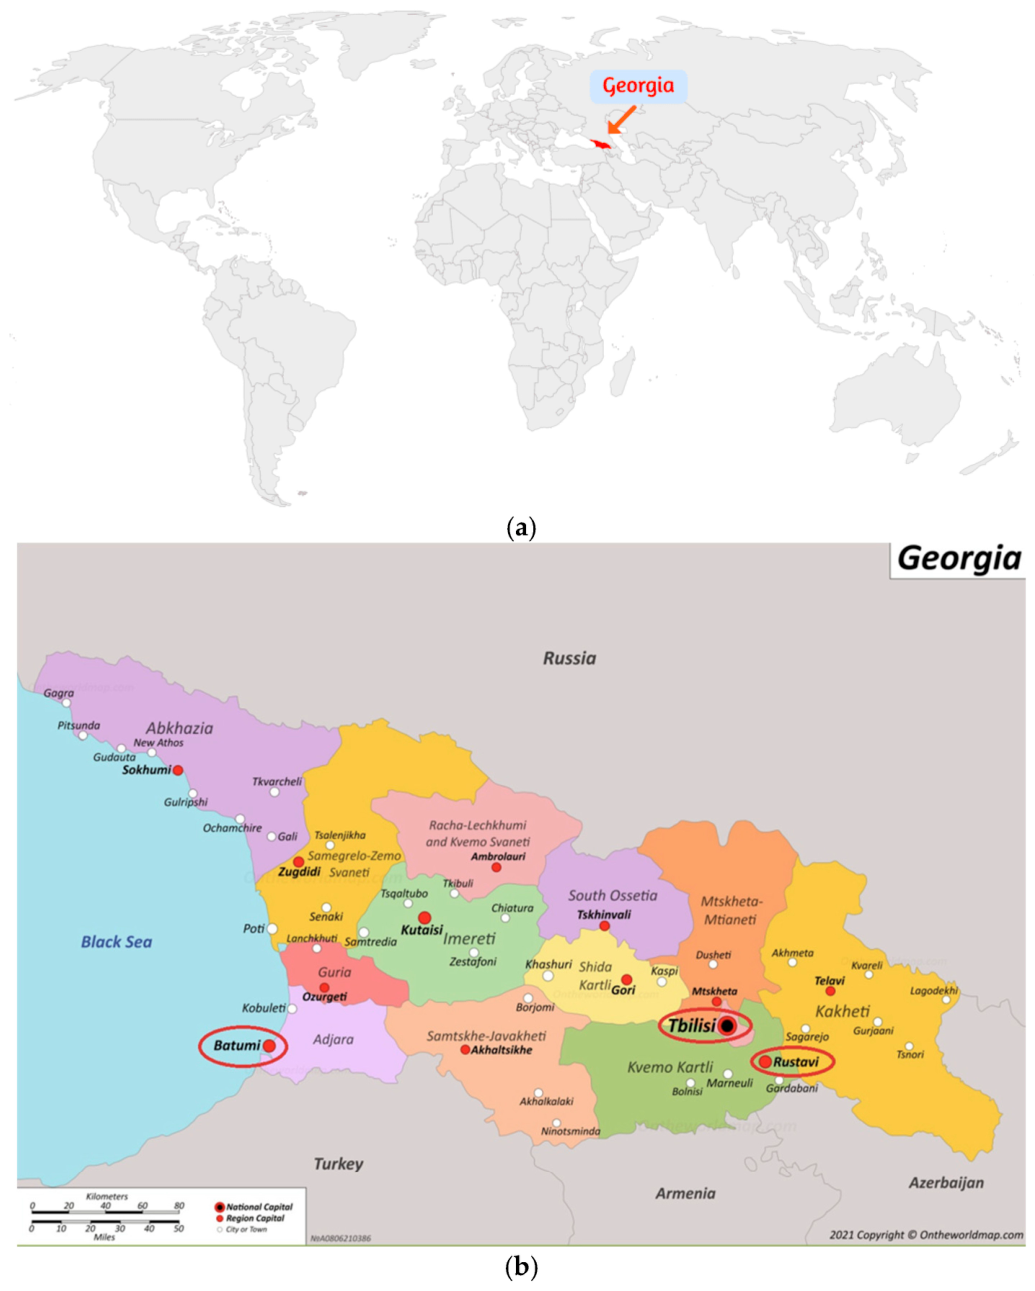
This study was conducted in three Georgian cities with distinct demographic, geographic, and emission characteristics: Tbilisi, Batumi, and Rustavi (Figure 1).
Tbilisi, the capital and largest city of Georgia, has a population exceeding one million inhabitants [21] and is characterized by intense traffic congestion, high vehicle density, and substantial urban emissions [4]. Batumi, located on the Black Sea coast, is the country’s main touristic city and presents mixed pollution sources associated with transport, tourism, and maritime activity [21]. Rustavi is one of Georgia’s industrial centers, where metallurgical production and industrial combustion contribute significantly to ambient air pollution [5]. The inclusion of cities with different dominant emission sources allowed comparison of pollutant responses to lockdown measures under varying urban and industrial conditions.
Figure 1.
Maps of (a) the world (Georgia shown in red) and (b) Georgia, with the three study cities—Tbilisi, Batumi, and Rustavi—marked with ovals. Map sources: Ontheworldmap.com (accessed on 15 June 2026).
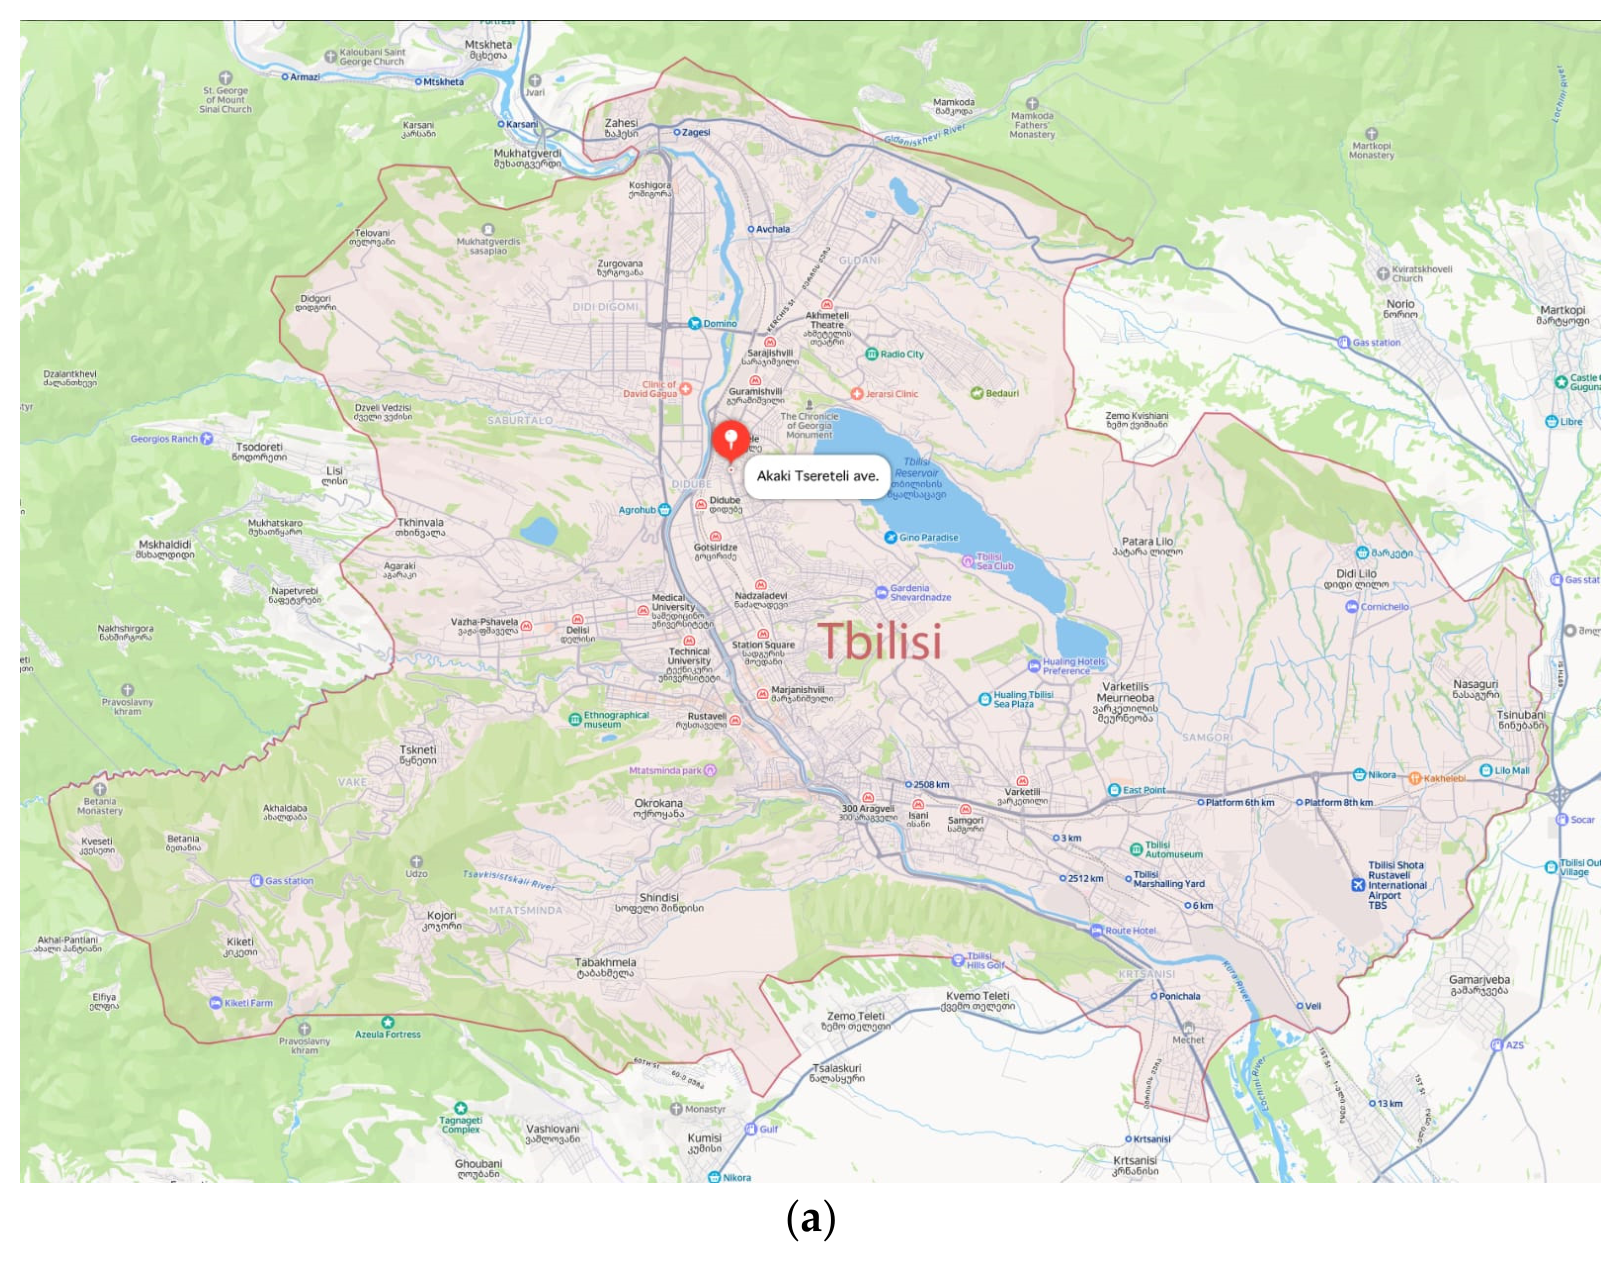
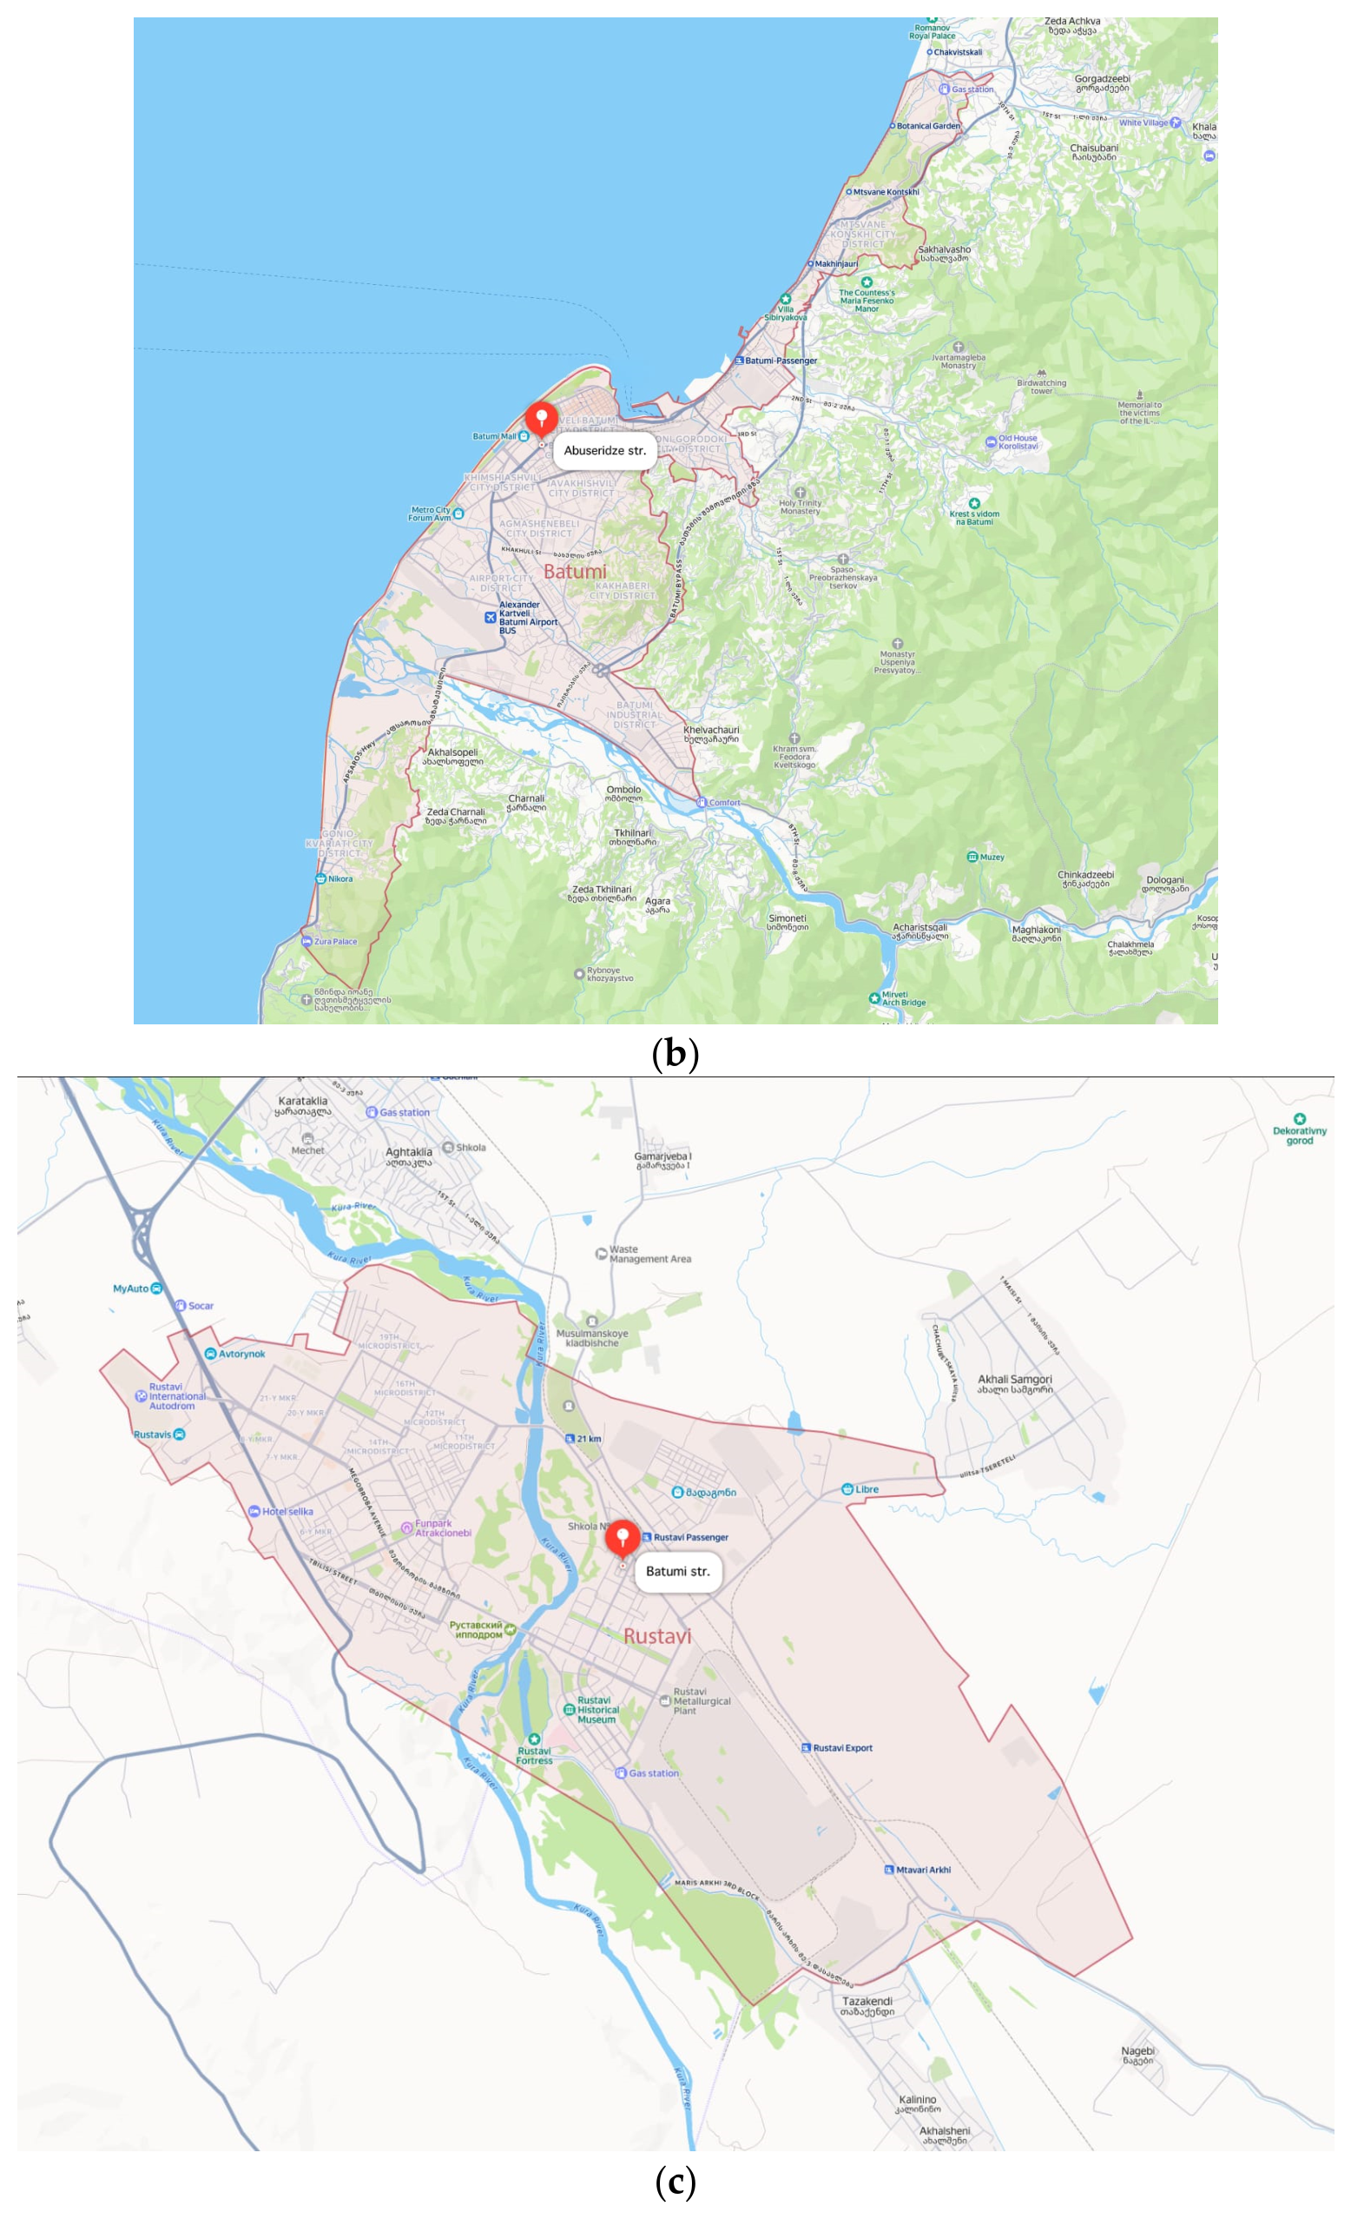
One automated monitoring station per city was used for this study, consistent with the configuration of Georgia’s national air quality network at the time of data collection: Akaki Tsereteli Avenue, Tbilisi (Didube district, a major arterial traffic corridor); Abuseridze Street, Batumi; and Batumi Street, Rustavi (Figure 2). As single-station monitoring cannot capture intra-city spatial variability, our findings should be interpreted as characterizing trends at the monitored location rather than city-wide air quality.
Figure 2.
Monitoring station locations in (a) Tbilisi (Akaki Tsereteli Avenue, Didube district), (b) Batumi (Abuseridze Street), and (c) Rustavi (Batumi Street). Map sources: Google maps.
2.3. Air Quality Data Collection
Daily concentrations of particulate matter with aerodynamic diameter ≤2.5 µm (PM2.5), particulate matter with aerodynamic diameter ≤10 µm (PM10), nitrogen dioxide (NO2), sulfur dioxide (SO2), and ground-level ozone (O3) were obtained from the official air quality monitoring network of the National Environmental Agency of Georgia through the public Air Quality Portal (https://air.gov.ge/).
Data were collected for the period from 1 March to 30 June in 2019, 2020, 2021, and 2022. The monitoring stations operate continuously (24 h/day) and provide automated measurements of atmospheric pollutants using standardized monitoring equipment.
The monitoring network includes analyzers and samplers manufactured by Horiba, Envea, Teledyne API, Palas GmbH, KIMOTO Electronic, and FAI Instruments. Measurements were performed according to the operational standards established by the National Environmental Agency.
Carbon monoxide (CO) is also measured at these stations but was excluded from this analysis: for the March–June 2019–2022 study window, multiple station-years showed substantial missingness, exceeding our imputation policy’s exclusion threshold, making CO unsuitable for inclusion alongside the other five pollutants. Ultraviolet radiation/insolation, which is mechanistically relevant to ground-level ozone formation, was not measured by the accessible network and is similarly unavailable.
2.4. COVID-19 Restriction Periods in Georgia
To control the spread of COVID-19, the Government of Georgia implemented several nationwide public health measures during 2020. A state of emergency was declared on 16 March 2020, followed by restrictions on internal movement, suspension of international flights, closure of schools and universities, and prohibition of public gatherings [4].
On 21 March 2020, quarantine measures and extensive business restrictions were introduced, including closure of shopping centers, restaurants, hotels, and public transportation systems. A nationwide curfew from 9:00 pm to 6:00 am was implemented on 6 April 2020. Restrictions gradually began to ease from 11 May 2020 onward, while most lockdown measures were lifted by 15 June 2020 [4,5].
These intervention phases were considered during interpretation of temporal pollution trends.
2.5. Data Processing and Statistical Analysis
2.5.1. Missing Value Assessment and Imputation
Prior to analysis, each station–pollutant–year series (n = 60 in total; five pollutants × three cities × four years) was audited for completeness against the expected 122 daily observations per series (March: 31 days, April: 30, May: 31, June: 30). Missingness was quantified as the proportion of expected observations absent, and the temporal structure of each gap was characterized by counting the number of discrete gap events and the length of the longest consecutive run of missing days.
Across all 60 series, 26 (43%) were complete. The remaining 34 series contained gaps, of which 28 had fewer than 10% missing values with a maximum consecutive run of 1–6 days. This scattered, non-consecutive pattern is consistent with routine sensor maintenance, telemetry failures, or the automated rejection of individual readings that failed internal quality-control criteria, rather than with instrument outages of extended duration. Six series had more than 10% missing values: Tbilisi PM2.5 2020 (16.4%, max run 6 days), Tbilisi PM10 2020 (16.4%, max run 6 days), Tbilisi O3 2019 (12.3%, max run 12 days), Rustavi PM2.5 2020 (27.9%, max run 34 days), Rustavi PM10 2020 (27.9%, max run 34 days), and one critical case, Batumi NO2 2021 (45.1%, max run 54 days).
Because the pattern of missingness across the dataset was overwhelmingly sporadic (isolated single days rather than contiguous blocks), three imputation strategies were applied proportionally to the severity of missingness in each series:
- (i)
- Linear interpolation: For the 28 series with scattered gaps of ≤10% (maximum consecutive run of up to 6 days), missing values were replaced by linear interpolation between the two adjacent valid daily observations. Where a missing value fell at the boundary of a series, the nearest valid value was carried forward or backward. Given the short gap lengths and the smooth day-to-day variation typical of ambient air quality data, linear interpolation introduces negligible bias and is consistent with established practice in environmental time-series analysis [22,23].
- (ii)
- Seasonal cross-year monthly mean imputation: For five series with moderate to high missingness (10–28%: Tbilisi O3 2019 [12.3%], Tbilisi PM2.5 2020 [16.4%], Tbilisi PM10 2020 [16.4%], Rustavi PM2.5 2020 [27.9%], Rustavi PM10 2020 [27.9%]), each missing day was filled with the mean concentration for that calendar month (March, April, May, or June) computed across the same station and pollutant in the three remaining years. This approach was preferred over same-year temporal interpolation because the 2020 series coincide with the lockdown anomaly: borrowing from adjacent lockdown-period days would artificially amplify the very signal under investigation. Using cross-year monthly means anchors imputed values to the climatological seasonal cycle without assuming the direction of the 2020 lockdown effect. Any residual gaps not resolved by the monthly mean were closed by forward or backward carry of the nearest valid observation.
- (iii)
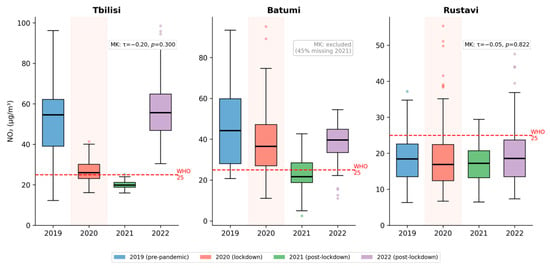
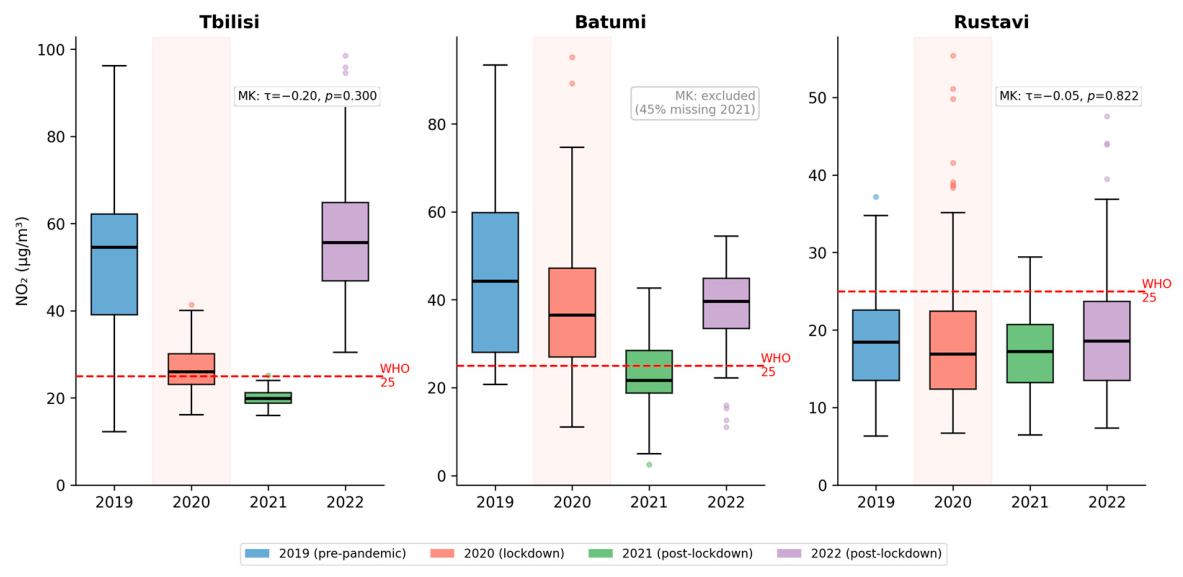
- Exclusion from trend analysis: Batumi NO2 in 2021 had 55 of 122 daily values missing (45.1%), concentrated in a single prolonged outage (maximum consecutive run: 54 days). At this level of missingness, imputation would render nearly half the series synthetic, making any trend estimate unreliable regardless of method. This series was therefore retained at its observed sample size (n = 67) for descriptive statistics and boxplot display—with the reduced n noted explicitly in Figure 3—but was excluded from the Mann–Kendall trend test and from all inter-annual comparisons requiring a complete annual record. Following imputation, 59 of 60 series were complete at n = 122 observations per series. The exception was Batumi NO2 2021, retained at n = 67 as described above. The imputed dataset was used for all subsequent analyses.Figure 3. Boxplots of daily NO2 concentrations (μg/m3) at Tbilisi, Batumi, and Rustavi during March–June 2019–2022 (n = 122 per year per station, except Batumi 2021 n = 67). The dashed red line indicates the WHO 24 h guideline (25 μg/m3). The shaded vertical band highlights 2020, the year in which lockdown measures were in effect.
2.5.2. Meteorological Data and Merged Dataset Construction
Daily mean temperature and mean wind speed for Tbilisi, Batumi, and Rustavi, March–June 2019–2022, were obtained from the Meteostat platform, which aggregates observations from World Meteorological Organization (WMO)-affiliated stations. Rustavi has no dedicated meteorological station; for March 2019 only, the nearest available station (Tbilisi, approximately 25 km away) was used as a proxy, flagged via a met_proxy indicator and treated as a sensitivity consideration rather than a precise local measurement. Precipitation, wind direction, wind gust, atmospheric pressure, and sunshine duration were also examined but were excluded from the analysis: pressure was missing for the entire year in Batumi 2019, and the remaining variables had near-total missingness across all station-years, so only temperature and wind speed were judged to be usable as covariates. A small number of scattered short gaps (≤7 consecutive days) in temperature and wind speed were closed by linear interpolation; no city-year required exclusion on these grounds.
The imputed pollutant series were merged with the meteorological series by city and calendar date to form a single daily panel (three cities × 122 days × four years = 1464 rows), retaining the raw (pre-imputation) pollutant values alongside the imputed values for the sensitivity comparison described in Section 2.5.4.
2.5.3. Interrupted Time-Series and Across-Year Regression Models
Following the approach of Bernal et al. [24] and Petit et al. [25], two complementary, meteorologically adjusted regression models were created as the primary inferential analysis for each of the 15 city–pollutant combinations. Mann–Kendall results are retained as a secondary, descriptive measure only (included in Supplementary Materials).
Model A (within-2020 interrupted time-series). For each city–pollutant pair, daily concentrations within 2020 were regressed on a linear time term (t, days from 16 March 2020), a binary indicator for active government restrictions (restriction_active = 1 for 16 March–15 June 2020, matching the intervention phases; 0 otherwise), an interaction term (t × restriction_active) allowing the slope to change at the onset of restrictions, and the two meteorological covariates (mean temperature, mean wind speed):
where pollutant is the daily mean concentration of the pollutant under analysis (µg/m3); β0 is the model intercept; t is the linear time term (days from 16 March 2020); restriction_active is a binary indicator equal to 1 during active government restrictions (16 March–15 June 2020) and 0 otherwise; t × restriction_active is the interaction term allowing the slope to change at the onset of restrictions; temperature and wind speed are the daily mean temperature and mean wind speed covariates; β1–β5 are the corresponding regression coefficients; and ε is the error term.
pollutant = β0 + β1(t) + β2(restriction_active) + β3(t × restriction_active) + β4(temperature) + β5(wind speed) + ε
The coefficient β2 (the step-change at restriction onset) is the primary effect estimate of interest. Model B (across-year comparison): To retain the inter-annual comparison structure of the original analysis while adjusting for meteorology, a second model compared the 2020 (lockdown) period against the pooled 2019, 2021, and 2022 period within the same March–June calendar window, with a centered day-of-year term capturing the seasonal cycle:
where lockdown_year is a binary indicator equal to 1 for the 2020 (lockdown) period and 0 for the pooled 2019, 2021, and 2022 period; day_of_year (centered) is a centered day-of-year term capturing the seasonal cycle; temperature and wind speed are as defined in Equation (1); β0 is the model intercept; β1–β4 are the corresponding regression coefficients; and ε is the error term.
pollutant = β0 + β1(lockdown_year) + β2(day_of_year, centered) + β3(temperature) + β4(wind speed) + ε
For Batumi NO2, 2021 was excluded from Model B for the reasons described in Section 2.5.1 (iii), leaving 2019, 2020, and 2022 (n = 366). Both models were fitted by ordinary least squares with Newey–West (HAC) standard errors (Bartlett kernel, automatic bandwidth selection following the Newey–West 1994 rule of thumb) to account for serial autocorrelation in daily residuals; this OLS-with-HAC engine was implemented and validated in Python (version 3.12). With 15 city–pollutant pairs × 2 models = 30 hypothesis tests, a Benjamini–Hochberg false discovery rate correction (α = 0.05) was applied across all 30 raw p-values; both raw and FDR-adjusted p-values are reported in Results, and results that lose significance after correction are described as suggestive rather than confirmed.
2.5.4. Sensitivity Analysis: Raw Versus Imputed Data
Both regression models were re-fitted using the raw (complete-case, pre-imputation) pollutant series and compared against the imputed-data results to achieve a direct before/after-imputation comparison. Across all 15 city–pollutant pairs, raw and imputed estimates were effectively identical (coefficient differences ≈ 0; no sign changes; no changes in significance category), because every series other than Batumi NO2 2021 has minimal raw missingness and that series was already excluded from both models on the same n in raw and imputed form.
2.5.5. Data-Quality Note: Rustavi SO2 2022
The Rustavi SO2 series for 2022 rises smoothly and near-monotonically from approximately 21.6 µg/m3 (1 March) to a peak of 59.2 µg/m3 (17 June), then falls abruptly to below 3 µg/m3 within the final week of the study window. This pattern is not present in the 2020 or 2021 Rustavi SO2 series, which remain in the low single digits throughout (aside from one isolated single-day spike in 2020), indicating it is specific to 2022 rather than a recurring station characteristic. We do not have access to the station’s calibration or maintenance logs and cannot confirm the cause with certainty; a multi-month, near-linear drift followed by an abrupt reset is, however, more consistent with sensor drift and recalibration than with a sustained industrial source, which would typically show greater day-to-day variability. This series is retained in the dataset (not excluded, since it is 100% complete) but is flagged here and in the Section 4 as a data-quality concern, and the corresponding model results should be interpreted with this caveat in mind.
2.5.6. Descriptive Statistics and Visualization
For each station, pollutant, and year, the following descriptive statistics were computed from the complete post-imputation daily series: arithmetic mean, standard deviation (SD), median, and interquartile range (IQR; Q1–Q3). Results are reported as mean ± SD throughout, with median and IQR provided in Table 1. Year-to-year distributions were visualized as boxplots showing the median (center line), IQR (box), 1.5 × IQR whiskers, and individual outlier points (Figure 3, Figure 4, Figure 5, Figure 6 and Figure 7). Smoothed daily concentration time-series for all four years were created and presented in Supplementary Materials, with the four major 2020 COVID-19 intervention phases (state of emergency, quarantine measures, nationwide curfew, and easing of restrictions) indicated by shaded background regions (Figure S1 in Supplementary Materials).
Table 1.
Meteorologically adjusted interrupted time-series (Model A, within-2020 step-change at restriction onset) and across-year (Model B) effect estimates for all 15 city–pollutant pairs, with raw and Benjamini–Hochberg false discovery rate (FDR)-adjusted p-values. The rows with bold text remained statistically significant after FDR correction.
Figure 4.
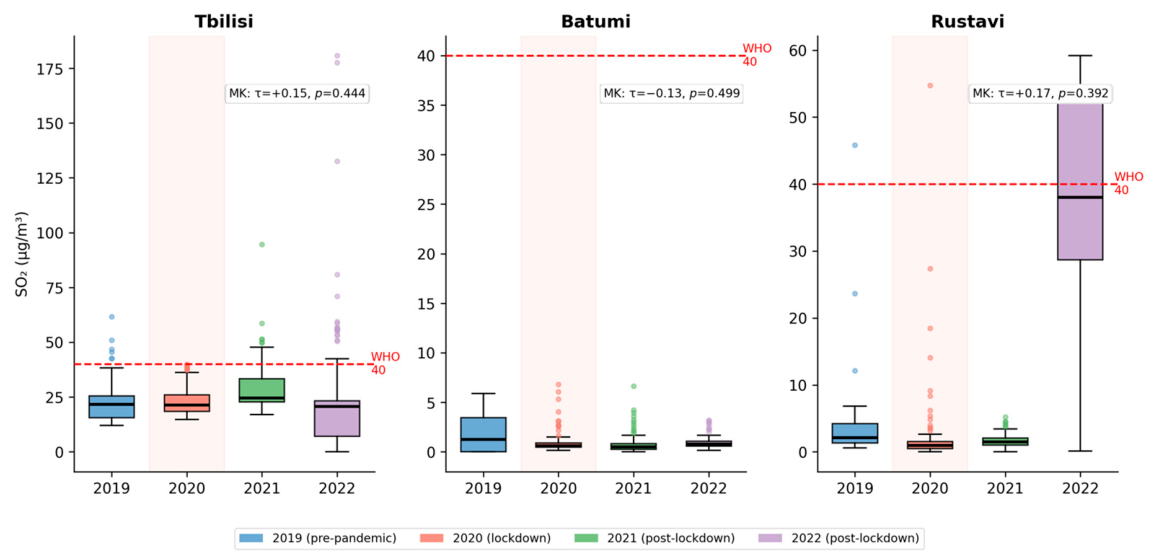
Boxplots of daily SO2 concentrations (μg/m3) at Tbilisi, Batumi, and Rustavi during March–June 2019–2022 (n = 122 per year per station). The dashed red line indicates the WHO 24 h guideline (40 μg/m3).
Figure 5.
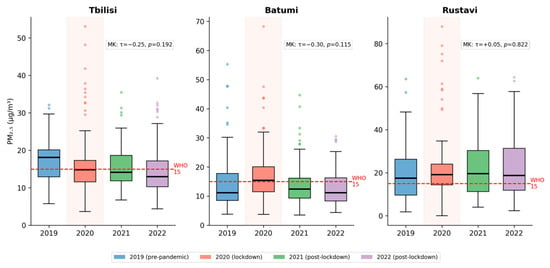
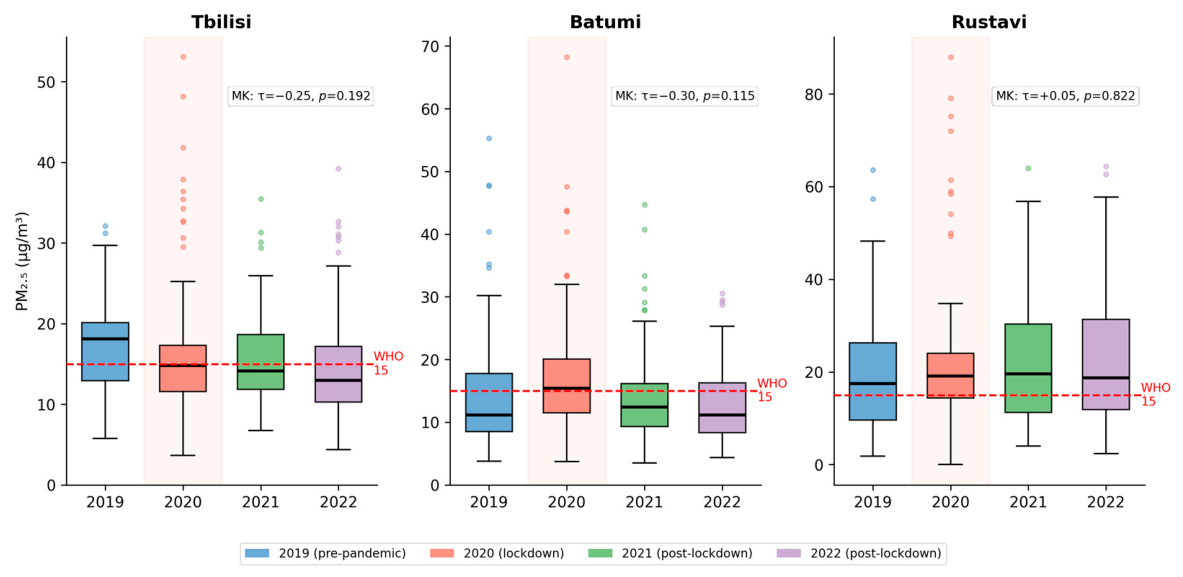
Boxplots of daily PM2.5 concentrations (μg/m3) at Tbilisi, Batumi, and Rustavi during March–June 2019–2022 (n = 122 per year per station). The dashed red line indicates the WHO 24 h guideline (15 μg/m3).
Figure 6.
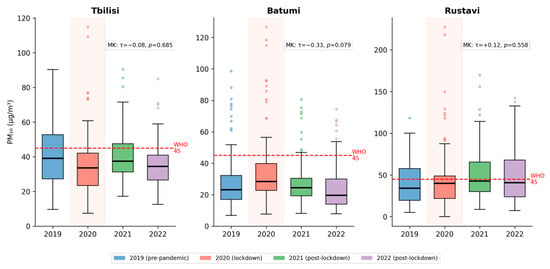
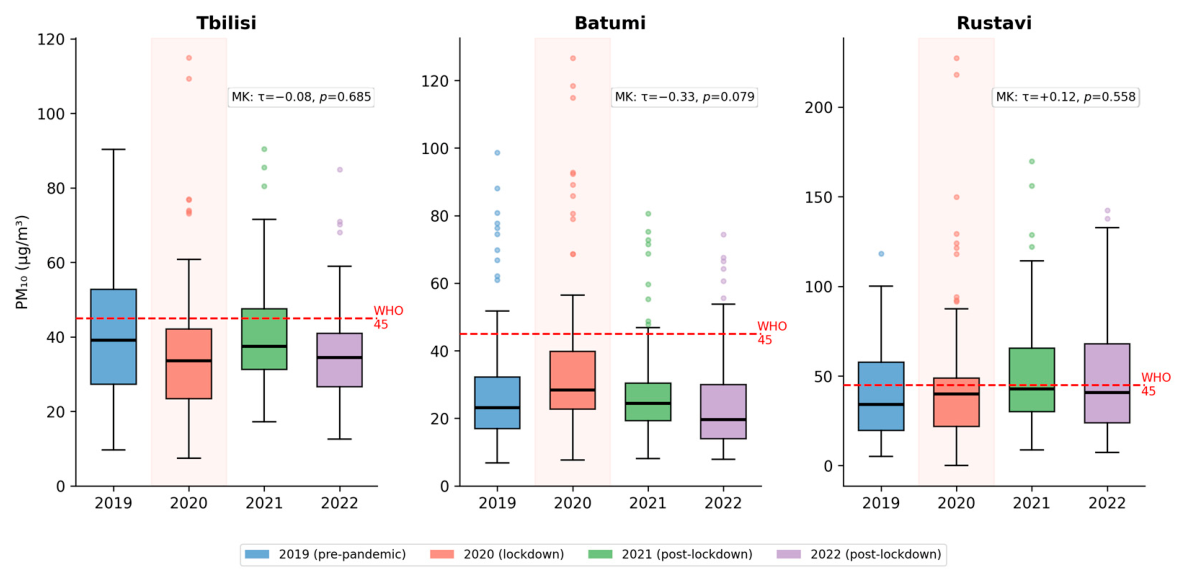
Boxplots of daily PM10 concentrations (μg/m3) at Tbilisi, Batumi, and Rustavi during March–June 2019–2022 (n = 122 per year per station). The dashed red line indicates the WHO 24 h guideline (45 μg/m3).
Figure 7.
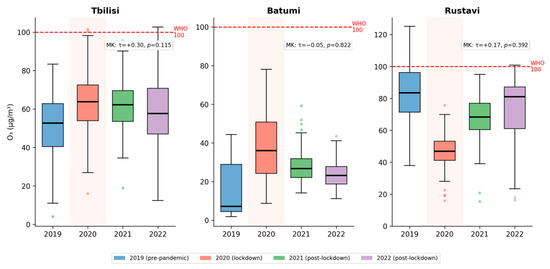
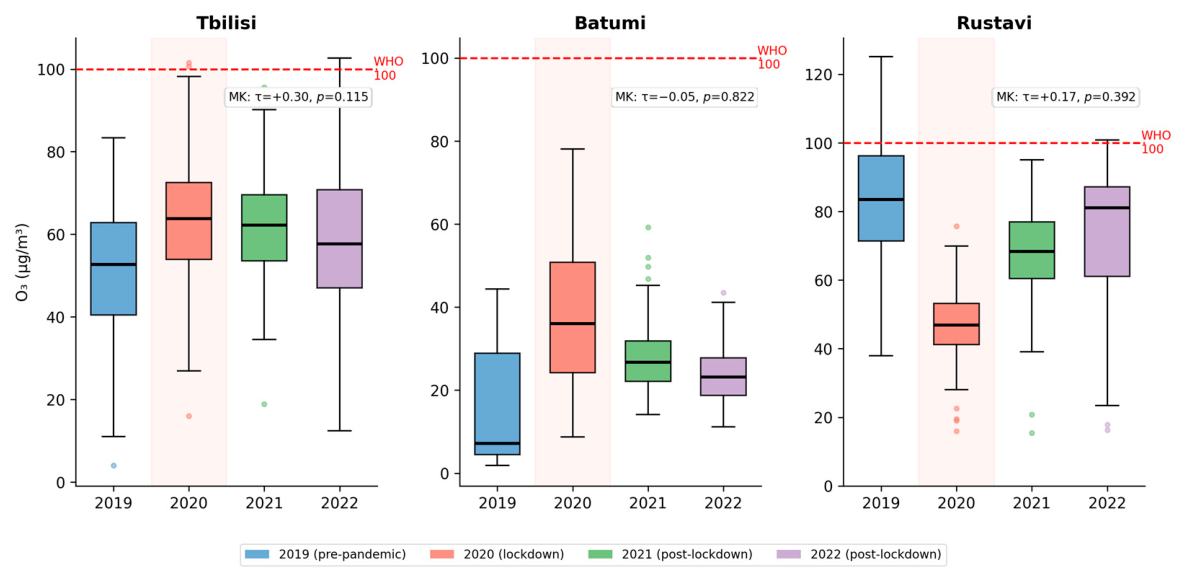
Boxplots of daily O3 concentrations (μg/m3) at Tbilisi, Batumi, and Rustavi during March–June 2019–2022 (n = 122 per year per station). The dashed red line indicates the WHO 8 h guideline (100 μg/m3).
Daily concentrations were evaluated against the applicable WHO Air Quality Guidelines (2021 revision): NO2 24 h mean 25 μg/m3; SO2 24 h mean 40 μg/m3; PM2.5 24 h mean 15 μg/m3; PM10 24 h mean 45 μg/m3; O3 peak-season 8 h mean 100 μg/m3.
In the time-series figure, to minimize confounding from known day-of-week patterns in traffic and industrial activity, temporal alignment was applied during inter-annual comparisons so that observations from equivalent weekdays were compared across years, ensuring that workdays were compared with corresponding workdays and weekends with weekends.
Additionally, in the time-series figure, policy-response effects were explored by overlaying major COVID-19 intervention phases on the time-series plots: declaration of the state of emergency (16–20 March 2020), implementation of quarantine measures (21 March–5 April), nationwide curfew (6 April–10 May), and progressive easing of restrictions (11 May–15 June). These temporal overlays enabled qualitative assessment of potential shifts in pollution levels corresponding to documented changes in human activity patterns. Inter-annual comparisons focused on identifying deviations in pollution trajectories during the 2020 lockdown relative to the pre-pandemic baseline (2019) and post-lockdown recovery years (2021–2022).
2.5.7. Trend Analysis (Secondary, Descriptive Measure)
As a secondary, descriptive check, the non-parametric Mann–Kendall trend test [26,27,28] was applied to monthly mean concentrations for each station–pollutant pair (n = 16 per test, March 2019–June 2022); full methodological detail and results are reported in Supplementary Table S1 and accompanying text. Batumi NO2 2021 was excluded from this test for the reasons described in Section 2.5.1. All statistical analyses were implemented in Python (version 3.12) using scipy.stats [29].
The Mann–Kendall results are unadjusted for meteorology and are retained only as a descriptive summary; the meteorologically adjusted interrupted time-series and across-year models are the basis for the inferential claims made in this manuscript.
3. Results
Figure 3, Figure 4, Figure 5, Figure 6 and Figure 7 present the year-to-year distributions of five major air pollutants (PM2.5, PM10, NO2, O3, SO2) across all three cities (Tbilisi, Batumi, Rustavi) as boxplots for March–June 2019–2022, showing the median, interquartile range, and 1.5 × IQR whiskers.
In Tbilisi, concentrations declined sharply during the 2020 lockdown (mean 26.8 ± 5.5 μg/m3, −47.9% vs. 2019) with a markedly narrowed IQR (23.1–30.1 μg/m3), reaching their lowest point in 2021 (20.0 ± 1.7 μg/m3; 99% of days below WHO guideline), before rebounding fully in 2022 (56.7 ± 14.0 μg/m3, +10.0% vs. 2019; 100% of days above WHO guideline). Batumi showed a more modest 2020 reduction (−16.8%), with a partial recovery in 2022. Rustavi showed no meaningful lockdown response across all four years (means 17.2–19.6 μg/m3), consistent with an industrial source mix insensitive to road traffic restrictions. Mann–Kendall trend test results are annotated per panel; no trend reached statistical significance at α = 0.05. Batumi 2021 retained a response at n = 67 observed days; this was excluded from trend analysis.
Tbilisi showed no lockdown-related reduction (2020 mean 23.2 ± 6.4 μg/m3, +2.4% vs. 2019), with concentrations rising in 2021 (28.9 ± 11.1 μg/m3) driven by episodic high-concentration events (max 94.6 μg/m3; 17% of days above WHO guideline). The 2022 Tbilisi box displays extreme dispersion (SD 28.2 μg/m3, max 180.8 μg/m3), indicating occasional serious pollution episodes. Batumi had negligible SO2 throughout (means < 1.7 μg/m3; no WHO exceedances in any year), consistent with its low-industry coastal profile. Rustavi SO2 was low in 2019–2021 (means 1.7–3.3 μg/m3) but showed an anomalous 10-fold elevation in 2022 (38.1 ± 14.7 μg/m3; 48% of days above WHO guideline); this value requires data quality verification before interpretation.
In Tbilisi, PM2.5 declined modestly and gradually over the study period (17.2 ± 5.6 μg/m3 in 2019 to 14.6 ± 6.3 μg/m3 in 2022; −15.1%), with WHO exceedance falling from 66% to 35%. Notably, the 2020 lockdown produced only a marginal mean reduction (15.7 ± 8.3 μg/m3; −8.8%) while the SD and maximum (53.1 μg/m3) increased. Batumi showed a counterintuitive increase in 2020 (17.3 ± 9.6 μg/m3; +19.7%, max 68.2 μg/m3) before declining in 2021–2022. Rustavi had the highest PM2.5 of the three cities in all years (means 19.6–22.9 μg/m3; 62–70% of days above WHO guideline), with no lockdown response.
Tbilisi showed a modest 2020 reduction (35.5 ± 17.4 μg/m3; −12.8% vs. 2019) with near-return to baseline in 2021 (40.0 ± 12.8 μg/m3). WHO exceedance fell from 41% (2019) to 12% (2022), though no significant monotonic trend was detected (τ = −0.083, p = 0.685). In Batumi, PM10 increased in 2020 (+23.5%; max 126.7 μg/m3), before declining to its lowest level in 2022 (23.6 ± 13.4 μg/m3); the Mann–Kendall test approached significance (τ = −0.333, p = 0.079). Rustavi showed the highest concentrations and widest variability of all three cities, with the extreme 2020 maximum of 227.3 μg/m3 indicating industrial dust events; WHO exceedance remained at 37–48% throughout all years with no improvement during lockdown.
Tbilisi showed a sustained lockdown-associated ozone increase (+25.0% in 2020 vs. 2019; mean 63.4 ± 15.0 μg/m3). Elevated levels persisted in 2021 (+22.6%) and 2022 (+16.6%), and the Mann–Kendall τ of +0.300 (p = 0.115) approached significance. In Batumi, ozone increased substantially in 2020 (+162.1%), though the atypically low 2019 baseline (median 7.2 μg/m3) raises data quality questions for that year. Rustavi showed the inverse pattern: the 2019 baseline was the highest in the dataset (83.3 ± 18.7 μg/m3; 20% of days above WHO guideline, max 125.2 μg/m3), falling by 43.2% in 2020 (47.3 ± 10.1 μg/m3). Concentrations partially recovered in 2021–2022 but did not return to 2019 levels.
Meteorologically Adjusted Interrupted Time-Series and Across-Year Models
Results from Model A (within-2020 segmented regression) and Model B (2020 vs. pooled 2019/2021/2022, meteorologically adjusted), are summarized below. Of 30 city–pollutant–model combinations, 11 remained statistically significant after Benjamini–Hochberg false discovery rate correction (Table 1); a further 5 were significant before but not after correction and are described as suggestive only.
FDR-significant results (Model A step-change at restriction onset; Model B across-year effect; both meteorologically adjusted): Tbilisi NO2 declined by 8.78 µg/m3 at restriction onset (p = 0.001) and by 14.44 µg/m3 in the across-year comparison (p < 0.001). Rustavi NO2 declined by 14.57 µg/m3 at restriction onset (p < 0.001); its across-year effect was not significant (p = 0.578). Batumi NO2 declined by 20.12 µg/m3 at restriction onset (p = 0.004); its across-year effect was not significant (p = 0.214). Tbilisi SO2 declined by 5.27 µg/m3 at restriction onset (p = 0.001). Batumi O3 increased by 18.06 µg/m3 at restriction onset (p = 0.004) and by 16.09 µg/m3 in the across-year comparison (p < 0.001). Rustavi O3 declined by 27.85 µg/m3 in the across-year comparison (p < 0.001). Rustavi SO2 declined by 12.78 µg/m3 in the across-year comparison (p < 0.001; see Section 2.5.5 regarding the 2022 data-quality flag for this series). Batumi PM2.5 increased by 3.28 µg/m3 (p = 0.001) and Batumi PM10 increased by 7.61 µg/m3 (p = 0.001) in the across-year comparison. Tbilisi PM10 declined by 5.25 µg/m3 in the across-year comparison (p = 0.042).
Results are significant before but not after FDR correction (suggestive only): Rustavi SO2 step-change (p_raw = 0.027, p_BH = 0.067), Batumi SO2 step-change (p_raw = 0.041, p_BH = 0.089), Tbilisi PM10 across-year effect (p_raw = 0.042, p_BH = 0.089), Rustavi O3 step-change (p_raw = 0.046, p_BH = 0.089), and Tbilisi O3 step-change (p_raw = 0.049, p_BH = 0.089). The remaining 14 of 30 combinations were not statistically significant at either threshold.
The sensitivity analysis comparing raw (complete-case) and imputed data showed no material differences in any coefficient, sign, or significance category across all 15 city–pollutant pairs (Supplementary Table S2).
4. Discussion
This study evaluated the impact of COVID-19 lockdown measures on ambient air quality in three Georgian cities—Tbilisi, Batumi, and Rustavi—across five major pollutants (NO2, SO2, PM2.5, PM10, and O3) during March–June 2019–2022. The results are consistent with a pattern observed in many other settings worldwide: this period of reduced mobility coincided with large, statistically robust but temporary changes in traffic-sensitive pollutants, particularly NO2, in the traffic-dominated capital, while industrial and coastal cities showed weaker or, in some cases, statistically non-significant responses after meteorological adjustment and false discovery rate correction. Our findings contribute to city- and pollutant-specific quantitative evidence from a South Caucasus upper-middle-income country that is underrepresented in the global COVID-19 air quality literature [5,30,31].
4.1. NO2: Traffic-Driven Reduction and Full Rebound
The most striking finding in the dataset is the response of NO2 in Tbilisi. During the 2020 lockdown, daily mean NO2 fell by 47.9% (from 51.5 ± 18.4 to 26.8 ± 5.5 μg/m3) and the interquartile range narrowed dramatically from 39.0–62.2 to 23.1–30.1 μg/m3, indicating not merely a downward shift in the mean but the effective suppression of high-concentration peak events associated with traffic congestion. This is consistent with the established finding that vehicles are responsible for a large proportion of nitrogen oxide emissions in Tbilisi [5,8,9,10] and confirms that mobility restrictions are highly effective at reducing NO2 in traffic-heavy urban environments. The magnitude of the Tbilisi reduction is comparable to lockdown-associated NO2 declines reported in other traffic-dominated capitals and megacities: Delhi (≈40–50%) [13,32], Rio de Janeiro (≈30–45%) [33], and cities across Pakistan, Morocco, and South America [14,31,34,35]. Satellite-based estimates from Tropospheric Monitoring Instrument and Ozone Monitoring Instrument confirm that NO2 reductions of 20–60% over urban areas were widespread during strict lockdown periods [36].
By 2021, Tbilisi NO2 fell further to 20.0 ± 1.7 μg/m3 with an exceptionally narrow IQR of 18.8–21.2 μg/m3, suggesting that residual mobility restrictions or behavioral changes maintained suppression of peak traffic events beyond the formal lockdown period. However, the 2022 rebound to 56.7 ± 14.0 μg/m3—exceeding the 2019 baseline by 10% and with 100% of days above the WHO 24 h guideline—confirms that the improvements were entirely temporary. This rebound pattern mirrors findings from Brazil [37] and global multi-city analyses [30,31], reinforcing the conclusion that without permanent changes to transport infrastructure, traffic-related NO2 returns to pre-lockdown levels once activity resumes [30]. Batumi showed a more modest 2020 reduction (−16.8%), consistent with its mixed urban and port-related emission profile. Rustavi exhibited virtually no lockdown response across all four years (means 17.2–19.6 μg/m3), confirming that metallurgical industrial operations are the dominant NO2 source in that city [38] and are insensitive to road traffic restrictions.
4.2. PM2.5 and PM10: Source Heterogeneity Limits Lockdown Response
The particulate matter results illustrate the limitations of mobility-based interventions when non-traffic sources contribute substantially to the pollution burden. In Tbilisi, PM2.5 declined by only 8.8% during the 2020 lockdown (from 17.2 to 15.7 μg/m3)—a far weaker response than NO2—while the standard deviation and upper outliers increased, indicating heightened episode frequency. The episodic PM2.5 spikes visible in the supplementary time-series in March 2020 are consistent with domestic combustion for home heating, which continued and possibly intensified during the lockdown as residents stayed indoors. This pattern of disengaged NO2 and PM2.5 responses has been documented: the differential reduction reflects the source-specific nature of lockdown impacts, with combustion sources for heating and cooking remaining largely unaffected [30,32]. In LMIC urban settings, home heating is a PM2.5 source that cannot be controlled through mobility restrictions alone [4].
Batumi presented a counterintuitive PM2.5 increase during 2020 (+19.7%, max 68.2 μg/m3), which may reflect long-range transport of biomass-burning aerosol, meteorological conditions favorable to accumulation, or continued domestic combustion unaffected by mobility restrictions. Similar “lockdown PM paradoxes” have been documented in South Asian and Latin American cities where household combustion and secondary aerosol formation counterbalance traffic emission reductions [13,33]. Rustavi consistently had the highest PM2.5 of the three cities (means 19.6–22.9 μg/m3; 62–70% of days above WHO guideline) with no lockdown-associated reduction in either model, confirming that coarse and fine particles are dominated by industrial process emissions at this site [38] rather than by traffic.
PM10 showed a similar pattern to PM2.5: a modest reduction in Tbilisi in 2020 (−12.8%) followed by near-return to baseline in 2021, with no sustained improvement. In Batumi, PM10 increased in 2020 (+23.5%, max 126.7 μg/m3), consistent with sea-salt and dust resuspension events along the Black Sea coast that operate independently of road traffic [39]. In Rustavi, extreme PM10 values in 2020 (max 227.3 μg/m3) are consistent with what we term “industrial dust events” here: short-duration spikes in PM10 (and, to a lesser extent, PM2.5) substantially above the station’s typical range, which we infer to be associated with fugitive dust from materials handling, unpaved haul roads, and slag or aggregate processing at the nearby metallurgical facility, given the station’s industrial siting (Section 2.2). We do not have wind-direction-resolved data, PM composition, or facility activity records to confirm this attribution directly, and we treat it as a plausible explanation rather than a demonstrated source. These extreme values were not suppressed during the lockdown period, consistent with an industrial rather than traffic-related source.
The supplementary time-series additionally reveal elevated PM10 spike events in Rustavi during 2021, suggesting that these episodic events were not limited to the lockdown year. The Mann–Kendall test for Batumi PM10 approached significance (τ = −0.333, p = 0.079), reflecting the overall downward trajectory from 2020 to 2022 rather than a lockdown-specific effect.
4.3. SO2: Industrial Sources Dominate
SO2 concentrations showed no meaningful lockdown response in any of the three cities. In Tbilisi, the 2020 mean was virtually unchanged (+2.4% vs. 2019), and concentrations rose in 2021–2022, driven by episodic events (max 94.6 and 180.8 μg/m3 in 2021 and 2022 respectively) rather than systematic trends, suggesting point-source events from heating infrastructure or small industries. Batumi had negligible SO2 throughout (all means below 1.7 μg/m3; no WHO exceedances), consistent with the absence of heavy industrial activity in this coastal tourism-oriented city [40].
The approximately 10-fold elevation in Rustavi SO2 in 2022 (38.1 ± 14.7 μg/m3 vs. 1.7–3.3 μg/m3 in 2019–2021), with 48% of days exceeding the WHO 24 h guideline, is the most unusual finding in the dataset. While it could reflect a genuine change in operations at the Rustavi Metallurgical Plant [38]—for example, a resumption of high-sulfur fuel combustion—it could equally reflect a sensor calibration issue given its abrupt onset. Similar anomalous SO2 spikes have been attributed to industrial point sources in other LMIC industrial cities [14].
4.4. O3: Photochemical Consequences of NO2 Reduction
Ground-level ozone showed a 25.0% increase in Tbilisi during 2020 (mean 63.4 ± 15.0 μg/m3), with elevated levels persisting through 2021 (+22.6%) and 2022 (+16.6%). The Mann–Kendall τ of +0.300 (p = 0.115) approached significance under the unadjusted Mann–Kendall test; the corresponding meteorologically adjusted estimates showed a significant step change at restriction onset before FDR correction but did not survive correction (p_BH = 0.089), and the across-year effect was not significant (p = 0.056), so this pattern should be regarded as suggestive rather than confirmed. A plausible contributing mechanism, consistent with but not directly tested by our data, is reduced NO2-driven titration of O3: in NOx-rich urban environments, lower nitrogen oxide concentrations are generally associated with reduced titration of O3 by NO [15]. Lockdown-associated ozone increases have been documented in cities across Europe, India, Brazil, and China, with Sicard et al. [15] reporting amplified ozone pollution in multiple cities during 2020. The sustained elevation in 2021 and 2022, after restrictions eased, may reflect both the post-lockdown recovery of traffic and interannual meteorological variability [41], among other unmeasured factors.
Rustavi exhibited the inverse O3 trajectory: a 43.2% reduction during 2020 (83.3 to 47.3 μg/m3); this decline remained statistically robust in the meteorologically adjusted model after FDR correction. The 2019 Rustavi O3 baseline (83.3 μg/m3; 20% of days above WHO 8 h guideline) was the highest in the entire dataset.
A plausible explanation, though untested without VOC, NOx-speciation, or industrial activity data, is reduced industrial VOC and NOx emissions during the restriction period suppressing ozone precursors. The partial recovery in 2021–2022 (means 67.7 and 71.3 μg/m3) as industrial activity resumed is consistent with this [15,41].
4.5. Supplementary Time-Series Evidence
The weekday-aligned supplementary time series (Figure S1) provide temporal context that complements the boxplot distributions. In the Tbilisi NO2 panel, the steepest concentration decline in 2020 is visible in mid-to-late March, aligned with the state of emergency (16–20 March) and quarantine measures (21 March–5 April). The 2021 Tbilisi NO2 curve runs flat and near-constant throughout the entire season—unlike any other year—confirming sustained suppression of traffic peaks rather than merely a reduction in baseline levels. For PM2.5 in Tbilisi, discrete high-concentration events in March 2020 are clearly visible in the time series, consistent with heating combustion episodes at the beginning of the season [30,32].
For Rustavi O3, the 2019 curve is elevated substantially above all subsequent years throughout the entire season, confirming that the anomalously high 2019 baseline is a season-wide phenomenon rather than a brief episode, and is consistent with typical pre-pandemic industrial operating conditions at the metallurgical facility [38]. The weekday alignment ensures that observed differences in within-season trajectories reflect genuine emission patterns rather than artifacts of differing weekday compositions between years [30].
4.6. Mann–Kendall Trend Analysis
The absence of statistically significant monotonic trends (all p > 0.05; Table 1) is the expected outcome given the V-shaped inter-annual trajectories induced by the lockdown-rebound pattern [28,30]: a test designed to detect unidirectional change cannot capture a temporary dip followed by recovery. The τ values closest to significance—Batumi PM10 (τ = −0.333, p = 0.079) and Tbilisi O3 (τ = +0.300, p = 0.115)—reflect sustained directional shifts that extend beyond the lockdown year itself, suggesting incipient long-term trends where a longer data series would be needed to confirm.
4.7. Strengths and Limitations
4.7.1. Strengths
- Multi-city, multi-pollutant design with distinct emission profiles: The simultaneous examination of three cities with fundamentally different dominant emission sources—traffic-dominated Tbilisi, coastal low-industry Batumi, and industrial Rustavi—enables direct comparison of lockdown responses across source types, providing more generalizable evidence than single-city analyses [30,31].
- Rigorous missing value treatment with transparent three-tier imputation: Linear interpolation for short gaps (≤10%), cross-year monthly mean imputation for moderate gaps (10–28%), and exclusion from trend analysis for Batumi NO2 2021 (45.1% missing) [22,23]. The imputation strategy is fully documented, reproducible, and conservative.
- Meteorologically adjusted interrupted time-series and across-year regression as the primary analysis, with non-parametric trend testing retained as a secondary check: Segmented regression and an across-year comparison (Bernal et al.-style [24]), both adjusted for temperature and wind speed and corrected for multiple comparisons via Benjamini–Hochberg, provide a stronger basis for inference about a short-term, non-monotonic disruption than trend testing alone; Mann–Kendall results (n = 16 monthly means) are reported alongside as a descriptive, secondary measure.
4.7.2. Weaknesses
- Observational, non-randomized design: Although the revised analysis includes meteorologically adjusted interrupted time-series and across-year models, residual confounding from unmeasured factors (e.g., boundary-layer dynamics, regional transport, concurrent economic changes) cannot be fully excluded, and our estimates should be read as adjusted associations rather than definitive causal effects.
- Single monitoring station per city (station locations and surrounding land use are mapped in Figure 2: Results characterize trends at the monitored location and may not be representative of city-wide air quality, particularly in large or topographically complex cities such as Tbilisi. In future work, we plan to complement the ground-based record with satellite observations (e.g., TROPOMI) and trajectory-based transport modeling (e.g., HYSPLIT) to address these limitations.
Despite these limitations, the findings provide valuable evidence regarding the differential environmental responses to mobility restrictions in Georgian urban settings and may support future public health and environmental policy development.
5. Conclusions
This study finds that the COVID-19 restriction period in Georgia was associated with a differential and temporary change in air quality across three urban environments with contrasting emission profiles, after adjusting for meteorological conditions. Traffic-dominated Tbilisi experienced the most marked response, with NO2 declining by 47.9% during the 2020 restriction period and PM2.5 falling modestly, before both rebounded fully by 2022. Industrial Rustavi and coastal Batumi showed smaller or negligible responses, reflecting the dominance of emission sources insensitive to road traffic restrictions. PM10 and SO2 were less responsive across all three cities, consistent with contributions from mechanically generated dust, industrial activities, and residential combustion. Ground-level ozone increased in Tbilisi, consistent with reduced NOx titration, while Rustavi showed the opposite pattern, reflecting source-dependent photochemical dynamics. Meteorologically adjusted interrupted time-series and across-year models identified 11 statistically robust city–pollutant effects after false discovery rate correction (most consistently for NO2), with a further five borderline results (chiefly for O3 and SO2) that did not survive correction and are reported as suggestive only; descriptive Mann–Kendall trend testing, applied as a secondary measure, did not detect significant monotonic trends across the four-year period, consistent with the non-monotonic, V-shaped lockdown–rebound trajectories observed in the dataset.
The findings highlight the importance of source-specific mitigation strategies: sustained improvements in air quality and potential short-term climate co-benefits require structural interventions targeting traffic emissions in Tbilisi, residential heating combustion across all three cities, and industrial fuel use in Rustavi. Temporary reductions in human activity provide a unique natural experiment for evaluating pollutant source dynamics, but long-term policy and technological change are necessary to achieve lasting air quality and climate benefits.
Overall, the study highlights the value of comprehensive, multi-city air quality monitoring and the need for targeted environmental policies to reduce anthropogenic emissions across diverse urban contexts.
Supplementary Materials
The following supporting information can be downloaded at: https://www.mdpi.com/article/10.3390/environments13080437/s1, Figure S1. Daily concentrations of NO2, SO2, PM2.5, PM10, and O3 (μg/m3) at three monitoring stations in Georgia (Tbilisi, Batumi, Rustavi) during March–June 2019–2022, with 2020 COVID-19 intervention phases overlaid; Figure S2. Detailed map of Tbilisi indicating the main highways, industrial enterprises, and land-use zones, prepared using information from the official website of the Municipal Services Development Agency (https://ms.gov.ge/) (accessed on 5 December 2025). Table S1. Descriptive statistics (mean ± SD, median [IQR]) and Mann-Kendall (MK) trend test results (Kendall’s τ, two-tailed p-value) for daily air pollutant concentrations at three monitoring stations in Georgia, March-June 2019–2022 (post-imputation). This table was relocated here from the main manuscript: the MK test, used in earlier drafts as the primary trend analysis, is now a secondary, descriptive measure only. The main text’s primary inferential results are the meteorologically-adjusted interrupted time-series and across-year models reported inTable 1 of the main manuscript. Table S2. Sensitivity comparison of meteorologically-adjusted interrupted time-series (Model A) and across-year (Model B) estimates using imputed versus raw (complete-case) data, for all 15 city-pollutant pairs. Estimates are identical between raw and imputed data for every pair.
Author Contributions
Conceptualization, A.S. and M.M.-S.-V.; methodology, A.S. and M.M.-S.-V.; software, A.S.; formal analysis, A.S.; writing—original draft preparation, A.S.; writing—review and editing, A.S., M.M.-S.-V.; visualization, A.S.; supervision, M.M.-S.-V. All authors have read and agreed to the published version of the manuscript.
Funding
This research received no external funding.
Institutional Review Board Statement
Not applicable. The study used publicly available environmental monitoring data and did not involve human participants, personal data, or biological samples; ethical approval was therefore not required.
Data Availability Statement
Data is available on Air quality portal (https://air.gov.ge/) of National Environmental Agency.
Conflicts of Interest
The authors declare no conflicts of interest.
Abbreviations
The following abbreviations are used in this manuscript:
| CO | Carbon monoxide |
| COVID-19 | Coronavirus disease 2019 |
| FDR | False Discovery Rate |
| NO2 | Nitrogen dioxide |
| NOx | Nitrogen oxides |
| O3 | Ozone |
| PM2.5 | Particulate matter with aerodynamic diameter ≤2.5 µm |
| PM10 | Particulate matter with aerodynamic diameter ≤10 µm |
| SO2 | Sulfur dioxide |
References
- Stafoggia, M.; Cesaroni, G.; Galassi, C.; Badaloni, C.; Forastiere, F. Long-term health effects of air pollution: Results of the European project ESCAPE. Recent. Progress. Med. 2014, 105, 450–453. [Google Scholar] [CrossRef] [Scilit] [PubMed]
- Pope, C.A.; Bates, D.V.; Raizenne, M.E. Health effects of particulate air pollution: Time for reassessment? Environ. Health Perspect. 1995, 103, 472–480. [Google Scholar] [CrossRef] [PubMed]
- WHO. Health Risks of Air Pollution in Europe: HRAPIE-2 Project: Updated Guidance on Concentration–Response Functions for Health Risk Assessment of Air Pollution in the WHO European Region; WHO Regional Office for Europe: Copenhagen, Denmark, 2025; Available online: https://iris.who.int/server/api/core/bitstreams/19bdf746-06de-4f1b-90ba-f8d53989936f/content (accessed on 5 June 2026).
- Baquie, S.; Behrer, P.A.; Du, X.; Fuchs, A.; Nozaki, N.K. Impacts and Sources of Air Pollution in Tbilisi, Georgia; Policy Research Working Paper No. 10643; World Bank: Washington, DC, USA, 2023. [Google Scholar] [CrossRef] [Scilit]
- Hrnčiar, M.; Chytrý, J.; Labohý, J.; Bohovic, R.; Skalský, M.; Černochová, M.; Toidze, N. Air Pollution in Georgia as Seen from Space: Study Based on Satellite Imagery & Copernicus Data; Arnika: Prague, Czech Republic; Tbilisi, Georgia, 2023; Available online: https://view.publitas.com/arnika-zs/air-pollution-in-georgia-as-seen-from-space_eng (accessed on 5 January 2026).
- Ministry of Environment Protection and Agriculture Government of Georgia. Georgia’s 2030 Climate Change Strategy and Action Plan. 2021. Available online: https://faolex.fao.org/docs/pdf/geo209870.pdf (accessed on 5 January 2026).
- International Energy Agency. Sustainable Transport Policy for Georgia: A Roadmap. 2025. Available online: https://iea.blob.core.windows.net/assets/182bc41d-1a59-4ad7-ba80-b201354196ae/SustainableTransportPolicyforGeorgia.pdf (accessed on 5 January 2026).
- Georgia Today. Air Quality in Georgia: Need for Urgent Policy Solutions. Available online: https://georgiatoday.ge/air-quality-in-georgia-need-for-urgent-policy-solutions (accessed on 4 January 2026).
- Maghedani, T. Air Pollution Regulation in Georgia: Current Needs and Policies. Heinrich-Böll Stiftung. Available online: https://ge.boell.org/en/2022/12/15/atmosperuli-haeris-dabindzurebis-kontroli-sakartveloshi-arsebuli-politika-da (accessed on 4 January 2026).
- UNDP. Georgia Strives to Improve Air Quality in Cities. UNDP. Available online: https://www.undp.org/georgia/press-releases/georgia-strives-improve-air-quality-cities (accessed on 4 January 2026).
- Tchantouridzé, L. COVID-19: The Case Of Georgia. Cent. Asia Cauc. 2020, 21, 070–078. [Google Scholar] [CrossRef] [Scilit]
- Nadareishvili, I.; Zhulina, A.; Tskitishvili, A.; Togonidze, G.; Bloom, D.E.; Lunze, K. The Approach to the COVID-19 Pandemic in Georgia—A Health Policy Analysis. Int. J. Public Health 2022, 67, 1604410. [Google Scholar] [CrossRef] [Scilit] [PubMed]
- Mahato, S.; Pal, S.; Ghosh, K.G. Effect of lockdown amid COVID-19 pandemic on air quality of the megacity Delhi, India. Sci. Total Environ. 2020, 730, 139086. [Google Scholar] [CrossRef] [Scilit] [PubMed]
- Otmani, A.; Benchrif, A.; Tahri, M.; Bounakhla, M.; Chakir, E.M.; El Bouch, M.; Krombi, M. Impact of Covid-19 lockdown on PM10, SO2 and NO2 concentrations in Salé City (Morocco). Sci. Total Environ. 2020, 735, 139541. [Google Scholar] [CrossRef] [Scilit] [PubMed]
- Nakada, L.Y.K.; Urban, R.C. COVID-19 pandemic: Impacts on the air quality during the partial lockdown in São Paulo state, Brazil. Sci. Total Environ. 2020, 730, 139087. [Google Scholar] [CrossRef] [Scilit] [PubMed]
- Sicard, P.; De Marco, A.; Agathokleous, E.; Feng, Z.; Xu, X.; Paoletti, E.; Rodriguez, J.J.D.; Calatayud, V. Amplified ozone pollution in cities during the COVID-19 lockdown. Sci. Total Environ. 2020, 735, 139542. [Google Scholar] [CrossRef] [Scilit] [PubMed]
- World Bank Group. Georgia. Available online: https://www.worldbank.org/ext/en/country/georgia (accessed on 2 January 2026).
- Asian Development Bank. Poverty Data: Georgia. Available online: https://www.adb.org/where-we-work/georgia/poverty (accessed on 2 January 2026).
- World Population Review. World Cities. Available online: https://worldpopulationreview.com/cities/starting-with/t (accessed on 2 January 2026).
- CEE Bankwatch Network. Urban Public Transport Reform in Tbilisi; CEE Bankwatch Network: Prague, Czech Republic, 2022. [Google Scholar]
- National Statistics Office of Georgia (Geostat). Population by Cities and Boroughs (Excel Dataset). Available online: https://geostat.ge/media/53040/1-3-population-by-cities-and-boroughs.xlsx (accessed on 3 January 2026).
- Alejo-Sanchez, L.E.; Márquez-Grajales, A.; Salas-Martínez, F.; Franco-Arcega, A.; López-Morales, V.; Acevedo-Sandoval, O.A.; González-Ramírez, C.A.; Villegas-Vega, R. Missing data imputation of climate time series: A review. MethodsX 2025, 15, 103455. [Google Scholar] [CrossRef] [Scilit] [PubMed]
- Flores, A.; Tito-Chura, H.; Cuentas-Toledo, O.; Yana-Mamani, V.; Centty-Villafuerte, D. PM2.5 Time Series Imputation with Moving Averages, Smoothing, and Linear Interpolation. Computers 2024, 13, 312. [Google Scholar] [CrossRef] [Scilit]
- Bernal, J.L.; Cummins, S.; Gasparrini, A. Interrupted time series regression for the evaluation of public health interventions: A tutorial. Int. J. Epidemiol. 2017, 46, 348–355. [Google Scholar] [PubMed]
- Petit, J.-E.; Dupont, J.-C.; Favez, O.; Gros, V.; Zhang, Y.; Sciare, J.; Simon, L.; Truong, F.; Bonnaire, N.; Amodeo, T.; et al. Response of atmospheric composition to COVID-19 lockdown measures during spring in the Paris region (France). Atmos. Chem. Phys. 2021, 21, 17167–17183. [Google Scholar] [CrossRef] [Scilit]
- Mann, H.B. Nonparametric tests against trend. Econometrica 1945, 13, 245–259. [Google Scholar] [CrossRef] [Scilit]
- Kendall, M.G. Rank Correlation Methods, 4th ed.; Charles Griffin: London, UK, 1975. [Google Scholar]
- Gilbert, R.O. Statistical Methods for Environmental Pollution Monitoring; Van Nostrand Reinhold: New York, NY, USA, 1987. [Google Scholar]
- Van Rossum, G.; Drake, F.L. Python Reference Manual; Centrum voor Wiskunde en Informatica: Amsterdam, The Netherlands, 1995. [Google Scholar]
- Venter, Z.S.; Aunan, K.; Chowdhury, S.; Lelieveld, J. COVID-19 lockdowns cause global air pollution declines. Proc. Natl. Acad. Sci. USA 2020, 117, 18984–18990. [Google Scholar] [CrossRef] [Scilit] [PubMed]
- Kumari, P.; Toshniwal, D. Impact of lockdown on air quality over major cities across the globe during COVID-19 pandemic. Urban Clim. 2020, 34, 100719. [Google Scholar] [CrossRef] [Scilit] [PubMed]
- Sharma, S.; Zhang, M.; Gao, J.; Zhang, H.; Kota, S.H. Effect of restricted emissions during COVID-19 on air quality in India. Sci. Total Environ. 2020, 728, 138878. [Google Scholar] [CrossRef] [Scilit] [PubMed]
- Dantas, G.; Siciliano, B.; França, B.B.; da Silva, C.M.; Arbilla, G. The impact of COVID-19 partial lockdown on the air quality of the city of Rio de Janeiro, Brazil. Sci. Total Environ. 2020, 729, 139085. [Google Scholar] [CrossRef] [Scilit] [PubMed]
- Khan, R.; Kumar, K.R.; Zhao, T. The Impact of Lockdown on Air Quality in Pakistan during the COVID-19 Pandemic Inferred from the Multi-sensor Remote Sensed Data. Aerosol Air Qual. Res. 2021, 21, 200597. [Google Scholar] [CrossRef] [Scilit]
- Muhammad, S.; Long, X.; Salman, M. COVID-19 pandemic and environmental pollution: A blessing in disguise? Sci. Total Environ. 2020, 728, 138820. [Google Scholar] [CrossRef] [Scilit] [PubMed]
- Bauwens, M.; Compernolle, S.; Stavrakou, T.; Müller, J.-F.; Van Gent, J.; Eskes, H.; Levelt, P.F.; Van Der A, R.; Veefkind, J.P.; Vlietinck, J.; et al. Impact of Coronavirus Outbreak on NO2 Pollution Assessed Using TROPOMI and OMI Observations. Geophys. Res. Lett. 2020, 47, e2020GL087978. [Google Scholar] [CrossRef] [Scilit] [PubMed]
- Islam, M.S.; Tusher, T.R.; Roy, S.; Rahman, M. Impacts of nationwide lockdown due to COVID-19 outbreak on air quality in Bangladesh: A spatiotemporal analysis. Air Qual. Atmos. Health 2021, 14, 351–363. [Google Scholar] [CrossRef] [Scilit] [PubMed]
- No More Tax. Free Zones in Georgia. Available online: https://nomoretax.eu/free-zones-georgia/ (accessed on 3 January 2026).
- Koçak, M.; Mihalopoulos, N.; Tutsak, E.; Theodosi, C.; Zarmpas, P.; Kalegeri, P. PM10 and PM2.5 composition over the Central Black Sea: Origin and seasonal variability. Environ. Sci. Pollut. Res. 2015, 22, 18076–18092. [Google Scholar] [CrossRef] [Scilit] [PubMed]
- European Bank for Reconstruction and Development (EBRD). Batumi—EBRD Green Cities. Available online: https://www.ebrdgreencities.com/our-cities/cities/batumi/ (accessed on 3 January 2026).
- Menut, L.; Bessagnet, B.; Siour, G.; Mailler, S.; Pennel, R.; Cholakian, A. Impact of lockdown measures to combat COVID-19 on air quality over western Europe. Sci. Total Environ. 2020, 741, 140426. [Google Scholar] [CrossRef] [Scilit] [PubMed]

Disclaimer/Publisher’s Note: The statements, opinions and data contained in all publications are solely those of the individual author(s) and contributor(s) and not of MDPI and/or the editor(s). MDPI and/or the editor(s) disclaim responsibility for any injury to people or property resulting from any ideas, methods, instructions or products referred to in the content. |
© 2026 by the authors. Licensee MDPI, Basel, Switzerland. This article is an open access article distributed under the terms and conditions of the Creative Commons Attribution (CC BY) license.