


Abstract
Mercury contamination in aquatic ecosystems is a worldwide issue due to the health risks associated with eating contaminated fish. The present study was carried out to measure the mercury (Hg) levels in different tissues of locally harvested fish and to assess the potential human health risks associated with their consumption. Fifty-two fish samples (northern pike (Esox lucius), walleye (Sander vitreus), and white bass (Morone chrysops)) were dissected, and tissue samples were individually homogenized and measured for total mercury using a Milestone DMA-80 tri-cell analyzer. Among the species studied, the highest mean Hg concentrations in the muscles and kidneys were observed in northern pike, while the highest Hg concentrations in the livers and gills were noted in white bass. The liver consistently showed the highest mercury accumulation across all species. The Hg levels in almost 50% of the northern pike muscle tissue samples exceeded the limit (0.5 μg/g) set by the European maximum permissible concentration for foodstuffs. Correlation analysis revealed a strong positive correlation between the Hg concentration in the muscles with both the weight and length of walleye and white bass. Human health risk assessment was estimated by the maximum allowable daily fish consumption (CRlim), maximum allowable monthly fish meal consumption (CRmm), individual risk assessment, and the target hazard quotient (THQ). The average monthly consumption limit (CRmm) ranged from two to four meals for adults and one to two meals for children. Individual risk assessment showed potential health risks associated with the regular consumption of northern pike and white bass, followed by walleye, for both adults and children. The mean hazard quotient (THQ) values exceeded one for all species in both adults and children, which indicates potential health risks associated with fish consumption. Across all species studied, children experienced higher risk than adults, suggesting greater susceptibility to potential health effects from the consumption of the studied fish. Lastly, the mercury levels should be regularly monitored, especially in piscivorous fish like northern pike, for pollution control and human health protection.
1. Introduction
Fish are a good source of high-quality protein, essential fatty acids, vitamins, and minerals for humans. They provide omega-3 fatty acids as well as important micronutrients such as iron, zinc, vitamin A, and vitamin D. Regular fish consumption has been associated with several health benefits, including supporting brain function, cardiovascular health, healthy growth and development, and a reduced risk of chronic conditions, such as heart disease, diabetes, and age-related cognitive impairment [1]. In freshwater ecosystems, fish also serve as indicators of trace metal contamination because they can accumulate the contaminants present in aquatic environments. Fish obtain their food from a wide range of sources in aquatic environments, including plankton, algae, insects, detritus, and smaller fish. Trace metals and other contaminants can bioaccumulate in fish, especially as larger predatory species eat smaller fish, enriching these substances up the food chain and ultimately consumed by humans. Although fish provide significant nutritional benefits, the accumulation of toxic contaminants may pose significant health risks to consumers [2,3,4,5,6].
Mercury is a naturally occurring trace element that exists in elemental mercury, inorganic mercury compounds, and organic mercury compounds. Each form exhibits different chemical behavior and toxicity. Mercury is a persistent and highly mobile contaminant due to its volatile nature. Mercury enters the environment from both natural sources, such as volcanoes and rock weathering, and anthropogenic sources, including coal burning, mining, industrial processes, and waste disposal. Once released, mercury can move and be recycled between the air, soil, and water before eventually settling in sediment and soil where it can remain for decades [7,8]. In the environment, mercury moves between soil, water, and air, changing between soluble and insoluble forms through methylation and demethylation. This cycle is completed by precipitation, with mercury either converted into volatile forms that return to the atmosphere or remaining in soluble forms that bioaccumulate in organisms and increase in concentration up the food chain [9].
Mercury is a globally widespread pollutant and a major worldwide concern due to its toxicity. Mercury can accumulate in fish and increase in concentration through the food chain, making fish consumption an important pathway for mercury exposure in humans. Human exposure to mercury through fish consumption poses adverse health effects. It can damage vital organs such as the kidneys, liver, heart, and central nervous system. It is also related to cardiovascular problems, including hypertension, coronary heart disease, and myocardial infarction. Mercury exposure during pregnancy affects fetal development, leading to lower birth weight, cognitive impairments, hearing loss, neurological problems, and delayed growth in newborns [10,11]. Therefore, monitoring mercury concentrations in locally harvested fish is important for evaluating potential health risks and ensuring food safety in local communities.
Mercury enters the environment through both natural processes (volcanic activity, forest fires, soil leaching) and anthropogenic sources (fossil fuel combustion, waste incineration). These release mercury to the atmosphere for subsequent wet and dry deposition or mobilize it directly through watershed runoff and erosion [12]. In closed-basin systems like Devils Lake, these inputs accumulate over time due to the absence of a continuous natural outflow. Devils Lake is a popular spot for fishing; however, information regarding mercury accumulation in fish species in this ecosystem remains limited. Therefore, this study was conducted to assess the Hg levels in the three most popular fish species harvested from Devils Lake. The main objectives of this study were (i) to assess mercury (Hg) concentrations in three locally harvested fish species, (ii) to compare Hg levels among different tissues (the muscle, gill, liver, and kidney), and (iii) to evaluate the potential human health risks associated with fish consumption using various risk assessment indices. Lastly, this study will contribute to the limited baseline mercury monitoring data available for Devils Lake and will offer a multi-tissue, multi-species assessment of Hg bioaccumulation and associated human health risk in this closed-basin lake ecosystem. The study findings will provide valuable insights into mercury bioaccumulation in local fish species and support the development of safer consumption guidelines to protect human health and aquatic ecosystems locally.
2. Materials and Methods
2.1. Study Area
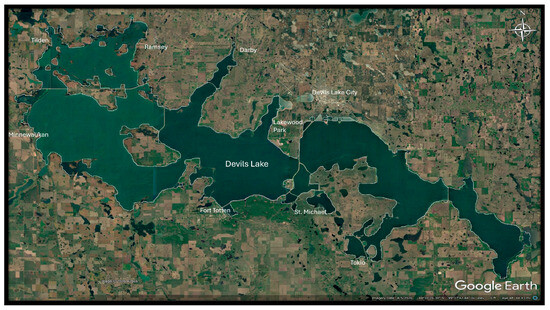
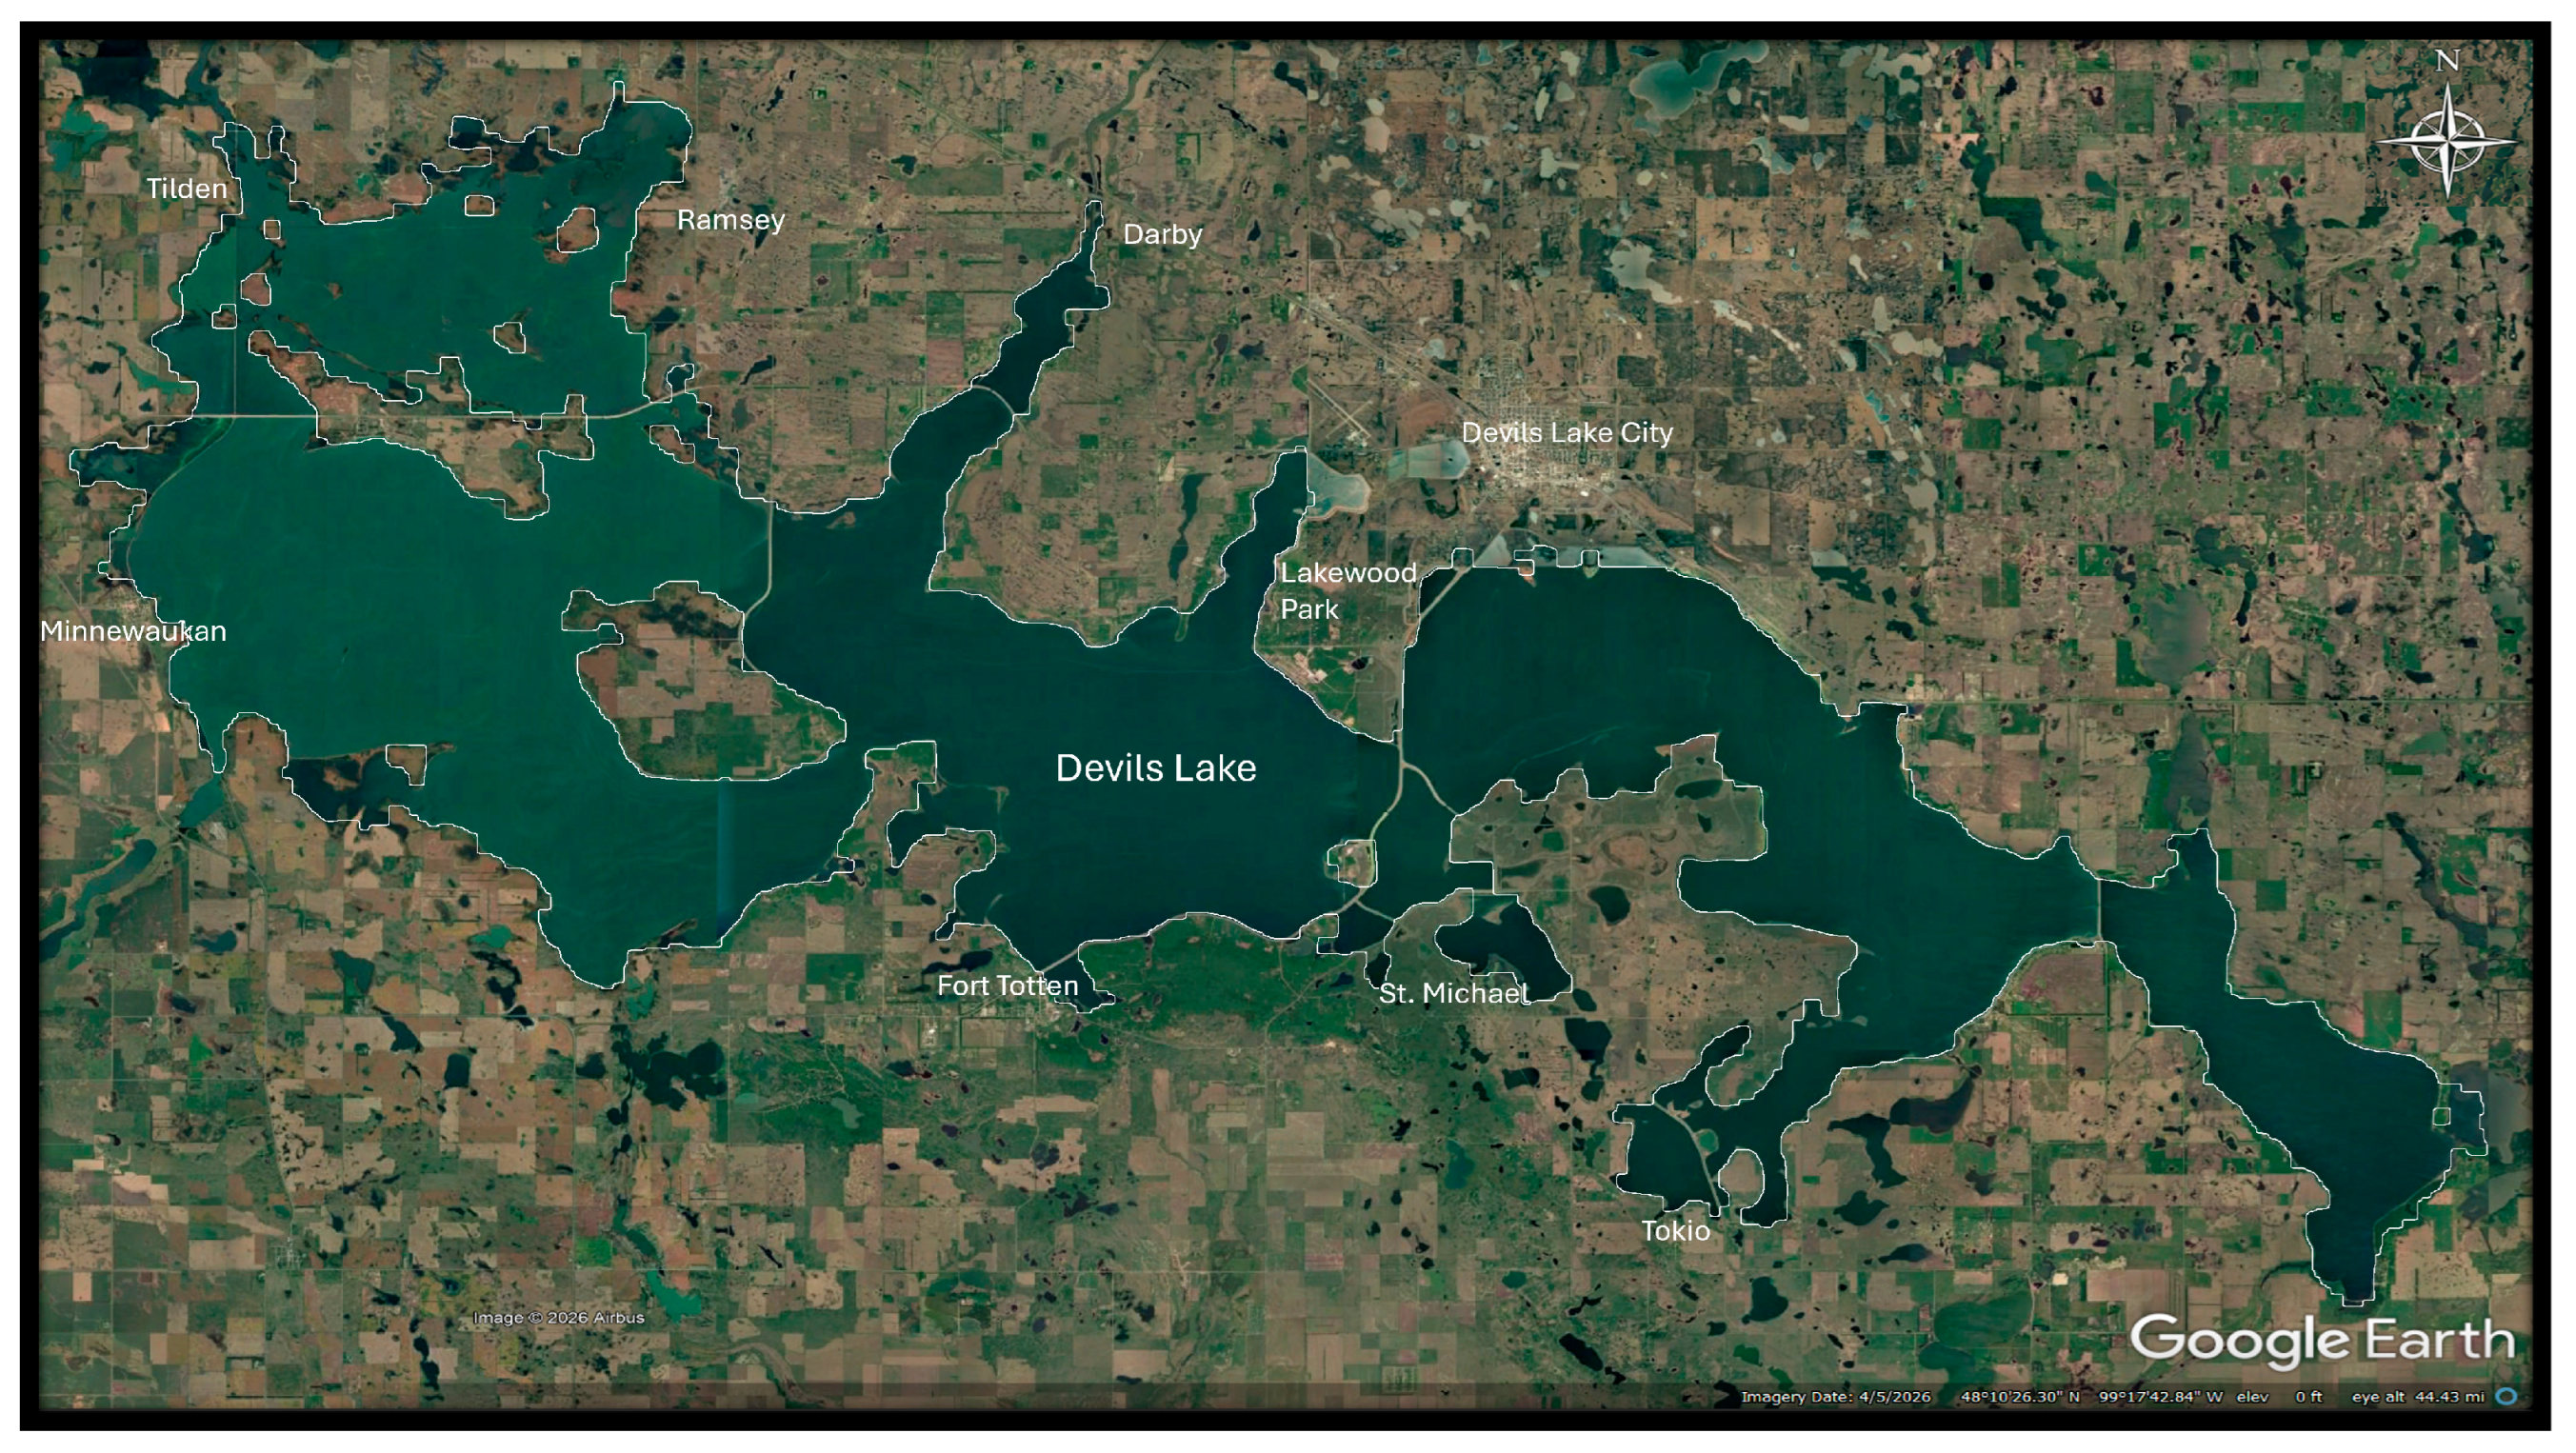
Devils Lake (48°05′58″ N, 98°54′10″ W), located in northeastern North Dakota, is the state’s largest natural lake (Figure 1). It is a large, shallow lake mainly used for recreational activities. The lake covers more than 160,000 acres and has hundreds of miles of shoreline. It provides essential habitat for a diverse range of fish and wildlife species. It is known as the “Perch Capital of the World” and is also full of walleye, northern pike, yellow perch, and white bass, making it a popular spot for fishing, bird watching, and hunting. Due to its closed basin, Devils Lake experiences fluctuating water levels. When there are dry spells, the lake can shrink, and, when there is heavy rain, the lake rises and spreads for miles. Since 1993, Devils Lake has risen about 9 m. This rise has flooded over 675 square kilometers and caused more than 900 buildings to be moved or abandoned [13,14,15,16]. Because the objective of this study was to evaluate mercury concentrations and potential human health risks, sampling coordinates were not recorded. Spatial and temporal variations in mercury accumulation in fish are planned for future research.
Figure 1.
Study map of Devils Lake.
2.2. Collection, Pretreatment, and Storage of Fish Samples
In the summer of 2023, 52 fish samples of the three species were collected from Devils Lake using standard methodology [17]. A total of 15 northern pike (Esox lucius), 16 walleye (Sander vitreus), and 21 white bass (Morone chrysops) were collected by conventional angling methods at a recreational fishing area. Fish were collected after capture, and no experiment or procedures were conducted on live vertebrates. After collection, they were placed in pre-cleaned plastic bags, transported in an ice cooler to the laboratory, and processed immediately. After recording the length and weight of each fish, they were dissected into different tissues (muscle, liver, gill, and kidney). These tissue samples were individually homogenized and kept frozen at −20 °C for further analysis [10].
2.3. Instrumentation
The mercury concentrations in the fish samples were determined from homogenized and grounded samples using a Milestone DMA-80 Tri-Cell Direct Mercury Analyzer (Milestone, Shelton, CT, USA) without any treatment. All analytical procedures followed EPA Method 7473 (Revision D, February 2007) and the manufacturer’s operating guidelines to ensure calibration and analysis requirements. The optimal instrument operating parameters were as follows: oxygen carrier gas at 60 psig; drying for 70 s at 250 °C; decomposition for 180 s at 250 °C; catalyst temperature of 565 °C; cell temperature of 120 °C; purge time of 60 s; amalgamator heating of 12 s; and data recording for 30 s. Liquid calibration standards and solid samples, including standard reference materials, were weighed to about 0.1 mg in quartz sample boats prior to analysis using an autosampler spindle. Calibration acceptance required a minimum three-point curve with a regression coefficient (R2) ≥ 0.995 based on either linear or quadratic fitting [18]. For quality control and quality assurance, blank, blank spike, duplicate sample, sample spike, and certified reference material (DORM-4 fish protein, Research Council Canada, Ottawa, ON, Canada) were used. The limit of detection (LOD) and limit of quantification (LOQ) were 0.0022 µg/g and 0.0063 µg/g, respectively, confirming that all reported mercury concentrations were within the quantifiable range of the analytical method. Acceptable recovery of DORM-4 mercury was above 90%, and acceptable relative percentage difference (RPD, %) of Hg level in duplicate samples was less than 10%.
2.4. Human Health Risk Assessment
2.4.1. Consumption Limits for Noncarcinogenic Effects
The maximum allowable daily fish consumption rate CRlim (kg/d) was determined using the following calculation [19,20]:
where RfD = reference dose (mg/kg/d), C = concentration in fish muscle (mg/kg), and BW = mean body weights. The body weights used in this study were 70 kg for adults and 14.5 kg for children (<6 years). RfD for Hg was 0.0001 mg/kg/d [20].
The maximum daily fish consumption rates were converted into allowable fish meals per month (CRmm) using the following calculation [19,20].
where Tap = average exposure time, MS = meal size. In this study, Tap was 30.44 days per month, and MS was 0.227 kg for adults, 0.114 kg for children [19,20].
2.4.2. Individual Risk Assessment
To assess individual risk, the ratio between the estimated exposure to a contaminant and its reference dose (RfD) was calculated using the following equation:
where exposure = total exposure to a single contaminant (mg/kg-d); RfD = reference dose. When the ratio is equal to or exceeds 1, the exposed population may be considered at potential risk of adverse health effects.
Individual exposure assessment was calculated by the following equation:
where Em = individual exposure to chemical contaminant (m) from ingesting fish (mg/kg-d); Cm = concentration of chemical contaminant (m) in the edible portion of fish (mg/kg); CR = mean daily consumption rate of fish (kg/d); BW = body weight of an individual consumer (kg) [20]. CR = 0.032 kg/d for adults and 0.008 kg/d for children.; BW is 70 kg for adults and 14.5 kg for children < 6 years.
2.4.3. Target Hazard Quotient (THQ)
The target hazard quotient (THQ) was used to estimate the risk of non-carcinogenic effects from lifelong contaminant exposures and was calculated using the following equation:
where EF = exposure frequency (365 days/year), ED = exposure duration (70 years for adults or 6 years for children), AT = average exposure time (EF × ED) [19], and IR = 0.032 kg/d for adults and 0.008 kg/d for children. The IR values used in this study were based on the FDA-recommended Dietary Guidelines for Americans for fish consumption, which suggest 0.227 kg (8 ounces) per week for adults and 0.057 kg (2 ounces) per week for children under 6 years of age. When THQ is <1, no long-term adverse effects on human health are expected.
3. Results and Discussions
3.1. Determination of Mercury in Fish Samples
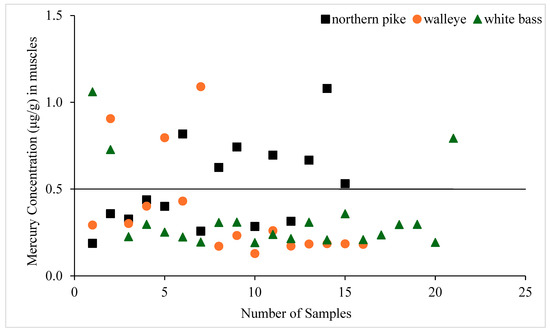
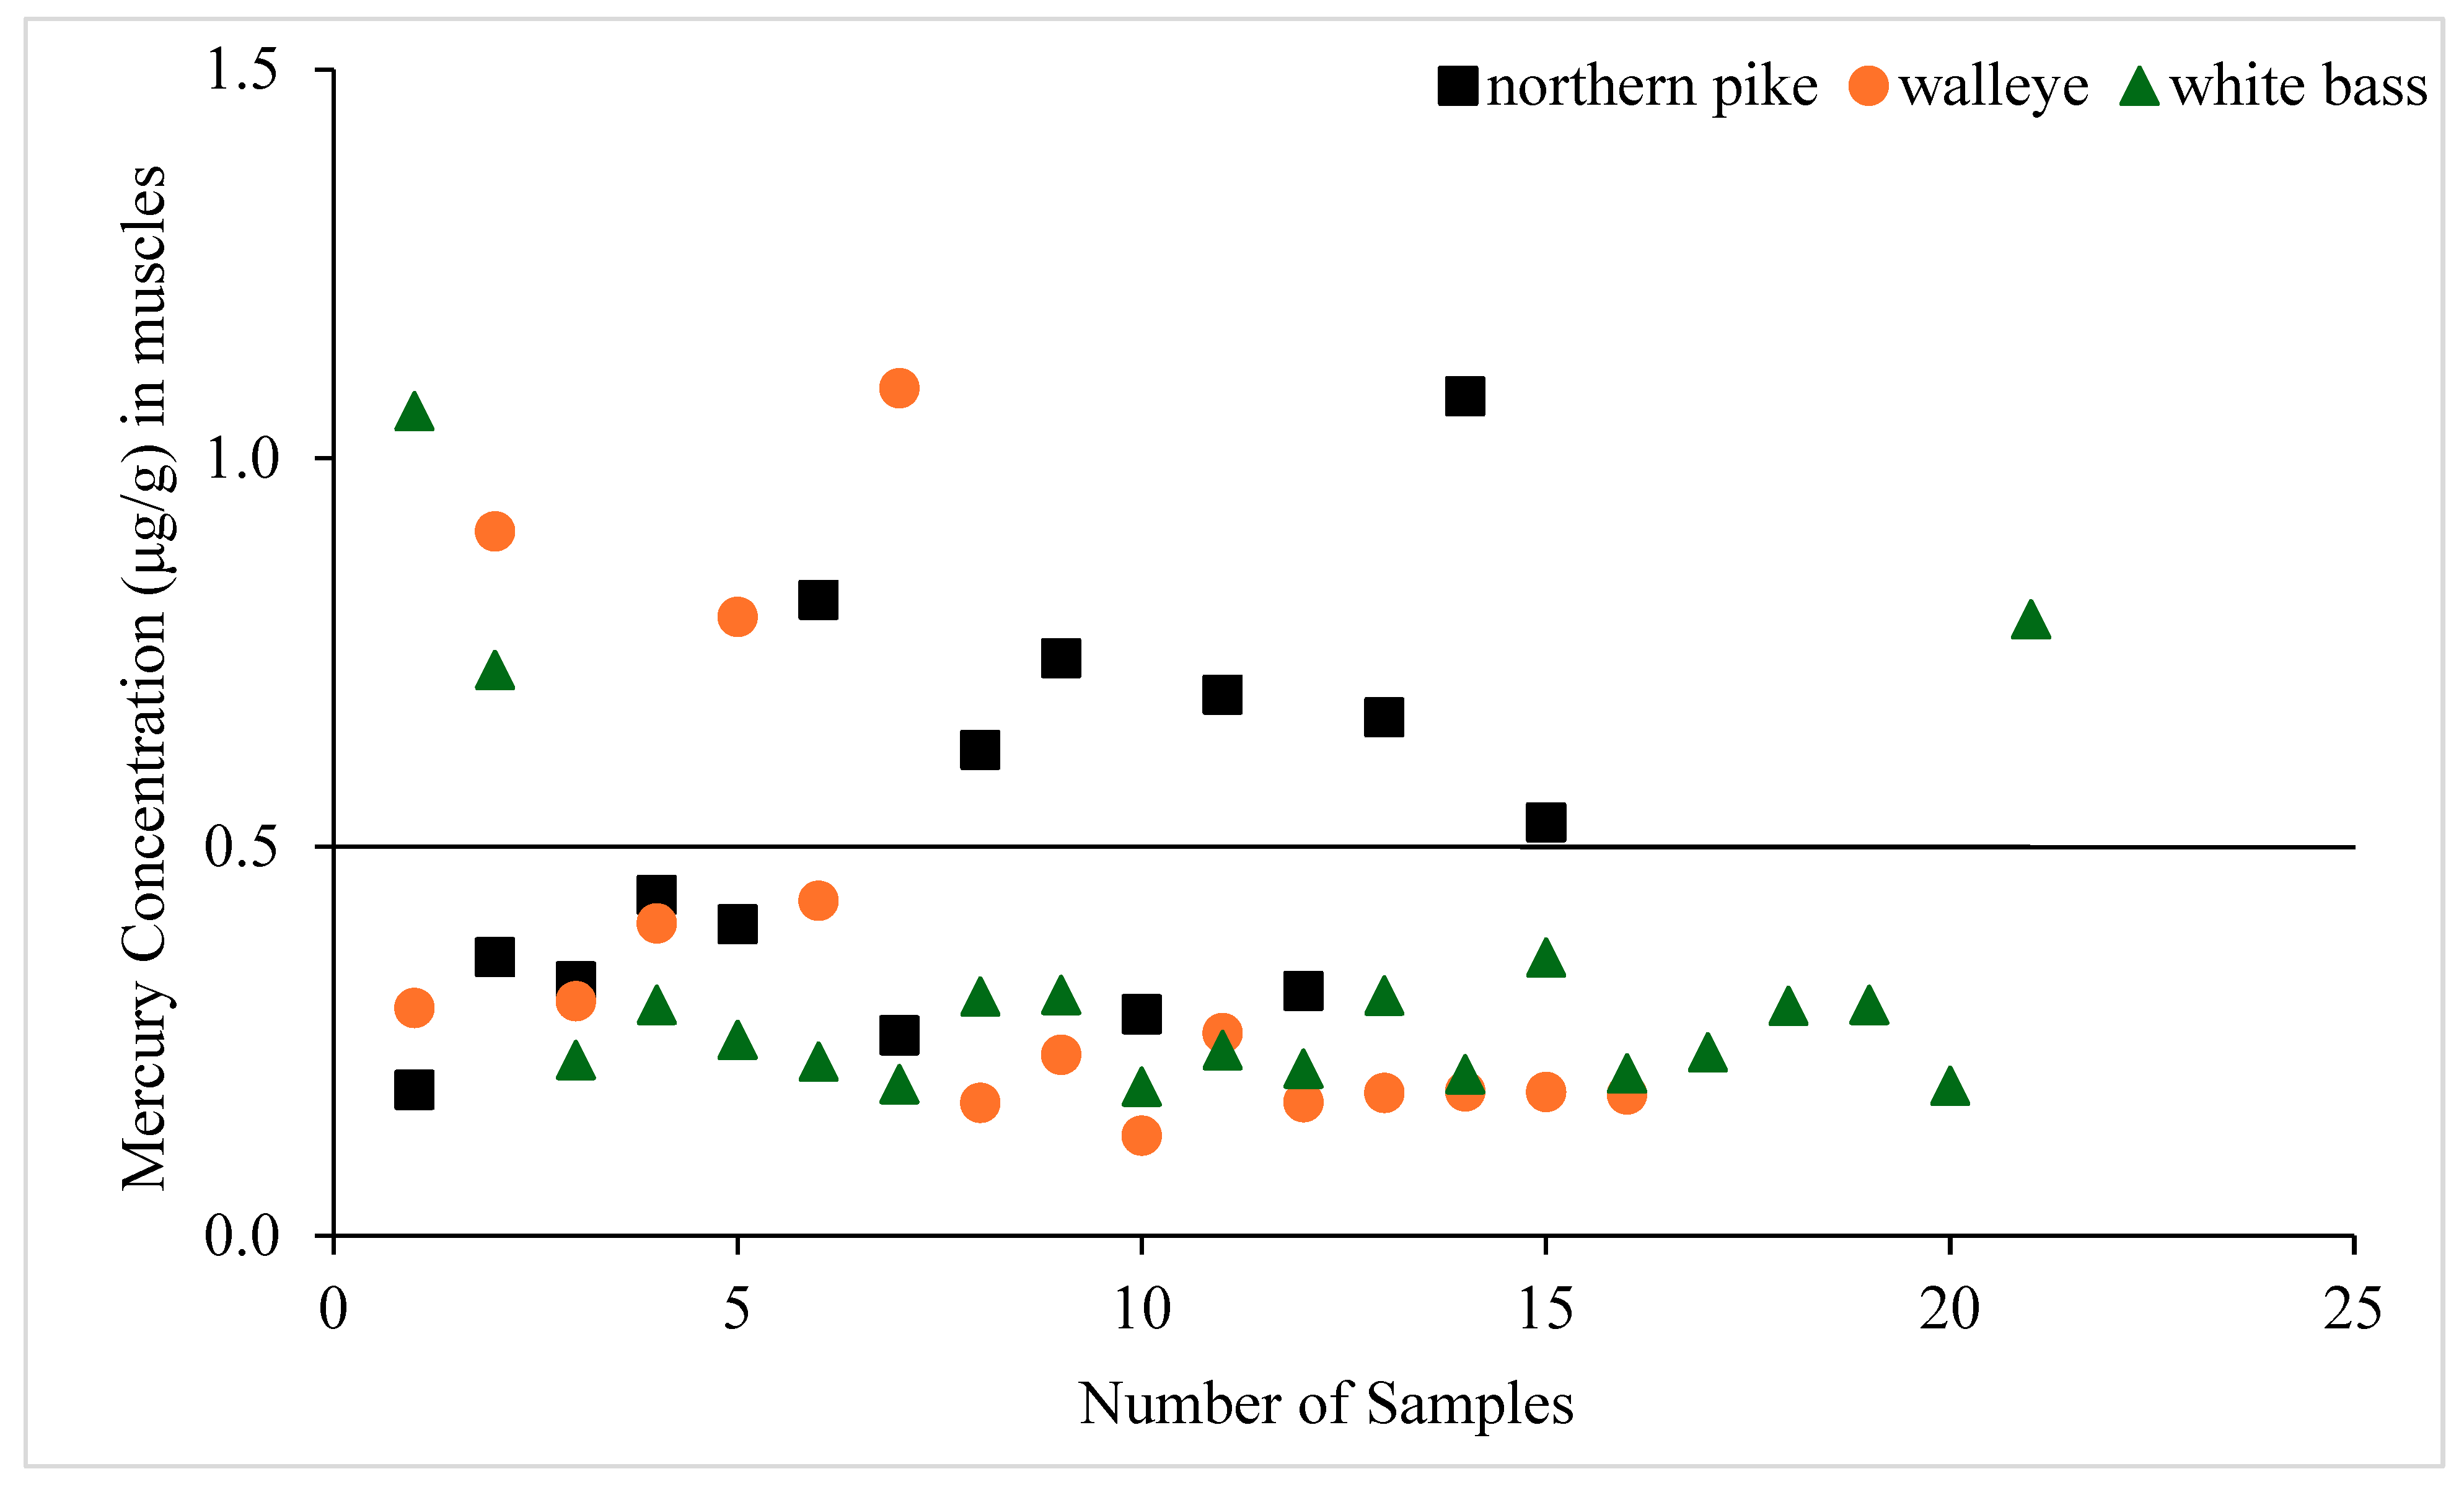
The descriptive analysis of the Hg concentration in the different tissues of northern pike, walleye, and white bass is shown in Table 1. Mercury concentrations were measured in 52 fish specimens, including northern pike (n = 15), walleye (n = 16), and white bass (n = 21). Similar monitoring approaches have been used in previous studies to evaluate mercury contamination in fish and assess the potential human health risks associated with fish consumption [21,22]. Although the sample size in the present study was modest, the analysis of multiple tissues provided valuable information on tissue-specific Hg accumulation patterns and variability among the analyzed fish species. The present study showed considerable variation in Hg levels in the different tissues of northern pike. The mean Hg concentrations in the different tissues were in the following decreasing order: liver (0.82 μg/g) > kidney (0.55 μg/g) > muscles (0.52 μg/g) > gills (0.29 μg/g). The maximum Hg concentration was observed in liver tissue (4.43 μg/g), which was approximately two times higher than in the kidney (1.91 μg/g) and four times higher than in the muscle tissue (1.08 μg/g). Significant heterogeneity in mercury levels in tissue was observed, with positive skewness and high kurtosis. Their values indicated the presence of a few individuals with exceptionally elevated Hg concentrations [23,24]. This was confirmed statistically using the Shapiro–Wilk test, which indicated a significant lack of normality (p < 0.001) in the kidney and liver tissues of northern pike. The gill tissue of northern pike also showed a significant deviation from normality at the p < 0.05 level. The mean Hg concentration in northern pike muscle exceeded the European maximum permissible concentration for foodstuffs (0.5 μg/g), with approximately 50% of the samples (Figure 2) exceeding this threshold limit and indicating a potential risk for human health.
Table 1.
Statistical distribution of mercury level (μg/g, ww) in tissues of northern pike, walleye, and white bass.
Figure 2.
Comparison of mercury concentration in fish muscles with maximum permissible concentration limit.
The mean values for the length and weight of walleye were 43.0 cm and 900 g (Table 1). The mean concentrations of Hg in the liver, kidney, muscles, and gill tissue of walleye were 0.73, 0.22, 0.37, and 0.19 μg/g, respectively. High standard deviations indicate significant variability in Hg concentrations in walleye tissues. The liver tissue showed the highest SD (0.64 μg/g), followed by the muscles (SD = 0.30), gills (SD = 0.17), and kidney (SD = 0.12). The positive skewness values (0.70 in kidney to 3.15 in gills) and high kurtosis values (−0.37 to 10.89) indicate non-normal, right-skewed distributions of Hg concentration in walleye tissue. These results suggest that some individuals had high concentrations in tissues. Non-Gaussian distributions were observed statistically in the muscle, gill, and liver tissues of walleye based on the Shapiro–Wilk test (p < 0.001). The mean Hg level in level in the walleye muscle was lower than the European maximum permissible concentration for foodstuffs (0.5 μg/g). Approximately 80% of the samples analyzed showed Hg concentrations below the maximum permissible level (Figure 2), indicating minimal health risk for consumers.
The basic statistical parameters (Table 1) indicate that the Hg concentrations in the muscles, gills, kidneys, and liver of white bass were 0.34 μg/g, 0.31 μg/g, 0.28 μg/g, and 0.99 μg/g, respectively. The data indicates high variability in Hg concentrations among white bass tissues. The distribution of Hg concentrations was non-Gaussian with high SD, positive skewness, and elevated kurtosis values. This was confirmed statistically by the Shapiro–Wilk test, which indicated a significant lack of normality (p < 0.001) in all white bass tissues. These statistical patterns once again reflect the presence of a few outlier samples with higher Hg concentrations than the overall mean [25]. The mean Hg level in the white bass muscle remained under the European regulatory threshold limit of 0.5 μg/g established for foodstuffs, with approximately 85% of the samples (Figure 2) well below the threshold limit, which indicates minimal health concerns for consumers.
3.2. Mercury Concentration Among Tissues in Fish Species
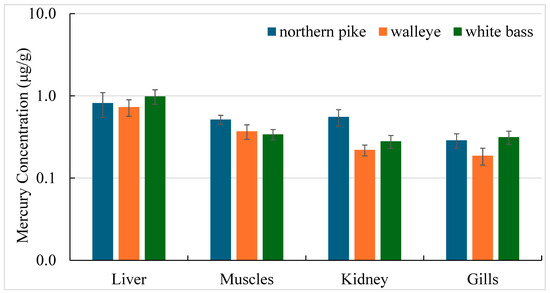
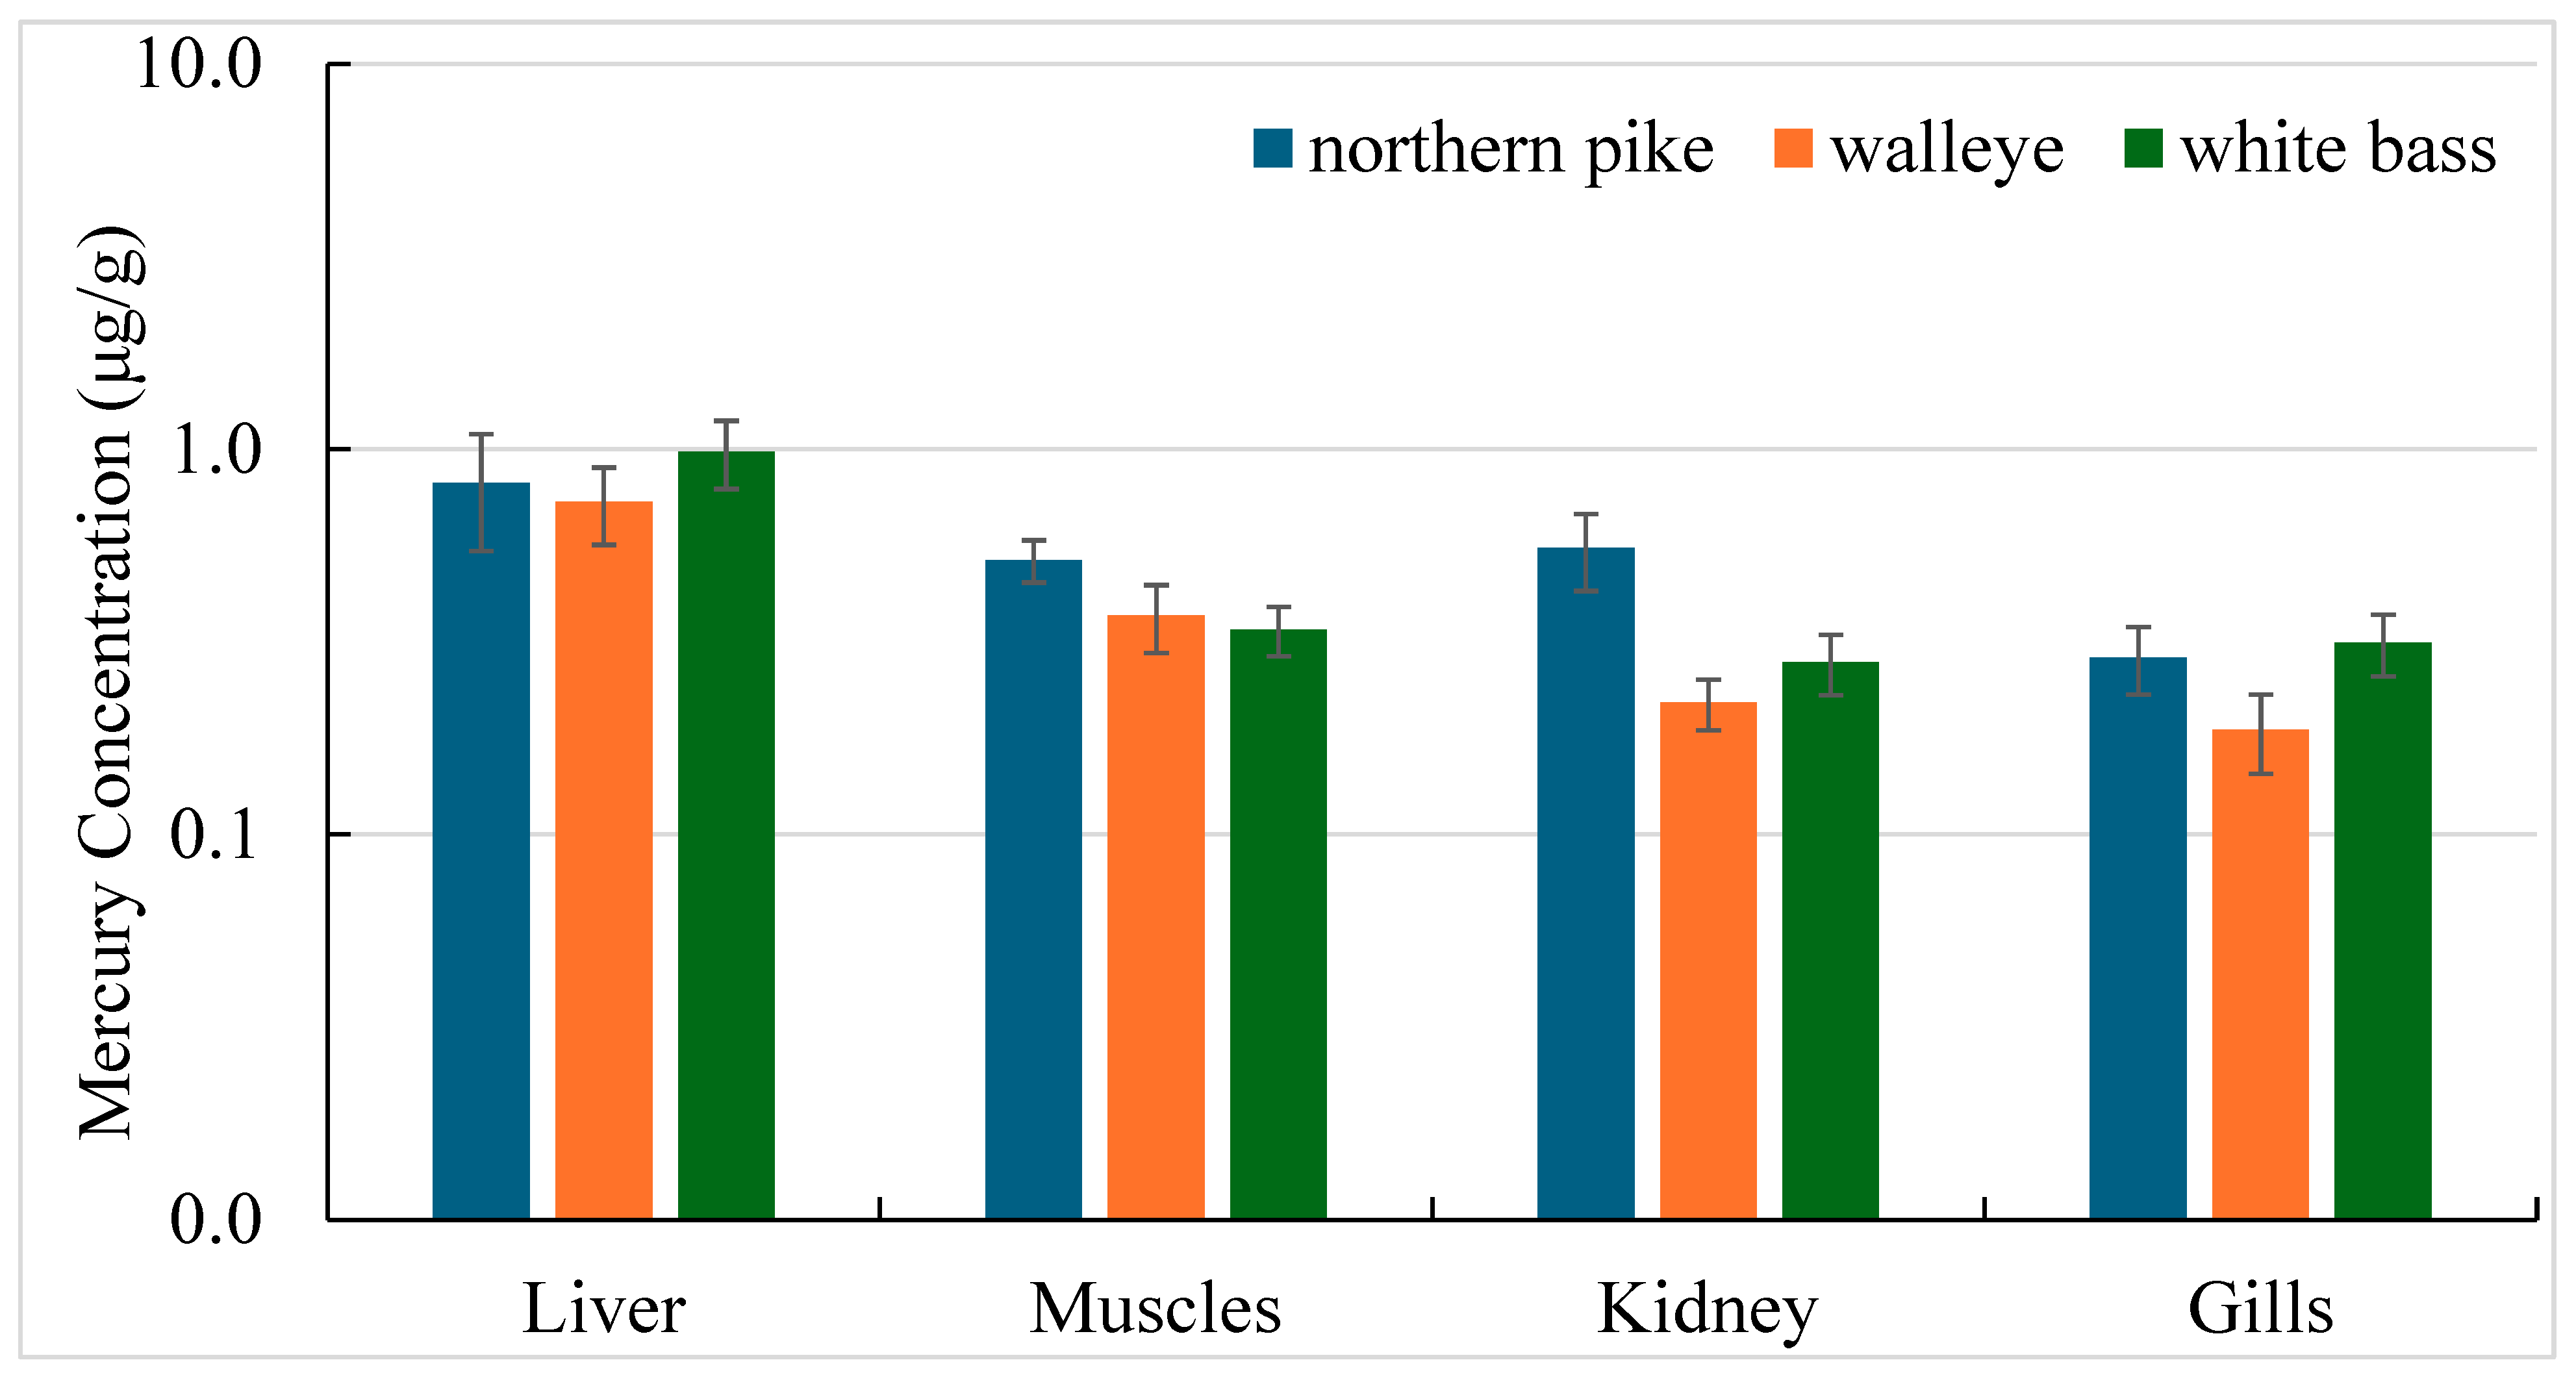
A comparison of the mean Hg levels among the tissues of northern pike, walleye, and white bass is shown in Figure 3. In northern pike, the highest mean Hg level was found in the liver, followed by the kidney, muscles, and gills. Similarly, the Hg concentrations in walleye decreased in the following order: liver > muscles > kidney > gills. The mean Hg level in white bass decreased in the following order: liver > muscles > gills > kidney. Both northern pike and walleye exhibited the highest mean Hg accumulation in the liver and the lowest in the gills, whereas white bass also showed maximum accumulation in the liver but the lowest concentration in the kidney. Overall, among all three species, the liver consistently displayed the highest Hg concentration in the analyzed tissues. Moiseenko and Gashkina (2020) [26] reported the highest Hg accumulation in the liver in northern pike and the lowest in gills, and Johnston et al, (2001) [27] observed that walleye from Clay Lake had higher Hg levels in the liver compared to the muscle tissue. These findings are consistent with the current study concerning the Hg bioaccumulation in the liver. It is well-known that the liver serves as the primary site for heavy metal accumulation because the liver is responsible for detoxification and transformation, and it tends to accumulate metals at higher concentrations than less metabolically active tissues, such as the muscles [28]. The broad concentration range observed in the liver (0.18–4.43 µg/g), kidney (0.05–1.91 µg/g), muscles (0.13–1.09 µg/g), and gills (0.05–1.11 µg/g) suggests high inter-individual variability in mercury bioaccumulation. Such variation is typically attributed to differences in fish body size, age, trophic position, and dietary preferences [29,30]. Because this study measured total mercury (THg) rather than methylmercury (MeHg), the higher concentrations observed in the liver indicate greater THg accumulation in this tissue and should not be interpreted as a direct measure of MeHg accumulation. Mercury can occur in different chemical forms within fish tissues. Inorganic Hg and MeHg may have different distributions among organs. The distribution of different chemical forms of mercury among fish tissues varies depending on species, feeding habits, and trophic position [31]. Future studies, including Hg speciation analysis, will provide further insight into MeHg distribution and potential ecological and human health implications.
Figure 3.
Comparison of mercury concentration (μg/g ± SE) in fish tissues.
The muscle Hg concentrations observed in Devils Lake predatory fish species were comparable with values reported in other water ecosystems. In the present study, Hg concentrations ranged from 0.13 to 1.09 µg/g in all studied fish. Comparable Hg concentrations have been reported in predatory fish in other lake systems. Walleye from Minnesota lakes showed a median muscle Hg concentration of 0.174 µg/g, which is comparable to the median walleye muscle Hg concentration observed in Devils Lake (0.25 µg/g) [32]. In Wulungu Lake, Xinjiang, China, predatory fish perch showed measurable Hg concentrations 0.05–0.12 µg/g in the muscle, demonstrating differences in Hg accumulation among species and lake environments [21]. Similarly, a study related to human risk assessment by fish consumption in Poland reported Hg accumulation in the muscle of northern pike (0.0185–0.0255 µg/g), indicating significant variation among lake ecosystems [22]. Studies of northern pike from subarctic lakes in Canada also demonstrated variability in muscle Hg concentrations (0.16–0.69 µg/g) associated with fish characteristics and lake-specific environmental conditions [33]. Overall, the Hg concentrations measured in Devils Lake predatory fish are comparable to those reported in other freshwater lake ecosystems, although the observed values are higher than some reported studies, likely due to differences in lake characteristics, fish size, trophic structure, and environmental Hg availability. These findings highlight the importance of continued Hg monitoring for ecological assessment and fish consumption risk evaluation.
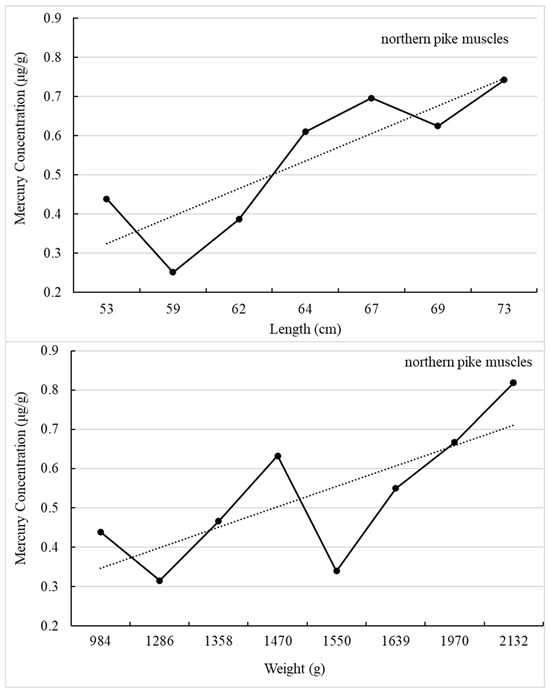
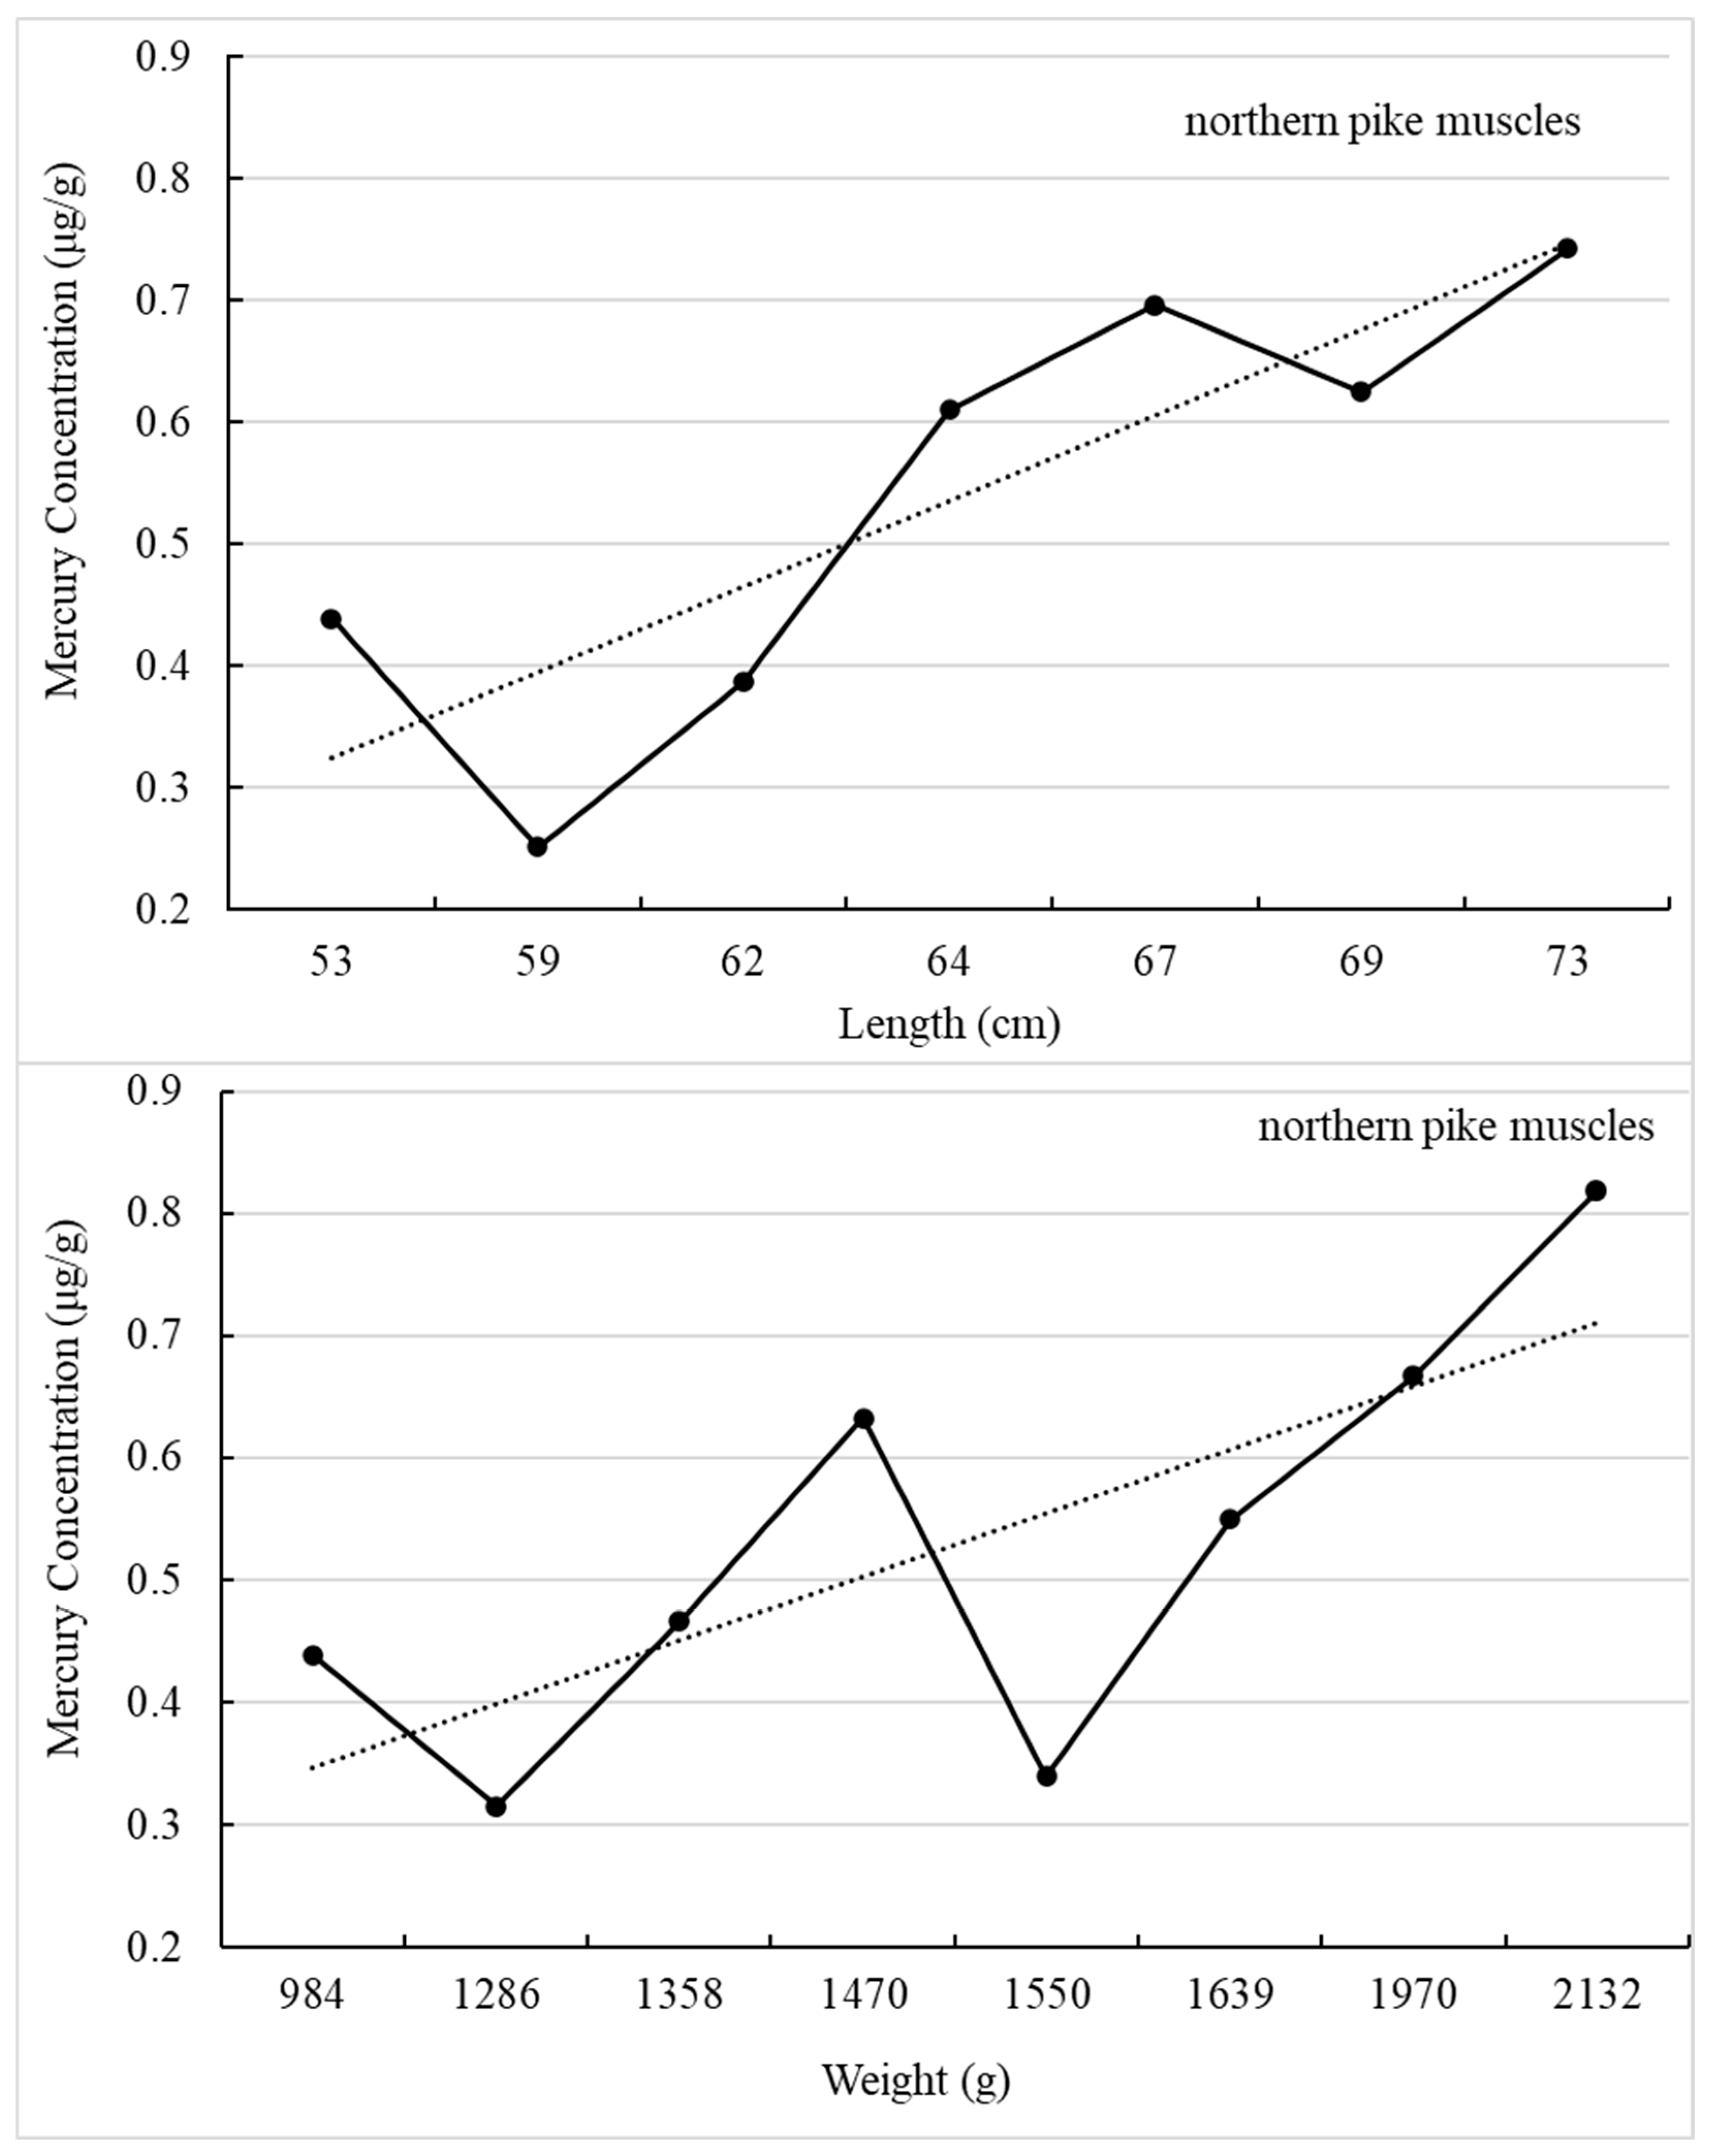
Muscle tissue plays a primary role in metabolism and overall energy balance. Understanding how muscle concentration varies with body size is important because muscle represents the main edible portion of the organism and a key source of nutrients for human consumption. In this study, we looked at the Hg concentration in the muscles with length and weight of three species. Pearson correlation analysis was performed to evaluate the relationship between fish size parameters (length and weight) and muscle Hg concentrations. The Hg concentrations in the muscle positively correlated with both length and body weight in all three species. In northern pike, the Hg concentration moderately correlated with length (r = 0.56, p < 0.05) and weakly with weight (r = 0.36, p > 0.05). In walleye, strong positive correlations were observed between mercury concentration and both length (r = 0.90, p < 0.05) and weight (r = 0.89, p < 0.05). Similarly, in white bass, the mercury levels strongly correlated with length (r = 0.92, p < 0.05) and weight (r = 0.94, p < 0.05). In general, mercury levels increase with fish size and weight. In this study, a 984 g northern pike contained 0.44 μg/g of mercury, while a 2132 g individual had 0.82 μg/g. A general increasing pattern was also observed with body length, with larger northern pike exhibiting higher mercury concentrations (Figure 4). Almost similar trends were also found for walleye and white bass, indicating that mercury accumulation increases with both size and weight across all three species. This suggests that larger and heavier individuals tend to bioaccumulate more mercury, likely due to longer exposure and their position at higher trophic levels. In addition to fish length and weight, age is an important factor influencing Hg bioaccumulation. Age determination was not conducted in the present study. Future studies incorporating age analysis along with Hg assessment will provide a more comprehensive understanding of the relationship between fish age and mercury accumulation in Devils Lake fish populations.
Figure 4.
Trend between muscle mercury levels with length and weight of northern pike.
3.3. Health Risk Assessment
Human health risk was estimated by assessing the maximum allowable daily fish consumption (CRlim), maximum allowable monthly fish meal consumption (CRmm), individual risk assessment, and the target hazard quotient (THQ). In this study, human health risk assessment was based on THg concentrations measured in fish muscle. Although MeHg was not directly analyzed, THg is commonly used as an indicator of MeHg exposure in fish muscle because MeHg generally represents the major fraction of mercury present in edible fish tissue; however, the lack of direct MeHg measurement introduces some uncertainty [34]. The values of CRlim, CRmm, and THQ for Hg are presented in Table 2. The CRlim for northern pike ranged from 0.006 to 0.037 kg/day for adults, with a mean of 0.017 kg/day, while children had lower limits, ranging from 0.001 to 0.008 kg/day, with a mean of 0.004 kg/day. Walleye showed a wider range for adults (mean value in bracket), with CRlim 0.006–0.054 (0.028) kg/day, whereas children’s CRlim ranged from 0.001 to 0.011 (0.006) kg/day. For white bass, adults had CRlim values of 0.007 to 0.036 kg/day, with a mean of 0.026 kg/day, and children had a range of 0.001 to 0.008 kg/day, with a mean of 0.005 kg/day. The monthly consumption limit (CRmm) showed an average of two, four, and three meals per month for adults for northern pike, walleye, and white bass consumption, respectively, while children’s averages were one meal per month for northern pike and white bass and two meals per month for walleye. The highest CRmm value was observed for walleye, which was seven meals per month for adults and three meals per month for children. Both the CRlim and CRmm values for adults and children differed within the studied fish species and between consumer ages. For all species, children had consistently lower CRlim and CRmm compared to adults. The North Dakota Department of Health fish consumption advisory recommends limiting larger walleye, northern pike, and white bass from Devils Lake to one meal per month, whereas smaller fish may be consumed more under the advisory [12].
Table 2.
Consumption limits (CRlim, CRmm), individual risk assessment, and target hazard quotient (THQ) of fish muscles for adults and children.
The individual risk assessment was evaluated for northern pike, walleye, and white bass consumption, which showed variation between adults and children. For northern pike, the ratio values for adults ranged from 0.86 to 4.94 with a mean of 2.36, while children revealed higher values ranging from 1.04 to 5.96, with a mean of 2.84. Similarly, walleye showed adult risk ratio values between 0.59 to 4.98 (mean 1.69), and children had a range of 0.71– 6.01 (mean 2.04). For white bass, values were noted between 0.88 to 4.85 (mean 1.56) for adults, whereas children’s values ranged from 1.06 to 5.85, averaging 1.88. When the risk ratio is equal to or exceeds one, consumers may be considered at potential risk of adverse health effects. In this study, 56% of walleye, 85% of white bass, and 93% of northern pike samples showed values higher than one for adults, while 81% of walleye and 100% of both northern pike and white bass samples were greater than one for children. These results show that a higher potential health risk is associated with the regular consumption of northern pike and white bass, followed by walleye, for both adults and children.
The target hazard quotient (THQ) values indicated varying levels of potential noncarcinogenic health risk with consumption of these fish. For northern pike, adult THQ values ranged from 0.86 to 4.94, with a mean of 2.36, while children showed higher values ranging from 1.04 to 5.96, averaging 2.84. Walleye THQ values for adults varied between 0.59 and 4.98, with a mean of 1.69, and for children, from 0.71 to 6.01, with a mean of 2.04. White bass THQ values for adults ranged from 0.88 to 4.85, averaging 1.56, whereas children’s values ranged from 1.06 to 5.85, with a mean of 1.88. In all cases, children exhibited higher THQ values compared to adults, highlighting their increased vulnerability to potential health risks from consuming these fish species. A THQ greater than one suggests a health concern for consumers. The mean THQ values for all species were higher than one for both adults and children, which indicates a risk associated with fish consumption. Among all species, children constantly experienced a higher risk than adults, suggesting greater susceptibility to health effects from the consumption of the studied fish.
4. Conclusions
In this study, we evaluated the Hg levels in different tissues of northern pike, walleye, and white bass and assessed the possible human health risks associated with their consumption. The Hg concentrations varied significantly among tissues, with the highest accumulation observed in the liver in all species. In the northern pike, the highest Hg level was found in the liver, followed by the kidney, muscles, and gills. Similarly, the Hg concentrations in walleye decreased in the following order: liver > muscles > kidney > gills. The mean Hg level in white bass decreased in the following order: liver > muscles > gills > kidney. The mean Hg concentration in northern pike muscle exceeded the European maximum permissible limit (0.5 µg/g), with approximately 50% of the samples exceeding this threshold limit, which indicates higher health risks. In contrast, the Hg levels in walleye and white bass muscle tissues largely remained below regulatory thresholds, indicating lower health risks. The mercury concentrations in the muscles positively correlated with length and body weight in all three species. In northern pike, the Hg concentration in the muscles moderately correlated with length and weakly correlated with weight. In walleye and white bass, strong positive correlations were observed between mercury concentration and both length and weight, highlighting that larger and older individuals bioaccumulate more mercury. In general, the mercury levels in the muscles were observed to increase with fish size and weight. Human health risk assessment based on CRlim, CRmm, individual risk assessment, and THQ revealed that children are more susceptible than adults. The mean THQ values for northern pike, walleye, and white bass were higher than one for both adults and children, highlighting the increased potential noncarcinogenic health risks associated with long-term consumption of these species. This study reveals significant species- and tissue-specific differences in Hg accumulation. Overall, regular consumption of northern pike and white bass poses a higher potential health risk, followed by walleye. Lastly, these findings highlight the importance of monitoring the Hg levels in commonly consumed freshwater fish to safeguard public health. Future studies incorporating temporal and spatial sampling, larger sample sizes, and age-based analysis would help improve these baseline findings and clarify the seasonal and biological factors affecting Hg accumulation in this system.
Author Contributions
Conceptualization, methodology, formal analysis, investigation, data analysis, writing—original draft preparation, M.S.; formal analysis, investigation, data analysis, data validation, writing—review and editing, Y.W.; formal analysis, investigation, A.B., A.F., C.G. and J.S.; supervision (metal analysis), data validation, writing—review and editing, D.T.P.; sampling, writing—review and editing, V.D.; conceptualization, supervision, project administration, funding acquisition, writing—review and editing, D.A.S. and S.H.G.; writing—review and editing, S.S. All authors have read and agreed to the published version of the manuscript.
Funding
The research funding to carry out this project was awarded as part of the IDeA Networks of Biomedical Research Excellence (INBRE) program (P20 GM103442) by the National Institute of General Medical Sciences.
Institutional Review Board Statement
No live vertebrate experiments were performed in this study. Fish samples consisted of post-harvest specimens obtained from local fishers operating in a recreational fishing area. Because no procedures were performed on live animals, institutional animal care and use committee approval was not required. All sample collection procedures complied with applicable local regulations and ethical guidelines. Where relevant, samples were obtained under the authority of local collection permits or agreements with the fishermen.
Data Availability Statement
Data are contained within this article. Further inquiries can be directed to the corresponding author.
Acknowledgments
This work was supported by the IDeA Networks of Biomedical Research Excellence (INBRE) program, Department of Pathology, School of Medicine and Health Sciences, University of North Dakota.
Conflicts of Interest
The authors declare no conflicts of interest.
References
- Noreen, S.; Hashmi, B.; Aja, P.M.; Atoki, A.V. Health benefits of fish and fish by-products—A nutritional and functional perspective. Front. Nutr. 2025, 12, 1564315. [Google Scholar] [CrossRef] [Scilit]
- Food and Agriculture Organization of the United Nations. Chapter 6: The Production Biology of River Fish. In River Fisheries. Available online: https://www.fao.org/4/t0537e/t0537e06.htm (accessed on 27 October 2025).
- Assan, D.; Huang, Y.; Mustapha, U.F.; Addah, M.N.; Li, G.; Chen, H. Fish feed intake, feeding behavior, and the physiological response of apelin to fasting and refeeding. Front. Endocrinol. 2021, 12, 798903. [Google Scholar] [CrossRef] [Scilit]
- Ray, S.; Vashishth, R. From water to plate: Reviewing the bioaccumulation of heavy metals in fish and unraveling human health risks in the food chain. Emerg. Contam. 2024, 10, 100358. [Google Scholar] [CrossRef] [Scilit]
- Almashhadany, D.A.; Rashid, R.F.; Altaif, K.I.; Mohammed, S.H.; Mohammed, H.I.; Al-Bader, S.M. Heavy metal (loid) bioaccumulation in fish and its implications for human health. Ital. J. Food Saf. 2024, 14, 12782. [Google Scholar] [CrossRef] [Scilit] [PubMed]
- Wu, P.; Foley, C.; Heiger-Bernays, W.; Chen, C. Chemical mixtures of mercury, PCBs, PFAS, and pesticides in freshwater fish in the US and the risks they pose for fish consumption. Environ. Res. 2025, 266, 120381. [Google Scholar] [CrossRef] [Scilit] [PubMed]
- Basu, M. Impact of Mercury and Its Toxicity on Health and Environment: A General Perspective. In Mercury Toxicity: Challenges and Solutions; Kumar, N., Ed.; Springer: Singapore, 2023; p. 95. [Google Scholar]
- Gworek, B.; Dmuchowski, W.; Baczewska-Dąbrowska, A.H. Mercury in the terrestrial environment: A review. Environ. Sci. Eur. 2020, 32, 128. [Google Scholar] [CrossRef] [Scilit]
- de Oliveira Novaes, E.; de Oliveira, A.T.; Araruna, L.T.; de Souza, J.S.; de Pinho, J.V.; de Almeida Rodrigues, P.; Vieira, I.R.S.; Conte-Junior, C.A. Mercury levels in the worldwide farmed fish: A systematic review. Biol. Trace Elem. Res. 2025, 203, 4361–4375. [Google Scholar] [PubMed]
- Felix, C.S.; Junior, J.B.P.; da Silva Junior, J.B.; Cruz, A.S.; Dantas, K.G.; Ferreira, S.L. Determination and human health risk assessment of mercury in fish samples. Talanta 2022, 247, 123557. [Google Scholar] [CrossRef] [Scilit] [PubMed]
- Saavedra, S.; Fernández-Recamales, Á.; Sayago, A.; Cervera-Barajas, A.; González-Domínguez, R.; Gonzalez-Sanz, J.D. Impact of dietary mercury intake during pregnancy on the health of neonates and children: A systematic review. Nutr. Rev. 2022, 80, 317–328. [Google Scholar] [PubMed]
- North Dakota Department of Health. A Guide to Safe Eating of Fish Caught in North Dakota. Available online: https://deq.nd.gov/publications/WQ/3_WM/FishAdvisory.pdf (accessed on 3 July 2026).
- Devils Lake, North Dakota Tourism Bureau. Devils Lake. Available online: https://www.devilslakend.com/plan-your-visit/about/history/ (accessed on 22 October 2025).
- North Dakota Tourism Division. (n.d.) Devils Lake. Available online: https://www.ndtourism.com/cities/devils-lake (accessed on 22 October 2025).
- Vandeberg, G.S.; Dixon, C.S.; Vose, B.; Fisher, M.R. Spatial assessment of water quality in the vicinity of Lake Alice National Wildlife Refuge, Upper Devils Lake Basin, North Dakota. Environ. Monit. Assess. 2015, 187, 40. [Google Scholar] [CrossRef] [Scilit] [PubMed]
- Brandt, L. The Devils Lake, North Dakota—Manitoba water trouble case: A transitional environmental problem. Gt. Plains Sociol. 2001, 13, 5. [Google Scholar]
- U.S. Environmental Protection Agency. Guidance for Assessing Chemical Contaminant Data for Use in Fish Advisories: Volume 1: Fish Sampling and Analysis, 3rd ed.; EPA 823-B-00-007; U.S. Environmental Protection Agency: Washington, DC, USA, 2000.
- Saleem, M.; Wang, Y.; Pierce, D.; Sens, D.A.; Somji, S.; Garrett, S.H. Concentration and Potential Non-Carcinogenic and Carcinogenic Health Risk Assessment of Metals in Locally Grown Vegetables. Foods 2025, 14, 2264. [Google Scholar] [CrossRef] [Scilit] [PubMed]
- Ye, X.; Lee, C.S.; Shipley, O.N.; Frisk, M.G.; Fisher, N.S. Risk assessment for seafood consumers exposed to mercury and other trace elements in fish from Long Island, New York, USA. Mar. Pollut. Bull. 2022, 176, 113442. [Google Scholar] [CrossRef] [Scilit] [PubMed]
- U.S. Environmental Protection Agency. Guidance for Assessing Chemical Contaminant Data for Use in Fish Advisories: Volume 2—Risk Assessment and Fish Consumption Limits, 3rd ed.; Office of Water: Washington, DC, USA, 2000. Available online: https://www.epa.gov/sites/default/files/2015-06/documents/volume2.pdf (accessed on 7 November 2025).
- Liu, F.; Li, M.; Lu, J.; Lai, Z.; Tong, Y.; Wang, M. Trace metals (as, Cd, Cr, Cu, Hg, Ni, Pb, Zn) and stable isotope ratios (δ13C and δ15N) in fish from wulungu lake, xinjiang, China. Int. J. Environ. Res. Public Health 2021, 18, 9007. [Google Scholar] [CrossRef] [Scilit] [PubMed]
- Chałabis-Mazurek, A.; Rechulicz, J.; Pyz-Łukasik, R. A food-safety risk assessment of mercury, lead and cadmium in fish recreationally caught from three lakes in Poland. Animals 2021, 11, 3507. [Google Scholar] [CrossRef] [Scilit] [PubMed]
- Burger, J.; Gochfeld, M. Mercury and selenium levels in 19 species of saltwater fish from New Jersey as a function of species, size, and season. Sci. Total Environ. 2011, 409, 1418–1429. [Google Scholar] [CrossRef] [Scilit] [PubMed]
- Storelli, M.M.; Stuffler, R.G.; Marcotrigiano, G.O. Total and methylmercury residues in tuna-fish from the Mediterranean sea. Food Addit. Contam. 2002, 19, 715–720. [Google Scholar] [CrossRef] [Scilit] [PubMed]
- Oros, A.; Pantea, E.D.; Ristea, E. Heavy Metal Concentrations in Wild Mussels Mytilus Galloprovincialis (Lamarck, 1819) During 2001–2023 and Potential Risks for Consumers: A Study on the Romanian Black Sea Coast. Sci 2024, 6, 45. [Google Scholar] [CrossRef] [Scilit]
- Moiseenko, T.I.; Gashkina, N.A. Distribution and bioaccumulation of heavy metals (Hg, Cd and Pb) in fish: Influence of the aquatic environment and climate. Environ. Res. Lett. 2020, 15, 115013. [Google Scholar] [CrossRef] [Scilit]
- Johnston, T.A.; Bodaly, R.A.; Latif, M.A.; Fudge, R.J.P.; Strange, N.E. Intra-and interpopulation variability in maternal transfer of mercury to eggs of walleye (Stizostedion vitreum). Aquat. Toxicol. 2001, 52, 73–85. [Google Scholar] [CrossRef] [Scilit] [PubMed]
- El-Sherif, A.A.; Shabaan, A.M.; Abdo, M.H.; Abdel Latif, A.K.M.; Goher, M.E. Water Feature and Heavy Metal Pollution Indices in Lake Qarun, Fayoum, Egypt. Egypt. J. Aquat. Biol. Fish. 2025, 29, 119–148. [Google Scholar] [CrossRef] [Scilit]
- Gribble, M.O.; Karimi, R.; Feingold, B.J.; Nyland, J.F.; O’Hara, T.M.; Gladyshev, M.I.; Chen, C.Y. Mercury, selenium and fish oils in marine food webs and implications for human health. J. Mar. Biol. Assoc. UK 2016, 96, 43–59. [Google Scholar] [PubMed]
- Cizdziel, J.; Hinners, T.; Cross, C.; Pollard, J. Distribution of mercury in the tissues of five species of freshwater fish from Lake Mead, USA. J. Environ. Monit. 2003, 5, 802–807. [Google Scholar] [CrossRef] [Scilit] [PubMed]
- Polak-Juszczak, L.; Góra, A. Organotropism of organic and inorganic mercury in fish from the Vistula Lagoon, Poland. J. Elem. 2019, 24, 589–602. [Google Scholar]
- Blinick, N.S.; Link, D.; Ahrenstorff, T.D.; Bethke, B.J.; Fleishman, A.B.; Janssen, S.E.; Krabbenhoft, D.P.; Nelson, J.K.; Rantala, H.M.; Rude, C.L.; et al. In-creased mercury concentrations in walleye and yellow perch in lakes invaded by zebra mussels. Sci. Total Environ. 2024, 957, 177515. [Google Scholar] [CrossRef] [Scilit] [PubMed]
- Moslemi-Aqdam, M.; Baker, L.F.; Baltzer, J.L.; Branfireun, B.A.; Evans, M.S.; Laird, B.D.; Low, G.; Low, M.; Swanson, H.K. Understanding among-lake variability of mercury concentrations in Northern Pike (Esox lucius): A whole-ecosystem study in subarctic lakes. Sci. Total Environ. 2022, 822, 153430. [Google Scholar] [CrossRef] [Scilit] [PubMed]
- Christian, L.D.; Burton, M.E.; Mohammed, A.; Nelson, W.; Shah, T.A.; Bertide-Josiah, L.; Yurek, H.G.; Evers, D.C. An evaluation of fish and invertebrate mercury concentrations in the Caribbean Region. Ecotoxicology 2024, 33, 397–414. [Google Scholar] [CrossRef] [Scilit] [PubMed]

Disclaimer/Publisher’s Note: The statements, opinions and data contained in all publications are solely those of the individual author(s) and contributor(s) and not of MDPI and/or the editor(s). MDPI and/or the editor(s) disclaim responsibility for any injury to people or property resulting from any ideas, methods, instructions or products referred to in the content. |
© 2026 by the authors. Licensee MDPI, Basel, Switzerland. This article is an open access article distributed under the terms and conditions of the Creative Commons Attribution (CC BY) license.