1. Introduction
Soil liquefaction represents one of the most significant seismic-induced hazards, as it can lead to loss of soil strength, ground deformation, and widespread structural damage. This natural phenomenon is relatively complex, potentially hazardous and it can generate an impact across multiple temporal and spatial scales (e.g., [
1,
2,
3,
4,
5,
6,
7]).
In the short term, it may cause (a) devastating effects on the built environment, including the failure or compromise of the structural integrity of building foundations and linear infrastructures, such as roads, power lines, natural gas pipelines, water supply and wastewater systems, as well as irrigation and land reclamation channels; (b) serious threats to artistic and cultural heritage, particularly in urban areas with high historical value; and (c) even the loss of human life.
In the medium to long term, the indirect effects of liquefaction can be equally severe. Economic losses can be substantial, arising not only from reconstruction costs, but also from the interruption of productive activities, depreciation of property values, and the reduced functionality of critical infrastructures. Furthermore, the consequences for public health and societal well-being can persist over time, through increased psychological stress among the affected population, deterioration of sanitary conditions, and the social vulnerability of communities forced to evacuate or live for extended periods in precarious conditions.
The severity of these impacts has been documented in numerous earthquake events worldwide. For instance, liquefaction associated with the 1989 Loma Prieta earthquake resulted in economic losses estimated at USD 99.2 million [
8]. During the 1995 Great Hanshin earthquake, liquefaction and lateral spreading caused extensive damage to port facilities at Kobe, leading to prolonged operational downtime and substantial business interruption costs that affected regional and international trade [
9]). Similarly, the 2001 Nisqually earthquake (USA) produced extensive ground deformation and pavement cracking at King County International Airport, resulting in repair and upgrade costs of approximately USD 4.4 million [
10]. Finally, one of the most recent examples is the Canterbury earthquake sequence (2010–2011), which generated economic losses exceeding NZD 40 billion [
11], while widespread liquefaction represented one of the principal causes of damage to residential land, housing, and lifeline infrastructure in Christchurch [
12].
For these reasons, assessing liquefaction susceptibility is a fundamental component of land-use planning and disaster risk reduction in seismically active areas. It requires the integration of geotechnical, hydrogeological, and geomorphological data, as well as a thorough understanding of the mechanisms governing soil response to seismic loading ([
13,
14,
15,
16]).
At this regard, among the most popular qualitative methods are those proposed by Youd and Perkins [
17], Wakamatsu [
18], and Wakamatsu et al. [
19]. In particular, Youd and Perkins collected information regarding earthquake-induced liquefaction case studies, such as the 1906 San Francisco, the 1954 Fallon-Stillwater, the 1964 Alaska, the 1964 Niigata, and the 1976 Guatemala earthquakes [
20,
21,
22,
23,
24], and suggested the subdivision of the investigated geological units into five classes of liquefaction susceptibility referred to as ‘non’, ‘low’, ‘moderate’, ‘high’, and ‘very high’. This subdivision was based on their age, type of prevailing shallow deposits, and depth of water table. Specifically, sediments were initially grouped as continental, coastal, and artificial deposits of Modern (<500 years), Holocene (<11 ka), Pleistocene (11 ka–2 Ma), and pre-Pleistocene (>2 Ma) ages.
Following these criteria, Youd and Perkins [
17] proposed that a saturated soil unit described as ‘recently deposited unconsolidated material of river channel, floodplain, deltaic, dune and estuarine formations, and uncompacted artificial fills’ should be characterized as ‘high’ to ‘very high’ susceptibility to liquefaction. On the other hand, talus, glacial till, residual soils, tuff, and compacted fills should be in general classified as ‘non-susceptible’ to liquefaction. Moreover, in this approach it is implied that liquefaction susceptibility is decreasing from Modern to pre-Pleistocene deposition.
Wakamatsu et al. [
19] took into consideration the ground motion intensity and the correlation between past liquefaction sites and geomorphological conditions associated with 75 earthquakes that occurred in Japan from 1885 to 1997. In particular, they considered two levels of ground motion for the classification of geomorphological features. Level-1 ground motion corresponds to crustal earthquakes, which may occur once or twice during the lifespan of an infrastructure, while level-2 is caused by subduction events and/or generally rare great earthquakes. For example, the 1964 Niigata and 1995 Hyogo-ken Nambu earthquakes were assumed to have caused level-1 and level-2 ground motions, respectively. The suggested geomorphologically based criteria were developed with reference to the criteria for an earthquake of seismic intensity V on the Japan Meteorological Agency scale (roughly equivalent to intensity VIII on the Modified Mercalli scale). In case of level-1 ground motion, the susceptibility to liquefaction of the geomorphological features is mainly classified as ‘high’, ‘low’, ‘very low’, and ‘none’, while for the level-2 scenario the most relevant classes are ‘very high’, ‘high’, ‘low’, and ‘none’. In both cases, the most susceptible zones are the ones characterized by fluvial or costal sediments, such as former river channels, former ponds, point bars, artificial deposits, beaches, and lowlands between dunes. These depositional-geomorphological features are classified as ‘highly’ susceptible to liquefaction in the former seismic scenario and as ‘very high’ in the second one.
Moreover, according to several studies focused on the geomorphological characteristics of the sites where liquefaction manifestations occurred during a seismic event [
25,
26,
27,
28,
29,
30,
31,
32,
33,
34,
35,
36], it was concluded that liquefaction phenomena are not randomly distributed over an active or recent floodplain, but are strongly dependent on the depositional history of the sediments in terms of grain size distribution as well as the depositional age and the shallow layering. The above-mentioned studies document that fine- and coarse-grained sediments of Holocene age sorted by fluvial or wave actions, such as in old/abandoned channels, point bars, and coastal settings, generally exhibit a notably higher density in liquefaction occurrences than other sectors (and hence other sedimentary conditions) of the same floodplain and/or coastal area. Consequently, the reliability of a liquefaction susceptibility map is highly dependent on the scale, density, and accuracy of the geological and geomorphological mapping as well as the available hydrogeological data.
In addition, several authors have focused on the influence of site-specific hydrogeological conditions on the assessment of soil liquefaction potential [
36,
37,
38,
39,
40,
41,
42,
43,
44]. For example, Chang et al. [
38] emphasize the importance of correctly representing this parameter in analytical models, as inappropriate assumptions may significantly distort the results. In particular, assuming a 3-m higher groundwater level relative to the real one can lead to an underestimation of the Liquefaction Potential Index (
LPI) up to 10–30%. Conversely, if the assumed level is 3 m lower than the actual depth, the
LPI may be overestimated by 5–45%. These findings highlight the need for accurate hydrogeological characterization in seismic hazard evaluations.
Cox et al. [
44] highlight the pressure changes induced by the M
w 6.2 Christchurch earthquake, observing mechanisms of groundwater transfer from deep to shallower aquifers. It is hypothesized that artesian pressures further promoted suffusion and piping along fractures, preferential flow paths, and already liquefied horizons. Following this suggestion, Dudley et al. [
37] investigated the role of the confined aquifer in the mechanism of soil liquefaction due to the 7.5 M
w earthquake in Palu (Indonesia) on 28 September 2018.
Considering the above premises, this research focuses on an area characterized by the transition from fluvial–alluvial deposits of the Po Plain to deltaic sediments. These characteristics make the study area particularly suitable for investigating the lateral variability of soil liquefaction susceptibility across transitional environments between fluvial and deltaic domains.
At the local scale, our findings may serve as an operational tool to support land management and sustainable planning strategies within the deltaic area investigated, but also in similar geomorphological-geographical settings. Consistent with the United Nations Sustainable Development Goals [
45], particularly SDG 11 and SDG 13, this study aims to contribute to disaster risk reduction and resilience-oriented land-use planning in vulnerable areas.
From a scientific standpoint, they offer valuable insights into the liquefaction behavior of complex deltaic environments potentially affected by seismic activity, thus contributing to the broader understanding of geohazard-related processes in such sensitive regions.
2. Study Area
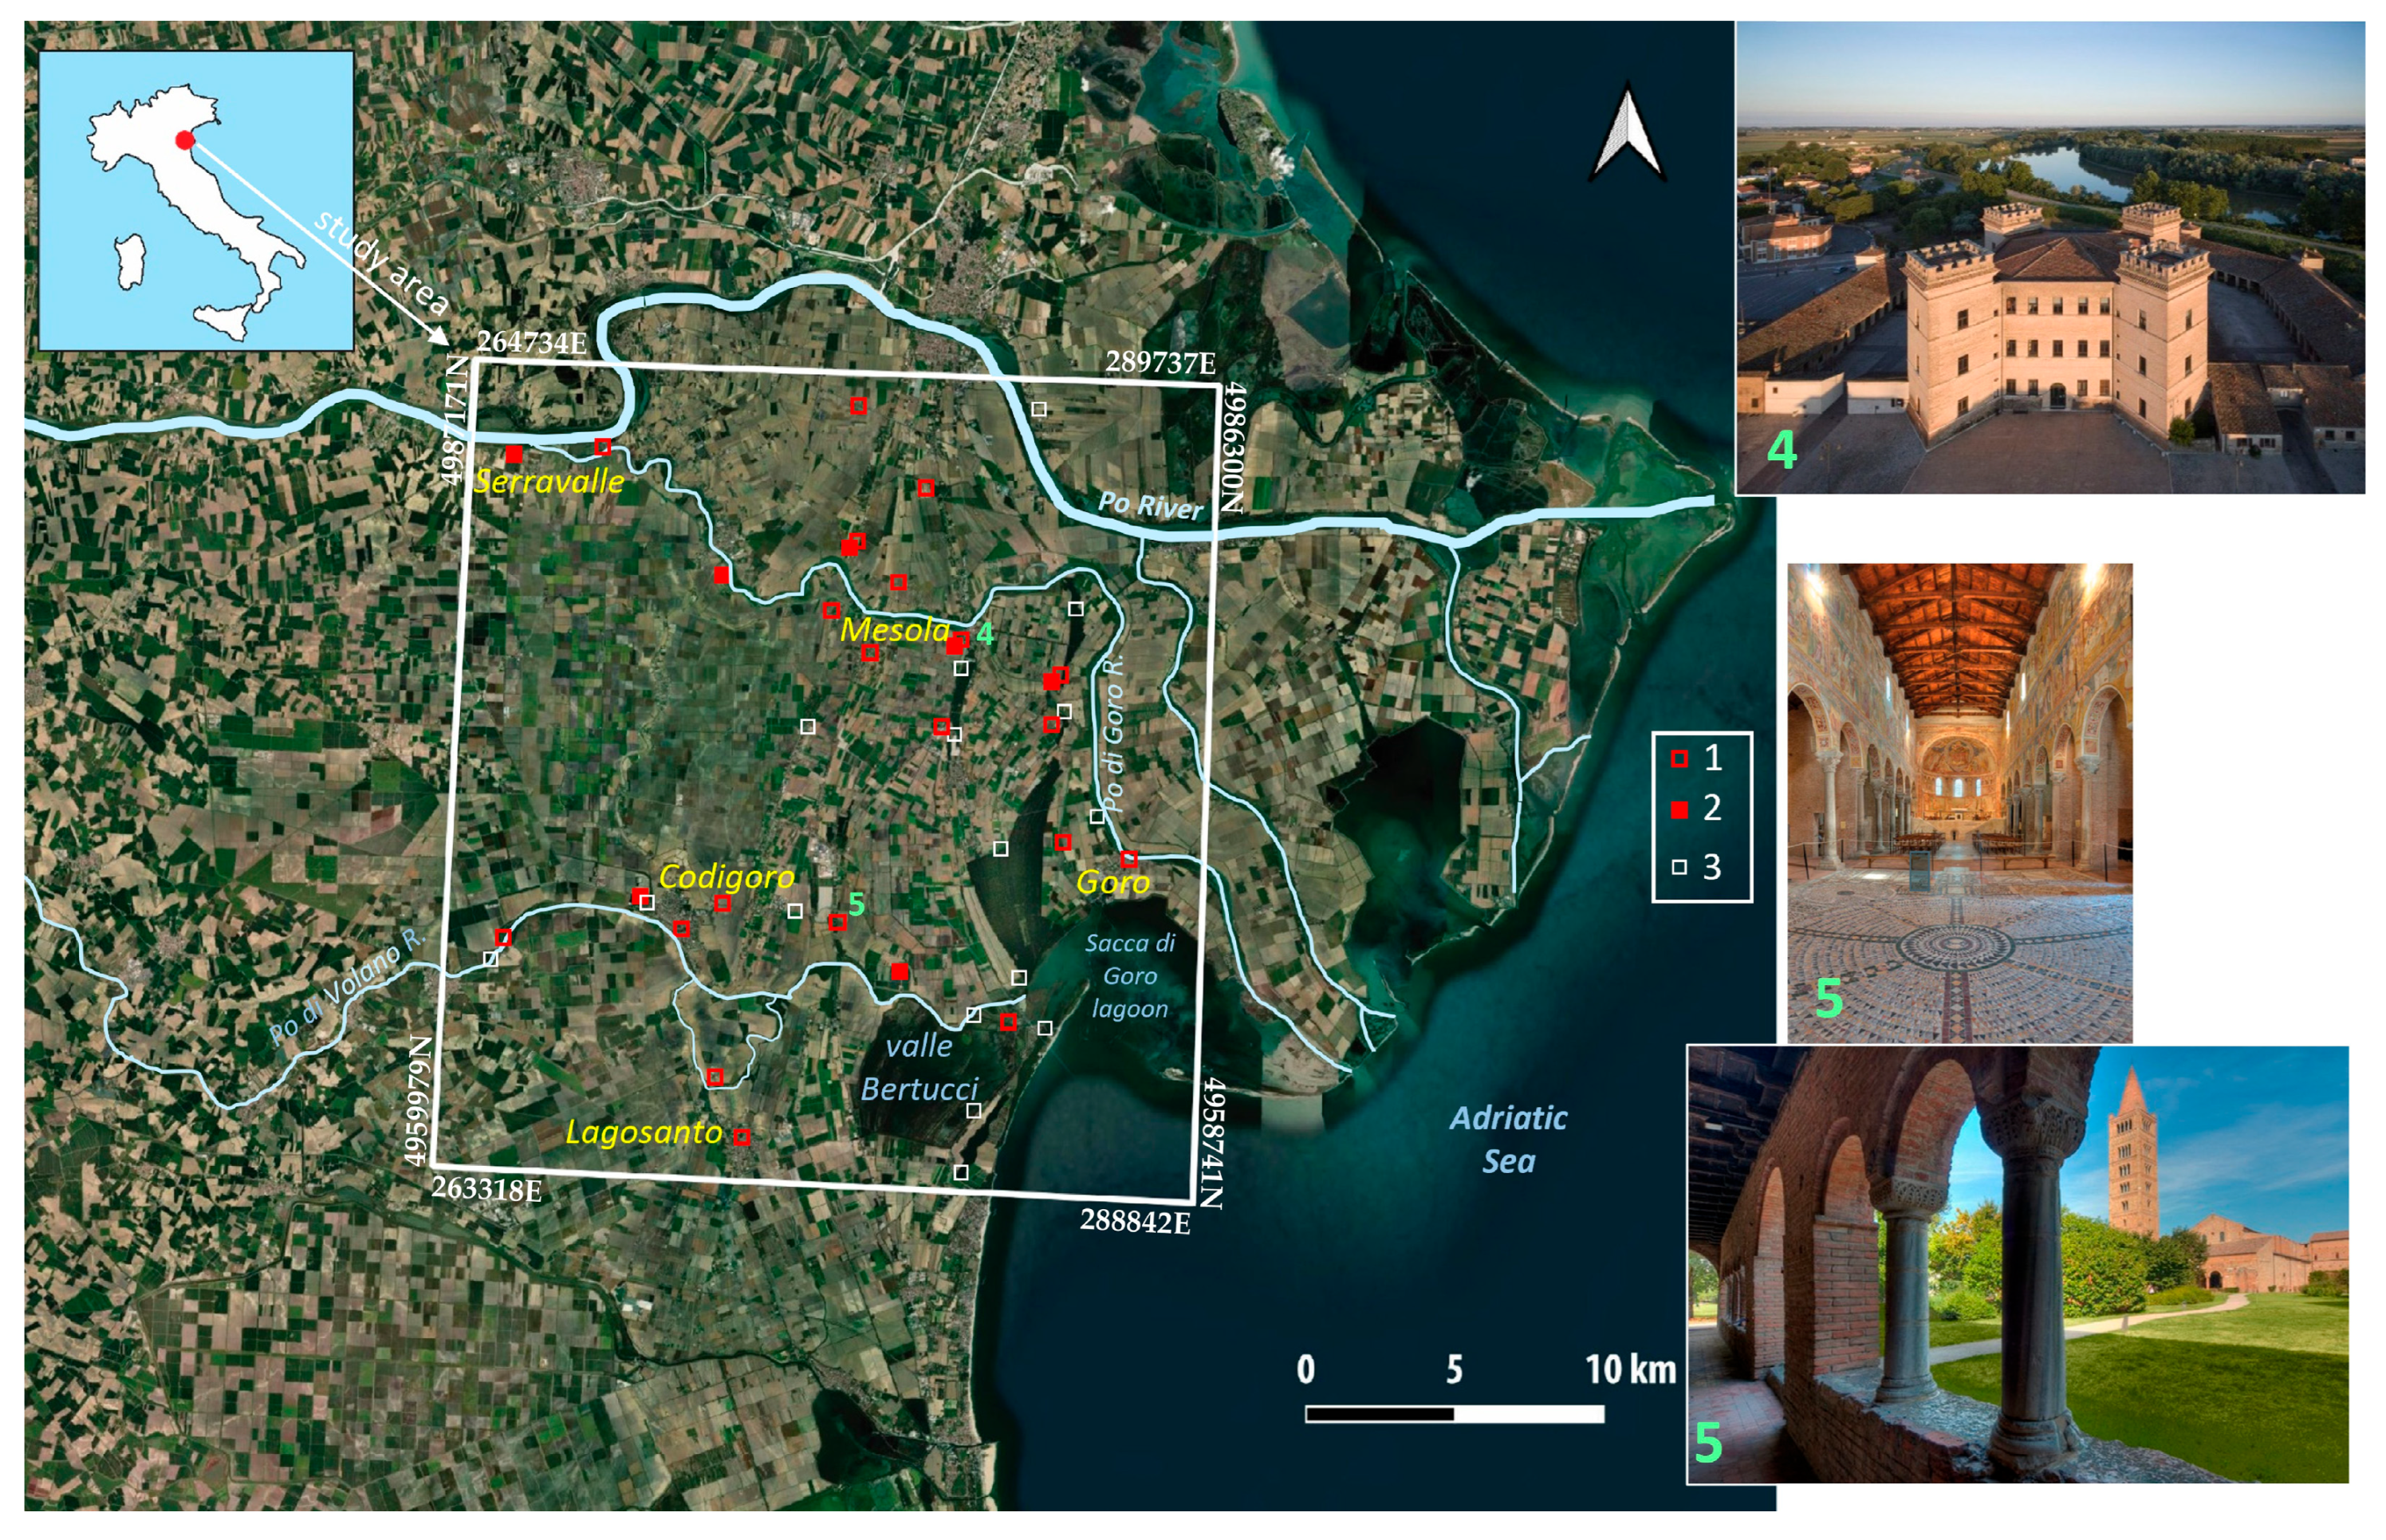
The investigated region mainly corresponds to the eastern sector of the Province of Ferrara and secondarily the Province of Rovigo (northern Italy), including part of the modern Po River Delta and covers an area of about 560 km
2 (
Figure 1).
The Po River is the most important fluvial system in Italy, with a length of approximately 650 km, draining a catchment area of about 75,000 km
2. It flows into the northern Adriatic Sea, contributing to the development and maintenance of the modern Po Delta (
Figure 1).
The territory is characterized by the dominance of intensive agricultural activities and hosts important cultural, archaeological, and natural heritage assets (e.g., the Mesola Forest—called
Bosco della Mesola, the Mesola Castle and the Pomposa Abbey;
Figure 1). Moreover, a significant portion of the territory lies below sea level (ranging from −3 to 0 m,
slm). Consequently, a dense network of reclamation canals connected to several pumping stations (known as
idrovore) has been developed to facilitate water discharge towards the Adriatic Sea. These canals perform a dual function: they serve as irrigation infrastructure during the summer months and as a drainage system for rainwater during the winter season. The presence of water has favored agricultural development; monoculture dominates (maize, sugar beet, corn, soybean, poplar), followed by horticultural and viticultural cultivation, while rice farming is practiced in some sectors.
The territory is affected by rapid subsidence and high sediment input, which have allowed for the preservation of a well-stratified record of the late Quaternary transgressive–regressive sedimentation cycles. In coastal sectors, Holocene sediment thickness can exceed 40 m. As a result, the area is characterized by complex alluvial systems, coastal dune ridges, and sandy bars, which are sometimes connected to littoral spits enclosing extensive lagoonal environments.
2.1. Geological, Geomorfological, and Hydrogeological Setting
The geological, geomorphological, and hydrogeological setting of the study area reflects the combined influence of multiple natural and anthropogenic factors. This complex system has evolved through the interplay of:
- (a)
tectonic activity, characterized by active ramp-and-flat reverse faults structurally characterizing the subsoil of the broader Po Basin and Adriatic Sea;
- (b)
alternating climate conditions during the Quaternary has strongly influenced erosion processes in the surrounding Alpine and Apennines mountain chain, therefore determining the amount and nature of the sedimentary successions within the foredeep and foreland areas, including the investigated one [
46,
47,
48];
- (c)
fluvial and deltaic processes, including recent hydrographic evolution such as channel migration and variations in sediment supply, closely linked to the late Holocene dynamics of the Po River system;
- (d)
anthropogenic modifications, encompassing extensive land reclamation, construction of river embankments, and channelization, predominantly initiated during the Early Modern period;
- (e)
subsidence phenomena, both natural (tectonic and compaction-related) and anthropogenic in origin, which have significantly contributed to the lowering of the topographic surface across various sectors of the delta plain. Between the 1950s and the early 1970s, the extraction of large quantities of methane-rich groundwater caused up to 3 m of land subsidence, with maximum land subsidence rates reaching 300 mm/a during the period 1950–1957 [
49] in the innermost part of the delta, where the main pumping centers were located.
2.1.1. Geomorphological Evolution
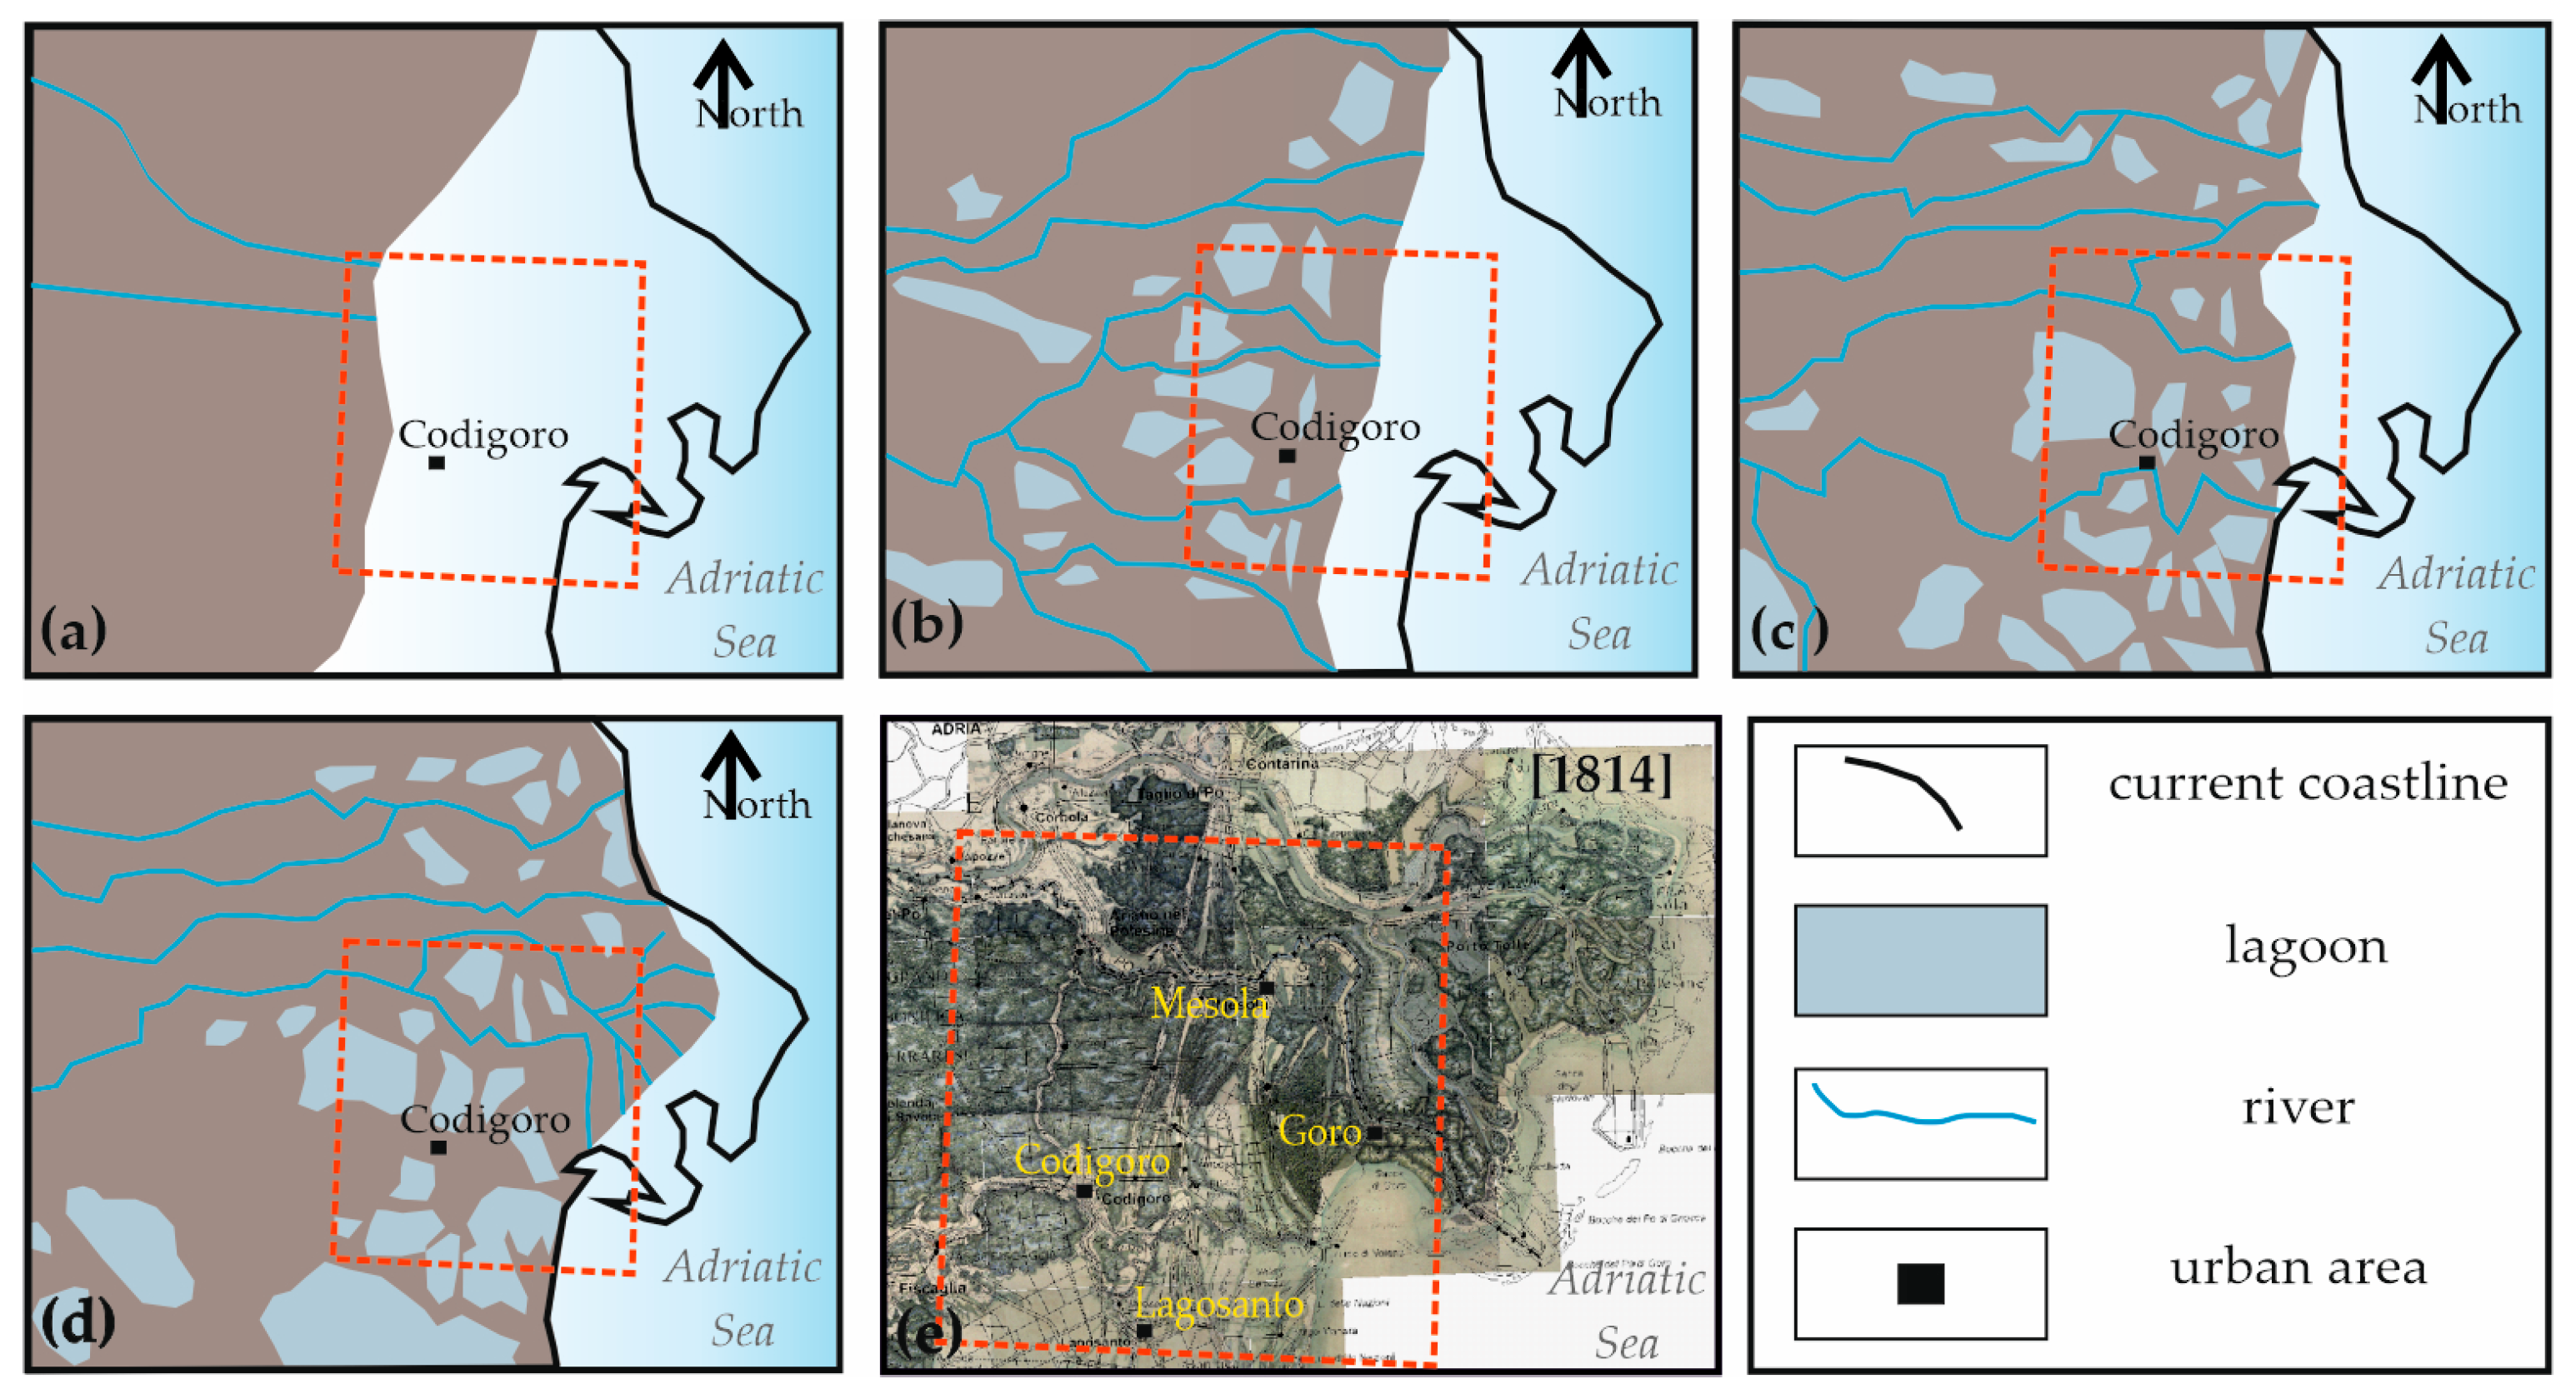
The palaeogeographic and hydrographic evolution of the Po Plain has been deeply conditioned by long-term climatic oscillations (6000 yr BP;
Figure 2) that affected the entire Mediterranean basin. In periods of increased precipitation, such as during humid climatic phases, the lower Po Plain was crossed by a dense and active fluvial network. These hydrological conditions favored the widespread deposition of alluvial sediments and the formation of coastal dune systems due to enhanced sediment supply and channels mobility. Conversely, during warm and arid climatic intervals, river discharge was significantly reduced. Simultaneously, global sea-level rise—driven by glacial melting—caused the shoreline to retreat inland, strongly altering the coastal configuration.
At the base of these fluvio–deltaic transformations lies a fundamental sedimentological and diagenetic process. Rivers tend to deposit coarse-grained sediments, such as sands and gravels, along their main channels, while finer materials (silts and clays) are distributed laterally, thus contributing to the formation and growth of natural levees. During flood events, overbank flows deposit coarser sediments near the active riverbeds, while the finer-grained fractions, suspended in floodwaters, are transported into more distal and more depressed areas. The latter zones, often corresponding to wetlands or marshes, are characterized by anoxic or poorly oxygenated conditions that favor the accumulation of organic matter and with time the formation of peat-rich deposits.
The reconstruction of the hydrographic evolution of the lower Po River over the last 3000 years has been made possible on the basis of an interdisciplinary approach, integrating historical research, archaeological findings, and geomorphological analyses [
50,
51,
52,
53,
54]. In addition, the study of historical cartography has played a fundamental role in identifying past river courses, palaeochannels, and avulsion processes.
Figure 2 illustrates one of the key phases of this hydrographic evolution, highlighting the interactions between fluvial dynamics and climatic forcing from the maximum transgression period (about 5500 BP) to about 200 BP.
Figure 2.
Hydrographical and geomorphological evolution of the Po River Delta (modified from Veggiani, [
55]): (
a) about 5500 BP, it is evident that a substantial part of the study area was previously occupied by marine environments; (
b) 2300 PB; (
c) 600 BP; (
d) 200 BP; (
e) historical map (1814; il territorio ferrarese). The solid black line represents the current coastline, whereas the brown-shaded areas correspond to the mainland. The study area is indicated by the red dashed box.
Figure 2.
Hydrographical and geomorphological evolution of the Po River Delta (modified from Veggiani, [
55]): (
a) about 5500 BP, it is evident that a substantial part of the study area was previously occupied by marine environments; (
b) 2300 PB; (
c) 600 BP; (
d) 200 BP; (
e) historical map (1814; il territorio ferrarese). The solid black line represents the current coastline, whereas the brown-shaded areas correspond to the mainland. The study area is indicated by the red dashed box.
2.1.2. Surface Geology
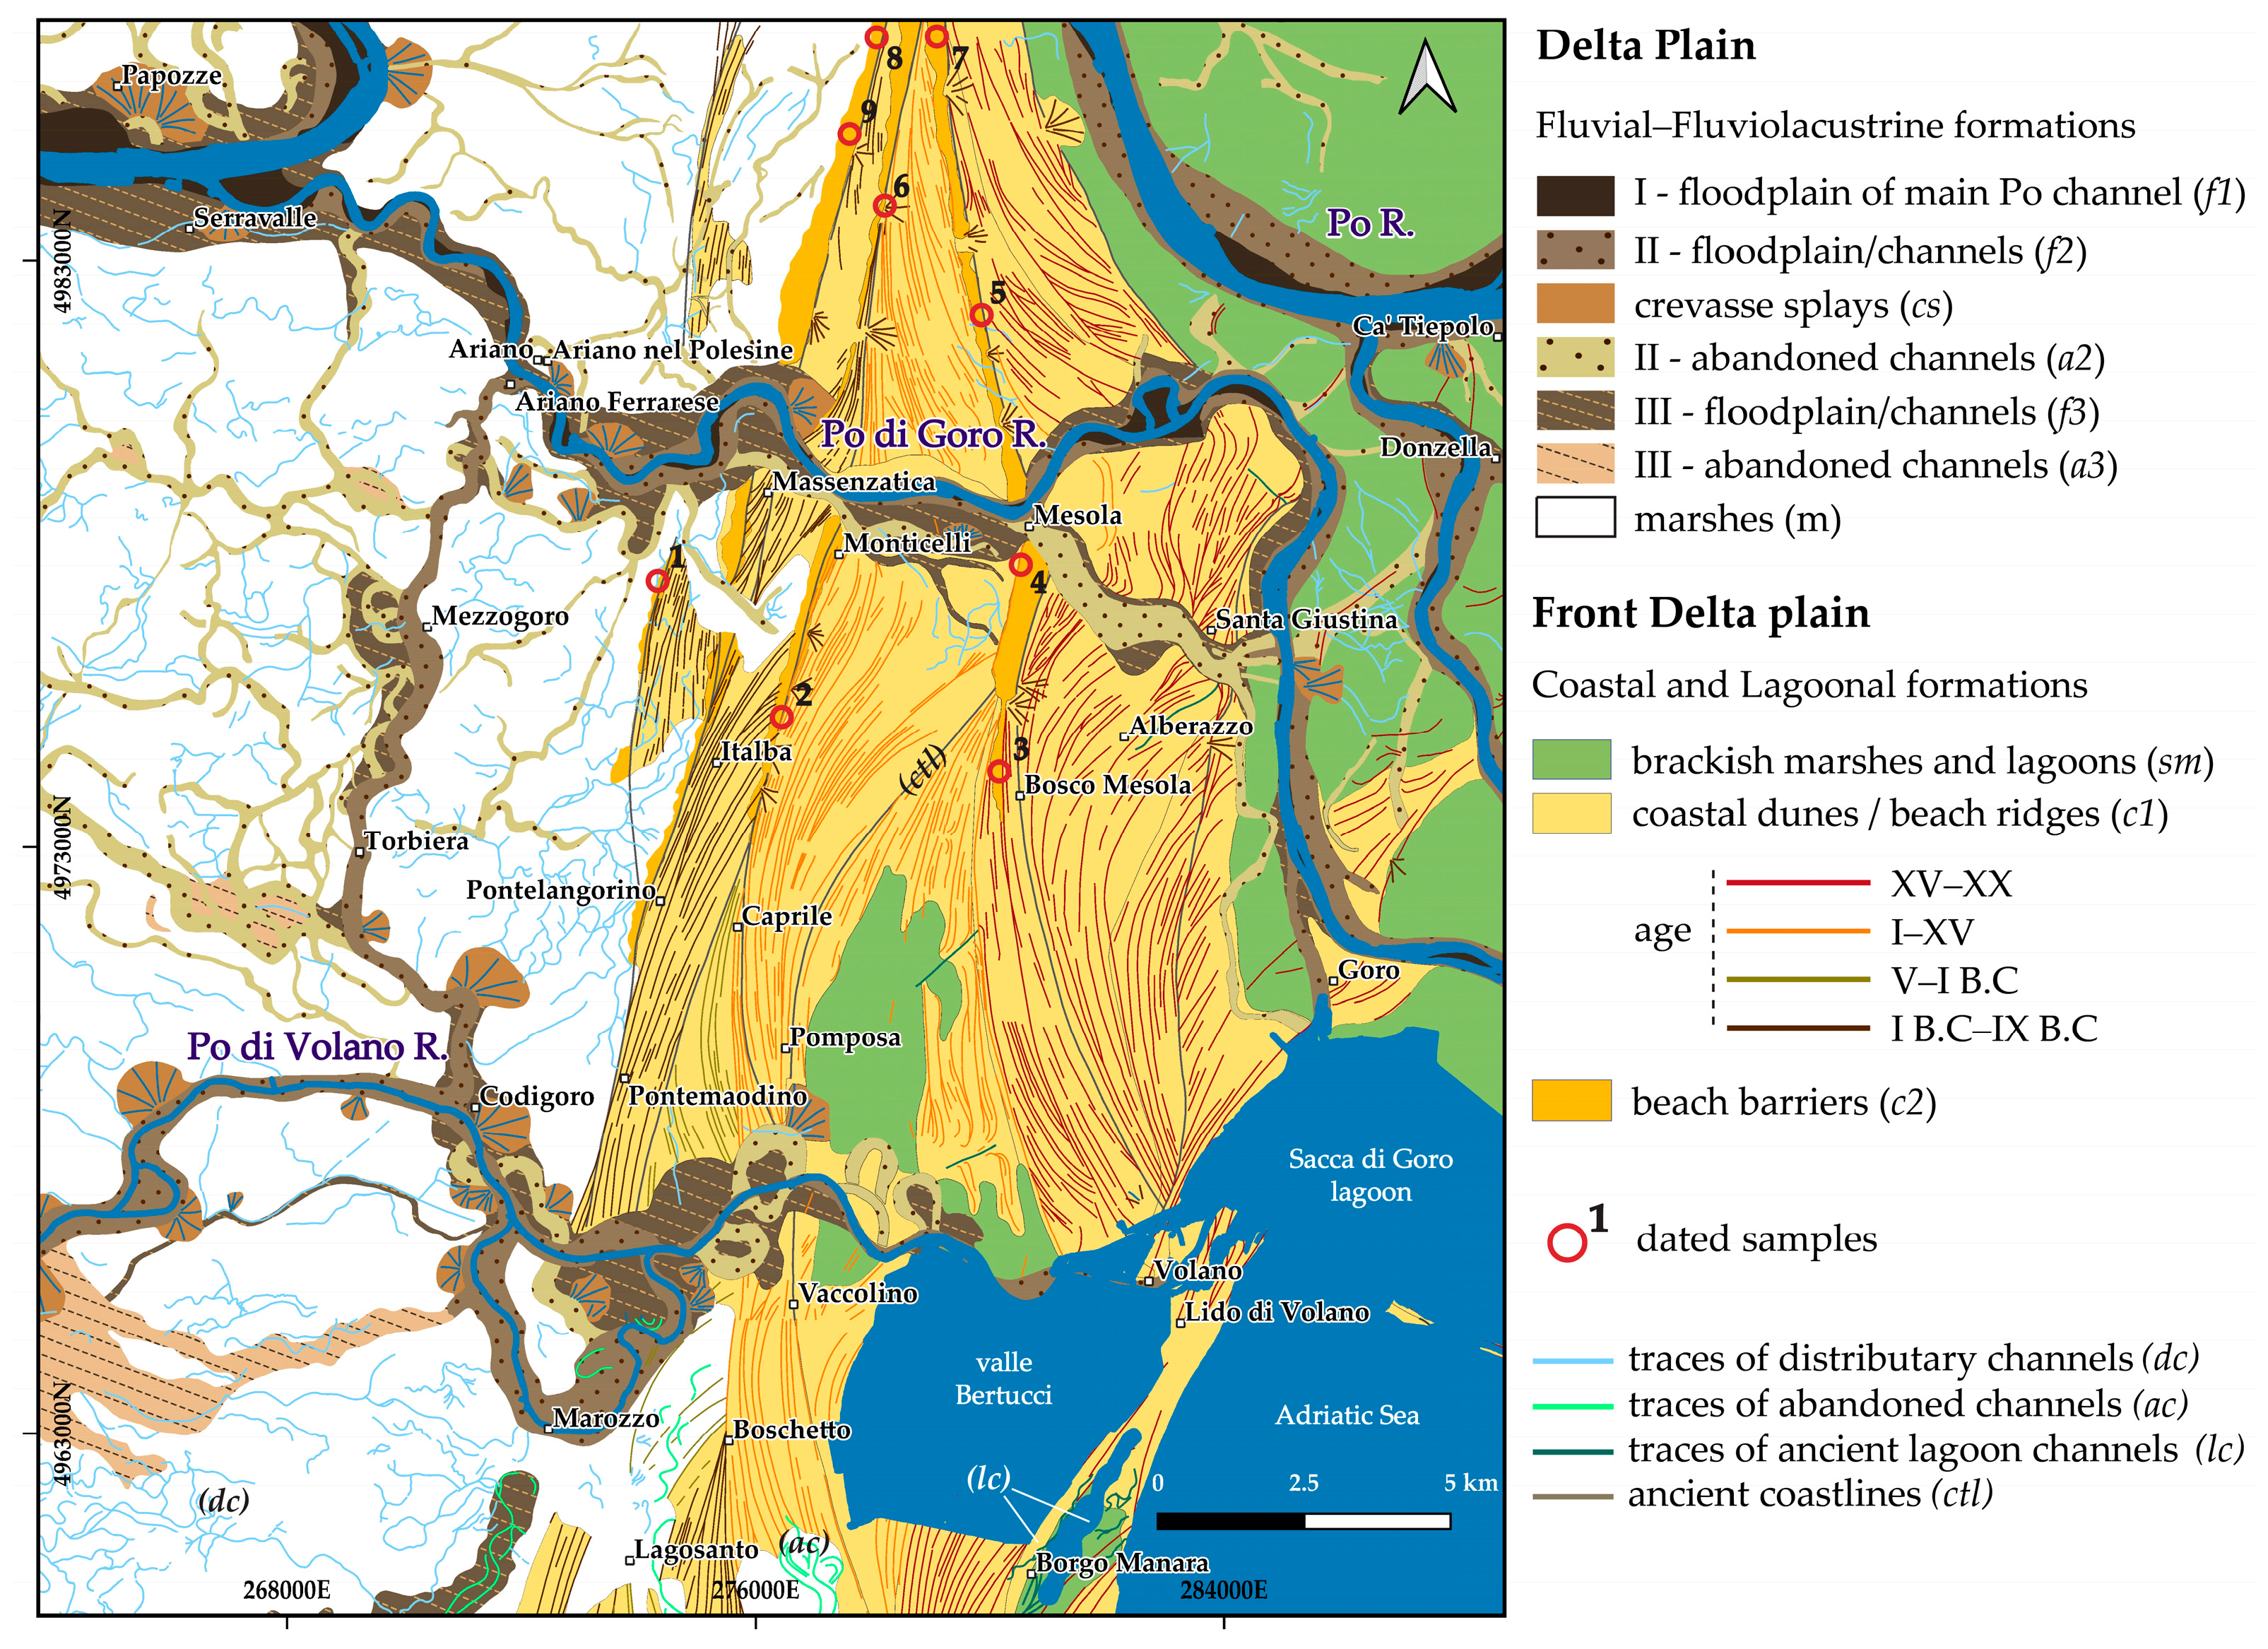
From a depositional environment standpoint (
Figure 3), the study area occupies a transitional zone between delta plain deposits (fluvial and fluviolacustrine formations) and those of the delta front and associated sandy flats (coastal and lagoonal formations).
The AES8 unit is composed of clays, silts, and sands of deltaic and marine origin. Its thickness ranges from approximately 20 m in the western sector to about 40 m in the eastern sector. These deposits are Holocene and were accumulated from around 10,000 years B.P. to the present. In the western sector, marsh deposits (m unit) prevail covering depressed inter-distributive areas between mainly suspended river channels with their natural levees (f1 and f2 units) and crevasse splay (cs unit) bodies. These marshy areas, generally with an altitude of some meters below sea level, have been drained by extensive hydraulic reclamation activities carried out in several steps during the last centuries. In these reclaimed lands mainly clays and silty clays presently crop out with alternating thin silty levels; they are often rich in organic material, locally fading into peaty clays and peats. Scattered bioclasts of continental Molluscs and abundant woody fragments are also present. Internal depositional features and layering are frequently obliterated by intense bioturbation, while a dense plane-parallel lamination or thin sandy-silt layers graded by distal fluvial overflow processes could be locally preserved. Further sedimentary aggradation was completely halted by hydraulic reclamation works. At present, these deposits cover a cumulative surface of ca. 225 km2, representing the 33% of the investigated area. Thickness of the formation locally reaches 15 m.
The Modena Unit (AES8a) represents the uppermost and most recent portion of the AES8 succession, consisting of deltaic clays, silts, and sands. Its basal boundary is defined to the east by an ancient, distinct, and predominantly erosional shoreline, and to the west by the transition between alluvial plain and deltaic deposits.
The unit is defined as post-Roman and has been identified based on the hydrographic reorganization, the enhanced sedimentation rates, and changes in archaeological signatures associated with the collapse of the Roman Empire. In its eastern sector, it includes delta-front and beach deposits, some of which are still undergoing active depositional processes. The thickness of this unit varies between 0 and 25 m, and its age ranges from approximately 1500 years B.P. to the Present.
Towards the east, the fine-grained deposits, associated with dominant marshy conditions environments, are progressively overlain by coastal dune and beach ridge deposits (c1 unit). The latter deposits consist of medium- to fine-grain sands, rich in bioclasts and wave structures, organized in thin- to medium-thickness layers frequently amalgamated. Faunas include Molluscs and Foraminifera commonly concentrated in storm deposits. Based on the observed sedimentary features and the faunal associations, it is possible to recognize lateral and vertical facies changes and hence distinguish between offshore and more internal settings.
External delta sediments consist of land of coastal dunes and beach ridges (c1 unit), beach barriers (c2 unit) and interposed brackish marshes, and lagoon depositional environments (sm unit). The central–eastern sector of the investigated area is characterized by coastal plain sands. They record several delta lobe generations, with outcropping littoral sediments that often preserve their primary morphology. These sands are locally interfingering with the deposits associated with the terminal section of several distributary channels intersecting the area.
These coastal deposits are locally associated with elongated beach barriers (c2 unit) running parallel to the beach ridges. These beach barriers consist of very well sorted fine sands lacking bioclasts (except from sporadic pulmonated Gastropods). Coastal dune and beach ridges cover a surface of 171.6 km2 corresponding to the 27.6% of the investigated area, while the outcropping beach barriers only 10 km2 (1.6%). For the purpose of this note, these sedimentological details will not be discussed further.
Moreover, the eastern and northeastern sectors are covered by the brackish marshes and lagoons deposits (sm unit) associated with the current Po River delta, while smaller courses of limited width were classified as traces of ancient lagoon channels. These units (67.4 km2) consist of clays, silty clays, and clayey silts, often enriched in organic substances and with subordinate intercalations of sandy-silty layers graded by distributary channel routes. Most of these environments are still subject to active sedimentary dynamics. These fine sediments form bodies on coastal sands up to a few meters thick in the southeastern part of the area, while in the northeastern sector similar sediments form much thicker and more extensive bodies with a base on pro-delta muds.
2.1.3. Hydrogeology of the Area
From a hydrogeological point of view, the following aquifer systems can be identified (Rapti-Caputo and Martinelli, 2009 [
57]; Marrocchino et al., 2010 [
58]; Rapti and Martinelli, 2025 [
59]):
- (a)
In the central–eastern sector, a shallow phreatic (unconfined) aquifer system is hosted within sandy coastal–deltaic bodies of the delta-front plain, including dune ridges, beach ridges, and beach–barrier complexes (
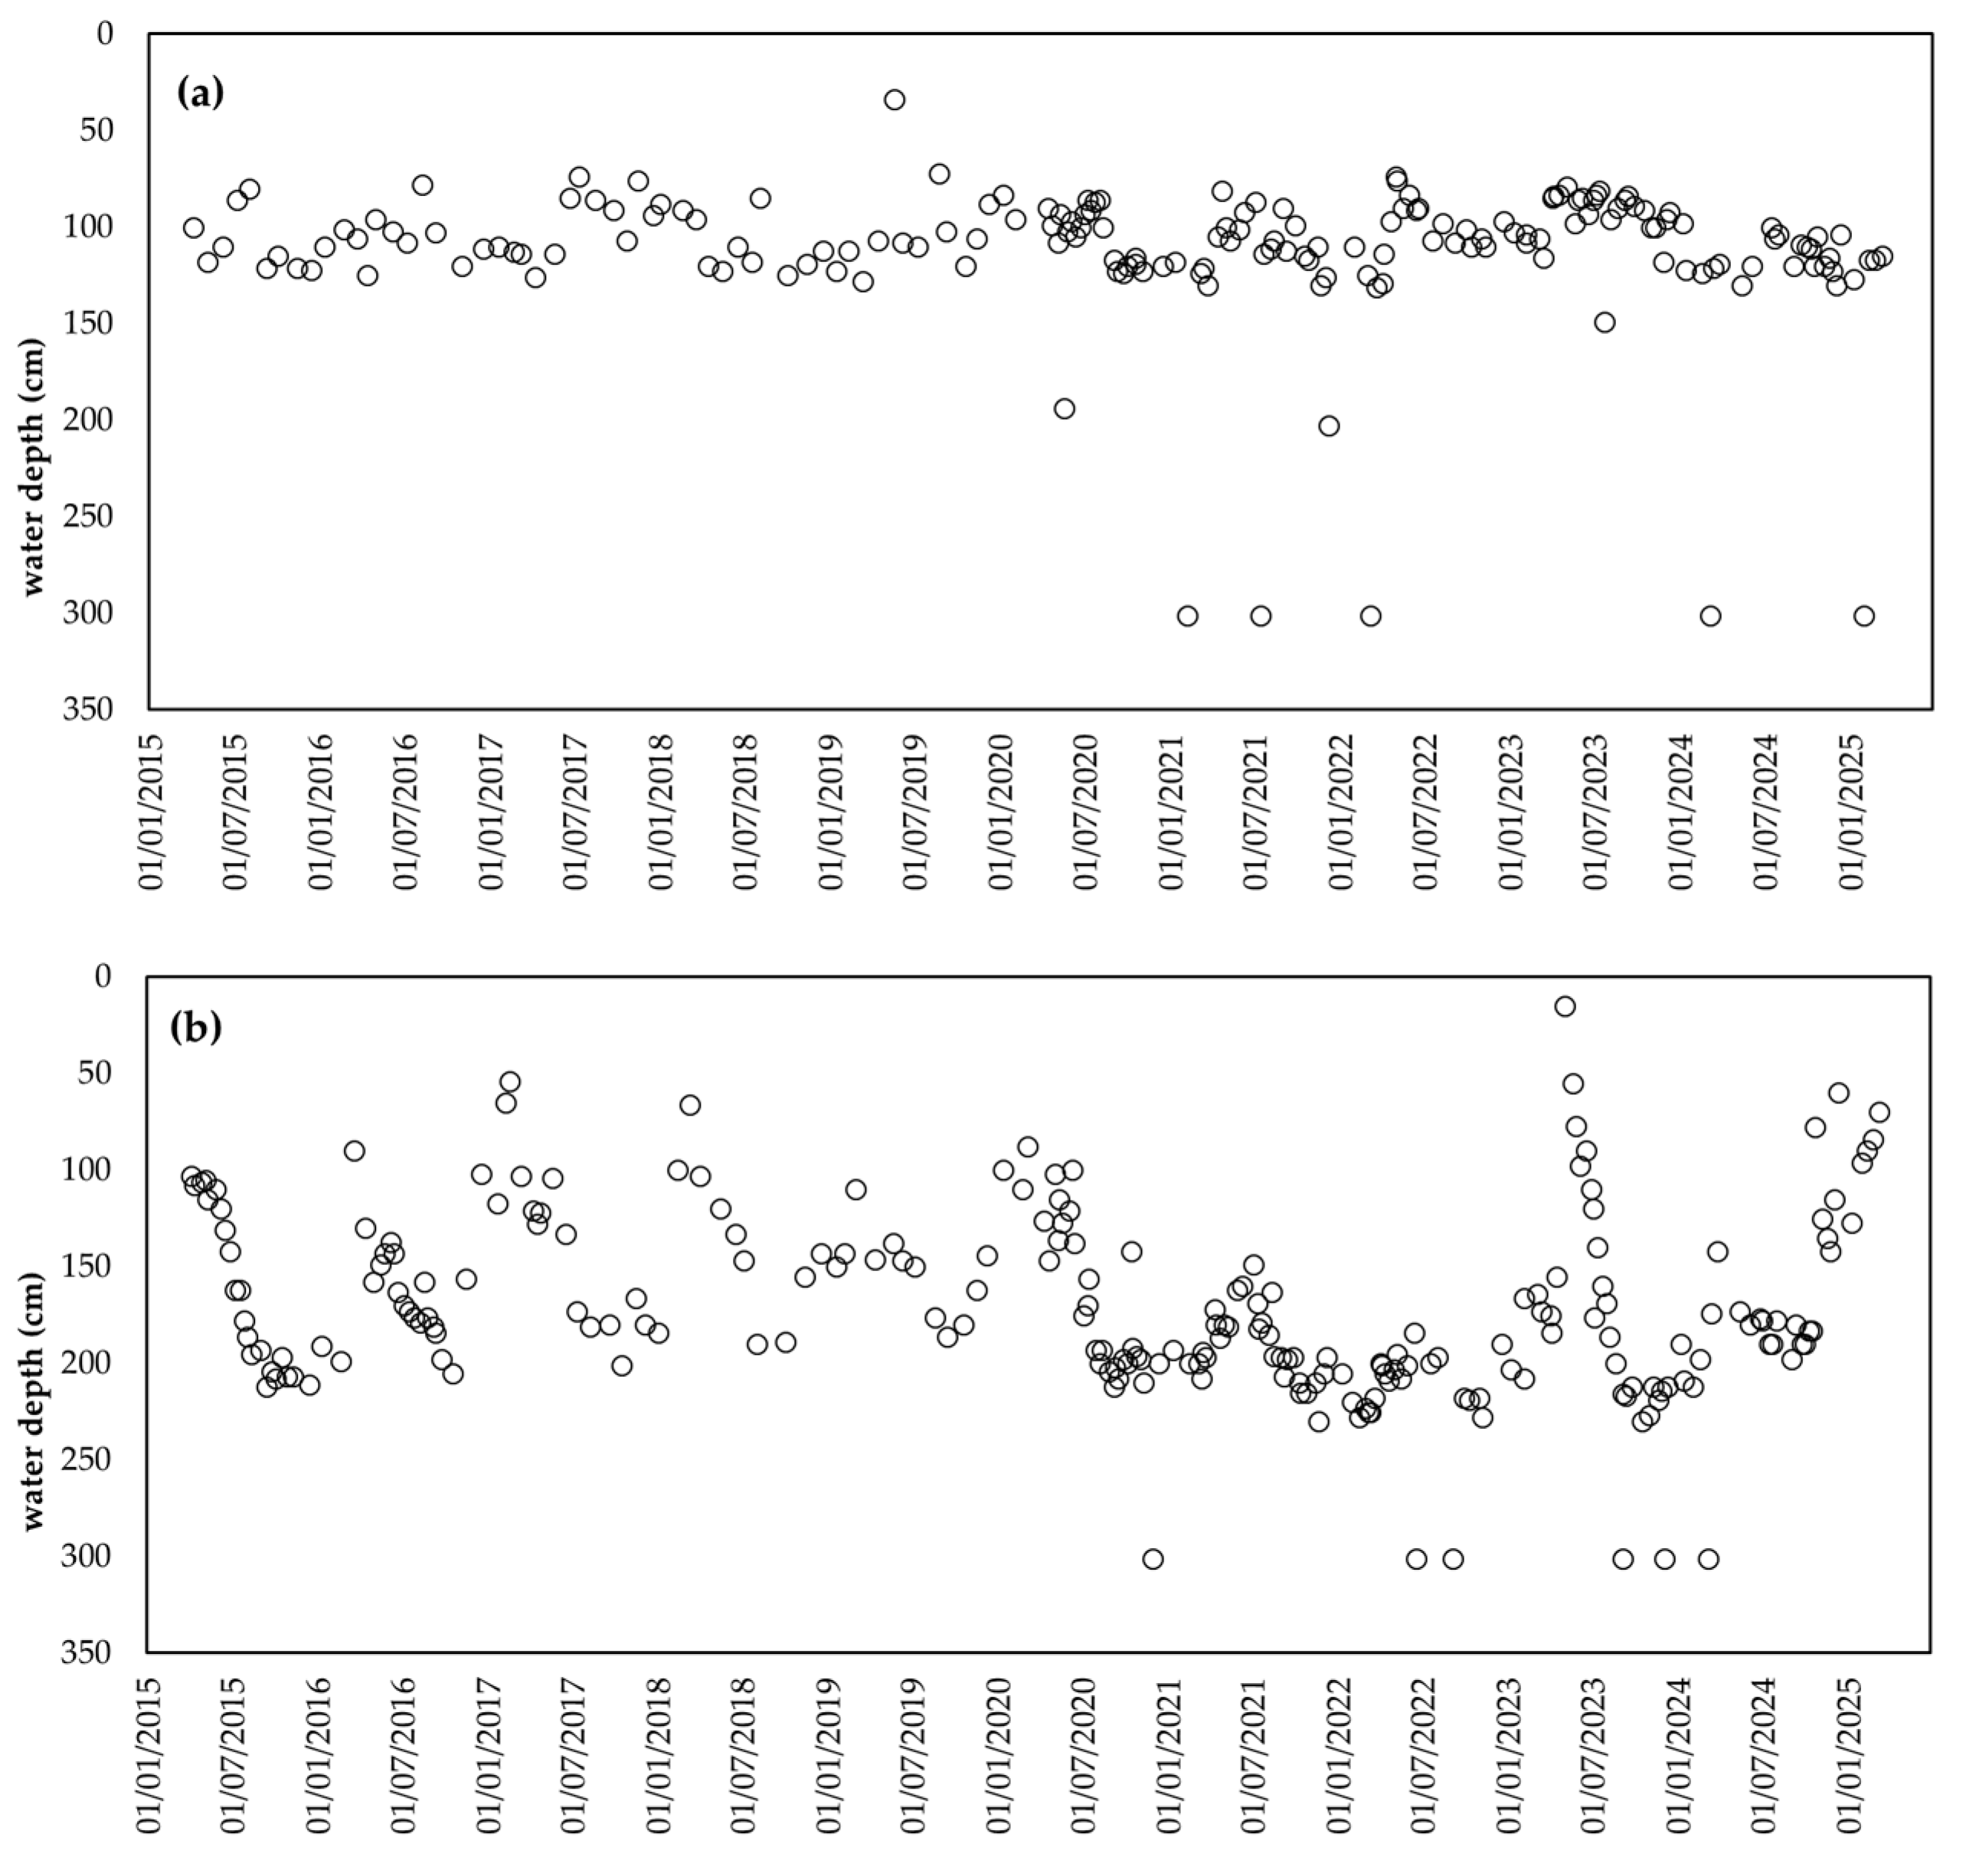
Figure 3). This aquifer exhibits pronounced lateral and vertical heterogeneities due to facies variability typical of these depositional environments. It is characterized by relatively high hydraulic conductivity and a thickness ranging from a few meters up to approximately 20 m, depending on local stratigraphic conditions. Recharge is primarily controlled by direct meteoric infiltration, while secondary contributions derive from hydraulic interaction with irrigation canals and adjacent surface water courses. Water depth data indicate that the water table undergoes seasonal to interannual fluctuations generally ranging from 75 to 125 cm (88% of the data) below ground level with rare exceptions where the level reaches 300 cm (
Figure 4a). Specifically, 10% of the data show a water depth exceeding 125 cm, whereas in 2% of the cases it is below 75 cm.
- (b)
Within the alluvial plain and lagoon deposits, dominating the western sector but also present in the eastern part of the study area (
Figure 3), small unconfined or semi-confined aquifers develop, which may be hydraulically interconnected. These aquifers consist of sandy or sandy-silty materials with local intercalations of peaty layers. Their thickness is a few meters and they have low productivity. In general, the water depth exhibits both annual and multi-year fluctuations, ranging from 15 to 300 cm from the ground surface (
Figure 4b). In particular, 31% of the analyzed sites exhibit a water depth ranging from 0.5 to 150 cm, whereas 65% fall within the 150–300 cm range.
The observed piezometric conditions reflect the integrated response of several local controlling factors, including: (a) the hydrostratigraphic architecture and hydraulic properties of the aquifer systems; (b) groundwater recharge conditions—particularly in areas close to the dense irrigation channel network, where groundwater depth is strongly controlled by channel water levels; and (c) groundwater abstraction rate, which may locally and temporarily alter piezometric level conditions. Accordingly, the distributions presented in
Figure 4 should be interpreted as a regional representation of the hydrodynamic behavior of the study area and not as a probabilistic characterization directly attributable to the individual depositional units adopted in the Liquefaction Potential Index assessment. The influence of water depth fluctuations on liquefaction susceptibility will be examined in
Section 4.
3. Materials and Methods
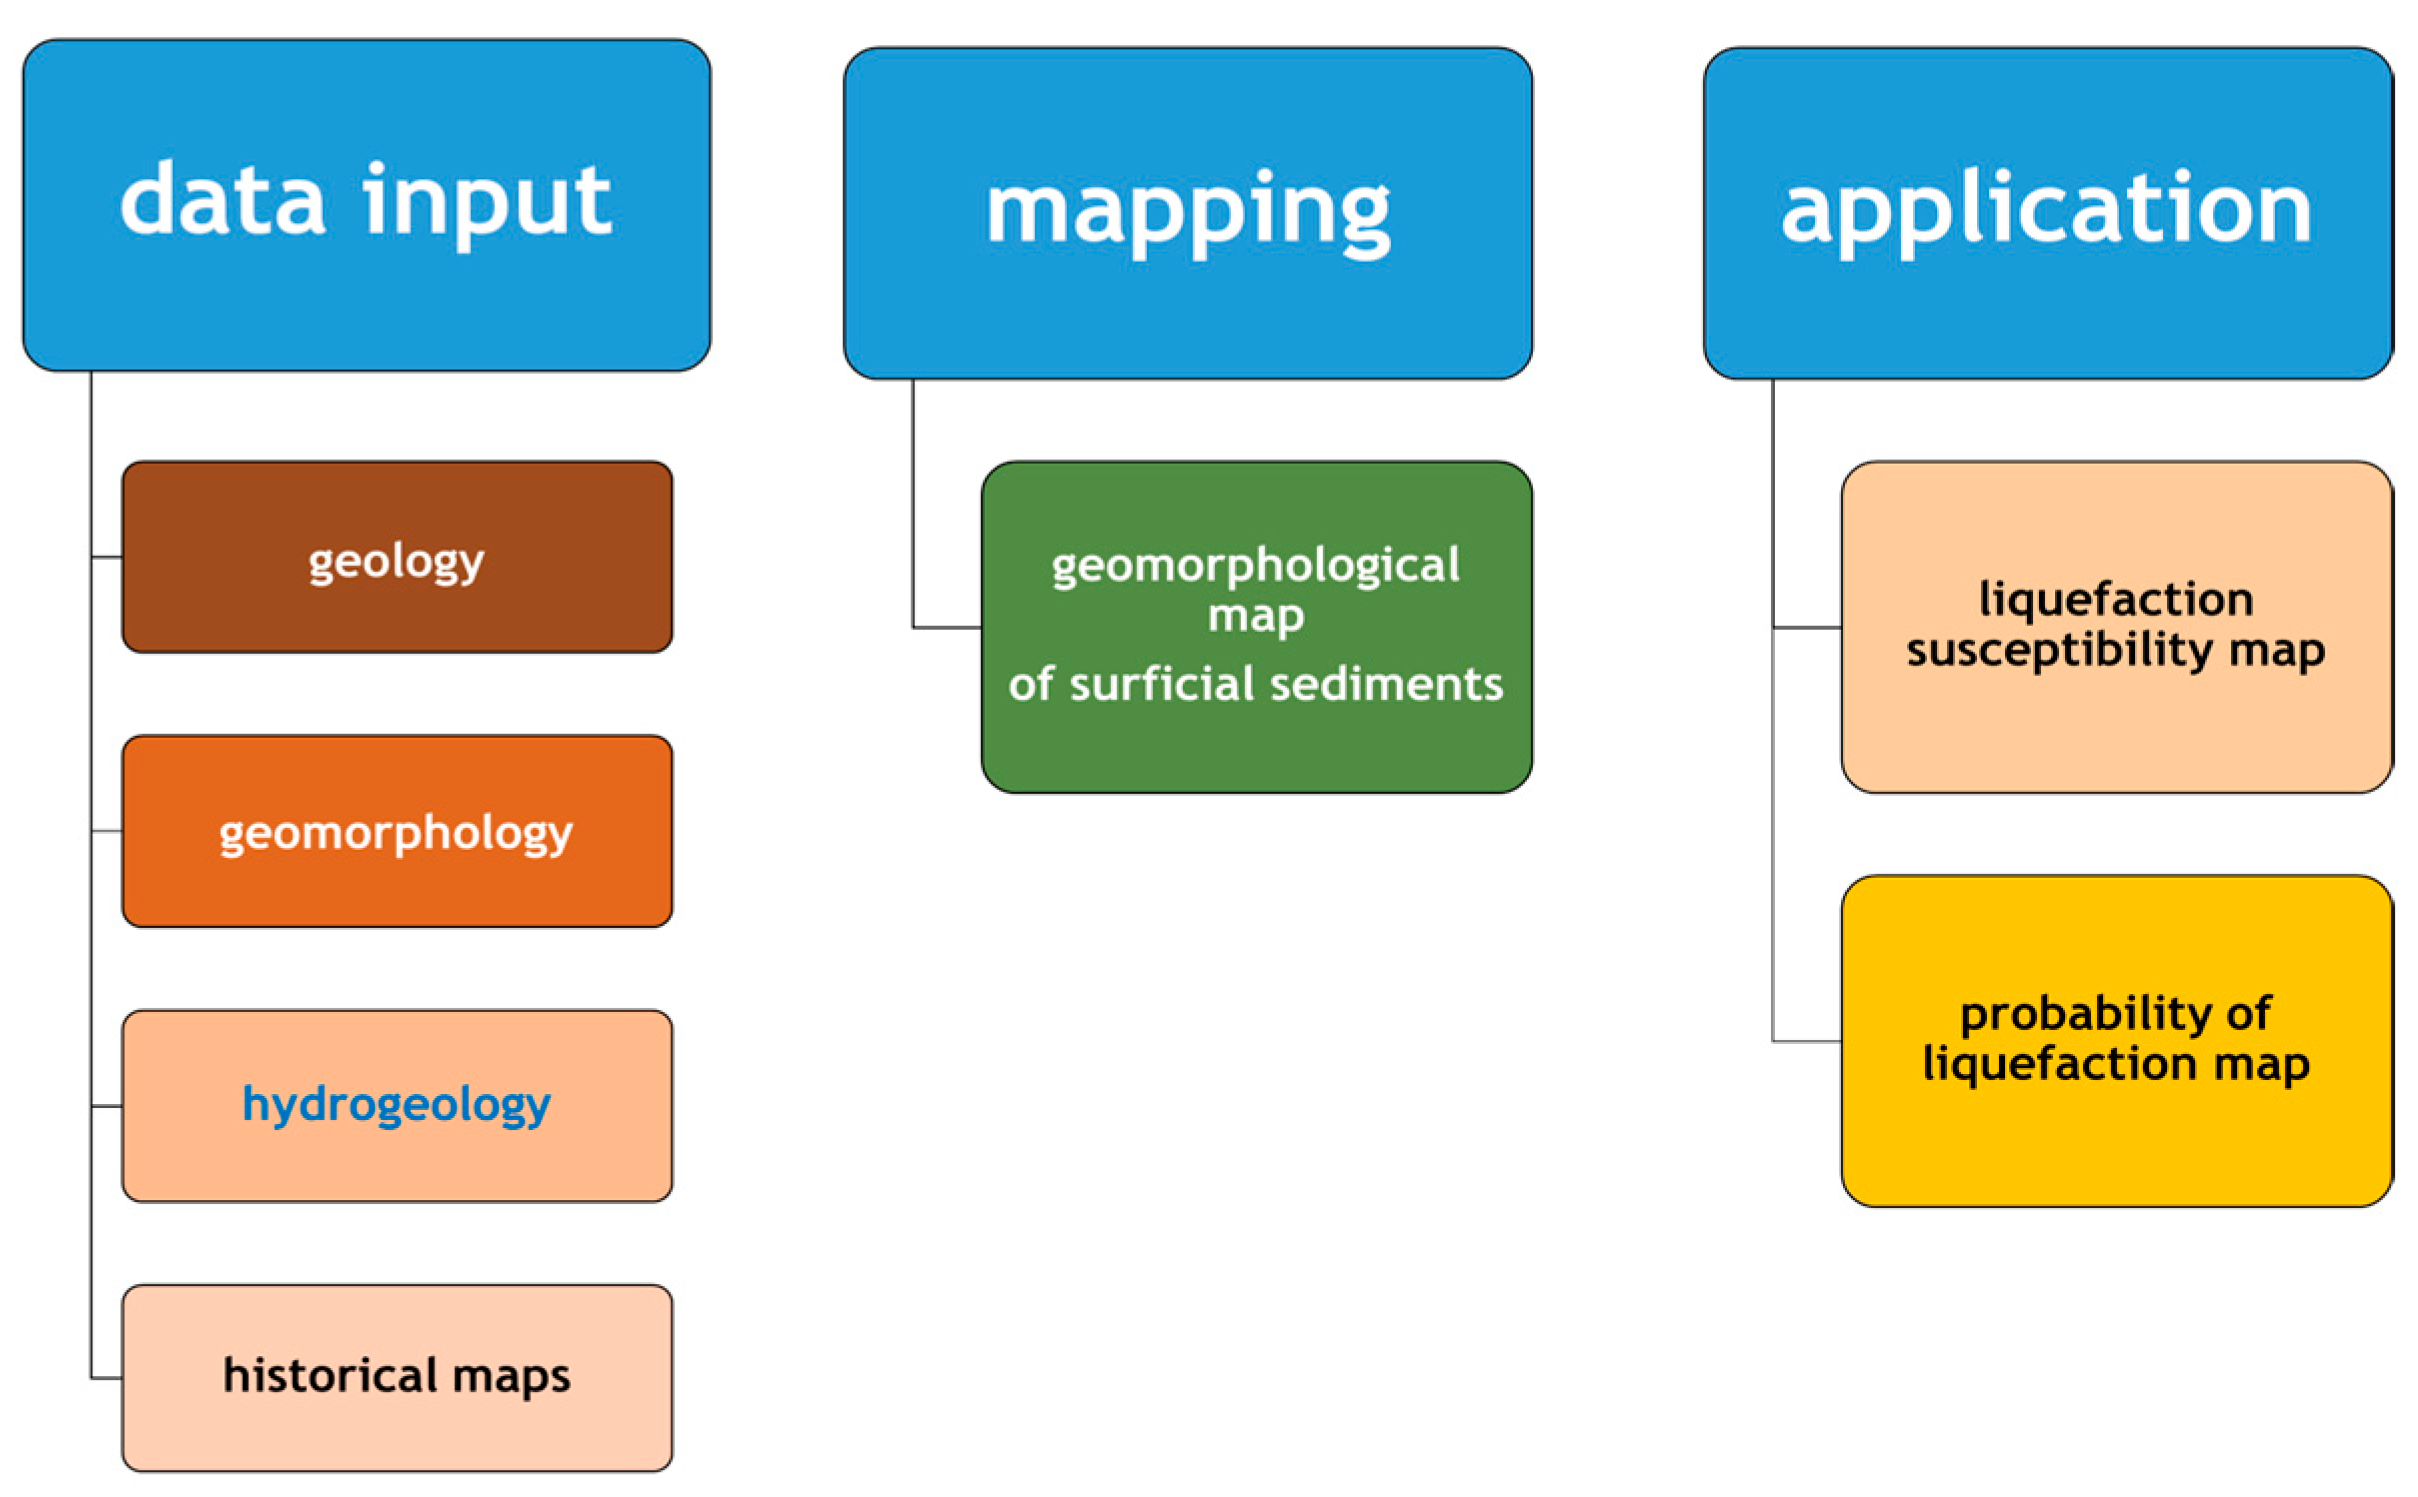
To achieve the objective of this research, the methodological flowchart illustrated in
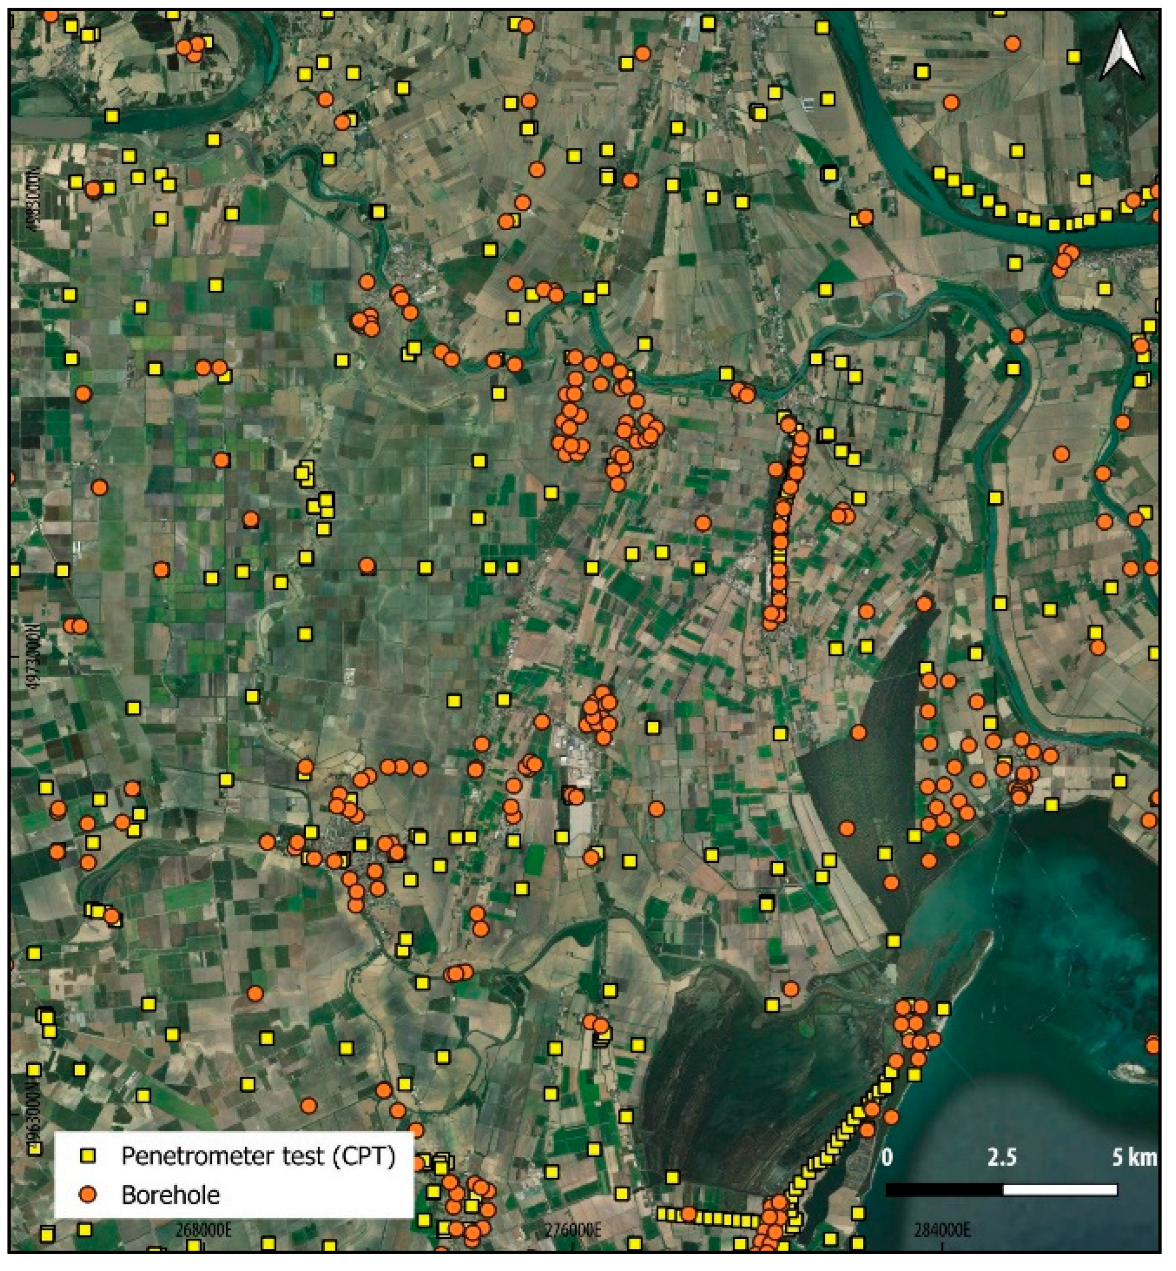
Figure 5 was adopted. It is structured into three main phases. The first phase involves the collection and critical analysis of geological, geomorphological, hydrogeological data, as well as historical cartography. The definition of the geomorphological features of the depositional systems and the associated surface lithology was mainly based on the Geological Map of Italy at a 1:50,000 scale, Codigoro sheet no. 187 [
56], integrated with other sedimentological data (e.g., [
60]), data from geognostic investigations (11 boreholes and 144 penetrometer tests;
Figure 6), and laboratory analyses (grain-size analyses).
The second phase concerns the elaboration and spatial distribution of the main parameters of interest. The third phase consists in the development of soil liquefaction susceptibility and probability maps, based on the integration of the previously analyzed data.
In this section, we present the principal methods applied in this paper to achieve the intermediate steps and then the final results for reaching the major goals of the research. In particular, we will (i) describe how to obtain a susceptibility map from the geological map of the shallow lithologies and the shallow hydrogeological conditions; (ii) how to estimate the maximum expected peak ground acceleration that could affect these sedimentary units assuming a worst-case (i.e., conservative) seismic scenario; and from these, (iii) how to estimate the probability of liquefaction across the entire investigated area. Finally, considering Cone Penetration Tests with pore pressure measurements (CPTu), we will investigate the correlation between the obtained liquefaction susceptibility classification of sediments with the values of liquefaction potential derived from in situ tests. Following the description of the methodological approaches at each step is also presented.
3.1. From Lithology to Susceptibility
The classification proposed by Youd and Perkins [
17] has been applied to a sector of the Po delta plain, for examining the likelihood of geological units to liquefaction. According to the criteria proposed by the authors, the deposited materials of the floodplain/channels (
f1,
f2,
f3) and crevasse splays (
cs) have been grouped as ‘floodplain deposits’. Abandoned channels (
a2,
a3) and their associated traces have been also classified as ‘river channels’. Moreover, marsh deposits (
m) founded in inter-distributive areas were classified as alluvial plain, while front delta deposits of brackish marshes, lagoons (
sm), and traces of lagoon channels were categorized as lagoonal deposits. Finally, formations of coastal dunes/beach ridges (
c1) and beach barriers (
c2) have been included in dune and estuarine deposits, respectively.
As it concerns the age of the sediments, Youd and Perkins [
17] classify the units in the categories of (a) <500 years, (b) Holocene, (c) Pleistocene, and (d) pre-Pleistocene. In our case, the whole study region is covered by Holocene deposits, with the most recent ones recognized in the evolving floodplain of the principal branch of the Po channel (
f1) and in the front delta plain area. Accordingly, formations of class I-floodplain (
f1), brackish marshes, and lagoon as well as coastal dunes of the XV–XX centuries are certainly younger than 500 years. In agreement with the statement that younger sediments are looser and consequently more likely to experience liquefaction in saturated conditions [
61], and considering the Youd and Perkins [
17] criteria, the floodplain of the principal channel of the Po River (
f1) could be classified as a uniform zone of high susceptibility, based on the geomorphological map used for the preliminary purposes of this research.
Table 1 presents a summary of the classification of the different units recognized in the investigated area (
Figure 3) according to Youd and Perkins [
17].
It is worth to note that several studies of the last 20 years suggest that in contrast to an apparently uniform fluvial floodplain liquefaction occurrences are strongly correlated, and show important variations, in correspondence with, for example, abandoned channels and point bars [
27,
31,
33,
34,
62]. At this regard, Wakamatsu et al. [
19] also proposed that the deposits be located in the inner part of a meander, i.e., point bars deposits, which should be classified as separate units associated to a very high liquefaction susceptibility category in case of level 2 ground motion. In line with these suggestions and following the initial classification of surficial units, it was assumed that these parts of the floodplain of the main Po channel (
f1) should be upgraded from high to very high susceptibility to liquefaction (
Table 1).
As it concerns the assessment of liquefaction susceptibility for the ‘floodplain/channels’ formations (f2 and f3), their classification was based on both the relative age and the depositional material. Even though the f2 unit consists of sandy material similar to f1 and likely younger than 500 years, it has been differently characterized as highly susceptible due to the older age and the inactive depositional environment. Following the same principle, f3 deposits have been classified as moderate susceptibility, due to the fact that they are mainly composed of silty-sandy material of Holocene age. Furthermore, formations of abandoned channels a2 and a3, as well as crevasse splay deposits were classified in accordance with their associated floodplains as high and moderate susceptibility, respectively.
On the other hand, estimation of the absolute chronology of coastal dunes and beach ridges c1 resulted in a further distinction of their susceptibility to high and moderate class, with units of the XV–XX centuries included in the former class. Moreover, beach barrier formations were characterized as Holocene estuarine deposits, therefore they were associated with a moderate liquefaction susceptibility class. Finally, marshes of interdistributary areas and brackish marshes and lagoons of front delta plain were classified as non-susceptible features, since they basically consist of clays, silty clays, and silts.
3.2. Seismic Input
The investigated area is adjacent to the seismogenic zone 912 of the SZ9 seismic zonation map of Italy [
63], which generated several seismic events in historical times, including the 1570 Ferrara, 1574 and 1639 Finale Emilia, 1901 Mirandola [
64,
65,
66] as well as the 2012 Emilia earthquakes (e.g., [
67]). This zone has been geometrically defined and seismologically and seismotectonically characterized on the basis of the regional tectonic and geological setting of the broader Po Plain. In zone 912 several blind reverse faults have been identified capable of generating moderate earthquakes (Meletti et al. 2004 and references therein [
63]). For the purpose of a probabilistic seismic hazard assessment analysis, in the national map it is also indicated for each zone the maximum expected magnitude, M
w, the corresponding rupture mechanism (faulting type), and the most likely range for the hypocentral depth. In zone 912, an M
w = 6.14, a reverse kinematics, and an interval depth of 5–8 km are suggested.
It should be noted that our investigated area falls outside any seismogenic zone of the national map and hence the maximum expected PGA values at the different locations must be calculated to obtain a reference triggering seismic load for the evaluation of the liquefaction potential at any point. Following the 2012 seismic sequence with an M
w = 6.1 mainshock and several events greater than 5 [
67], the recorded ground motions have been nicely reproduced by the ITA10 attenuation law [
68], which could be accordingly considered suitable for the Po Plain geological setting [
69]. Due to the similar geological conditions, ITA10 [
68] could be therefore applied also to the area investigated in the present paper. This attenuation law combines a nonlinear term for the distance from the epicenter (
FD), a linear term for the scaling of the magnitude (
FM), a site coefficient for including lithological amplifications (
Fsoil), and a coefficient related to the faulting style (
FF).
where the distance function is defined as
where
RJB is the Joyner–Boore distance and
h the depth, while the magnitude function is
Bindi et al. [
68] fix the parameters
Rref = 1 km,
Mref = 5.0 and
Mh = 6.75. In order to apply Equation (1) to the whole investigated area we have subdivided it into a regular grid. Taking into account the details and the minimum dimensions of the mapped lithological units due to the scale of the basic input data (
Figure 3), a good compromise between running time and resolution of the output products is achieved with a mesh size of 50 m × 50 m. Accordingly, beyond the constant coefficient
e1, posed equal to 3.672, and assuming the same reverse faulting style for the entire investigated area (
FF = 0.105), the expected PGA was thus calculated for each mesh by assuming the centroid of the cell as a possible epicenter. At this regard, it should be noted that our investigated area falls outside any seismogenic zone of the national SZ9 zonation map, while the closest zone is the 912 almost contiguous to the SW corner.
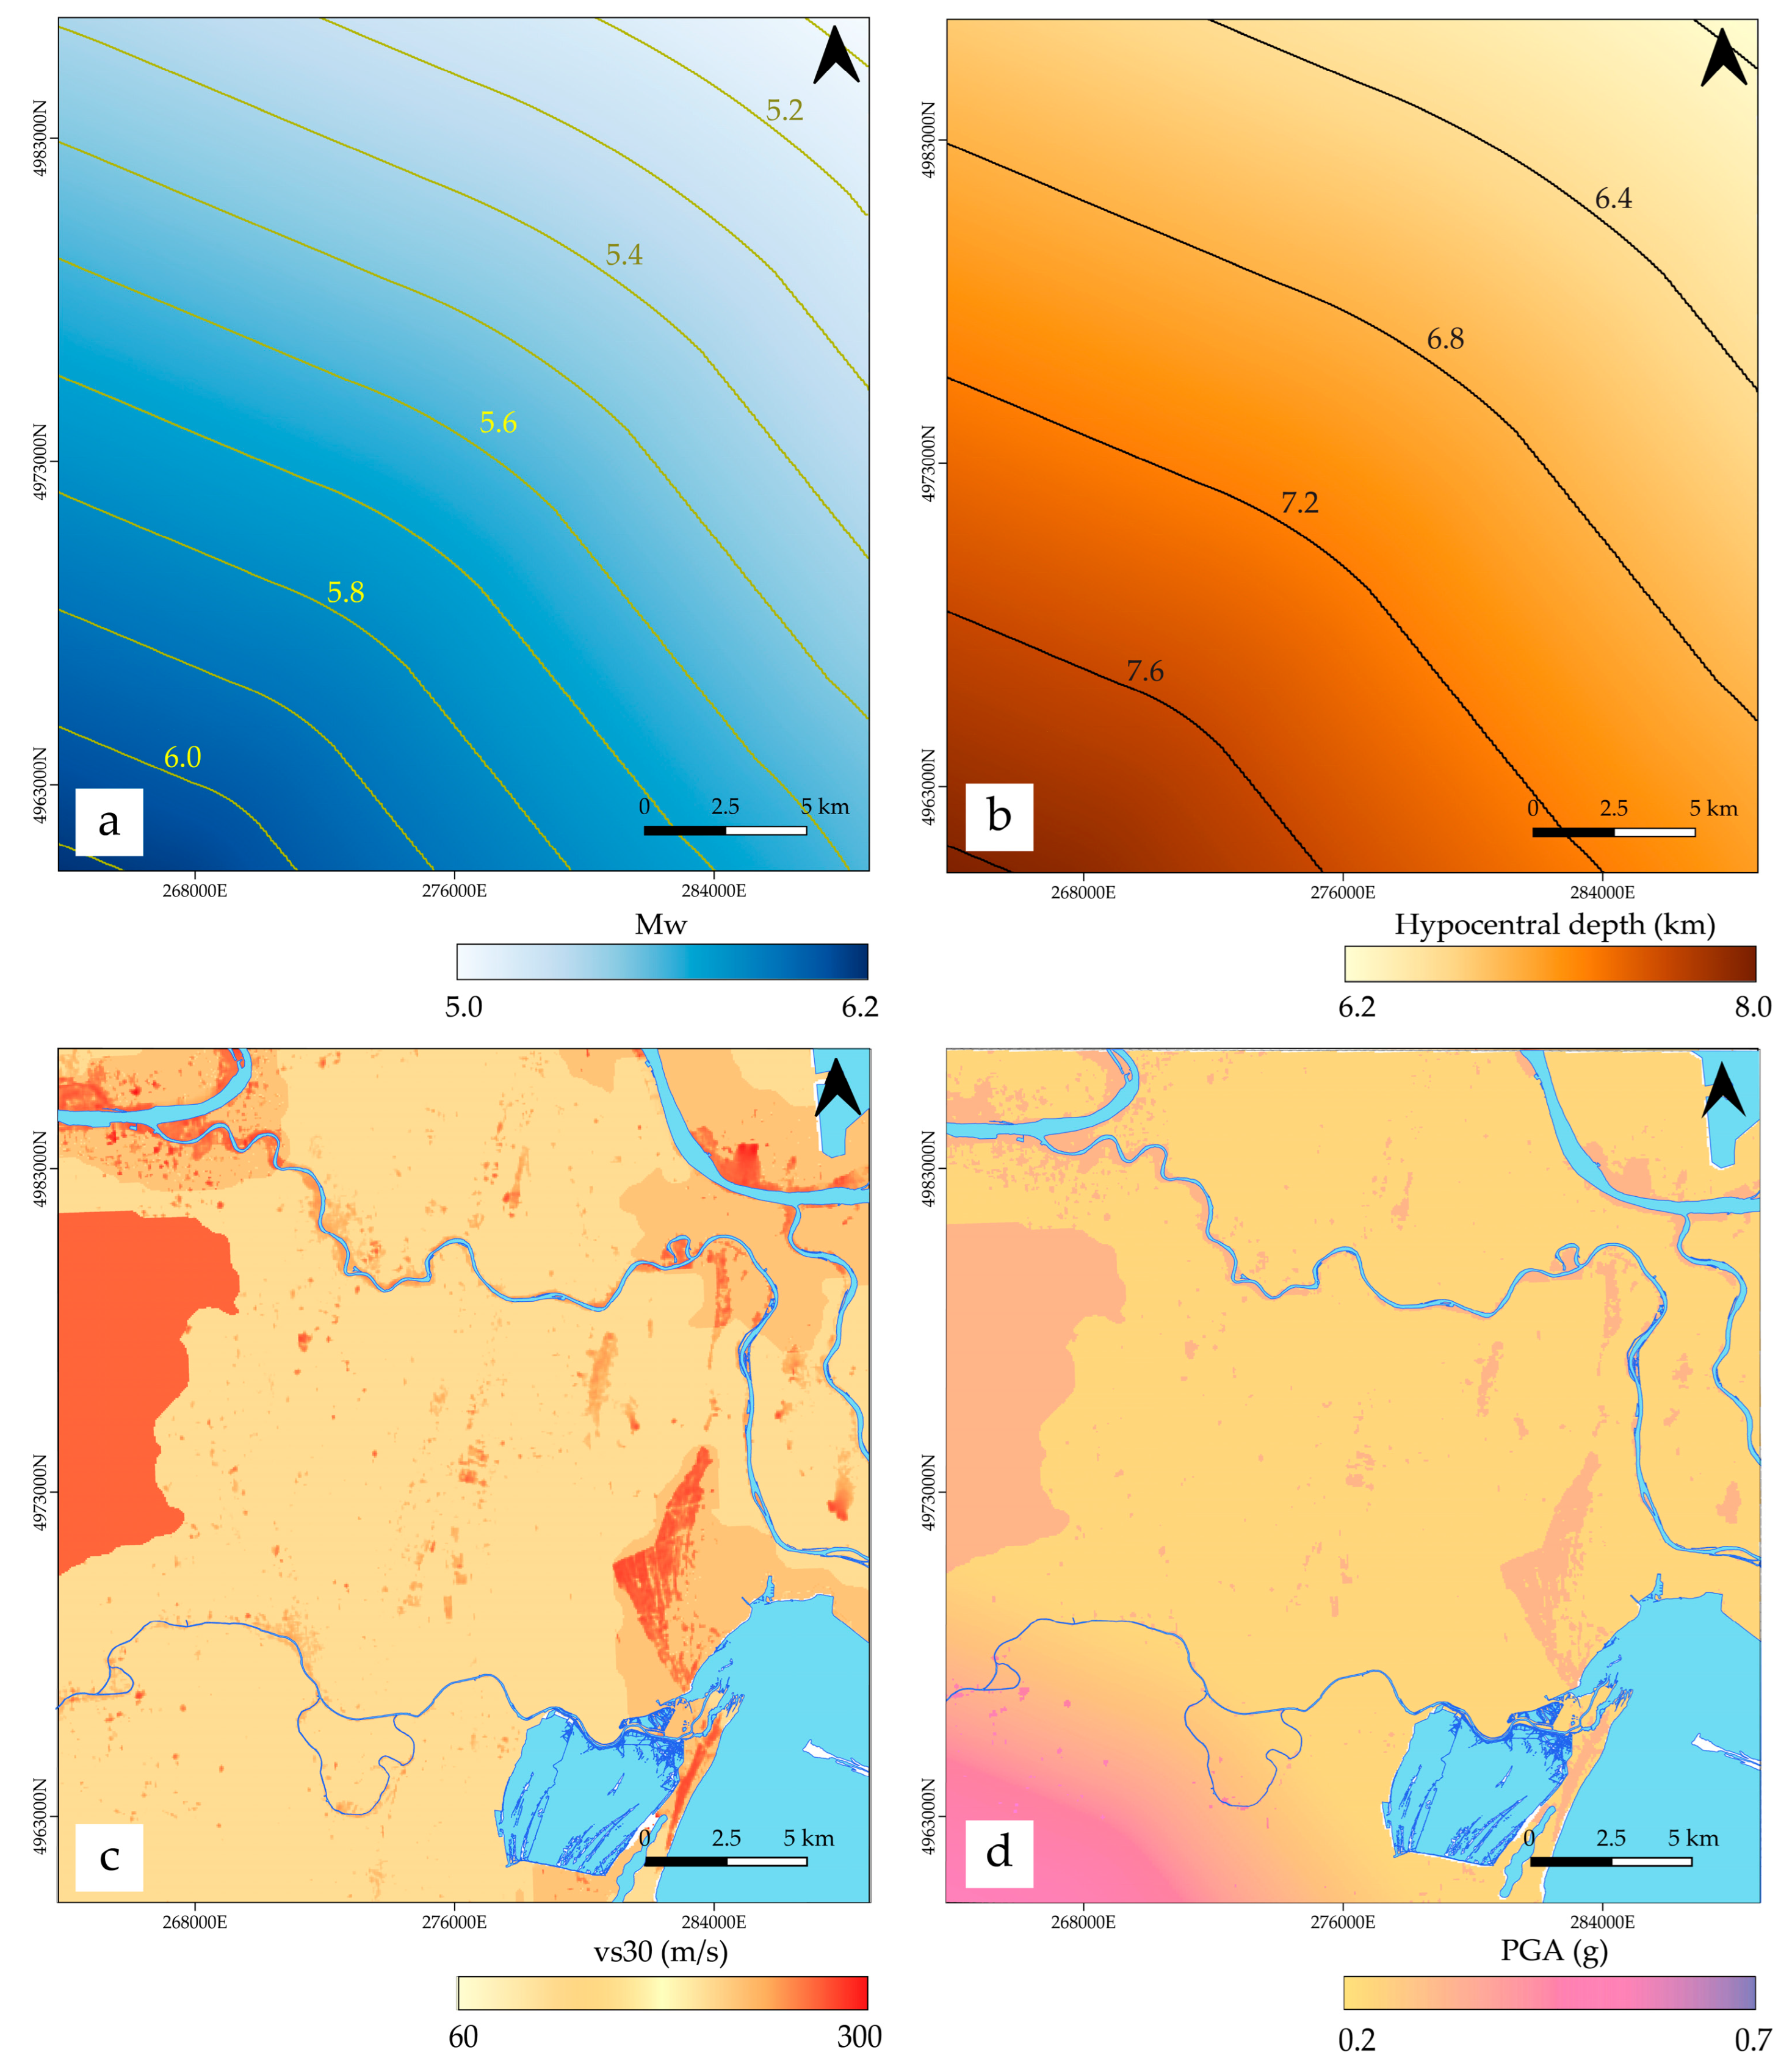
In order to assume a reasonable magnitude value for each cell of the grid, we explored a broad set of seismic scenarios, for a first set of models a negative gradient has been applied, tentatively following a linear decrease of 0.03 M
w units per kilometre of distance from the border of the 912 zone [
63], (
Figure 7a). Although we tested different magnitude gradients (see
Figure S1 in Supplementary Materials), the above gradient assures that the minimum magnitudes in the NE corner of the investigated area roughly corresponds to 5.0, which represents the background seismicity commonly assumed in SHA analyses in Italy.
As concerns the lithological amplification coefficient,
Fsoil, in Equation (1) we analysed the available
vs30 map produced by Mori et al., [
70], showing that the investigated area is entirely characterized by values between 150 and ca. 250 m/s corresponding to soil class
C (>180 m/s) and
D (<180 m/s) (
Figure 7c). With the same systematic procedure, for this parameter we thus attributed to the coefficient
Fsoil of each cell the corresponding value of 0.240 and 0.105 for soil class
C and
D, respectively (
Figure 7c; [
68]).
Having assumed as a worst-case scenario that each cell corresponds to an epicenter, the Joyner–Boore distance is accordingly posed equal to 0, and the distance function
FD simplifies as follows:
Relative to the depth, we considered two possible hypocentral conditions. Firstly, we assumed a value of
h = 10.322 km as proposed by Bindi et al. [
68] from the regression of the entire dataset, which would further simplify Equation (4). Alternatively, based on the tectonic setting in correspondence of the investigated area, which is on top of the frontal most sector of the Northern Apennines orogenic wedge (e.g., [
46]), the shallower possibly seismogenic source could be represented by the low-angle basal detachment and associated splay faults. Corresponding depths for these structures progressively decrease NNE-wards from 8 to 6 km [
46,
71]. Further seismogenic sources could be represented by inherited high-angle structures affecting the underlying units formally belonging to the Adria plate thus potentially generating hypocentral depths comparable to the above-mentioned fixed
h value (10.322 km). Following the worst-case scenario approach of this research, we accordingly tested the depth variable condition in the calculations of the PGA (
Figure 7b).
As an alternative to the double gradient models (NNE-wards decrease of the magnitude and shallowing of the hypocentral depth) above described, we recall that for the areas outside the Italian seismogenic zones SZ9, a reference background seismicity with magnitude 5.0 is assumed [
72]. Accordingly, in a second group of models the PGA was calculated for each mesh by assuming the centroid of the cell as a possible M5.0 epicenter. Furthermore, in this case we tested different fixed focal depths between 6 and 8 km (see
Figure S2 in Supplementary Materials). Similar to Norini et al. [
69] we also tested the scenario of an event of fixed magnitude (M = 6.14) occurring at the closest point of the 912 seismogenic zone, where the PGA values at each mesh of the grid ‘simply’ decrease with distance according to Equations (1) to (4) (
Figure S2d in Supplementary Materials).
Following several tests to evaluate the sensitivity of the models to the selected parameters, we finally considered a composite model characterized for each mesh by the greatest calculated PGA value between assuming an M = 6.14 event occurring within the 912 seismogenic zone at the SW corner of the investigated area and a ‘local’ 5.0 magnitude associated to the background seismicity outside the zone 912. This represents our preferred model for the seismic input. Accordingly, based on the above assumptions and equations, the maximum expected PGA has been therefore calculated for each cell of the grid (
Figure 7d).
3.3. Liquefaction Probability Estimates
In order to estimate the probability of liquefaction, the method proposed by HAZUS [
73] was subsequently applied. According to HAZUS, the likelihood of experiencing liquefaction at a specific location is primarily influenced by (a) the susceptibility of the soil, (b) the amplitude and duration of the ground shaking, and (c) the depth of the groundwater. Therefore, geological units susceptible to liquefaction and a seismic scenario were considered in assessing the probability of these phenomena.
Specifically, taking into consideration the susceptibility categories of
Table 1, a mean groundwater depth of 0.5 m (
Figure 4) as the most conservative scenario, a moment magnitude ranging from 5.0 and 6.14 (
Figure 7a) and maximum expected PGA between 0.31 and 0.67 g (
Figure 7d), the probability of liquefaction was determined by the following equation:
where
P [
Liquefactionsc|PGA =
a] is the conditional probability of liquefaction occurrence for a given susceptibility category (
sc) depending on the specified level (
a) of peak ground acceleration (PGA).
Relationships between liquefaction probability and PGA for the different susceptibility categories are based on widely accepted empirical methods and statistical modeling of the liquefaction database developed by Liao et al. [
74].
Pml represents the proportion in the map of the selected unit susceptible to liquefaction, corresponding to 0.25, 0.20, 0.10, and 0.005 for the very high, high, moderate, and low susceptibility classes, respectively. As concerns the denominator of Equation (5)
corresponds to the correction factor for the moment magnitude (M), while
represents the correction factor for the groundwater depth (
dW). The results obtained with less conservative groundwater depth values (1.5 and 3.0 m) are described and discussed in the
Supplementary Materials (see
Figure S3).
3.4. Liquefaction Potential
The evaluation of liquefaction potential was accomplished by collecting and analyzing data provided by in situ tests like Cone Penetration Tests, with pore pressure measurements (CPTu) conducted within the studied area. The aim of this activity was to develop a dataset of in situ tests representative for each liquefaction susceptibility class and to evaluate the liquefaction potential at different sites. Specifically, a total number of 73 CPTu were collected of which 31 were conducted on areas classified with high susceptibility, 23 moderate, and finally 19 non-susceptible to liquefaction areas.
The liquefaction potential for each analyzed CPTu, in terms of Liquefaction Potential Index (
LPI), was computed using the CLiq3.0 software developed by Geologismiki (
www.geologismiki.gr, accessed on 29 April 2026) considering the equation suggested by Iwasaki et al. [
75,
76]:
where
F is equal to 1 −
FS, for
FS < 1, and to 0, for
FS ≥ 1.0, with
FS representing the factor of safety. The parameter
w(
z) is equal to 10–0.5·
z, with
z corresponding to the depth below the ground surface (in meters). The
LPI ranges from 0 to 100.
Initially, the factor of safety for each soil layer was estimated using the Boulanger and Idriss [
77] simplified procedure, where the soil Fines Content (
FC) was obtained based on the proposed correlation between
FC and the soil behavior type index
Ic. According to the recommendation of Robertson and Wride [
78], soil layers with
Ic values greater than 2.6 should be assessed as clay-like soils and consequently as non-liquefiable ones. In terms of seismic loading, we considered the earthquake magnitude and PGA values for each investigated pixel as they have been described in a preceding section. Considering the seasonal fluctuation of the groundwater table, we tested three different scenarios: 0.5 m, as the more conservative one, related to heavy rain period and/or flooding periods, but also 1.5 and 3.0 m representing dryer seasons.
The computed
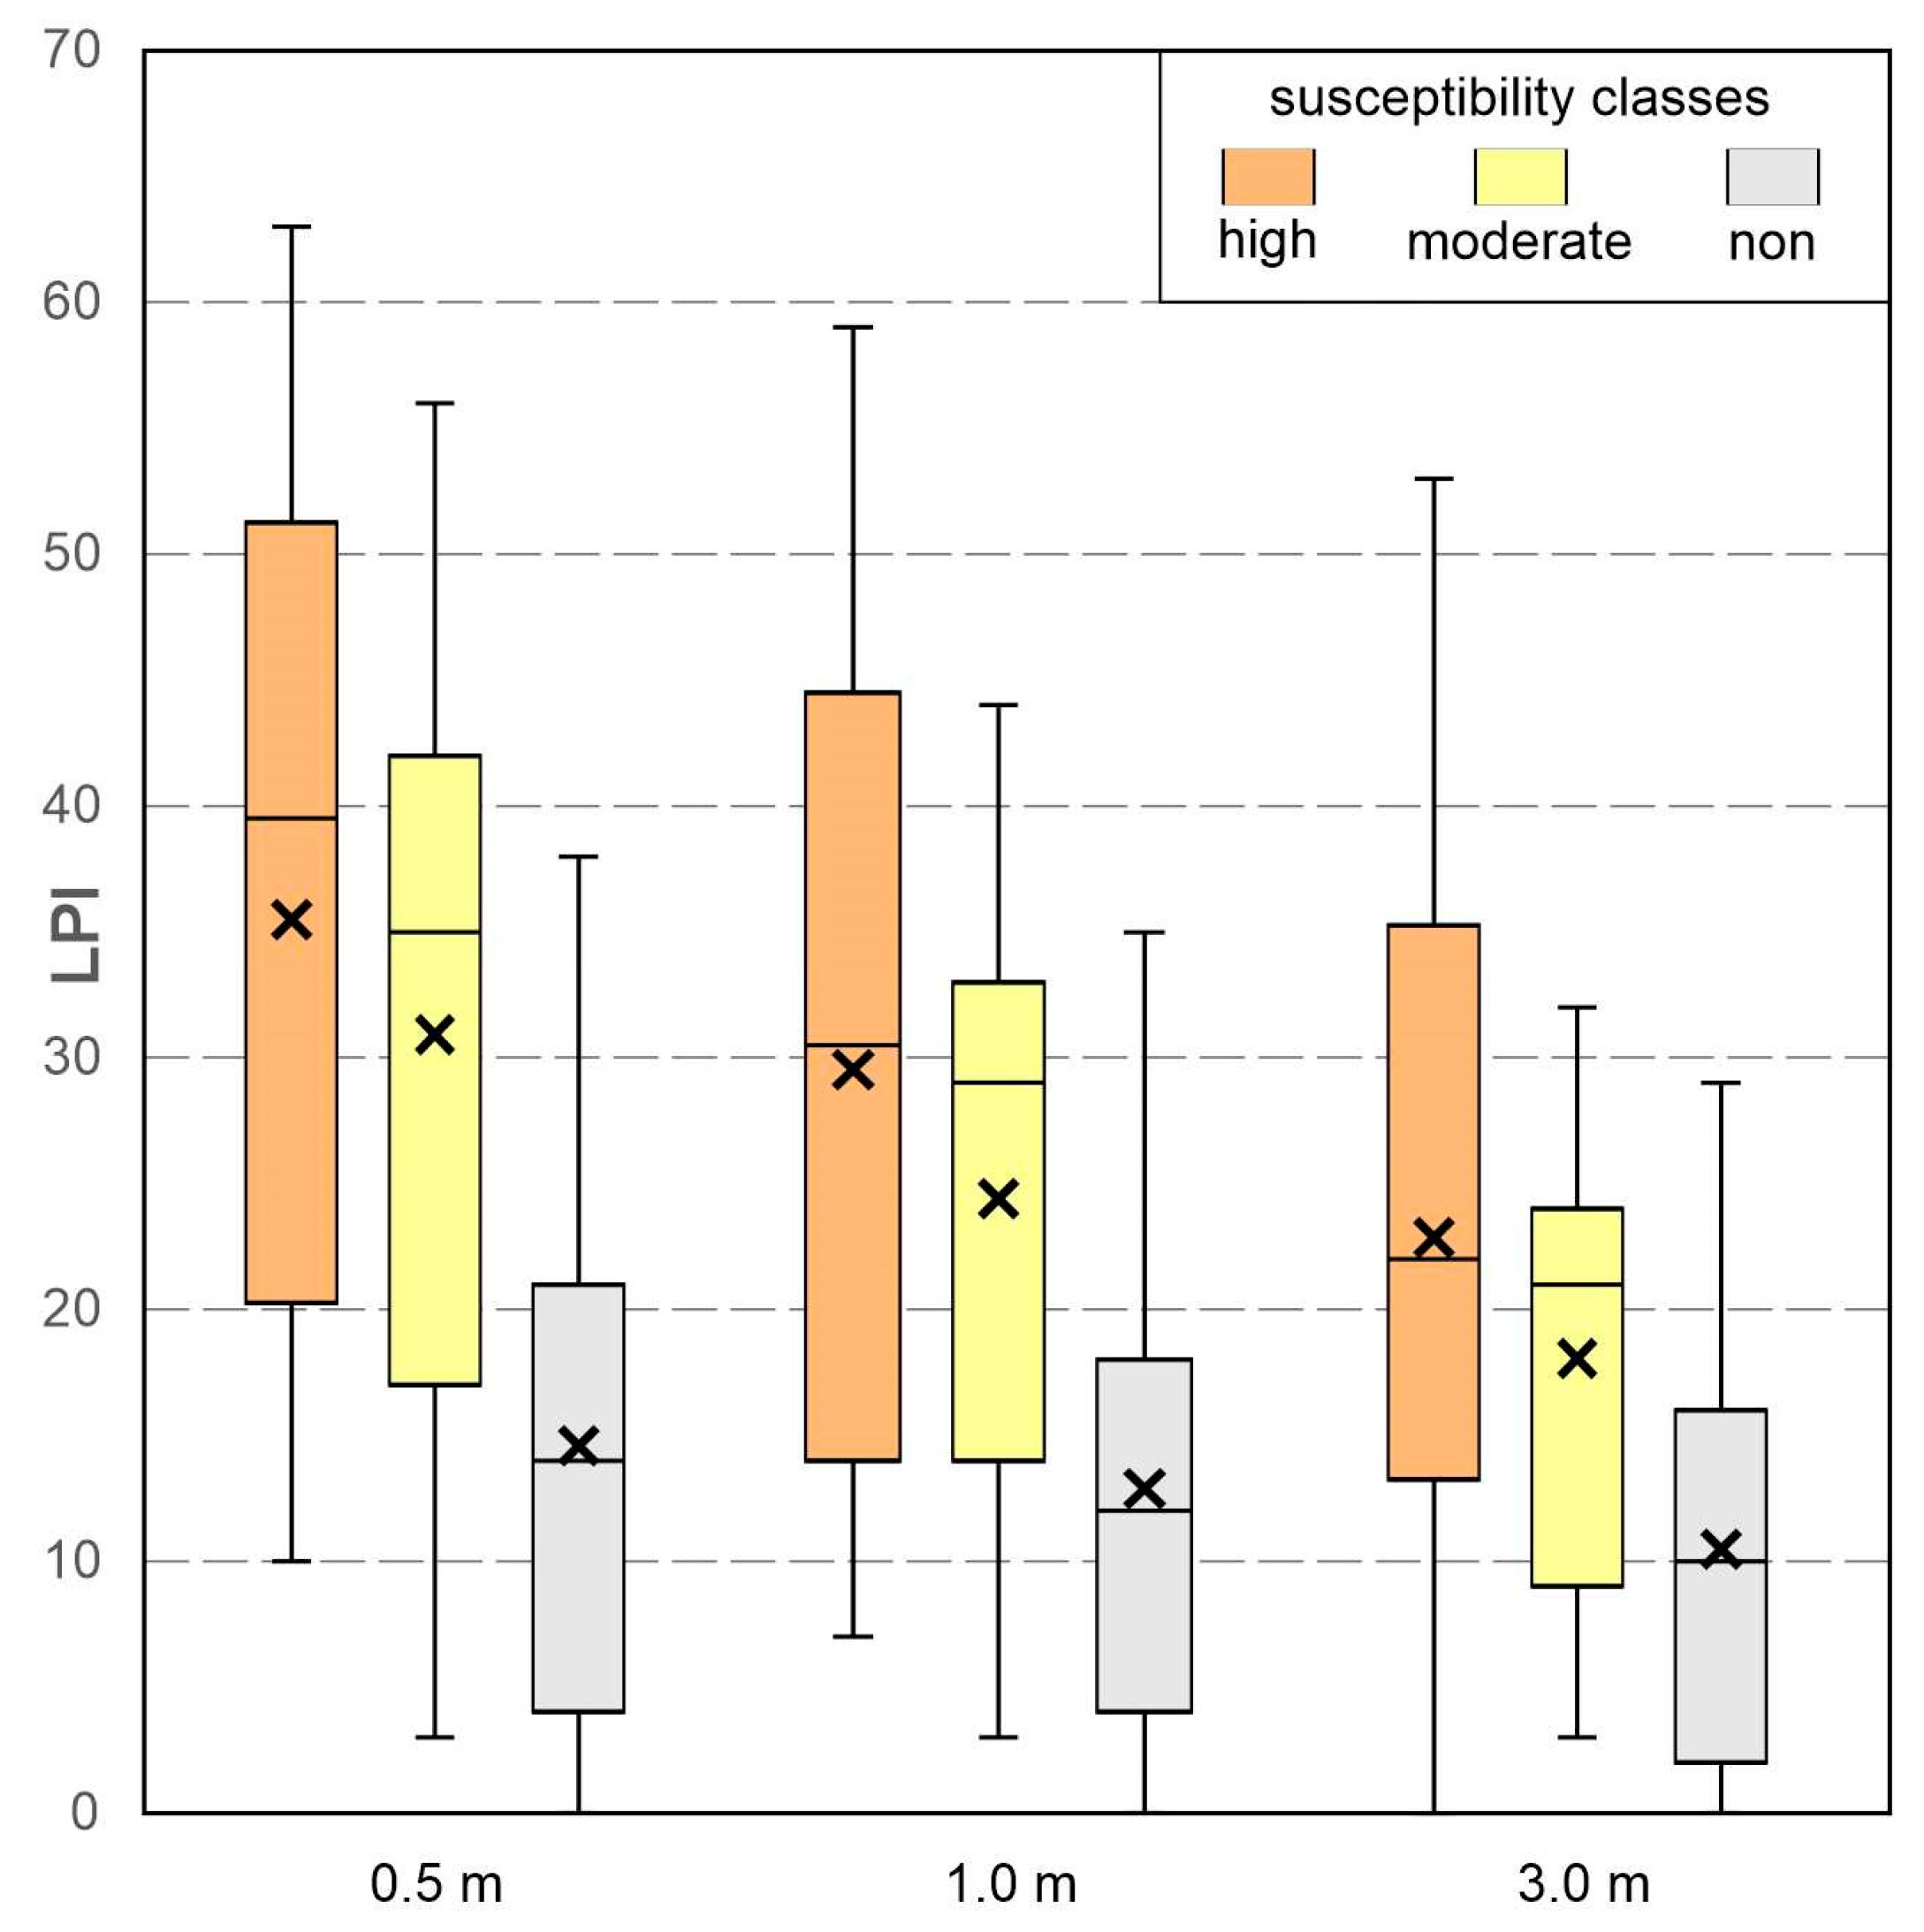
LPI values were further statistically analyzed in terms of average values and by applying the approach of box–whisker plot method using the SPSS software (IBM SPSS Statistics 29.0.2) (see
Section 5). The latter method is commonly applied for displaying the spread of the data distribution, where the rectangle indicates the first, Q1, and third, Q3, quartiles, the whiskers outside the box show the minimum and the maximum values, and the line within the box represents the median. Values that lie more than one and a half times the length IQR (= Q3 − Q1) are called outliers and are indicated as an open circle.
4. Results
4.1. Liquefaction Susceptibility Map
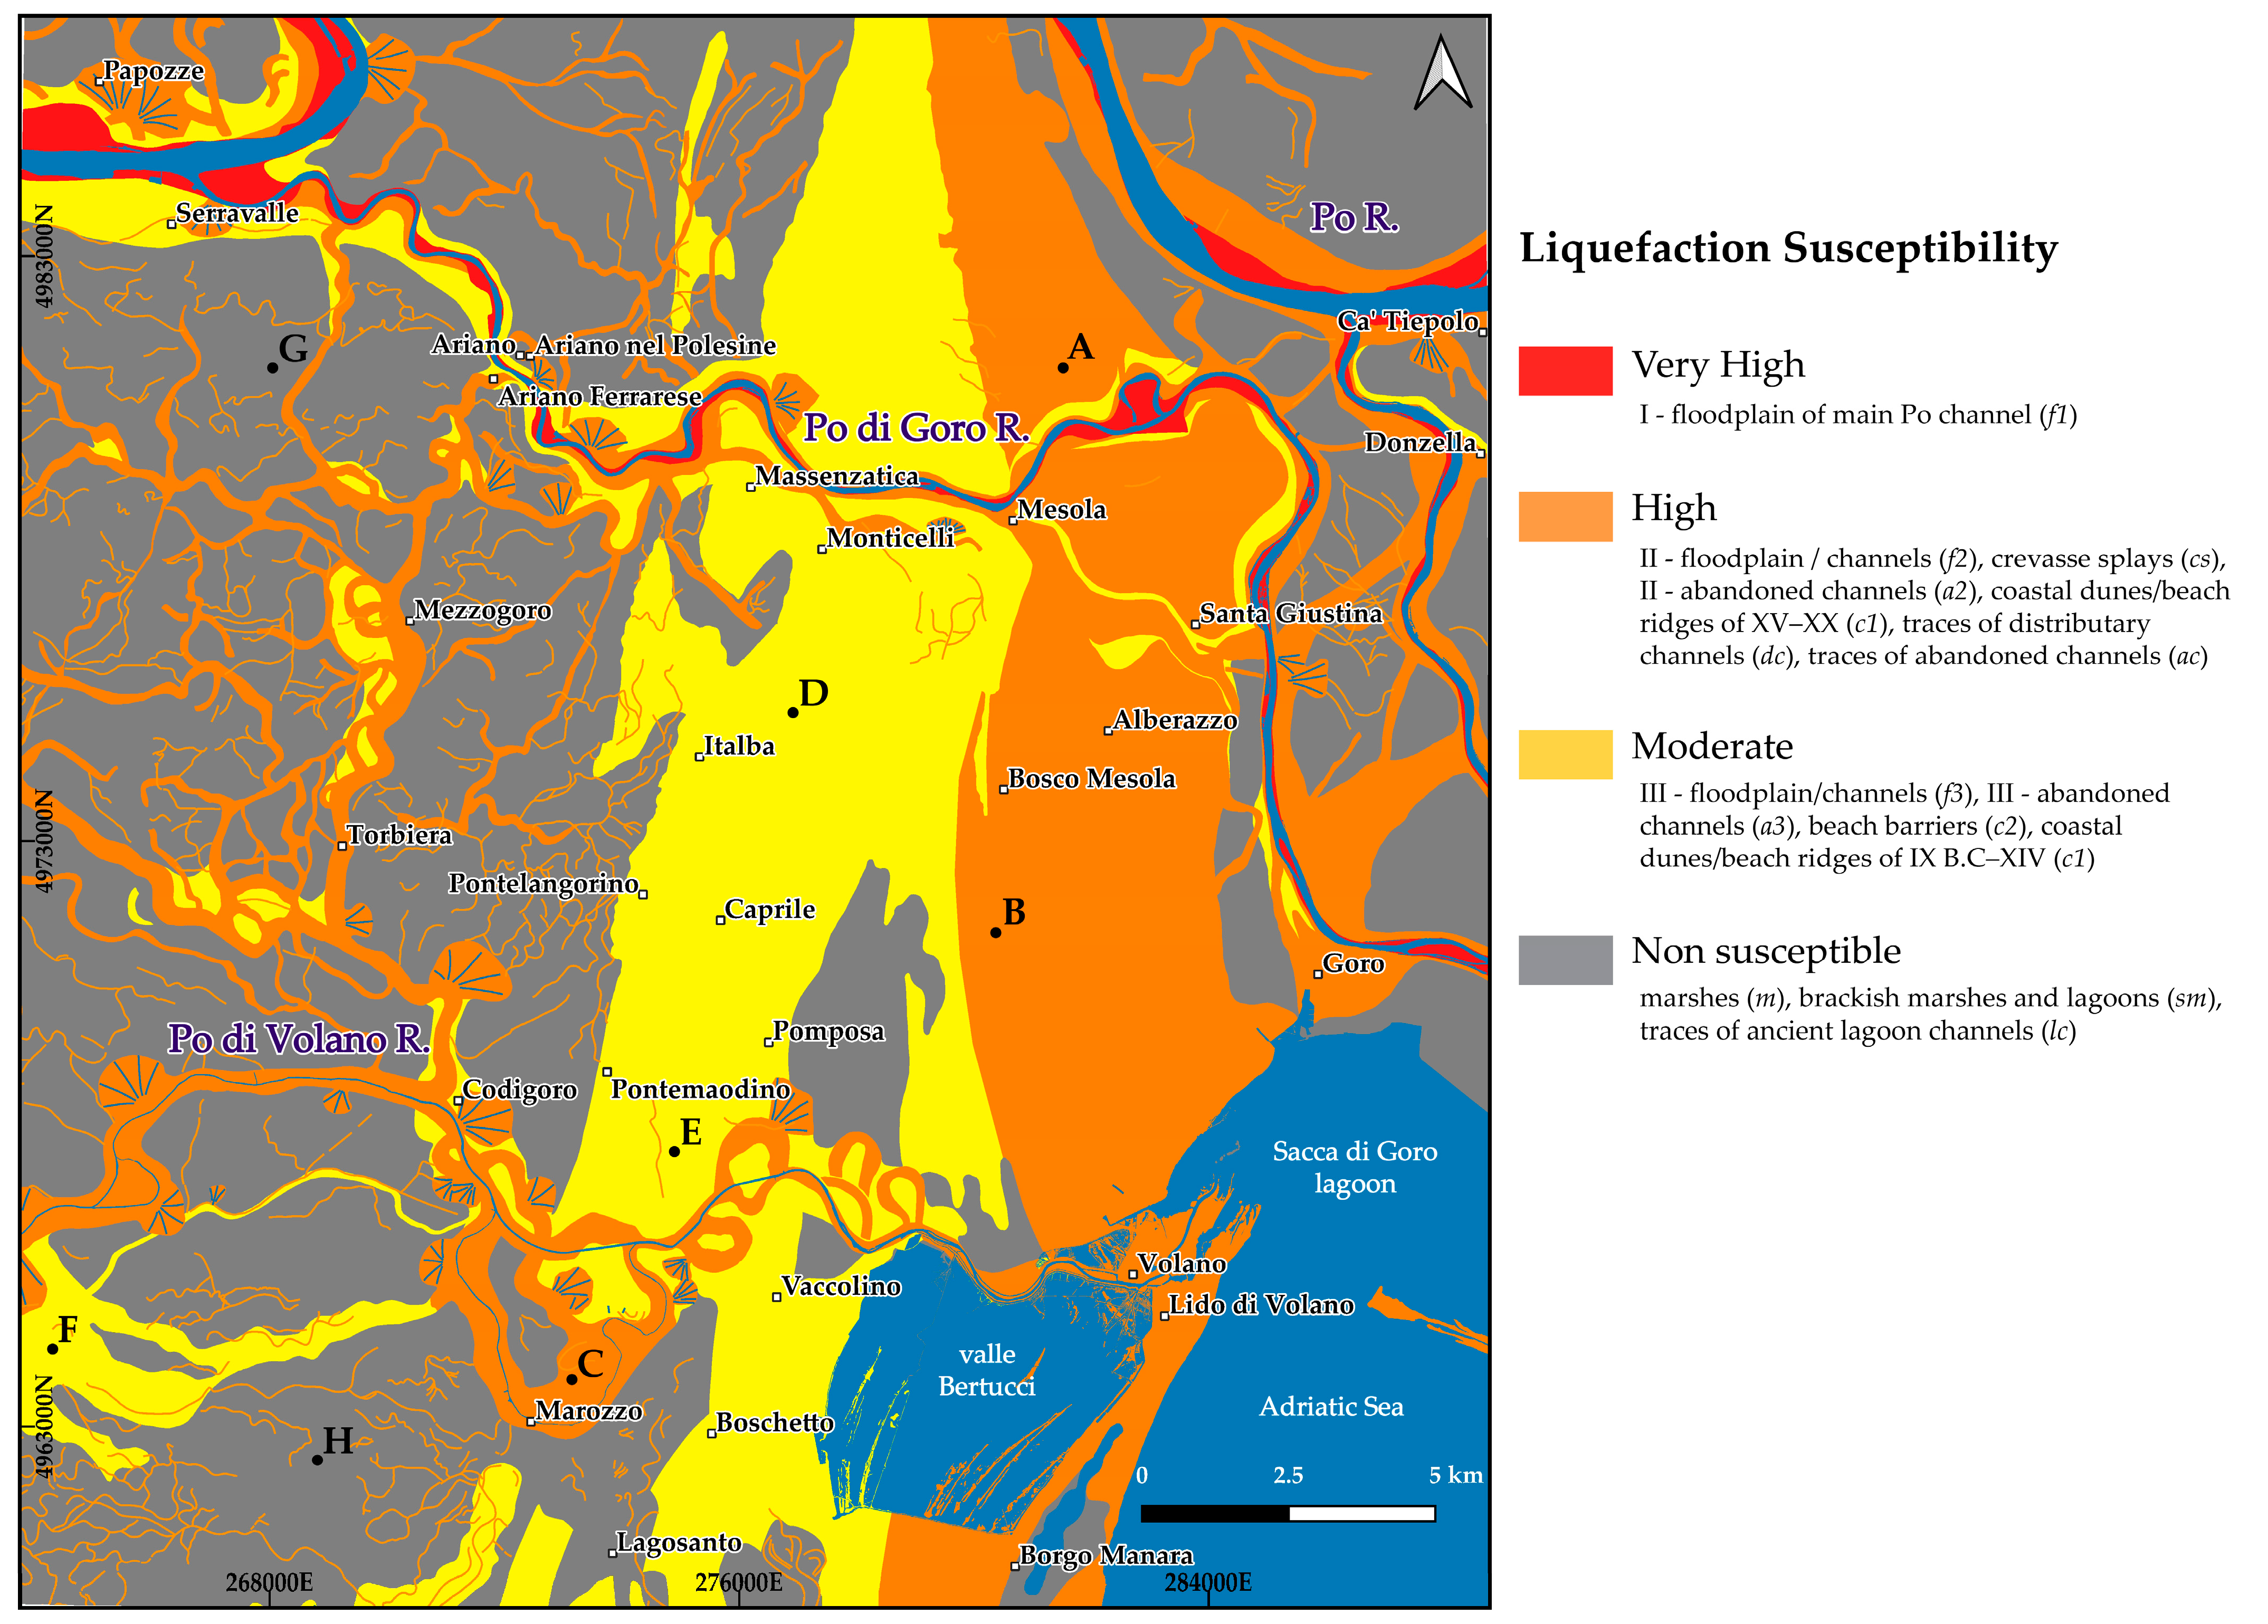
Based on the criteria and the methods described in the previous section, a map of liquefaction susceptibility has been produced by gridding the investigated area (
Figure 8). Accordingly, each mesh of the grid was categorized into the three susceptibility classes (very high, high, and moderate susceptible units), while sectors where liquefaction phenomena are not expected or are not of interest (‘Non susceptible’) were also distinguished.
Following the obtained results, the most susceptible sectors (very high susceptibility class) correspond to the narrow floodplain
f1 associated to the main channel of the Po River extending from the northwestern to the central–eastern part of the investigation area (
Figure 3). This unit crosses the western marsh deposits
m and the longitudinal central sector of coastal formations and the easternmost brackish marshes and lagoons
sm.
The western sector of the investigated region is dominated by clayish and silty clayish materials of the reclaimed marshy lands corresponding to non-susceptible units and representing a sort of background irregularly crossed by braided and/or meandering bodies defining high and moderate susceptibility narrow zones. In particular, floodplain/channels f2, abandoned channels a2, crevasse splay cs and narrower distributary channels correspond to highly susceptible zones, while floodplain/channels f3 and their associated abandoned channels a3 to a moderate susceptibility class, largely represented in the southwestern part of the map.
Towards the central-eastern sector of the area, marshy conditions are largely overlaid by coastal formations, while fluvial deposits f1 of a major reach of the Po and floodplain/channels f2 interlay and cross the northern and southern sectors. Being mostly covered by units formed as coastal dunes/beach ridges c1 and beach barriers c2, this broad longitudinal sector was classified into two roughly parallel moderate and high susceptible zones also taking into account the different age between the inner-older and the outer-younger (<500 years) coastal dunes/beach ridges c1.
Coastal formations also include areas of brackish marshes and lagoons m located in the (north) easternmost sector of the map. Accordingly, these areas were characterized as non-susceptible to liquefaction phenomena as they are covered by deposits similar with the marshes of the western part, just differing for the higher salt content. In addition, this zone is also crossed by the major channel of the Po River (f1), which is associated with floodplain/channels (f2, f3) and abandoned channels (a2, a3) crossing the area similar to the western and central sectors. As a consequence, these belts were also classified as susceptible to liquefaction (very high and high).
4.2. Liquefaction Probability Map
Liquefaction susceptibility refers to the intrinsic predisposition of a soil deposit to liquefy during an earthquake whereas liquefaction probability quantifies the likelihood that liquefaction will occur under specified seismic loading conditions [
16,
79].
As above mentioned, in order to estimate the liquefaction probability, we applied the methodology proposed by HAZUS [
73] considering the PGA values calculated in the previous section on the basis of the attenuation law recommended by Bindi et al. [
68]. Within the investigated area, on the basis of the preferred seismic input model and a worst-case scenario, the obtained PGA values range from 0.24 to 0.50 g (
Figure 7d).
As expected, the highest values occur in the SW corner obviously due to the effects of the 6.14 magnitude seismic source 912 [
63]. Outside this buffer zone the distribution of the PGA values is instead markedly correlated with the coefficient of lithological amplification and particularly the associated
vs30 values therefore clustering around 0.24 and 0.33 g for type-
D (
vs30 < 180 m/s), and type-
C (
vs30 > 180 m/s) soils, respectively (
Figure 7c).
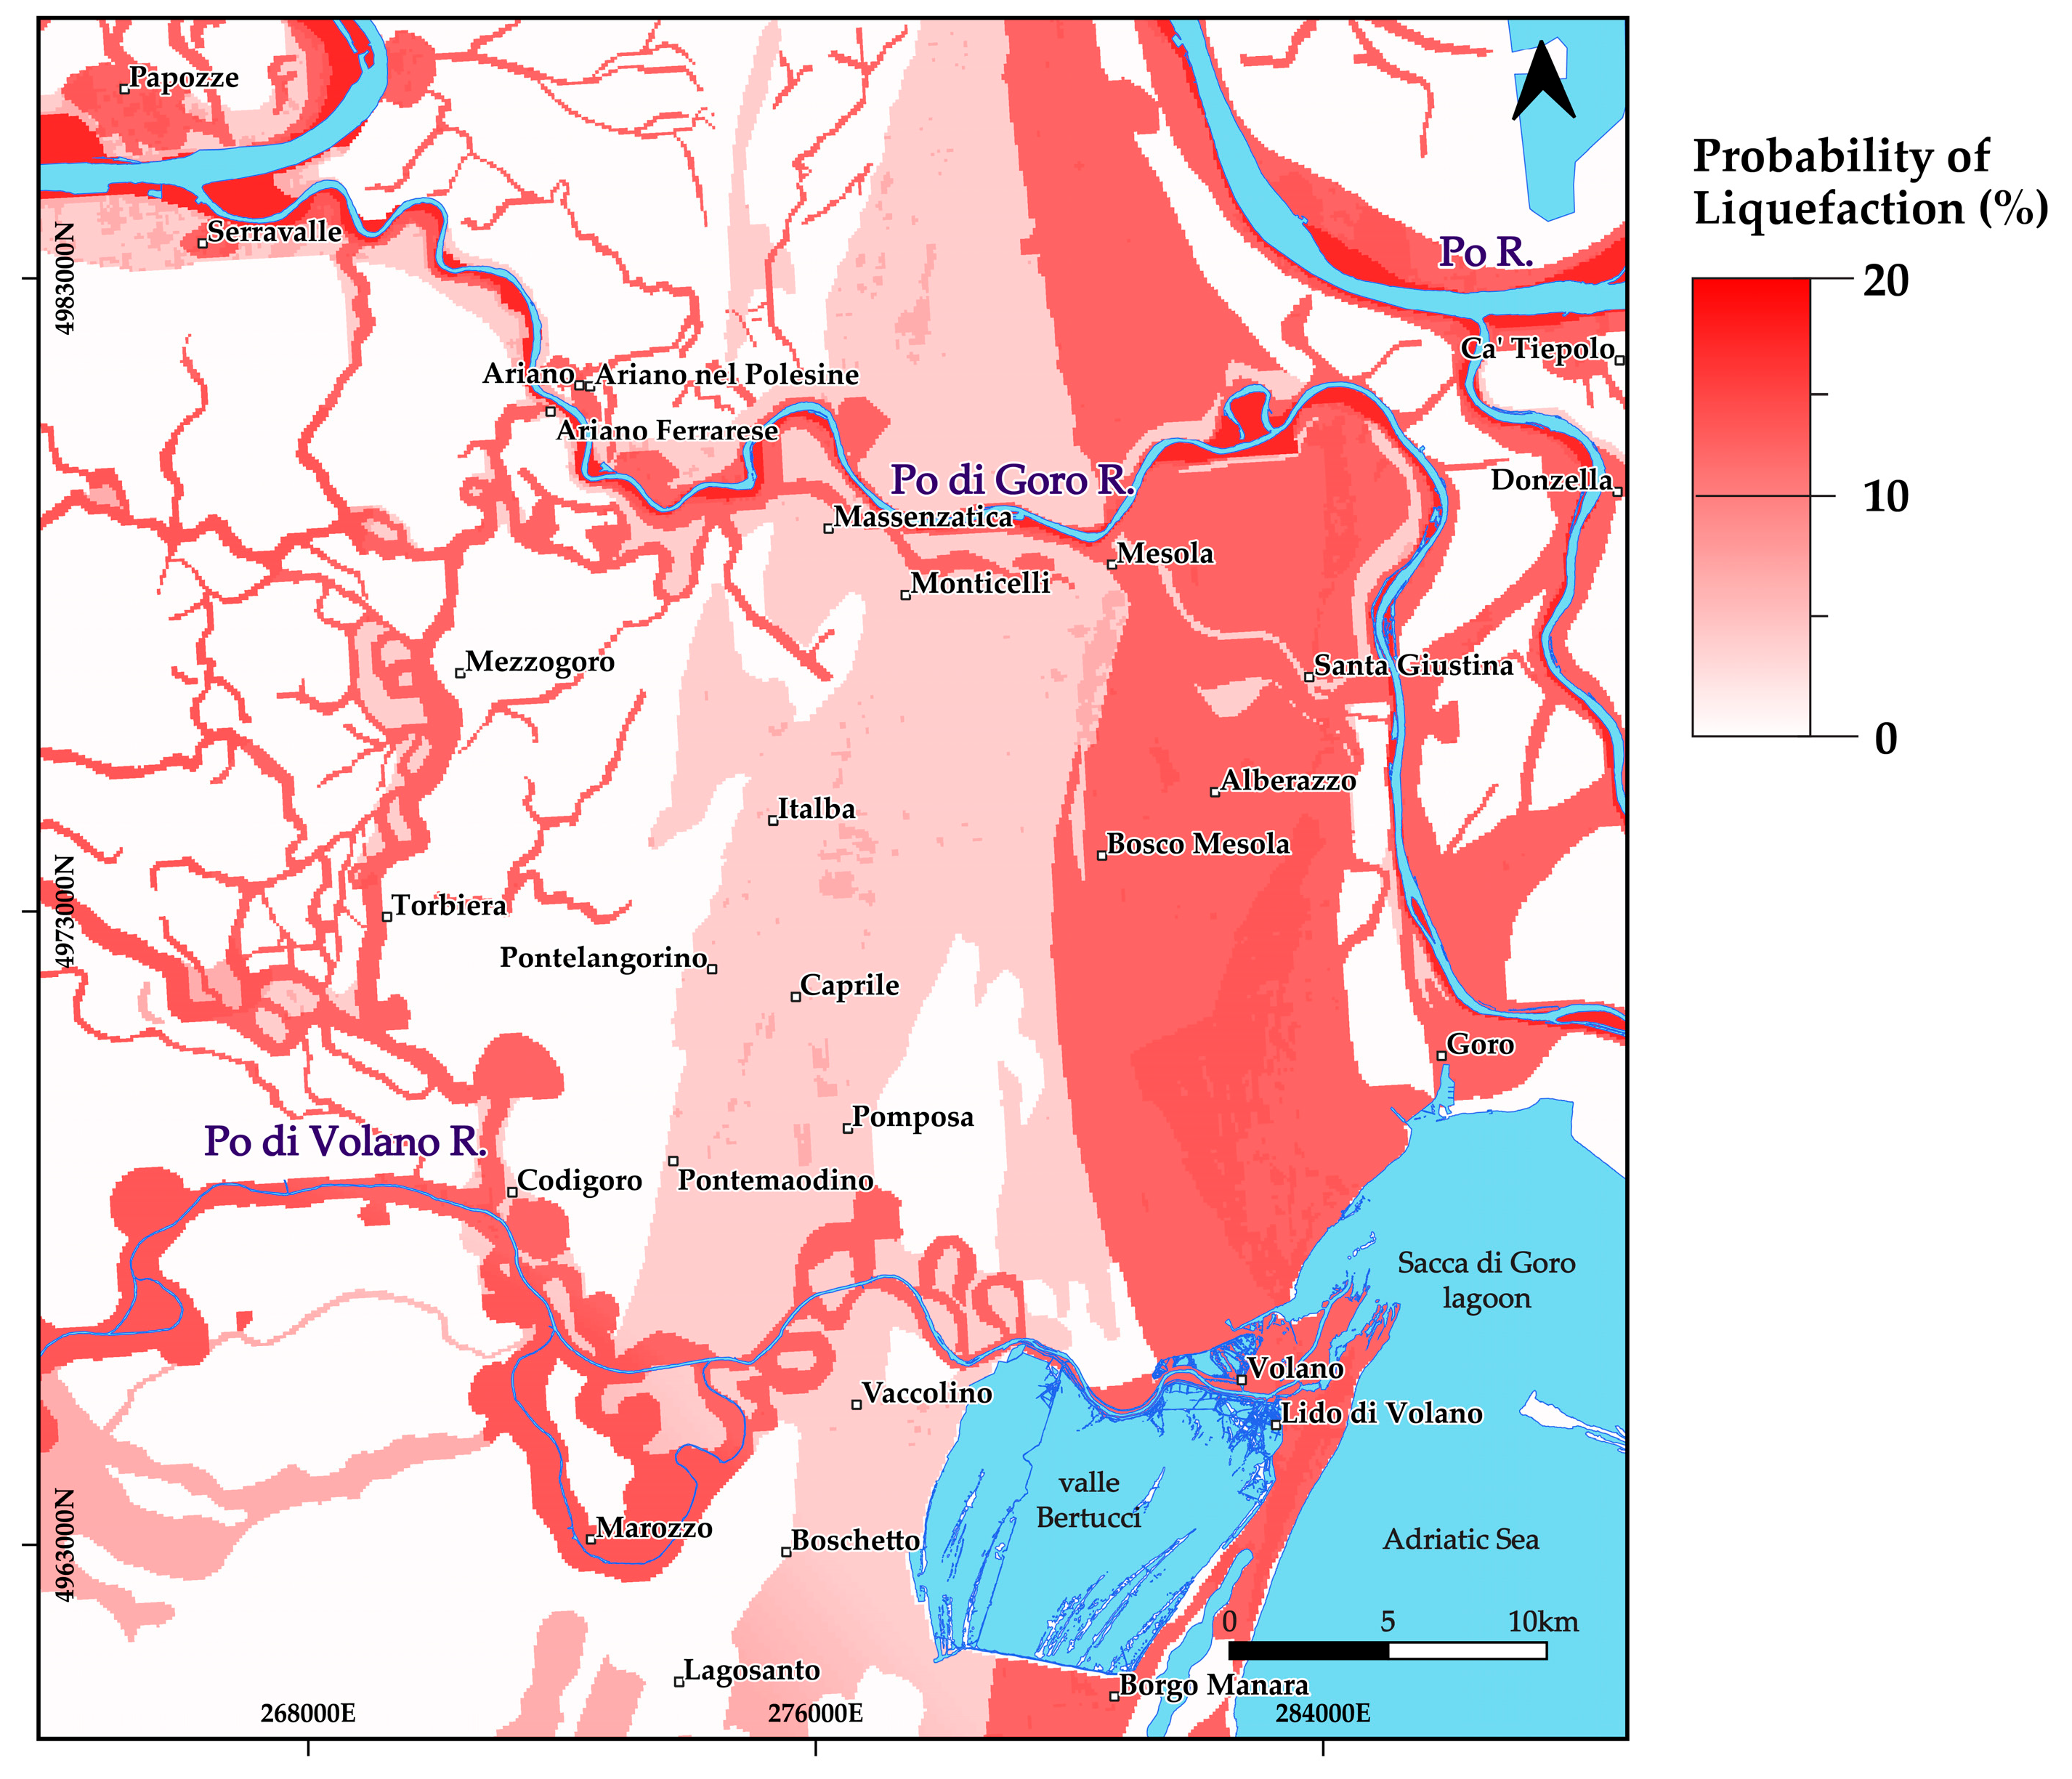
Based on these PGA values and applying Equation (5), the probability of liquefaction in the Po delta plain was thus estimated. The obtained probabilities range from 0% to almost 17% and the compiled relevant map is represented in
Figure 9. As expected, the probability distribution is obviously strongly influenced by the susceptibility of the outcropping units, but also by the different parameters of the tested seismic scenarios, especially the PGA.
More specifically, the almost nul probability values prevail in the western sector of the map, where marsh deposits m are largely represented. Similar percentages characterize also the zones of brackish marshes and lagoons sm occurring in the eastern and locally central parts of the map. The beach barriers c2 and the coastal dunes/beach ridges c1 of the central longitudinal area result in higher probabilities of liquefaction, with values in the ranges 6–7% and 12–13% in the western (older) and eastern (younger) N–S trending strips, respectively. With a general west to east direction, the entire area is also crossed by several fluvial units. In particular, floodplain/deposits f3 extending between the interdistributary plain and the abandoned channels a3 show probability of liquefaction values of 4–7%, while the more recent floodplain/channels f2, abandoned channels a2 and crevasse splay bodies cs show even higher probabilities (12–13%).
Finally, in correspondence with the active floodplain f1 of the major reaches of the Po River, crossing the northern sector of the investigated region, probability values up to almost 17% have been locally obtained.
4.3. Evaluation of Liquefaction Potential
Having assessed the liquefaction susceptibility of the surficial geological features, we additionally analyzed data derived from in situ tests, such as CPTu, randomly distributed within the studied area (
Figure 6), and evaluated the corresponding
LPI values. Specifically, the data were statistically analyzed using the box-and-whisker plot method and initially presented in groups according to liquefaction susceptibility classes, considering three distinct piezometric scenarios with groundwater table depths fixed at 0.5, 1.5, and 3.0 m below ground level.
Although in some sectors of the study area a groundwater depth of 0.5 m may represent a relatively uncommon condition relative to a seasonal average, at the current stage of the research a sufficiently dense and long-term piezometric monitoring network, representative of each mapped geological unit, is not available. For this reason, it is not currently possible to quantitatively constrain or assign robust occurrence probabilities to the individual groundwater scenarios used in the
LPI calculations. On the other hand, the results of the several models tested for calculating the probability of liquefaction (see
Figure S3 in
Supplementary Materials) indicate that deeper groundwater levels (down to 3.0 m) only slightly decrease (0.5–1%) the overall distribution obtained with the preferred input model and very locally up to 2% for the highest values in correspondence with the active floodplain
f1.
As shown in
Figure 10, the
LPI values at sites characterized as highly susceptible on a regional scale are higher than those of the other two classes, namely the moderate and non-susceptible to liquefaction classes. However, although the
LPI values associated with the sites of the third group (i.e., non-susceptible to liquefaction) are clearly distinct from those of the other two for all groundwater-table scenarios, an overlap in
LPI values can still be observed between the sites classified as susceptible to liquefaction.
As expected, the LPI values at sites with the highest liquefaction susceptibility are also generally higher than those at moderately susceptible sites; however, it is not possible to define a clear threshold between these two classes for none of the three groundwater scenarios. Accordingly, the distribution of these values was further investigated by taking into account the type of deposits in which the in situ tests were performed. This analysis indicated that the deposits with the greatest liquefaction potential correspond to coastal dunes and beach ridges c1.
In addition, it is demonstrated that the average LPI value for each class systematically decreases as the groundwater table depth increases, confirming that a thicker non-liquefiable crust layer results in lower liquefaction potential at a site. Moreover, this decrease in LPI values is consistently observed across all susceptibility classes. This trend highlights the importance of groundwater-level fluctuations in controlling liquefaction potential under varying geological and hydrogeological conditions.
4.3.1. Highly Liquefaction Susceptibility Areas
Regarding the features classified as highly susceptibility to liquefaction (
Section 4.1), the average
LPI values for a groundwater table depth equal to 0.5, 1.5, and 3.0 m are 29, 25, and 21 for the recent floodplain deposits
f2; 43, 35, and 26 for coastal dunes/beach ridges
c1 and 27, 22, and 18 for deposits characterized as abandoned channels
a2 (
Table 2 and
Figure S4).
Applying the box–whisker plot statistical analysis, for the same three groundwater depth scenarios it is possible to estimate that the weighted averages at the 50th percentile for floodplain deposits
f2 are 22, 20, and 17, with the highest and lowest
LPI values (i.e., whisker) equal to 63, 59, and 53 and to 12, 11, and 6, respectively (
Table 2 and
Figure S4). For the case of more recent (<500 yr) coastal dunes/beach ridges
c1 the relevant values are 42, 36, and 28, while the outliers in terms of the highest and lowest
LPI values are 55, 47, and 35 and 31, 28, and 22, respectively. Finally for the abandoned channels
a2 the weighted averages at the 50th percentile are 24, 12, and 14, while the highest and lowest values are 57, 53, and 43 and 10, 9, and 5, respectively.
4.3.2. Moderate Liquefaction Susceptibility Areas
As expected, the
LPI values are generally lower for the CPTu carried out in deposits classified as moderate liquefaction susceptibility. Specifically, based on penetrometric tests on floodplain deposits
f3, the averages are 24, 23, and 21 (for 0.5, 1.5, and 3.0 m depth of the water table, respectively;
Table 3 and
Figure S5), while on beach barriers
c2 the average
LPI values are 26, 19 and 13.
It is worth noting that 13 out of 28 CPTu carried out in the ‘older’ Holocene coastal dunes/beach ridges
c1 (
Table S1), have been classified as moderate susceptibility; however, this second group shows averages (40, 31 and 22) smaller than the former group, but slightly higher than the other coastal dunes/beach ridges deposits
c2, which have been similarly classified as moderate. Finally, the average
LPI values characterizing the abandoned channels
a3 are 9, 9, and 8 for the three-groundwater table related scenarios, respectively.
According to the outcome arisen by the box–whisker plot statistical analysis in the dataset of moderate susceptibility to liquefaction deposits (
Table 3 and
Figure S5), we estimated that the weighted averages at the 50th percentile for beach barriers
c2 are 23, 15, and 9 with the highest and lowest
LPI values (i.e., whiskers) equal to 45, 35, and 24 and to 15, 12, and 9, respectively. For the cases of coastal dunes/beach ridges
c1 the relevant values are 33, 25 and 17, while the highest and lowest
LPI values are equal to 50, 39 and 30 and to 22, 14 and 9, respectively. Finally, the abandoned channels
a3 are characterized by weighted averages at the 50th percentile equal to 9, 8, and 7 with highest and lowest
LPI values equal to 17, 16, and 15 and 3, 3, and 3, respectively.
4.3.3. Non-Susceptible Liquefaction Areas
Finally, the non-susceptible to liquefaction class mainly consists of deposits described as marshes
m and brackish marshes and lagoons
sm. The average
LPI values for the former are 17, 15, and 13 (for 0.5, 1.5, and 3.0 m depth respectively of water table;
Table 4 and
Figure S6) and systematically smaller for the latter ones (8, 7 and 5).
The whisker plots for this dataset reveal that the weighted averages at the 50th percentile for marshes are 14, 12, and 12, for the same groundwater scenarios, with the highest and lowest
LPI values equal to 38, 35, and 29 and 4, 4, and 4, respectively. In case of lagoons
sm deposits, the relevant values are 4, 4, and 2, while the highest and lowest
LPI values are equal to 17, 14, and 10 and 2, 2, and 1, respectively (
Table 4 and
Figure S6).
5. Discussion
The results of the present study demonstrate a significant exposure of both critical infrastructure and the residential population in correspondence of areas characterized by moderate to high liquefaction susceptibility. Although the assessment is based on a regional scale mapping of the susceptibility classification, which inherently carries limitations in terms of spatial resolution and local soil variability, the findings of the present research provide a valuable first-order indication of where liquefaction induced hazards may be most likely to occur. Such information is essential for guiding future detailed investigations and for supporting risk-informed planning and decision-making.
5.1. Exposure of Critical Infrastructure and Population to Liquefaction Susceptibility
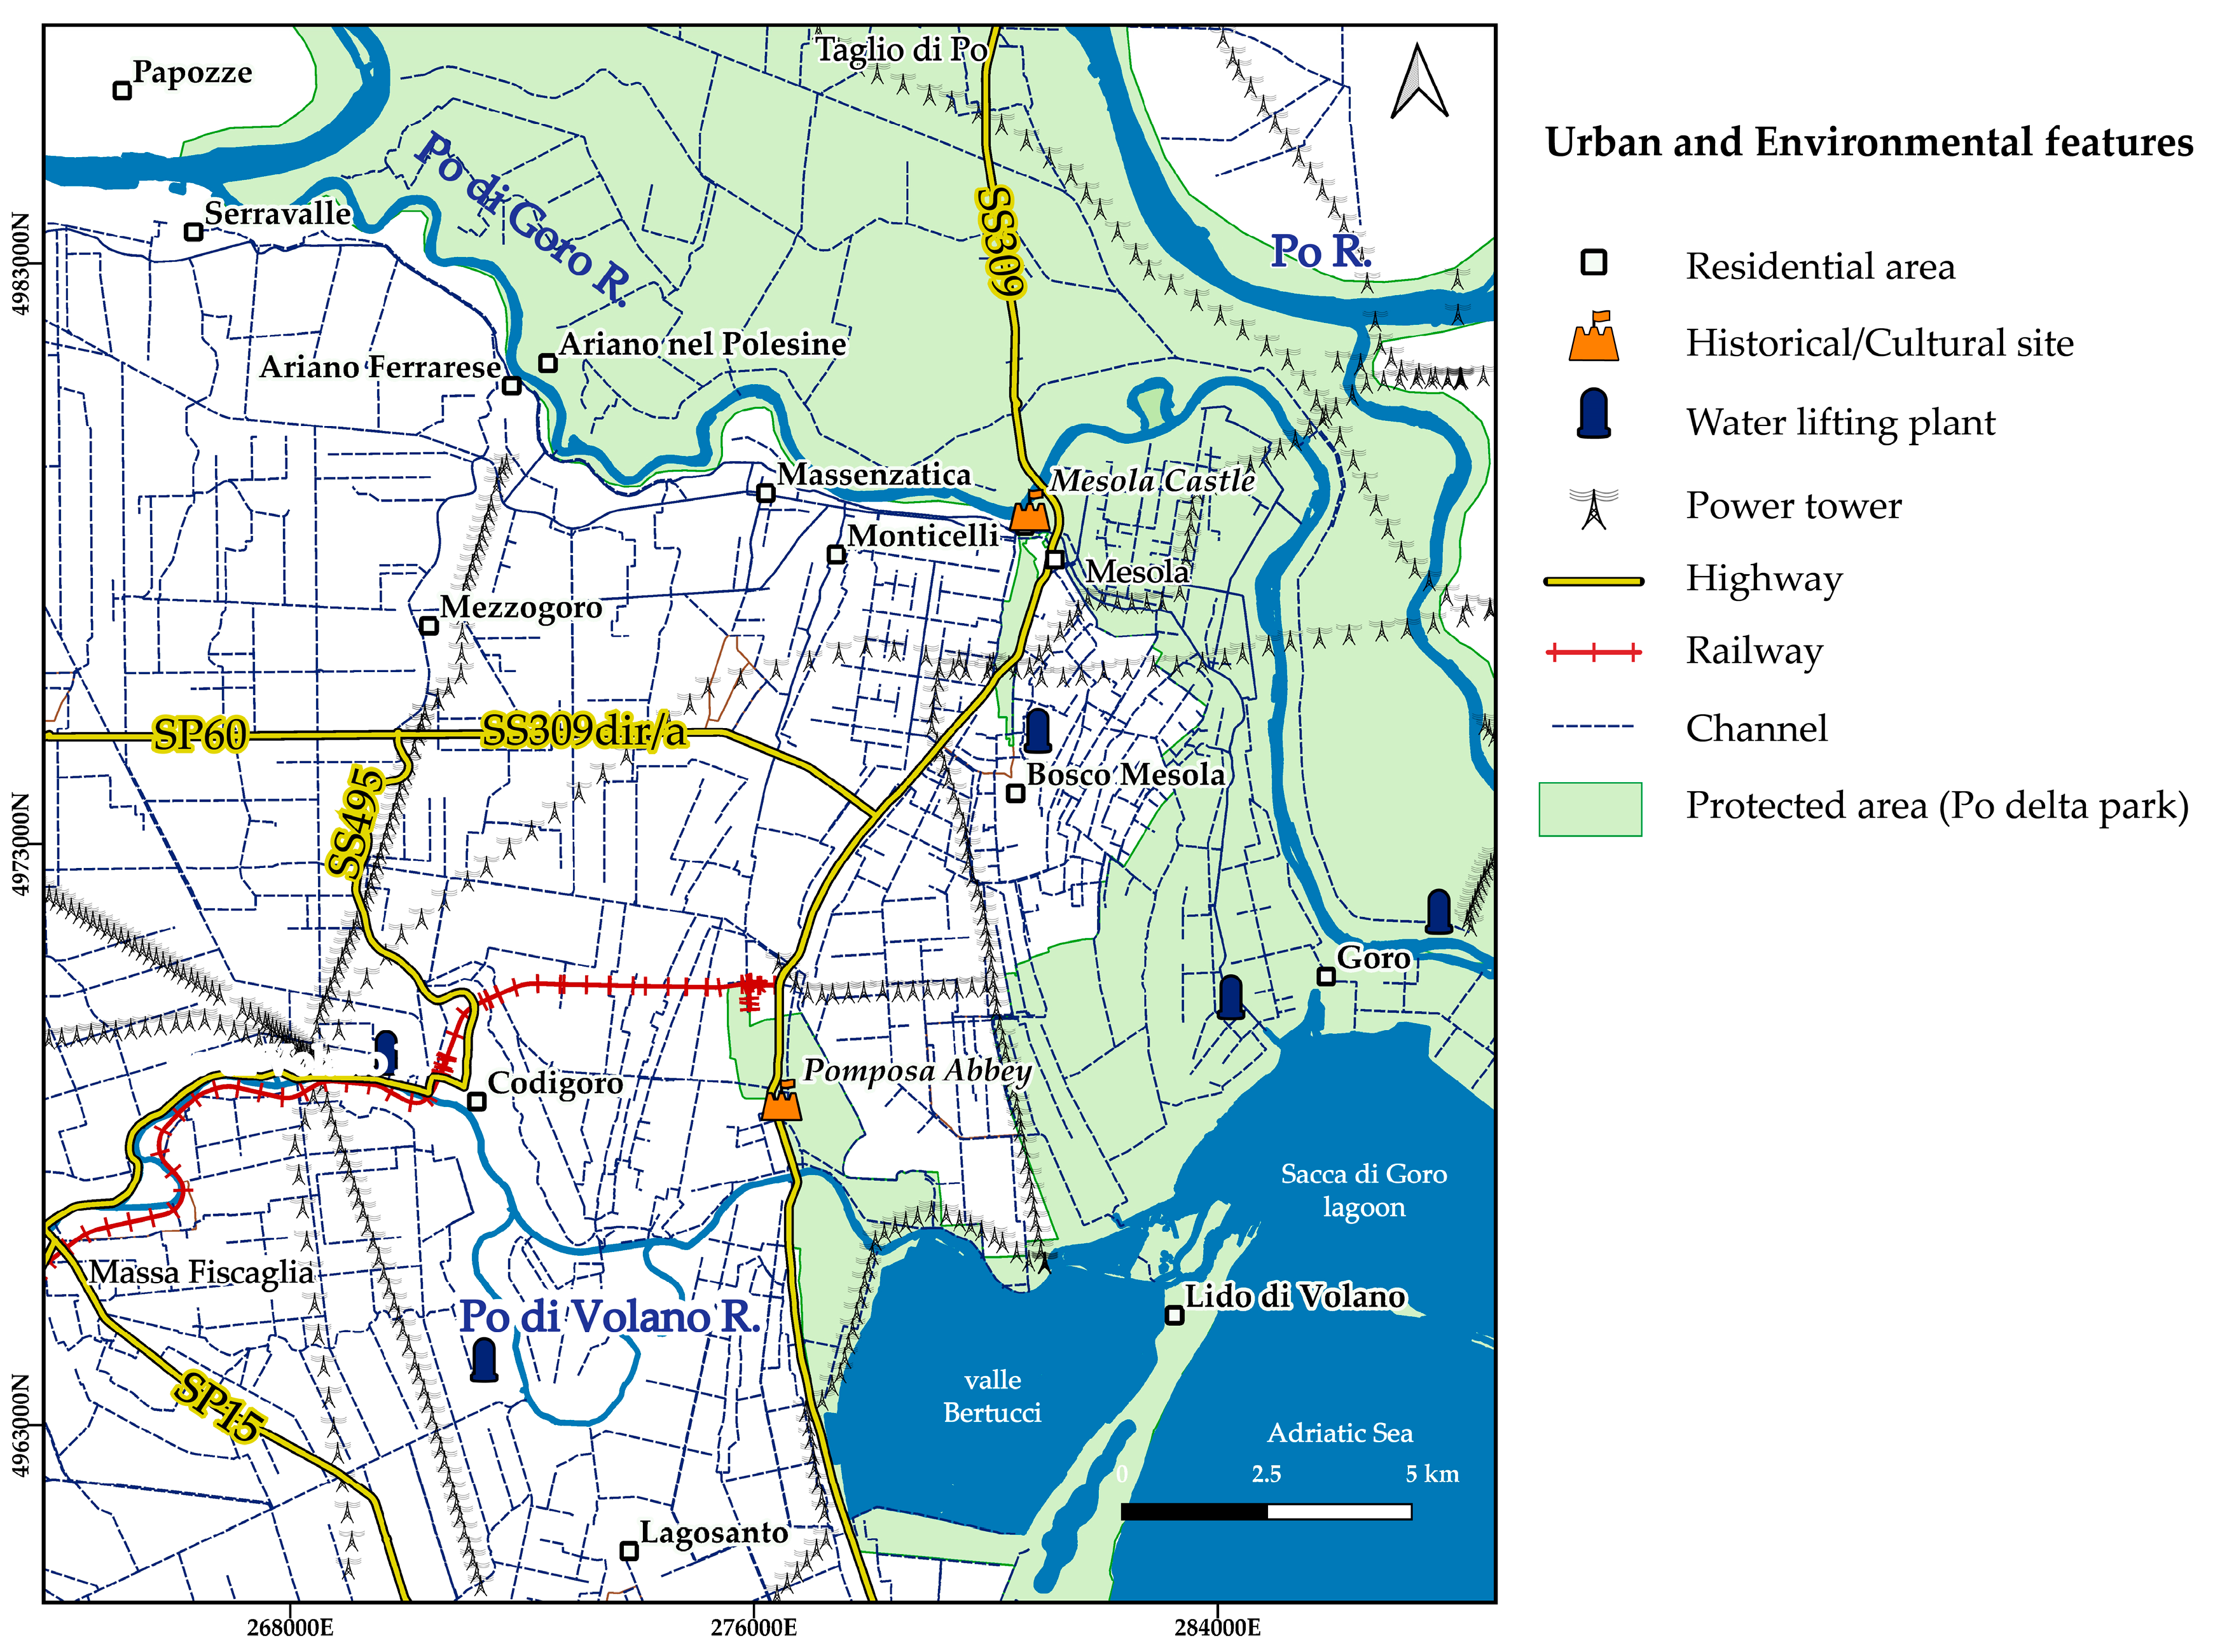
The integration of the liquefaction susceptibility map with infrastructure and demographic datasets (
Figure 8 and
Figure 11) reveals a significant exposure of the study area to potential liquefaction effects. Indeed, a large proportion of the community is potentially exposed to liquefaction hazard, which could exacerbate the impact of seismic events on housing, services, and public safety. Out of approximately 47,600 inhabitants within the study area, and assuming a uniform distribution of the population within the urbanized areas, more than 70% reside in zones characterized by moderate-to-high liquefaction susceptibility. Specifically, about 10% of the urbanized areas are located in high susceptibility zones (e.g., Lido di Volano and Massa Fiscaglia). Approximately 33% live in areas of high-to-moderate susceptibility (e.g., Bosco Mesola and Taglio di Po). In addition, 28% of the inhabitants are situated in areas characterized by moderate-to-high susceptibility, such as Serravalle and Mesola. Moreover, buildings of historical and cultural interest, such as the Mesola Castle and the Abbey of Pomposa (
Figure 1), are both located in areas characterized by high liquefaction susceptibility.
About 42% of the total length of the principal road network crossing the study area (SS309, SP16, and SR495) is located in areas characterized by high liquefaction susceptibility, whereas only 21% in sectors classified as non-susceptible. At this regard, liquefaction-induced settlement and/or lateral spreading could cause severe track misalignment, embankment failure, and prolonged service interruptions.
In particular, the road SS309 (Strada Romea), a major N–S transportation corridor connecting Ravenna to Venice, represents a strategic infrastructure with an average daily traffic volume of 149,486 vehicles (San Giuseppe di Comacchio monitoring station; Emilia-Romagna Region Transport Portal). Along this route, 37% of the path falls within areas of high liquefaction susceptibility, while the remaining 63% within areas of moderate susceptibility. Given its high traffic volume and national strategic role, even any minimal liquefaction-induced disruption along it could have a major impact for mobility and emergency response.
The railway network also exhibits a comparable level of exposure, with approximately 49% of the track alignment crossing areas of high liquefaction susceptibility, 27% within zones of moderate susceptibility, and only 24% in areas classified as non-susceptible. In addition, the railway stations of Massa Fiscaglia, Pomposa Zona Industriale, and Codigoro are located in areas classified as having high, moderate, and no susceptibility to liquefaction, respectively.
Within the investigated area, 31% of the irrigation channels has been excavated across zones of high liquefaction susceptibility, 29% in zones of moderate susceptibility, and the remaining 40% in non-susceptible areas. Most important, all four pumping stations (hydraulic lift facilities) necessary for continuously draining the investigated area are positioned in high liquefaction susceptibility zones.
Finally, the analysis of power transmission infrastructures indicates that 24% of the 475 power towers stand in zones of high liquefaction susceptibility, 16% in areas of moderate, and the remaining 60% in non-susceptible zones.
5.2. Liquefaction Potential and Geomorphological Features
An additional and important issue to be addressed in liquefaction hazard analyses is the degree of reliability and precision of the available information relative to the liquefaction potential. In particular, one question that is often posed is how representative for a wider area is the value of the
LPI, which is obtained at a specific site, and conversely which is the resolution of regional-scale maps obtained, for example, following the HAZUS [
73] approach? In the frame of the present research, investigating alluvial and deltaic environments commonly characterized by lateral and vertical lithological heterogeneities even in correspondence of apparently uniform geomorphic features, these questions are of utmost importance.
As it has been shown in
Section 4 (Results), the
LPI values obtained at sites included in the same surficial geological unit could also vary significantly. The difference between the mean
LPI value and the 50th percentile highlights the skewed distribution of the data, suggesting the influence of extreme values on the average and the greater representativeness of the median for describing typical liquefaction conditions. These conclusions represent a major outcome of the present study, indicating the importance of conducting in situ tests in several locations also within the same geomorphological unit in order to compute more realistically the distribution of the liquefaction potential.
Moreover, the obtained results confirm that the complementary use of liquefaction susceptibility maps produced at a regional scale and site-specific (i.e., very local scale) analyses represents a crucial approach for more properly assessing this kind of natural hazard. Indeed, the former source of information (i.e., regional scale map) delineates areas more or less prone to liquefaction on the basis surficial geological mapping and geomorphological analyses. The latter source of information (i.e., CPTu) is instead quantitative in estimating the liquefaction potential settlement (i.e., LPI) but limited to the sites where the in situ test is carried out.
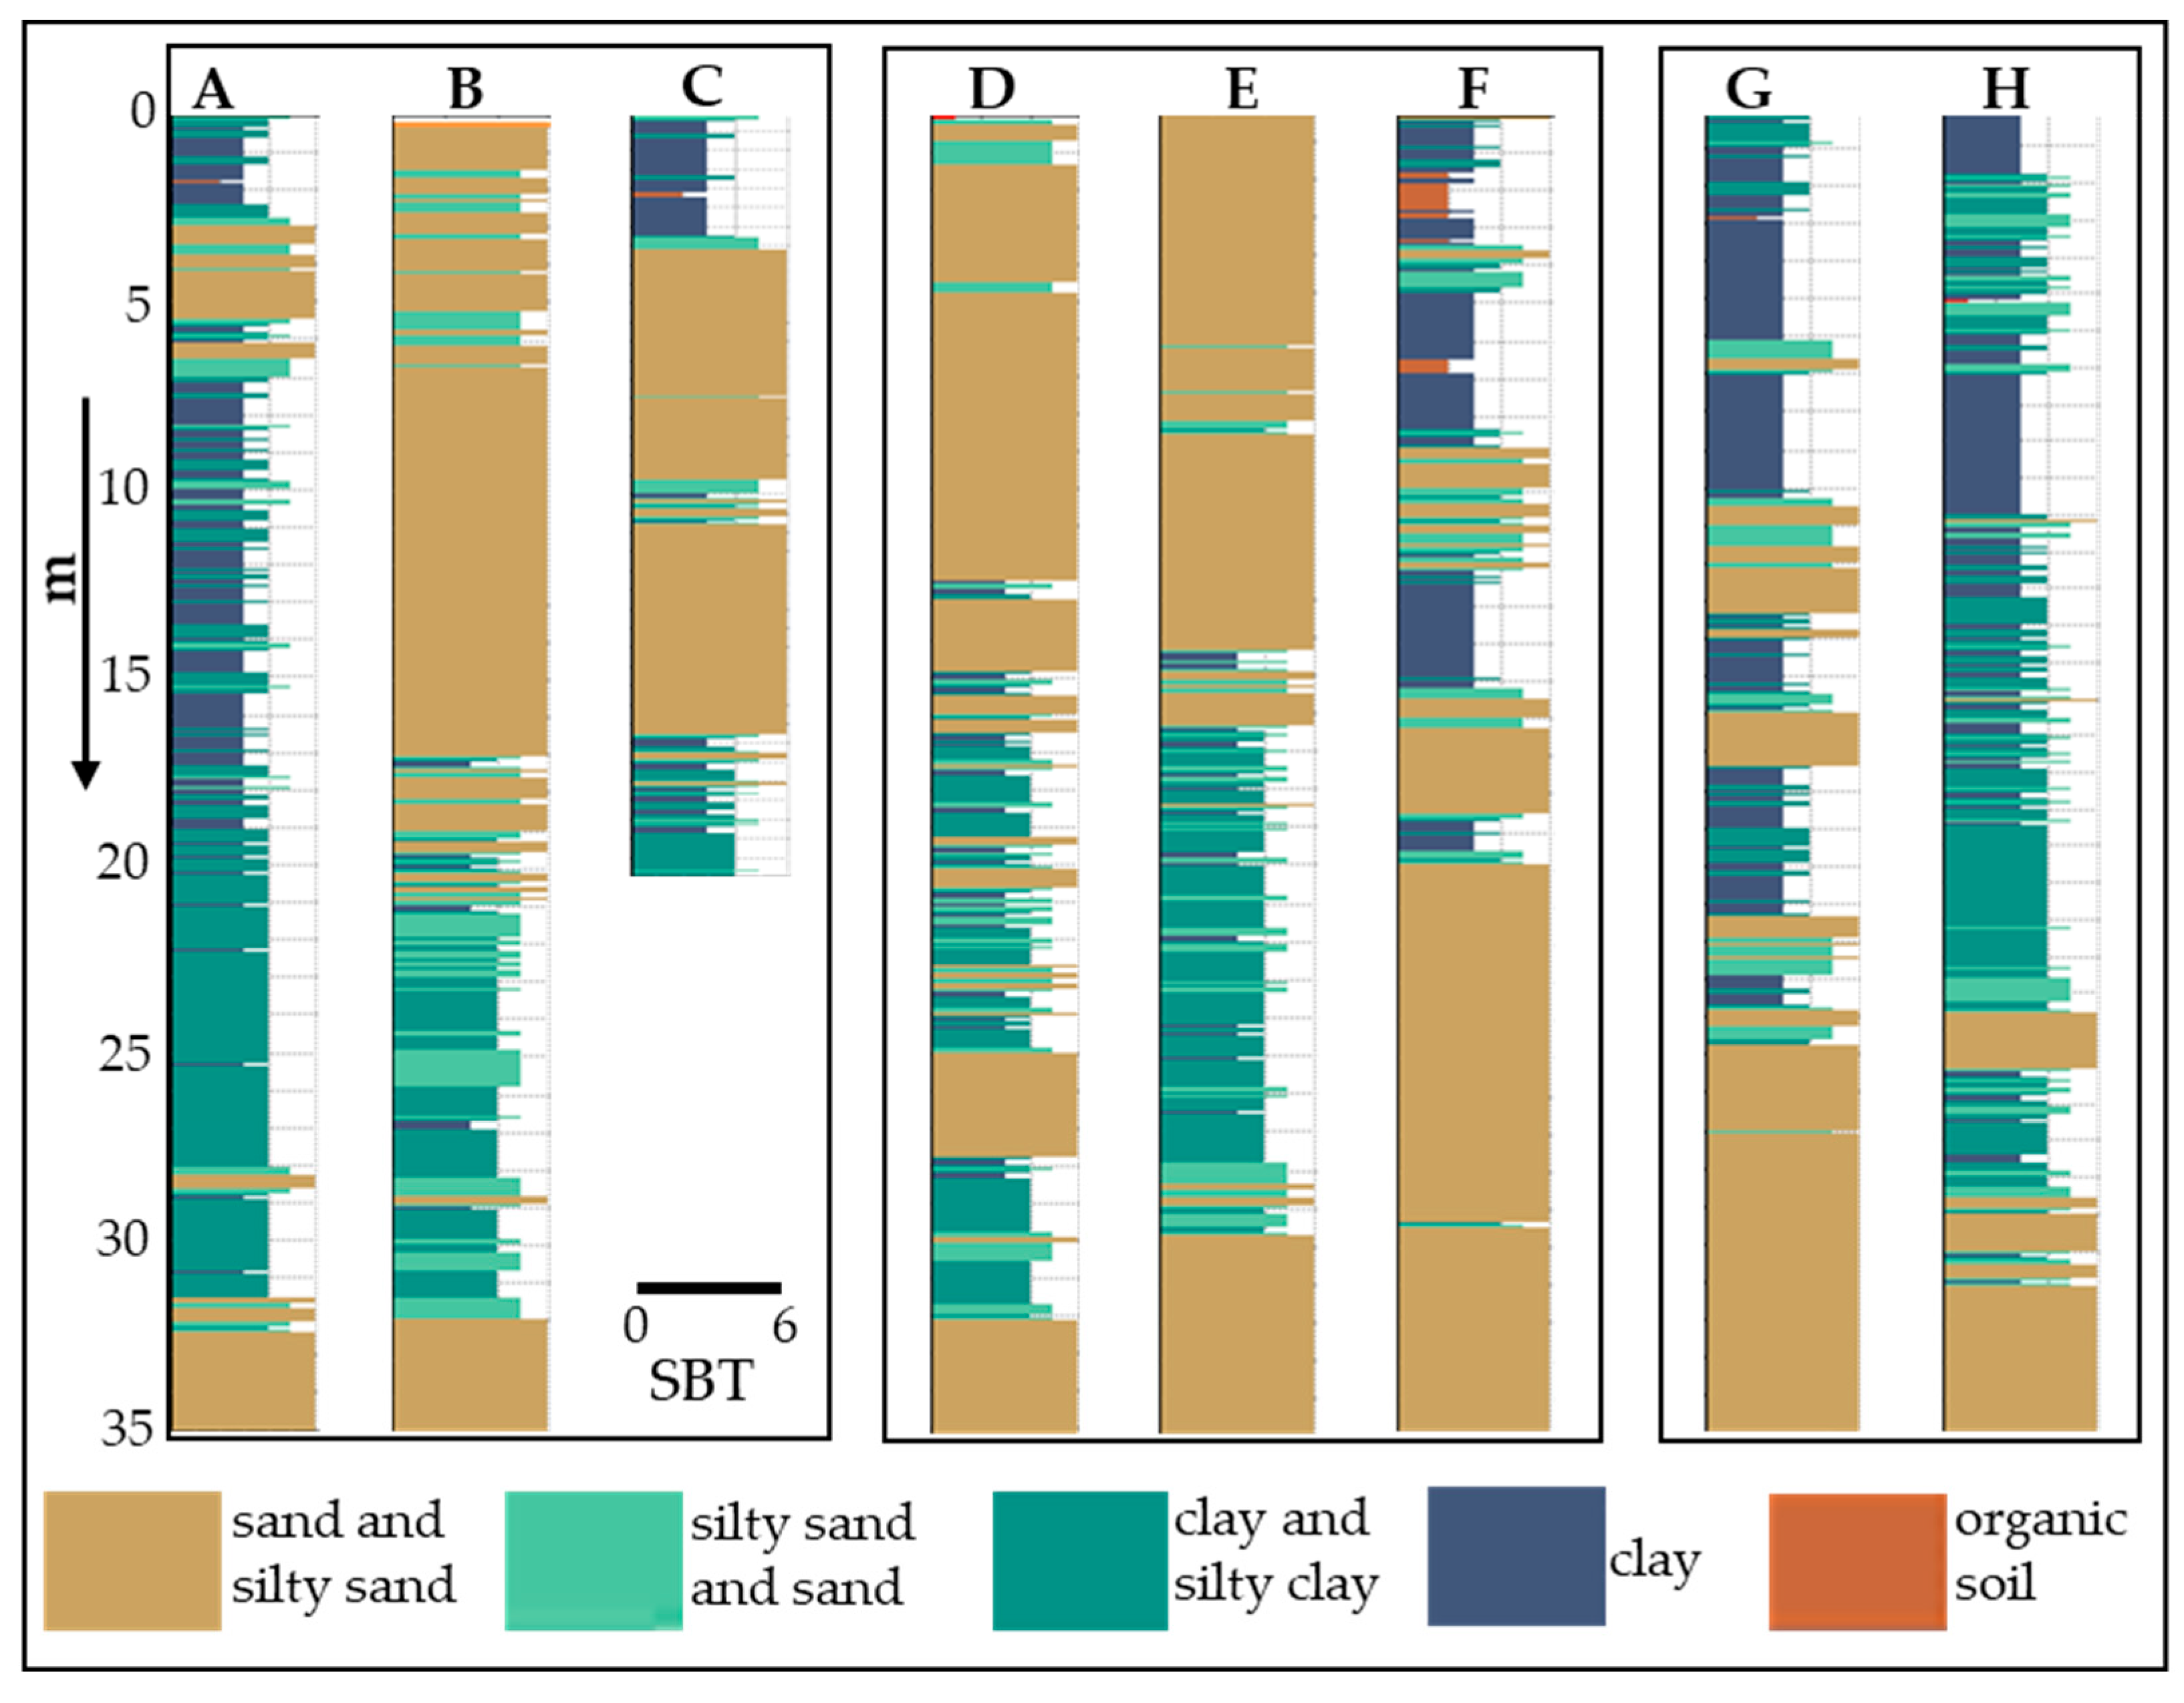
At this regard,
Figure 12 shows representative examples of lithological successions obtained from the analysis of CPTu data at sites classified as high (A, B, C), moderate (D, E, F) and non-susceptible (G, H) to liquefaction, respectively. It is worth noting that the lithological successions obtained from the penetrometric tests could largely vary within the same class of potential liquefaction or be similar at sites characterized by two different classes. For example, though the A, B, and C sites (
Figure 12) have been classified as high susceptibility to liquefaction, the corresponding CPTu have been performed in distinct mapped units, namely the floodplain deposits
f2, the coastal dunes
c1 and the abandoned channels
a2, respectively.
In particular, though the behavior at the three sites is expected to be similar relative to soil liquefaction, the subsoil stratigraphies significantly differ: the floodplain deposits f2 are characterized by highly stratified soil layers dominated by finer material (i.e., silt and clay), the coastal dunes c1 subsoil stratigraphy is characterized by a major sandy layer alternating with thin (less than 1 m-thick) silty material, while the abandoned channel a2 site is characterized by a surficial clay-like material (up to a depth of 3 m) that overlays a thick sandy level.
In principle, solely based on the penetrometric data provided by in situ tests, floodplain deposits f2 should be not capable of inducing severe liquefaction. However, the occurrence of sand-silty sand and relatively thin layers at shallow depth may possibly generate small-size liquefaction phenomena. Accordingly, considering this geological setting and depositional unit as highly susceptible to liquefaction represents a conservative scenario.
Relative to the geological units classified as moderate susceptibility to liquefaction (
Figure 12), we selected three subsoil stratigraphic logs (D, E, F) representative of the beach barriers
c2, the coastal dunes/beach ridges
c1, and the abandoned channels
a3. As expected, in correspondence of the beach barriers and ridges (units
c1 and
c2) most of the shallow (up to 10–15 m) sedimentary succession is represented by sand with only a few thin layers of silty sand, like the one encountered in the same unit but classified as high susceptibility (B). On the other hand, the geomorphological feature of abandoned channels (F) is highly stratified showing clay and silty layers of less than 1 m-thick at the surface covering coarser layers. According to Hutabarat and Bray [
80], this highly stratified succession is not expected to produce large amount of ejecta and consequently the classification of these deposits as moderate susceptible to liquefaction may be considered quite conservative. Nevertheless, the contradiction between the site classification obtained on the basis of a regional-scale approach and the site-specific scale results obtained from penetrometric tests confirms the need for the urban environments of conducting in situ tests for more properly and accurately evaluating the liquefaction potential.
Finally, regarding the deposits classified as non-susceptible to liquefaction (
Figure 12), the local-scale information derived from CPTu data agrees with the characterization at the regional scale. As can be seen in logs G and H (
Figure 12), both units (marshes
m and brackish marshes and lagoons
sm) mainly consist of clay-rich soils dominated also at shallow depth by clay layers. Typically, these soils are considered non-susceptible to liquefaction either at the regional and site-specific scales. In this case, the detailed subsoil stratigraphy obtained from the penetrometric tests confirms the classification on regional scale. However, the outliers of
LPI values described in the Results section, suggest that cases of high liquefaction potential could not be excluded.
This contradiction may be due to the 1:50,000 mapping scale compared to the 1:500 local scale and/or to the specific laterally variable depositional conditions being not feasible distinguishing them on a regional-scale map. In order to overcome this issue, it is suggested to perform a few randomly distributed in situ tests to verify or update the outcome of a regional-scale approach, which in turn provides a general view of the liquefaction hazard distribution. Adopting a transect-based reporting framework, in which CPTu-derived
LPI values are presented along systematic profiles rather than as scattered point estimates within unit polygons, would also bring the present approach closer to recent best practice in multi-decadal coastal-vulnerability work [
81,
82] and would make the regional-to-local handoff more transparent for non-specialist users of the map.
6. Conclusions
Liquefaction during earthquakes is strongly influenced by the depositional history, including sediment type, age, shallow layering, and groundwater depth. Holocene, unconsolidated sediments, particularly in (palaeo-)channels and coastal point bars, are more susceptible than other deposits.
The accuracy of susceptibility maps depends on the scale of investigation and the quality and density of geological, geomorphological, and hydrogeological data. This research focuses on a 560 km2 area in the eastern sector of the Po River Plain (northern Italy), encompassing part of the modern Po Delta, to assess the liquefaction susceptibility of local geological units. A comprehensive dataset was used, including lithological, chronological (14C), geomorphological, hydrological, and hydrogeological information, as well as satellite imagery, historical and modern maps, archaeological evidence, and subsurface data from core drilling and penetrometer tests. The integrated data analysis allowed to define the liquefaction susceptibility map at the regional scale following the HAZUS approach and distinguishing the outcropping units into four classes, corresponding to the following susceptibility levels:
- (a)
very high, in the portion of the territory occupied by the floodplain of the principal reach of the Po channel, which accounts for 4% of the area;
- (b)
high, corresponding to 26% of the area, characterizing geological formations such as floodplains, channels, crevasse splays, abandoned channels, and coastal dunes;
- (c)
moderate, covering approximately 20% of the territory, mainly in correspondence of beach barrier deposits;
- (d)
non-susceptible to liquefaction, representing 50% of the territory, including marshes of interdistributary areas and brackish marshes and lagoons of the front delta plain, dominated by clays, silty clays, and silts.
In parallel, CPTu data collected across different lithological units have been statistically analyzed (see
Section 4.3) in terms of Liquefaction Potential Index (
LPI). A detailed analysis of the
LPI values for sites classified as high, moderate, and low susceptibility, under three groundwater table scenarios (0.5, 1.5, and 3.0 m), generally indicates a decrease in
LPI with increasing groundwater depth, an increase of the
LPI with increasing susceptibility classes (from non-susceptible to high susceptibility), but also a significant variability within the same surficial geological unit due to vertical and lateral heterogeneity.
Discrepancies between regional-scale susceptibility maps and site-specific investigations highlight the importance of integrating both approaches to accurately assess liquefaction risk and guide mitigation strategies.
Furthermore, the analysis shows that critical infrastructure and residential populations within the study area are substantially exposed to zones of moderate to high liquefaction susceptibility. Although regional-scale mapping has inherent limitations in spatial resolution and soil variability, it provides a valuable first-order assessment for identifying areas most likely affected by liquefaction, supporting future detailed investigations and risk-informed planning.
Finally, this study aims to contribute to the understanding of liquefaction susceptibility in urbanized areas characterized by complex depositional environments—specifically alluvial and deltaic plains—and the presence of aquifers with water table fluctuations ranging from 0.5 to 3.0 m below ground level.