


Abstract
Assessing the contribution of tropical cyclones to regional precipitation variability is essential for understanding the associated hydrometeorological benefits and risks. This study quantifies the contribution of tropical cyclones to annual precipitation in the northernmost part of South America from 2016 to 2025, utilizing data from surface rain gauges. Simulations using the Weather Research and Forecasting (WRF) model, configured with 2 km grid spacing and 38 vertical levels, estimate the influence of relative humidity at 850 hPa and ambient temperature at 500 hPa on precipitation over the continental region when each convective system is nearest to the coastline. During Hurricanes Matthew (2016) and Melissa (2025), contributions to the annual average precipitation reached 51% and 47%, respectively, with the highest values observed near the northern South American coastline. The contributions of Harvey (2017), Iota (2020), Julia (2022), and Beryl (2024) to annual precipitation were 0–26%, 0–18%, 0–12%, and 0–19%, respectively. Precipitation distribution was heterogeneous during the passage of tropical storms. The extent of accumulated precipitation was influenced by the cyclone’s trajectory and proximity to mountainous regions. Patterns of relative humidity at 850 hPa did not correspond to a uniform precipitation distribution. Between 6% and 30% of rain gauges did not record precipitation during the analyzed tropical cyclone events. These findings highlight that tropical cyclone-induced precipitation is strongly influenced by complex interactions between atmospheric dynamics and topography. Future research should assess the contributions of these systems to groundwater and surface reservoirs that support indigenous communities in rural areas.
1. Introduction
Globally, torrential rainfall from tropical cyclones (TCs) and the resulting floods contribute significantly to fatalities and economic losses associated with these storms [1]. For example, Typhoon Morakot made landfall in Taiwan in August 2009, producing cumulative rainfall of up to 2777 mm over three days, resulting in widespread flooding and 673 fatalities [2]. Similarly, Hurricane Maria (2017) produced rainfall exceeding 900 mm in Puerto Rico, resulting in extensive flooding and more than 40,000 landslides [3]. In certain regions, TCs account for up to 50% of extreme flooding events, highlighting their substantial impact [4]. Despite these hazards, rainfall from TCs can also provide benefits by serving as a critical freshwater source. Studies indicate that water levels in dams and reservoirs can rise by several meters within hours during such events [5]. Additionally, Guaraglia et al. [6] report that these systems facilitate significant aquifer recharge through runoff, raising the water table by more than 10 m. The magnitude and frequency of these impacts are influenced not only by the intensity of oceanic heatwaves but also by large-scale environmental conditions that affect their distribution and the occurrence of extreme events [7]. In the Atlantic basin, TC formation and intensification depend on favorable thermodynamic and dynamic conditions. Key factors include sea-level pressure anomalies and elevated sea surface temperatures, which promote air ascent, enhance convection, and supply the energy required for cyclonic development [8]. Low vertical wind shear further enables the organization and persistence of these systems, supporting their intensification. On a broader scale, climate variability patterns such as the Atlantic Multidecadal Mode (AMM), the El Niño–Southern Oscillation (ENSO), and the North Atlantic Oscillation (NAO) modulate these processes by altering thermal and humidity conditions in the region. The negative phase of the NAO, in particular, favors warmer conditions in the tropical Atlantic [9,10].
Various studies have quantified TCs’ contribution to precipitation across the tropical Atlantic. In the North Atlantic basin, TCs account for about 4% of total precipitation. In coastal regions such as the southeastern United States, this contribution ranges from 10% to 25% of annual precipitation [11]. More recent studies indicate that TCs may account for 20% to 30% of maximum annual precipitation in this area [12]. In Central America and Mexico, the impact is greater. Between July and October, TCs contribute 10% to 30% of precipitation on Mexico’s western and eastern coasts and 40% to 60% of daily extreme precipitation [13]. In the Caribbean, Fernández-Alvarez et al. [14] found that TCs account for 18% to 28% of seasonal precipitation in Cuba, suggesting a similar pattern across the region. Hernández Ayala and Matyas [15] report that in Puerto Rico, TCs contribute between 20% in August and 30% in September. These studies demonstrate the significant role of TCs in regional precipitation regimes; however, their contribution in northern South America remains less clearly constrained, particularly at the annual scale and in relation to spatial patterns.
Recent years have seen notable changes in precipitation patterns across parts of northern South America [16]. While multiple mechanisms have been proposed to explain this variability, the precise cause remains undetermined. It is well established that TCs contribute substantially to precipitation in northern South America [17,18]. TCs are low-pressure systems that form in tropical regions over extensive oceanic areas, where sea surface temperatures exceed 27 °C and vorticity conditions are favorable [19]. These systems are major contributors to extreme precipitation globally, often resulting in catastrophic floods and landslides that cause significant socioeconomic losses [20]. Although TCs form in the Atlantic basin, their distribution and impacts vary by region, influenced by prevailing oceanic and atmospheric conditions [21]. In northern South America, these events are especially significant due to widespread poverty, limited health infrastructure, and food security challenges. The region’s location at the southernmost tip of the Atlantic basin means most cyclonic tracks move northwest, reducing the likelihood of direct impacts. Additionally, northern South America experiences higher vertical wind shear than other Atlantic regions [22]. High wind shear disrupts the vertical structure of TCs, hindering their formation and intensification [23]. However, studies and technical reports show that even without direct impacts, the presence or proximity of TCs can significantly increase rainfall in the region. During hurricane season, rainfall increases of 25 to 75 mm above the monthly average and positive anomalies of nearly 20% have been documented in northern South America, particularly in Colombia [24]. These conditions increase the risk of extreme hydrometeorological events. While many cyclones passing through the Caribbean do not make landfall in northern South America, they still cause impacts, including increased rainfall, higher wave activity, and changes in atmospheric conditions, especially in coastal areas. This indicates that TC-related precipitation in the region cannot be fully characterized using approaches based solely on direct landfall or simple proximity thresholds.
Although previous studies have examined precipitation patterns across various regions of South America, few have directly assessed the relationship between these patterns and TC influence. Specifically, limited research quantifies the contribution of TCs to annual precipitation variability, deviations from historical precipitation averages, and the factors influencing precipitation intensity. Moreover, the magnitude and spatial structure of these contributions remain insufficiently characterized. Improved understanding of the ocean-atmosphere conditions generated by cyclone passage and their effects on precipitation supports risk scenario anticipation, enhances decision-making by national and regional authorities, and facilitates the development of early warning monitoring systems. Therefore, this study quantifies the contribution of tropical cyclones to annual precipitation in northern South America and analyzes the factors controlling their spatial distribution. This study analyzes rainfall records from rain gauges in northern South America during six TCs occurring between 2016 and 2025. Additionally, simulations using the Weather Research and Forecasting (WRF) model were conducted to assess the influence of TCs on hydrometeorological variables that determine precipitation intensity in relation to topography. The contribution of each cyclone to annual precipitation, changes in relative precipitation compared with historical levels, and factors affecting precipitation in the region were estimated, with consideration of TC proximity. By combining observational data with high-resolution modeling, this study provides a more robust characterization of TC-induced precipitation in northern South America. Analyzing rainfall associated with TCs in northern South America is particularly relevant given recurring droughts year-round and severe flooding during the rainy season. Enhanced understanding of TC impacts supports informed decision-making and improved preparedness in risk management.
2. Materials and Methods
2.1. Study Area
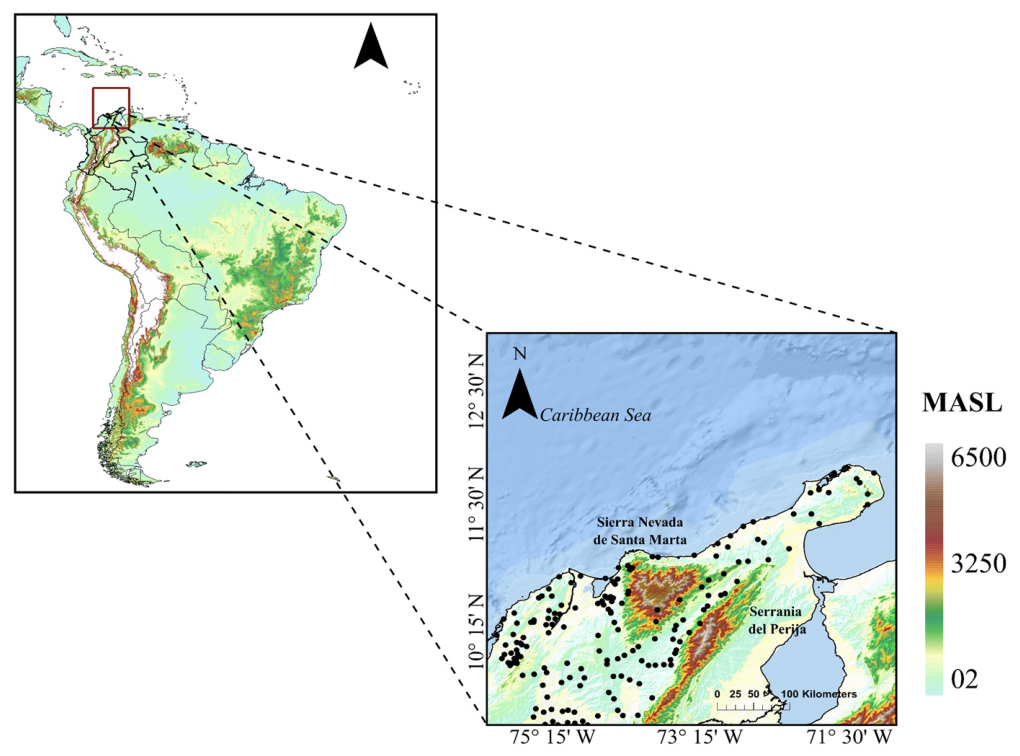
The study area encompasses the northernmost part of South America. Although Venezuela is included in this region, the analysis centers on areas of Colombia because data from rain gauge stations at 9.25–13.52° N and 75.54–70.79° W are available. The region is characterized by extensive plains, complex topography, and a dynamic ocean-land system. Climate conditions range from tropical in low-altitude areas to temperate and cold climates in mountainous regions (Figure 1). These varied climates, resulting from the region’s diverse topography, create both ecological richness and climate-related challenges.
Figure 1.
Map of northern South America with topography. Black dots indicate rain gauge locations used to analyze rainfall variability from six tropical cyclones.
The region faces significant climate change challenges, including vulnerability to prolonged droughts, desertification in certain areas, and rising sea levels that threaten coastal zones. Within the study area, the Serranía del Perijá lies to the east, while the Sierra Nevada de Santa Marta lies to the west. The Serranía del Perijá extends from the eastern branch of the Andes Mountains, terminating in the northern part of the Guajira Desert and reaching an elevation of 3630 m above sea level. The Sierra Nevada de Santa Marta is among the highest coastal mountain ranges globally, with an approximate elevation of 5700 m, and is situated just 42 km from the Caribbean coast.
Data
The International Best Track Archive for Climate Stewardship (IBTrACS; https://coast.noaa.gov/hurricanes; accessed on 15 March 2026), maintained by the National Climatic Data Center, was used to identify TC tracks that passed within 500 km of the northernmost part of South America. Table 1 presents the number and characteristics of the TCs included in this study.
Table 1.
Key characteristics of selected TCs (2016–2025) used to assess their impact on precipitation variability in the study area. Peak Category is the highest Saffir–Simpson category attained during the cyclone’s lifetime, whereas Intensity in Domain represents the cyclone’s intensity within the study area.
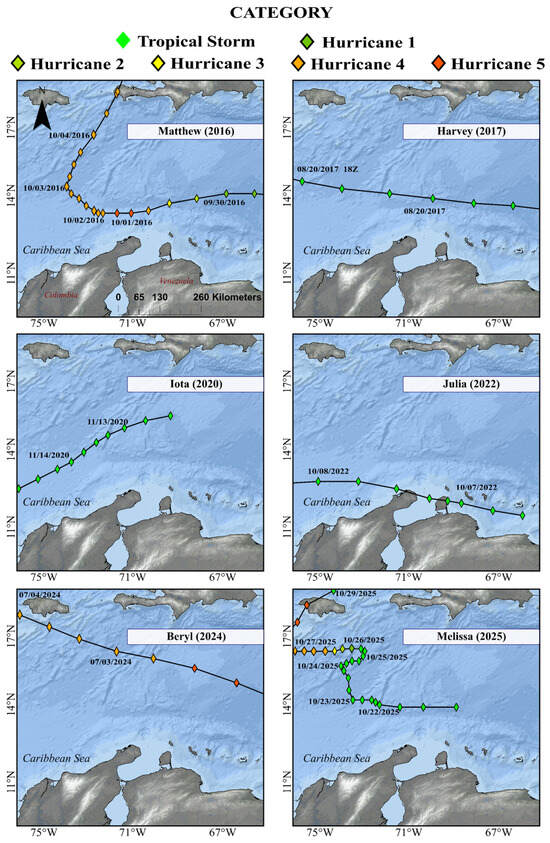
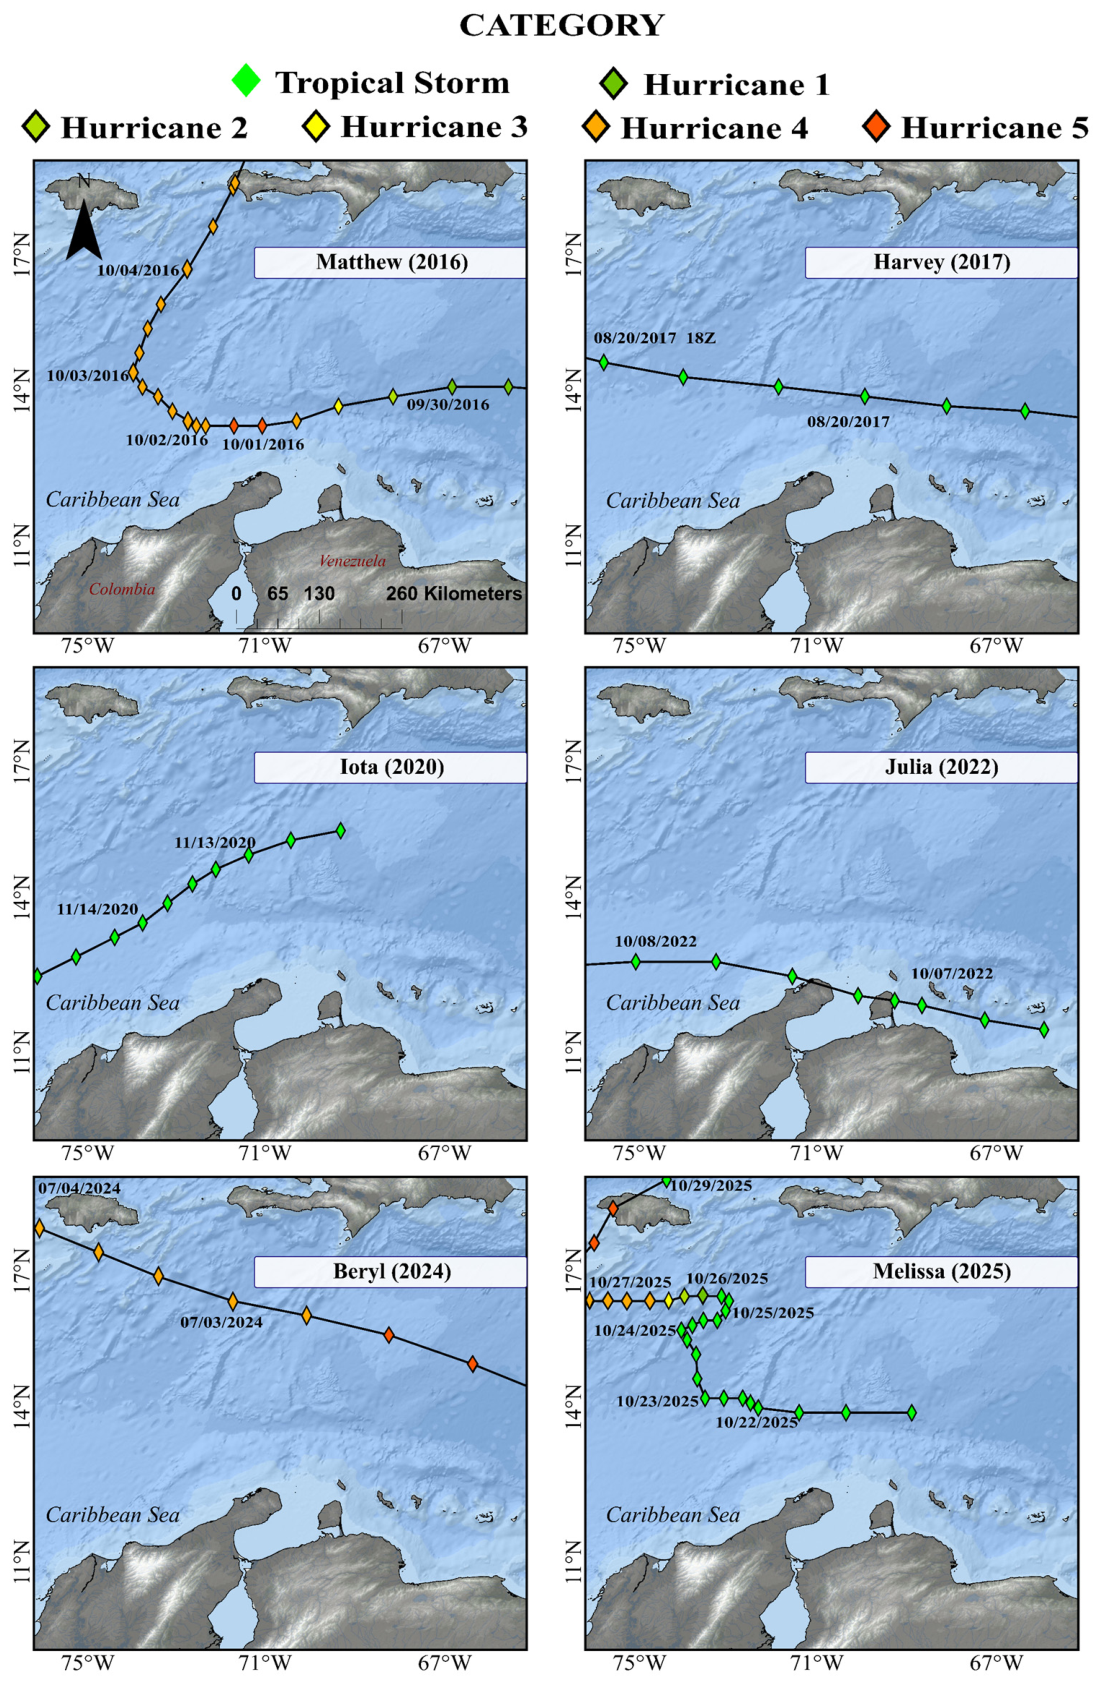
As they moved across northern South America, the cyclones displayed varied movement patterns, including straight-line tracks, turns, and quasi-stationary events (Figure 2). Hurricane Matthew followed a complex path, initially moving west before turning north near 14° N. In contrast, Tropical Storm Harvey maintained a nearly zonal path with minimal directional change and a shorter duration. TC Iota moved from northeast to southwest. Tropical Storm Julia approached closest to the northern coast, with a slight curve and several points near the continent. Hurricane Beryl traveled northwest for a long distance, while Hurricane Melissa, which remained a tropical storm for 4 days, exhibited a highly erratic, quasi-stationary path with loops and abrupt changes in direction.
Figure 2.
Tracks of six tropical cyclones used to analyze the variability of precipitation over Northern South America. The tracks are used to assess the spatial and temporal distribution of precipitation associated with each event over Northern South America.
Daily precipitation records were obtained from the rain gauge network of the Institute of Hydrology, Meteorology, and Environmental Studies (IDEAM, acronym in Spanish) in Colombia. To ensure that the information provided is accurate and unbiased, a quality control check of the precipitation data was conducted, focusing on the detection of occurrence errors and quantitative errors. The availability of precipitation data for each TC event was 209, 220, 204, 198, 94, and 144 for Matthew (2016), Harvey (2017), Iota (2020), Julia (2022), Beryl (2024), and Melissa (2025), respectively. To ensure a correct analysis, the records from the rain gauges studied had to contain at least 80% of daily precipitation data from 1980 to 2015. Additionally, precipitation data had to be available during the cyclone active period, defined as the interval when the TC was located within a 500 km radius of the study region. Rain gauges were classified according to elevation as low-elevation (LE: <80 m), mid-elevation (ME: 80–400 m), and high-elevation (HE: >400 m). This classification is informed by the presence of plains, hills, mountain ranges, and highlands within the study area, which can be divided into three categories based on elevation above sea level. The first category includes arid and dry regions, predominantly located at elevations between 70 and 80 m above sea level. The second category includes areas exhibiting a transition from dry to subhumid vegetation, which is closely linked to precipitation patterns and occurs at average altitudes between 80 and 400 m above sea level. The third category consists of regions with complex topography and a humid temperate climate, with elevations ranging from 400 m to approximately 5600 m.
Rainfall from tropical storms was defined at each rain gauge in the dataset. The precipitation field of a TC, a rotating storm system with a low-pressure center, can be axisymmetric and evenly distributed around the center under ideal conditions. However, in practice, it often shows significant asymmetry. Causes include vertical wind shear, translational motion, and environmental interactions [25]. Many studies use a distance-based criterion to attribute precipitation to a TC at a given location. They often use a radial threshold of 200 to 500 km from the cyclone’s center. If the TC center is within 500 km of a rain gauge for a day, all precipitation that day is attributed to the cyclone. However, a fixed radial threshold introduces spatial truncation error, potentially excluding precipitation physically linked to the cyclone, especially rainfall from moisture convergence and vertical ascent beyond the threshold. Also, the cyclone’s lowest-pressure region is not always where the heaviest rain falls. These areas may be displaced because of the system’s asymmetrical structure. TCs can also influence environmental conditions to promote rainfall, especially over complex topography. It makes it challenging to attribute rainfall solely to distance from the center. Ng et al. [26] found that point-based rainfall from tropical storms can reach up to 650 km from the system’s center. Based on this, the study included precipitation recorded at rain gauges within 500 km of TCs’ centers. The analysis period included three days before and three days after the cyclone remained within a 500 km radius in order to account for precursor and residual atmospheric effects. To assess the impact of TC rainfall, daily precipitation for each event was standardized relative to the 1980–2015 climatology by subtracting the climatological daily mean for each calendar day and dividing by the corresponding historical daily standard deviation. Event-level anomalies were then calculated by averaging these standardized values over the defined active period.
2.2. Model Configuration
The Weather Research and Forecasting (WRF) model was employed to simulate six TCs over a 109 × 109 grid with 2 km grid spacing and 38 vertical levels. These simulations aimed to identify hydrometeorological variables that may influence surface precipitation within the domain. The WRF model is a mesoscale forecast and data assimilation system designed to enhance the understanding and prediction of mesoscale weather and to facilitate the application of research findings [27,28]. Initial and boundary conditions for the simulations were derived from the ERA5 dataset provided by the European Center for Medium-Range Weather Forecasts (ECMWF) at a 0.25° × 0.25° grid resolution. Each event simulation included a 48 h spin-up period. For physical parameterizations, the WSM 5-class scheme was applied for microphysics, and both longwave and shortwave radiation were represented using the RRTM scheme [29,30]. Cumulus convection was parameterized with the Betts–Miller–Janjic (BMJ) scheme [31]. Surface layer processes were represented using the Monin–Obukhov similarity theory (Janjic Eta formulation), and the planetary boundary layer was parameterized with the MYJ scheme [31,32]. Land surface processes were simulated using the Unified Noah land surface model [33]. We assessed the WRF model’s performance by comparing its precipitation estimates for each event with the accumulated precipitation measured by each rain gauge, using multiple statistical metrics (Appendix A).
2.3. Generalized Additive Model (GAM)
GAMs are widely applied in environmental studies and hydrology [34,35]. This statistical approach was employed to identify the factors influencing precipitation as recorded by rain gauges. A GAM is represented by Equation (1).
The terms are smooth, nonparametric functions that characterize the relationship between each predictor and the response variable [36]. On the other hand, is the intercept of the model. To address potential nonlinear associations among factors affecting precipitation, the following variables were included: minimum distance (the shortest distance between the station and the track), nearby wind (wind speed at the nearest point), nearby pressure (atmospheric pressure at the center of the TC at the nearest point), and the altitude of each rain gauge. The minimum distance to the nearest point along the TCs’ path was calculated using the Haversine formula, which estimates the geodesic distance between two locations on the Earth’s surface [37]. Spatial autocorrelation of the residuals was evaluated using Moran’s I index, with a spatial weight matrix constructed from the k nearest neighbors [38]. When significant autocorrelation was identified (p < 0.05), models incorporating spatial structure were applied using two-dimensional smoothing of the geographic coordinates. This approach accounted for spatial dependence and yielded robust estimates of the effects of the explanatory variables on precipitation [39].
3. Results
3.1. Contribution of TC to Annual Precipitation
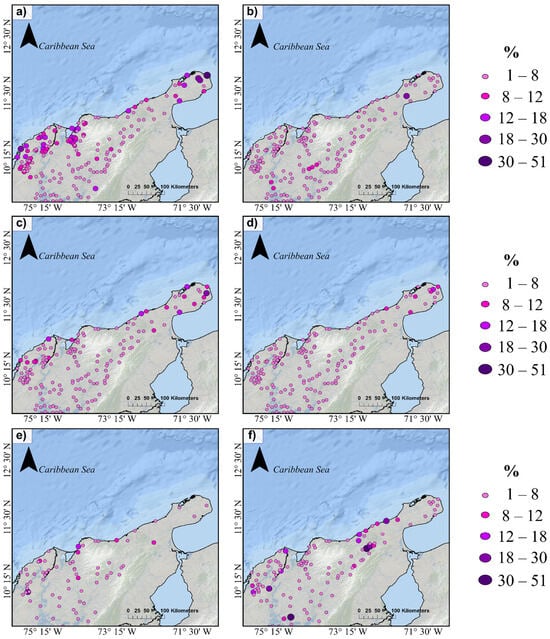
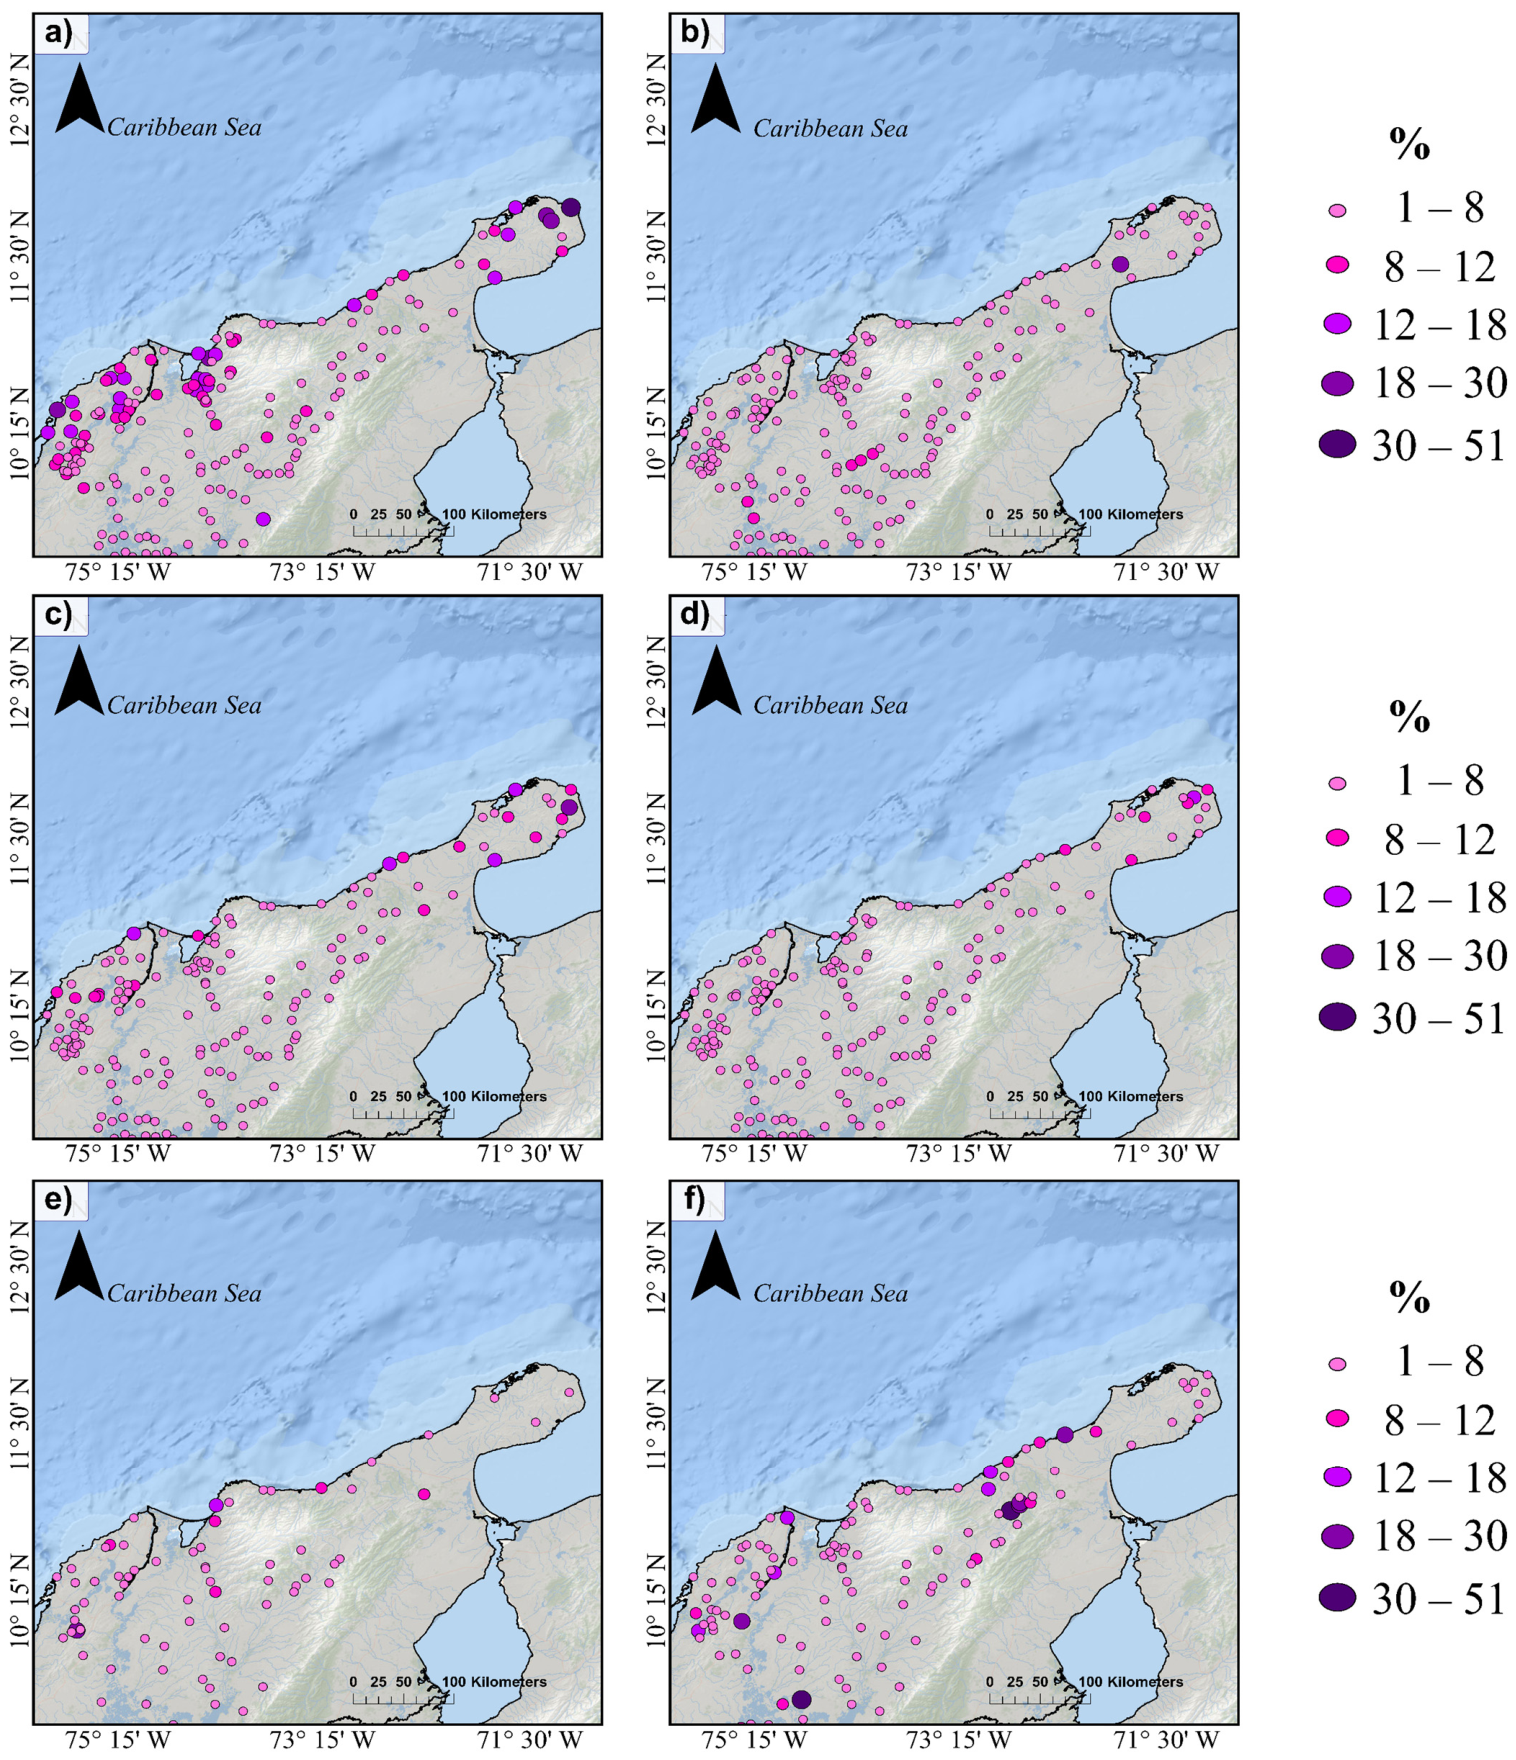
Figure 3 shows the spatial patterns of TC-induced precipitation over Northern South America. It is estimated that Hurricane Matthew contributed 0–51% (6 ± 7%), 0–26% (4 ± 5%), and 1–12% (5 ± 3%) to annual precipitation at low-elevation, mid-elevation, and high-elevation rain gauges, respectively. During this event, low-elevation areas received higher, though uneven, precipitation relative to the annual total. At some rain gauges, the hurricane accounted for up to 50% of annual rainfall. Matthew did not affect all locations; 7% of rain gauges recorded no rainfall. About 18% of gauges measured less than 10% of the annual total during Matthew, while 2% recorded more than 20%. Rain gauges positioned near the coastline and downwind of the Sierra Nevada de Santa Marta record the highest rainfall amounts (Figure 3a). On the other hand, Tropical Storm Harvey contributed to annual rainfall totals of 0–9%, 0–26%, and 0–3% at low-, mid-, and high-elevation rain gauges, respectively. During its passage, not all stations recorded associated rainfall; 21% of the rainfall records during Tropical Storm Harvey are null. Furthermore, in mid-elevation areas, only one rain gauge accounted for 10% of the annual precipitation total. Spatially, there are no highly localized precipitation hotspots associated with convective bands and local topographic effects (Figure 3b).
Figure 3.
Spatial patterns of TC-induced precipitation over Northern South America. Panels (a–f) illustrate the spatial distribution of the contribution of tropical cyclones Matthew (2016), Harvey (2017), Iota (2020), Julia (2022), Beryl (2024), and Melissa (2025) across the study region. Rain gauges without recorded rainfall for each event are excluded from the display.
Tropical Storm Iota contributed between negligible amounts and 15% of the annual precipitation in low-elevation regions. Medium-elevation areas exhibited the greatest variability, with contributions ranging from nearly zero to 18%. In high-elevation zones, average contributions ranged from 0% to 4%. During the storm, 19% of rainfall records indicated no precipitation. At eight of the 204 operational rain gauges, contributions to annual precipitation exceeded 10% (Figure 3c). For Tropical Storm Julia, the maximum contributions to annual precipitation were 12%, 7%, and 7% at low-, mid-, and high-elevation rain gauges, respectively. Precipitation associated with this tropical storm was moderately higher in low-lying areas. This event did not display a clear dominant spatial pattern; instead, it showed a weak signal from the TC, with contributions primarily localized in low-lying regions. Thirty percent of rain gauges recorded no rainfall during the passage of Tropical Storm Julia, and the number of rain gauges contributing at least 5% to the area’s annual precipitation did not exceed 7% of the total rain gauges in the study (Figure 3d).
During Hurricane Beryl, low-altitude stations received nearly twice as much precipitation as other elevation categories. Low-lying areas not only dominated but also exhibited the greatest variability, with annual precipitation contributions ranging from 0% to 20%. Twenty-six percent of precipitation records during the event represented contributions to the year’s accumulated precipitation greater than 5%. Additionally, 10% of rain gauges did not record any precipitation during Hurricane Beryl (Figure 3e). In contrast, Hurricane Melissa contributed 0–47% (6 ± 19%), 0–47% (4 ± 8%), and 1–34% (8 ± 10%) to annual precipitation at low-, mid-, and high-elevation rain gauges, respectively. Although approximately 11% of records indicated contributions greater than 10%, 17% of rain gauges recorded zero precipitation during Hurricane Melissa (Figure 3f).
3.2. Standardized Anomalies of TC-Induced Precipitation
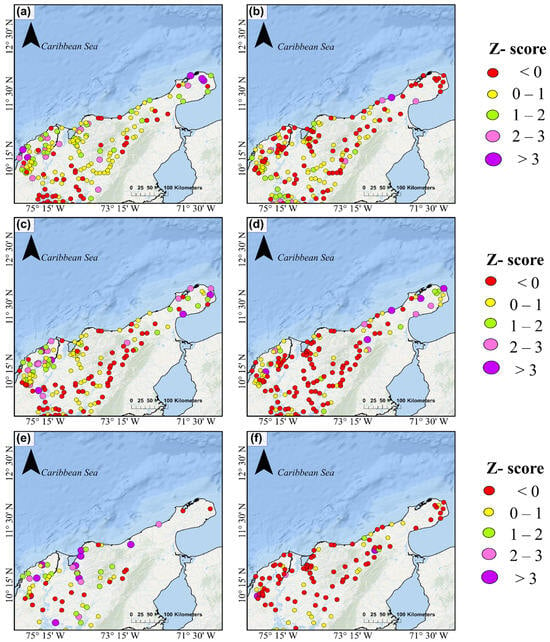
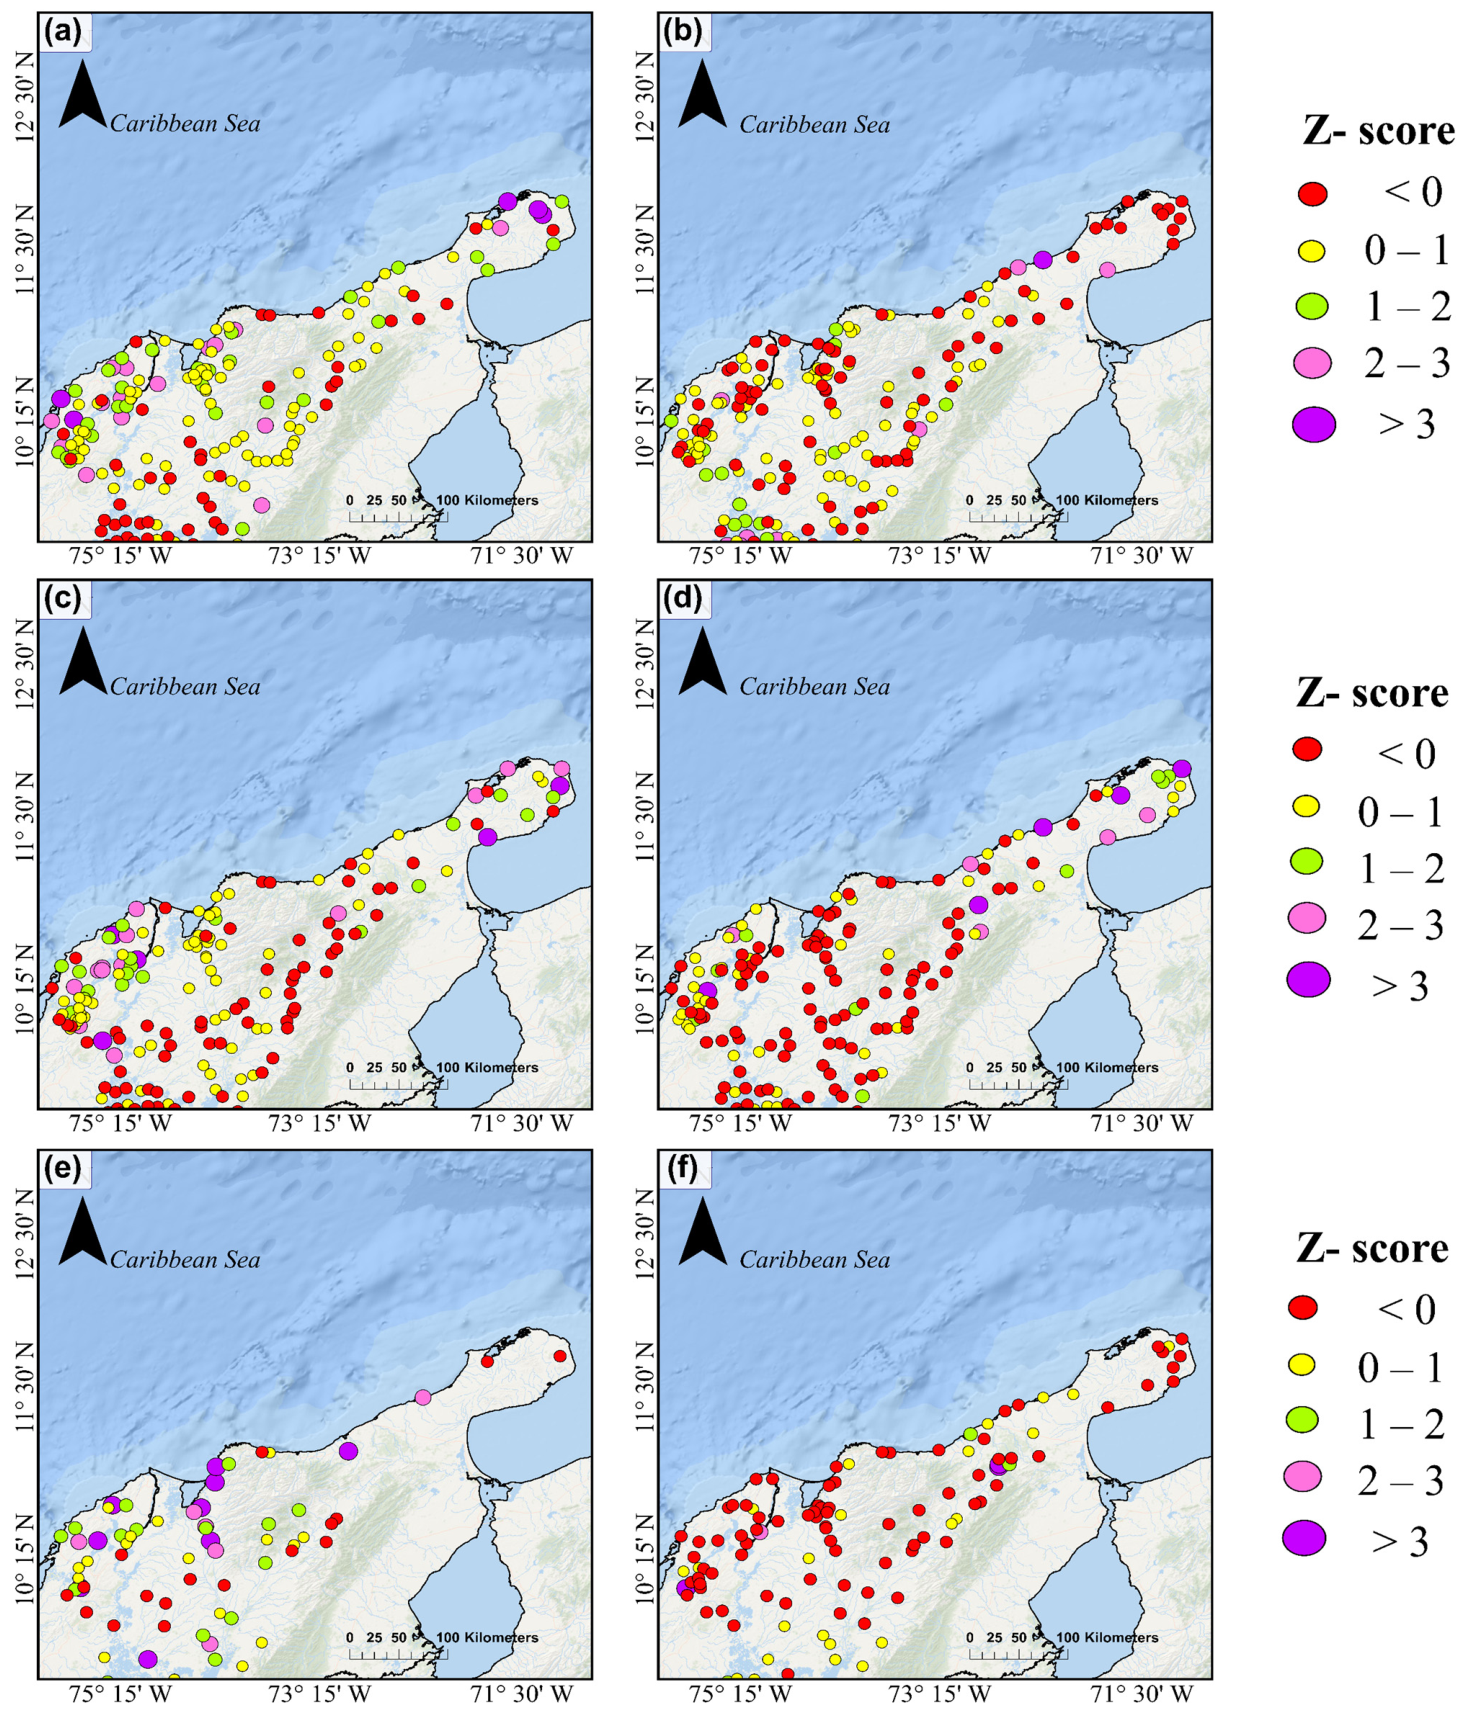
Figure 4 illustrates the spatial distribution of standardized anomalies in TC-induced precipitation across northern South America. During Hurricane Matthew, 35% of stations exhibited below-normal precipitation, while 40% displayed weak positive anomalies (0–1), indicative of typical variability. Moderate positive anomalies (1–2) were observed at 15% of stations, 7% recorded strong anomalies (2–3), and 2% experienced very extreme anomalies exceeding 3 standard deviations (Figure 4a). In the case of Hurricane Harvey, 47% of rain gauges reported negative anomalies, 39% fell within the 0–1 range, and 8%, 5%, and 1% recorded anomalies in the 1–2, 2–3, and 3+ ranges, respectively (Figure 4b).
Figure 4.
Spatial patterns of standardized daily anomalies (z-scores) resulting from tropical cyclones over Northern South America. Panels (a–f) display the spatial distribution of standardized daily anomalies for tropical cyclones Matthew (2016), Harvey (2017), Iota (2020), Julia (2022), Beryl (2024), and Melissa (2025). For each event, daily precipitation anomalies are calculated relative to the 1980–2015 climatological daily mean for the corresponding calendar day and are normalized by the historical daily standard deviation.
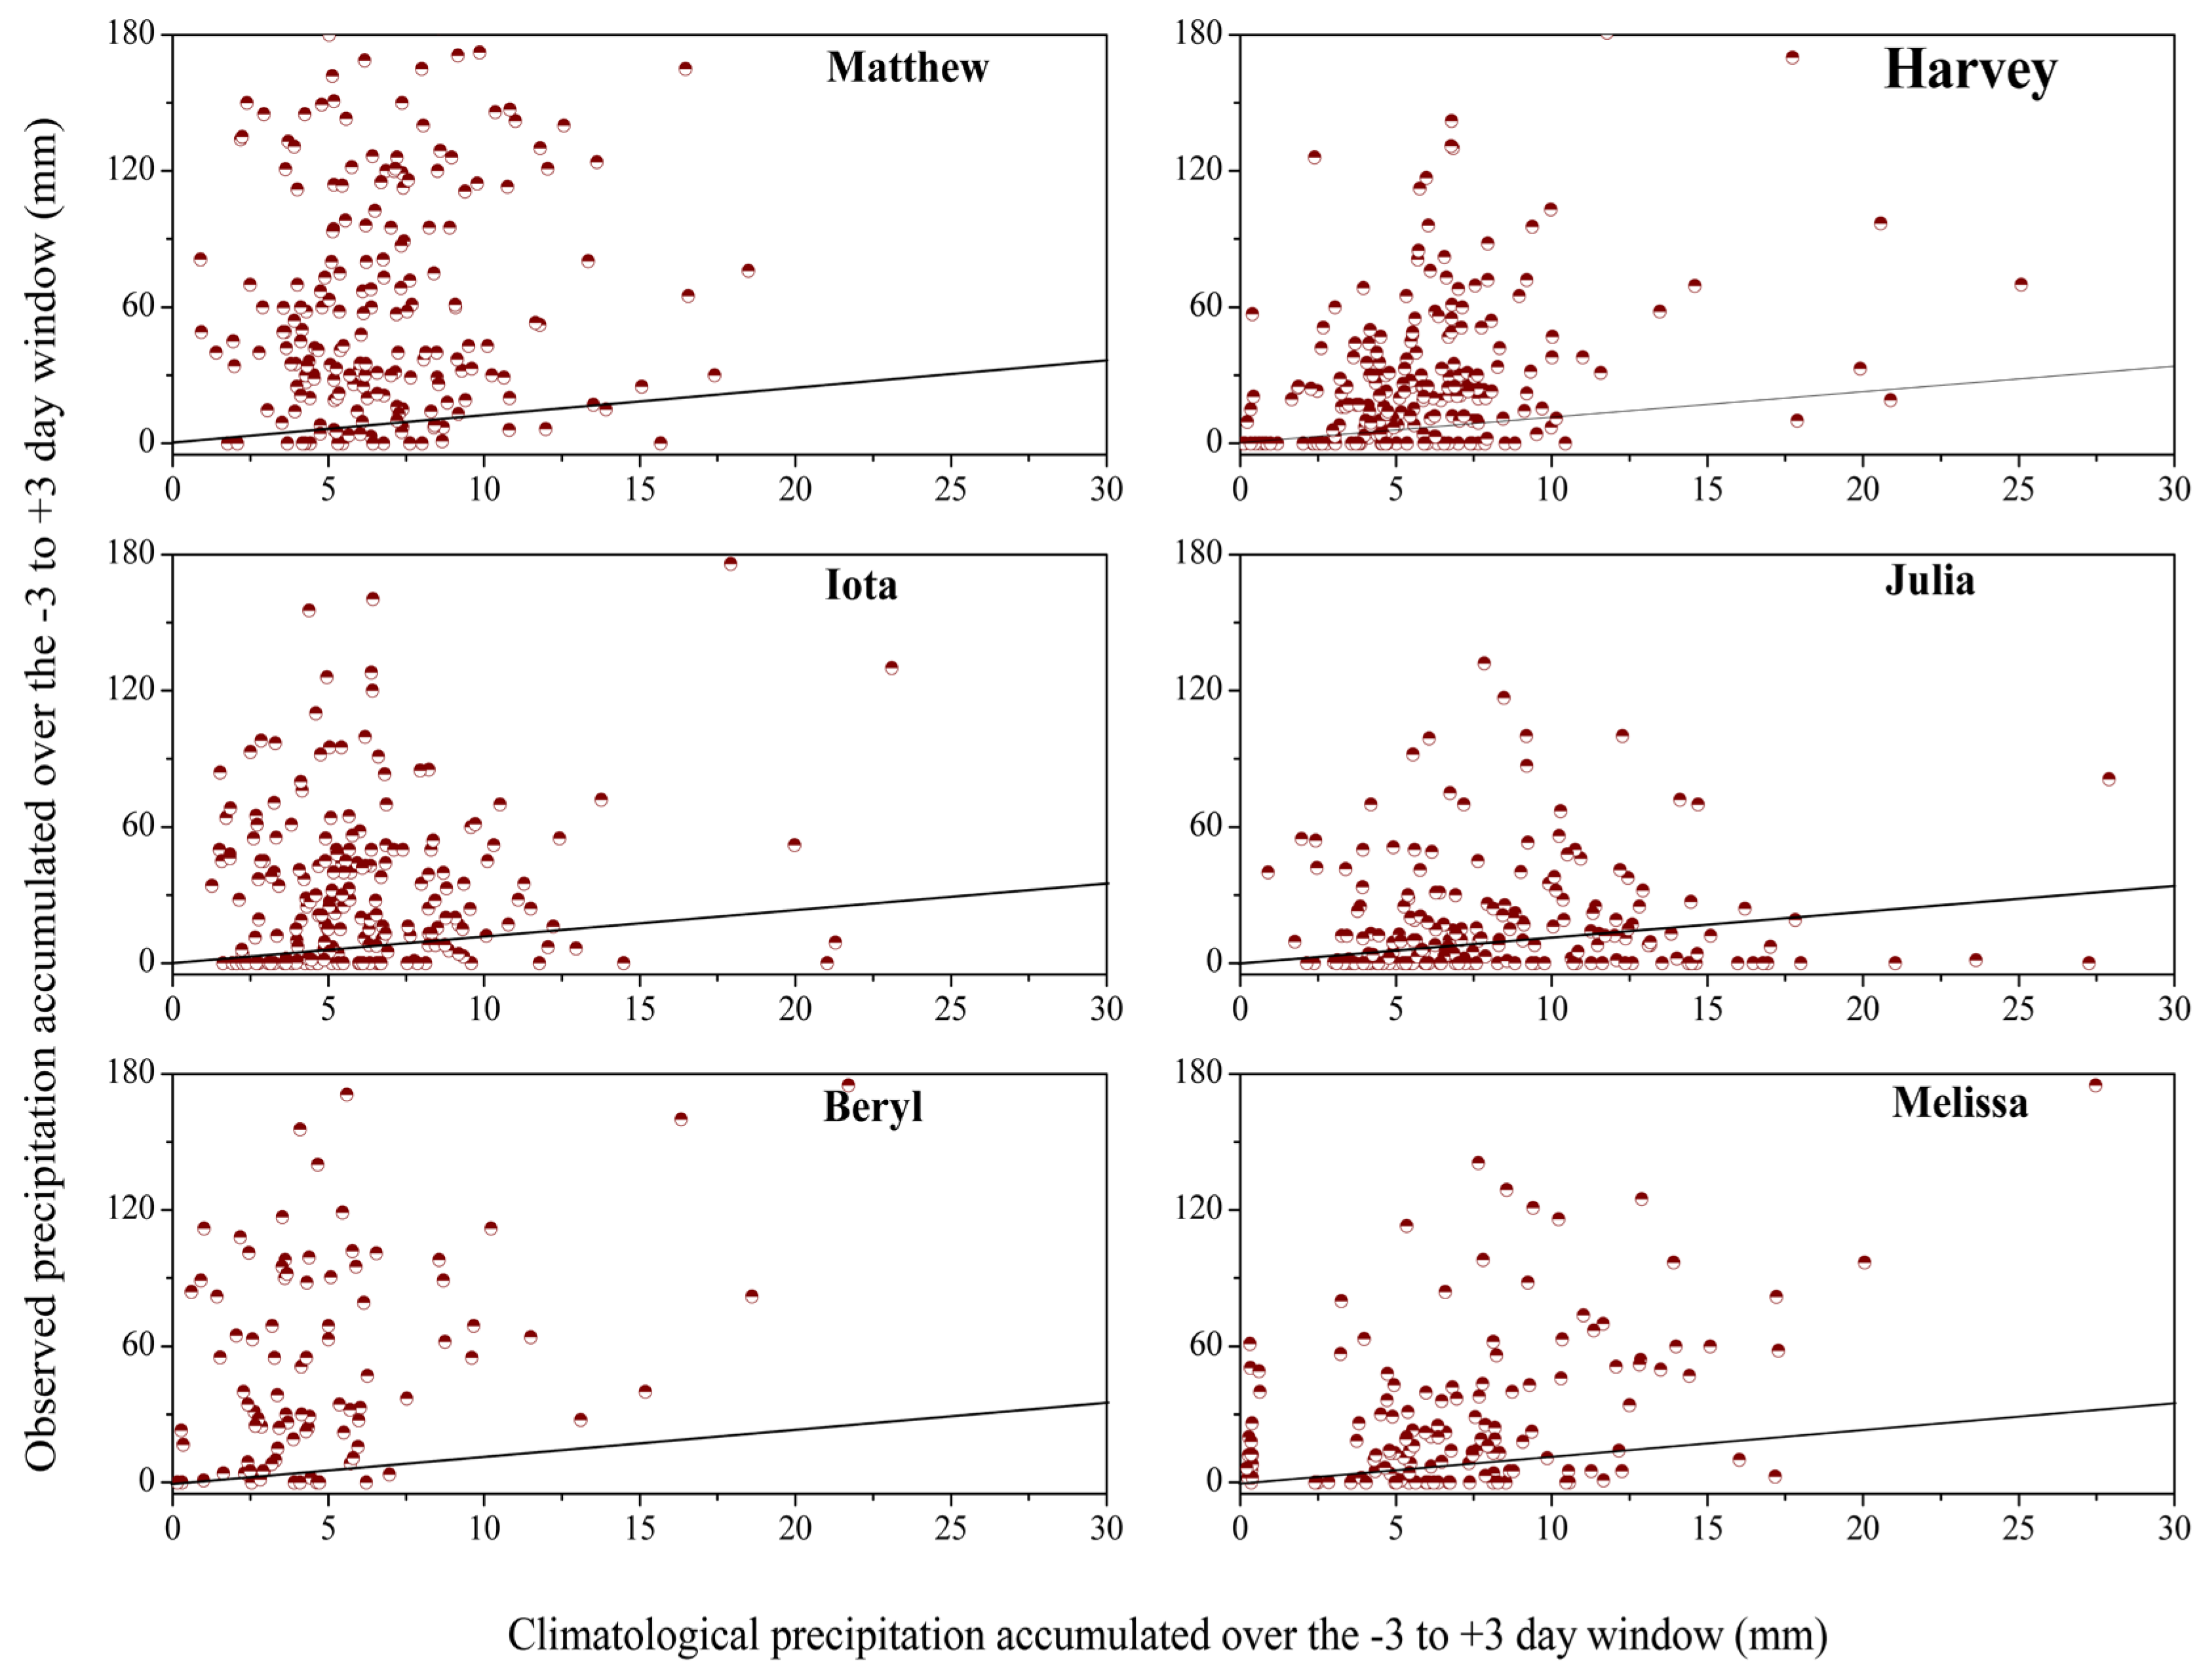
During Hurricane Iota, most rain gauge readings indicated slightly above-normal conditions, with 36% of readings within the 0–1 range. Moderate to strong positive anomalies (≥1) were less common, representing 19% of stations. Of these, 9% experienced extreme conditions (anomalies ≥ 2), including 3% with very extreme values exceeding 3 standard deviations (Figure 4c). For Tropical Storm Julia, standardized precipitation anomalies between 1 and 2, 2 and 3, and greater than 3 were observed at 6%, 3%, and 3% of rain gauges, respectively. Additionally, 63% of rainfall records during Julia showed negative anomalies (Figure 4d). During Hurricane Beryl, 16% of rain gauges recorded anomalies with standardized precipitation deviations greater than 3, while moderate and extreme positive anomalies together accounted for 25% of the total (Figure 4e). In contrast, during Hurricane Melissa, 73% of rainfall records exhibited anomalies below zero, while standardized precipitation anomalies in the ranges of 0 to 1, 1 to 2, 2 to 3, and greater than 3 were 18%, 3%, 1%, and 6%, respectively (Figure 4f). Negative anomalies do not necessarily indicate that rainfall was entirely absent during TC passage. Many stations recorded precipitation, but totals were below the climatological mean for those dates. Rain gauges with negative anomalies generally recorded rainfall, though amounts were lower than expected. Therefore, negative anomalies indicate a relative deficit compared to the climatological baseline, not direct precipitation suppression by the cyclone. The percentage of rain gauges that recorded no rainfall during each hurricane varied: 7% for Matthew, 21% for Harvey, 19% for Iota, 30% for Julia, 10% for Beryl, and 17% for Melissa. Even during intense hurricanes like Matthew, some areas received no rainfall (Appendix B).
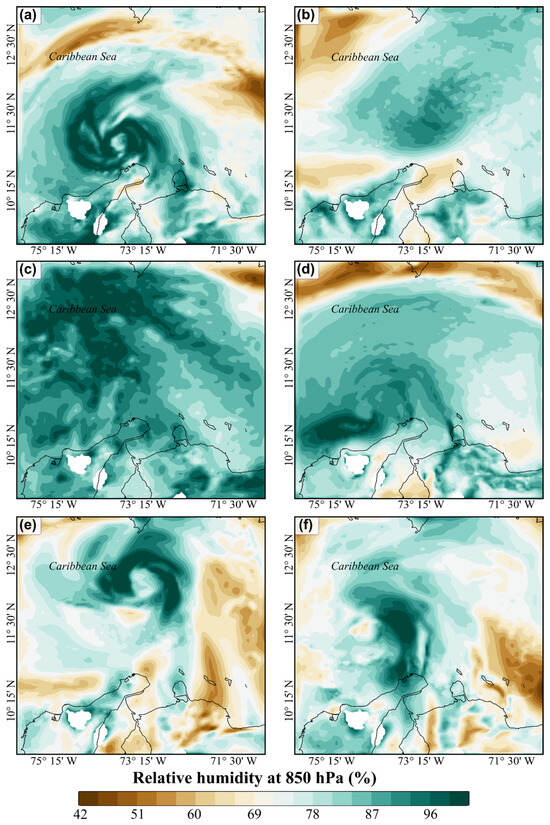
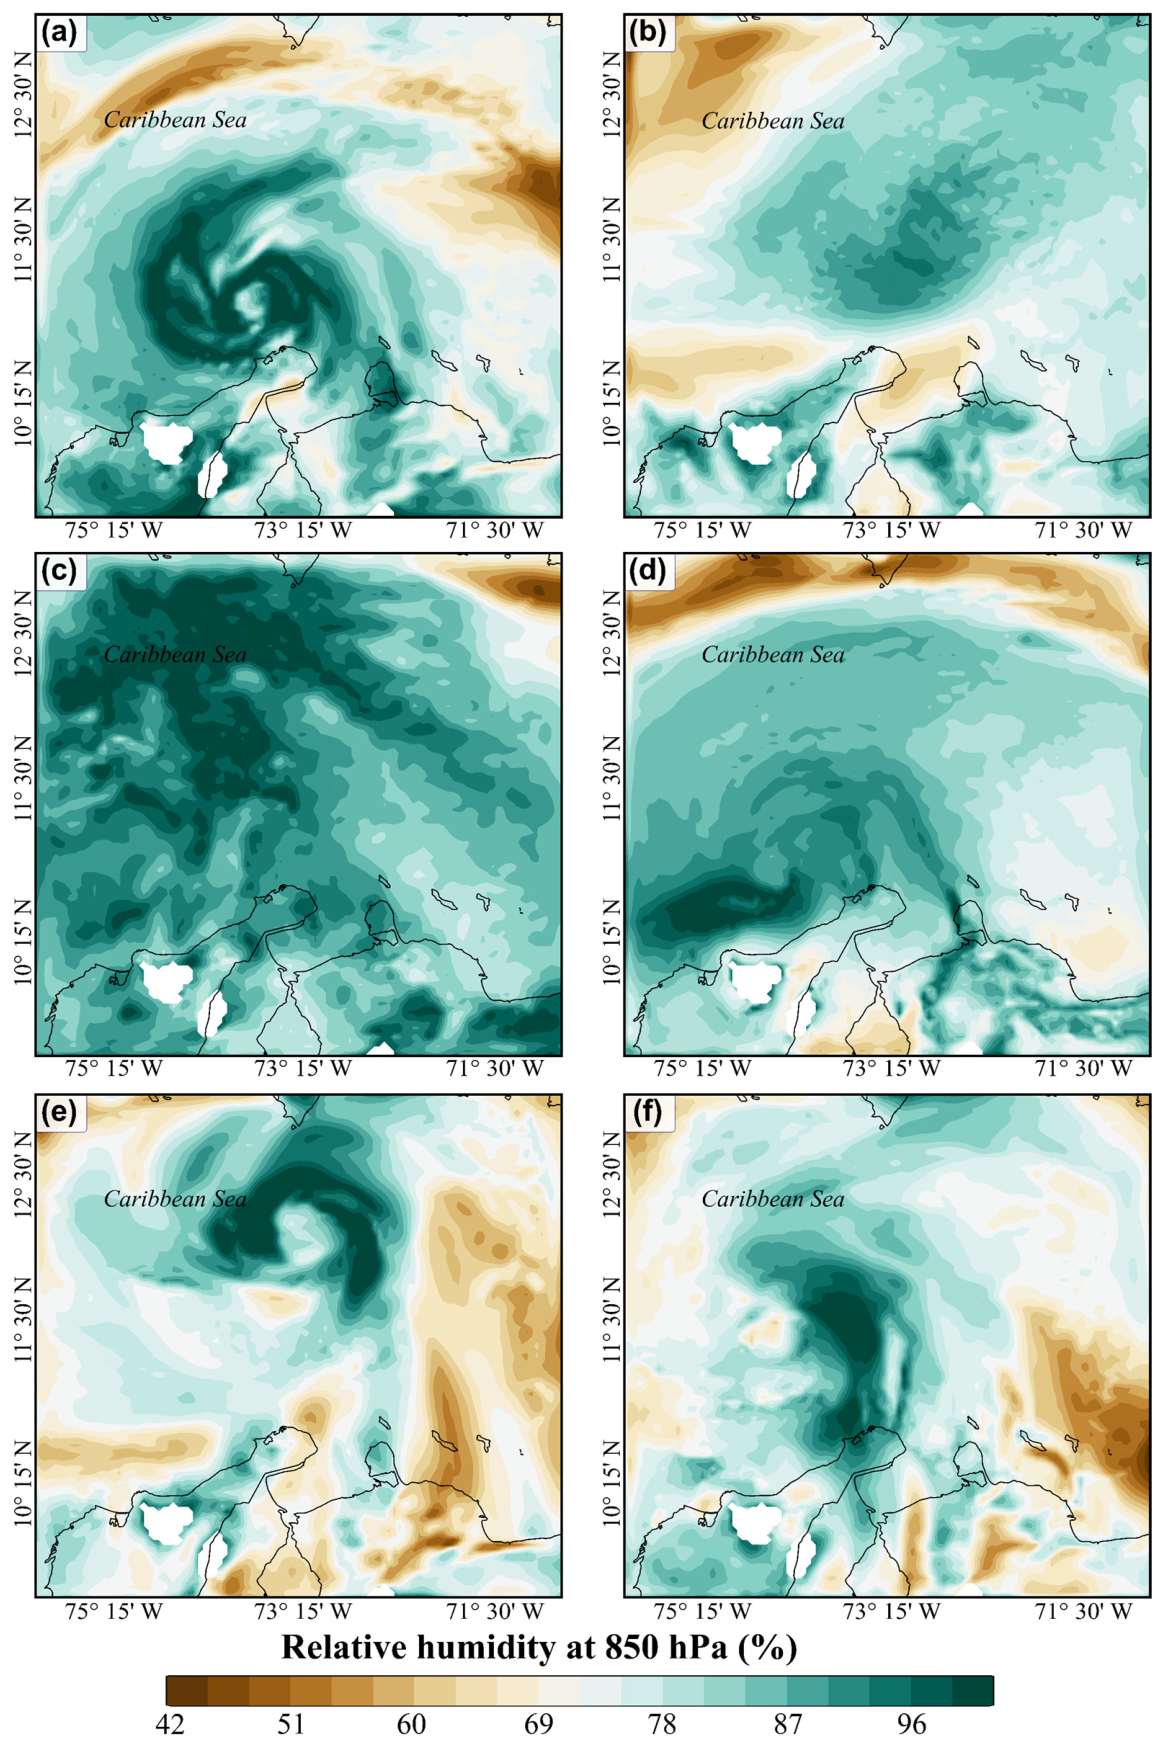
The spatial distribution of relative humidity at 850 hPa during periods when TCs approached northern South America demonstrates distinct event-dependent patterns (Figure 5). Humidity at 850 hPa is used to assess lower-tropospheric moisture flux. Tropical cyclone activity is known to be sensitive to various environmental factors, including humidity levels in the lower and middle troposphere [40]. Rainfall in the inner-core region is often unaffected by changes in environmental humidity because of strong convection and already high moisture. However, even minor changes in large-scale humidity can significantly impact rainfall in the outer region [41].
Figure 5.
Spatial distribution of relative humidity at 850 hPa during periods when tropical cyclones approach the continental region of Northern South America. Panels (a–f) present the relative humidity at 850 hPa for tropical cyclones Matthew (2016), Harvey (2017), Iota (2020), Julia (2022), Beryl (2024), and Melissa (2025).
These patterns indicate pronounced spatial heterogeneity in lower-tropospheric moisture associated with TCs, ranging from compact, high-intensity cores to broader and more diffuse moisture fields. The analysis shows that Matthew and Beryl exhibited well-defined, quasi-circular humidity structures, with maxima concentrated near the cyclone core and extending toward the continental margin, which suggests strong low-level moisture advection (Figure 5a,e). Similarly, Melissa displayed a pronounced asymmetric structure, with enhanced humidity extending over the coastal regions of Colombia (Figure 5f). In contrast, Tropical Storm Harvey presented a more diffuse and weaker moisture field, characterized by relatively homogeneous conditions and weak spatial gradients (Figure 5b). Iota exhibited widespread high relative humidity across most of the domain, indicating near-saturated conditions in the lower troposphere and environments favorable for sustained precipitation (Figure 5c). Tropical storm Julia showed a more localized humidity anomaly near the storm center, with weaker signals farther from the center (Figure 5d). It is therefore noteworthy that TCs affecting the northern coast of South America exhibit substantial variability in both the intensity and spatial extent of lower-level moisture fields.
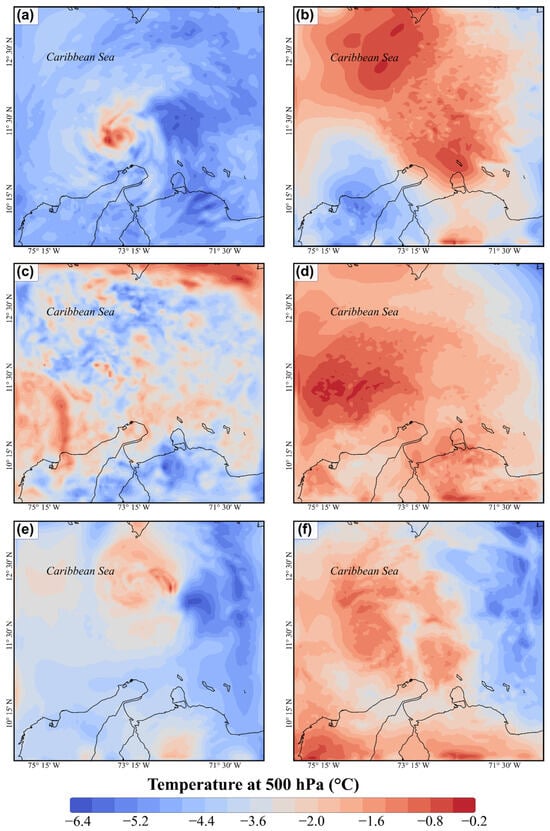
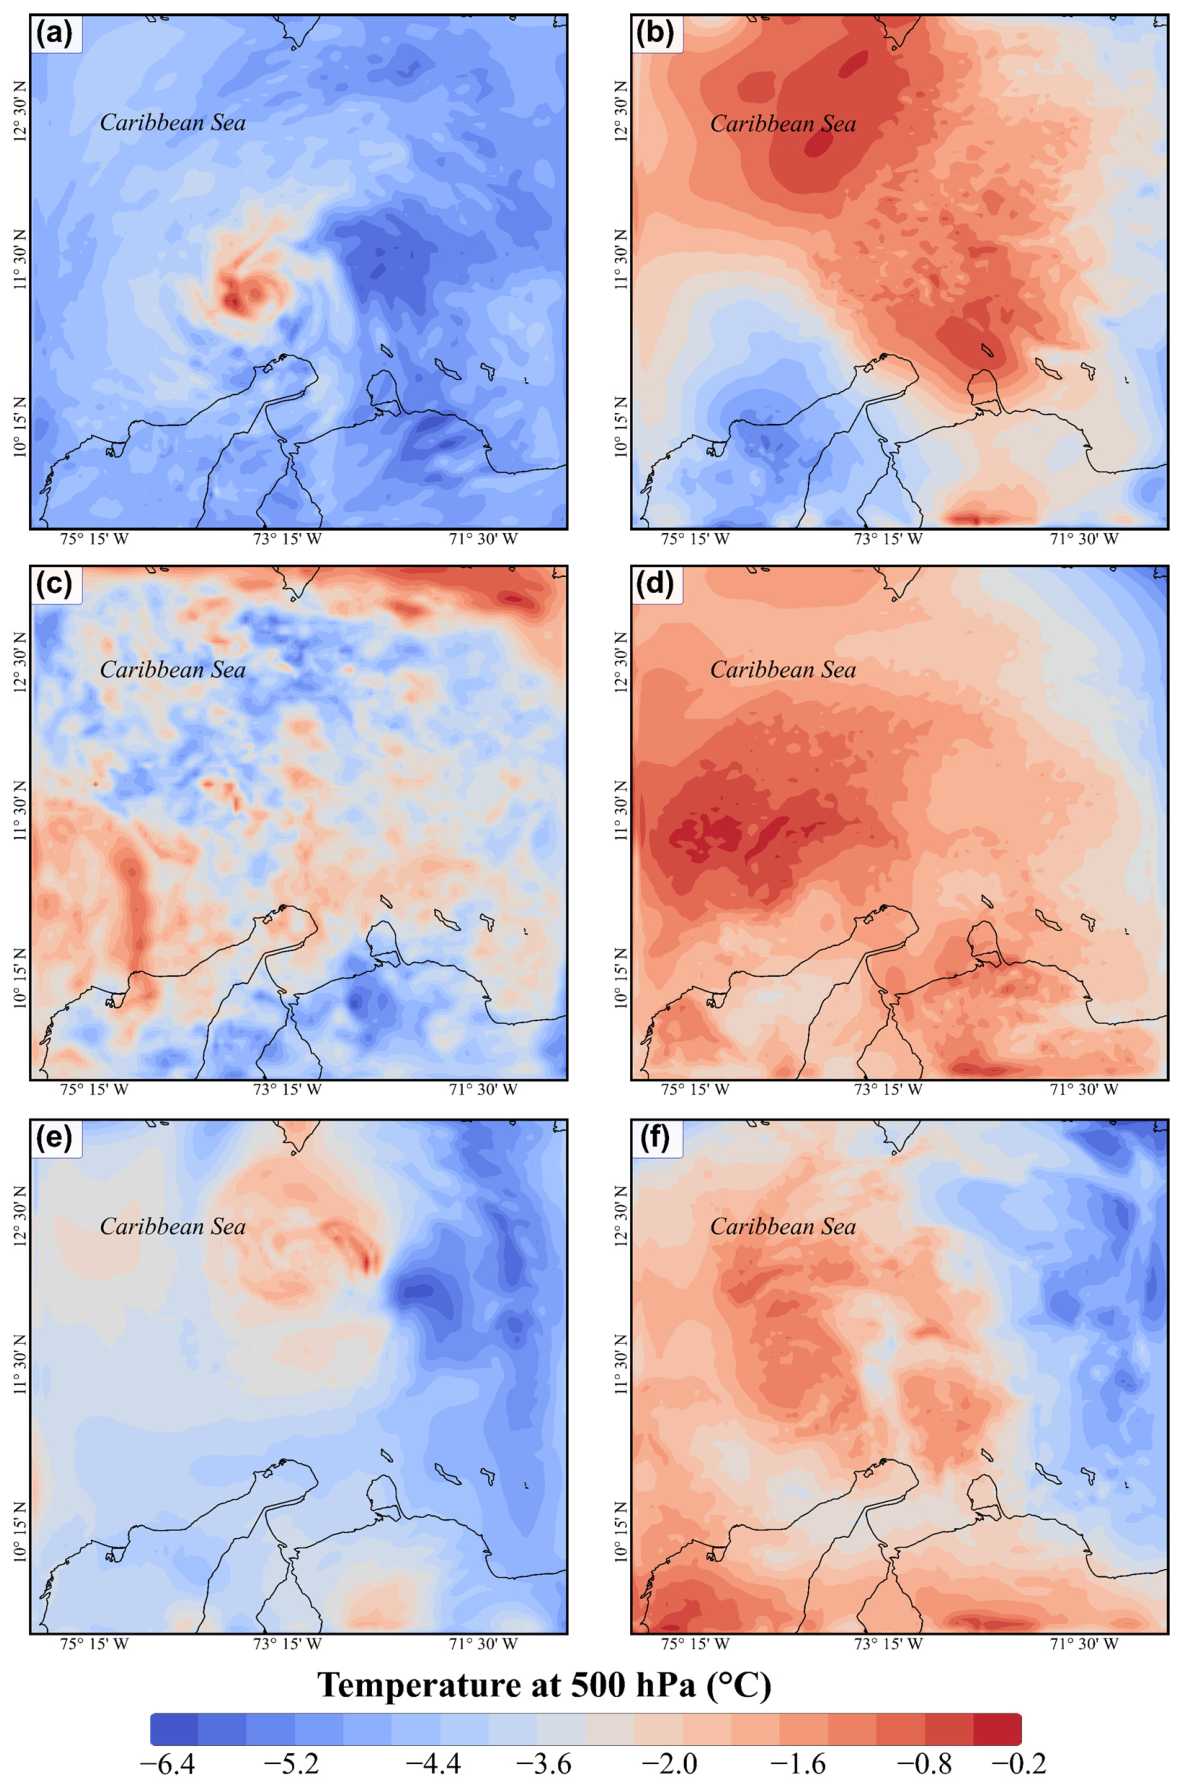
The spatial distribution of temperature at 500 hPa during the closest approach of TCs to northern South America shows marked variability among the different systems (Figure 6). Matthew and Beryl exhibit well-defined warm-core structures, characterized by localized mid-tropospheric warming surrounded by relatively cooler environmental air (Figure 6a,e). By comparison, tropical storms Harvey and Julia display broader regions of positive temperature anomalies extending over the Caribbean and northern South America, suggesting large-scale mid-tropospheric warming during their passage (Figure 6b,d). Iota, in contrast, is characterized by a fragmented and less organized thermal pattern, with weak gradients and irregular spatial distribution (Figure 6c). Hurricane Melissa exhibits a more coherent warm-core structure near the northern coast of South America, although significant warming anomalies also extend over adjacent continental regions (Figure 6f).
Figure 6.
Spatial distribution of mid-tropospheric (500 hPa) temperature during the closest approach of tropical cyclones to northern South America. Panels (a–f) depict temperature fields associated with tropical cyclones Matthew (2016), Harvey (2017), Iota (2020), Julia (2022), Beryl (2024), and Melissa (2025).
3.3. Explanatory Variables Importance
Including a two-dimensional smooth term for geographic coordinates within the GAM effectively captured residual spatial variability, as indicated by non-significant spatial autocorrelation in the Moran’s I test (p > 0.05). These results demonstrate that proximity to TCs chiefly influences precipitation patterns across the rain gauge network. The models explained between 11% and 36% of the precipitation variability, depending on the event. For Hurricane Matthew, precipitation decreased with increasing distance from the cyclone center, highlighting the importance of storm proximity. In Harvey, the relationship between precipitation and distance was more complex, exhibiting a nonlinear, asymmetric radial structure. For Iota, precipitation variability was influenced by atmospheric conditions, particularly wind speed and pressure, with higher values associated with reduced rainfall, while altitude remained non-significant. The distance variable also showed a significant nonlinear effect, indicating spatially heterogeneous precipitation patterns. In contrast, for tropical cyclones Julia and Beryl, the GAMs explained a smaller proportion of precipitation variability (approximately 11%), with surface pressure emerging as the sole consistent predictor. For Melissa, the model achieved the highest explanatory power (approximately 36%), with distance identified as the most influential predictor through a highly significant nonlinear relationship. Wind speed and elevation did not show significant effects.
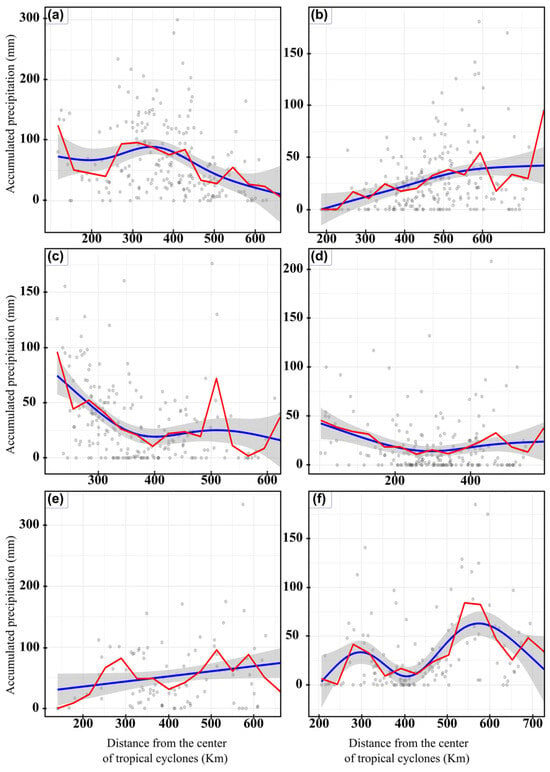
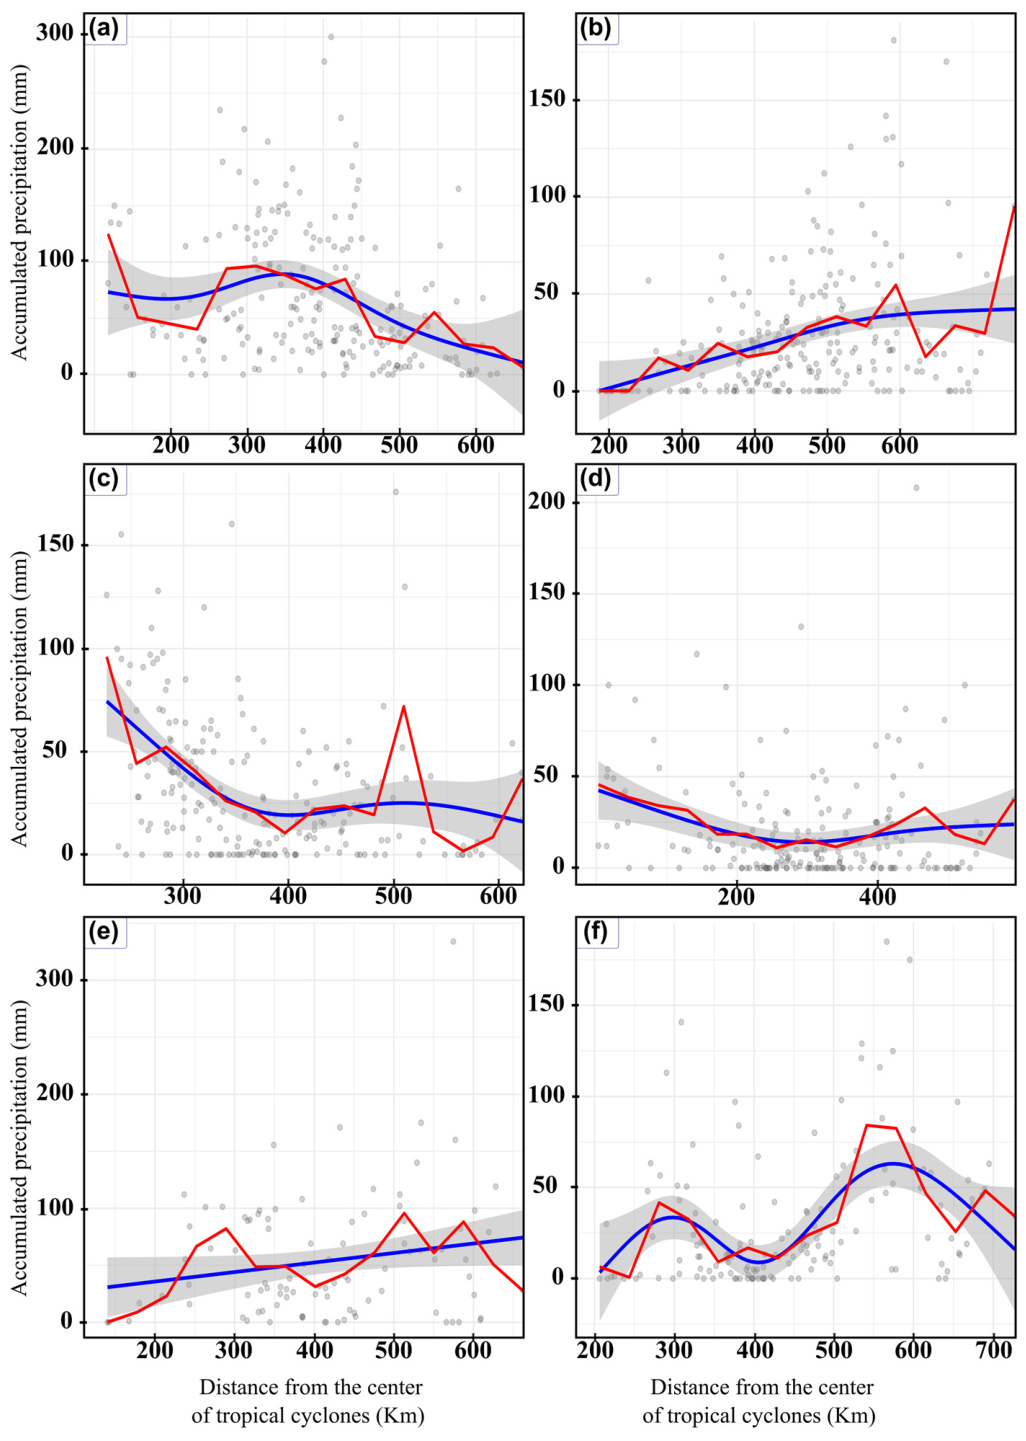
Figure 7 shows the radial profiles of accumulated precipitation as a function of distance from the centers of TCs, based on data from the rain gauges included in this study. For Hurricane Matthew, maximum precipitation values occurred at distances of approximately 250–350 km, with substantial dispersion in precipitation across the study area. The observed heterogeneous distributions likely result from local processes and the cyclone’s internal structure, rather than from distance alone. Precipitation decreased progressively beyond 400 km (Figure 7a). In contrast, Hurricane Harvey exhibited wide dispersion in precipitation data, with an increasing trend up to 600 km from the system’s center (Figure 7b). During Tropical Storm Iota, cumulative precipitation records showed a marked decrease from the center to approximately 350–400 km. Beyond 400 km, precipitation stabilized, with occasional peaks in some rainfall records (Figure 7c). For tropical storm Julia, precipitation decreased sharply with increasing distance from the center within the first 200 km (Figure 7d). In the case of Beryl, very extreme precipitation events were recorded at rain gauges located more than 500 km away (Figure 7e). Finally, during Melissa, significant accumulated precipitation was observed at approximately 300 and 550 km from the cyclone’s center (Figure 7f).
Figure 7.
Radial relationship between accumulated precipitation and distance to the center of tropical cyclones over Northern South America. Panels (a–f) show accumulated precipitation recorded at rain gauge stations as a function of the minimum distance to the cyclone center during its closest approach, for tropical cyclones Matthew (2016), Harvey (2017), Iota (2020), Julia (2022), Beryl (2024), and Melissa (2025). The blue curves represent smooth fits derived from a GAM, with shaded areas indicating confidence intervals, and red lines corresponding to binned averages.
4. Discussion
Climate change is projected to increase the frequency of hydroclimate extremes in the twenty-first century. Understanding the relationship between TCs and drought is critical. The main findings indicate that TCs contributed most significantly to annual precipitation in low-lying regions. During Hurricanes Matthew and Melissa, these contributions reached 50% and 47%, respectively. This pattern may be linked to deep convective processes. Tao et al. [42] reported that deep convection precedes the intensification of TCs and stratiform rainfall both within and beyond the inner core of the tropical system. Additionally, under La Niña conditions or prior to such ENSO events, extreme rainfall is more likely as cyclones traverse northern South America due to reduced subsidence in the Caribbean basin [43]. The vertical distribution of precipitation is influenced by moisture content and low-level convective processes, while vertical wind shear is the primary dynamic factor shaping convection over the tropical Atlantic [44]. The contributions of Hurricanes Harvey, Iota, Julia, and Beryl to annual precipitation were 0–26%, 0–18%, 0–12%, and 0–19%, respectively. Herrera et al. [45] used CHIRPSv2 and MSWEP data to estimate the influence of cyclones on precipitation between 1985 and 2023 across much of the American continent. The authors found that TCs contribute 4–15% to annual precipitation. TCs may contribute between 10 and 50% of rainfall in coastal, arid, semi-arid, and peninsular regions [4,13]. The extent of this contribution to cumulative precipitation is influenced by the cyclone’s track and proximity to the region. When the cyclonic system is farther away, atmospheric moisture may diverge over land, thereby reducing the likelihood of tropical convective activity and associated precipitation [46]. Furthermore, the precipitation pattern during Harvey and Iota was spatially dispersed, with limited structural coherence. Harvey produced weaker, more diffuse, and less organized rainfall than other cyclones studied. Relative humidity at 850 hPa indicated a diffuse moisture field with weak gradients, restricting intense convection. For Iota, 19% of records showed no precipitation, reflecting a discontinuous spatial signal and predominantly slightly humid conditions. Although Iota was associated with a generally moist atmosphere at 850 hPa, it lacked strong convective organization. TCs interact with regional atmospheric features such as easterly waves, low-level jets, and the Intertropical Convergence Zone, which shape moisture transport and precipitation patterns [47]. These interactions are complex and depend on synoptic and seasonal dynamics.
Collectively, these findings indicate that the contribution of tropical cyclones to annual precipitation in northern South America is governed by nonlinear interactions among cyclone trajectory, atmospheric moisture organization, convective processes, and regional topography. The marked variability observed among events suggests that precipitation associated with TCs cannot be inferred solely from cyclone intensity or direct landfall, as peripheral systems may also contribute substantially to the regional hydrological cycle. This complexity highlights the importance of incorporating storm proximity, moisture transport, and topographic effects into regional hydroclimatic assessments and early warning strategies for hydrometeorological extremes. During the passage of Tropical Storm Julia, the spatial distribution of anomalies was predominantly negative, with approximately 63% of rainfall data falling within this range during the 1980 to 2015 period. Approximately half of these negative anomalies are attributable to a lack of precipitation during the event. This pattern can be explained by the asymmetric precipitation fields of TCs, moisture divergence, and topographic influences [48]. Julia demonstrated a concentrated moisture structure near the cyclone core, characterized by significant radial precipitation profiles at radio <200 km. In contrast, Hurricane Beryl produced an intense, organized, and highly heterogeneous rainfall event. Although 10% of stations recorded no precipitation, a substantial proportion of rain gauges contributed significantly to the annual rainfall total. These results indicate that precipitation from tropical storms is influenced by the interaction of orographic and convective processes, which vary significantly between events, rather than by a single altitudinal configuration. Previous studies have found that rainfall distributions from TCs can vary significantly within a given region. Breña-Naranjo et al. [49] evaluated the contribution of tropical cyclone rainfall in Mexico from 1998 to 2013 using the TMPA 3B42 satellite-derived precipitation dataset. Their findings show that average regional contributions range from 0% to 20%, with no consistent spatial pattern. Additionally, the study demonstrates that the highest rainfall amounts may be produced by any category of tropical cyclone, not exclusively by the most intense storms, thereby challenging the common perception regarding hurricane intensity and rainfall. Furthermore, Ng et al. [26] reported that in northwest Australia, some coastal stations receive over 40% of their annual precipitation from TCs. This percentage decreases sharply inland, where values are typically below 30%.
Arid regions, including northern Colombia within the study area, recorded the highest standardized precipitation anomalies in most rainfall datasets during the passage of Matthew, Iota, and Julia. These results are consistent with previous research. Prat and Nelson [50] reported that, from 1998 to 2009, TCs contributed on average more than 25% and up to 61% of the annual precipitation budget across various climatic regions with arid or tropical characteristics. Similarly, Khouakhi et al. [4] found that between 40% and 50% of rainfall associated with TCs occurs along the western coast of Australia, on islands in the southern Indian Ocean, and in regions such as East Asia and Mexico.
GAMs indicate that the proximity and track of TCs exert the greatest influence on precipitation records in northern South America. Cyclone intensity, as measured by pressure and wind dynamics, also has significant effects. Additionally, elevation enhances precipitation through orographic effects. The models explain approximately 11% to 36% of the total precipitation variability, aligning with the inherently chaotic nature of precipitation associated with TCs. The GAMs showed that the highest rainfall amounts could be generated by any category of tropical cyclone, contradicting the common perception that the most intense hurricanes, in terms of wind speed, also produce the highest rainfall rates. Other studies have also observed, as we have, a weak correlation between maximum wind speed and maximum precipitation [49,51,52].
Tropical cyclones in our study area have caused significant rainfall, flooding, storm surges, and isolated communities due to the presence of unpaved roads. For instance, while Julia made landfall in Nicaragua, its proximity to Uribia in northern Colombia affected over 12,300 families and flooded half the urban area. Tropical Cyclone Iota also caused severe flooding in the Colombian Caribbean. Understanding the factors influencing rainfall variability from tropical cyclones is essential for developing early warning systems, as it helps integrate community risk variables and improve the prevention of weather-related damage.
Our study has several limitations. First, rainfall records are available at daily temporal resolution, whereas the IBTrACS dataset for tropical cyclone positions is updated every 6 h. This discrepancy may introduce errors in precipitation estimates for each tropical cyclone, as daily precipitation records are logged the following day at approximately 12:00 UTC. Such errors are likely to result in overestimation of precipitation attributed to individual TCs. Additionally, rain gauges may underestimate precipitation from TCs due to insufficient collection during high-wind periods [53,54]. Despite these limitations, our research identifies patterns and results that can inform land-use planning and water resource management in the region. Furthermore, it enhances understanding of TCs’ influence on precipitation in northern South America. These findings have implications for climate predictability in northern South America, as precipitation over the study area can be forecast from tropical cyclone activity forecasts.
5. Conclusions
This study demonstrates that the contribution of tropical cyclones to annual precipitation in northern South America is not controlled solely by cyclone intensity but rather by complex interactions among atmospheric dynamics, moisture transport, storm trajectory, and regional topography, which can make even peripheral systems important contributors to the regional hydrological balance. We utilized 209, 220, 204, 198, 94, and 144 rain gauges to analyze rainfall associated with Matthew (2016), Harvey (2017), Iota (2020), Julia (2022), Beryl (2024), and Melissa (2025), respectively. The highest proportions of precipitation induced by tropical cyclones, reaching up to 51 percent, were recorded at rain gauges located below 80 m above sea level. The proportion of precipitation attributable to tropical cyclones generally decreases with increasing distance from the coast, a trend particularly evident in flat regions with limited mountainous terrain. Negative standardized precipitation anomalies were observed for all analyzed tropical cyclones, ranging from 27 percent to 63 percent across all rain gauges. Patterns of relative humidity at 850 hPa demonstrate pronounced spatial heterogeneity in lower-tropospheric moisture associated with tropical cyclones, varying from compact, high-intensity cores to broader, more diffuse moisture fields. Matthew and Beryl exhibited well-defined warm-core structures, characterized by localized mid-tropospheric warming surrounded by relatively cooler environmental air. In contrast, tropical storms Harvey and Julia displayed broader regions of positive temperature anomalies extending over the Caribbean and northern South America. Cyclone proximity, regional topography, and coastal location significantly influence rainfall variability. The results indicate that each tropical cyclone possesses a distinct “atmospheric signature” in each region, as identified through precipitation analysis. Understanding the behavior of individual cyclones and the factors influencing precipitation requires a multi-methodological approach that integrates data from rain gauge networks, numerical simulations, and statistical models.
Author Contributions
Conceptualization, H.A.A. and N.F.M.; Software, H.A.A. and N.F.M.; Validation, H.A.A. and N.F.M.; Formal analysis, H.A.A. and N.F.M.; Investigation, H.A.A. and N.F.M.; Data curation, H.A.A. and N.F.M.; Writing—original draft, H.A.A. and N.F.M.; Supervision, H.A.A.; Project administration, H.A.A. and N.F.M.; Funding acquisition, H.A.A. and N.F.M. All authors have read and agreed to the published version of the manuscript.
Funding
Funding for the study was provided by Minciencias [Cto. ICETEX 2022 − 0772 (Código: 1118-890-82246)] under the “Diseño e Implementación de un Sistema de Alerta Temprana por Fenómenos Hidrometeorológicos extremos utilizando Métodos de Inteligencia Artificial y Aprendizaje Automático para la Gestión del Riesgo y Ordenación Sostenible del territorio colombiano en los Andes y La Guajira” project.
Data Availability Statement
The raw data supporting the conclusions of this article will be made available by the authors on request.
Acknowledgments
The author thanks the Minciencias-Colombia for its logistical and financial assistance in conducting this research (Cto. ICETEX 2022 − 0772 (Código: 1118-890-82246)).
Conflicts of Interest
The authors declare no conflicts of interest.
Abbreviations
The following abbreviations are used in this manuscript:
| TCs | Tropical cyclones |
| ENSO | El Niño–Southern Oscillation |
| WRF | Weather Research and Forecasting model |
| IBTrACS | International Best Track Archive for Climate Stewardship |
| ECMWF | European Center for Medium-Range Weather Forecasts |
| GAM | Generalized Additive Model |
| RMSE | Root mean square error |
| MAE | Mean absolute error |
Appendix A
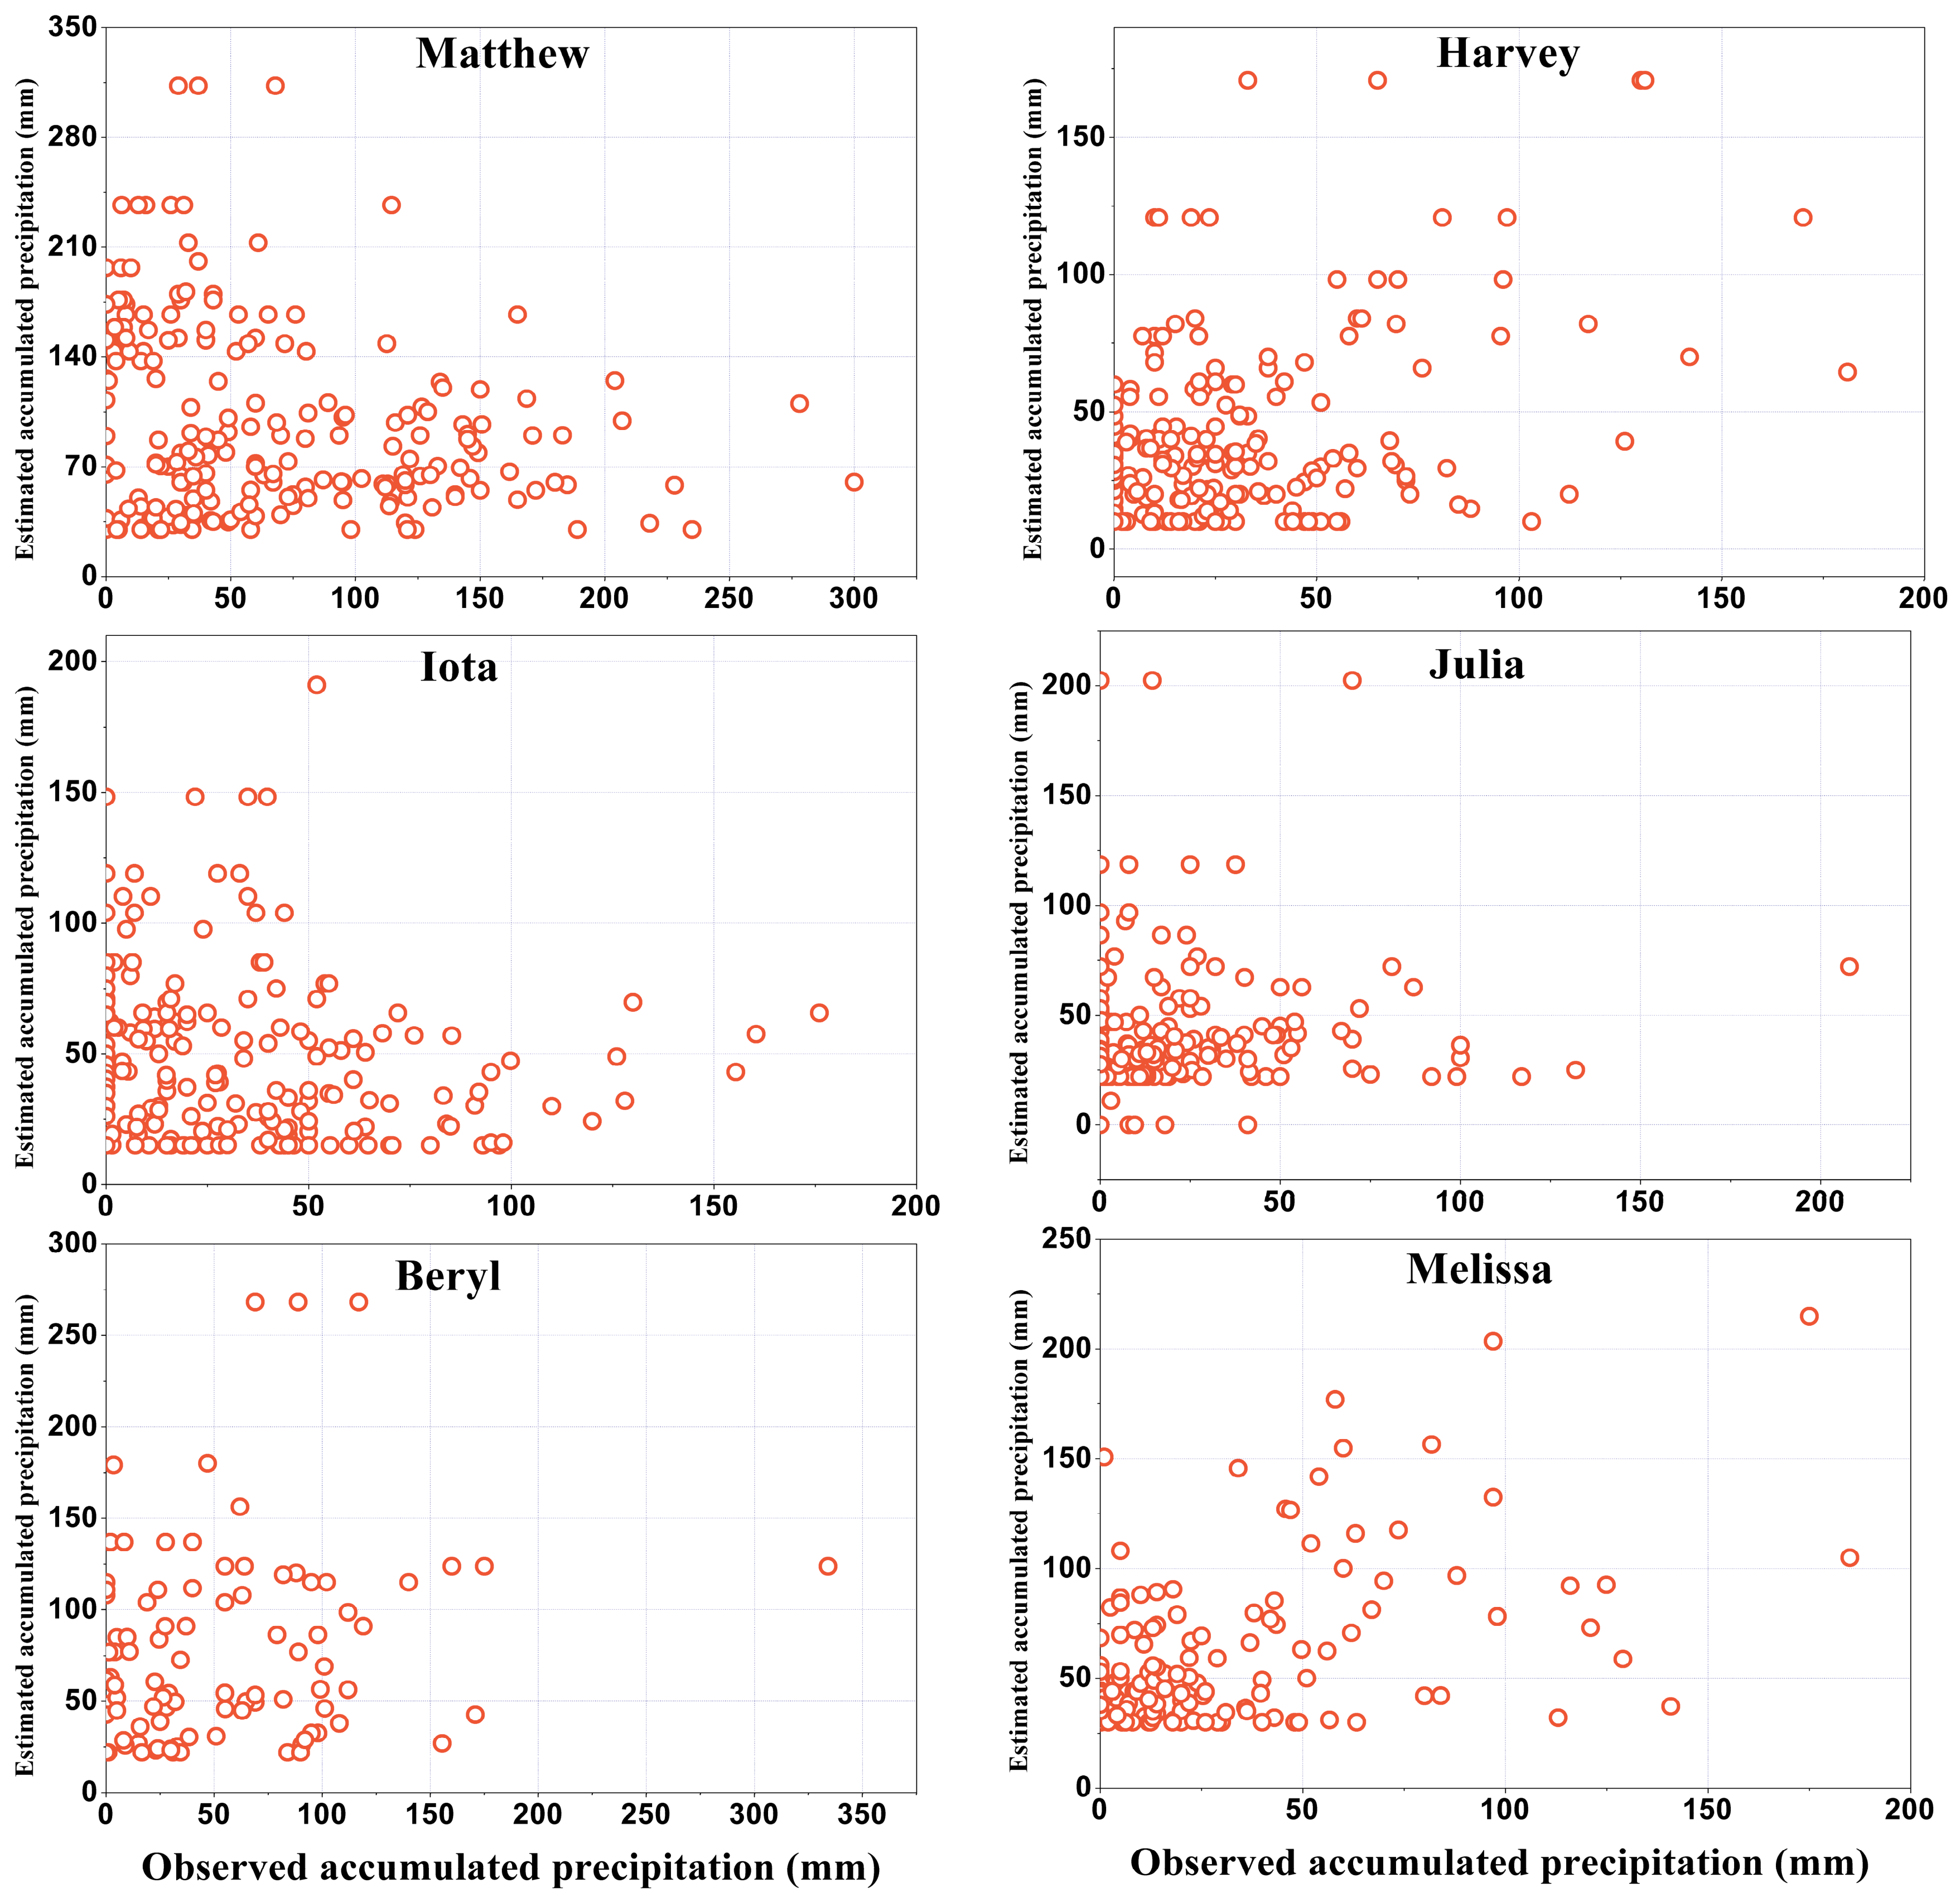
Simulations were conducted using the Weather Research and Forecasting (WRF) model to estimate relative humidity at 850 hPa and ambient temperature at 500 hPa for each tropical cyclone included in the analysis. Model performance for each event was assessed by comparing simulated and observed cumulative precipitation at each rain gauge within the study area. The BIAS, percent BIAS (PBIAS), root mean square error (RMSE), and mean absolute error (MAE) were calculated, treating each rain gauge as an independent spatial observation. Table A1 presents the statistical metrics of the WRF model’s performance in estimating accumulated precipitation. The results indicate that the numerical model generally overestimated accumulated precipitation for all tropical cyclones analyzed, as shown by consistently positive BIAS and PBIAS values. BIAS values ranged from 10.0 mm to 30.3 mm. The smallest bias was recorded for Harvey (BIAS = 10 mm), while the largest values were observed for Matthew and Melissa, with BIAS values close to 30 mm.
The percent BIAS (PBIAS) analysis further confirms the model’s tendency toward overestimation. The Julia and Melissa events exhibited the largest relative errors, at approximately 113% and 101%, respectively. In contrast, the lowest PBIAS values were recorded for Harvey (35.5%) and Beryl (42.1%), indicating relatively better model performance in those cases, although overestimation remained evident. The RMSE ranged from 36.3 mm to 98.85 mm, with the highest value observed for Matthew and the lowest for Harvey. Similarly, the MAE ranged from 27.0 mm to 75.9 mm; Harvey was the event best represented by the model, while Matthew exhibited the largest average discrepancy between simulated and observed accumulated precipitation.
Table A1.
Statistical performance metrics for the WRF model in simulating accumulated precipitation associated with the analyzed tropical cyclones.
Figure A1 shows a comparison between observed and estimated cumulative precipitation during the passage of each cyclone within the study area. Simulated precipitation values at the rain gauge locations were overestimated by approximately 63%, 69%, 60%, 81%, 62%, and 87% compared to observed values during the passage of Matthew, Harvey, Iota, Julia, Beryl, and Melissa, respectively.
Figure A1.
Comparison of observed and simulated cumulative precipitation during the passage of each tropical cyclone.
Appendix B
Figure A2.
Scatter plot comparing observed precipitation with climatological precipitation for each tropical cyclone.
References
- Anderson, G.B.; Schumacher, A.; Done, J.M.; Hurrell, J.W. Projecting the impacts of a changing climate: Tropical cyclones and flooding. Curr. Environ. Health Rep. 2022, 9, 244–262. [Google Scholar] [CrossRef] [Scilit]
- Jiang, H.; Zipser, E.J. Contribution of tropical cyclones to the global precipitation from eight seasons of TRMM data: Regional, seasonal, and interannual variations. J. Clim. 2010, 23, 1526–1543. [Google Scholar] [CrossRef] [Scilit]
- Bessette-Kirton, E.; Cerovski-Darriau, C.; Schulz, W.; Coe, J.A.; Kean, J.W.; Godt, J.W.; Thomas, M.A.; Hughes, K.S. Landslides triggered by Hurricane Maria: Assessment of an extreme event in Puerto Rico. GSA Today 2019, 29, 4–10. [Google Scholar] [CrossRef] [Scilit]
- Khouakhi, A.; Villarini, G.; Vecchi, G.A. Contribution of tropical cyclones to rainfall at the global scale. J. Clim. 2017, 30, 359–372. [Google Scholar] [CrossRef] [Scilit]
- Needham, H.F.; Keim, B.D.; Sathiaraj, D. A review of tropical cyclone-generated storm surges: Global data sources, observations, and impacts. Rev. Geophys. 2015, 53, 545–591. [Google Scholar] [CrossRef] [Scilit]
- Guaraglia, D.; Carretero, S.; Rodrigues Capítulo, L.; Kruse, E. Assessing recharge, discharge, and sea-level rise impacts in a coastal aquifer using a new approach. Front. Water 2025, 7, 1714041. [Google Scholar] [CrossRef] [Scilit]
- Tang, S.; Huang, X.; Fei, J.; Cheng, X.; Yang, L.; Shao, S. Tropical cyclone outer-to-inner brightness temperature ratio: A new size-adaptive parameter reflecting storm intensity and its change. Geophys. Res. Lett. 2026, 53, e2025GL118384. [Google Scholar] [CrossRef] [Scilit]
- Knaff, J.A. Implications of summertime sea level pressure anomalies in the tropical Atlantic region. J. Clim. 1997, 10, 789–804. [Google Scholar] [CrossRef] [Scilit]
- Kossin, J.P.; Vimont, D.J. A more general framework for understanding Atlantic hurricane variability and trends. Bull. Am. Meteorol. Soc. 2007, 88, 1767–1782. [Google Scholar] [CrossRef] [Scilit]
- Lim, Y.-K.; Schubert, S.D.; Kovach, R.; Molod, A.M.; Pawson, S. The roles of climate change and climate variability in the 2017 Atlantic hurricane season. Sci. Rep. 2018, 8, 16172. [Google Scholar] [CrossRef] [Scilit]
- Rodgers, E.B.; Adler, R.F.; Pierce, H.F. Contribution of tropical cyclones to the North Atlantic climatological rainfall as observed from satellites. J. Appl. Meteorol. 2001, 40, 1785–1800. [Google Scholar] [CrossRef] [Scilit]
- Chalise, D.R.; Aiyyer, A.; Sankarasubramanian, A. Tropical cyclones’ contribution to seasonal precipitation and streamflow over the southeastern and southcentral United States. Geophys. Res. Lett. 2021, 48, e2021GL094738. [Google Scholar] [CrossRef] [Scilit]
- Franco-Diaz, A.; Klingaman, N.P.; Vidale, P.L.; Guo, L.; Demory, M.-E. The contribution of tropical cyclones to the atmospheric branch of Middle America’s hydrological cycle using observed and reanalysis tracks. Clim. Dyn. 2019, 53, 6145–6158. [Google Scholar] [CrossRef] [Scilit]
- Fernández–Alvarez, J.C.; Sorí, R.; Pérez–Alarcón, A.; Nieto, R.; Gimeno, L. The role of tropical cyclones on the total precipitation in Cuba during the hurricane season from 1980 to 2016. Atmosphere 2020, 11, 1156. [Google Scholar] [CrossRef] [Scilit]
- Hernández Ayala, J.J.; Matyas, C.J. Spatial distribution of tropical cyclone rainfall and its contribution to the climatology of Puerto Rico. Phys. Geogr. 2018, 39, 1–20. [Google Scholar] [CrossRef] [Scilit]
- Gu, G.; Adler, R.F. Observed variability and trends in global precipitation during 1979–2020. Clim. Dyn. 2023, 61, 131–150. [Google Scholar] [CrossRef] [Scilit]
- Hidalgo, H.G.; Alfaro, E.J.; Valverde, K.T.; Bazo, J. Probability of induced extreme precipitation events in Central America due to tropical cyclone positions in the surrounding oceans. Nat. Hazards 2023, 116, 2917–2933. [Google Scholar] [CrossRef] [Scilit]
- Lagos-Zuniga, M.; Balmaceda-Huarte, R.; Regoto, P.; Torrez, L.; Olmo, M.; Lyra, A.; Pareja-Quispe, D.; Bettolli, M.L. Extreme indices of temperature and precipitation in South America: Trends and intercomparison of regional climate models. Clim. Dyn. 2024, 62, 4541–4562. [Google Scholar] [CrossRef] [Scilit]
- Li, Y.; Zhao, D. Climatology of tropical cyclone extreme rainfall over China from 1960 to 2019. Adv. Atmos. Sci. 2022, 39, 320–332. [Google Scholar] [CrossRef] [Scilit]
- Chen, A.; Pokhrel, Y.; Chen, D.; Huang, H.; Dai, Z.; He, B.; Wang, J.; Li, J.; Wang, H.; Liu, J. Impact of tropical cyclones and socioeconomic exposure on flood risk distribution in the Mekong Basin. Commun. Earth Environ. 2024, 5, 704. [Google Scholar] [CrossRef] [Scilit]
- Knutson, T.R.; McBride, J.L.; Chan, J.; Emanuel, K.; Holland, G.; Landsea, C.; Held, I.; Kossin, J.P.; Srivastava, A.K.; Sugi, M. Tropical cyclones and climate change. Nat. Geosci. 2010, 3, 157–163. [Google Scholar] [CrossRef] [Scilit]
- Le Hénaff, M.; Domingues, R.; Halliwell, G.; Zhang, J.A.; Kim, H.-S.; Aristizabal, M.; Miles, T.; Glenn, S.; Goni, G. The role of the Gulf of Mexico ocean conditions in the intensification of Hurricane Michael (2018). J. Geophys. Res. Ocean. 2021, 126, e2020JC016969. [Google Scholar] [CrossRef] [Scilit]
- Fischer, M.S.; Reasor, P.D.; Tang, B.H.; Corbosiero, K.L.; Torn, R.D.; Chen, X. A tale of two vortex evolutions: Using a high-resolution ensemble to assess the impacts of ventilation on a tropical cyclone rapid intensification event. Mon. Weather Rev. 2023, 151, 297–320. [Google Scholar] [CrossRef] [Scilit]
- Moyano, D.H.; Rodriguez, A.; Montes, S.G. Caracterización Meteomarina Anual del Caribe Colombiano 2021; Editorial Dimar: Cartagena, Colombia, 2022. [Google Scholar] [CrossRef] [Scilit]
- Schumacher, R.S.; Galarneau, T.J., Jr.; Bosart, L.F. Distant effects of a recurving tropical cyclone on rainfall in a midlatitude convective system: A high-impact predecessor rain event. Mon. Weather Rev. 2011, 139, 650–667. [Google Scholar] [CrossRef] [Scilit]
- Ng, B.; Walsh, K.; Lavender, S. The contribution of tropical cyclones to rainfall in northwest Australia. Int. J. Climatol. 2015, 35. [Google Scholar] [CrossRef] [Scilit]
- Banks, R.F.; Baldasano, J.M. Impact of WRF model PBL schemes on air quality simulations over Catalonia, Spain. Sci. Total Environ. 2016, 572, 98–113. [Google Scholar] [CrossRef] [Scilit]
- Wu, H.; Zhang, Y.; Yu, Q.; Ma, W. Application of an integrated Weather Research and Forecasting (WRF)/CALPUFF modeling tool for source apportionment of atmospheric pollutants for air quality management: A case study in the urban area of Benxi, China. J. Air Waste Manag. Assoc. 2018, 68, 347–368. [Google Scholar] [CrossRef] [Scilit] [PubMed]
- Hong, S.-Y.; Dudhia, J.; Chen, S.-H. A revised approach to ice microphysical processes for the bulk parameterization of clouds and precipitation. Mon. Weather Rev. 2004, 132, 103–120. [Google Scholar] [CrossRef] [Scilit]
- Mlawer, E.J.; Taubman, S.J.; Brown, P.D.; Iacono, M.J.; Clough, S.A. Radiative transfer for inhomogeneous atmospheres: RRTM, a validated correlated-k model for the longwave. J. Geophys. Res. 1997, 102, 16663. [Google Scholar] [CrossRef] [Scilit]
- Janjic, Z.I. The step-mountain eta coordinate model: Further developments of the convection, viscous sublayer, and turbulence closure schemes. Mon. Weather Rev. 1994, 122, 927–945. [Google Scholar] [CrossRef] [Scilit]
- Janjic, Z. Nonsingular Implementation of the Mellor-Yamada Level 2.5 Scheme in the NCEP Meso model. In Office Note; National Centers for Environmental Prediction: College Park, MI, USA, 2002. [Google Scholar]
- Zhang, G.; Chen, Y.; Li, J. Effects of organic soil in the Noah-MP land-surface model on simulated skin and soil temperature profiles and surface energy exchanges for China. Atmos. Res. 2021, 249, 105284. [Google Scholar] [CrossRef] [Scilit]
- Dantas, L.G.; Santos, C.A.C.d.; Olinda, R.A.d.; Brito, J.I.B.d.; Santos, C.A.G.; Martins, E.S.P.R.; de Oliveira, G.; Brunsell, N.A. Rainfall prediction in the state of Paraíba, Northeastern Brazil using generalized additive models. Water 2020, 12, 2478. [Google Scholar] [CrossRef] [Scilit]
- Zhang, X.; Liu, C.; Liu, Y.; Yuan, X. An analysis of the impacts of meteorological factors on ozone concentration using generalized additive model in Tianjin, China. J. Atmos. Sol.-Terr. Phys. 2025, 277, 106669. [Google Scholar] [CrossRef] [Scilit]
- Mestre, O.; Hallegatte, S. Predictors of tropical cyclone numbers and extreme hurricane intensities over the North Atlantic using generalized additive and linear models. J. Clim. 2009, 22, 633–648. [Google Scholar] [CrossRef] [Scilit]
- Mao, L.; Xu, Y.; Qian, Q. Revisiting Loss Functions for Typhoon Trajectory Forecasting: A Haversine Distance-Based Approach. In Proceedings of the 2025 9th IEEE International Conference on Network Intelligence and Digital Content (IC-NIDC), Beijing, China, 7–9 November 2025; pp. 6–10. [Google Scholar]
- Zhang, C.; Lv, W.; Zhang, P.; Song, J. Multidimensional spatial autocorrelation analysis and it’s application based on improved Moran’s I. Earth Sci. Inform. 2023, 16, 3355–3368. [Google Scholar] [CrossRef] [Scilit]
- Troutman, B.M. Runoff prediction errors and bias in parameter estimation induced by spatial variability of precipitation. Water Resour. Res. 1983, 19, 791–810. [Google Scholar] [CrossRef] [Scilit]
- Emanuel, K. The Hurricane—Climate connection. Bull. Am. Meteorol. Soc. 2008, 89, ES10–ES20. [Google Scholar] [CrossRef] [Scilit]
- Kim, D.; Park, D.-S.R.; Nam, C.C.; Bell, M.M. The parametric hurricane rainfall model with moisture and its application to climate change projections. npj Clim. Atmos. Sci. 2022, 5, 86. [Google Scholar] [CrossRef] [Scilit]
- Tao, C.; Jiang, H.; Zawislak, J. The relative importance of stratiform and convective rainfall in rapidly intensifying tropical cyclones. Mon. Weather Rev. 2017, 145, 795–809. [Google Scholar] [CrossRef] [Scilit]
- Bruick, Z.S.; Rasmussen, K.L.; Rowe, A.K.; McMurdie, L.A. Characteristics of intense convection in subtropical South America as influenced by El Niño—Southern Oscillation. Mon. Weather Rev. 2019, 147, 1947–1966. [Google Scholar] [CrossRef] [Scilit]
- Dominguez, C.; Done, J.M.; Bruyère, C.L. Easterly wave contributions to seasonal rainfall over the tropical Americas in observations and a regional climate model. Clim. Dyn. 2020, 54, 191–209. [Google Scholar] [CrossRef] [Scilit]
- Herrera, D.; Dominguez, C.; Centella, A.; Sánchez-Murillo, R.; Pons, D.; Hidalgo, H.; Sierra-Lorenzo, M.; Cook, B.; Bregy, J.; Bezanilla, A. Tropical cyclones modulate drought characteristics in the Hurricane Region of the Americas. arXiv 2024. [Google Scholar] [CrossRef] [Scilit]
- Magaña, V.; Dominguez, C. Contribution of tropical cyclones to seasonal precipitation over the tropical Americas. Geophys. Res. Lett. 2017, 48, e2021GL094738. [Google Scholar]
- Gimeno-Sotelo, L.; Gimeno, L. Where does the link between atmospheric moisture transport and extreme precipitation matter? Weather Clim. Extrem. 2023, 39, 100536. [Google Scholar]
- Dominguez, C.; Magaña, V. The role of tropical cyclones in precipitation over the tropical and subtropical North America. Front. Earth Sci. 2018, 6, 312622. [Google Scholar] [CrossRef] [Scilit]
- Breña-Naranjo, J.A.; Pedrozo-Acuña, A.; Pozos-Estrada, O.; Jiménez-López, S.A.; López-López, M.R. The contribution of tropical cyclones to rainfall in Mexico. Phys. Chem. Earth Parts A/B/C 2015, 83, 111–122. [Google Scholar]
- Prat, O.P.; Nelson, B.R. Mapping the world’s tropical cyclone rainfall contribution over land using the TRMM multi-satellite precipitation analysis. Water Resour. Res. 2013, 49, 7236–7254. [Google Scholar]
- Feng, X.; Shu, S. How do weak tropical cyclones produce heavy rainfall when making landfall over China. J. Geophys. Res. Atmos. 2018, 123, 11–830. [Google Scholar] [CrossRef] [Scilit]
- Sinclair, V.A.; Catto, J.L. The relationship between extra-tropical cyclone intensity and precipitation in idealised current and future climates. Weather Clim. Dyn. 2023, 4, 567–589. [Google Scholar]
- Pollock, M.D.; O’donnell, G.; Quinn, P.; Dutton, M.; Black, A.; Wilkinson, M.E.; Colli, M.; Stagnaro, M.; Lanza, L.G.; Lewis, E.; et al. Quantifying and mitigating wind-induced undercatch in rainfall measurements. Water Resour. Res. 2018, 54, 3863–3875. [Google Scholar] [CrossRef] [Scilit]
- Dunn, R.E.; Fowler, H.J.; Green, A.C.; Lewis, E. Tipping-bucket rain gauges: A review of the undercatch phenomenon, and methods for its reduction and correction. Weather 2025, 80, 196–205. [Google Scholar] [CrossRef] [Scilit]

Disclaimer/Publisher’s Note: The statements, opinions and data contained in all publications are solely those of the individual author(s) and contributor(s) and not of MDPI and/or the editor(s). MDPI and/or the editor(s) disclaim responsibility for any injury to people or property resulting from any ideas, methods, instructions or products referred to in the content. |
© 2026 by the authors. Licensee MDPI, Basel, Switzerland. This article is an open access article distributed under the terms and conditions of the Creative Commons Attribution (CC BY) license.