


Abstract
OnVeMCS 1.1 is a standalone software for probabilistic human health risk assessment of pollutants in soil, sediment, water, air, and food, enabling Monte Carlo simulation (MCS) of risks across multiple exposure pathways. The hazard index (HI) and cancer risk metrics (TCR/ILCR) for ingestion, inhalation, and dermal contact are quantified using the standard dose/concentration approach. Users can manually enter analyte concentrations with various probability distributions or import them from Excel templates, and select scenario-specific exposure factor sets for residents (children and adults), outdoor and indoor workers, and food consumers. The software supports both one-dimensional (1D) and two-dimensional Monte Carlo simulation (2D MCS) modes. The results are presented through a variety of plots, including histograms and cumulative distribution functions (CDFs), pathway/analyte contribution charts, sensitivity analysis plots, nested CDFs, and uncertainty ribbons. The software also allows the overlay of two or more outputs and the inclusion of regulatory thresholds (HI = 1; TCR/ILCR = 10−6–10−4). The results are exported to a multi-sheet Excel workbook containing raw arrays, summary tables, exceedance probabilities, and sensitivity data. OnVeMCS operates quickly, with even 2D MCSs being completed in several seconds. OnVeMCS is distributed as a single Windows installer file with data examples and is free for the academic community.
1. Introduction
Environmental contamination often involves pollutants distributed across multiple environmental media such as soil [1], sediment [2,3], water [4], air [5], and food [6]. Exposure to such contaminants can occur through ingestion, inhalation or dermal contact, and individuals may be exposed simultaneously through several pathways [7,8]. Traditional point-estimate risk assessments, developed by the United States Environmental Protection Agency (USEPA) [9], typically calculate a single value for the hazard quotient (HQ) or cancer risk (CR), based on most-likely input values. While these deterministic assessments provide a preliminary indication of potential risk, they cannot capture the range of possible outcomes associated with variability in environmental concentrations or uncertainty in exposure factors. For this reason, a probabilistic approach, such as Monte Carlo simulation, is used to address the above-mentioned limitations. Furthermore, the USEPA has emphasised the importance of adequately characterising variability and uncertainty and recognises Monte Carlo analysis as a useful tool for risk assessment [10].
Among Monte Carlo approaches, one-dimensional Monte Carlo simulation (1D MCS) is the most commonly used, mainly because it is simpler to apply. Input variables are assigned probability distributions, random values are sampled and propagated through the risk equations, and the resulting output distribution can then be used to estimate percentiles and exceedance probabilities [11,12,13]. Recent applied studies of contaminated soils [14,15], sediment [16,17], groundwater [18,19], air [20,21], and food [22,23] commonly explore such probabilistic workflows. However, 1D MCS treats all inputs in the same way, considering only the parameter distribution, which means that variability and uncertainty are combined in a single output distribution [24,25]. As a result, it is not possible to determine how much of the output is driven by variability and how much by uncertainty in the input parameters, nor to identify which of the two is dominant. Two-dimensional Monte Carlo simulation (2D MCS) addresses this problem by using nested simulation loops to propagate uncertainty and variability separately [26,27]. In 2D MCS, each sample drawn in the outer loop is followed by a full set of inner-loop simulations, resulting in multiple risk distributions rather than a single distribution [28,29]. In practice, this means that instead of a single output distribution, a set of distributions is obtained, allowing uncertainty bounds to be defined around risk percentiles. In recent years, this method has been increasingly applied in environmental risk studies [30,31,32].
Probabilistic risk assessment is not complete without understanding which inputs drive the results. For this purpose, researchers most commonly use sensitivity analysis based on rank correlation coefficients [33,34] or the contribution-to-variance approach [35,36,37]. Therefore, it is possible to determine how a pollutant concentration or exposure parameter is related to health risk, how strongly it influences the result, and whether the relationship is positive or negative [38,39].
Despite the clear advantages of probabilistic approaches, their practical implementation remains challenging. A range of tools is currently used to perform Monte Carlo simulations and sensitivity analysis, including widely used Excel add-ins such as Oracle Crystal Ball (Oracle, Austin, TX, USA) [40] and Palisade @Risk (Palisade, Ithaca, NY, USA) [41], specialized tools such as the USEPA Stochastic Human Exposure and Dose Simulation (SHEDS) model [42], as well as models developed in programming languages such as R (RStudio, Boston, MA, USA) [43] and Python (Python Software Foundation, Beaverton, OR, USA) [44]. These tools are well established and provide substantial flexibility and analytical capability. However, their application involves manual model setup, Excel-based implementation, or the use of programming and advanced statistical knowledge, which may limit accessibility and reproducibility for some users. In addition, setting up the full model can take time and be prone to user error, as it usually requires defining the risk equations, specifying input and output variables, running the simulations, and then processing the results.
To address these challenges, the OnVeMCS software was developed as a standalone Windows desktop application specifically designed for probabilistic health risk assessment. The software integrates data input, distribution assignment, 1D MCS and 2D MCS, sensitivity analysis, and visual and tabular outputs within a single environment. It allows definition of scenario-specific exposure factors for diverse populations, including resident adults/children, indoor/outdoor workers and eight food consumer subgroups. With its user-friendly interface, OnVeMCS makes model setup and execution easier and reduces the need for programming or advanced statistical knowledge. This makes probabilistic risk assessment easier to apply in environmental studies and helps ensure that the analyses are reproducible. Therefore, OnVeMCS is particularly suited for researchers and scientists working in environmental health, exposure assessment, and risk analysis, while also being applicable to professionals in governmental institutions and private-sector organizations involved in the preparation of risk assessment studies.
Hence, this article aimed to describe the underlying risk methodology, software architecture, and features, demonstrate the application through a hypothetical case study, and discuss its potential use in environmental health research and regulation. In line with these objectives, the Supplementary Material provides example input data for different media, including air, water, sediment, soil, and food. It also includes the OnVeMCS setup files, installation manual, and license documentation to facilitate the installation and proper use of the software.
2. Materials and Methods
2.1. Risk Assessment Framework
OnVeMCS adheres to the standard USEPA [9] exposure framework. Within this software, it is possible to assess residential risk (for adults and children), occupational risk (for outdoor and indoor workers), and food-related risk, which is subdivided into eight life-stage categories: infant, toddler, child, adolescent, adult, elderly, pregnant, and lactating individuals.
First, the average daily dose (ADD) (also referred to as chronic daily intake (CDI) or estimated daily intake (EDI) or exposure concentration (EC)) is calculated, for each analyte and each exposure pathway. When water is the medium, the exposure pathways are ingestion and dermal contact. In the case of soil, the pathways include ingestion, dermal contact, and inhalation. For sediment, the pathways are ingestion and dermal contact. In contrast, for air as the medium, the only relevant exposure pathway is inhalation, whereas for food, ingestion is the sole pathway of exposure to contaminants. The following equations present the ADD/EDI/EC calculation for all four media.
- Water medium:
- Soil/sediment medium:
- Air medium:
- Food medium:
For occupational risk assessment (i.e., risk to workers), ADD/EC is calculated using the same equation as in the residential exposure scenario.
In the ADD/EDI/EC equation, in addition to the analyte concentration (Ci), exposure parameters are also included, and their explanation is provided in Table 1.
Table 1.
Explanation of exposure parameters used in the calculation of health risks in water, soil/sediment, air, and food.
OnVeMCS incorporates a library of exposure factor sets representing common receptor scenarios: (1) resident adults and children; (2) workers in outdoor or indoor environments; (3) and food consumers. Each scenario contains default ingestion rates, inhalation rates, skin surface areas, body weights, reference doses, and other parameters consistent with USEPA Exposure Factors Handbooks, European Food Safety Authority (EFSA), and other scientific literature [45,46]. These factors could be modified to reflect site-specific or regional data.
After calculating ADD/EDI/EC, the next step is to compute the hazard quotient (HQ) and cancer risk (CR), which are calculated in the same way regardless of the medium. The hazard quotient is defined as the ratio of ADD/EDI/EC to the reference dose (RfD, mg/kg/day) or concentration (RfC, mg/m3), whereas cancer risk is calculated as the product of ADD/EDI/EC and the cancer slope factor (SF, 1/(mg/kg/day)) or inhalation unit risk (IUR, 1/(mg/m3)). The sum of all HQs and CRs across analytes and exposure pathways represents the total non-carcinogenic risk, expressed as the hazard index (HI), and the total carcinogenic risk, expressed as total cancer risk (TCR) for soil/sediment, air, and food media, and as incremental lifetime cancer risk (ILCR) in the case of water. The equations for calculating HQ, CR, HI, and TCR/ILCR are as follows:
where HQij is the hazard quotient for analyte i via pathway j; ADDij/EDIij/ECij is the average daily dose or estimated daily intake or exposure concentration for analyte i via pathway j; RfDij (or RfCij) is the reference dose (or concentration) for analyte i via pathway j; CRij is the cancer risk for analyte i via pathway j; and SFij (or IURij) is the cancer slope factor (or inhalation unit risk) for analyte i via pathway j. The total number of analytes is denoted by n, and the total number of exposure pathways is denoted by m.
Non-carcinogenic risk is considered negligible if HI < 1 [47,48]. On the other hand, carcinogenic risk is considered negligible if TCR < 1 × 10⁻⁶, and acceptable if it falls between 1 × 10⁻⁶ and 1 × 10⁻⁴. Non-carcinogenic risk values greater than 1 and carcinogenic risk values greater than 1 × 10⁻⁴ are considered unacceptable [49,50].
2.2. Monte Carlo Simulation
2.2.1. One-Dimensional Monte Carlo (1D MCS)
Health risk assessment can be deterministic or probabilistic. The deterministic approach assumes that all input variables are fixed values. Since exposure parameters are typically assigned for an average population, this may lead to either overestimation or underestimation of risk [51,52]. This limitation can be overcome by applying the Monte Carlo simulation as a probabilistic approach.
In Monte Carlo simulation, probabilistic distributions are assigned to input concentrations and exposure parameters, and this type of simulation is referred to as one-dimensional Monte Carlo simulation. OnVeMCS supports eight types of concentration distributions: Fixed, Normal, Lognormal, Triangular, Uniform, BetaPERT, Gamma, and Weibull. For exposure parameters, the software applies the distributions most commonly used in the literature [45,46]. All exposure parameter values and their distributions are summarized in the Excel file exported after running the simulation.
By performing a large number of iterations, the model calculates the output, i.e., the health risk, resulting in a probabilistic distribution of risk. The resulting sample distributions are summarized through means, medians, percentiles (e.g., 5th, 50th, and 95th), histograms, and cumulative distribution functions. These outputs enable analysts to quantify the likelihood that risk metrics exceed regulatory thresholds.
2.2.2. Two-Dimensional Monte Carlo (2D MCS)
A more advanced version of Monte Carlo simulation involves two nested one-dimensional Monte Carlo simulations, which can simultaneously address both the variability and the uncertainty of input variables, rather than only variability, as is the case with 1D MCS [53,54]. This approach is called two-dimensional Monte Carlo simulation (2D MCS). Within this model, there are two loops: an outer loop with n simulations that addresses uncertainty, and an inner loop with m simulations that addresses variability [25,55]. For each of the n simulations in the outer loop, m simulations are performed in the inner loop, resulting in m × n outcomes and n probabilistic distributions. The most sensitive variables, as identified through sensitivity analysis (Section 2.2.3), are placed in the outer loop [56].
In OnVeMCS software users select parameters to be treated as uncertain. Outputs include nested CDFs, uncertainty ribbons (shaded bands around CDFs representing confidence intervals), risk-surface plots that display how outcomes vary across uncertain parameter values, and butterfly plots illustrating the spread of the outer and inner simulations. These features assist analysts in distinguishing whether high-risk outcomes are driven by variability or parameter uncertainty.
2.2.3. Sensitivity Analysis in Probabilistic Health Risk Assessment
One of the advantages of Monte Carlo simulation is that it enables sensitivity analysis, which makes it possible to identify the parameters that have the greatest influence on the risk value [57,58]. OnVeMCS implements percentage of variance explained and tornado plots. Tornado plots rank parameters according to the absolute difference in output percentiles when each parameter is varied across its range, providing an intuitive visual ranking of risk drivers. Sensitivity analysis is useful because it can support decision-making in health risk assessment by helping identify which factors most influence health outcomes, which uncertainties matter most, where additional data collection would be most valuable, and which variables can be simplified or excluded from further analysis [59].
3. Software Implementation
3.1. Software Architecture
The OnVeMCS application is packaged as a single Windows executable and distributed free of charge for academic use. The current release (ver. 1.1; June 2026) includes example datasets and an Excel template for data import.
3.2. User Interface and Workflow
Figure 1 illustrates the typical workflow in OnVeMCS. The left panel presents the input controls where users may:
- Define analytes and concentrations. Concentrations can be entered manually or imported from an Excel template. During import, units are normalized (e.g., mg/kg for food, soil, and sediment, μg/L for water, and ng/m3 for air) and the software automatically detects column headers corresponding to analyte names, media and units.
- Assign the analyte distributions. For each analyte and medium, users select a distribution type and specify its parameters (mean and standard deviation for Normal; shape and scale for Gamma, etc.). After the simulation is run, the resulting distribution is also presented graphically in the form of a histogram as one of the output results.
- Select the exposure scenario. A drop-down menu allows selection of the receptor scenario, including residential (adults and children), worker (outdoor and indoor), and food consumer (infant, toddler, child, adolescent, adult, elderly, pregnant, and lactating). Users also select the environmental media for which risk assessment is performed, as well as the relevant exposure pathways, including ingestion, inhalation, and dermal contact.
- Configure the simulation settings. Users choose the number of iterations for 1D MCS and outer/inner loop sizes for 2D MCS, and set random seeds for reproducibility.
Figure 1.
Initial screen after the OnVeMCS application is launched.
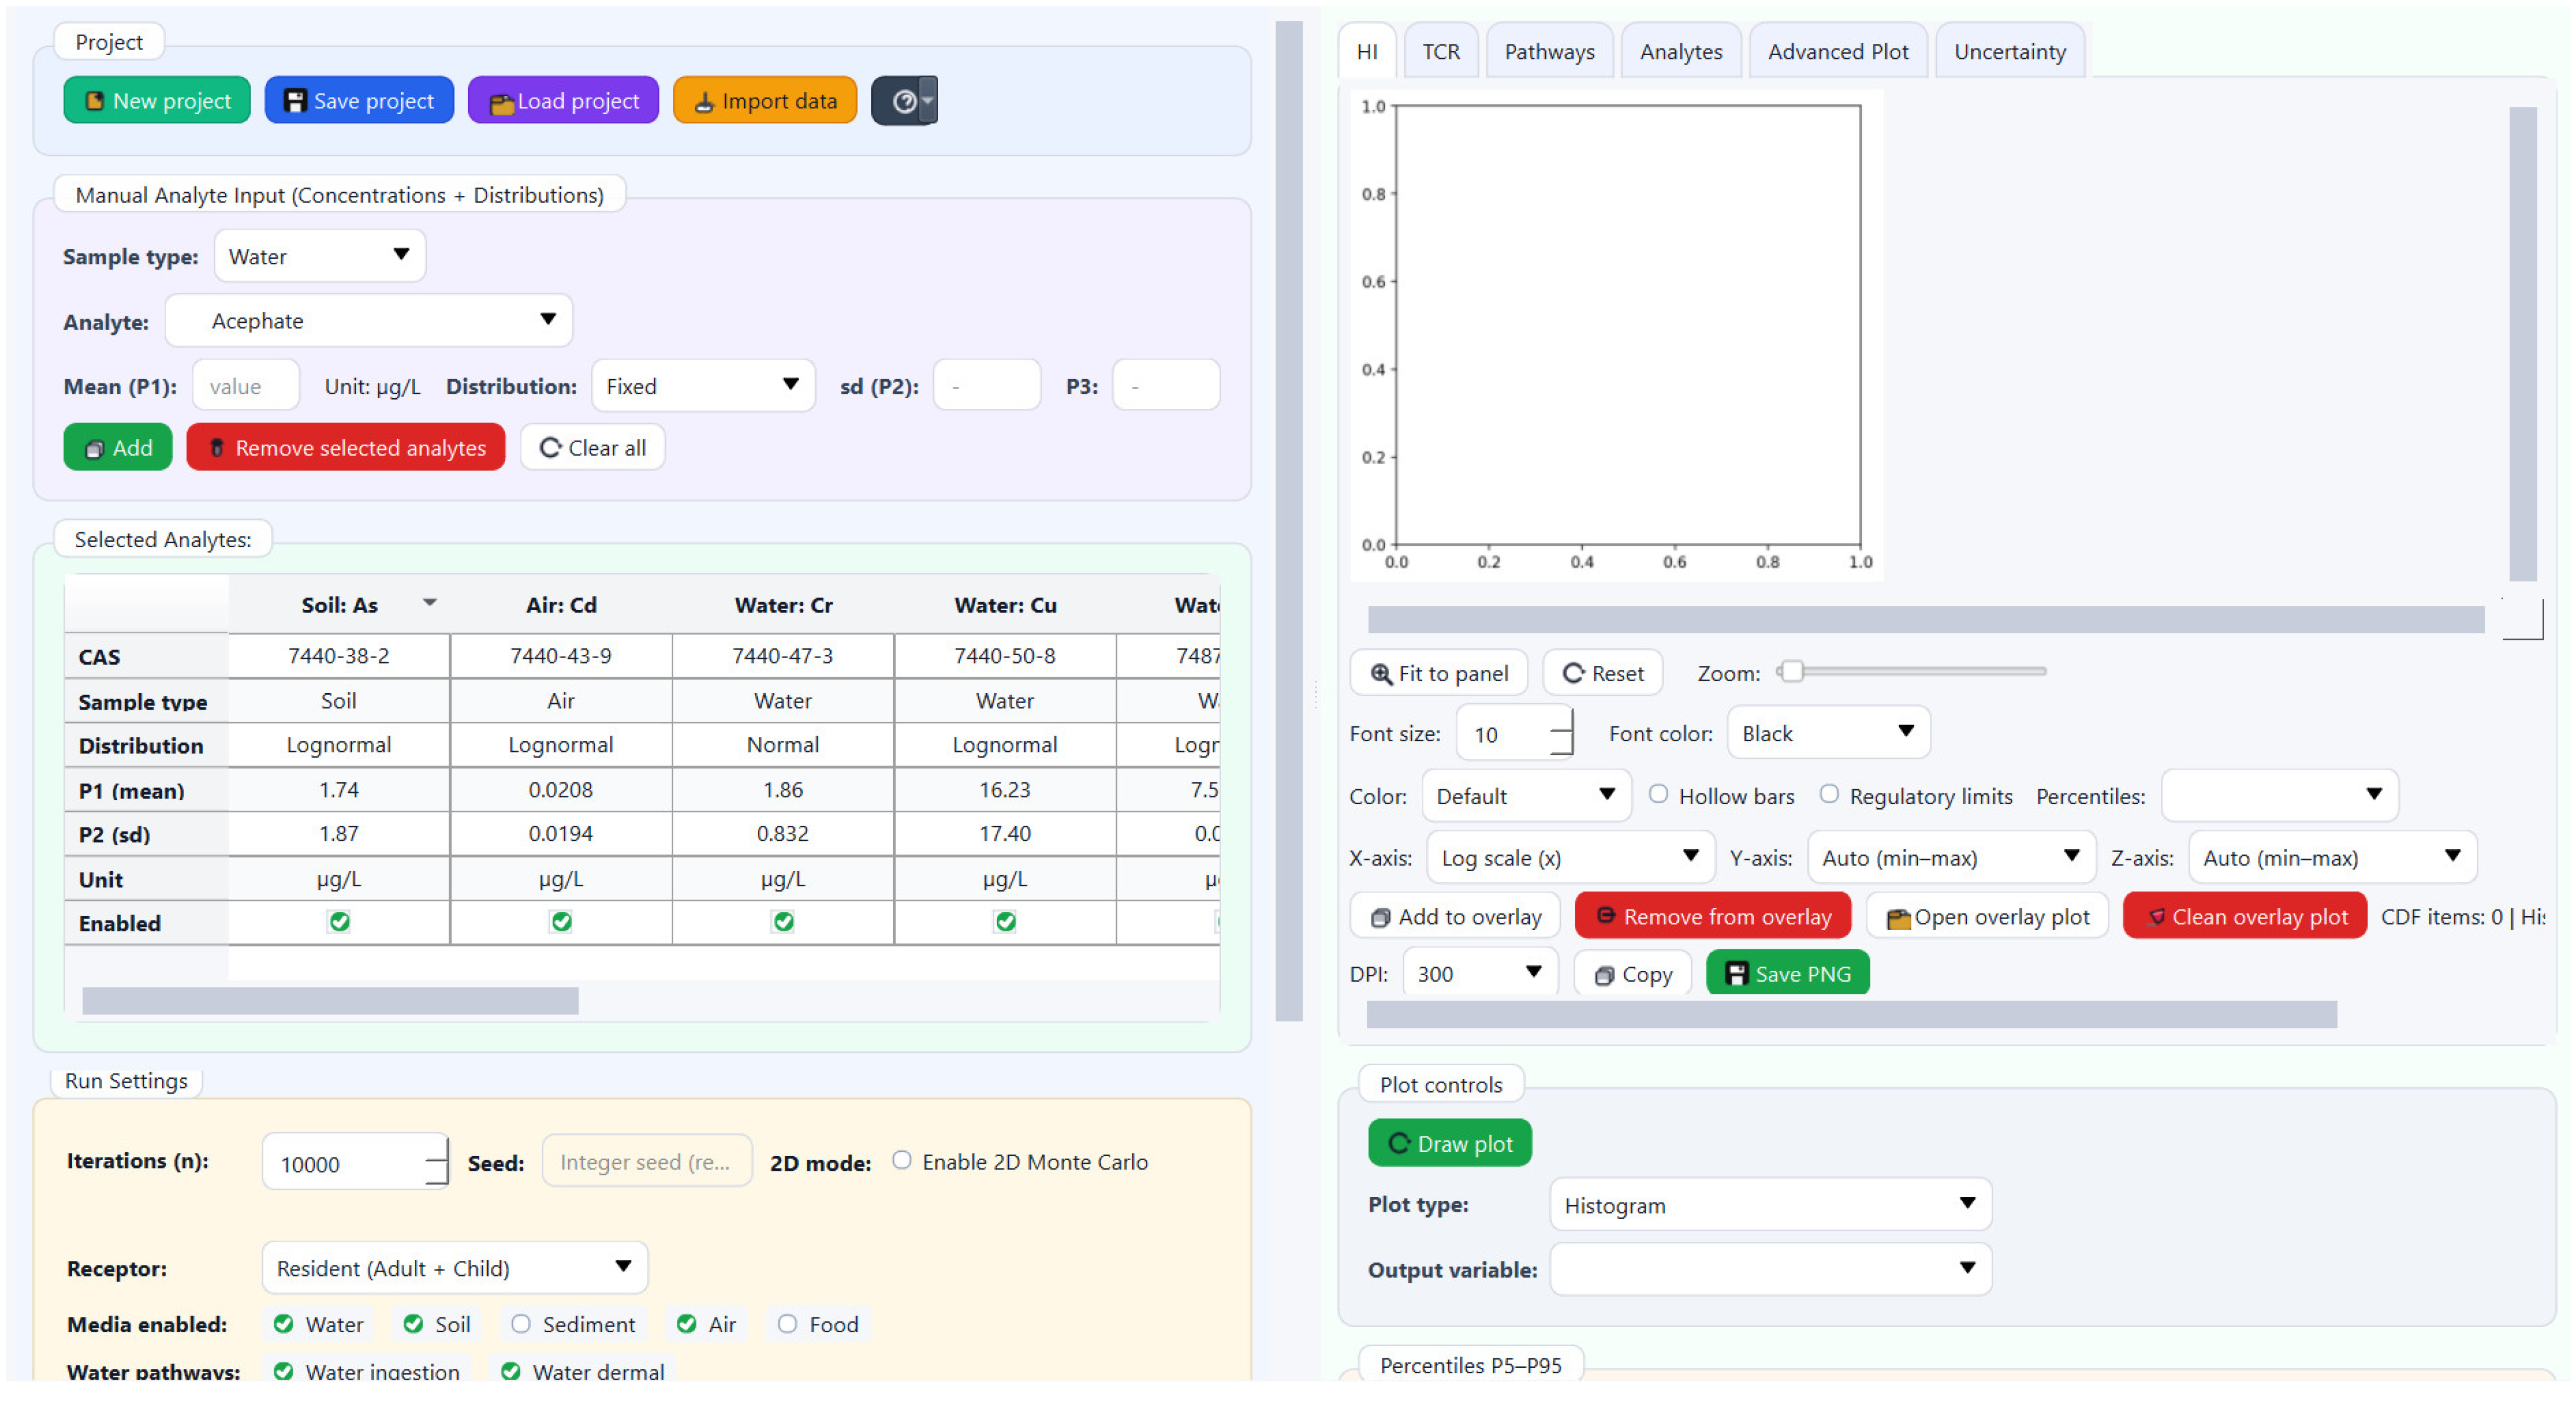
Upon clicking Run simulation, the results appear in the right panel as a series of tabs containing plots, tables, and summary statistics. Simulation outputs can also be exported to a multi-sheet Excel workbook containing results, including deterministic and probabilistic risk estimates, percentile summaries, exceedance probabilities, sensitivity metrics, and detailed HQ/CR results by analyte, pathway, receptor, or scenario. Users may also export individual plots as high-resolution PNG files.
3.3. Demonstration Case Study
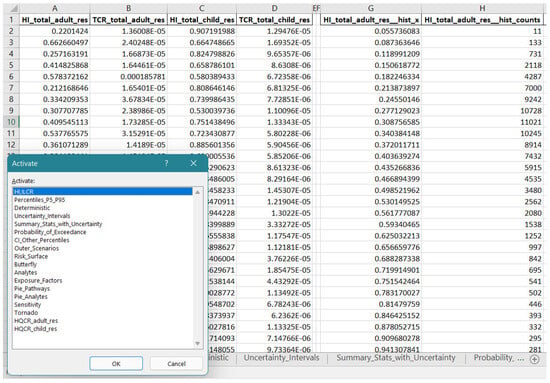
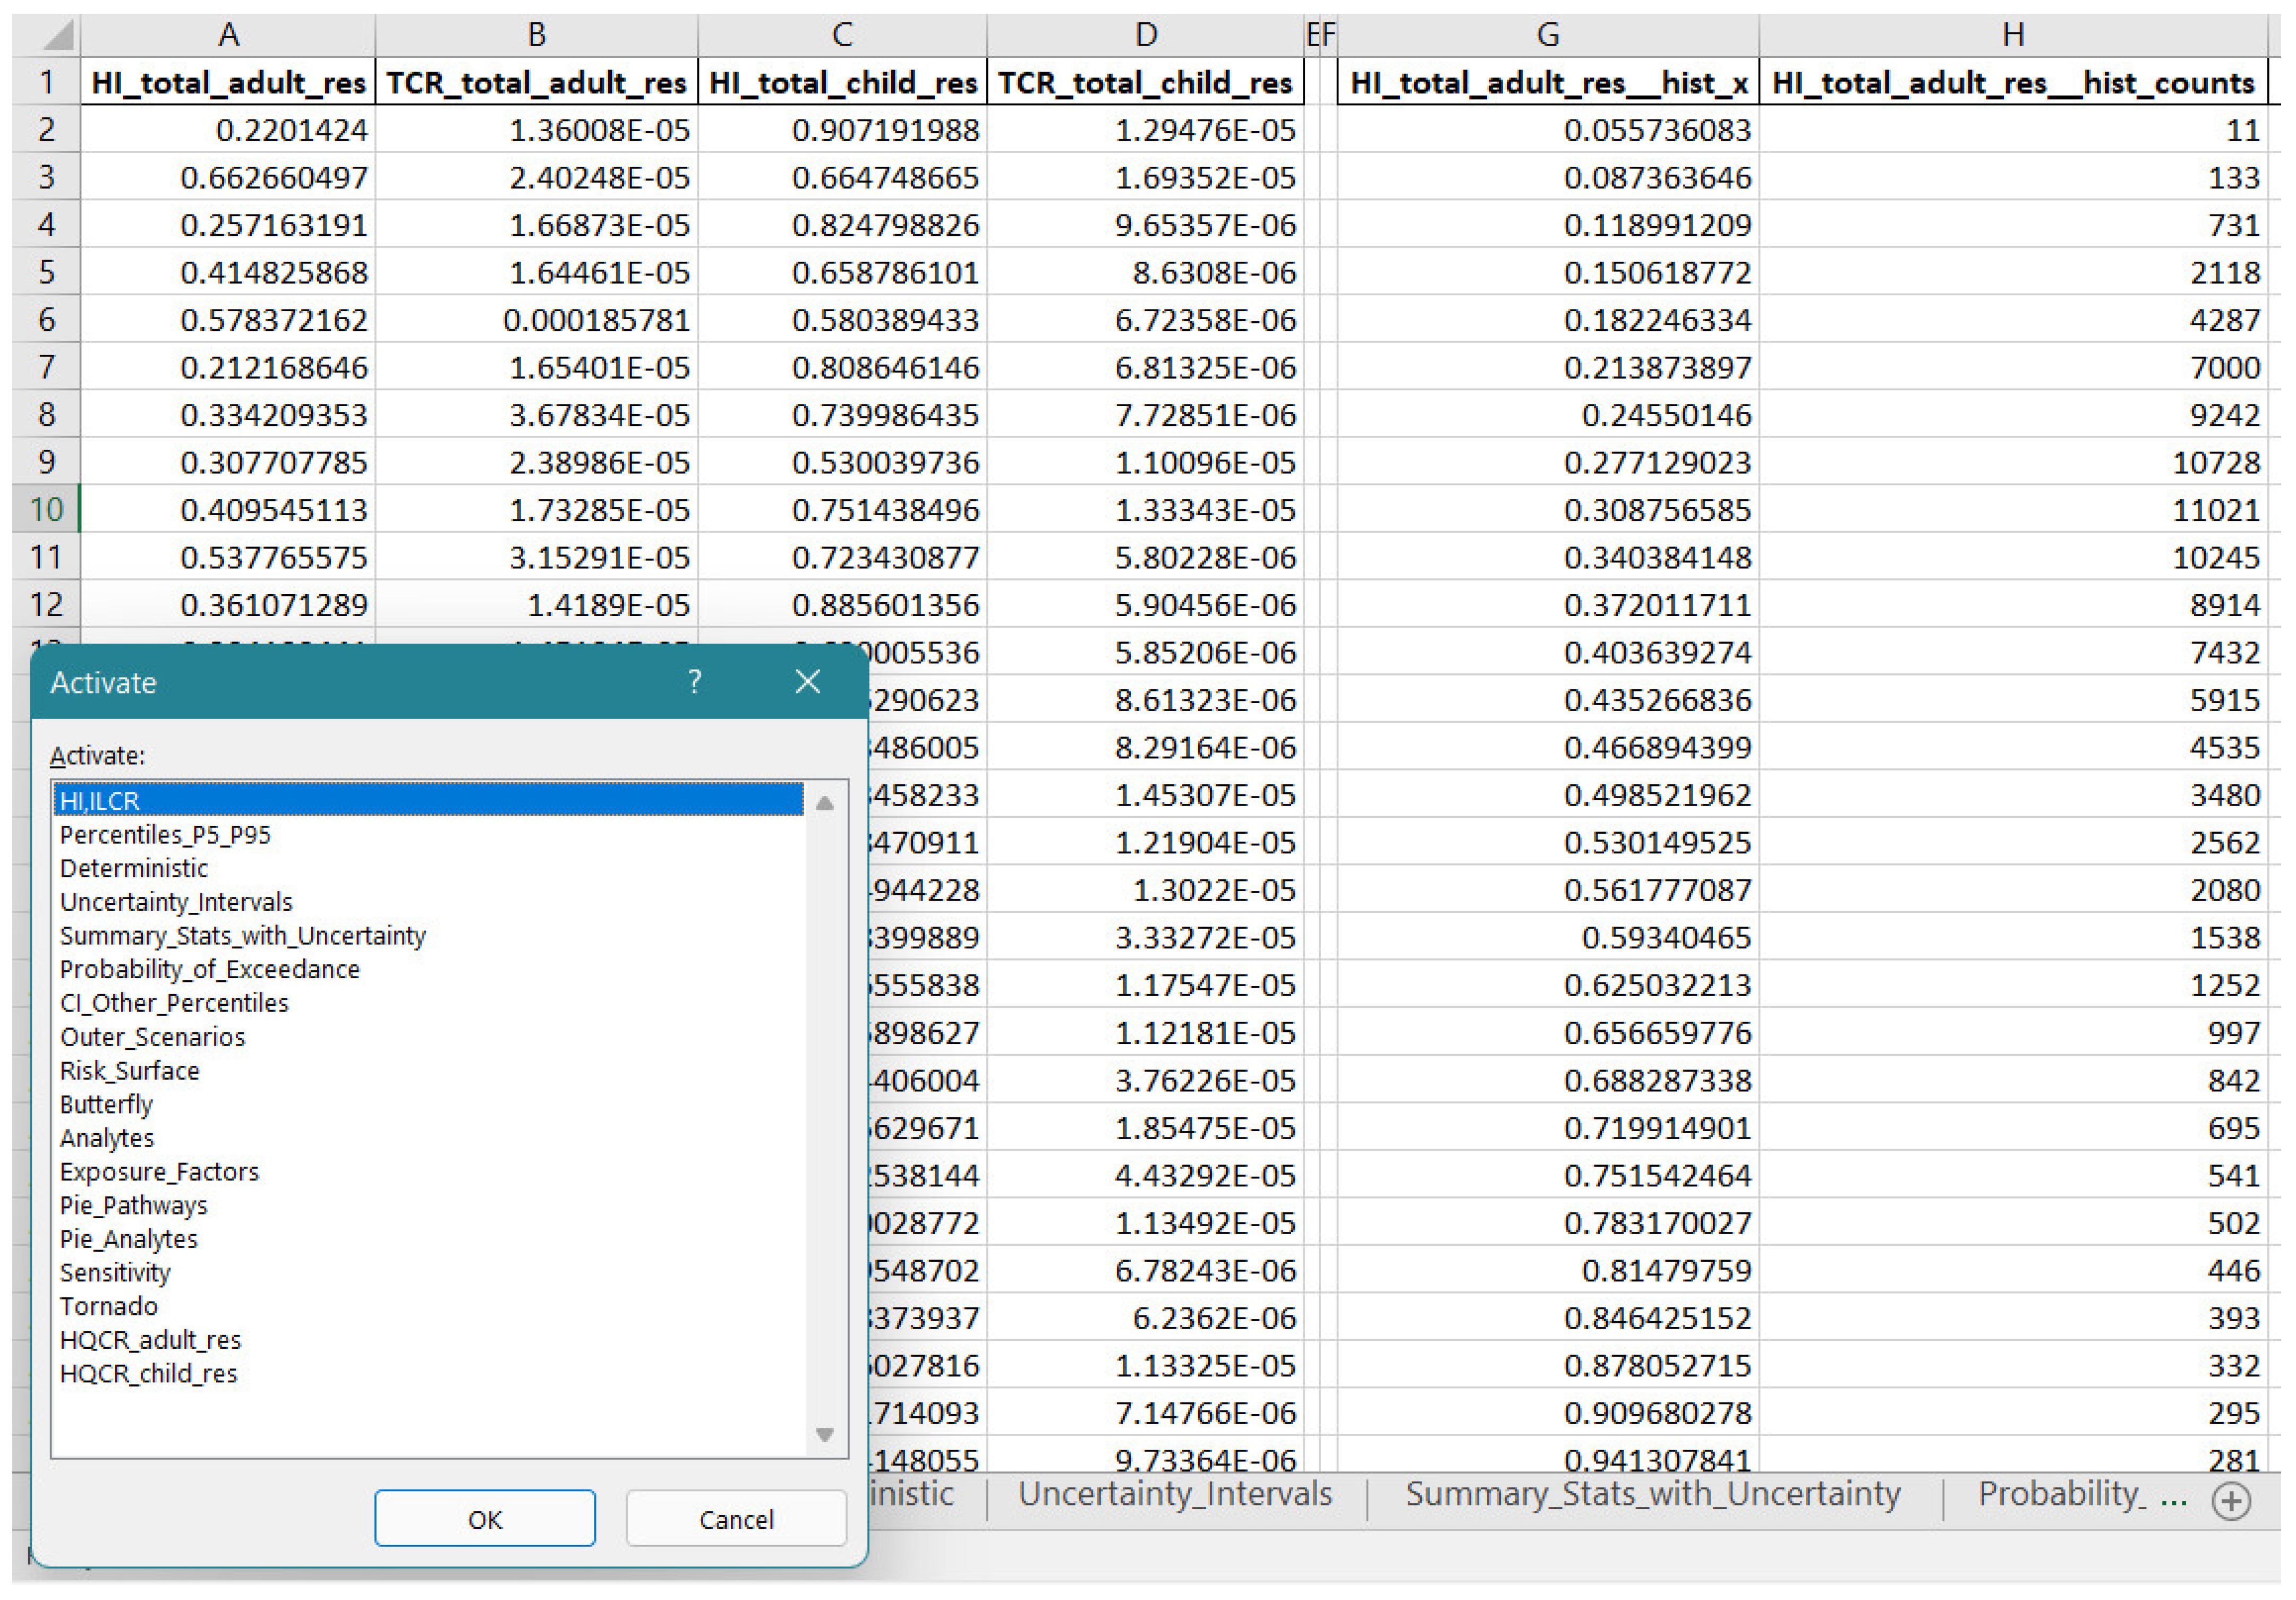
To illustrate OnVeMCS’s capabilities, a hypothetical scenario in which 13 contaminants (Cd, Cr, Cu, Ni, Pb, Zn, Hg, As, V, Fe, Mn, NO3−, and F−) are present in groundwater was simulated. The concentrations of all heavy metal(loid)s are estimated to follow lognormal distributions, while NO3− and F− follow a normal distribution. Exposure factors correspond to adult and child residents. A 1D MCS with 10,000 iterations was conducted, and HI and ILCR computed. Subsequently, a 2D MCS was performed using 1000 variability and 100 uncertainty simulations. The 1D MCS required 3.18 s to complete, whereas the 2D MCS required 6.93 s. In the following subsections, all graphical outputs generated using OnVeMCS will be presented and explained. In addition, all data required for generating the plots are available in the exported Excel file, as shown in Figure 2.
Figure 2.
Contents of the exported Excel workbook containing all results obtained in OnVeMCS.
3.3.1. Probabilistic Outputs
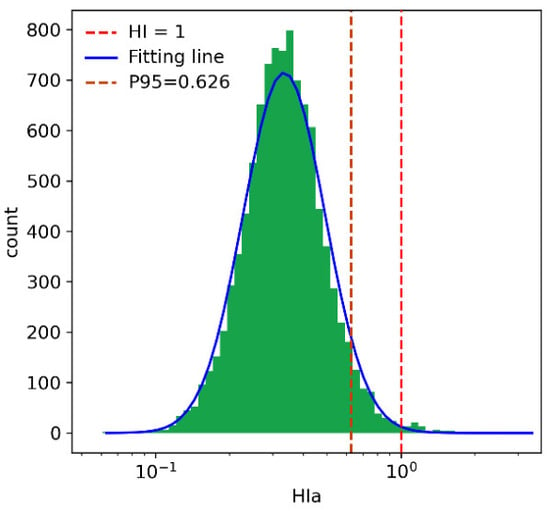
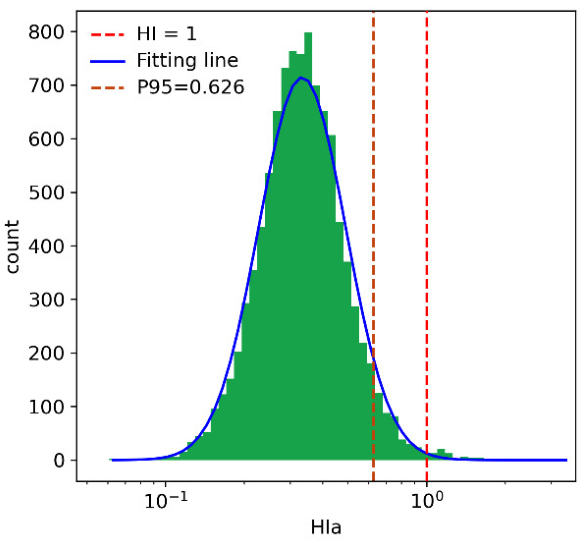
Figure 3 shows the histogram of the hazard index for adults (HIa) resulting from the simulation. The green bars represent the frequency of HIa values and the red dashed vertical line marks HI = 1, indicating the non-carcinogenic threshold. Furthermore, the blue fitting line on the histogram represents the theoretical distribution curve fitted to the Monte Carlo simulation results, calculated from the mean and standard deviation of the simulated outcomes. Additionally, dashed brown line represents the 95th percentile risk value. Most simulated values lie below 1, although a small fraction exceeded the threshold, highlighting the utility of probabilistic assessment over single-point estimates.
Figure 3.
Histogram plot of a simulated non-carcinogenic risk for adults (HIa) with a fitting line and a reference line at HI = 1.
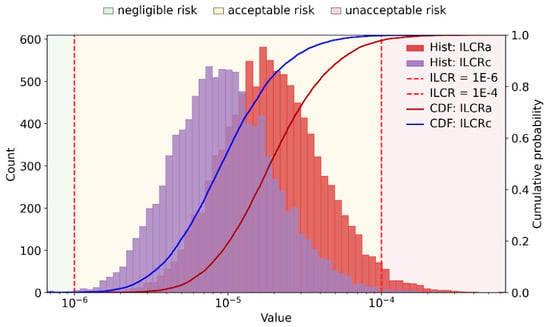
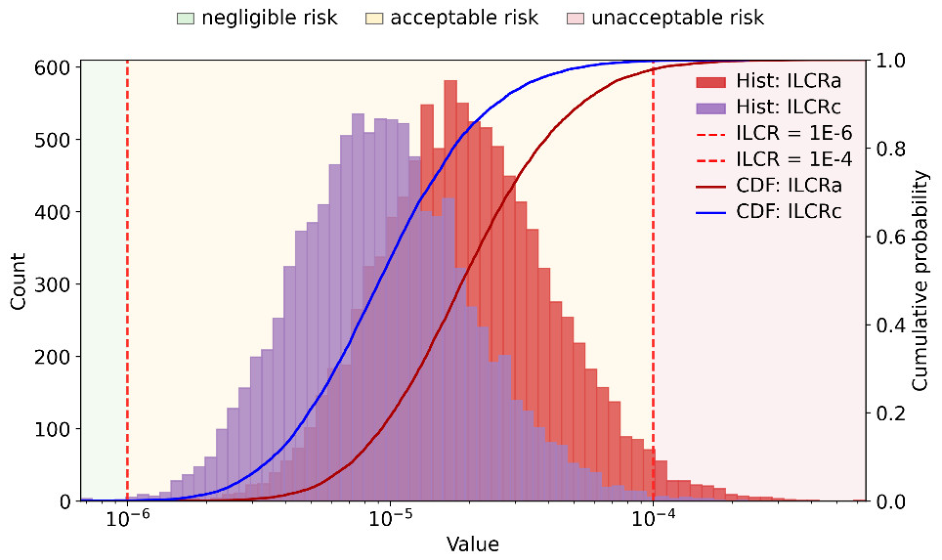
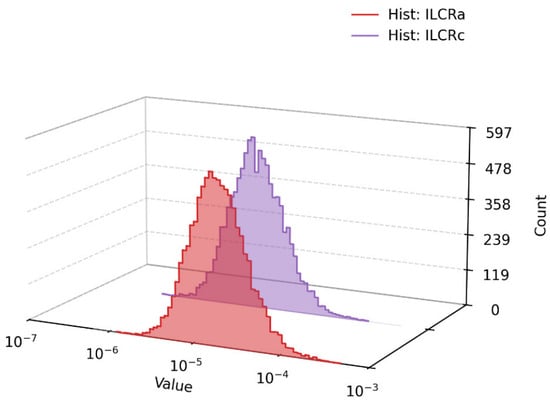
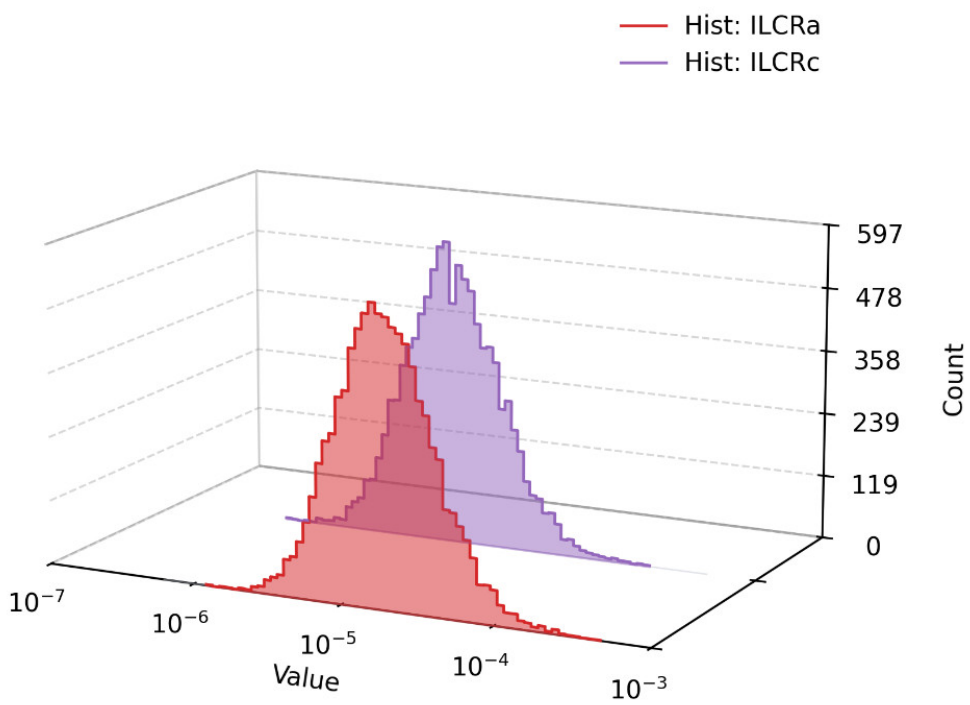
Figure 4 presents the cumulative distribution function (CDF) and histogram overlay plot of total carcinogenic risk for adults (ILCRa) and children (ILCRc). The dashed lines at 10−6 and 10−4 delineate the USEPA’s carcinogenic risk thresholds. In the overlay plot in OnVeMCS it is also possible to add colors for risk regions, as shown in Figure 4. Most of the simulated values for both variables fall within this range, whereas the position of the ILCRa curve suggests higher carcinogenic risk estimates than those of ILCRc under the simulated conditions. The CDF can be used to identify risk levels associated with selected percentiles. Additionally, it is possible to generate 3D-view plots of overlaid histograms or CDF lines in OnVeMCS. A 3D plot of overlaid histograms is presented in Figure 5.
Figure 4.
Overlay plot of histograms and cumulative distribution functions (CDFs) of carcinogenic risk for adults (ILCRa) and children (ILCRc) with reference lines at 10−6 and 10−4.
Figure 5.
Three-dimensional overlay plot of histograms of carcinogenic risk for adults (ILCRa) and children (ILCRc).
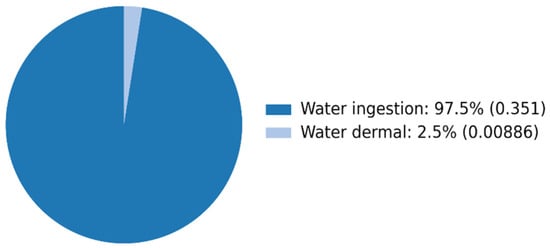
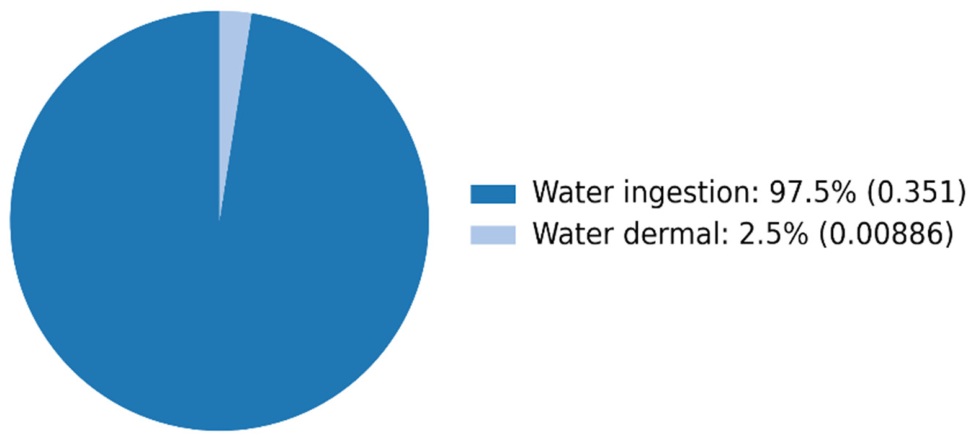
Figure 6 summarizes the contributions of ingestion and dermal pathways to the HIa. The pie charts show the percentage contribution of each exposure pathway, together with the mean risk value associated with each of them. For this example, ingestion dominates non-carcinogenic risk. Therefore, the pie charts are particularly useful for identifying the dominant exposure pathways and supporting risk management decisions by indicating which pathways contribute most to the overall risk.
Figure 6.
Pie charts showing the contributions of individual exposure pathways to non-carcinogenic risk for adults (HIa).
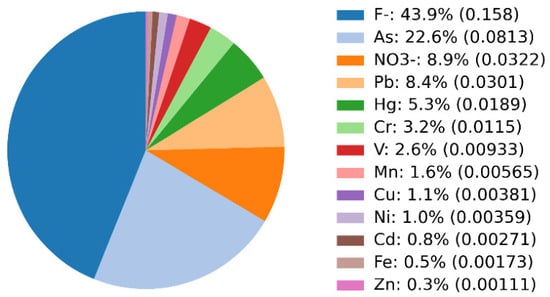
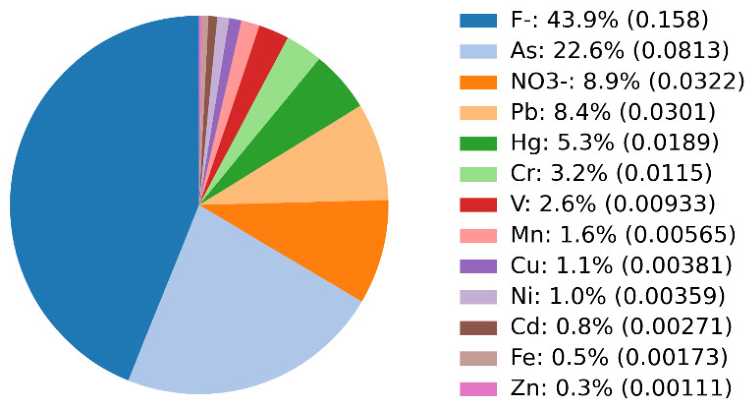
Figure 7 shows the contribution of individual analytes to the total risk. Analogously to the pie charts for the exposure pathways, this chart shows the percentage contribution of each analyte, together with the corresponding mean risk value. Fluoride concentration accounted for the majority of risk (43.9%) due to its higher concentration and toxicity, whereas Fe or Zn concentrations had a negligible impact.
Figure 7.
Pie charts showing the contributions of individual analytes to non-carcinogenic risk for adults (HIa).
3.3.2. Sensitivity Analysis
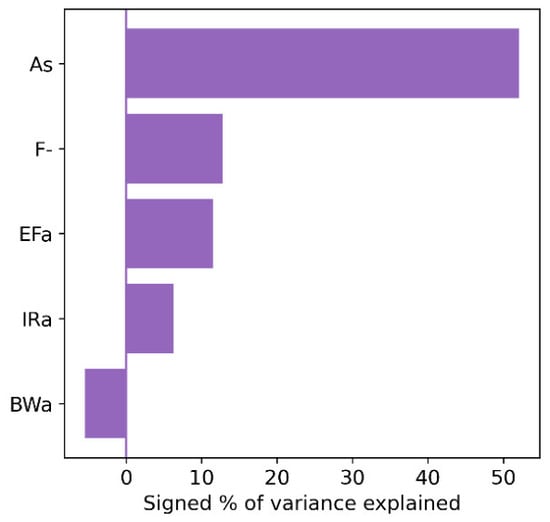
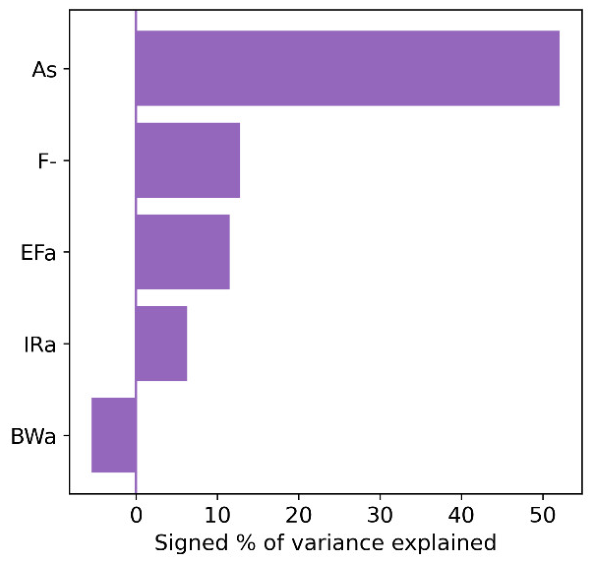
Figure 8 depicts the sensitivity analysis results for HIa. The results are presented for the five most sensitive parameters: As concentration, F− concentration, exposure frequency (EFa), ingestion rate (IRa), and body weight (BWa). Notably, the user can choose how many parameters will be displayed in the sensitivity plot within the OnVeMCS software. Positive sensitivity values indicate that increasing the parameter increases risk, whereas negative values indicate an inverse relationship. In this case, the As and F− concentration are the most influential drivers of HIa, suggesting that efforts to reduce concentration levels of these contaminants could substantially lower the risk. The only parameter characterized by a negative value in the sensitivity plot was body weight (BWa), indicating that individuals with higher body weight are less susceptible to risk.
Figure 8.
Sensitivity plot illustrating the effect of each input variable on non-carcinogenic risk for adults (HIa).
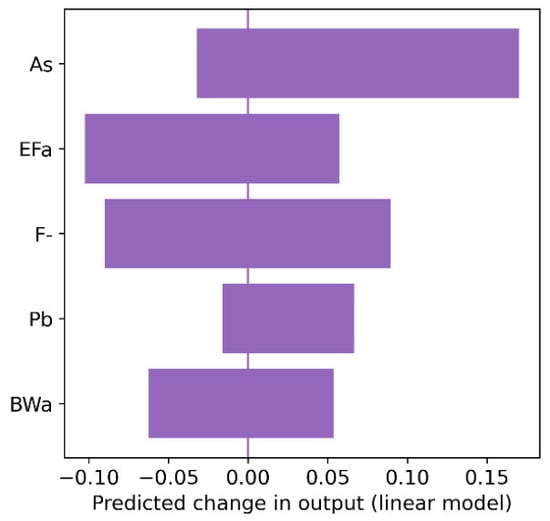
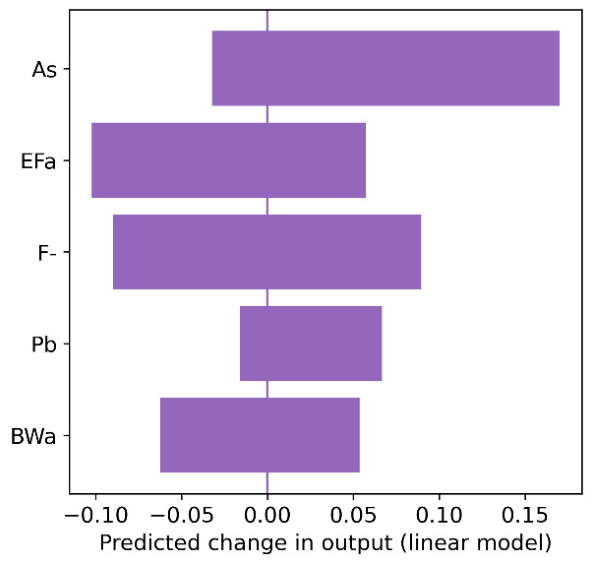
Figure 9 shows the tornado plot for HIa, which ranks parameters based on the spread between low (5th percentile) and high (95th percentile) risk estimates when each parameter is varied across its distribution while others are held at median values. A longer left or right side indicates that the effect is stronger in that direction, which may reflect both the sign of the regression coefficient and asymmetry of the input distribution around the median. Consistent with the sensitivity analysis results, the As concentration produces the largest variation in risk, followed by exposure frequency, and F− concentration.
Figure 9.
Tornado plot for non-carcinogenic risk for adults (HIa) showing the predicted change in model output associated with varying each parameter from its median to its 5th and 95th percentile using a linear model.
3.3.3. Two-Dimensional MCS
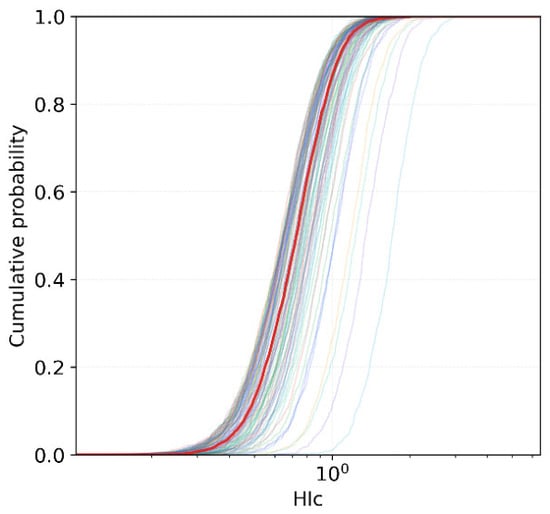
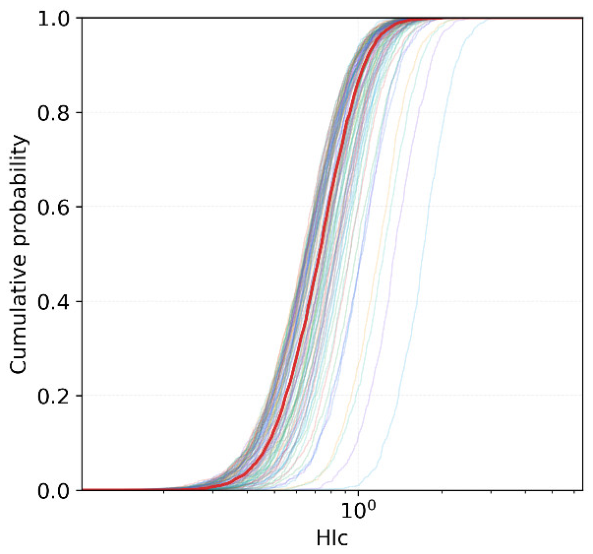
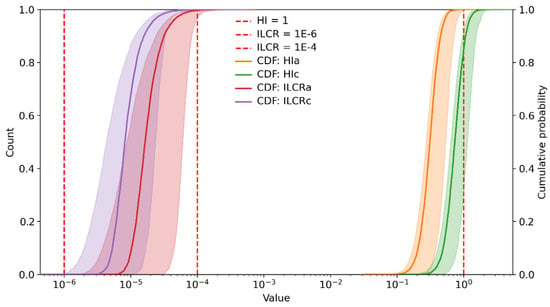
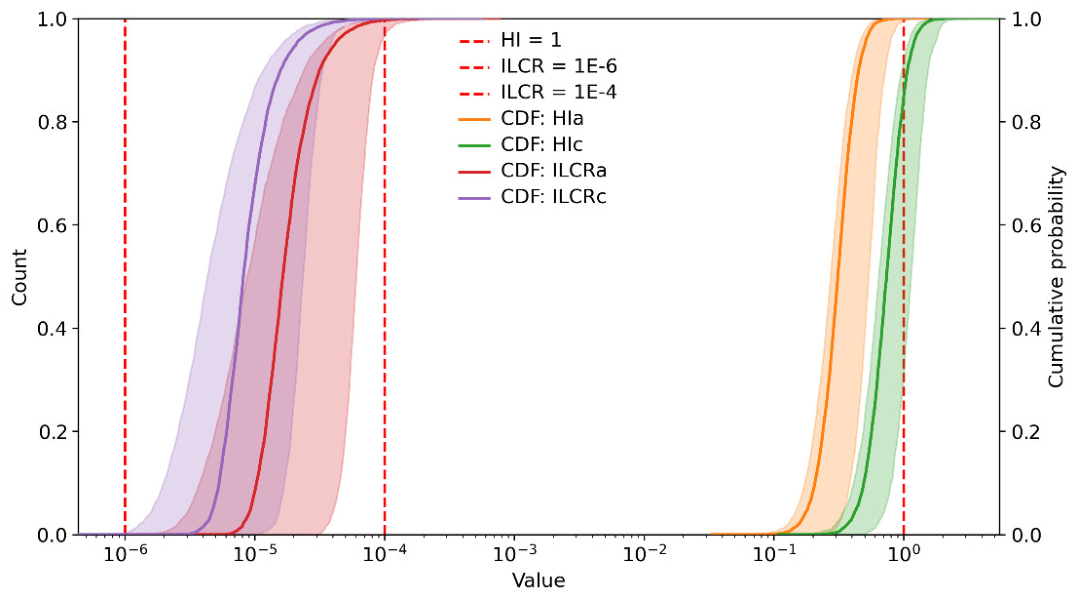
OnVeMCS can generate nested CDFs and uncertainty ribbons when 2D MCS is conducted. These outputs help visualize the variability and uncertainty separation across the input parameters. Each curve on the nested CDF plot corresponds to one uncertainty simulation, and the spread of the curves illustrates the uncertainty in the model predictions. The CDF with confidence band shows the cumulative distribution of the model output together with the uncertainty across the outer Monte Carlo iterations. The central curve represents the median CDF at each point, whereas the shaded band shows the 5th–95th percentile range of CDFs obtained from repeated uncertainty simulations. Figure 10 shows the nested CDF plot for non-carcinogenic risk in children (HIc), whereas Figure 11 presents the CDFs with confidence bands for HIa, HIc, ILCRa, and ILCRc.
Figure 10.
Nested cumulative distribution functions (CDFs) of non-carcinogenic risk for children (HIc) generated from repeated Monte Carlo uncertainty simulations.
Figure 11.
Cumulative distribution functions (CDFs) with confidence bands for the simulated risk metrics, illustrating model output distributions and uncertainty across Monte Carlo simulations.
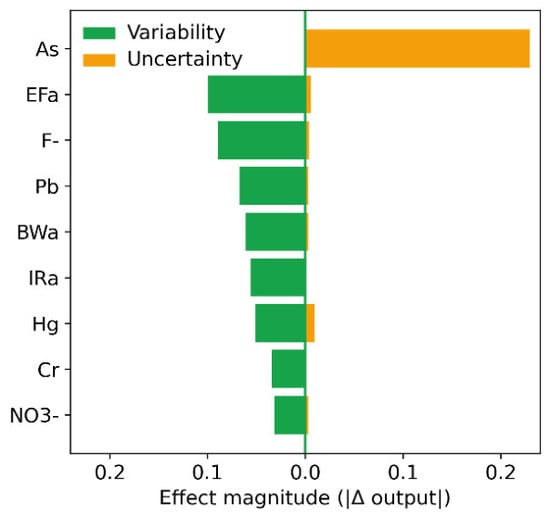
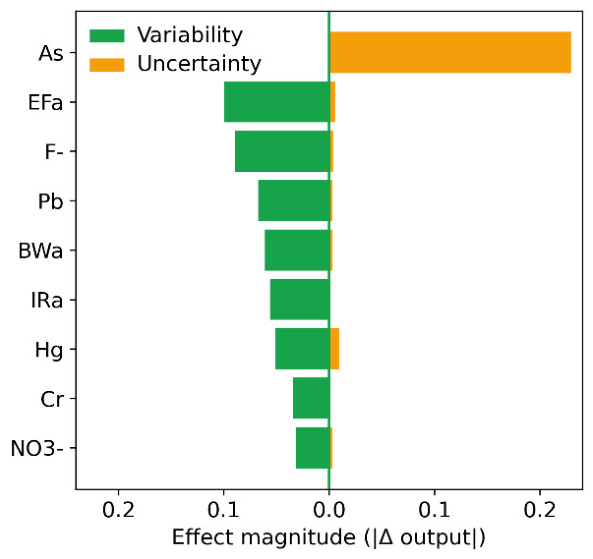
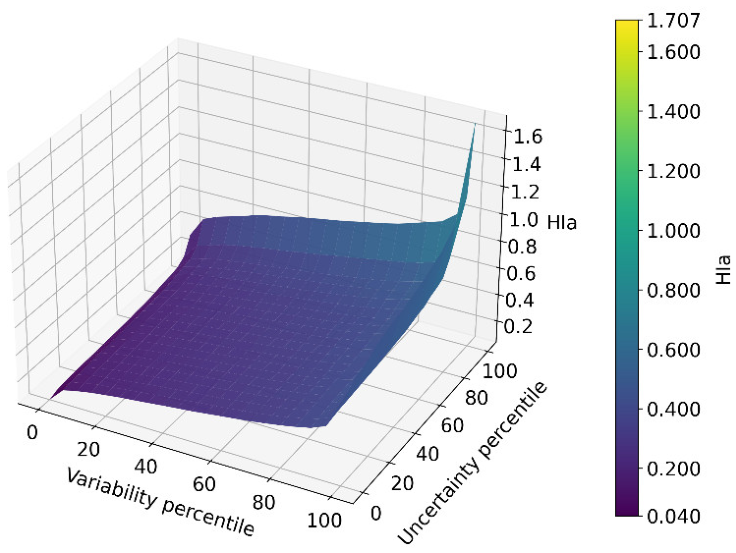
Within the section related to 2D MCS, in addition to nested CDFs and CDFs with confidence bands, the OnVeMCS software also allows the generation of butterfly plots and risk surface plots. Figure 12 shows the butterfly plot for HIa. The butterfly plot separates the contribution of each input parameter into variability-driven and uncertainty-driven components in the 2D MCS. The left bars represent variability, the right bars represent uncertainty, and longer bars indicate greater influence on output variation.
Figure 12.
Butterfly plot of variability and uncertainty contributions for the analyzed input parameters in the two-dimensional Monte Carlo simulation of non-carcinogenic risk for adults (HIa).
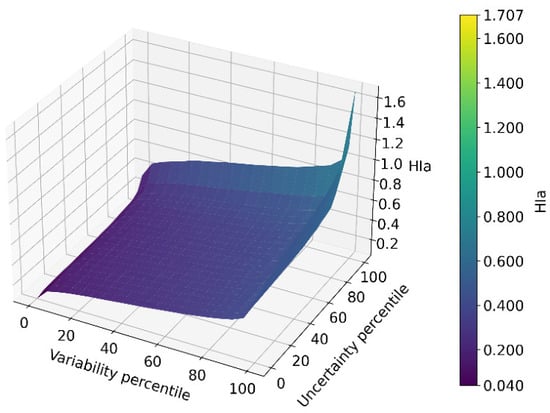
Furthermore, uncertainty and variability can be examined in the risk surface plot, as shown in Figure 13. The x-axis represents the variability percentile, the y-axis represents the uncertainty percentile, and the surface height indicates the predicted risk value.
Figure 13.
Risk surface plot showing the model output (HIa) as a function of variability and uncertainty percentiles in the two-dimensional Monte Carlo simulation.
4. Discussion
4.1. Simulation Reproducibility and Comparison with the Existing Tools
Reproducibility was assessed by performing ten independent simulations using the same case study and simulation settings. The coefficient of variation (CV) was used to quantify differences among repeated runs. The repeated simulations produced highly consistent results, with only minor variability between runs. The CV for the median values ranged from 0.3% to 0.5% for non-carcinogenic risk and from 0.7% to 1.0% for carcinogenic risk. The highest observed variability was found for the 95th percentile of carcinogenic risk, where the CV reached 2.4% on average. These results confirm that OnVeMCS provides stable and reproducible outputs under identical input assumptions and simulation settings.
In addition to demonstrating stable simulation outputs, it is also important to place OnVeMCS in the context of existing software for Monte Carlo-based risk assessment. Monte Carlo simulation capabilities are available in several general-purpose software packages. However, these tools are often implemented as Excel add-ins (e.g., Oracle Crystal Ball and Palisade @Risk) or require coding and advanced statistical expertise, as in the case of SHEDS. Most of them are not tailored to the specific needs of environmental health risk assessments and typically focus on single media or one-dimensional variability. In contrast, OnVeMCS integrates USEPA dose equations, supports multiple environmental media and exposure pathways, and provides built-in exposure factor libraries for diverse populations. Its ability to easily perform two-dimensional simulations distinguishes it from many commercial packages, enabling analysts to separate uncertainty from variability very fast. Sensitivity analysis and tornado plots are easily integrated, along with butterfly plots, CDFs with confidence bands, and risk surface plots. Moreover, OnVeMCS is freely available to academic users as a Windows executable, lowering the barrier to adoption. Taking Oracle Crystal Ball as a software tool widely used for probabilistic health risk assessment, the results obtained with this software were compared with those generated by OnVeMCS. The results were found to be highly similar, with differences expressed as CV values of only a few percent at most, both for 1D MCS and 2D MCS.
4.2. Implications for Risk Assessment and Management
Probabilistic risk assessment enables decision-makers to understand not only point estimates but also the distribution of possible health outcomes. The demonstration shows that while mean or median risk values may fall within acceptable ranges, upper-tail outcomes can exceed regulatory thresholds. OnVeMCS allows users to compute the exceedance probabilities (HI = 1; ILCR = 10−6–10−4) and identify the percentiles corresponding to risk management benchmarks. The ability to explore pathway and analyte contributions helps prioritize interventions, such as soil remediation or water treatment. Sensitivity analysis directs attention to the parameters that most strongly influence risk and can therefore support the selection of appropriate mitigation measures. For example, if exposure frequency is identified as the dominant parameter, risk reduction may be achieved by limiting the frequency or duration of contact with the contaminated medium. If the ingestion rate is among the most influential parameters, mitigation may focus on reducing intake through behavioral recommendations or exposure restrictions. In contrast, if contaminant concentration has the greatest influence on risk, the most effective measures are likely to include source control or environmental remediation.
4.3. Limitations and Future Work
OnVeMCS currently operates only on Windows, which may limit its adaptability. Although extensive, the set of probability distributions does not yet include mixture distributions or time-dependent models. The software relies on the exposure factors and toxicity values provided and does not include site-specific databases. Future versions will aim to: (1) make the software available on other operating systems and as a web-based application; (2) expand the library of distributions; (3) include spatial analysis tools to visualize how risk varies across different locations; and (4) integrate region-specific exposure factor datasets to better reflect local population characteristics. Community feedback will guide these enhancements.
5. Conclusions
OnVeMCS provides a comprehensive, user-friendly solution for performing deterministic and probabilistic human health risk assessments across soil, sediment, water, air, and food media. By implementing standard USEPA dose equations, supporting a range of probability distributions, enabling one- and two-dimensional Monte Carlo simulations, and integrating sensitivity analysis, the software allows environmental scientists and risk assessors to quantify health risks, along with variability and uncertainty characterization. The graphical interface facilitates data entry, parameter selection, and model execution, while the exported outputs provide a clear basis for further analysis, interpretation, and presentation of the results. Through its application, OnVeMCS can help users identify the main exposure pathways, evaluate whether risk levels exceed regulatory thresholds, and prioritize mitigation measures. Continued development will focus on expanding functionality and accessibility.
Supplementary Materials
The following supporting information can be downloaded at: https://www.mdpi.com/article/10.3390/environments13060332/s1, Excel Table S1: OnVeMCS_Water_Example data; Excel Table S2: OnVeMCS_Soil_Example data; Excel Table S3: OnVeMCS_Sediment_Example data; Excel Table S4: OnVeMCS_Air_Example data; Excel Table S5: OnVeMCS_Food_Example data; OnVeMCS Setup File: OnVeMCS_Setup; Manual: OnVeMCS User Manual; License: OnVeMCS License.
Author Contributions
A.O.: Conceptualization; Software; Resources; Funding acquisition; Project administration; Supervision; Writing—review and editing; J.V.: Investigation; Methodology; Data curation; Validation; Visualization; Formal analysis; Writing—original draft. All authors have read and agreed to the published version of the manuscript.
Funding
This research received no external funding.
Data Availability Statement
The latest version of the OnVeMCS installer file and example datasets are available for free academic use from the authors upon request.
Acknowledgments
The authors thank colleagues for testing early versions of the software and providing valuable feedback.
Conflicts of Interest
The authors declare no conflicts of interest.
Correction Statement
This article has been republished with an updated software in the Supplementary Materials. This change does not affect the scientific content of the article.
References
- Miletić, A.; Vesković, J.; Lučić, M.; Onjia, A. Monte Carlo Simulation of Source-Specific Risks of Soil at an Abandoned Lead-Acid Battery Recycling Site. Stoch. Environ. Res. Risk Assess. 2024, 38, 3313–3329. [Google Scholar] [CrossRef] [Scilit]
- Cüce, H.; Kalipci, E.; Ustaoglu, F.; Baser, V.; Türkmen, M. Ecotoxicological Health Risk Analysis of Potential Toxic Elements Accumulation in the Sediments of Kızılırmak River. Int. J. Environ. Sci. Technol. 2022, 19, 10759–10772. [Google Scholar] [CrossRef] [Scilit]
- Varol, M. Environmental, Ecological and Health Risks of Trace Metals in Sediments of a Large Reservoir on the Euphrates River (Turkey). Environ. Res. 2020, 187, 109664. [Google Scholar] [CrossRef] [Scilit] [PubMed]
- Muhammad, S.; Ahmed, T.; Amin, S.; Tokatli, C.; Ustaoğlu, F.; Ahmad, A.; Ali, W.; Farooq, U. Spatial Distribution of Hazard Index via Heavy Metals Consumption in Water from the Himalayan Lacustrine Ecosystems. Phys. Chem. Earth Parts A/B/C 2025, 138, 103858. [Google Scholar] [CrossRef] [Scilit]
- Obradović, J.; Vesković, J.; Jovašević-Stojanović, M.; Obradović, M.; Onjia, A. Two-Dimensional Monte Carlo Simulation of Source-Specific Risks from PM2.5-Bound Polycyclic Aromatic Hydrocarbons in Indoor and Outdoor School Environments. Build. Environ. 2025, 279, 113050. [Google Scholar] [CrossRef] [Scilit]
- Lučić, M.; Onjia, A. Probabilistic Dietary Exposure and Risk Ranking of Pesticides in Peppers (Capsicum annuum): Regional and Consumer Group Variability. Food Chem. 2025, 492, 145355. [Google Scholar] [CrossRef] [Scilit]
- Hammel, S.C.; Andersen, H.V.; Knudsen, L.E.; Frederiksen, M. Inhalation and Dermal Absorption as Dominant Pathways of PCB Exposure for Residents of Contaminated Apartment Buildings. Int. J. Hyg. Environ. Health 2023, 247, 114056. [Google Scholar] [CrossRef] [Scilit] [PubMed]
- Han, Y.; Zhang, S.; Kang, D.; Hao, N.; Peng, J.; Zhou, Y.; Liu, K.; Chen, Y. A Decade Review of Human Health Risks from Heavy Metal Contamination in Industrial Sites. Water Air Soil Pollut. 2025, 236, 144. [Google Scholar] [CrossRef] [Scilit]
- USEPA. User’s Guide: Human Health Risk Assessment; Office of Emergency and Remedial Response, US Environmental Protection Agency: Washington, DC, USA, 2008.
- USEPA. Guiding Principles for Monte Carlo Analysis; United States Environmental Protection Agency: Washington, DC, USA, 1997.
- Gao, Y.; Qian, H.; Zhou, Y.; Chen, J.; Wang, H.; Ren, W.; Qu, W. Cumulative Health Risk Assessment of Multiple Chemicals in Groundwater Based on Deterministic and Monte Carlo Models in a Large Semiarid Basin. J. Clean. Prod. 2022, 352, 131567. [Google Scholar] [CrossRef] [Scilit]
- Malakootian, M.; Mohammadi, A.; Faraji, M. Investigation of Physicochemical Parameters in Drinking Water Resources and Health Risk Assessment: A Case Study in NW Iran. Environ. Earth Sci. 2020, 79, 195. [Google Scholar] [CrossRef] [Scilit]
- Hao, X.; Hao, H.; Bu, C.; Long, E.; Wang, H.; Wu, P.; Li, X. Temporal and Spatial Distribution, Sources and Health Risk Assessment of Trace Elements in a Typical Karst River Basin in Southwest China: Influence of Acid Mine Drainage from Abandoned Coal Mines. Ecotoxicol. Environ. Saf. 2026, 309, 119524. [Google Scholar] [CrossRef] [Scilit]
- Nath, H.; Adhikary, S.K.; Roy, S.; Akhter, S.; Bithi, U.H.; Salam, M.A.; Islam, A.R.M.T.; Siddique, M.A.B. Utilizing PMF and Monte Carlo-Based Models to Evaluate Toxic Metal Enrichment Pathways, Sources, and Public Health Risks in an Unplanned Urbanized Dumpsite Soil. Environ. Sci. Adv. 2026, 5, 169–191. [Google Scholar] [CrossRef] [Scilit]
- Leng, W.; Li, L.; Liu, H.; Bai, L.; Zhang, M.; Wang, L.; Liu, J. Source-Specific Risks of Heavy Metals in Urban–Agricultural Soils and Implications for Human Health in a Liver Cancer High-Incidence Area of Central China. J. Clean. Prod. 2026, 554, 148109. [Google Scholar] [CrossRef] [Scilit]
- Bhuyan, M.S.; Ismail, M.; Morshed, A.J.M.; Islam, M.T.; Mondal, V. Heavy Metal Contamination in Sediment of Mudskipper Habitat along the Cox’s Bazar Coast, Bay of Bengal, Bangladesh: Ecological and Human Health Risk Assessment Using Deterministic and Probabilistic Approaches. Reg. Stud. Mar. Sci. 2026, 94, 104759. [Google Scholar] [CrossRef] [Scilit]
- Long, X.; Zhou, C.; Fu, H.; Meng, S.; Wei, Y. Source-Oriented Probabilistic Human Health Risk Assessments and Priority Heavy Metal Pollution Control Areas Identification in the Laoguan River Basin. Environ. Pollut. 2026, 397, 127990. [Google Scholar] [CrossRef] [Scilit] [PubMed]
- Li, Q.; Kang, X.; Xu, M.; Wang, D.; Li, K. Groundwater Quality and Risk Assessment in Urban Areas of Arid Regions on the Western Qinghai-Tibet Plateau. Groundw. Sustain. Dev. 2025, 31, 101547. [Google Scholar] [CrossRef] [Scilit]
- Deng, J.; Yu, J.; Zhang, B.; Zhao, H.; Zhao, Z.; Chen, Y.; Pu, S. Source-Pathway-Sink Analysis and Health Risk Zoning of Heavy Metal Groundwater Pollution in Karst Chemical Park. Environ. Pollut. 2025, 382, 126716. [Google Scholar] [CrossRef] [Scilit]
- Munshed, M.; Van Griensven Thé, J.; Fraser, R. Advancing Human Health Risk Assessment Through a Stochastic Methodology for Mobile Source Air Toxics. Environments 2025, 12, 54. [Google Scholar] [CrossRef] [Scilit]
- Ghosh, B.; Padhy, P.K.; Niyogi, S.; Patra, P.K.; Hecker, M. A Comparative Study of Heavy Metal Pollution in Ambient Air and the Health Risks Assessment in Industrial, Urban and Semi-Urban Areas of West Bengal, India: An Evaluation of Carcinogenic, Non-Carcinogenic, and Additional Lifetime Cancer Cases. Environments 2023, 10, 190. [Google Scholar] [CrossRef] [Scilit]
- Rajwar, R.; Rishabh, K.; Kumar, D.; Samadder, S.R. Analysis of Human Risk Assessment Due to Arsenic Exposure through Cow Milk Using Multivariate and Monte Carlo Simulation Technique: A Case Study. Environ. Monit. Assess. 2026, 198, 326. [Google Scholar] [CrossRef] [Scilit]
- Afacan, F.O.; Yussuf, N.H.; Buyuksirit-Bedir, T.; Kayisoglu, C.; Odabas, E.; Golge, O.; Kabak, B. Occurrence and Dietary Risk Assessment of Pesticide Residues in Bananas and Kiwifruits from Turkey. Regul. Toxicol. Pharmacol. 2026, 167, 106037. [Google Scholar] [CrossRef] [Scilit]
- Yang, S.; Zhao, J.; Chang, S.X.; Collins, C.; Xu, J.; Liu, X. Status Assessment and Probabilistic Health Risk Modeling of Metals Accumulation in Agriculture Soils across China: A Synthesis. Environ. Int. 2019, 128, 165–174. [Google Scholar] [CrossRef] [Scilit] [PubMed]
- Han, Z.; Wang, H.; Huang, X.; Song, X.; Shu, Y.; Wu, J.; Sun, J.; Li, R.; Fan, Z. Determination of Soil Environmental Criteria for High-Risk Trace Metals in Urban Park Soils Using Improved CLEA Model. J. Hazard. Mater. 2024, 480, 136001. [Google Scholar] [CrossRef] [Scilit]
- Vesković, J.; Onjia, A. Radiotoxic and Chemotoxic Probabilistic Risks from Uranium, Thorium, and Potentially Toxic Elements in Groundwater near Coal-Fired Power Plants. Chemosphere 2025, 391, 144732. [Google Scholar] [CrossRef] [Scilit] [PubMed]
- Sobhanardakani, S.; Hosseini, N.S. Modeling Health Risks from Urban Roadside Soil Toxic Elements Using Two-Dimensional Monte Carlo Simulation Paired with Multiple Linear Regression. J. Environ. Chem. Eng. 2026, 14, 121843. [Google Scholar] [CrossRef] [Scilit]
- Ding, H.; Zeng, D.; Gao, Y.; Lyu, X.; Jin, J.; Yuan, H.; Zhang, J.; Dong, J.; Gao, X.; Zhu, P.; et al. Priority Control of Agricultural and Traffic Sources of Soil Heavy Metals: An Integrated Source-Oriented Risk Assessment in the Drawdown Zone of the Danjiangkou Reservoir. Toxics 2025, 13, 1073. [Google Scholar] [CrossRef] [Scilit] [PubMed]
- Rao, J.N.; Parsai, T. Wildfire-Driven Changes in the Formation of Disinfection by-Products (DBPs) and Their Precursors: Prioritization and Human Health Risk Assessment Using Two-Dimensional Monte-Carlo Simulation. J. Hazard. Mater. 2025, 499, 139924. [Google Scholar] [CrossRef] [Scilit]
- Yuan, B.; Du, P.; Chen, J.; Li, S.; Zhang, Y.; Liu, H.; Yu, J.; Luo, H.; Li, F. Two-Dimensional Monte Carlo Simulation Improves Source-Specific Health Risk Assessment Accuracy of Soil Heavy Metals in a Legacy Mining Region. J. Hazard. Mater. 2025, 496, 139190. [Google Scholar] [CrossRef] [Scilit]
- Liu, T.; Du, W.; Yu, S.; Zhang, W. Distribution, Sources, and Probabilistic Risk Assessment of Heavy Metals in the Wetland Water–Sediment System: Based on CEWQI, PLI, PMF, and Two-Dimensional Monte Carlo Method. J. Contam. Hydrol. 2026, 276, 104753. [Google Scholar] [CrossRef] [Scilit]
- Wang, M.; Gou, Z.; Zhao, W.; Qu, Y.; Chen, Y.; Sun, Y.; Cai, Y.; Ma, J. Predictive Analysis and Risk Assessment of Potentially Toxic Elements in Beijing Gas Station Soils Using Machine Learning and Two-Dimensional Monte Carlo Simulations. J. Hazard. Mater. 2024, 477, 135393. [Google Scholar] [CrossRef] [Scilit]
- Verma, D.; Sharma, P.K.; Patel, K.S.; Pandey, P.K.; Varol, S.; Yurdakul, S.; Martín-Ramos, P.; Blaudez, D. Assessment of Potentially Toxic Element Contamination in Medicinal Plants from a Polluted Region of India: A Study on Accumulation and Health Risks. Environ. Monit. Assess. 2025, 197, 1305. [Google Scholar] [CrossRef] [Scilit]
- Soleimani, H.; Nasri, O.; Ghoochani, M.; Azhdarpoor, A.; Dehghani, M.; Radfard, M.; Darvishmotevalli, M.; Oskoei, V.; Heydari, M. Groundwater Quality Evaluation and Risk Assessment of Nitrate Using Monte Carlo Simulation and Sensitivity Analysis in Rural Areas of Divandarreh County, Kurdistan Province, Iran. Int. J. Environ. Anal. Chem. 2022, 102, 2213–2231. [Google Scholar] [CrossRef] [Scilit]
- Nemati, B.; Fallahizadeh, S.; Mostafaei, G.; Miranzadeh, M.B. Health Risk Assessment of Toxic Elements in Kashan Drinking Water Reservoirs Using Monte Carlo Simulation and Sensitivity Analysis. Sci. Rep. 2025, 15, 17806. [Google Scholar] [CrossRef] [Scilit]
- Kumar, S.; Maurya, N.S. Analysis of Heavy Metal Contamination in Groundwater and Associated Probabilistic Human Health Risk Assessment Using Monte Carlo Simulation: A Case Study in Gaya, Bihar. J. Water Health 2025, 23, 630–647. [Google Scholar] [CrossRef] [Scilit]
- Wen, Y.; Li, J.; Ji, W.; Wu, S.; Gong, Y. Unveiling the Neglected Threat: Probabilistic Risk Assessment of Potentially Toxic Elements in Geogenically Contaminated Karst Soils. Ecotoxicol. Environ. Saf. 2026, 311, 119875. [Google Scholar] [CrossRef] [Scilit] [PubMed]
- Mianeh, H.Y.; Amiri, L.; Jafari, A.; Nourozi, N. Health Risk Assessment via Monte Carlo Simulation and Sensitivity Analysis for Fluoride and Nitrate Content in Bottled Waters Consumed in Kermanshah City, Iran. Sci. Rep. 2025, 15, 5008. [Google Scholar] [CrossRef] [Scilit]
- Huang, Z.-Y.; Syu, C.-H.; Chien, L.-C.; Hseu, Z.-Y. Probabilistic Health Risk Assessment of Rare Earth Elements through Rice (Oryza sativa L.) Consumption Using Monte Carlo Simulation. Food Chem. 2025, 496, 146760. [Google Scholar] [CrossRef] [Scilit] [PubMed]
- EPM Information Development Team. Crystal Ball User’s Guide; Oracle: Austin, TX, USA, 2017. [Google Scholar]
- Palisade Company LLC. @RISK Getting Started Guide; Palisade Company LLC: Ithaca, NY, USA, 2020; Available online: https://help-risk.lumivero.com/v8_3/en/Guides/@RISK-Getting-Started-Guide.pdf (accessed on 24 April 2026).
- USEPA. Stochastic Human Exposure and Dose Simulation (SHEDS); United States Environmental Protection Agency: Washington, DC, USA, 2012.
- Pouillot, R.; Delignette-Muller, M.L.; Kelly, D.L.; Denis, J.B. The Mc2d Package, R-universe; RStudio: Boston, MA, USA, 2026. Available online: https://cran.r-universe.dev/mc2d/doc/docmcEnglish.Rmd (accessed on 24 April 2026).
- Maranho, R.L.N.; Lourenço, F.R. Development of a Python-Based Tool for Evaluation of Multivariate Decision Risk Considering Measurement Uncertainty and Correlation Effects. Microchem. J. 2026, 224, 117824. [Google Scholar] [CrossRef] [Scilit]
- Miletić, A.; Lučić, M.; Onjia, A. Exposure Factors in Health Risk Assessment of Heavy Metal(Loid)s in Soil and Sediment. Metals 2023, 13, 1266. [Google Scholar] [CrossRef] [Scilit]
- Vesković, J.; Onjia, A. Exposure and Toxicity Factors in Health Risk Assessment of Heavy Metal(Loid)s in Water. Water 2025, 17, 2901. [Google Scholar] [CrossRef] [Scilit]
- Egbueri, J.C.; Abu, M.; Agbasi, J.C. An Integrated Appraisal of the Hydrogeochemistry and the Potential Public Health Risks of Groundwater Nitrate and Fluoride in Eastern Ghana. Groundw. Sustain. Dev. 2024, 26, 101264. [Google Scholar] [CrossRef] [Scilit]
- Pant, R.R.; Varol, M.; Awasthi, M.P.; Bohara, R.; Paudel, S.; Nepal, J.; Pant, S.R.; Joshi, T.R.; Bishwakarma, K.; Almazroui, M.; et al. Comprehensive Assessment of Water Quality of a Transboundary River in Nepal Using Hydro-Chemical, Chemometric, Health Risk and Index-Based Approaches. Water Air Soil Pollut. 2025, 236, 211. [Google Scholar] [CrossRef] [Scilit]
- Ghouma, A.; Aydi, A.; Martin, J.A.R.; Gasmi, M. Health Risk Assessment Associated to Heavy Metal Pollution Levels in Mediterranean Environment Soils: A Case Study in the Watershed of Sebkhet Ariana, Tunisia. Arab. J. Geosci. 2022, 15, 716. [Google Scholar] [CrossRef] [Scilit]
- Han, Q.; Wang, W.; Zhao, T.; Jin, L.; Wang, Y.; Yang, S.; Zhang, Y. Integrated Source Apportionment, Risk Assessment, and Probabilistic Modeling of Potentially Toxic Elements in Soils from an Undeveloped Metallogenic Region, Northwest China. Phys. Chem. Earth Parts A/B/C 2026, 142, 104288. [Google Scholar] [CrossRef] [Scilit]
- Ge, Q.; Chen, G.; Guo, W.; Zhao, J.; Yao, Y.; Yang, L.; Jiang, T.; Chen, J.; Zheng, L. Health Risk Assessment of Heavy Metal(Loid)s in a Soil-Rice System in the Selenium-Enriched Area Based on Monte Carlo Simulation and Bioaccessibility. Environ. Geochem. Health 2025, 47, 400. [Google Scholar] [CrossRef] [Scilit]
- Tian, S.; Ying, S.C.; Liang, T.; Han, Z.; Li, H.; Ji, X.; Li, Y.; Zheng, Y.; Tang, J. A Hybrid Approach for Assessing Source-Oriented Health Risk and Evaluating Mitigation Measures of Potential Toxic Elements in Road Dust from Mining Areas. Environ. Int. 2026, 208, 110141. [Google Scholar] [CrossRef] [Scilit]
- Vesković, J.; Onjia, A. Two-Dimensional Monte Carlo Simulation Coupled with Multilinear Regression Modeling of Source-Specific Health Risks from Groundwater. J. Hazard. Mater. 2025, 488, 137309. [Google Scholar] [CrossRef] [Scilit] [PubMed]
- Pang, K.; Luo, K.; Zhang, S.; Hao, L. Source-Oriented Health Risk Assessment of Groundwater Based on Hydrochemistry and Two-Dimensional Monte Carlo Simulation. J. Hazard. Mater. 2024, 479, 135666. [Google Scholar] [CrossRef] [Scilit]
- Moazamnia, M.; Sadeghfam, S.; Jabraili-Andariyan, N.; Nadiri, A.A.; Mirabbasi, R.; Noori, R. Probabilistic Human Health Risk Assessment for Arsenic, Nickel and Lead Exposures Based on Two-Dimensional Monte Carlo Simulation. Groundw. Sustain. Dev. 2024, 27, 101312. [Google Scholar] [CrossRef] [Scilit]
- Vesković, J.; Onjia, A. Influencing Factors of Groundwater 238U, 232Th, 40K, and Rare Earth Element Contamination: Insights from the Two-Dimensional Monte Carlo Simulation of Radiological Risks. Mar. Pollut. Bull. 2025, 213, 117682. [Google Scholar] [CrossRef] [Scilit]
- Wang, X.; Xu, F.; Gui, Y.; Liu, Y. Enhancing Health Risk Assessment for Soil Heavy Metal (Loid)s Using a Copula-Based Monte Carlo Simulation Method. Ecotoxicol. Environ. Saf. 2025, 300, 118419. [Google Scholar] [CrossRef] [Scilit] [PubMed]
- Tokatlı, C.; Ustaoğlu, F.; Yazman, M.M.; Yüksel, B. Where Rivers Meet the Sea: Source Fingerprinting and Health Risk Mapping of Potentially Hazardous Elements in Sediments from the Çanakkale Strait Basin (Türkiye). Mar. Pollut. Bull. 2026, 222, 118626. [Google Scholar] [CrossRef] [Scilit] [PubMed]
- Razavi, S.; Jakeman, A.; Saltelli, A.; Prieur, C.; Iooss, B.; Borgonovo, E.; Plischke, E.; Lo Piano, S.; Iwanaga, T.; Becker, W.; et al. The Future of Sensitivity Analysis: An Essential Discipline for Systems Modeling and Policy Support. Environ. Model. Softw. 2021, 137, 104954. [Google Scholar] [CrossRef] [Scilit]

Disclaimer/Publisher’s Note: The statements, opinions and data contained in all publications are solely those of the individual author(s) and contributor(s) and not of MDPI and/or the editor(s). MDPI and/or the editor(s) disclaim responsibility for any injury to people or property resulting from any ideas, methods, instructions or products referred to in the content. |
© 2026 by the authors. Licensee MDPI, Basel, Switzerland. This article is an open access article distributed under the terms and conditions of the Creative Commons Attribution (CC BY) license.