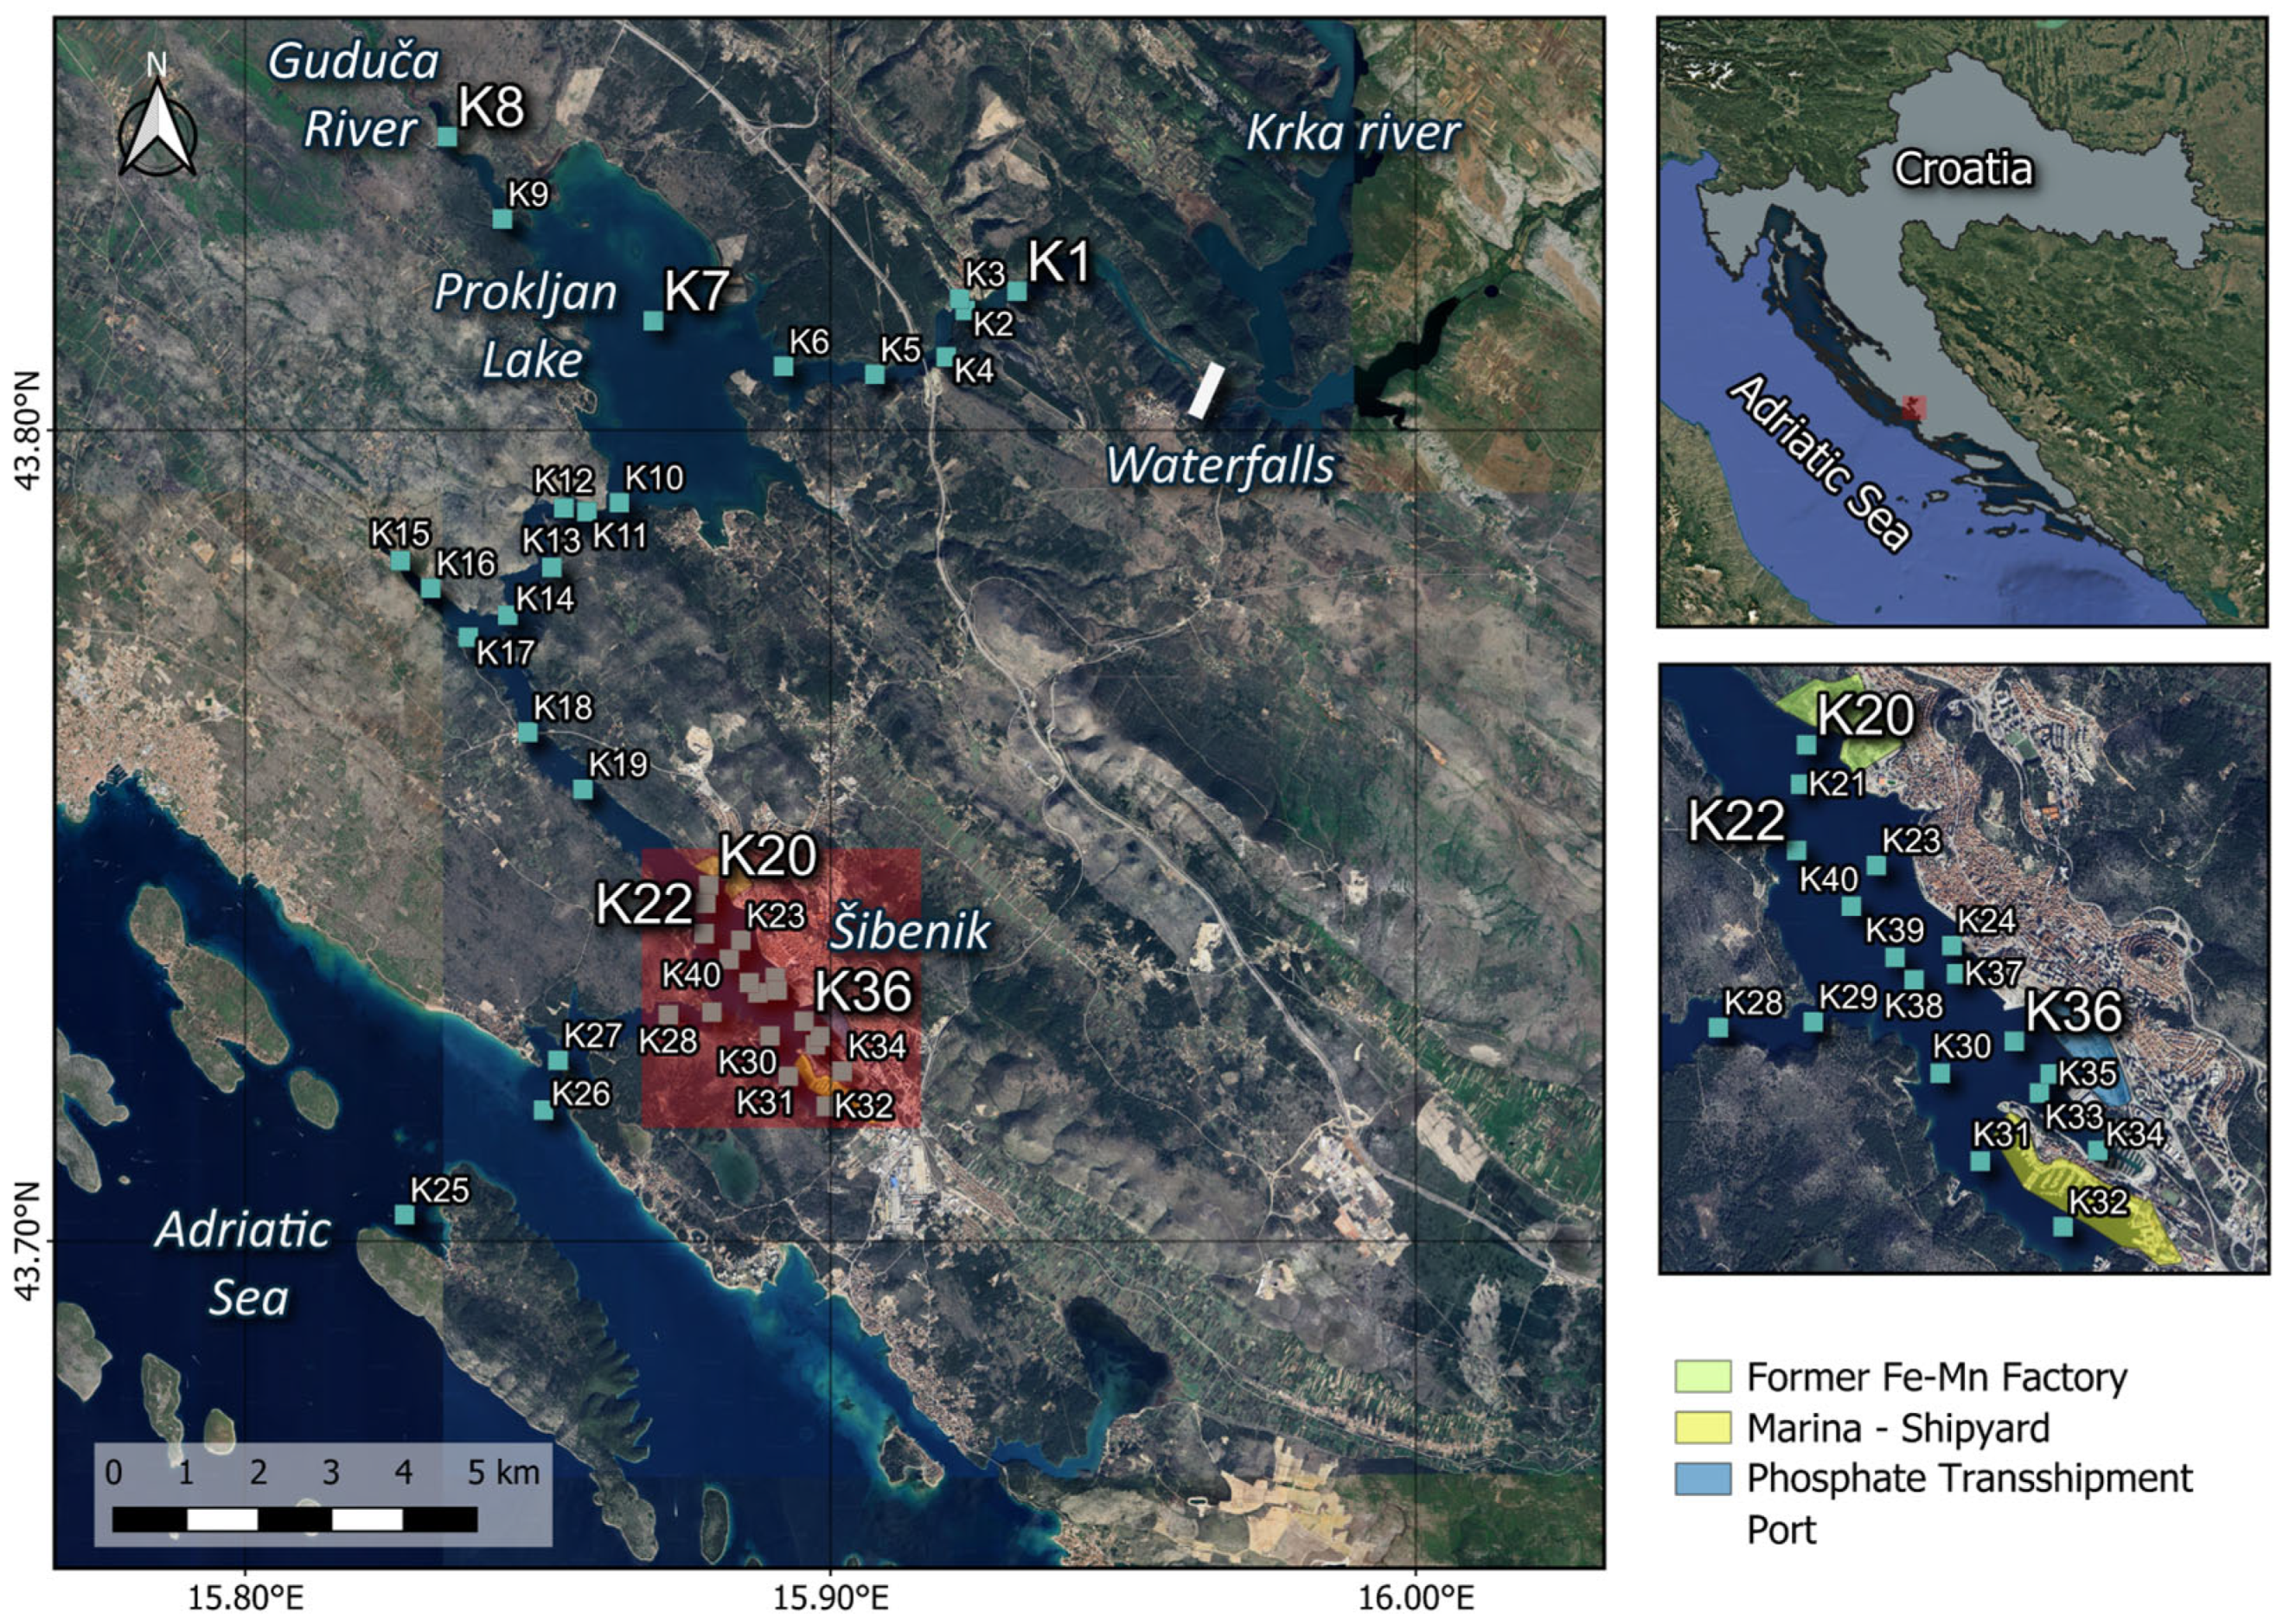
3.1. Spatial Distribution and Statistical Characterisation of MS in the Surface Sediments of the Krka River Estuary
Magnetic susceptibility (MS) was measured in two datasets: (i) surface sediments from the Krka River Estuary and (ii) six sediment cores, which were collected to observe the behaviour of MS and element distribution at different depths. The results of MS measurements for surface sediments from the Krka River Estuary are presented in
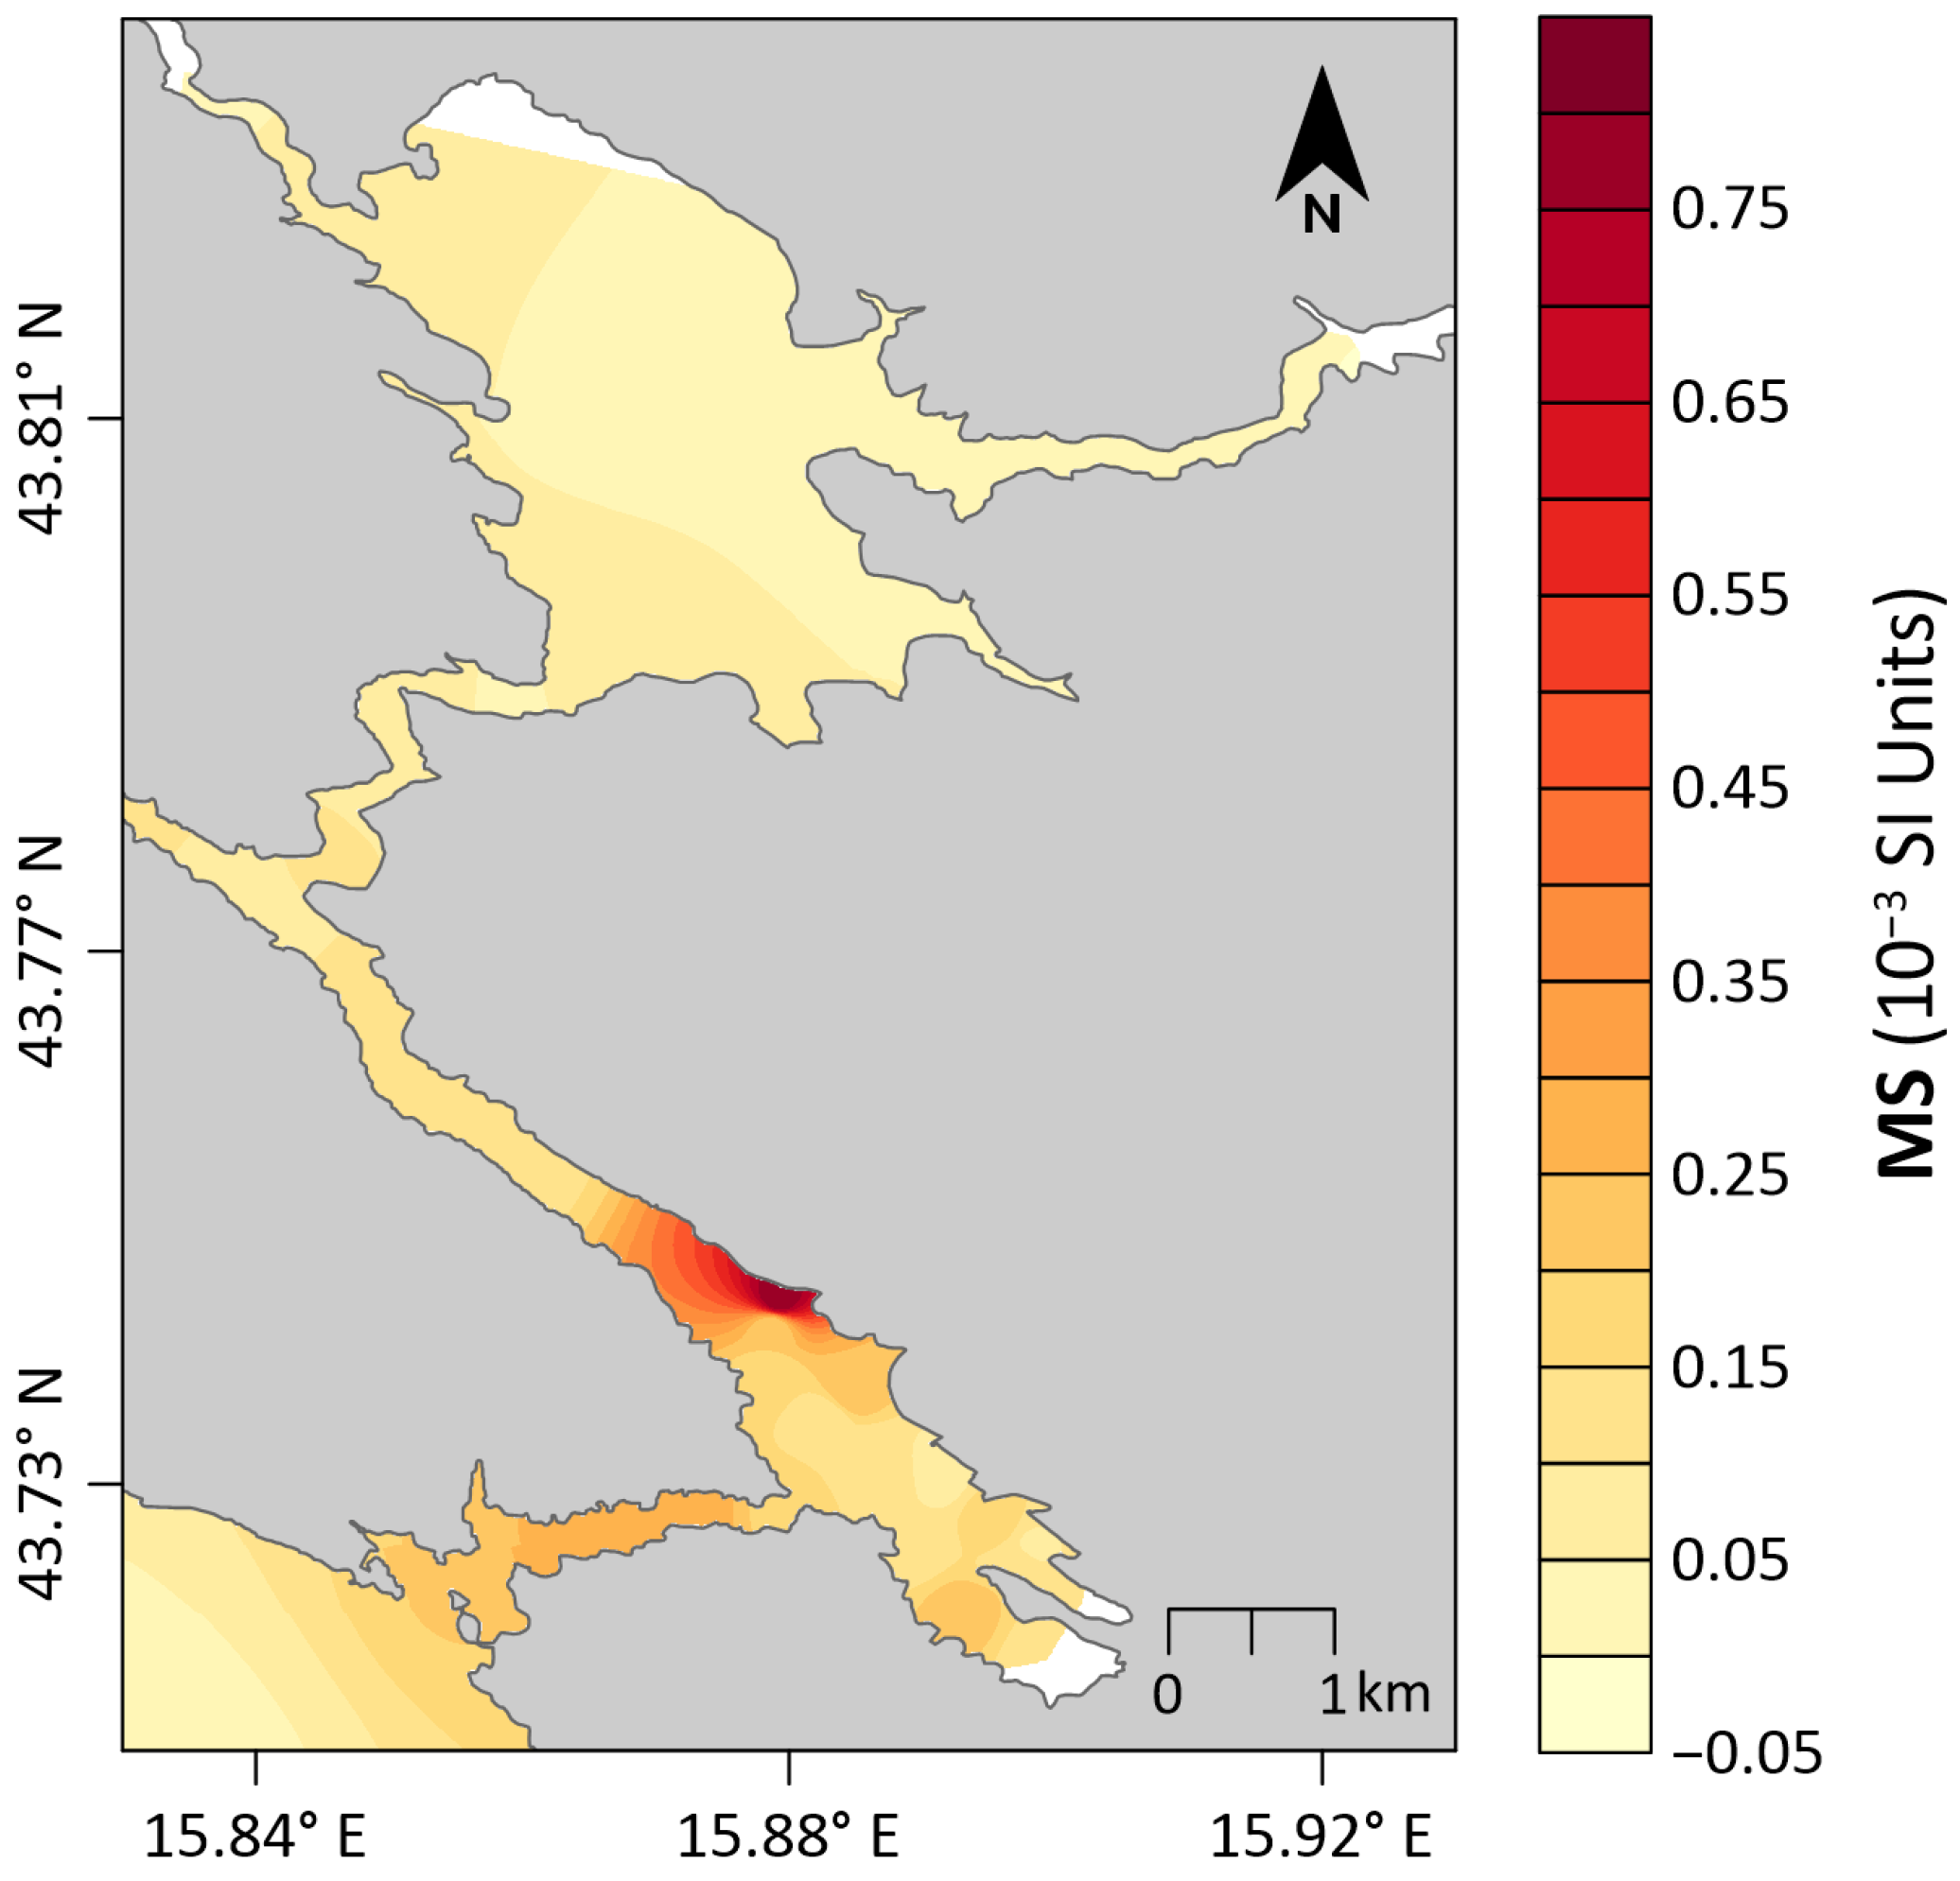
Figure 2 and
Table S1. The MS measured in sediment cores is not presented here to avoid duplication, as it will be shown later as charts and discussed in detail.
Figure 2 presents a contour map, showing the spatial distribution of MS in the surface sediments of the Krka River Estuary. As can be seen from this map, lowest values of MS (<0.05 × 10
−3 SI units) prevail in the most upstream part of the estuary. Values are slightly higher (0.05–0.15 × 10
−3 SI units) in the part of canyon between southern part of Prokljan Lake and Šibenik town, while around Šibenik town and its port and industry, values are very much elevated, with the highest measured value of 0.799 × 10
−3 SI units. In the St. Ante Channel, most downstream part of the Krka River Estuary, linking Šibenik with open sea, MS values are approximately 0.25–0.35 × 10
−3 SI units, while going towards the open sea they are gradually decreasing. The spatial distribution of MS values in surface sediments is highly important, as the spatial distribution of several metals, especially Mn, Pb, Ba, and Sb, closely resembles the MS distribution. Therefore, a spatial map of MS distribution can be very useful for identifying potentially toxic metal hotspots in the studied region, as elevated heavy metal values usually correspond with the highest MS values.
To get a better insight into results, basic statistical parameters (N-number of cases, Mean, Median, Minimum, Maximum, Range and Standard Deviation) were calculated for surface sediments of the Krka River Estuary and are presented in
Table 1.
The mean MS value in the Krka River Estuary is quite low compared to some other sites in Croatia; for example, in Zagreb city soils the mean value is 0.374 [
47], whereas in Sisak city soils the mean value is much higher at 18.6 [
59]. Study of Frančišković-Bilinski et al. [
60] reported values for karstic and flysch rivers of Slovenia and part of Croatia. Mean value of rivers from old Celje industrial region in Slovenia is 1.30 × 10
−3 SI units, for Slovenian clean karstic rivers 0.479 × 10
−3 SI units and for Croatian and Slovenian flysch and alogene rivers 0.340 × 10
−3 SI units. So, median values of all three groups of rivers from that study are much higher than median from the Krka River Estuary. Also, it is interesting to compare that maximal value measured in the Krka River Estuary is significantly lower than median value from the Celje industrial region, which indicates that Krka River Estuary is much less polluted than compared region.
We can further note that the difference between the median and the mean value exists, but it is not that large, which means that the distribution is not too irregular, and this small irregularity is a consequence of that one rather large anomaly in the K20 sample. If we exclude this large anomaly from dataset, rest of the samples have a very regular distribution. The minimum value is extremely low, even slightly negative. Negative magnetic susceptibility in sediments is usually caused by the presence of diamagnetic minerals (such as carbonates and opal) and the absence of strong magnetically minerals (such as magnetite), which repel, rather than attract, magnetic fields. The XRD analysis (
Figure S1) confirmed the predominance of calcite in the uppermost part of the estuary (K1), providing a mineralogical explanation for the very low MS values, as carbonate minerals are diamagnetic and therefore contribute to negative MS. The prevalence of carbonate minerals in this part of the estuary is not surprising, given that the Krka River brings very little terrigenous material, which could otherwise supply a higher amount of magnetic minerals. At this site, pyrite was detected in the sediment. However, pyrite is only weakly paramagnetic, and its formation (pyritisation) typically occurs under anoxic conditions where sulphate-reducing bacteria consume ferromagnetic minerals such as magnetite. Therefore, in the uppermost part of the estuary, even if minor amounts of iron oxides were originally present, their transformation into weakly magnetic pyrite, combined with the prevalence of diamagnetic carbonates, effectively erases the magnetic signature.
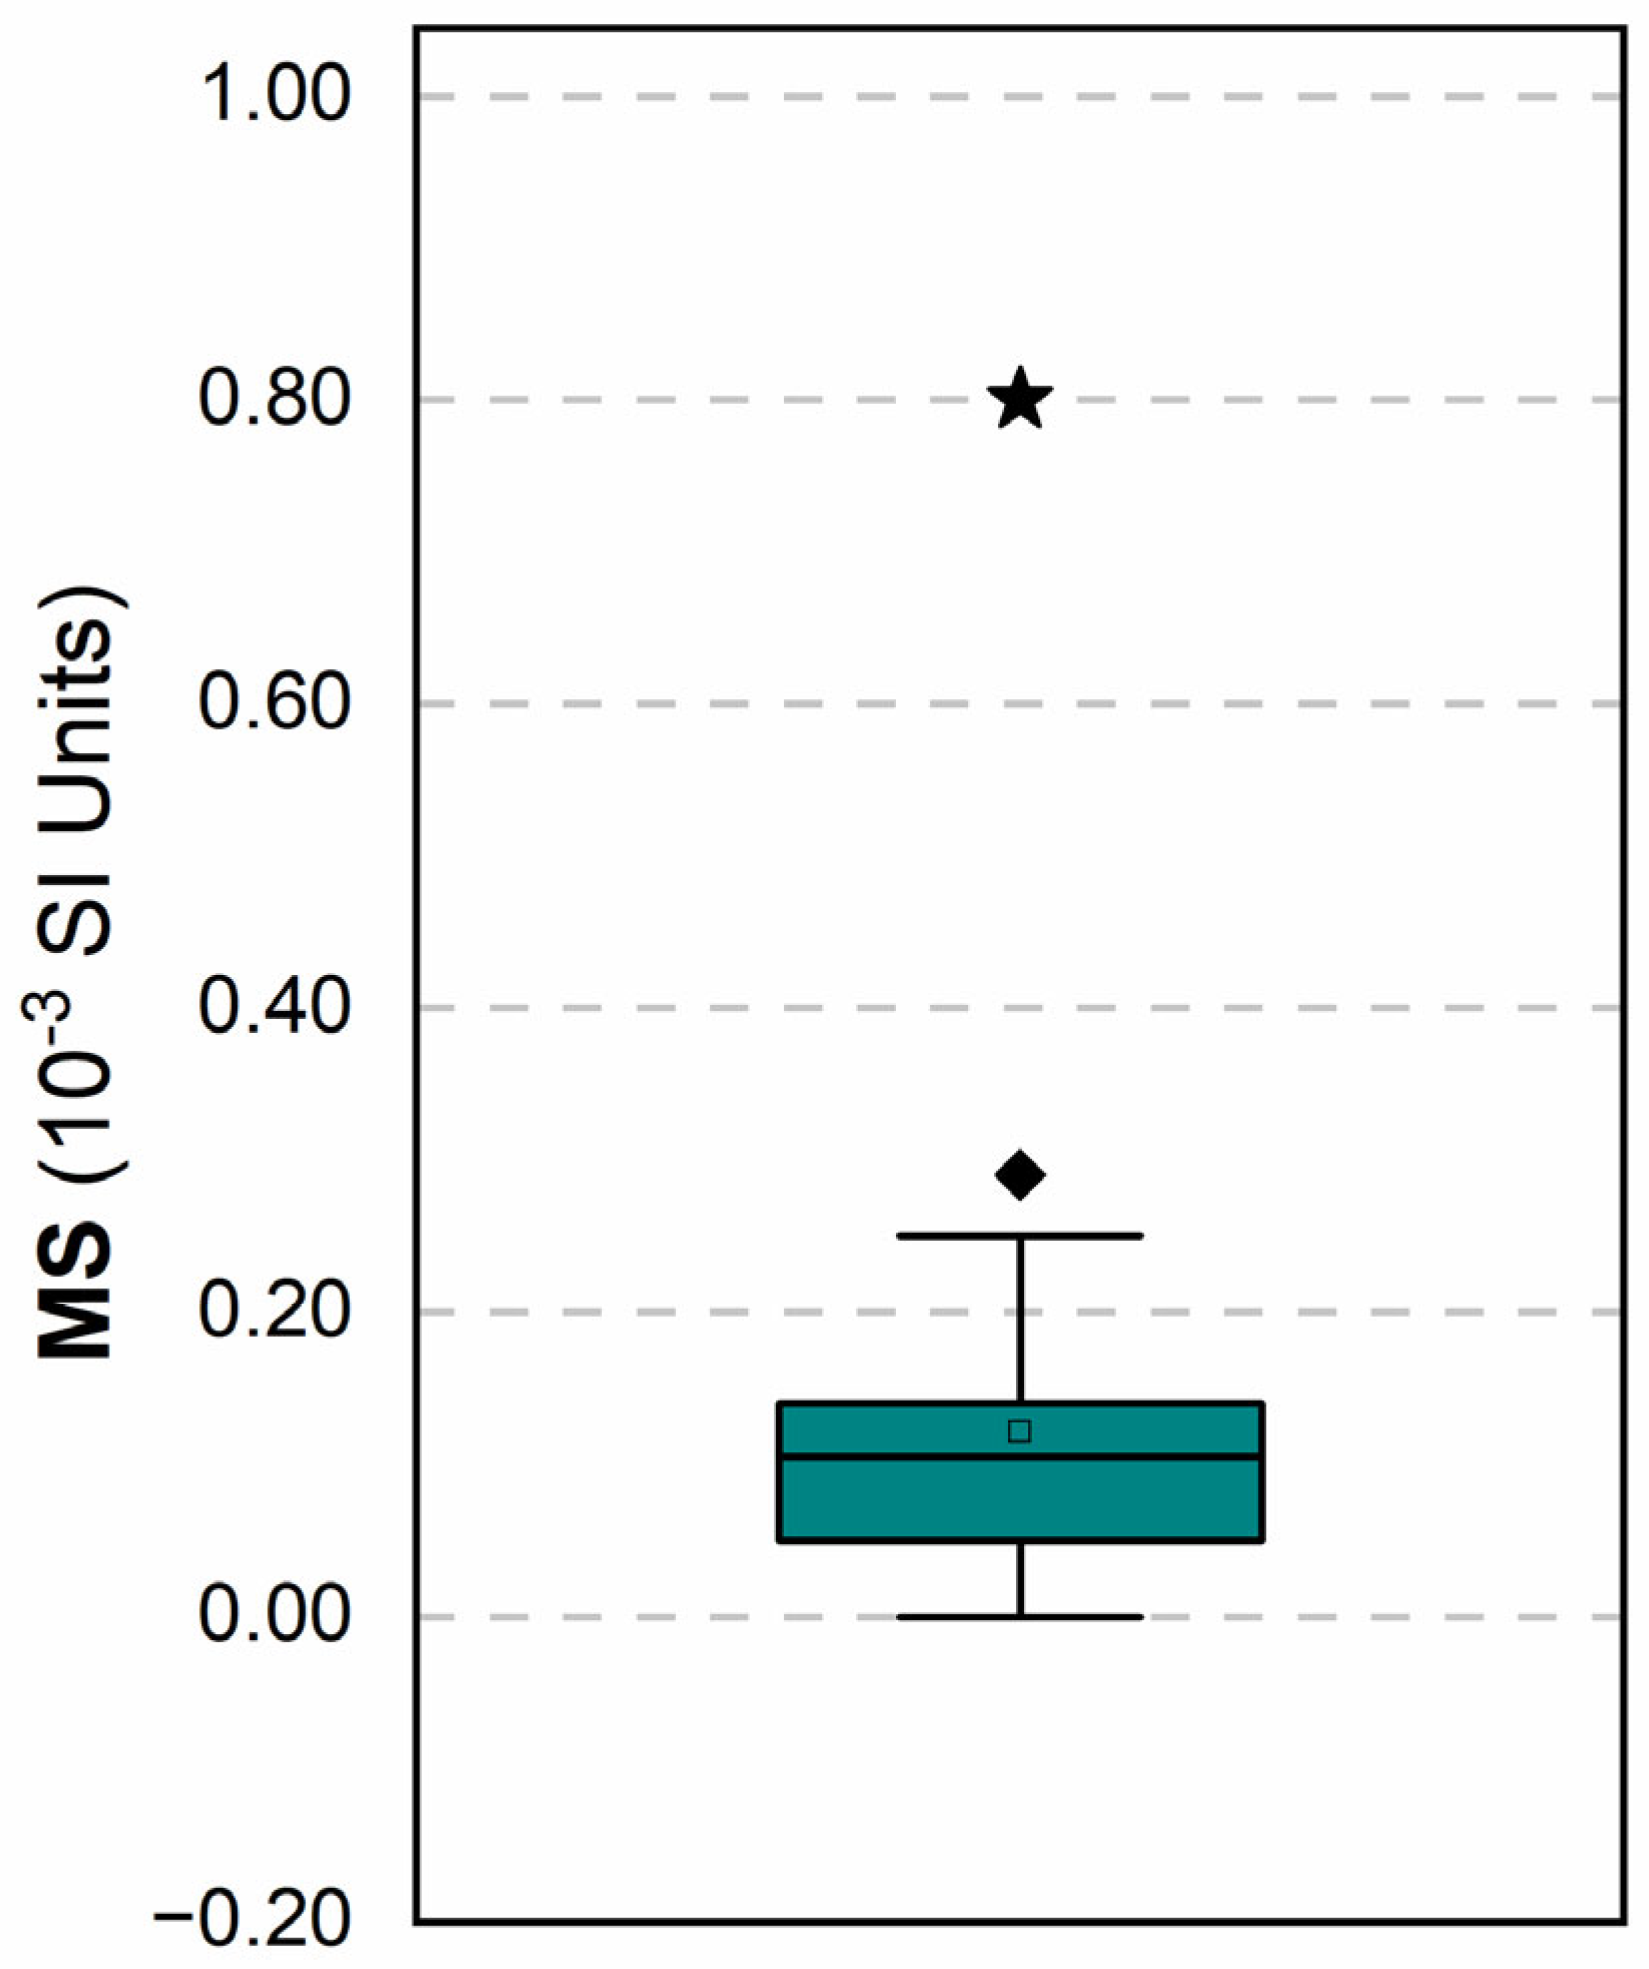
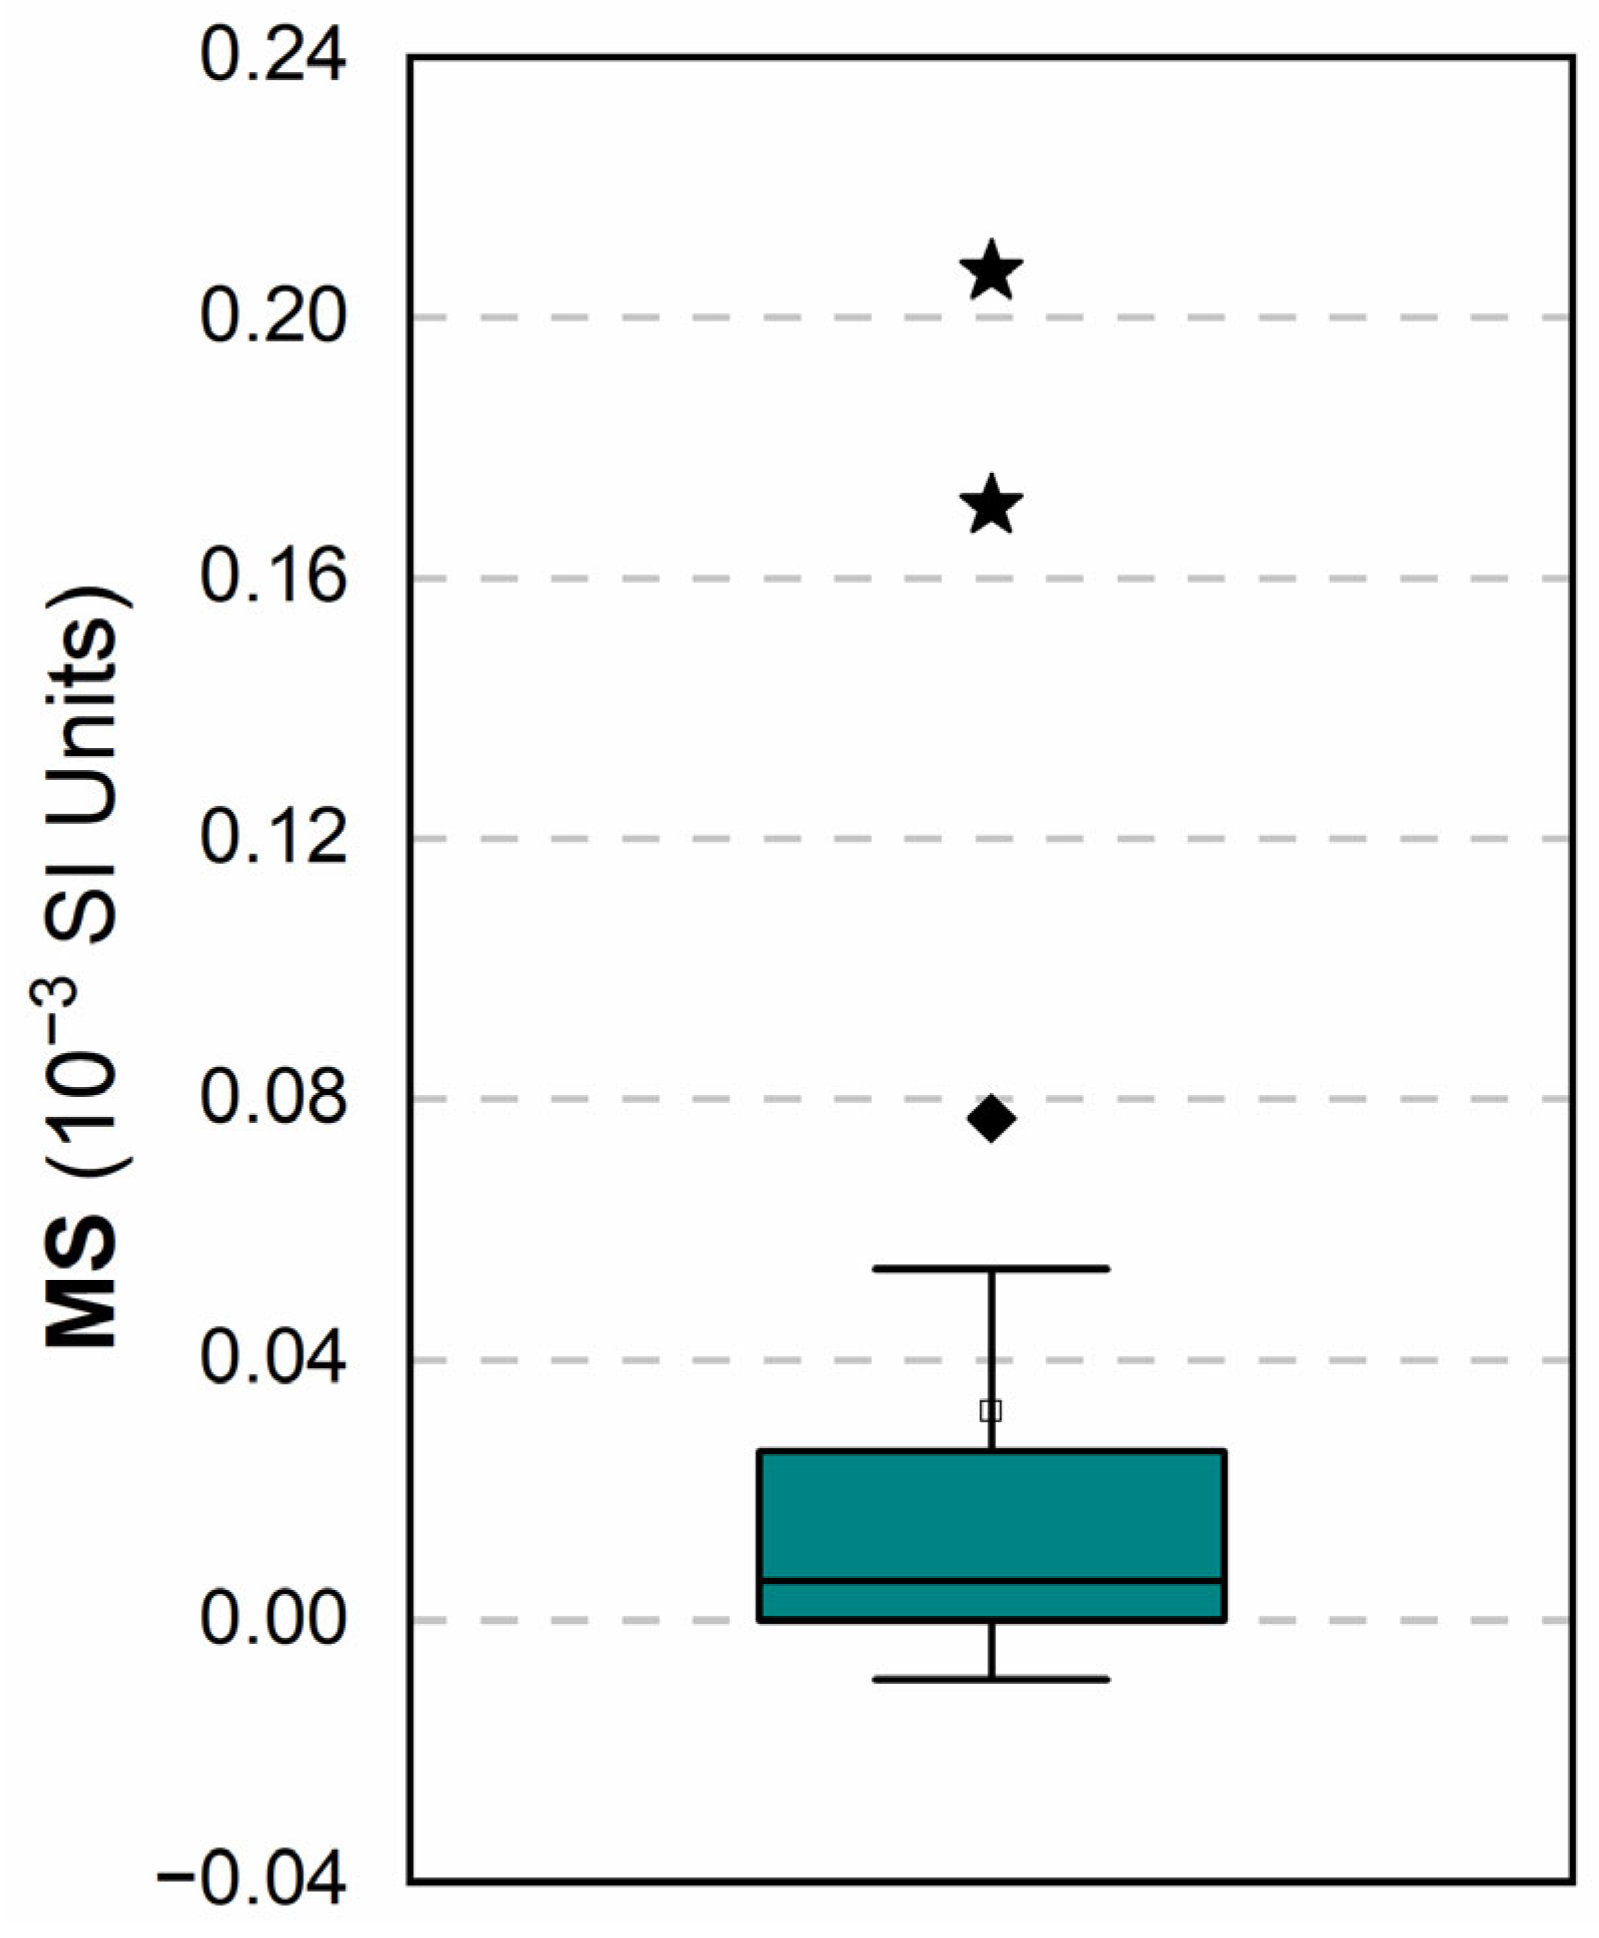
Statistical anomalies of MS values of surface sediments from Krka River Estuary were determined using boxplot method, which is presented in
Figure 3. As we can see from the boxplot, statistically speaking, there is only one anomaly present, a rather pronounced extreme with an MS value of 0.799 × 10
−3 SI units in sample K20. Therefore, it can be assumed that this sample contains elevated values of some of the heavy metals. All other samples have a very regular distribution and therefore it is to be expected that there is no (at least not significant) anthropogenic influence in them, especially because MS values are not high.
Sample K20, which statistically presents a very large anomaly, does not actually have an absolutely very high MS value: for example, in the Zagreb city area the values range up to 3 × 10
−3 SI units [
47], and in Sisak area, which is strongly polluted with Fe particles from metallurgic industry, they go up to 100 × 10
−3 SI units [
59]. Therefore, anomaly K20 was not excluded from all analyses performed within statistical evaluation, as its influence on elevation of some parameters, e.g., Mean or Median, was not significant. However, given its anomaly compared to other samples, it is to be expected that sample K20 is very likely under anthropogenic influence and that certain heavy metals are significantly elevated there. Therefore, when using magnetic susceptibility to assess sediment metal contamination, it is crucial to consider the natural MS values in the study area and to examine in detail the spatial zones where they are elevated.
3.2. Determining Correlations Between MS and Studied Elements in Surface Sediments of the Krka River Estuary
A correlation analysis was conducted to determine the relationships between measured MS values and 28 chemical elements studied in the Krka River Estuary. The complete correlation matrix is presented in
Table S2, while significant correlations between MS and the elements are shown in
Table 2. The Pearson correlation coefficient was used because the vast majority of our data are normally distributed. The Pearson correlation coefficient is superior to Spearman’s in the case of continuous, normally distributed data. Its linear relationship provides greater precision, sensitivity to exact values, and better suitability for predictive modelling. The main difference from the Spearman coefficient is that Pearson measures the strength of raw values, whereas Spearman only analyses rankings [
61]; therefore, Pearson is much more precise in cases similar to ours.
The results of the correlation analysis indicate that MS is an effective proxy for identifying spatial variability and metal enrichment in sediments of the Krka River Estuary. Statistically significant correlations were found for several elements, with the strongest relationships observed for Mn (r = 0.88) and Pb (r = 0.87), followed by Ba (0.76), Co (0.73), and Sb (0.71). These high correlation coefficients are at the upper end of values recorded in similar studies worldwide (
Table 3), suggesting a specific mechanism of metal input into this system.
The strong association of MS with Mn and Pb directly reflects the ecological history of the lower part of the estuary. Previous research indicates that elevated concentrations of these elements are primarily related to the historical activity of the former TEF factory in Šibenik [
53]. The production of ferromanganese and silicomanganese generated significant amounts of slag and particles from electrofilters (so-called fly ash). Multielement analysis of slag collected from the former factory site confirmed a marked enrichment in numerous elements, especially manganese (Mn) [
52,
63]. These findings support the thesis that slag particles, transported by aeolian or hydrodynamic processes, were deposited in the surrounding estuarine sediments, thus directly influencing their geochemical composition. Interestingly, the correlation between MS and total iron (Fe) is relatively weak (r = 0.38), although statistically significant. The weak MS–Fe correlation, despite Fe’s magnetic role, is consistent with other systems where Fe occurs mainly in non-magnetic or weakly magnetic phases and the “magnetic” fraction is carried by specific Fe-bearing minerals or technogenic particles rather than bulk Fe content [
11,
22,
23,
64]. Although iron is the most common ferromagnetic element, MS often shows much stronger correlations with other elements, such as Zn, Cu, or Ni, in various types of samples [
11,
62,
65,
66]. This is especially true where Fe is present in non-magnetic forms, such as silicate lattices, rather than as free oxides (like magnetite). Therefore, MS can also be used as a proxy for other heavy metal pollution (Zn, Cu, Cr, Pb) besides iron. MS can have the strongest correlations with these elements because they are deposited alongside the magnetic particles that provide the magnetic response. Thus, it can be assumed that MS often traces pollution more directly than total iron content. MS is primarily affected by the amount of ferrimagnetic minerals (such as magnetite) rather than total iron, which is usually found in the form of paramagnetic minerals like hematite or pyroxenes [
67,
68]. Additionally, some elements like Zn and Cr can be incorporated into the lattice of other magnetic minerals, such as sphalerite, contributing to magnetic variability. Therefore, our finding that MS correlations in the Krka River estuary are significantly higher with other potentially toxic metals than with Fe is not unusual and is fully consistent with the literature.
The fact that correlations with Mn and Pb are twice as strong as those with Fe confirms that MS in Krka is a “selective indicator” of TEF industrial waste. Comparison with other systems (e.g., Vistula estuary or Kerala coast) shows that correlations in Krka (especially for Mn and Pb) are among the highest recorded. While in other systems MS often reflects mixed signals (grain size, organic matter), here the correlation is clear and direct. The presence of non-negligible but sub-significant correlations with Cr and As (>0.30) reflects findings that metals with mixed lithogenic and anthropogenic origins often show moderate MS relationships [
12,
16,
69]. A recent paper on the Krka River Estuary highlighted that Cr and As in the estuary are predominantly of natural, terrigenous origin, but with a possible additional anthropogenic contribution in the Šibenik Bay area [
52]. Therefore, the moderate associations of Cr and As with MS may reflect the mixing of a natural detrital signal with local anthropogenic influences. This confirms that metals of mixed (lithogenic and anthropogenic) origin are also partially associated with the magnetic fraction. The results confirm that the MS measurement method in the Krka River Estuary is an extremely reliable tool for the rapid and economical detection of pollution hotspots. As MS measurements do not require expensive or time-consuming chemical sample preparation, they can serve as a primary tool for monitoring and spatial mapping of industrial waste distribution in the sediments of this protected area.
3.3. Source Identification of Metals in Krka River Estuary Sediments Using Multivariate Statistical Approaches
A Q-mode cluster analysis was performed, which included all parameters (MS and all studied elements). The cluster analysis in this work is based on Euclidean distance. This method groups data points by calculating the straight-line distance between them, defined as the square root of the sum of squared differences between their coordinates. It is important because it identifies clusters of high similarity, although it is sensitive to outliers [
70]. As our dataset contains few statistical anomalies, it is well suited to this type of statistical analysis. Euclidean distance is used when cluster compactness is a priority and is a powerful, standard, and highly intuitive distance metric.
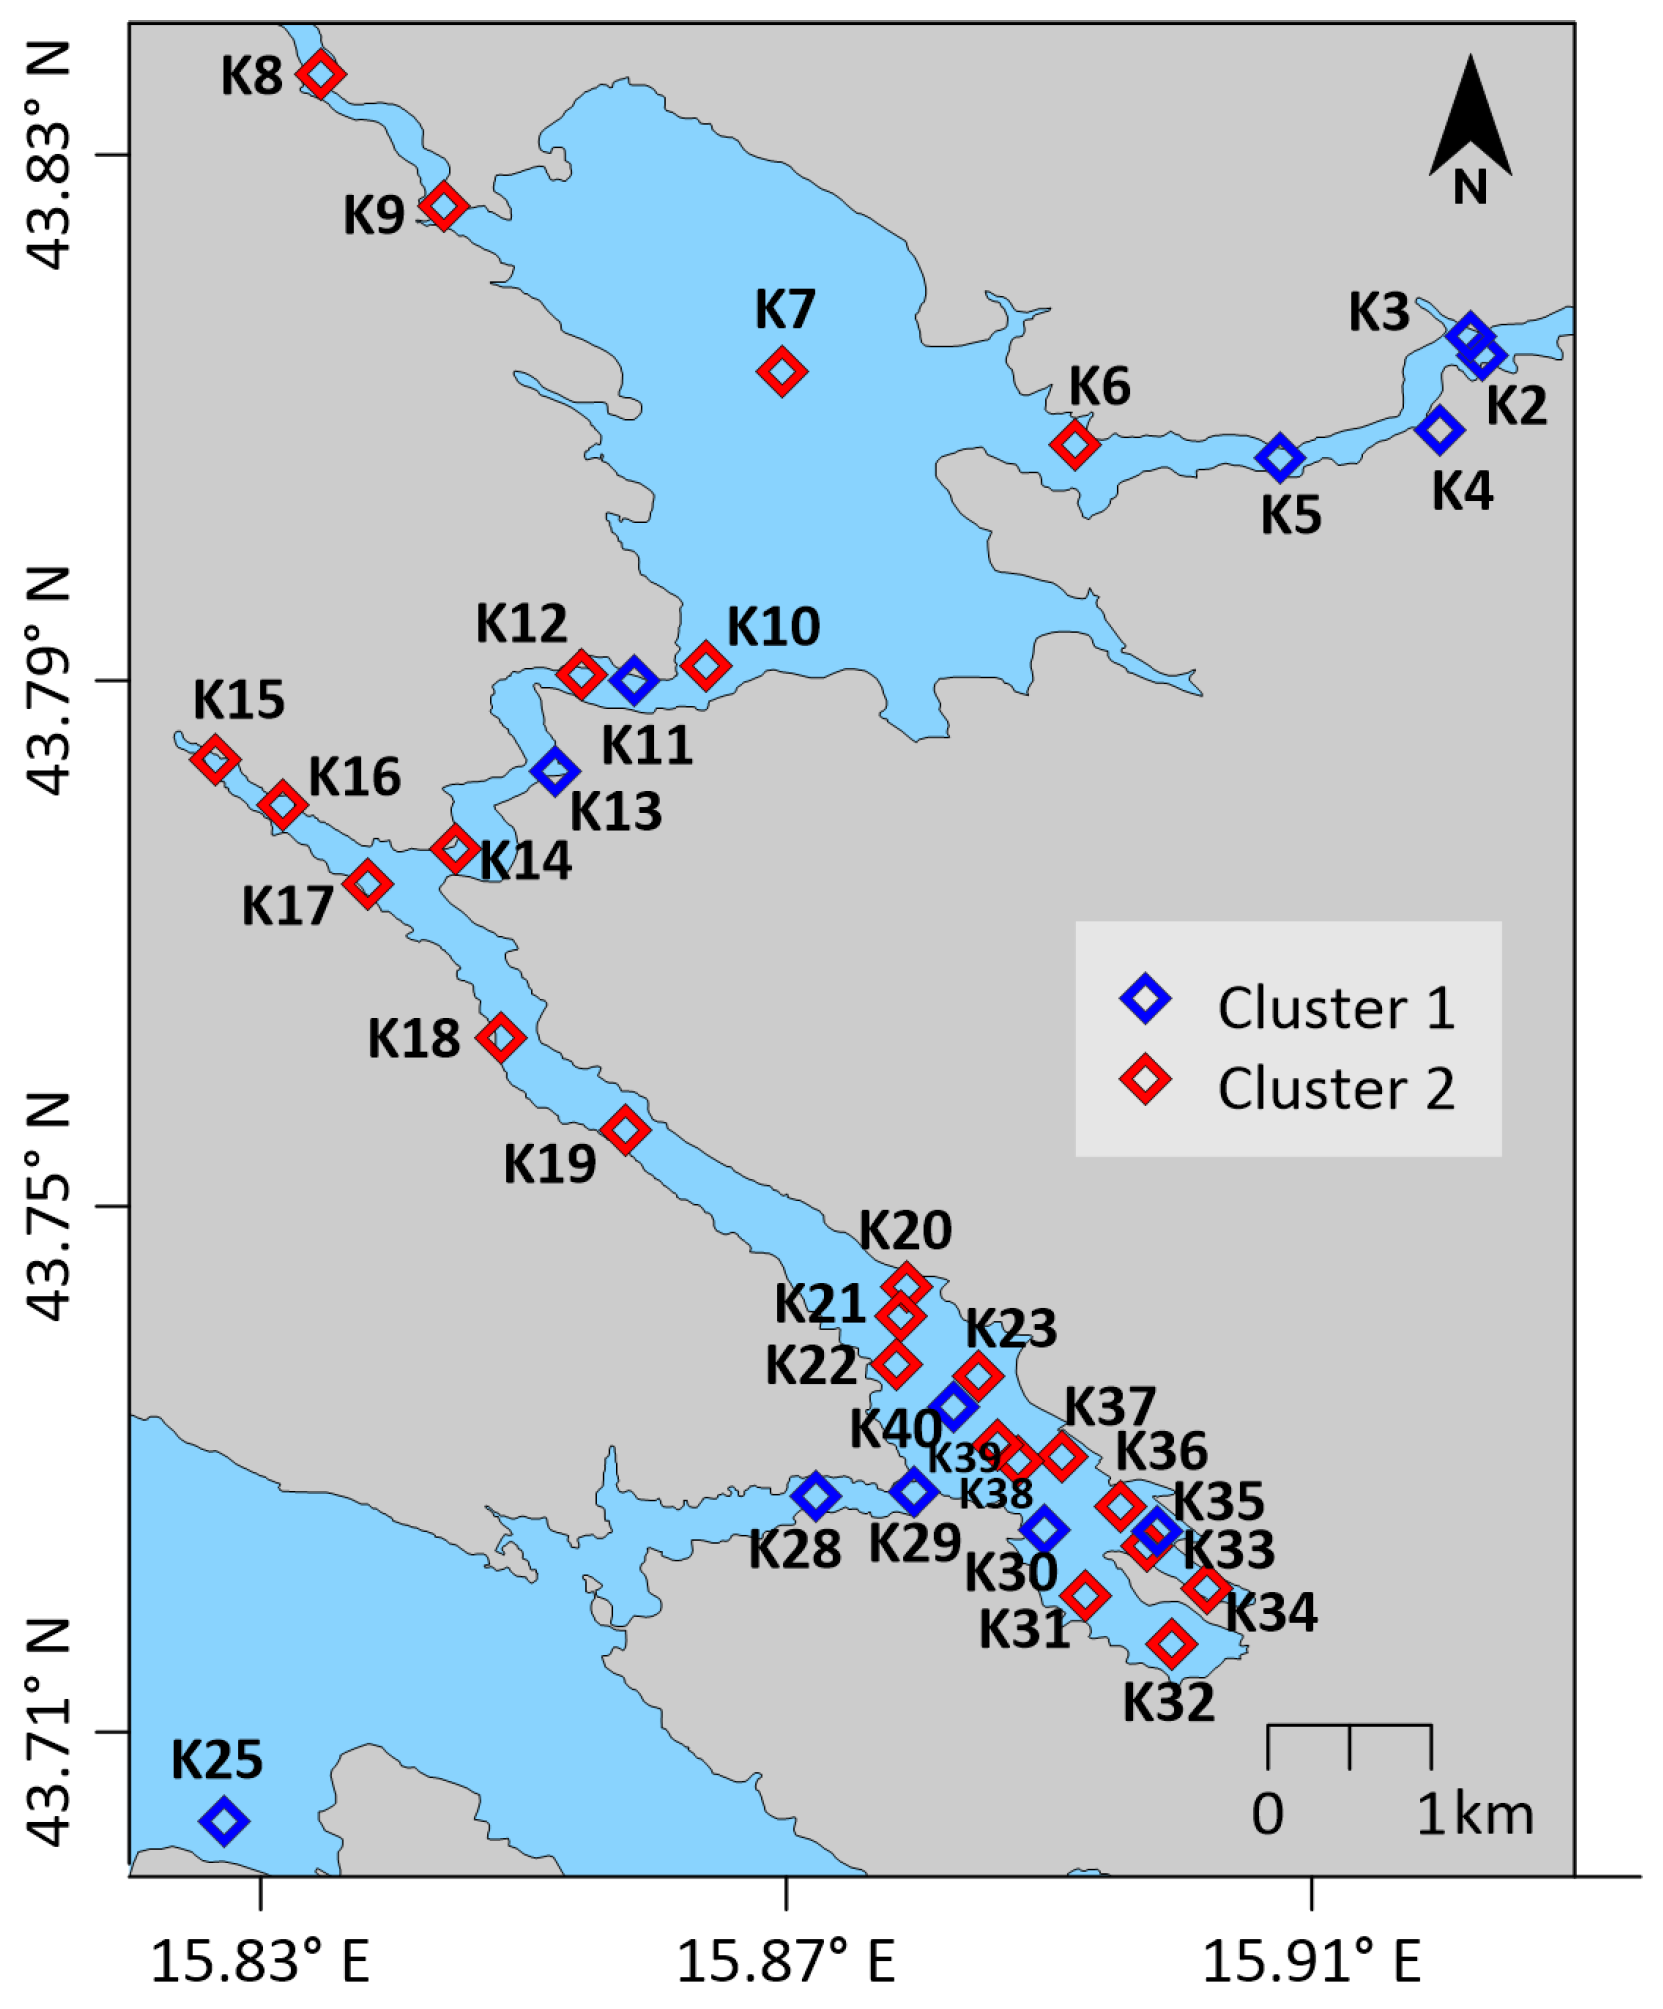
The results are presented in
Table 4,
Table 5,
Table 6 and
Table 7 and
Figure 4.
Table 4 shows the Euclidean distances between clusters,
Table 5 shows the cluster means,
Table 6 lists the members of Cluster 1 with their distances from the corresponding cluster center, and
Table 7 lists the members of Cluster 2 with their distances from the corresponding cluster center. In
Figure 4 is presented spatial distribution of those two clusters. Based on their similarity, cluster analysis classified each sample into one of these two clusters, which clearly reflect the two basic sedimentological/geochemical areas of the estuary. Cluster 1 is characterized by very low MS values and lower concentrations of almost all elements, while Sr is higher in this group. In contrast, Cluster 2 shows higher MS values and significantly higher concentrations of most elements. This differentiation is robust and can be interpreted as a clear distinction between sediment with dominant biogeocarbonate sedimentation and sediment enriched with terrigenous and anthropogenically derived particles. The elevated Sr in Cluster 1 is consistent with predominant marine sedimentation, as it is well established in the geochemical literature that Sr is incorporated into marine carbonates and that its content in carbonate sediments can increase with the proportion of certain marine carbonate phases. Such an interpretation aligns with current knowledge about sedimentation in the Krka River Estuary, with different areas of sedimentation, predominantly biogeocarbonate sedimentation in the lower estuary and the uppermost estuary and mixed sedimentation in the upper-middle area, where there is a greater influence of terrigenous material. Also, the map from
Figure 4 visually confirms our interpretation that Cluster 1 is linked to dominant biogeocarbonate sedimentation, while Cluster 2 is linked to terrigenous and anthropogenically derived particles. In karst estuaries, the sediment is dominated by diamagnetic or weakly magnetic carbonate material, and even relatively small contributions of ferrimagnetic and industrial particles can produce a clearly measurable increase in MS, which enables the application of MS method as a rapid screening tool for metal enrichment in sediment, provided local geochemical conditions and site-specific MS values are established.
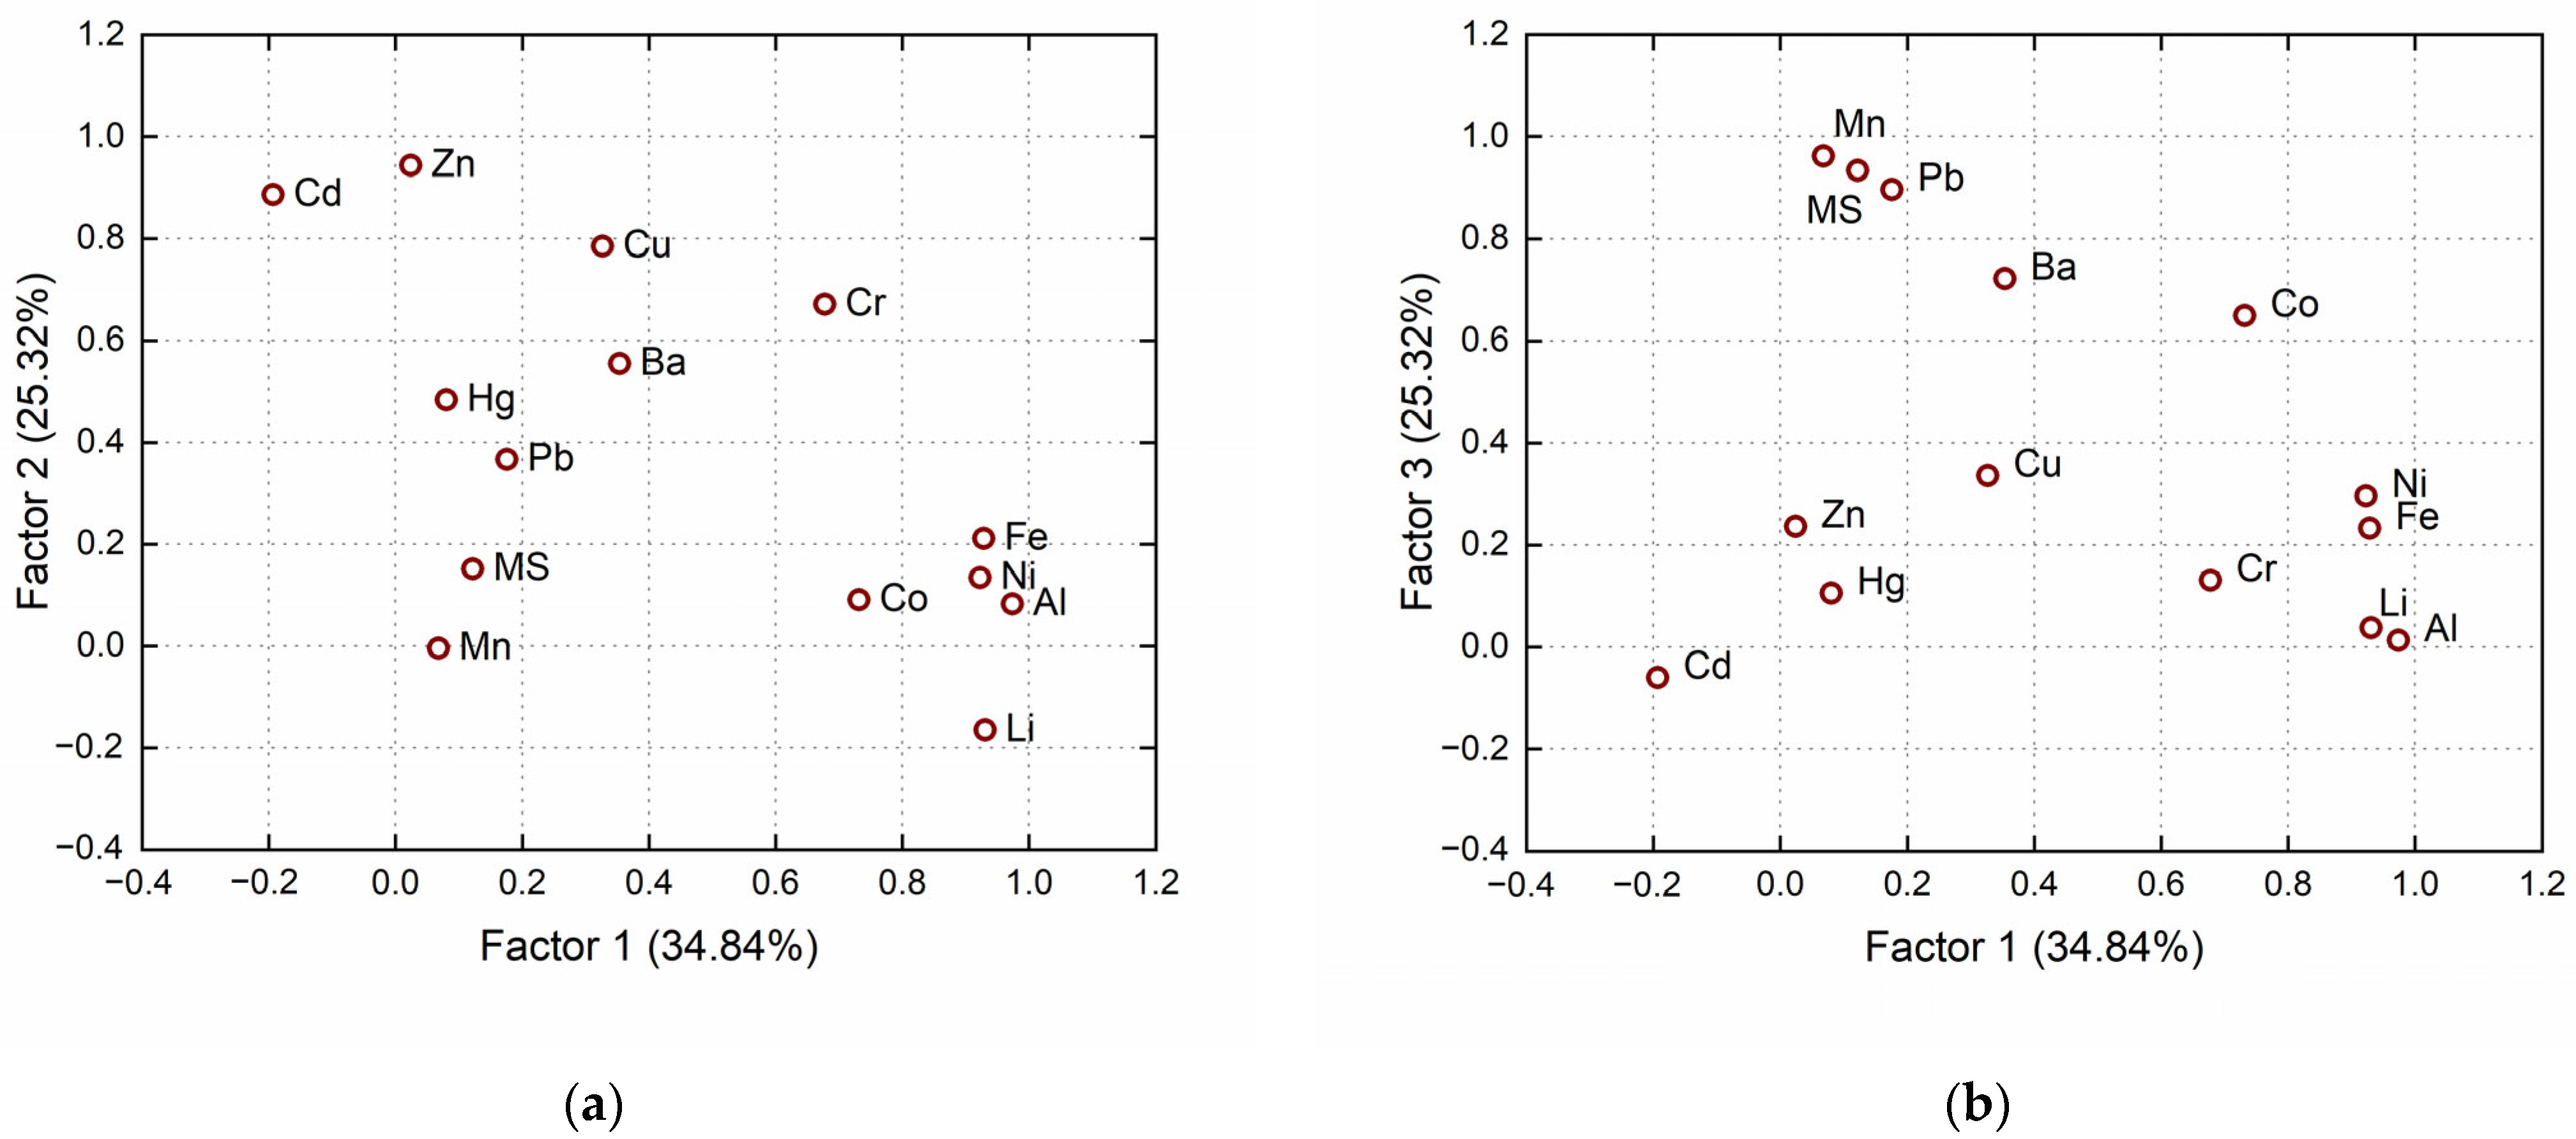
Furthermore, Factor analysis was performed on 14 parameters (MS, Li, Cd, Pb, Al, Cr, Mn, Fe, Co, Ni, Cu, Zn, Ba, and Hg) to provide better insight into possible elemental and mineral associations, the origin of elements, and the relationships between them. The results are presented in
Figure 5, which shows the factor loadings, and in
Table 8, which presents the factor scores for each sample. The factor analysis revealed that 87.91% of the total variability can be explained by the first three factors, which is a very good result. Generally, the higher the factor scores of a factor in a given sample, the more dominant that factor is in that sample. This high variance extraction indicates a strong and significant differentiation of geochemical processes within the Krka River Estuary.
Factor 1 showed very strong correlations with Li, Al, Fe, Co, and Ni, and can be attributed to the natural geological background. A strong loading of typical terrigenous elements coincides with the input of detrital material into the estuary. This agrees with previous findings that link the lithogenic elements in the sediments of the Krka River Estuary to the Guduča River and the Litno spring, which carry flysch and flysch-like deposits into the estuary. Factor 2 is related to Cd, Cu, and Zn, and can be interpreted as an anthropogenic factor associated with activities within Šibenik Bay, including wastewater, port, and shipyard operations. Factor 3 is associated with MS, Pb, Mn, and Ba. The grouping of MS with Pb, Mn, and Ba provides statistical confirmation that MS in this area is a reliable indicator of sediment enrichment with metals resulting from industrial activities. The exceptionally high factor values at the sampling sites near the abandoned TEF factory confirm the existence of local pollution hotspots caused by the factory’s many years of operation.
The strong loading of MS on Factor 3 (0.93) indicates that in the Krka River Estuary, MS is not only an indicator of sediments with a higher detrital component, but also an effective proxy for anthropogenically induced particles. This is consistent with other case studies where magnetic parameters are used to identify hotspots of industrial sediment contamination. As observed in other systems (e.g., Vistula Estuary or Ambon Bay), MS is a strong indicator for specific metals (Mn, Pb, Ba, Co), while it remains a weaker indicator for others (Fe, Cr, As) [
11,
16]. Therefore, when conducting environmental magnetism studies, it should always be considered that MS reflects specific mineral phases rather than overall sediment chemistry. The clear distinction between the terrigenous factor (Factor 1) and the industrial factor (Factor 3) demonstrates that MS integrates both lithogenic inputs and technogenic particles. In the Krka estuary, the low natural magnetic background makes the anthropogenic signal from the TEF slag, which is rich in Mg and Pb, stand out with high contrast.
Although MS is very effective, it is not a universal replacement. The weak correlation between MS and total Fe, in combination with the lack of a stronger link between elements such as Cd, Cu and Zn, highlights the need of considering local mineralogical and geochemical contexts when interpreting MS results. However, as a targeted tool for the identification of Mn and Pb enrichment associated with the ferroalloy industry, MS proves to be an extremely sensitive and operationally valuable method. This integrated approach—combining MS with multivariate statistics—places the Krka River Estuary as a well-characterized case study within the global research on environmental magnetism.
3.4. Vertical Distribution of MS Within Layers in Sediment Cores from the Krka River Estuary
To gain better insight into the behaviour of MS with increasing sediment depth, six sediment cores from the Krka River Estuary were analysed. All layers from each core were statistically evaluated separately. The boxplot method was used to identify any anomalies within each core. Only core K1 was found to contain anomalies; all other cores showed no statistical MS anomalies and exhibited a regular natural distribution. Therefore, their boxplots are not presented here. In core K1, two pronounced extremes were observed in the 12–14 cm and 20–22 cm layers, and one outlier was found in the 22–24 cm layer. The results of the boxplot analysis for core K1 are shown in
Figure 6.
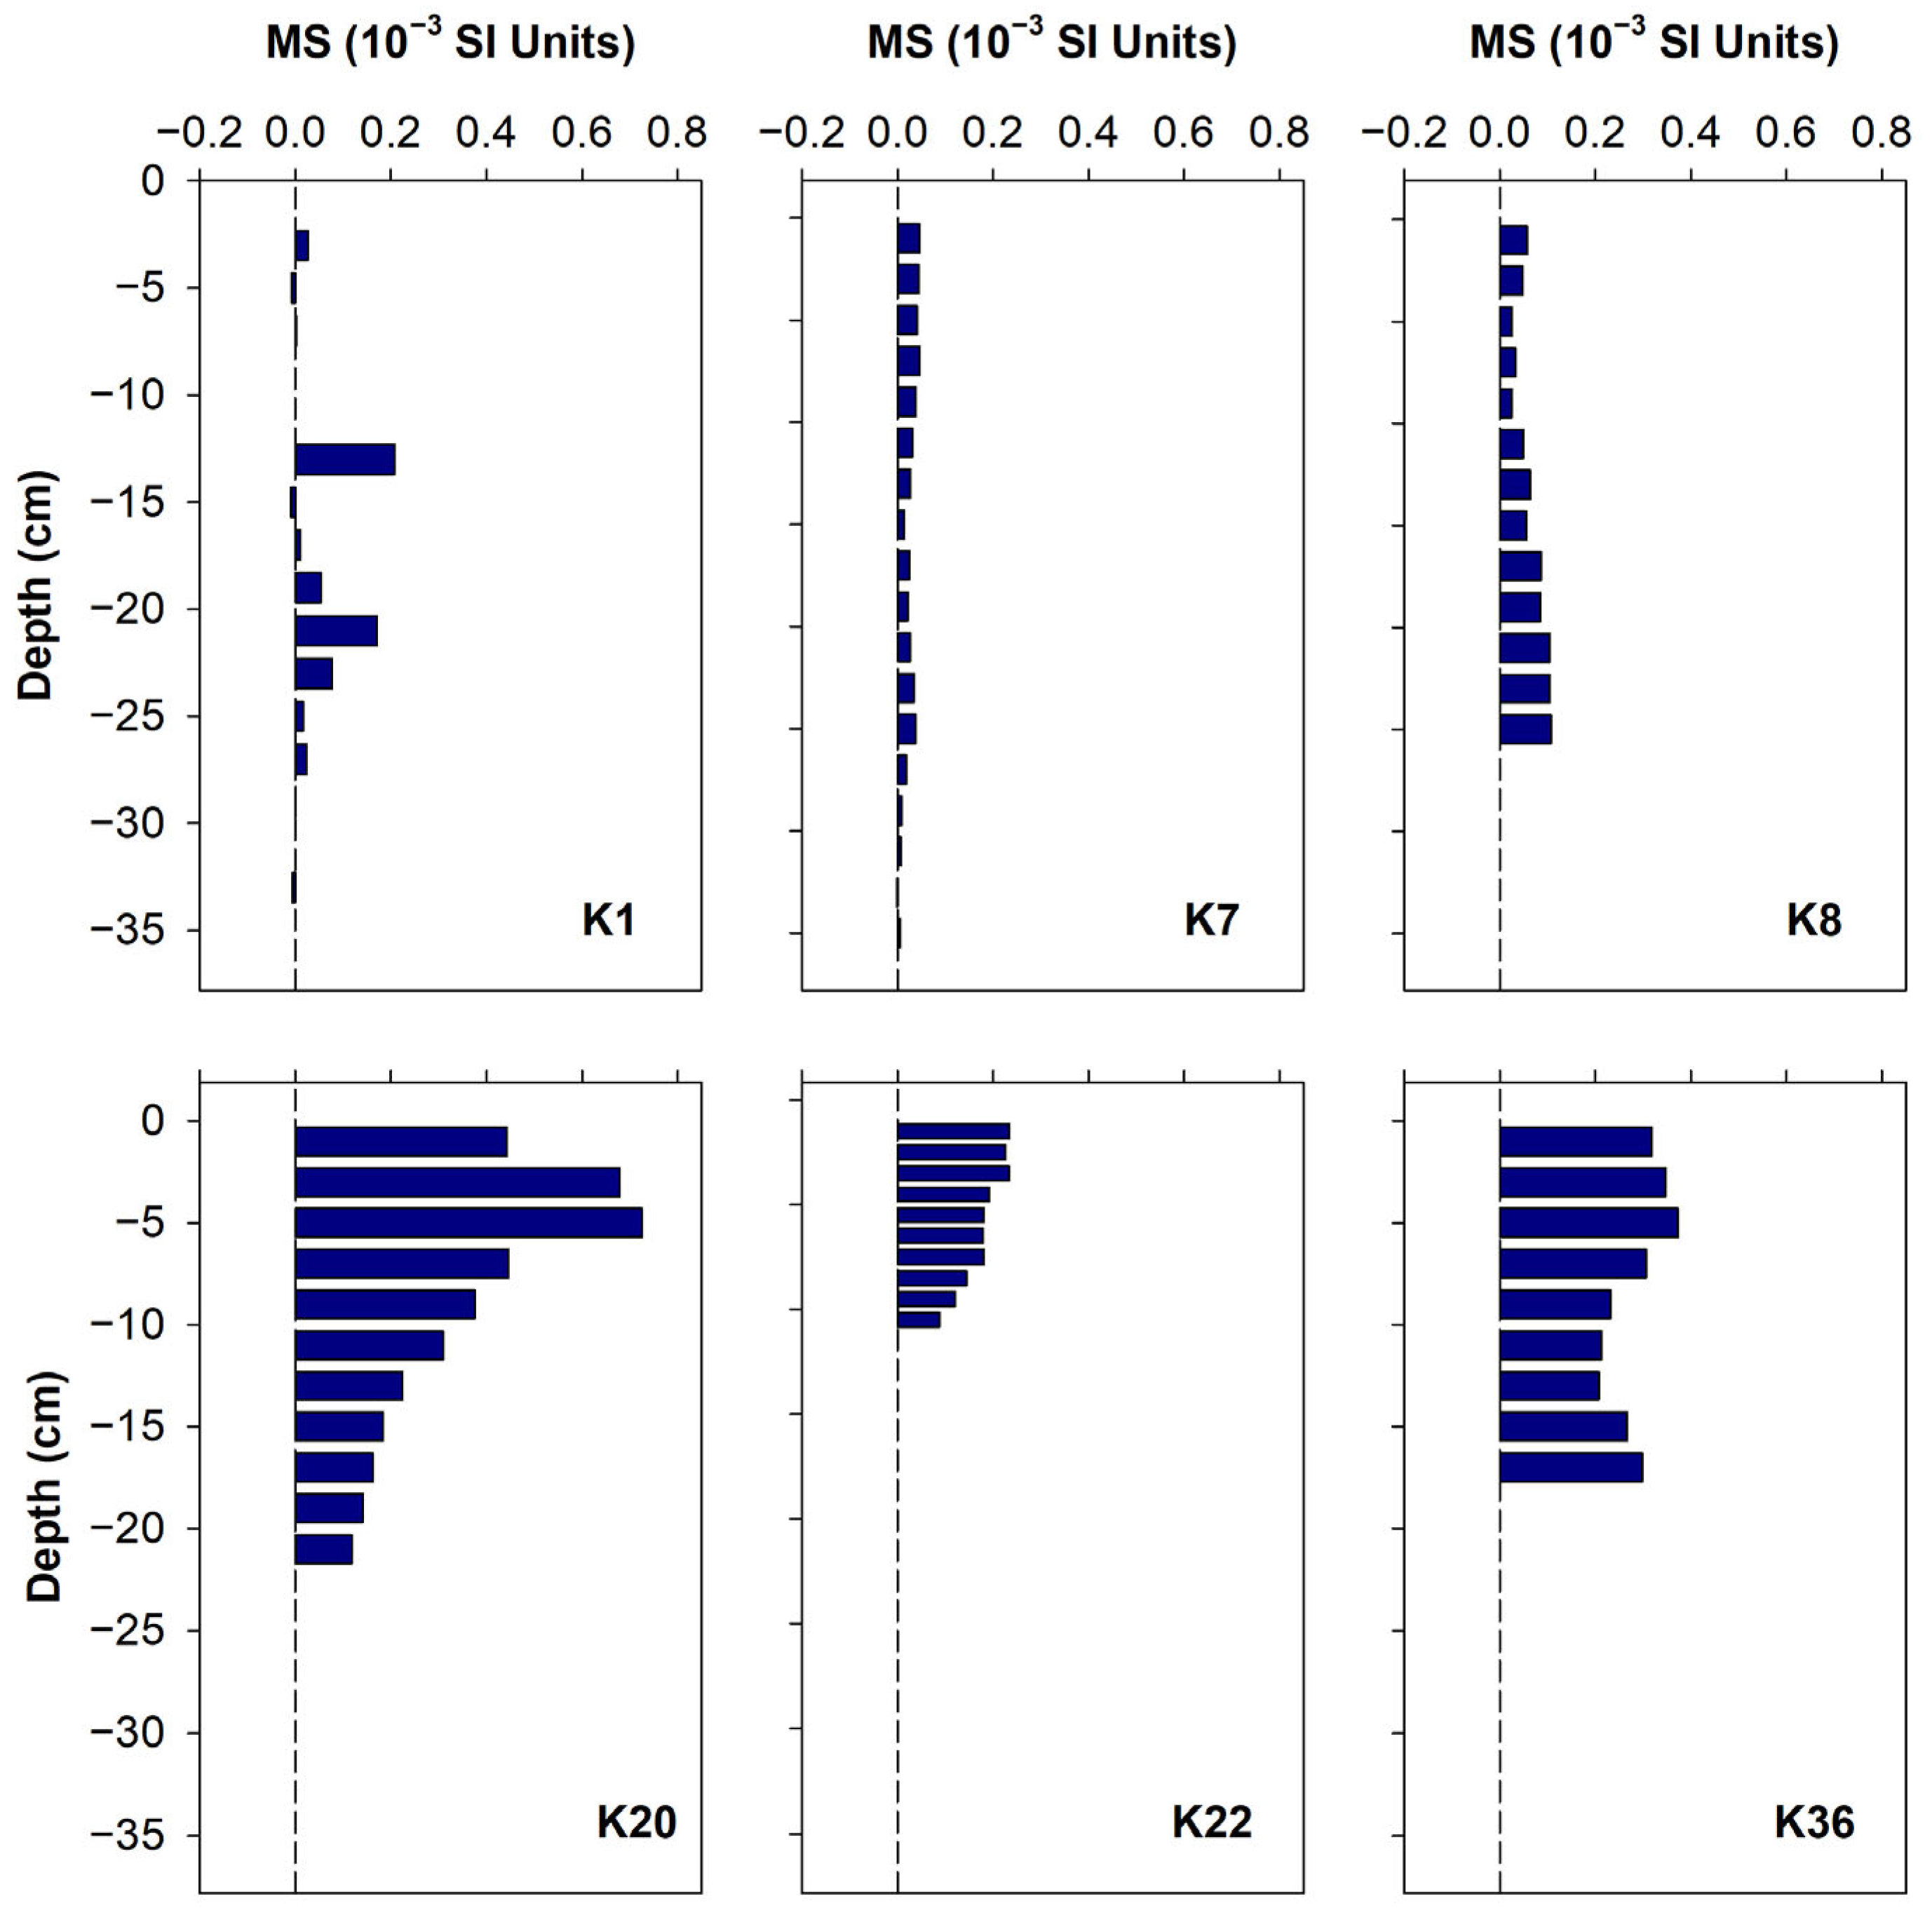
In core K1, the most upstream studied location in the estuary, all MS anomalies, as well as other highest values, are present approximately in the middle of the core, at depths from about 12 to 24 cm (
Figure 7). In most of the shallower layers, MS values are very low, indicating a decrease in contamination in more recent years. According to Cukrov et al. [
50], the sedimentation rate upstream of Prokljan Lake is 2 mm year
−1, so it can be assumed that these elevated MS values originate from layers that are 60–120 years old. However, differences in MS values between these layers are very high. Therefore, it seems there was no continuous input of heavy metal contamination, but rather some sporadic events during that period brought contamination.
In core K7, located in the middle of Prokljan Lake, a trend of decreasing MS values is observed from the surface to 16 cm depth, after which an increase is visible up to 26 cm, followed by another decline (
Figure 7). However, these changes in MS values are not large. In layers deeper than 26 cm, values are very low. According to Cukrov et al. [
50], the average sedimentation rate in Prokljan Lake is 4 mm year
−1, so these very low values start in layers older than approximately 65 years.
In core K8, located in Prokljan Lake at the Guduča River inflow, a significant decrease in MS values is observed from the deepest layers to about 4–6 cm, and from there to the surface, MS increases slightly again, but remains significantly lower than in the deeper layers (
Figure 7). At this location, according to Cukrov et al. [
50], annual sedimentation is about 5 mm, so this slight increase in MS values occurs in layers 8–12 years old. Anthropogenic influence at this location is unlikely, so the increased MS values most probably originate from terrigenous particles brought by the Guduča River. The rather small differences between layers (years) are most likely the result of changes in the quantity of material brought by the Guduča River, which mostly depends on the precipitation rate.
In core K20, located just in front of the closed ferroalloys factory, the highest MS values are found in the 4–6 cm layer; from there, they decrease towards the surface and with depth (
Figure 7). The sedimentation rate in Šibenik Bay is estimated to be less than 1 mm per year [
50]; however, sediment near the former TEF factory is enriched with slag material. Therefore, it is not possible to assume continuous sedimentation in that area or to discuss the dynamics of contamination over the years. Nevertheless, the clear decreasing trend in the uppermost sediment possibly reflects the closure of the TLM factory and the remediation of the surrounding area.
In core K22, located near the Martinska marine station, just opposite K20, there is a noticeable trend of decreasing values towards deeper layers, indicating that anthropogenic influence at this location was gradually increasing over time (
Figure 7). In the three shallowest layers, that increase has stopped and MS values are no longer rising; it is expected that they will start to decrease in the future, similar to core K20, but with some delay.
In core K36, located just in front of Šibenik harbour, the highest values are present in the 4–6 cm layer (
Figure 7). They decrease slightly towards the surface and with depth, but in the two deepest layers, they increase slightly again. However, there are no very large differences in MS values in any layer of this core, indicating that anthropogenic influence at this location has remained about the same throughout the time span covered by this core.
Although results from the current study confirm that MS is a reliable tool for assessing metal enrichment in surface sediment of the karstic estuary, its application to sediment cores requires significant caution. When dealing with depth profiles, MS has several important limitations that make it a potentially ambiguous indicator. Lithology, particle size distribution, and early diagenetic processes have a dominant influence on vertical MS variations; therefore, separation of the magnetic signal from the actual metal concentrations can occur. MS can be useful for screening cores to select depths for further chemical analysis and for distinguishing broadly impacted intervals, but it is not robust enough to be used as a stand-alone method to quantify vertical metal enrichment or to discuss historical contamination input in the environment.