


Abstract
Brine generated from seawater desalination presents significant environmental challenges due to its high salinity and pollutant content, particularly when discharged without adequate treatment. While advanced brine treatment systems offer opportunities for resource recovery and pollution reduction, they often involve increased energy and material demands, creating trade-offs between environmental benefits and resource consumption. This study integrates Water Footprint Assessment (WFA) and Life Cycle Assessment (LCA) to evaluate the freshwater sustainability of circular brine treatment systems under different process configurations. The framework is applied to four treatment scenarios, including variations in precipitation agents (NaOH and Ca(OH)2) and the inclusion of calcination processes, and compared with a reference scenario representing direct brine discharge. The results show that the blue water footprint is primarily driven by indirect water use associated with energy consumption, while pollutant loads influence the grey water footprint. Although advanced scenarios increase gross water demand, significant reductions are achieved through avoided water contributions from resource recovery and internal water reuse. Among the evaluated configurations, Scenario 2 exhibits the highest total water footprint due to elevated energy and pollutant-related impacts, whereas Scenarios 3 and 4 demonstrate improved performance through enhanced recovery efficiency. The water–carbon trade-off analysis highlights that minimizing carbon emissions does not necessarily reduce water consumption, emphasizing the importance of integrated assessment. Overall, the findings demonstrate that sustainable brine treatment design requires balancing water use, pollution control, energy demand, and resource recovery. The proposed WFA–LCA framework provides a robust decision-support tool for optimizing circular brine management systems.
1. Introduction
Freshwater is fundamental to human well-being, economic development, and ecosystem stability; however, its availability is increasingly constrained by both natural and anthropogenic pressures. Although freshwater constitutes only a small fraction of the Earth’s total water resources, the portion readily accessible for human use is extremely limited [1]. This imbalance, combined with uneven spatial and temporal distribution, poses a significant challenge for sustainable water resource management [2,3,4]. Rapid population growth, industrial expansion, and increasing agricultural demand continue to place significant pressure on already stressed water systems [5,6,7]. Projections further indicate that water scarcity will intensify in the coming decades, with a substantial proportion of the global population expected to experience water stress conditions [1,8]. These challenges highlight the urgent need for innovative and sustainable approaches to water resource management.
In response to growing water scarcity, desalination has emerged as a reliable and scalable solution for augmenting freshwater supply, particularly in arid and semi-arid regions [9]. Among available technologies, seawater reverse osmosis (SWRO) is widely adopted due to its relatively high efficiency and adaptability [10,11]. However, the expansion of desalination has introduced a critical environmental concern: the generation of highly concentrated brine. Conventional brine disposal practices, such as direct discharge into marine environments, can result in adverse ecological impacts due to elevated salinity and residual chemical content. Consequently, the development of advanced brine management technologies (BMTs), including volume reduction and zero liquid discharge (ZLD) systems, has gained increasing attention [12].
Modern brine treatment approaches offer promising pathways for recovering both freshwater and valuable mineral resources. Volume reduction technologies enable additional water recovery, while ZLD and crystallization processes facilitate the extraction of salts and other valuable materials [13,14,15]. These approaches align with circular economy principles by transforming waste streams into resource streams. However, such systems are inherently resource-intensive. Thermal-based technologies, including multi-effect distillation (MED) and crystallization, require substantial energy inputs [12], while membrane-based processes often depend on extensive chemical pre-treatment to mitigate scaling and fouling [16].
These energy and chemical requirements contribute to indirect freshwater consumption across supply chains. The water footprint associated with electricity generation varies significantly depending on energy source; for example, hydropower exhibits high water consumption due to reservoir evaporation losses, whereas renewable sources such as wind and solar photovoltaic systems have comparatively lower water footprints [17,18]. Similarly, chemical production processes introduce additional hidden water consumption. As a result, evaluating only direct water use is insufficient; instead, a comprehensive assessment must consider total water use across the entire supply chain [19]. These interdependencies highlight the importance of assessing brine treatment systems within a broader water–energy nexus framework, where improvements in one dimension may lead to trade-offs in another.
Water Footprint Assessment (WFA) provides a robust framework for quantifying freshwater consumption and pollution by distinguishing between blue and grey water footprints [20]. In parallel, Life Cycle Assessment (LCA) is widely used to evaluate environmental impacts across supply chains, including energy and material flows. While both methodologies are well established, they are often applied independently. WFA focuses on volumetric water use and pollution, whereas LCA emphasizes broader environmental impacts such as climate change and resource depletion [21,22]. However, limitations in LCA frameworks have been identified in capturing the full environmental implications of freshwater use and depletion [23]. As a result, the lack of integration between WFA and LCA restricts the ability to fully capture the complex interactions between water consumption, pollution, and resource recovery in emerging treatment systems.
This limitation is particularly significant in the early design phase of brine treatment technologies, where decisions regarding process configuration, energy sources, and material inputs can strongly influence long-term sustainability outcomes. Without an integrated assessment framework, early-stage evaluations may overlook critical trade-offs or fail to identify opportunities for improving resource efficiency.
To address this gap, this study integrates Water Footprint Assessment and Life Cycle Assessment to evaluate the freshwater sustainability of an early-stage brine treatment system within a circular economy framework. The analysis is based on a bench-scale system developed under the WalNUT project, a Horizon 2020 initiative aimed at advancing innovative and circular approaches in wastewater and brine treatment [24]. The system combines physical and chemical processes to enable resource recovery, including magnesium oxide (MgO), calcium carbonate (CaCO3), sodium sulfate (Na2SO4), potassium chloride (KCl), and sodium chloride (NaCl), while also recovering high-purity water.
Several studies have evaluated desalination and brine management systems using environmental assessment tools such as LCA and WFA [25,26]. Existing research has primarily focused on conventional desalination processes, particularly seawater reverse osmosis, with emphasis on energy consumption, carbon emissions, and water use impacts [27,28]. Other studies have explored brine treatment technologies and resource recovery pathways, including zero liquid discharge systems and mineral extraction processes [29,30]. However, these assessments are often conducted using a single methodological approach, either LCA or WFA, and rarely consider their integration [31]. Furthermore, limited attention has been given to early-stage circular brine treatment systems, where process design decisions and trade-offs between water consumption, pollution, energy use, and resource recovery are not yet fully understood. This highlights a critical research gap in the integrated evaluation of circular brine treatment systems using combined WFA and LCA approaches. This study addresses these gaps by integrating WFA and LCA within a unified framework for evaluating early-stage circular brine treatment systems. Unlike previous studies that apply these methods independently or focus on conventional systems, this work explicitly incorporates resource recovery, avoided environmental impacts, and water–energy trade-offs within a consistent system boundary. This integrated approach provides a more comprehensive basis for assessing sustainability and supporting decision-making in brine treatment design.
This study aims to quantify the blue and grey water footprints of different brine treatment scenarios while evaluating the influence of energy consumption and chemical inputs on overall freshwater use. It further assesses the contribution of resource recovery in reducing net water demand through the concept of water credits and examines the trade-offs between water footprint and environmental performance under varying energy configurations. By integrating WFA and LCA within a unified framework, this study provides new insights into the water–energy–resource nexus of brine treatment systems. The findings contribute to advancing circular economy strategies in desalination and support the development of more sustainable and resource-efficient brine management technologies.
2. Materials and Methods
This study integrates WFA and LCA to evaluate the freshwater sustainability of an early-stage brine treatment system under a circular economy framework. The overall methodological framework is illustrated in Figure 1. The framework consists of four main phases: (i) system modeling and data collection, (ii) water footprint accounting, (iii) sustainability assessment, and (iv) scenario and sensitivity analysis, all supported by a shared life cycle inventory (LCI).
Figure 1.
Integrated WFA–LCA methodological framework for brine treatment systems.
2.1. System Modeling and Data Collection
A mass and energy balance approach was used to quantify all material and energy flows within the brine treatment system. The model tracks inputs and outputs across each unit process to ensure mass conservation and accurate representation of process performance. Calculations were performed in MS Excel, while system modeling and life cycle inventory development were conducted using openLCA 2.0 developed by GreenDelta. Foreground data were obtained from laboratory-scale experiments conducted at the National Technical University of Athens (NTUA), Greece (2021–2022), using brine collected from a conventional seawater reverse osmosis (SWRO) desalination plant in Sounio, Attica. Background data for energy and material production were sourced from the Ecoinvent 3.9.1 cut-off database, using country-specific datasets where available and global datasets as proxies when necessary. More detailed information on the background system’s water consumption is found in the Supplementary Materials, Tables S16–S18.
Energy requirements for unit processes were estimated using a combination of simulation tools and literature-based values. Nanofiltration energy demand was simulated using the DuPont Water Application Value Engine (WAVE) software (https://www.dupont.com/water/resources/design-software.html, accessed on 15 February 2026), resulting in a specific energy consumption of 5.22 kWh/m3. Thermal processes (for example, MED evaporation and crystallization) and chemical processes were estimated based on comparable systems reported in the literature.
2.1.1. Functional Unit and System Boundaries
The functional unit (FU) of this study is defined as the treatment of 1.0 m3 of reject brine generated from a seawater reverse osmosis (SWRO) desalination plant. In the reference scenario, the FU corresponds to the direct discharge of untreated brine into the receiving water body. In contrast, the developed treatment scenarios aim to process the same volume of brine through integrated treatment systems designed for resource recovery and freshwater production.
The foreground system includes all unit processes involved in brine treatment, namely: (i) chemical treatment (precipitation of Mg(OH)2 and CaCO3, neutralization, and flotation); (ii) membrane-based separation (nanofiltration); (iii) thermal processes (multi-effect distillation and crystallization); (iv) high-temperature processing (calcination); and (v) natural drying. The system boundary extends from the brine treatment facility gate to the generation of recovered products intended for market substitutions.
Processes excluded from the system boundary include the upstream SWRO desalination process, brine collection and transport, end-of-life of recovered products, and treatment plant infrastructure. Transportation processes were also excluded due to data limitations and their relatively minor contribution to total water consumption, as highlighted in WFA guidelines [20]. The background system includes upstream production of energy, chemicals, and auxiliary inputs, which are essential components of the supply chain and significantly influence indirect water consumption.
2.1.2. Scenario Development and Process Description
The reference scenario represents conventional brine management, where reject brine is discharged directly into surface water bodies without further treatment. While this approach involves minimal operational input, it poses potential environmental risks and may not comply with regulatory standards. To address these limitations, four (4) treatment scenarios were developed to enhance system performance through resource recovery and environmental compliance. These scenarios are designed to (i) enable nutrient recovery for potential use as bio-based fertilizers; (ii) achieve near-zero liquid discharge (ZLD); (iii) comply with environmental regulations; and (iv) support circular economy objectives.
The system boundaries and process configurations of the treatment scenarios are illustrated in Figure 2. The scenarios primarily differ in the type of chemical used for Mg(OH)2 precipitation and the inclusion of calcination. Specifically, Sc1 and Sc2 utilize NaOH, while Sc3 and Sc4 utilize Ca(OH)2. Additionally, calcination is included in Sc2 and Sc4, whereas Sc1 and Sc3 exclude this process. All scenarios share common processes, including neutralization, nanofiltration, multi-effect distillation, crystallization, and flotation.
Figure 2.
System boundary and process flow diagram of the brine treatment system. The black dashed boundary represents the developed treatment scenarios, while the green dashed boundary indicates the reference scenario corresponding to direct brine discharge.
The treatment system enables the recovery of valuable mineral products, including MgO, CaCO3, KCl, Na2SO4, and NaCl, which are considered for market substitution, particularly in fertilizer applications. In addition, high-purity water is recovered and reused within the system, with excess water discharged to the receiving environment.
In this study, the integration of WFA and LCA is achieved through a shared life cycle inventory (LCI) framework. All mass and energy flows derived from system modeling are used consistently as input data for both WFA and LCA analyses. The two methods are applied in parallel rather than sequentially; WFA is used to quantify freshwater consumption and pollution (blue and grey water footprints), while LCA is used to assess broader environmental impacts associated with energy and material flows. This integrated approach enables a consistent and unified evaluation of water use, energy demand, pollutant loads, and resource recovery within the same system boundaries. As such, the framework allows for a more comprehensive analysis of trade-offs within the water–energy–resource nexus, rather than treating each assessment independently.
2.2. Water Footprint Accounting Analysis
Water footprint calculations were conducted based on the defined system boundaries, with a focus on blue and grey water footprint components to capture both consumptive water use and pollution-related impacts.
The blue water footprint (WFblue) represents the consumptive use of surface and groundwater resources. This study comprises the following four components: (i) evaporation losses during treatment processes; (ii) water incorporated in upstream chemical production; (iii) lost return flows that are no longer available within the same catchment; and (iv) avoided water associated with resource recovery and internal water reuse. The blue water footprint is calculated as follows:
The grey water footprint (WFgrey) quantifies the volume of freshwater required to dilute pollutants to meet acceptable environmental standards. It reflects the potential impact of effluent discharges on water quality and is expressed as follows:
where is the pollutant load (mass/time), is the maximum allowable concentration defined by regulatory standards, and is the natural background concentration in the receiving water body. In cases where site-specific data for are unavailable, a value of zero was assumed in accordance with established WFA guidelines. The total water footprint is defined as the sum of blue and grey components:
The green water footprint was excluded from this analysis, as it is generally associated with rainwater use in agricultural systems and is not relevant to the industrial processes considered in this study.
2.3. Sustainability, Scenario, and Sensitivity Analysis
The sustainability of water use was evaluated at the river basin scale by comparing the calculated water footprints with water availability and the assimilative capacity of the receiving water bodies. Blue water sustainability was assessed using the water scarcity indicator, defined as follows:
where represents the total blue water footprint within the catchment and denotes the available blue water resources. A value greater than 1 indicates unsustainable water use, whereas values less than 1 suggest that water consumption remains within sustainable limits.
Grey water sustainability was evaluated using the Water Pollution Level (WPL) [32,33], expressed as follows:
where is the total grey water footprint and is the actual run-off available for pollutant dilution. The actual runoff represents the volume of water available in the receiving system for pollutant dilution and was determined based on representative hydrological data for the study regions. In the absence of site-specific measurements, values were estimated using literature-based and secondary data consistent with basin-scale water availability assessments. Values exceeding 1 indicate that the assimilative capacity of the receiving water body has been exceeded, implying unsustainable pollution levels [20,32,34].
To evaluate system performance under varying conditions, a scenario-based analysis was conducted by comparing four developed treatment configurations with a reference scenario representing conventional brine discharge. In addition, alternative energy scenarios were analyzed to assess the influence of energy sources on water footprint results, based on national energy transition targets for Greece and the Philippines [35,36]. More information is found in the Supplementary Materials, Table S14 [37,38] and Table S15 [35,39].
A sensitivity analysis (expressed in sensitivity ratio, Equation (7)) was performed by applying a ±10% variation to key input parameters, including energy consumption and chemical usage, to evaluate their influence on the overall water footprint. The relative change between scenarios was calculated to quantify performance differences and identify the most influential parameters.
2.4. Data Quality Assessment
A Data Quality Assessment (DQA) was conducted in accordance with ISO 14040:2006 and the ILCD Handbook [40] to evaluate the reliability and robustness of the input data and the resulting water footprint estimates. The assessment aimed to ensure the consistency and credibility of both foreground and background datasets used in the study.
The evaluation considered key data quality indicators (see Supplementary Materials Table S19), including technological representativeness, geographical representativeness, temporal representativeness, completeness, precision, and methodological consistency. These indicators provide a systematic basis for assessing the suitability of the data in representing the actual system conditions.
An overall Data Quality Rating (DQR) was calculated by aggregating the individual indicator scores. The resulting DQR values were used to classify data quality into three categories: high quality, basic quality, and estimated data, following established LCA data quality guidelines. This classification supports the transparent interpretation of results and highlights potential uncertainties associated with the dataset.
3. Results
3.1. Life Cycle Inventory Data
The collected LCI data for the reference and developed brine treatment scenarios are summarized in Table 1. These data serve as the basis for scaling all material and energy inputs per functional unit (1 m3 of treated brine) and are subsequently used for the calculation of blue and grey water footprints.
Table 1.
LCI data for reference and developed brine treatment scenarios.
The results highlight significant variations in chemical consumption, energy demand, and resource recovery across the scenarios. Chemical usage differs depending on the precipitation agent employed, with NaOH applied in Sc1 and Sc2, and Ca(OH)2 in Sc3 and Sc4. Notably, the use of Ca(OH)2 results in lower deionized water requirements compared to NaOH-based scenarios.
Energy consumption is dominated by thermal processes, particularly multi-effect distillation (MED), which represents the largest energy contributor across all treatment scenarios. Additional energy demand is observed in Sc2 and Sc4 due to the inclusion of the calcination process. Membrane-based processes, such as nanofiltration, also contribute significantly to overall energy consumption.
In terms of resource recovery, all developed scenarios demonstrate the ability to recover valuable mineral products, including MgO, CaCO3, Na2SO4, NaCl, and KCl, as well as high-purity water. Sc3 and Sc4 show higher water recovery compared to Sc1 and Sc2, indicating improved process efficiency under Ca(OH)2-based treatment configurations. The LCI results illustrate the trade-offs between chemical inputs, energy consumption, and resource recovery, which are critical in understanding the water footprint performance of each scenario.
3.2. Water Footprint Accounting
3.2.1. Blue Water Footprint Results
The blue water footprint (WFblue) for all scenarios in Greece and the Philippines is presented in Figure 3. In Greece, WFblue increases from Sc1 to Sc4, with Sc4 exhibiting the highest value (12.36 m3/FU), while Sc1 shows the lowest (9.96 m3/FU), corresponding to a reduction of approximately 24.83%. A similar trend is observed in the Philippines, where Sc4 yields the highest WFblue (32.81 m3/FU), and Sc1 presents the lowest value (28.57 m3/FU). Notably, all developed scenarios show a substantial increase compared to the reference scenario, indicating that system expansion and additional processing steps introduce higher water demand. Moreover, WFblue values in the Philippines are consistently higher than those in Greece across all scenarios, reflecting differences in process conditions, energy requirements, and regional supply chains.
Figure 3.
Comparison of blue water footprint WFblue across scenarios for Greece and the Philippines, showing higher values in all developed scenarios compared to the reference case and consistently greater impacts in the Philippines.
To better understand the sources of water consumption, WFblue is disaggregated into direct water (DW) and indirect water (IW) contributions, as shown in Figure 4a,b. In both Greece (Figure 4a) and the Philippines (Figure 4b), indirect water, particularly associated with energy consumption, dominates the overall WFblue, contributing more than 75–90% across all scenarios. In contrast, direct water use (for example, evaporated and process water) accounts for only a minor fraction. This indicates that upstream processes, especially electricity generation and chemical production, are the primary drivers of water consumption in the system. The dominance of IW is consistent across Sc1–Sc4, highlighting the critical role of energy-intensive operations in shaping WFblue.
Figure 4.
Contribution of direct and indirect water use to the WFblue across scenarios for (a,c,e) Greece and (b,d,f) the Philippines, highlighting the dominance of indirect water from energy and the contribution of avoided water from resource recovery.
A more detailed breakdown of low-percentage contributions is presented in Figure 4c,d, focusing on the 0–2.5% (Greece) and 0–10% (Philippines) ranges. These panels emphasize the relatively small but non-negligible contributions of direct water use components, including evaporated water and process water. Although these components contribute minimally compared to IW, their variation across scenarios reflects operational differences, such as water reuse efficiency and process optimization. Different visualization ranges were applied for Greece (0–2.5%) and the Philippines (0–10%) to enhance the visibility of low-percentage contributions, as the relative magnitude of minor components differs between the two cases.
The contribution of avoided water, representing credits from resource recovery, is highlighted in Figure 4e,f. These panels (75–100% range) illustrate how recovered products and reused water offset the overall WFblue. Among the scenarios, Sc1 demonstrates the highest avoided water contribution, followed by Sc3, for both Greece and the Philippines. This reduction is primarily attributed to the recovery of marketable products such as MgO, CaCO3, Na2SO4, NaCl, and KCl, which substitute conventional production pathways with associated water savings. In particular, MgO recovery plays a dominant role in generating water footprint credits. Additionally, the reuse of high-purity recovered water within the system, specifically for preparing NaOH and HCl solutions during Mg(OH)2 precipitation and neutralization, further contributes to WFblue. More details are shown in the Supplementary Material, Tables S1–S9.
The results demonstrate that while process intensification and resource recovery increase gross WFblue due to higher indirect water demand, they simultaneously provide significant offsets through avoided water. This highlights the importance of considering both direct and indirect contributions, as well as recovery-based credits, in evaluating the net water footprint performance of advanced treatment systems.
To further clarify the origin of the high WFblue, a more detailed process-level contribution analysis was conducted and is presented using Sankey diagrams in Figure 5. The Sankey representation provides a clearer visualization of how individual treatment scenarios distribute their blue water footprint across the major process units in Greece and the Philippines. As shown in Figure 5, MED evaporation consistently dominates the WFblue contribution across all scenarios in both countries, indicating that it is the principal driver of total freshwater consumption within the system. This dominant contribution is primarily attributed to its high energy requirement, which is the largest among all unit processes.
Figure 5.
Sankey diagram illustrating the distribution of water footprint contributions across process units for (a) Greece and (b) the Philippines, highlighting the dominant role of the MED process and the relative contributions of downstream treatment and recovery units.
In addition to MED evaporation, nanofiltration, and Mg(OH)2 precipitation, these contribute appreciably to WFblue, although to a much lesser extent than MED evaporation. The Sankey plots show that nanofiltration remains a substantial contributor across all scenarios in both Greece and the Philippines, reflecting the indirect water demand associated with electricity use. A similar pattern is observed for the Mg(OH)2 precipitation step, regardless of whether NaOH or Ca(OH)2 is used as the precipitating agent. By contrast, the CaCO3 precipitation process contributes only a minor share to the total WFblue, mainly because the associated use of Na2CO3 results in a comparatively low water burden. Overall, the Sankey diagrams highlight that the differences in total WFblue among scenarios are governed largely by variations in the energy-intensive processes, particularly MED evaporation and nanofiltration, while the remaining treatment steps play secondary roles. Detailed numerical values and percentage contributions for all processes and scenarios are provided in Table A1.
3.2.2. Grey Water Footprint Results
The grey water footprint (WFgrey) and the corresponding avoided grey water (WFgrey) across all scenarios for Greece and the Philippines are presented in Figure 6a,b. WFgrey represents the total volume of freshwater required to assimilate pollutant loads, while WFavoided reflects the potential reduction in freshwater pollution due to resource recovery and process substitution.
Figure 6.
Comparison of grey water footprint and avoided grey water across scenarios for (a) Greece and (b) the Philippines, showing increased pollutant-related water demand alongside significant avoided impacts from resource recovery.
It is important to note that WFavoided does not represent actual recoverable freshwater, but rather the volume of water that would have been required to dilute pollutants in conventional production systems. Therefore, WFavoided is treated separately and is not directly subtracted from WFgrey, and no net WFavoided is reported. This distinction is essential, as WFgrey represents a local water quality impact within the receiving environment, whereas WFavoided reflects a system-level environmental credit associated with avoided emissions from conventional production pathways. This differs from WFblue, where recovered water can be directly reused, allowing for net footprint calculations.
In both countries, the reference scenario exhibits negligible WFgrey and no WFavoided, reflecting the baseline condition with minimal pollutant mitigation and no recovery processes. In contrast, all developed scenarios (Sc1–Sc4) show an increase in WFgrey, primarily due to additional treatment processes and system expansion, which introduce higher pollutant loads requiring dilution. The details on the effluent loads and water required to assimilate the pollutants are shown in the Supplementary Materials, Table S10 [41,42,43,44,45,46,47,48,49,50] and Table S11 [51,52] and the WFavoided of effluent is presented in the Supplementary Materials, Tables S12 and S13.
In the case of Greece (Figure 6a), WFgrey increases substantially from the reference scenario to the developed scenarios, with Sc2 exhibiting the highest value (52.15 m3), followed by Sc3 and Sc1. Despite this increase, WFavoided rises significantly across all scenarios, indicating strong pollution offset potential. The highest WFavoided is observed in Sc3 (1258.71 m3), followed by Sc4 (949.03 m3) and Sc2 (944.38 m3), demonstrating that these scenarios provide the greatest potential reduction in freshwater pollution. This is primarily attributed to the recovery of MgO and other by-products, which avoids emissions of key pollutants such as arsenic, chromium, copper, nickel, mercury, and zinc associated with conventional production processes. The relatively lower WFavoided in Sc1 (404.71 m3) reflects its comparatively lower recovery efficiency.
In the Philippine context (Figure 6b), similar trends are observed, although at a smaller magnitude. WFgrey increases in Sc1 (4.65 m3) and reaches its peak in Sc2 (5.16 m3), indicating higher pollutant loads under intensified system operations. However, a notable decrease is observed in Sc3 (0.46 m3), suggesting improved process efficiency and enhanced pollutant control. The notably lower WFgrey observed in Sc3 can be attributed to improved process efficiency and reduced pollutant loads associated with the use of Ca(OH)2 as the precipitation agent, which enhances the removal of key pollutants and reduces dilution requirements. In addition, regional differences in regulatory thresholds and assumptions regarding background concentrations influence the magnitude of WFgrey. In the Philippine case, the use of broader allowable concentration ranges and the assumption of zero background concentration contribute to lower WFgrey values compared to Greece. In contrast, WFavoided increases consistently across all developed scenarios, with Sc4 showing the highest value (13.87 m3), followed by Sc3 (9.19 m3) and Sc2 (4.74 m3). This indicates that although some scenarios increase pollutant loads, they simultaneously generate substantial environmental credit through avoided emissions.
The heatmap (Figure 7) illustrates the variation in pollutant contributions across the different brine treatment scenarios for Greece and the Philippines. In both cases, nitrate and ammonium consistently dominate the pollutant profile, exhibiting the highest contribution levels across most scenarios. In contrast, trace metals such as chromium, arsenic, zinc, and others contribute significantly lower magnitudes. Greece shows a more diverse pollutant distribution, with additional contributions from barium, phosphorus, copper, and nickel in certain scenarios, particularly Sc2 and Sc3. Conversely, the Philippines exhibits a simpler profile with fewer pollutants and generally lower magnitudes, although nitrate remains a key contributor. The presence of blank cells indicates pollutants that are not detected or not relevant in specific scenarios. The results highlight that nutrient-related pollutants are the primary drivers of water quality impacts, while metal contributions remain comparatively minor across the assessed configurations.
Figure 7.
Heatmap of pollutant contributions across scenarios for (a) Greece and (b) the Philippines. Color intensity (log scale) indicates magnitude; blank cells denote absent pollutants.
The results demonstrate a clear trade-off between increased pollutant generation and pollution offset through resource recovery. While the implementation of advanced treatment processes leads to higher WFgrey, particularly in early scenarios (Sc1–Sc2), more optimized configurations (Sc3–Sc4) enhance recovery efficiency and significantly increase WFavoided. These findings highlight the importance of evaluating both pollutant generation and avoided impacts to fully capture the environmental performance of the system.
3.2.3. Total Water Footprint Results
The total water footprint (WF) represents the combined contribution of blue water (WFblue) and grey water (WFgrey). Consistent with the grey water footprint methodology, avoided grey water is not subtracted from WFgrey; thus, the total WF reflects the gross freshwater requirement associated with both direct water consumption and the dilution capacity needed for pollutant assimilation. Figure 8 presents the distribution of WF components across all scenarios for Greece and the Philippines, allowing for a comparative assessment of magnitude, composition, and variability. In both countries, the reference scenario is located near the origin, indicating minimal freshwater demand due to the absence of advanced treatment processes and associated pollutant loads.
Figure 8.
Water footprint components (blue, gray, and total) across scenarios for Greece (a) and the Philippines (b). Values are expressed in m3/FU.
In Greece (Figure 8a), all developed scenarios (Sc1–Sc4) exhibit substantial increases in total WF relative to the reference scenario. This increase is driven predominantly by WFgrey, which constitutes the largest share of total WF across all scenarios. Sc2 shows the highest total WF, reflecting elevated pollutant loads and consequently greater dilution requirements. Sc1 represents the lowest total WF among the developed scenarios, while Sc3 and Sc4 demonstrate moderate reductions compared to Sc2. Despite these differences, the relative contribution of remains consistently dominant, indicating that water demand in the Greek context is primarily governed by pollutant assimilation rather than direct water consumption. The widespread in total WF values across scenarios further suggests strong sensitivity to system configuration and treatment intensity.
In contrast, the Philippines (Figure 8b) displays a more compact distribution of total WF values, although similar trends are observed. Sc2 again yields the highest total WF, confirming its relatively higher pollutant-driven water demand. Sc3 exhibits the lowest total WF among the developed scenarios, suggesting improved treatment efficiency and reduced pollutant loads. Sc1 and Sc4 fall within intermediate ranges. Compared to Greece, total WF values in the Philippines are generally lower, reflecting differences in influent characteristics, treatment performance, or system design. However, WFgrey remains the dominant component, underscoring the critical role of pollutant dilution requirements in determining overall water demand.
Across both countries, the dominance of WFgrey highlights the importance of pollutant load reduction and treatment optimization as key strategies for minimizing freshwater demand. While variations in WFblue are relatively small, changes in WFgrey significantly influence total WF, indicating that improvements in water quality management can yield substantial reductions in overall environmental burden. Furthermore, the observed differences between Greece and the Philippines emphasize the influence of regional conditions and system configurations, reinforcing the need for context-specific approaches in the design and optimization of sustainable water treatment systems.
3.2.4. Total Water Footprint and Recovered Products Credits Results
Table 2 shows the percentage recovery of high-purity water and the avoided water from the recovered salts and minerals from 1.0 m3 of treated brine, considering the total water consumed along the treatment process. For Greece, it can be found that Sc4 exhibits the highest per cent recovery of high-purity water, which is also the scenario with the lowest total water footprint. The water recovery was found to be lowest in Sc2, which can be observed as a scenario with the highest water footprint. In the Philippines, the highest water recovery was observed in Sc3 and the lowest at Sc2. Across both countries, Sc3 consistently yielded the highest or near-highest recovery performance, while Sc2 exhibited the lowest efficiency.
Table 2.
Comparative results of total water footprint and recovered water volumes under four developed scenarios in Greece and in the Philippines.
For the recovery of products for potential market substitution, Sc1 and Sc3 appear to be the highest in Greece and in the Philippines, respectively. However, Sc2 in both countries shows the lowest per cent recovery. The high-purity water recovery exhibits a higher percentage when compared to the water avoided from salts and minerals. This confirms that the equivalent market substitution products provide a higher water credit than the recovered high-purity water.
3.3. Water Footprint Sustainability Assessment Results
The sustainability assessment was calculated separately, WSblue and WPL, as shown in Table 3. For Greece, the ratio between the WFblue and the WAblue shows a clear increase in all the developed scenarios, with values ranging from 0.341 to 0.426. For the Philippines, WSblue values show minimal variation across all scenarios, ranging from 0.104 to 0.120. Both countries show below the sustainability threshold of 1.0, indicating sustainable water-use performance under the evaluated treatment scenarios. All WSblue values remain below the sustainability threshold, suggesting that the system maintains sustainable performance even under increased water resource pressure associated with treatment scenarios.
Table 3.
Water Footprint Sustainability Assessment (WFA and WPL) for Greece and the Philippines across all scenarios.
In Greece, the ratio between WFgrey and the river water flow rate remains low, ranging from 0.011 to 0.360. This remains far below the sustainability threshold, indicating effective control of pollution-related water impacts. In the Philippines, a similar trend was observed in which WPL remains less than the threshold value of 1.0, indicating sustainable pollution loads within the limit.
3.4. Water Footprint Response Formulation and Sensitivity Analysis
The results translate into targeted response strategies in freshwater consumption. First, as the results clearly identified that energy consumption is the highest contributor in WFblue across all developed scenarios, the strategies should focus on improving the energy efficiency of energy-intensive processes and evaluating energy source selection. This response shifts water management efforts from purely operational water savings toward energy–water nexus optimization, where reductions in energy intensity directly translate into lower water consumption. Furthermore, it addresses indirect water consumption, such as that associated with chemical inputs. The results show that substituting NaOH with Ca(OH)2 can yield lower water consumption; therefore, the inclusion of upstream water footprint in the design decisions on chemical substitution strategy can be considered as a response formulation to reduce water WF. Lastly, leveraging the avoided WF from the recovered market-equivalent products and high-purity water can contribute to the WF reduction. Through maximization of the resource recovery efficiency, the WF credits can directly offset the brine treatment’s water consumption. Overall, these responses provide a practical and policy-relevant pathway for reducing freshwater pressures and supporting sustainable brine management strategies.
The sensitivity analysis was conducted to investigate how parameter variability affects the results and to identify parameters that are critical for quantifying the water footprint of the brine treatment process. Table 4 shows the sensitivity ratio because of the ± 10% variation in energy consumption and chemical use across all developed scenarios (Sc1–Sc4) for Greece and the Philippines.
Table 4.
Sensitivity Ratio of energy consumption and chemical use in all developed scenarios.
As shown, energy consumption is the most sensitive among all parameters in both countries, indicating that this electricity input is the dominant driver influencing resource-related outcomes, more specifically in Sc3 in Greece. Meanwhile, in chemical use, the sensitivity ratios are consistently low across all scenarios and in both countries. In Greece, NaOH and Ca(OH)2 show minor sensitivity effects (0.06 and 0.05, respectively), while Na2CO3 shows negligible influence (≤0.01). Also, HTAB and HCl show zero sensitivity, indicating minimal contribution to overall system variation. In the Philippines, chemical sensitivity ratios are even lower. These results indicate that moderate changes in chemical use have a limited impact on the overall performance of the brine treatment system.
Grey water was not included in the sensitivity analysis because it does not represent direct physical water consumption but rather a calculated, impact-based metric reflecting the volume of water needed for pollutant dilution to meet water quality standards.
3.5. Scenario Analysis and Data Quality Assessment
For both countries, the reference scenario shows a minor difference in WF when renewable energy is used, and that electricity source substitution alone has minimal influence on WF under baseline operational conditions. Across all the developed scenarios, the use of renewable energy consistently shows a significant increase in the total WF, shown in Table 5. It can be noticed, specifically, that Sc2 shows the largest WF increase in Greece, giving 21.30%, and Sc4 (104.66%) in the Philippines. It is also important to note that the negative relative change means a WF reduction. In the Philippine setting, it can be observed that a 9.68% decrease is exhibited only in the reference scenario.
Table 5.
Relative percentage change of scenario analysis in WF among all developed scenarios.
Also, in this section, the DQA is presented based on the pedigree matrix shown in Supplementary Materials (Table S20). Generally, the parameters on the different processes have low ranking, from 1.8 to 2.4, and have received a basic data quality level identified from Table 1. The DQA results indicate that the datasets used for the WF of the brine treatment are generally of good quality. While temporal and geographical representativeness are moderate due to reliance on global data sets, the strong technological representativeness, high precision, and consistent methodology provide confidence in the validity of the model results. The calcination step presents the highest uncertainty and should be interpreted with caution; overall, the data are adequate to support strong WFA conclusions.
3.6. Water–Carbon Footprint Trade-Offs in Brine Treatment Systems
The trade-off between water and carbon footprints across all scenarios is illustrated in Figure 9, using normalized values to enable a direct and consistent comparison between Greece and the Philippines. Normalization allows both indicators to be evaluated on a common scale, facilitating clearer interpretation of relative performance across scenarios. The values were normalized using min–max scaling to rescale carbon and water footprints between 0 and 1, enabling direct comparison across scenarios. In this approach, lower footprint values correspond to higher normalized scores, representing better environmental performance.
Figure 9.
Normalized comparison of carbon and water footprints across scenarios for Greece (solid lines) and the Philippines (dashed lines), highlighting trade-offs and relative performance between scenarios.
In the Greek context (solid lines), a clear trend is observed where improvements in water footprint are generally associated with increases in carbon footprint. Among the scenarios, Sc2 exhibits the lowest normalized water footprint but corresponds to a relatively higher carbon footprint, indicating a trade-off between reduced water demand and increased energy-related emissions. Conversely, Sc4 shows a higher water footprint while maintaining moderate carbon performance. Sc1 and Sc3 demonstrate intermediate behavior, suggesting partial balance but without achieving optimal performance in both indicators simultaneously.
In contrast, the Philippine results (dashed lines) show a more pronounced divergence between water and carbon performance. Sc4 achieves the lowest carbon footprint but exhibits the highest water footprint, highlighting a strong trade-off between energy efficiency and water use. On the other hand, Sc2 presents the lowest water footprint but with higher carbon implications. Sc3 demonstrates a relatively balanced profile, with moderate values for both indicators, indicating a potential compromise solution. Sc1 shows low carbon impact but does not perform optimally in terms of water footprint.
The normalized comparison clearly demonstrates that no single scenario simultaneously minimizes both water and carbon footprints in both regional contexts. The results emphasize that carbon-optimal configurations are not necessarily water-efficient, and vice versa. Although a formal multi-objective optimization was beyond the scope of this study, the normalized framework provides a robust basis for identifying balanced or compromise scenarios, such as Sc3 in the Philippine case, which may offer more sustainable performance when both environmental indicators are considered.
4. Discussion
4.1. Blue Water Footprint
WFblue was presented based on direct and indirect water consumption for a more comprehensive and transparent assessment of both on-site and upstream water use within a system. The contribution analysis shown in Figure 4 and Figure 5 identified the indirect water, particularly the energy consumption, as the largest contributor. This result aligns with the study of [32], which reported that energy consumption is the highest contributor to the overall WFblue of both a conventional municipal wastewater treatment plant and a water reclamation unit. The highest contribution of MED evaporation among all the processes in all scenarios is furtherly substantiated by [4], the study states that MED evaporation treats high-TDS brine to produce high-quality water; however, a high electrical energy consumption is needed for the process, which further verifies that the energy-intensive background of MED evaporation is the primary driver of high WF of the brine treatment process [9,53].
Likewise, the upstream production of chemicals is particularly important to analyze, as it represents an additional layer of hidden water use, as noted by [19]. For NaOH, using the Ecoinvent 3.9.1 cut-off database, water is identified as a major input in the chlor-alkali electrolysis process (diaphragm, membrane, and mercury cell technologies) for the production of NaOH, alongside electricity, as also noted by [54]. These inputs highlight the significant influence of upstream chemical production on the overall WFblue of the system. The Ca(OH)2 in Mg(OH)2 precipitation, as a replacement of NaOH in Sc1 and Sc2, has a minimal contribution in Sc3 and Sc4. In particular, the substantial water requirements associated with NaOH and Ca(OH)2 manufacturing underscore the importance of considering indirect water use when evaluating process sustainability [55]. Additionally, in the CaCO3 precipitation process, the industrial production of soda ash using the Solvay process includes NaCl (salt) and CaCO3 (limestone) as raw materials. This process requires water used in NaCl solution, conversion of CaO into Ca(OH)2, and in preparing CaCl2 and NH4Cl solutions [56]. The cumulative water consumption from these chemical production pathways significantly elevates the overall blue water footprint of the brine treatment systems, emphasizing the criticality of upstream material selection in circular economy initiatives [57].
Furthermore, the environmental impact associated with electricity generation, particularly from fossil fuels, significantly exacerbates water scarcity due to the substantial water demands of power plants for cooling and other operational processes [58]. This underscores the need to transition towards renewable energy sources with lower water footprints to mitigate the water-energy nexus impact in brine treatment [59]. This highlights the imperative to explore alternative, less water-intensive methods for chemical production, such as utilizing desalination brine for sodium hydroxide generation via membrane chlor-alkali electrolysis, which can reduce reliance on virgin resources and associated environmental footprints [60,61]. Moreover, the recovery of valuable products from brine, including salts and metals, could further enhance the circularity of these systems by converting waste streams into marketable assets, thereby mitigating the overall environmental burden associated with resource extraction and production [62]. Such strategies, including zero liquid discharge systems that recover freshwater, sodium chloride, and mixed solid salts, demonstrate considerable potential for fostering circular economy principles within desalination and brine treatment applications [12,63].
Lastly, the recovered products consume the highest amount of freshwater due to their production. To be more specific, the background production of MgO includes mining and crushing steps, and a calcination step with a temperature of about 800–1000 °C. According to Chu (2023) [36], one of the main challenges during the calcination of Mg(OH)2 (brucite) to produce MgO is the high energy consumption. This means that the high amount of water consumed in MgO production stemmed in energy consumption, which is the same amount of water to be avoided after the product recovery and market substitution [36,64].
4.2. Grey Water Footprint
The calculations of WFgrey in both countries, WFavoided positively exceeds WFgrey across all the developed scenarios, except Sc1 and Sc2 in the Philippine setting, suggesting that the water that can be avoided associated with the recovered products can virtually outweigh the water needed to assimilate the pollutant loads, which may lead to water sustainability outcomes. Nevertheless, when the two countries are compared, the Philippines exhibits a minor WF than Greece. This can be attributed to the regulatory threshold and water quality standards used [65]. By following the EU Water Framework Directives, Greece has more conservative pollutant thresholds and has a smaller difference between maximum and natural background concentration, while the Philippine national standards allow a greater concentration margin, and the natural background concentrations were assumed to be zero due to the lack of data on the considered basin. Therefore, these findings indicate that WFgrey outcomes are influenced not only by treatment performance but also by regulatory standards and data availability. When WFavoided is considered, the developed scenarios clearly deliver positive outcomes for water resource sustainability.
4.3. Total Water Footprint
The developed scenarios on the total WF show a higher WF compared to the reference scenario, which can be attributed to the additional resource and energy input required to attain enhanced brine management outcomes in line with the brine treatment technology’s design goal. The reference scenario minimizes freshwater use primarily by limiting treatment consideration; however, the developed scenarios, therefore, represent a deliberate shift from water minimization toward resource recovery, emphasizing an integral trade-off between freshwater consumption and overall environmental performance [66,67].
4.4. Total Water Footprint and Recovered Products Credits
Despite the substantial total water footprint of the process, the high-purity water recovered and avoided water through the conventional production of salts and minerals provides a potential quantifiable offset that reduces water burden. When evaluating the gross water consumption only, the system appears water-intensive, particularly in Greece, which is higher than in the Philippines across all scenarios. However, such an interpretation is incomplete without accounting for the substitution effect generated by recovered water and nutrients.
From a systems perspective, the recovered high-purity water and the salts and minerals constitute an avoided freshwater extraction, effectively replacing an equivalent volume of water that would otherwise be sourced from a conventional supply. Without recovery, the total water footprint would translate directly into net water consumption. The recovery stream, therefore, functions as an internal circularity mechanism that reduces the system’s freshwater demand. Significantly, these findings highlight a water-related trade-off. While the treatment process is water-intensive, the integrated recovery pathway allows it to compensate for parts of the resources and environmental burden. Therefore, sustainability assessment should prioritize net water balance rather than gross water use, integrating both consumption and substitution effects. The results indicate that water recovery and the minerals recovered alongside the water to be avoided during the conventional production of these materials do not eliminate the process burden but materially offset it.
Despite the substantial water footprint of the process, recovering high-purity water and avoiding water use through conventional salt and mineral production provides a measurable offset that reduces the net burden. Although the system appears water-intensive, particularly in Greece, this interpretation is incomplete without considering substitution effects from recovered water and nutrients. From a systems perspective, these recovered outputs replace freshwater that would otherwise be extracted from conventional sources, functioning as an internal circularity mechanism that lowers overall demand. While recovery does not eliminate the process burden, it materially offsets freshwater consumption [68]. Therefore, sustainability assessments should prioritize net water balance rather than gross water use, integrating both consumption and substitution effects. This approach aligns with life cycle assessment methodologies that account for avoided burdens, where the environmental impacts of producing conventional products are subtracted from the impacts of the recovery process [69].
4.5. Water Footprint Sustainability Assessment
Since the assessment is based on bench-scale data, the water footprint sustainability assessment results should be interpreted as indicative rather than predictive, as it does not represent the full operational efficiencies, scale-dependent losses, or variability encountered under a large-scale implementation. The consistent low WSblue and WPL values imply that on a bench scale, the system maintains sustainable water footprint performance across all scenarios, while highlighting that future pilot- or full-scale assessments to validate these sustainability trends under real-world operating conditions are still needed. Future research should focus on developing scaling approaches that integrate process efficiency adjustments, energy optimization, and system-level uncertainties to enable the application of the proposed WFA–LCA framework at pilot and industrial scales.
4.6. Sensitivity and Scenario Analysis
The sensitivity analysis indicates that variations in operational parameters (±10% electricity and chemical dosing) do not necessarily translate into proportional changes in grey water values. Similar to the study of [70] on the improvement of the WFgrey assessment, it shows that total phosphorus (TP) input was higher than that of dissolved inorganic nitrogen (DIN) despite the lower rate of phosphorus fertilizer application. This result is a direct example of non-proportionality between an input and the resulting grey water footprint.
The increase in water footprint under renewable energy scenarios can be attributed to the specific composition of the energy mix. While renewable energy is generally associated with lower carbon emissions, certain technologies, such as hydropower, have relatively high-water consumption due to evaporation losses from reservoirs. In contrast, solar photovoltaic and wind energy systems typically exhibit lower water footprints. Therefore, the overall water footprint is strongly influenced by the relative contribution of these technologies within the national energy mix. This highlights that the transition to renewable energy does not inherently reduce water consumption, and may, in some cases, increase it depending on the dominant energy sources. Consequently, the water–energy nexus must be carefully considered when evaluating sustainable brine treatment systems. Further details on the water consumption of individual energy sources are provided in the Supplementary Materials (Tables S16 and S17), supporting the observed trends.
When a scenario analysis was conducted, the variability among the developed scenarios highlights that renewable energy integration does not inherently reduce WF. This result was found to be similar to the study of [1] wherein the water consumption of a seawater desalination with a reverse osmosis process increases [16], and highlighted that the use of thermal and solar power as energy sources requires more than double the water consumption [71,72]. Additionally, it was highlighted in the WFA guidelines [20], that hydropower, as a form of energy, has a relatively large water footprint per unit of energy. The relative change in the analysis clearly shows that WF does not respond proportionally to energy substitution. Similar renewable-energy inputs produce reasonable changes in Greece but extreme relative changes in the Philippines, highlighting geographical-specific behavior. Therefore, it indicates that energy sources have a great impact on the water footprint of the brine treatment process.
4.7. WFA–LCA Framework Integration
The integrated WFA–LCA framework developed in this study provides a comprehensive approach for evaluating the freshwater sustainability of early-stage brine treatment technologies within a broader water–energy–resources nexus, as illustrated in Figure 10. The results demonstrate that applying WFA and LCA independently is insufficient to capture the complex interactions between water consumption, pollution, energy demand, and resource recovery. In contrast, their integration enables a holistic assessment of how water is used and impacted across the system and how these effects are linked to energy use and material flows.
Figure 10.
Proposed integrated WFA–LCA nexus framework linking water, energy, and resource recovery in brine treatment systems, supporting scenario evaluation, trade-off analysis, and early-stage decision-making.
The nexus-based framework highlights the interconnected roles of water (blue and grey water footprints), energy (electricity demand, thermal processes, and associated carbon emissions), and resource recovery (for example, MgO, CaCO3, Na2SO4, NaCl, and KCl). By linking these dimensions, the framework supports a more transparent evaluation of trade-offs and synergies across the system. For instance, increased energy use in advanced treatment processes leads to higher indirect water consumption, while simultaneously enabling pollutant reduction and the recovery of valuable products that contribute to avoided environmental impacts.
At the scenario level, the results demonstrate a clear shift from conventional brine disposal toward circular and resource-efficient management strategies. Although the developed scenarios exhibit higher total water and energy demands compared to the reference scenario, these increases reflect improved environmental performance through reduced pollutant discharge, enhanced regulatory compliance, and material recovery. The reference scenario minimizes water use primarily by limiting treatment and allowing direct discharge, whereas the developed scenarios intentionally increase process intensity to achieve broader sustainability benefits.
From a techno-economic perspective, the implementation of advanced brine treatment systems is closely linked to energy consumption and process complexity. Energy-intensive processes, particularly multi-effect distillation and calcination, may significantly influence operational costs and overall system feasibility. Conversely, the recovery of valuable products such as MgO, CaCO3, and salts offers potential economic benefits through market substitution, which may partially offset treatment costs. Although a detailed techno-economic analysis was beyond the scope of this study, these findings highlight the importance of integrating environmental and economic assessments in future work to support the large-scale deployment of sustainable brine treatment technologies.
The results of this study are consistent with previous international studies on desalination and brine treatment systems, which have identified energy consumption as a dominant driver of water footprint, particularly through indirect water use associated with electricity generation [73,74]. Similar trends have been reported in studies of reverse osmosis desalination and wastewater treatment systems, where energy-intensive processes significantly influence overall water demand [58,75,76]. However, the magnitude of water footprint values varies across regions due to differences in energy mix, regulatory standards, and system configurations. For example, regions with higher reliance on water-intensive energy sources, such as hydropower, tend to exhibit higher indirect water consumption, while differences in water quality standards affect grey water footprint outcomes [77,78]. These comparisons highlight the importance of considering regional context when evaluating the sustainability of brine treatment systems.
Despite these contributions, the study has several limitations. The analysis is based on bench-scale data and does not explicitly account for scale-dependent operational factors, infrastructure requirements, or economic considerations. In addition, the use of secondary data for background processes and regional assumptions introduces uncertainty in the results. These limitations should be considered when interpreting the findings.
Overall, the WFA–LCA nexus framework provides a robust decision-support tool for early-stage design, enabling scenario comparison, trade-off analysis, and the identification of more balanced and sustainable configurations. This integrated approach is particularly valuable for guiding circular economic strategies and informing policy development in desalination and brine treatment systems.
5. Conclusions
This study presented an integrated WFA and LCA framework to evaluate the freshwater sustainability of circular brine treatment systems at the early design stage. The results demonstrate that while advanced treatment configurations enable substantial resource recovery and environmental benefits, they also introduce complex trade-offs between water consumption, pollution, and energy use. The analysis revealed that the blue water footprint is predominantly driven by indirect water use associated with energy-intensive processes, particularly multi-effect distillation and nanofiltration. Although process intensification increases overall water demand, significant reductions are achieved through avoided water contributions from recovered products and internal water reuse. In contrast, the grey water footprint increases with additional treatment processes due to higher pollutant loads; however, this is offset by substantial avoided impacts linked to reduced emissions from conventional production systems.
Across all scenarios, Sc2 consistently exhibited the highest total water footprint due to elevated pollutant dilution requirements and energy consumption, while Sc3 and Sc4 demonstrated improved performance through enhanced recovery efficiency and reduced pollution-related impacts. In the Philippine context, Sc3 emerged as the most balanced scenario, achieving the lowest total water footprint with moderate carbon implications, whereas in Greece, no single scenario simultaneously minimized both water and carbon footprints.
The water–carbon trade-off analysis further confirmed that improvements in carbon performance do not necessarily correspond to reductions in water footprint. Energy-efficient configurations may increase water demand due to upstream resource requirements, highlighting the importance of considering the water–energy nexus in system design. The normalized comparison framework provided a practical approach for identifying compromise solutions, particularly in region-specific contexts. The sustainability assessment indicated that all scenarios remain within acceptable limits for water scarcity and pollution levels, suggesting that the proposed systems are environmentally viable under the studied conditions. However, sensitivity analysis identified energy consumption as the most influential parameter, emphasizing the need to optimize energy use and carefully select energy sources to reduce indirect water demand.
This study highlights that sustainable brine treatment design requires a holistic and integrated evaluation of water consumption, pollution, energy use, and resource recovery. The proposed WFA–LCA framework provides a valuable decision-support tool for early-stage system optimization and for advancing circular economy strategies in desalination. Future work should focus on multi-objective optimization, the incorporation of spatially explicit water scarcity factors, and scaling analysis to support real-world implementation. Future research should focus on scaling the framework to pilot and industrial applications, integrating techno-economic analysis, and incorporating spatially explicit water scarcity factors. In addition, further work is needed to refine the integration of WFA and LCA and to explore multi-objective optimization approaches for balancing water, energy, and environmental performance.
Supplementary Materials
The following supporting information can be downloaded at: https://www.mdpi.com/article/10.3390/environments13050259/s1, Table S1: WFblue of brine treatment for reference and developed scenarios (1 m3 of treated brine); Tables S2–S5: WFblue on each process and recovered products for reference and developed scenarios—Greece (Sc1)–(Sc4); Tables S6–S9: WFblue on each process and recovered products for reference and developed scenarios—Philippines (Sc1)–(Sc4); Table S10: Effluent loads and water required to assimilate (WF) the pollutants for reference and developed scenarios (1 m3 of treated brine), Greece; Table S11: Avoided WF of effluent for reference and developed scenarios (1 m3 of treated brine), Greece; Table S12: Effluent loads and water required to assimilate (WF) the pollutants for reference and developed scenarios (1 m3 of treated brine), Philippines; Table S13: Avoided WF of effluent for reference and developed scenarios (1 m3 of treated brine), Philippines; Table S14: Energy Mix to produce 1 kWh high voltage electricity; Table S15: Energy Mix to produce 1 kWh high voltage electricity (with renewable energy targets); Table S16: Water consumption to produce 1 kWh of electricity in different energy sources; Table S17. Water consumption to produce 1 kWh of electricity with renewable energy sources; Table S18: Water consumption of chemicals/materials used in all the developed scenarios; Table S19: Data Quality Rating levels definition for the different data quality indicators; and Table S20: Data Quality Scoring Assessment Matrix.
Author Contributions
Conceptualization, J.A.J., F.J.T. and B.K.; methodology, J.A.J., F.J.T. and B.K.; software, J.A.J. and B.K.; validation, F.J.T. and B.K.; formal analysis, J.A.J.; investigation, J.A.J.; resources, B.K. and M.B.; data curation, J.A.J. and B.K.; writing—original draft preparation, J.A.J.; writing—review and editing, F.J.T., B.K., C.E.F.M., M.B., J.G.G. and D.B.S.; visualization, J.A.J.; supervision, F.J.T., B.K. and C.E.F.M.; project administration, B.K., M.B. and D.B.S.; funding acquisition, B.K. and M.B. All authors have read and agreed to the published version of the manuscript.
Funding
This research was funded by the European Union’s Horizon 2020 WalNUT Project with a grant number 101000752 and Erasmus+ Call 2022-KA1-Learning Mobility of Individuals—Student mobility for studies between programme and partner countries for supporting and funding the mobility program during the conduct of the study.
Data Availability Statement
All data are contained in the manuscript.
Acknowledgments
The authors would like to acknowledge the support of the following: Office of the International Linkages for Research and Development (ILRAD), Mapua University, for facilitating the mobility program, University of Southern Denmark (SDU) as the host and implementing institution, and National Technical University of Athens (NTUA), Greece for the data and laboratory testing. The authors also acknowledge Lilla Simon of the Department of Green Technology, Faculty of Engineering, SDU for the assistance of providing relevant data.
Conflicts of Interest
The authors declare no conflicts of interest.
Abbreviations
The following abbreviations are used in this manuscript:
| BBF | Bio-Based Fertilizer |
| BMTs | Brine Management Technologies |
| DQA | Data Quality Assessment |
| DQR | Data Quality Ratio |
| HTAB | Hexadecyl trimethyl ammonium bromide |
| ILCD | International Reference Life Cycle Data System |
| MED | Multi-Effect Distillation |
| LCA | Life Cycle Assessment |
| Ract | Actual Run-off |
| SWRO | Seawater Reverse Osmosis |
| WFA | Water Footprint Assessment |
| WFblue | Blue Water Footprint |
| WFgrey | Grey Water Footprint |
| WAblue | Water Availability |
| WPL | Water Pollution Level |
| WSblue | Blue Water Scarcity |
Appendix A
Table A1.
WF on the different processes in all the developed scenarios per 1 m3 of treated brine.
References
- Zhang, X.; Jiang, J.; Yuan, F.; Song, W.; Li, J.; Xing, D.; Zhao, L.; Dong, W.; Pan, X.; Gao, X. Estimation of Water Footprint in Seawater Desalination with Reverse Osmosis Process. Environ. Res. 2022, 204, 112374. [Google Scholar] [CrossRef] [Scilit] [PubMed]
- Jeswani, H.K.; Azapagic, A. Water Footprint: Methodologies and a Case Study for Assessing the Impacts of Water Use. J. Clean. Prod. 2011, 19, 1288–1299. [Google Scholar] [CrossRef] [Scilit]
- Bwapwa, J.K.; Akash, A.; Trois, C. Jet Fuel from Domestic Wastewater Treatment Using Microalgae: A Review. In Green Materials for Wastewater Treatment; Springer: Cham, Switzerland, 2020; ISBN 9783030177249. [Google Scholar]
- Cipolletta, G.; Lancioni, N.; Akyol, Ç.; Eusebi, A.L.; Fatone, F. Brine Treatment Technologies towards Minimum/Zero Liquid Discharge and Resource Recovery: State of the Art and Techno-Economic Assessment. J. Environ. Manag. 2021, 300, 9. [Google Scholar] [CrossRef] [Scilit] [PubMed]
- Diro, K.; Angassa, K.; Gebremeskel, T.; Abewaa, M.; Mengistu, A. Assessment of the Water Footprint of the Brewery Industry: The Case of Heineken, Addis Ababa, Ethiopia. Results Eng. 2024, 24, 102928. [Google Scholar] [CrossRef] [Scilit]
- Khondoker, M.; Mandal, S.; Gurav, R.; Hwang, S. Freshwater Shortage, Salinity Increase, and Global Food Production: A Need for Sustainable Irrigation Water Desalination—A Scoping Review. Earth 2023, 4, 223–240. [Google Scholar] [CrossRef] [Scilit]
- Reid, A.J.; Carlson, A.K.; Creed, I.F.; Eliason, E.J.; Gell, P.A.; Johnson, P.T.J.; Kidd, K.A.; MacCormack, T.J.; Olden, J.D.; Ormerod, S.J.; et al. Emerging Threats and Persistent Conservation Challenges for Freshwater Biodiversity. Biol. Rev. 2019, 94, 849–873. [Google Scholar] [CrossRef] [Scilit]
- United Nations Educational Scientific and Cultural Organization. The United Nations World Water Development Report 2019: Leaving No One Behind; UNESCO: Paris, France, 2019. [Google Scholar]
- Ouda, O.K.M.; Khalid, Y.; Ajbar, A.; Rehan, M.; Shahzad, K.; Wazeer, I.; Nizami, A. Long-Term Desalinated Water Demand and Investment Requirements: A Case Study of Riyadh. J. Water Reuse Desalination 2017, 8, 432–446. [Google Scholar] [CrossRef] [Scilit]
- Al-Kaabi, A.H.; Mackey, H.R. Environmental Assessment of Intake Alternatives for Seawater Reverse Osmosis in the Arabian Gulf. J. Environ. Manag. 2019, 242, 22–30. [Google Scholar] [CrossRef] [Scilit]
- Omerspahic, M.; Al-Jabri, H.; Siddiqui, S.A.; Saadaoui, I. Characteristics of Desalination Brine and Its Impacts on Marine Chemistry and Health, With Emphasis on the Persian/Arabian Gulf: A Review. Front. Mar. Sci. 2022, 9, 845113. [Google Scholar] [CrossRef] [Scilit]
- Panagopoulos, A.; Haralambous, K.J.; Loizidou, M. Desalination Brine Disposal Methods and Treatment Technologies—A Review. Sci. Total Environ. 2019, 693, 2. [Google Scholar] [CrossRef] [Scilit]
- Chung, H.W.; Nayar, K.G.; Swaminathan, J.; Chehayeb, K.M.; Lienhard V, J.H. Thermodynamic Analysis of Brine Management Methods: Zero-Discharge Desalination and Salinity-Gradient Power Production. Desalination 2017, 404, 291–292. [Google Scholar] [CrossRef] [Scilit]
- Mavukkandy, M.O.; Chabib, C.M.; Mustafa, I.; Al Ghaferi, A.; AlMarzooqi, F. Brine Management in Desalination Industry: From Waste to Resources Generation. Desalination 2019, 472, 3. [Google Scholar] [CrossRef] [Scilit]
- US Department of the Interior Bureau of Reclamation. Brine-Concentrate Treatment and Disposal Options Report—Part 1; US Department of the Interior Bureau of Reclamation: Washington, DC, USA, 2009.
- Semblante, G.U.; Lee, J.Z.; Lee, L.Y.; Ong, S.L.; Ng, H.Y. Brine Pre-Treatment Technologies for Zero Liquid Discharge Systems. Desalination 2018, 441, 96–111. [Google Scholar] [CrossRef] [Scilit]
- Hoekstra, A.Y.; Mekonnen, M.M. The Water Footprint of Electricity from Hydropower; UNESCO-IHE Institute for Water Education: Delft, The Netherlands, 2011. [Google Scholar]
- Mekonnen, A.D.; Gorsevski, P.V. A Web-Based Participatory GIS (PGIS) for Offshore Wind Farm Suitability within Lake Erie, Ohio. Renew. Sustain. Energy Rev. 2015, 41, 162–177. [Google Scholar] [CrossRef] [Scilit]
- Gerbens-Leenes, P.W.; Hoekstra, A.Y.; Bosman, R. The Blue and Grey Water Footprint of Construction Materials: Steel, Cement and Glass. Water Resour. Ind. 2018, 19, 1–12. [Google Scholar] [CrossRef] [Scilit]
- Hoekstra, A.Y.; Aldaya, M.M.; Chapagain, A.K.; Mekonnen, M.M. The Water Footprint Assessment Manual; Earthscan Copyright: Washington, DC, USA, 2012; ISBN 978-1-84971-279-8. [Google Scholar]
- Boulay, A.; Hoekstra, A.Y.; Vionnet, S. Complementarities of Water-Focused Life Cycle Assessment and Water Footprint Assessment. Environ. Sci. Technol. 2013, 47, 11926–11927. [Google Scholar] [CrossRef] [Scilit]
- Berger, M.; Gerbens-Leenes, W.; Karandish, F.; Aldaya, M.M.; Boulay, A.M.; Hogeboom, R.J.; Link, A.; Manzardo, A.; Mialyk, O.; Motoshita, M.; et al. Complementary Strengths of Water Footprint and Life Cycle Assessments in Analyzing Global Freshwater Appropriation and Its Local Impacts—Recommendations from an Interdisciplinary Discussion Series. Ecol. Indic. 2025, 174, 113458. [Google Scholar] [CrossRef] [Scilit]
- Bayart, J.-B.; Bulle, C.; Deschênes, L.; Margni, M.; Pfister, S.; Vince, F.; Koehler, A. A Framework for Assessing Off-Stream Freshwater Use in LCA. Int. J. Life Cycle Assess. 2010, 15, 439–453. [Google Scholar] [CrossRef] [Scilit]
- EU Horizon WalNUT Homepage. Salt of the Earth: Greece’s Latest Circular Solution to Water and Fertiliser Security. 2025. Available online: https://walnutproject.eu/news/salt-of-the-earth-greeces-latest-circular-solution-to-water-and-fertiliser-security/ (accessed on 11 December 2025).
- Bello, A.S.; Zouari, N.; Da’ana, D.A.; Hahladakis, J.Ν.; Al-Ghouti, M.A. An Overview of Brine Management: Emerging Desalination Technologies, Life Cycle Assessment, and Metal Recovery Methodologies. J. Environ. Manag. 2021, 288, 112358. [Google Scholar] [CrossRef] [Scilit]
- Elginöz, N.; Papadaskalopoulou, C.; Harris, S.E. Using Life Cycle Assessment at an Early Stage of Design and Development of Zero Discharge Brine Treatment and Recovery. Water Resour. Ind. 2022, 28, 100184. [Google Scholar] [CrossRef] [Scilit]
- Cornejo, P.K.; Santana, M.V.E.; Hokanson, D.R.; Mihelcic, J.R.; Zhang, Q. Carbon Footprint of Water Reuse and Desalination: A Review of Greenhouse Gas Emissions and Estimation Tools. J. Water Reuse Desalination 2014, 4, 238–252. [Google Scholar] [CrossRef]
- Raluy, R.G.; Serra, L.M.; Uche, J.; Valero, A. Life-Cycle Assessment of Desalination Technologies Integrated with Energy Production Systems. Desalination 2004, 167, 445–458. [Google Scholar] [CrossRef] [Scilit]
- O’Connell, M.G.; Rajendran, N.; Elimelech, M.; Gilron, J.; Dunn, J.B. Analysis of Energy, Water, Land and Cost Implications of Zero and Minimal Liquid Discharge Desalination Technologies. Nat. Water 2024, 2, 1116–1127. [Google Scholar] [CrossRef] [Scilit]
- Tong, T.; Xu, L.; Horseman, T.; Westerhoff, P.; Xu, P.; Yao, Y.; Zhang, X.; Alghanayem, R.; Lin, S. Brine Management with Zero and Minimal Liquid Discharge. Nat. Rev. Clean Technol. 2025, 1, 185–200. [Google Scholar] [CrossRef] [Scilit]
- Ktori, R.; Posada, J.A.; van Loosdrecht, M.C.M.; Xevgenos, D. LCA Methodological Choices and Environmental Impacts Performance of an Integrated Seawater Desalination and Brine Treatment System. Sustain. Prod. Consum. 2025, 61, 338–355. [Google Scholar] [CrossRef] [Scilit]
- Çankaya, S. Evaluation of the Impact of Water Reclamation on Blue and Grey Water Footprint in a Municipal Wastewater Treatment Plant. Sci. Total Environ. 2023, 903, 5. [Google Scholar] [CrossRef] [Scilit]
- Pellicer-Martínez, F.; Martínez-Paz, J.M. The Water Footprint as an Indicator of Environmental Sustainability in Water Use at the River Basin Level. Sci. Total Environ. 2016, 571, 561–574. [Google Scholar] [CrossRef] [Scilit]
- D’Ambrosio, E.; Ricci, G.F.; Gentile, F.; De Girolamo, A.M. Using Water Footprint Concepts for Water Security Assessment of a Basin under Anthropogenic Pressures. Sci. Total Environ. 2020, 748, 6–7. [Google Scholar] [CrossRef] [Scilit]
- Department of Energy. National Renewable Energy Program 2020–2040; Department of Energy: Taguig City, Philippines, 2022.
- Chu, S.H.; Yang, E.H.; Unluer, C. Chemical Synthesis of Magnesium Oxide (MgO) from Brine towards Minimal Energy Consumption. Desalination 2023, 556, 4. [Google Scholar] [CrossRef] [Scilit]
- International Energy Agency. Greece. 2024. Available online: https://www.iea.org/countries/greece (accessed on 28 October 2025).
- International Energy Agency. Philippines. 2023. Available online: https://www.iea.org/countries/philippines (accessed on 28 October 2025).
- European Commission. National Energy and Climate Plans (NECPs). Available online: https://commission.europa.eu/energy-climate-change-environment/implementation-eu-countries/energy-and-climate-governance-and-reporting/national-energy-and-climate-plans_en (accessed on 28 October 2025).
- European Commission-Joint Research Center. International Reference Life Cycle Data System (ILCD) Handbook—General Guide for Life Cycle Assessment—Detailed Guidance, 1st ed.; EUR 24708 EN; Publications Office of the European Union: Luxembourg, 2010. [Google Scholar]
- Canadian Council of Ministers of the Environment. Canadian Water Quality Guidelines for the Protection of Aquatic Life: Arsenic; Canadian Council of Ministers of the Environment: Winnipeg, MB, Canada, 2001.
- Chapman, D. Water Quality Assessments—A Guide to Use of Biota, Sediments and Water in Environmental Monitoring, 2nd ed.; E&FN Spon: London, UK, 1996. [Google Scholar]
- Canadian Council of Ministers of the Environment. Canadian Water Quality Guidelines for the Protection of Aquatic Life: Chromium—Hexavalent Chromium and Trivalent Chromium; Canadian Council of Ministers of the Environment: Winnipeg, MB, Canada, 1999.
- Canadian Council of Ministers of the Environment. Canadian Water Quality Guidelines for the Protection of Aquatic Life: Phosphorus; Canadian Guidance Framework for the Management of Freshwater Systems; Canadian Council of Ministers of the Environment: Winnipeg, MB, Canada, 2004.
- US-EPA; United States Environmental Protection Agency. National Recommended Water Quality Criteria—Aquatic Life Criteria. Available online: https://www.epa.gov/wqc/national-recommended-water-quality-criteria-aquatic-life-criteria-table (accessed on 28 November 2025).
- European Parliament and the Council of the European Union. Directive 2013/39/EU of the European Parliament and of the Council Amending Directives 2000/60/EC and 2008/105/EC as Regards Priority Substances in the Field of Water Policy; European Union: Brussels, Belgium, 2008.
- Canadian Council of Ministers of the Environment. Canadian Water Quality Guidelines for the Protection of Aquatic Life: Zinc; Canadian Council of Ministers of the Environment: Winnipeg, MB, Canada, 2018.
- Canadian Council of Ministers of the Environment. Canadian Water Quality Guidelines for the Protection of Aquatic Life: Ammonia; Canadian Council of Ministers of the Environment: Winnipeg, MB, Canada, 2010.
- Canadian Council of Ministers of the Environment. Water Quality Guidelines for the Protection of Aquatic Life: Chloride; Canadian Council of Ministers of the Environment: Winnipeg, MB, Canada, 2011.
- Canadian Council of Ministers of the Environment. Canadian Water Quality Guidelines for the Protection of Aquatic Life: Nitrate; Canadian Council of Ministers of the Environment: Winnipeg, MB, Canada, 2012.
- Department of Environment and Natural Resources. DENR Administrative Order No. 2016-08 on Water Quality Guidelines and General Effluent Standards of 2016; Department of Environment and Natural Resources: Quezon City, Philippines, 2016.
- Department of Environment and Natural Resources. DENR-Updated Water Quality Guidelines (WQG) and General Effluent Standards (GES) for Selected Parameters; Department of Environment and Natural Resources: Quezon City, Philippines, 2021.
- Kieselbach, M.; Högen, T.; Geißen, S.; Track, T.; Becker, D.R.; Rapp, H.; Koschikowski, J.; Went, J.J.; Horn, H.; Saravia, F.; et al. Brines from Industrial Water Recycling: New Ways to Resource Recovery. J. Water Reuse Desalination 2020, 10, 443–461. [Google Scholar] [CrossRef] [Scilit]
- Garcia-Herrero, I.; Margallo, M.; Onandía, R.; Aldaco, R.; Irabien, A. Environmental Challenges of the Chlor-Alkali Production: Seeking Answers from a Life Cycle Approach. Sci. Total Environ. 2017, 580, 147–157. [Google Scholar] [CrossRef] [Scilit]
- Salazar-Sogamoso, L.M.; García, M.Á.G.; Dobrosz-Gómez, I. Comparative Life Cycle Assessment of Sequential Chemical and Electrochemical Processes for the Treatment of Industrial Textile Wastewater. J. Solid State Electrochem. 2024, 29, 3379–3399. [Google Scholar] [CrossRef] [Scilit]
- Rahimpour, H.; Fahmi, A.; Zinatloo-Ajabshir, S. Toward Sustainable Soda Ash Production: A Critical Review on Eco-Impacts, Modifications, and Innovative Approaches. Results Eng. 2024, 23, 2. [Google Scholar] [CrossRef] [Scilit]
- Shrestha, S. Advancing Chain Elongation Technology for Medium Chain Carboxylic Acids Production from Waste Streams. Ph.D. Thesis, University of Michigan, Ann Arbor, MI, USA, 2020. [Google Scholar] [CrossRef] [Scilit]
- Sarraf, S.; Deswal, S. Life Cycle Assessment of a Water Treatment Plant Based on Non-Conventional Moving Bed Biofilm Reactor Process. Evergreen 2023, 10, 1388–1397. [Google Scholar] [CrossRef] [Scilit]
- Fayyaz, S.; Masjedi, S.K.; Kazemi, A.; Khaki, E.; Moeinaddini, M.; Olsen, S.I. Life Cycle Assessment of Reverse Osmosis for High-Salinity Seawater Desalination Process: Potable and Industrial Water Production. J. Clean. Prod. 2022, 382, 135299. [Google Scholar] [CrossRef] [Scilit]
- Du, F.; Warsinger, D.M.; Urmi, T.; Thiel, G.P.; Kumar, A.; Lienhard, J.H. Sodium Hydroxide Production from Seawater Desalination Brine: Process Design and Energy Efficiency. Environ. Sci. Technol. 2018, 52, 5949–5958. [Google Scholar] [CrossRef] [Scilit]
- Khajouei, G.; Park, H.I.; Finklea, H.O.; Ziemkiewicz, P.; Peltier, E.; Lin, L.-S. Produced Water Softening Using High-PH Catholyte from Brine Electrolysis: Reducing Chemical Transportation and Environmental Footprints. J. Water Process Eng. 2021, 40, 101911. [Google Scholar] [CrossRef] [Scilit]
- Ojo, O.E.; Olanrewaju, O.A. Innovative Recovery Methods for Metals and Salts from Rejected Brine and Advanced Extraction Processes—A Pathway to Commercial Viability and Sustainability in Seawater Reverse Osmosis Desalination. Water 2025, 17, 3141. [Google Scholar] [CrossRef] [Scilit]
- Panagopoulos, A. Beneficiation of Saline Effluents from Seawater Desalination Plants: Fostering the Zero Liquid Discharge (ZLD) Approach—A Techno-Economic Evaluation. J. Environ. Chem. Eng. 2021, 9, 105338. [Google Scholar] [CrossRef] [Scilit]
- Bernard, E.; Nguyen, H.; Kawashima, S.; Lothenbach, B.; Manzano, H.; Provis, J.L.; Scott, A.; Unluer, C.; Winnefeld, F.; Kinnunen, P. MgO-Based Cements—Current Status and Opportunities. RILEM Tech. Lett. 2023, 8, 65–78. [Google Scholar] [CrossRef] [Scilit]
- Ansorge, L.; Stejskalová, L.; Vološinová, D.; Dlabal, J. Limitation of Water Footprint Sustainability Assessment: A Review. Eur. J. Sustain. Dev. 2022, 11, 1. [Google Scholar] [CrossRef] [Scilit]
- Luo, Y.-L.; Pan, Y.-R.; Wang, X.; Wang, Z.; Daigger, G.T.; Ma, J.; Tang, L.; Liu, J.; Ren, N.-Q.; Butler, D. Leveraging the Water-Environment-Health Nexus to Characterize Sustainable Water Purification Solutions. Nat. Commun. 2025, 16, 1269. [Google Scholar] [CrossRef] [Scilit] [PubMed]
- Pan, Y.-R.; Wang, X.; Ren, Z.J.; Hu, C.; Liu, J.; Butler, D. Characterization of Implementation Limits and Identification of Optimization Strategies for Sustainable Water Resource Recovery through Life Cycle Impact Analysis. Environ. Int. 2019, 133, 105266. [Google Scholar] [CrossRef] [Scilit]
- Pandey, A.K. Sustainable Water Management through Integrated Technologies and Circular Resource Recovery. Environ. Sci. Water Res. Technol. 2025, 11, 1822–1846. [Google Scholar] [CrossRef] [Scilit]
- Pausta, C.M.; Kalbar, P.P.; Saroj, D. Life Cycle Assessment of Nutrient Recovery Strategies from Domestic Wastewaters to Quantify Environmental Performance and Identification of Trade-Offs. Sci. Rep. 2024, 14, 3678. [Google Scholar] [CrossRef] [Scilit]
- De Girolamo, A.M.; Miscioscia, P.; Politi, T.; Barca, E. Improving Grey Water Footprint Assessment: Accounting for Uncertainty. Ecol. Indic. 2019, 102, 822–833. [Google Scholar] [CrossRef] [Scilit]
- Garcia, J.; Gacu, J.; Lawrence, M. Suitability Analysis for Solar PV Farm Installation Using GIS and Analytical Hierarchy Process (AHP) in Simara Island, Province of Romblon, Philippines. E3S Web Conf. 2024, 473, 01013. [Google Scholar] [CrossRef] [Scilit]
- Suman, A. Role of Renewable Energy Technologies in Climate Change Adaptation and Mitigation: A Brief Review from Nepal. Renew. Sustain. Energy Rev. 2021, 151, 111524. [Google Scholar] [CrossRef] [Scilit]
- Larsen, M.A.D.; Drews, M.; Gani, R. Water Consumption in the Energy Sector. In DTU International Energy Report 2016: The Energy-Water-Food Nexus—From Local to Global Aspects; Technical University of Denmark: Lundtofte, Denmark, 2016. [Google Scholar]
- Soliman, M.; Guen, F.Z.; Ahmed, S.A.; Saleem, H.; Khalil, M.J.; Zaidi, S.J. Energy Consumption and Environmental Impact Assessment of Desalination Plants and Brine Disposal Strategies. Process Saf. Environ. Prot. 2021, 147, 589–608. [Google Scholar] [CrossRef] [Scilit]
- Fisher, P.M.J.; Smith, D. The Water Industry and the Decarbonisation of Cities: A Comprehensive Review in the Context of Cop26. PLoS Water 2022, 1, e0000023. [Google Scholar] [CrossRef] [Scilit]
- Grubert, E.; Sanders, K.T. Water Use in the United States Energy System: A National Assessment and Unit Process Inventory of Water Consumption and Withdrawals. Environ. Sci. Technol. 2018, 52, 6695–6703. [Google Scholar] [CrossRef] [Scilit]
- Galychyn, O.; Fath, B.D. Integrated Hybrid Life Cycle Assessment of the Ukrainian Water Market. Res. Sq. 2024, preprint. [Google Scholar] [CrossRef] [Scilit]
- Jin, Y.; Behrens, P.; Tukker, A.; Scherer, L. Water Use of Electricity Technologies: A Global Meta-Analysis. Renew. Sustain. Energy Rev. 2019, 115, 109391. [Google Scholar] [CrossRef] [Scilit]
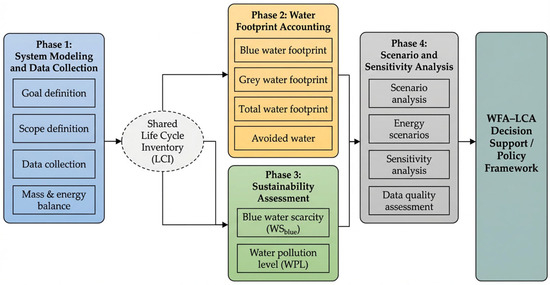
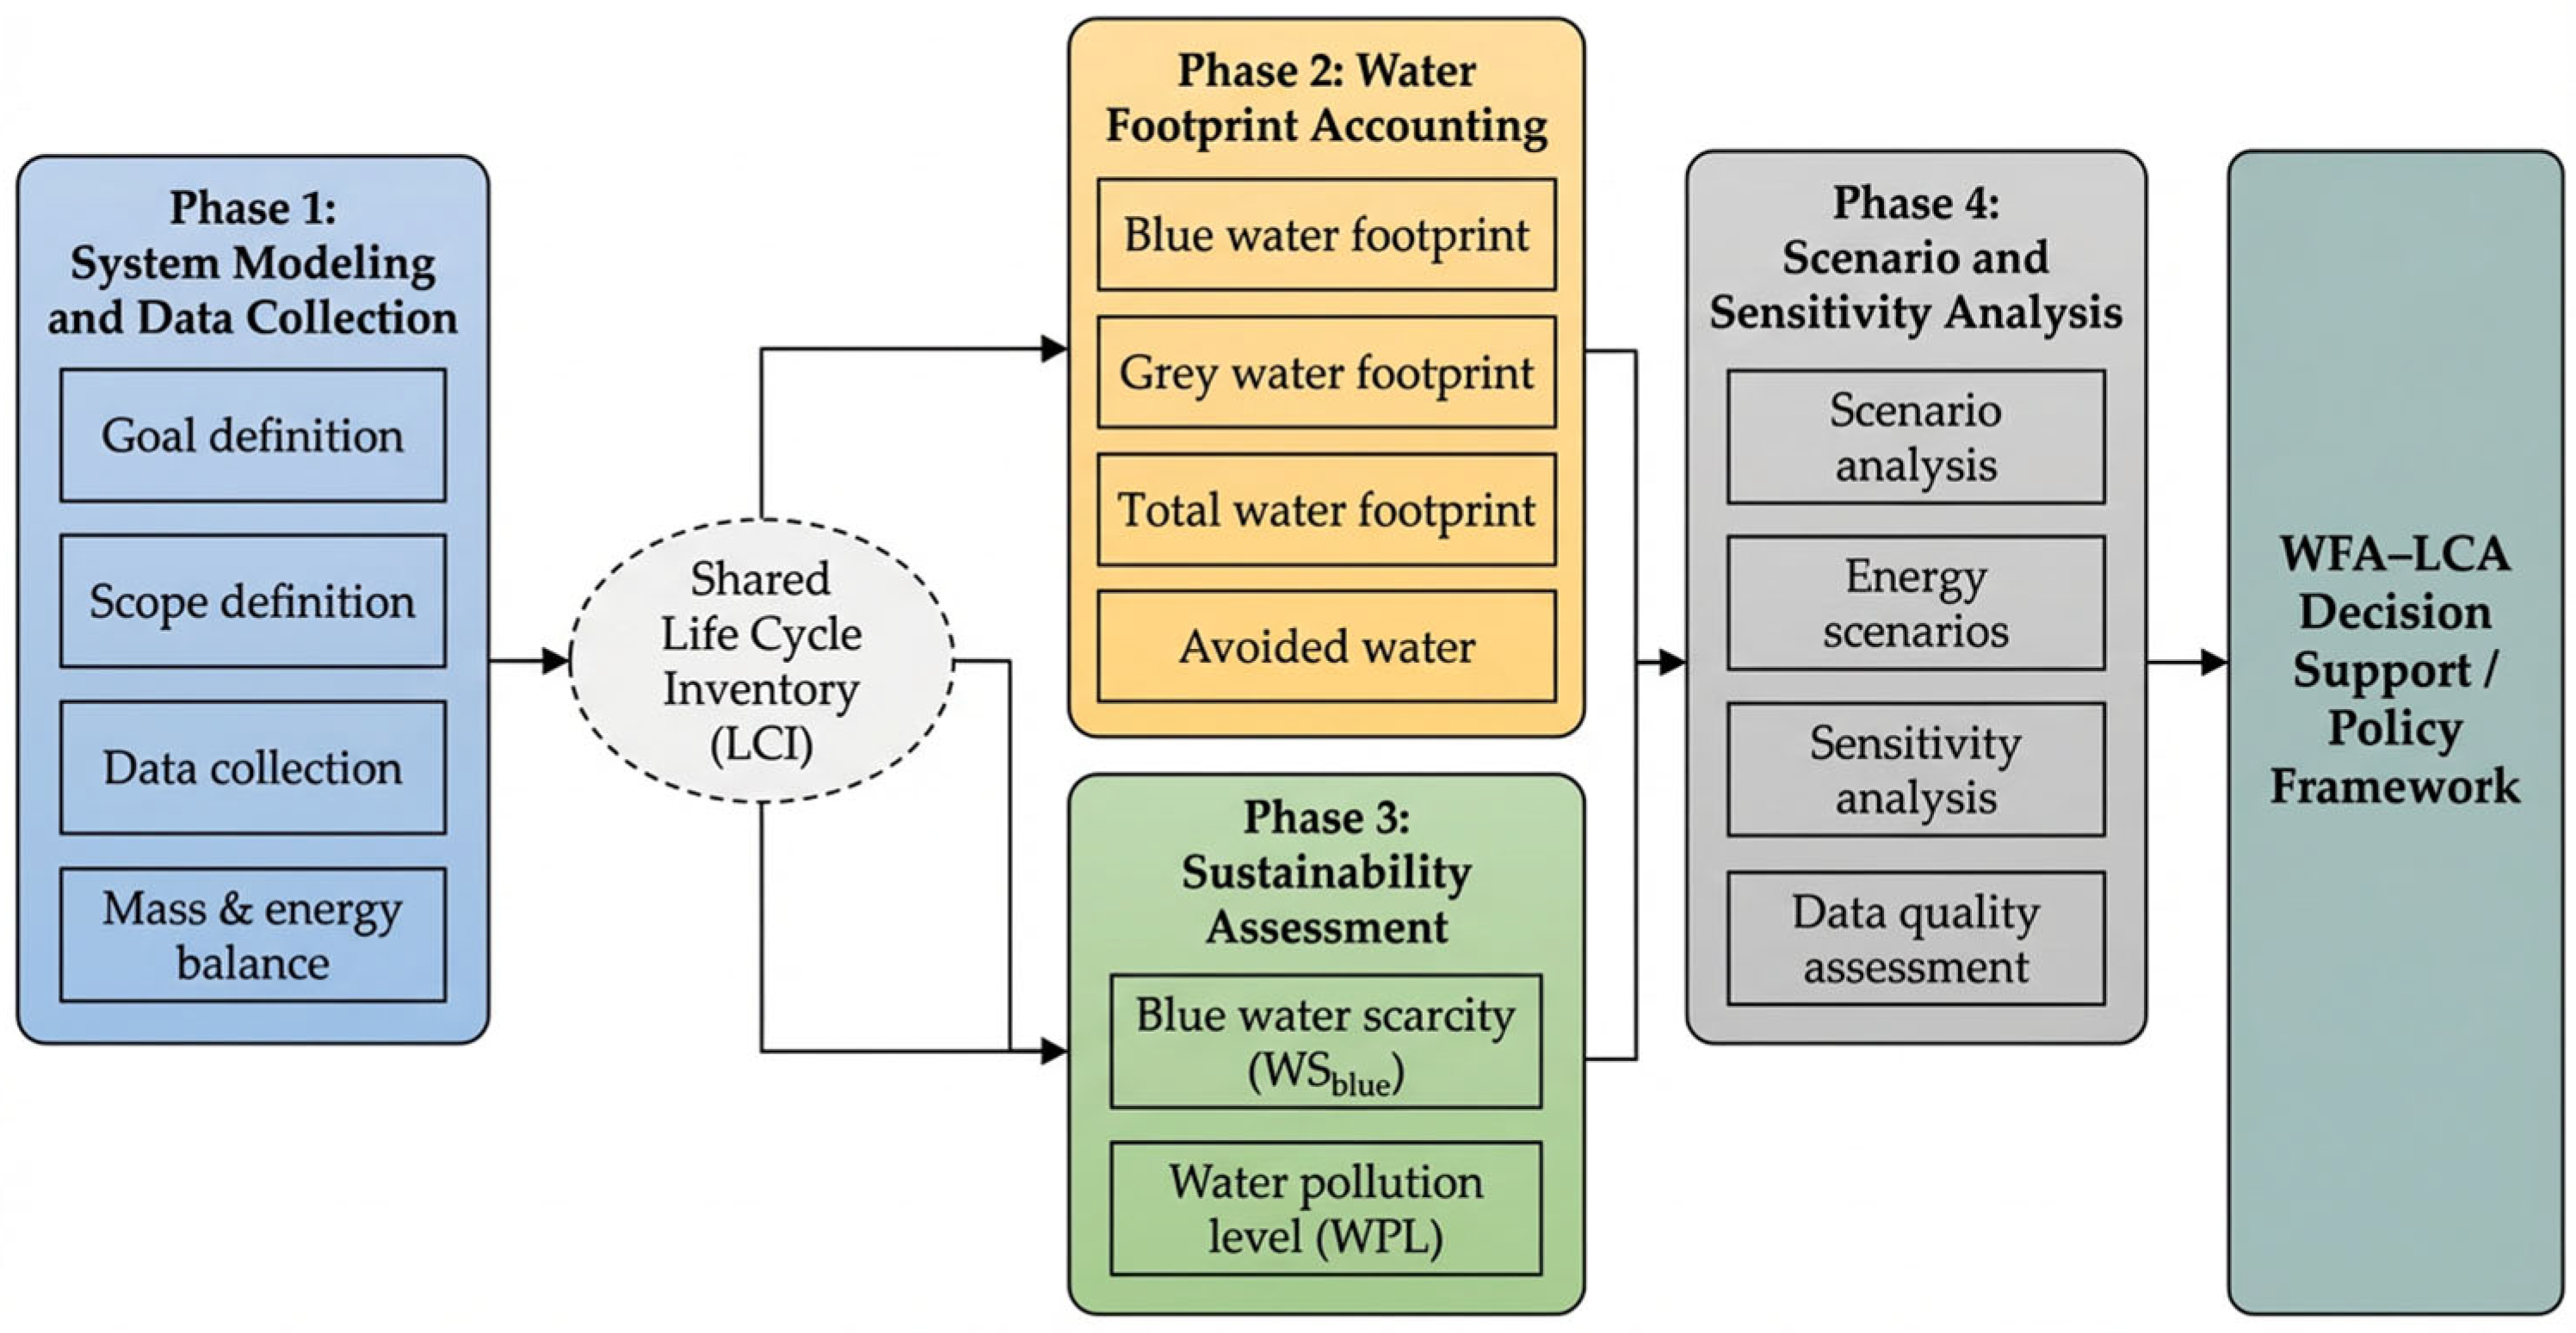
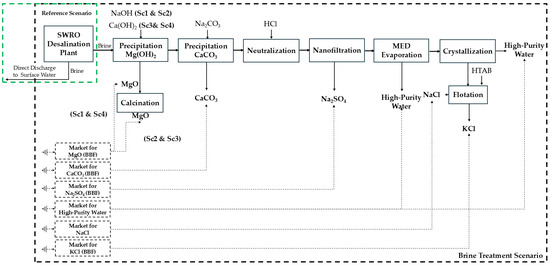
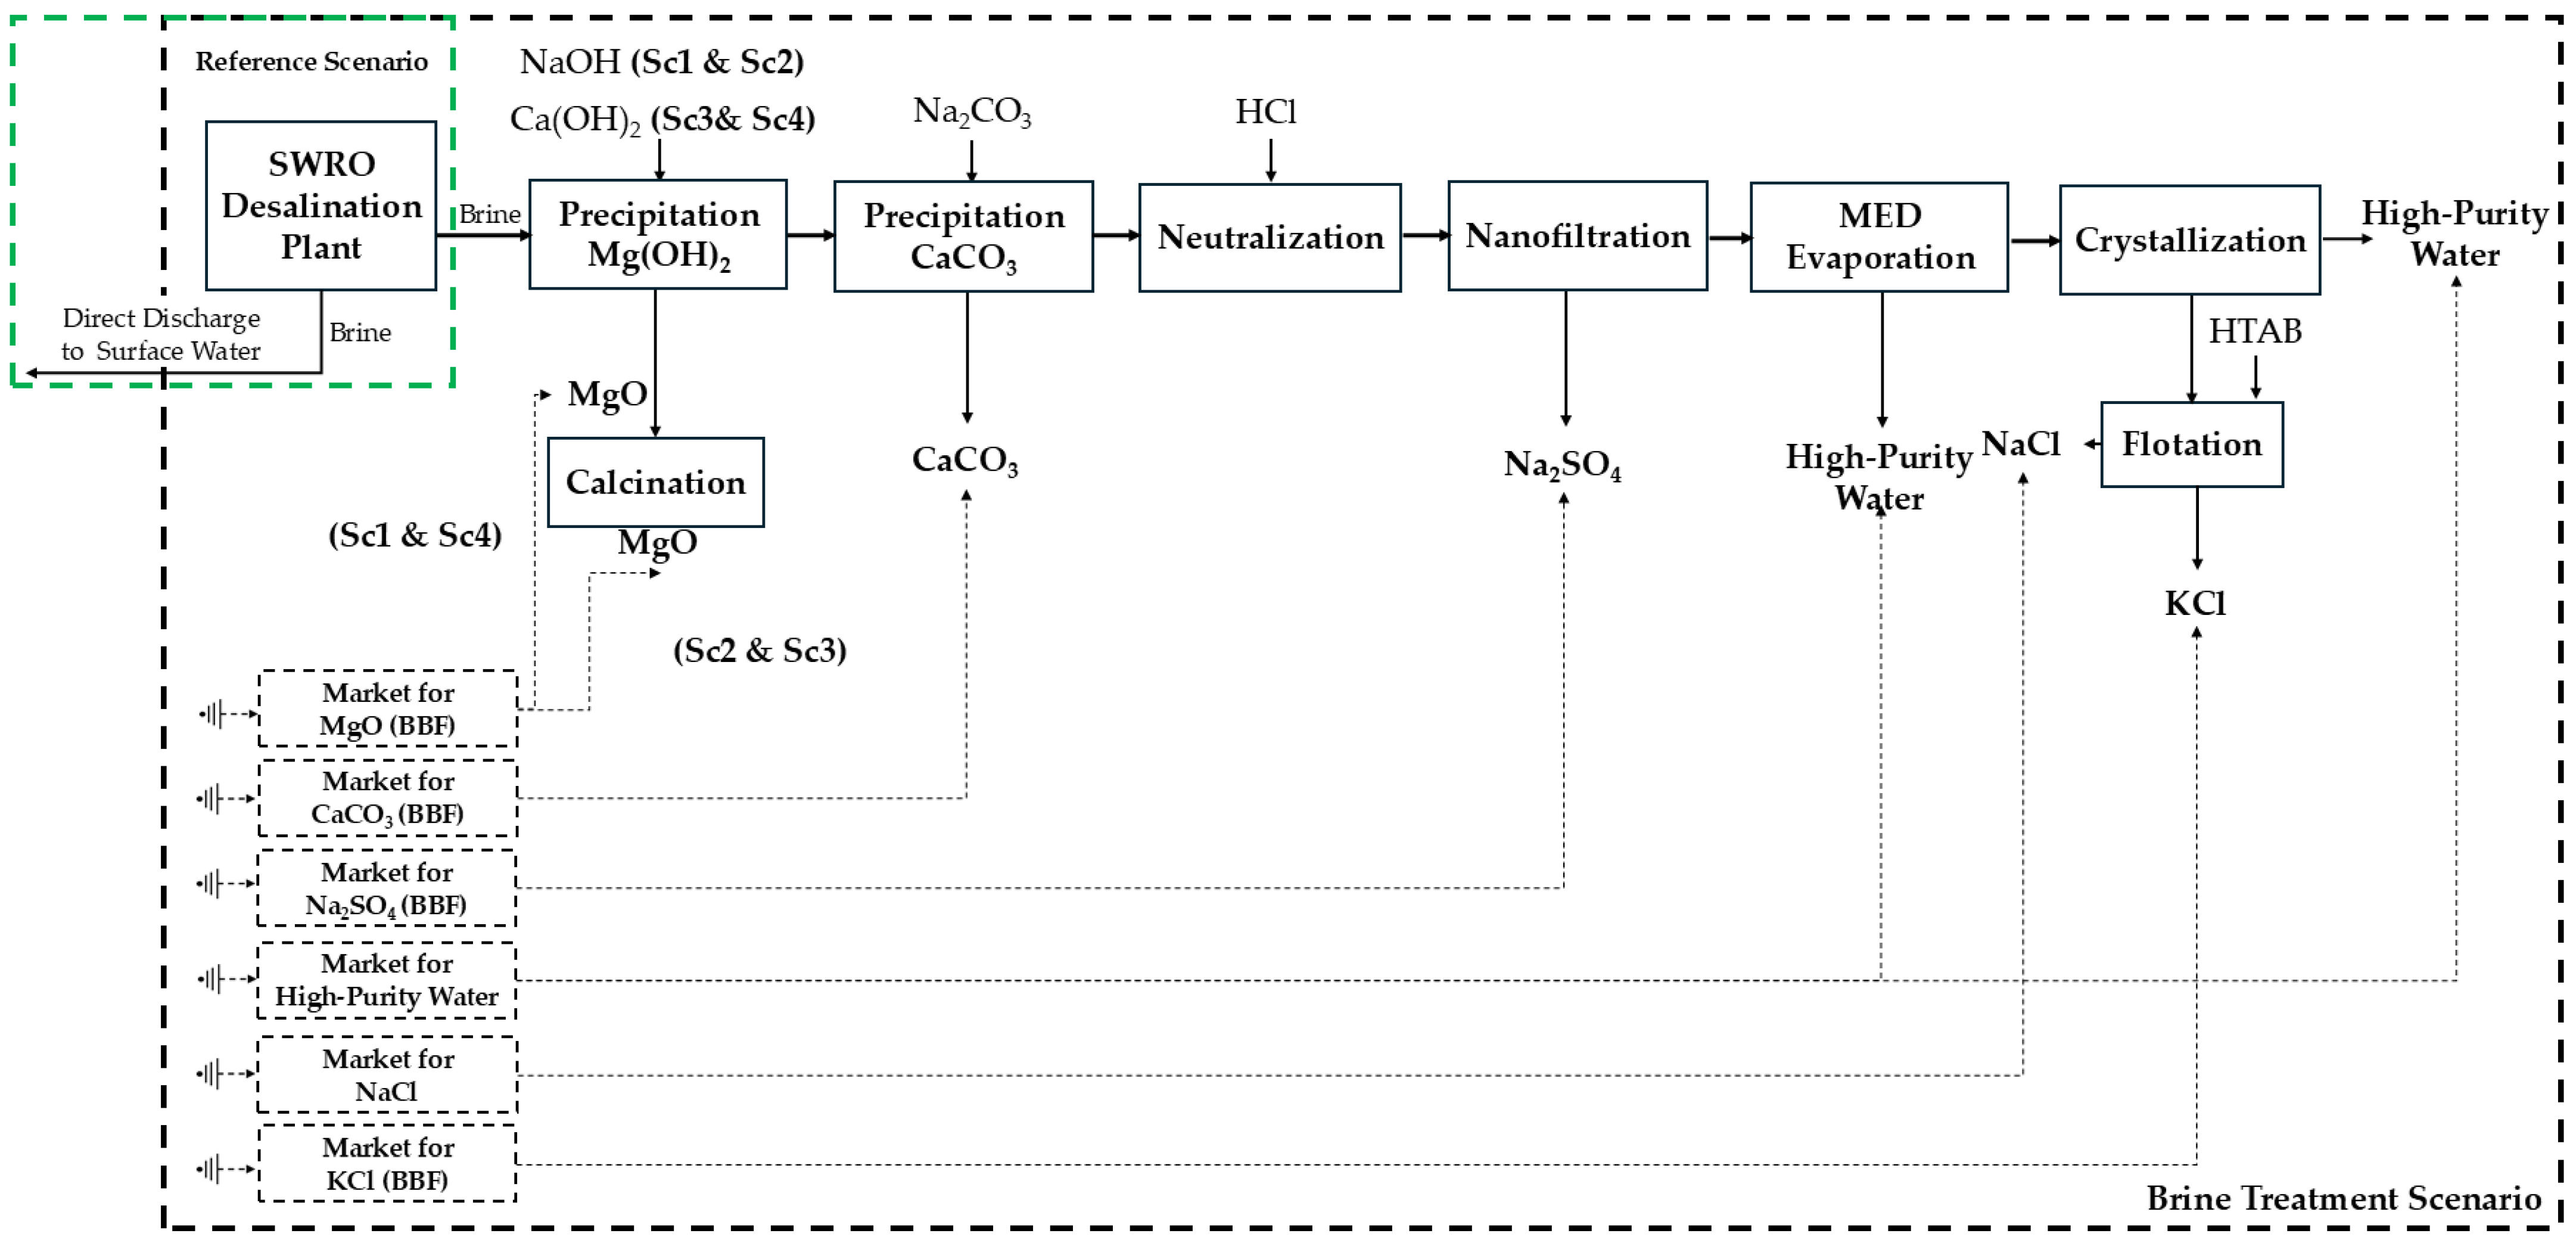
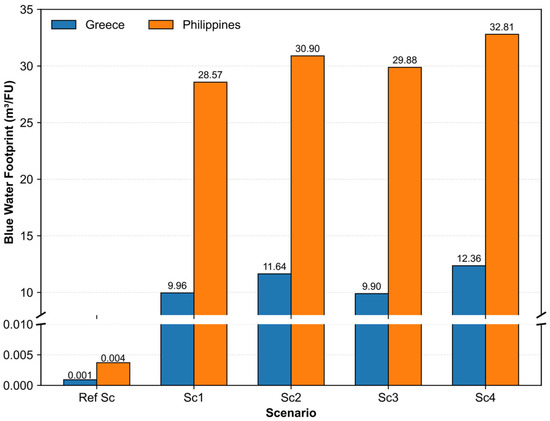
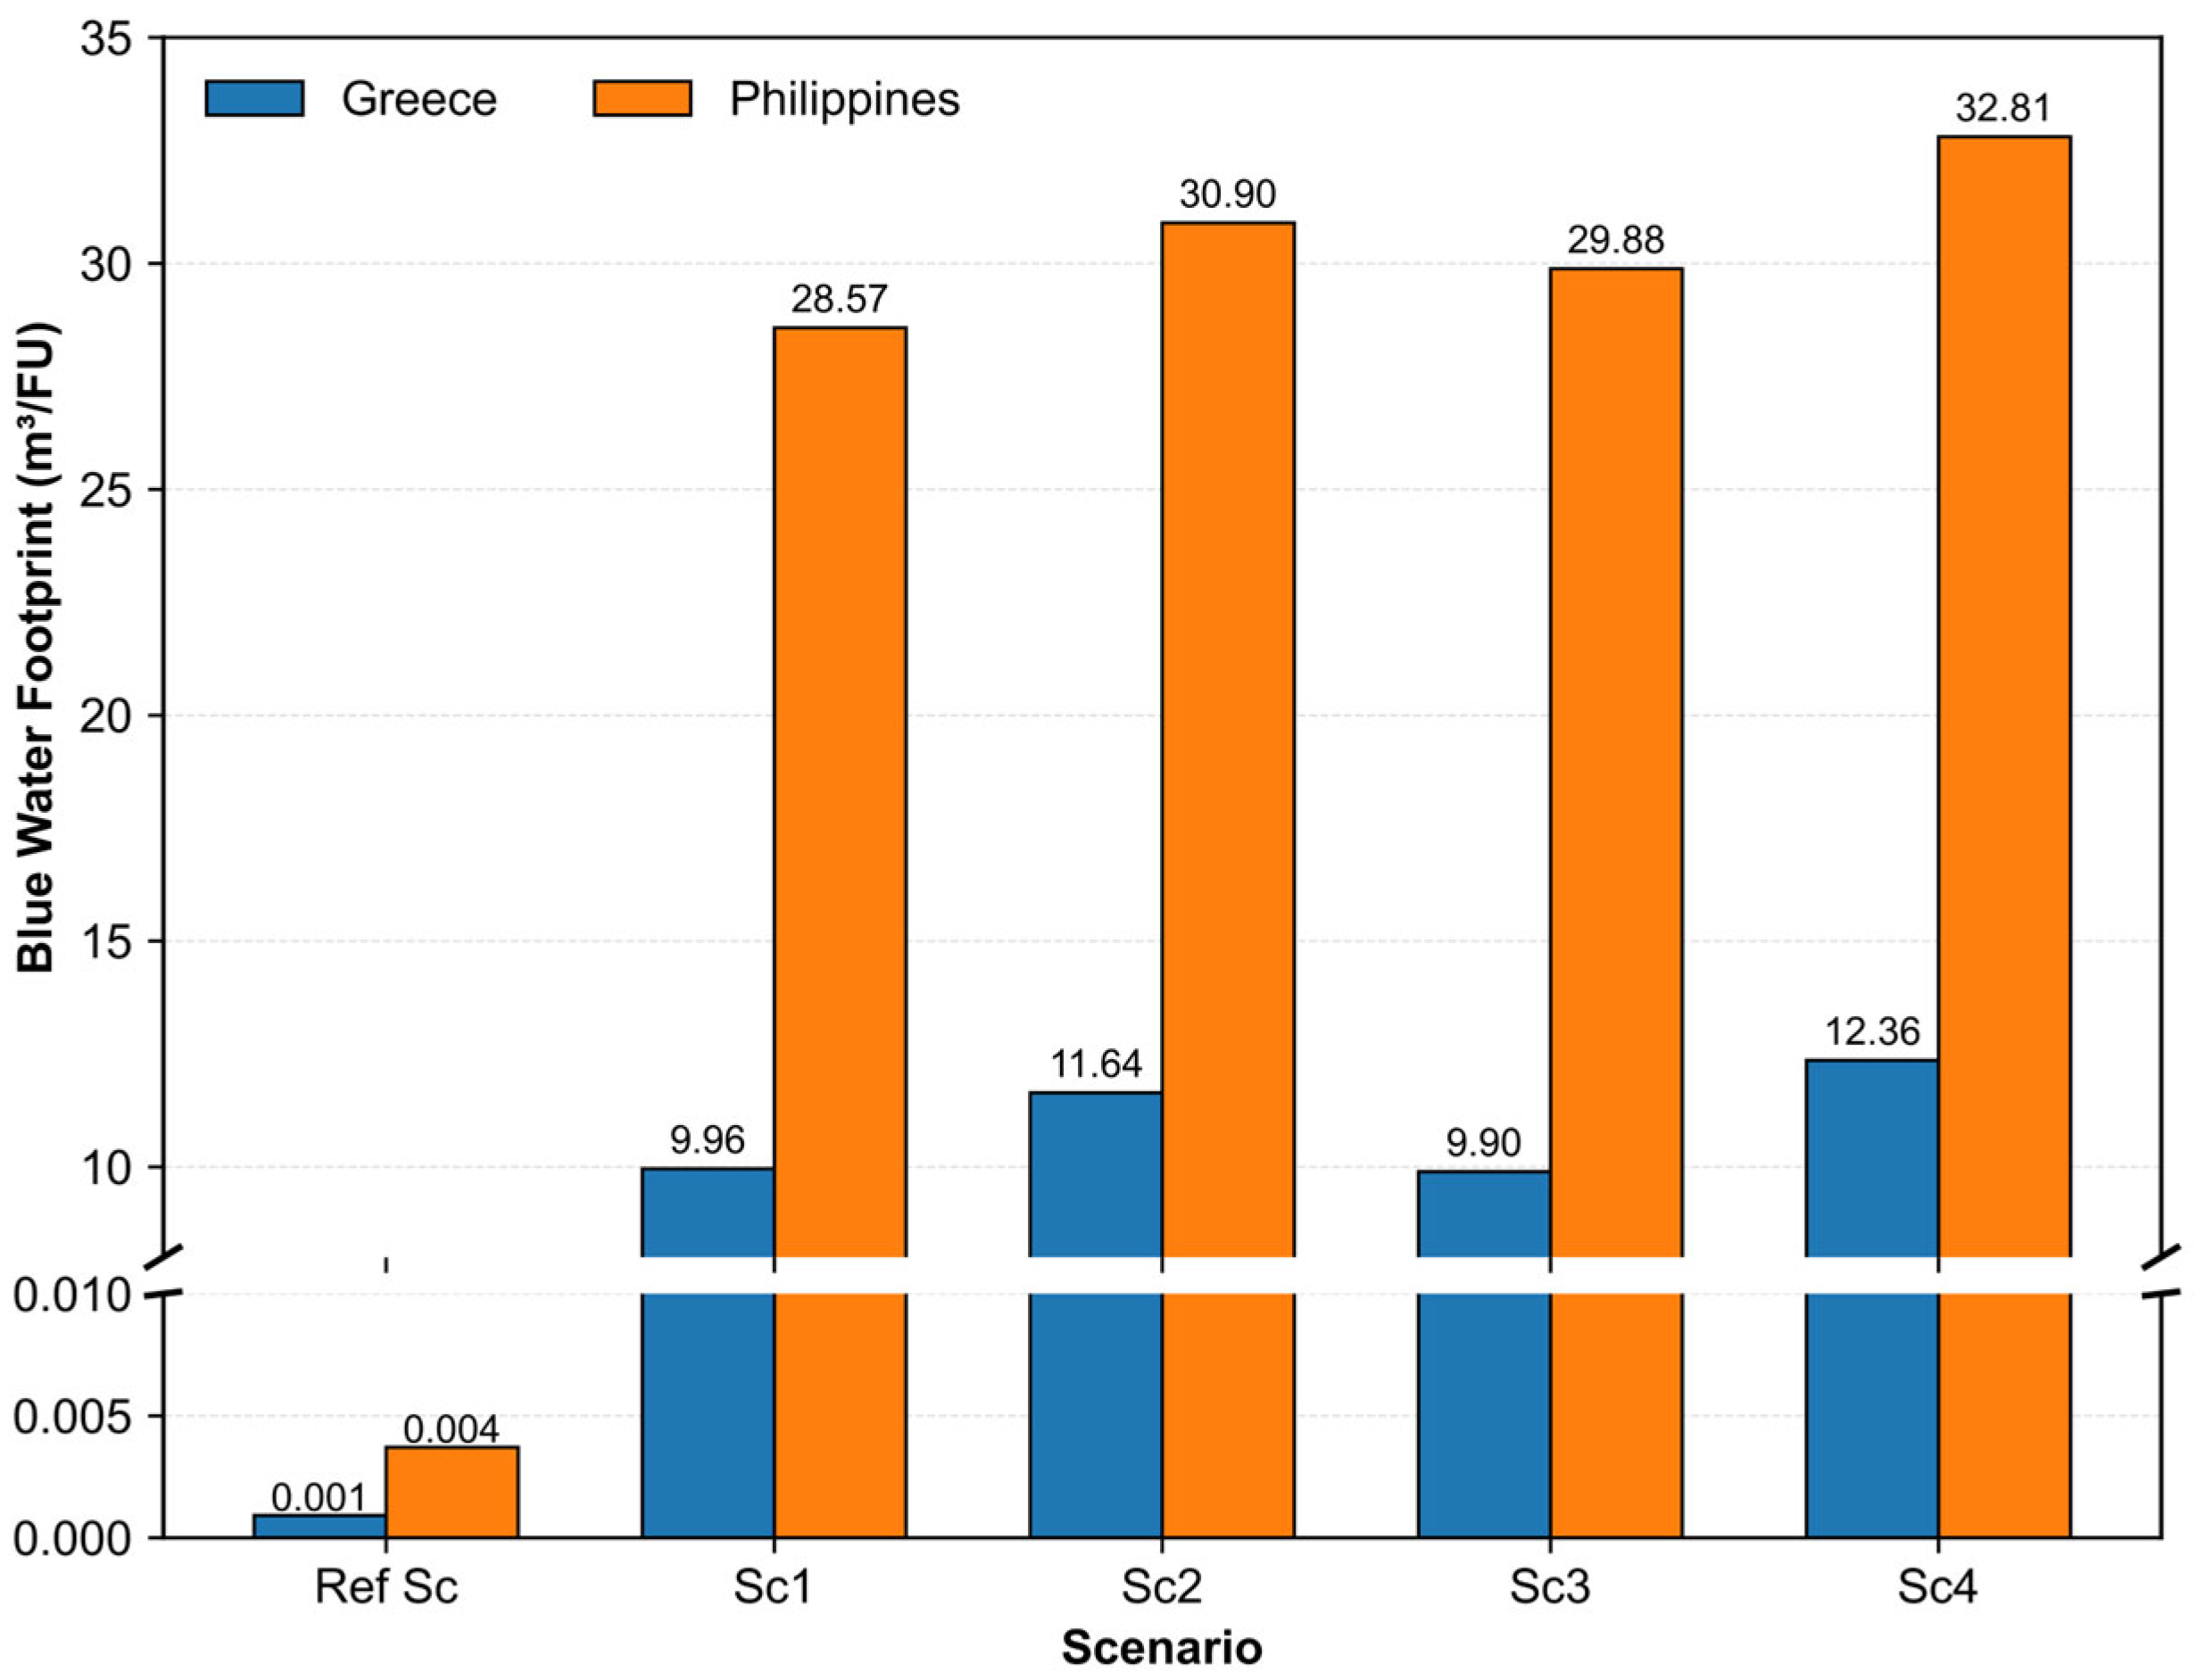
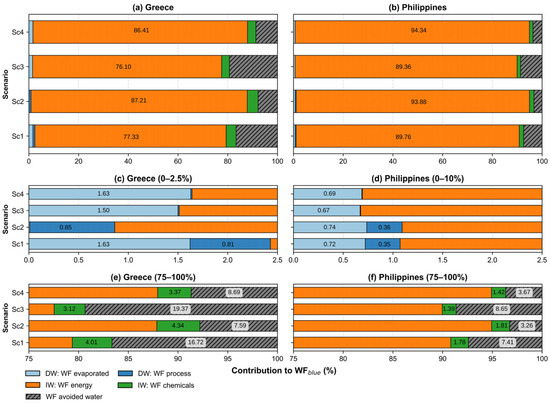
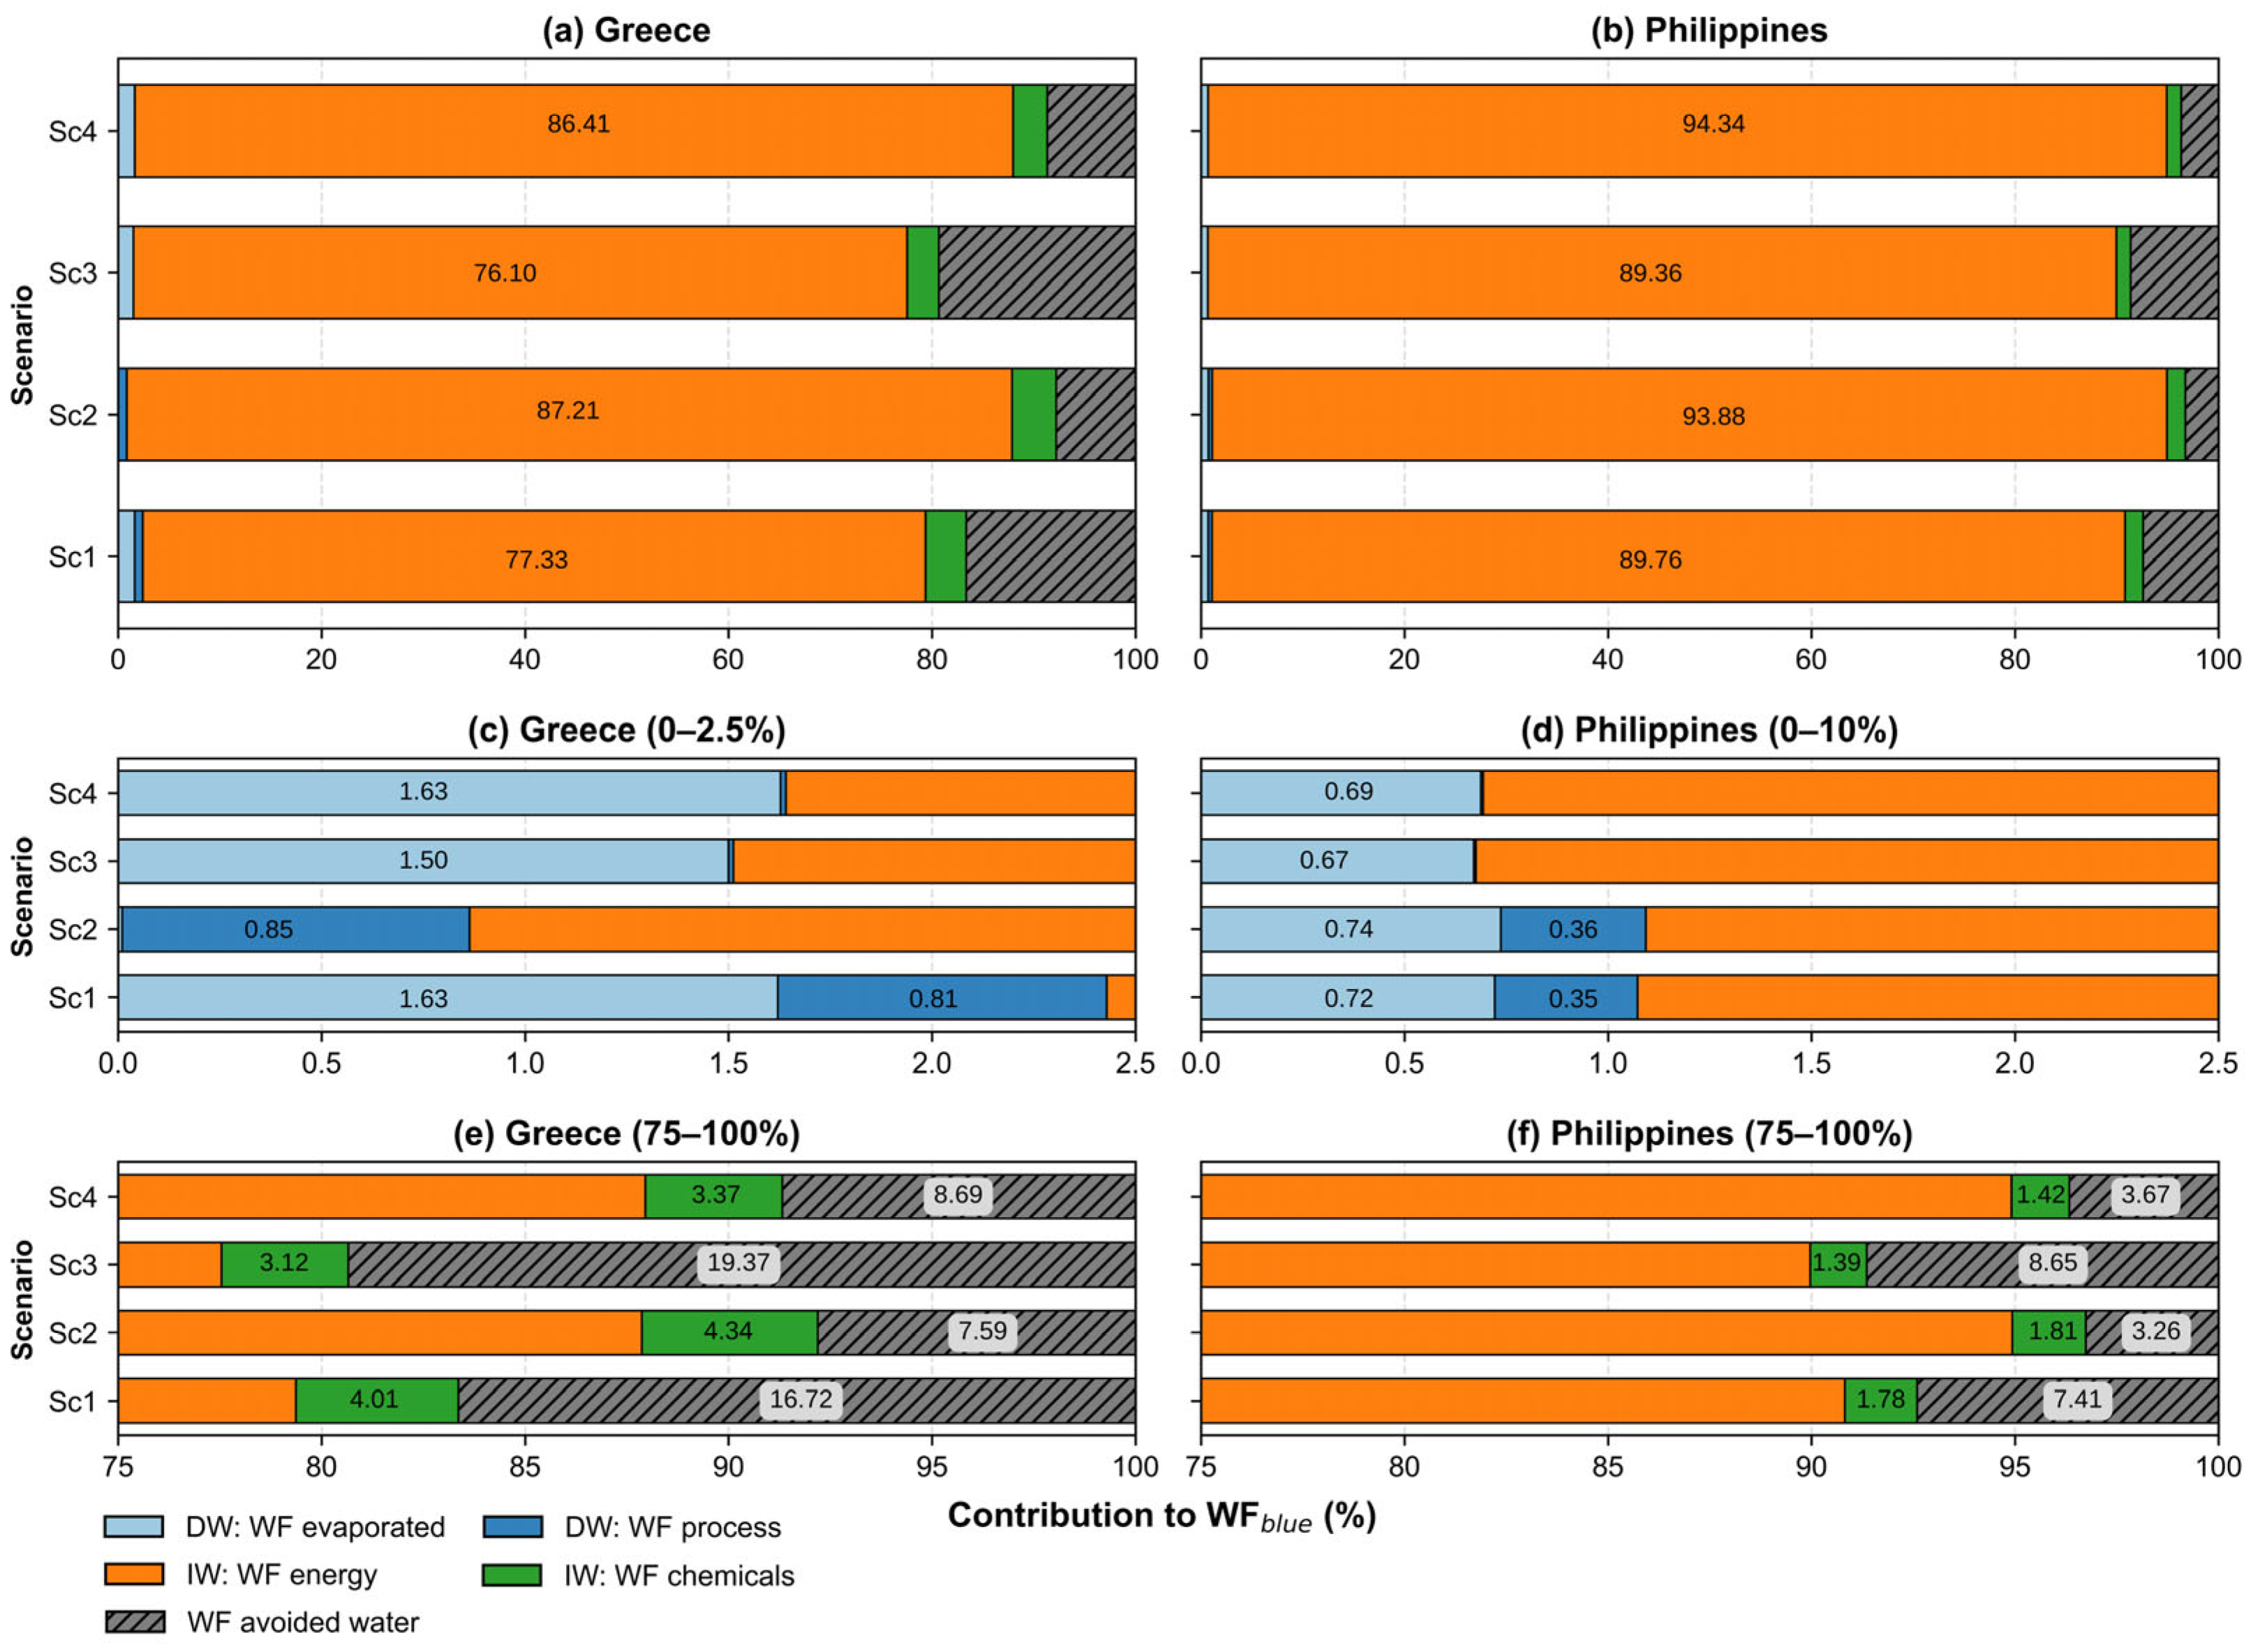
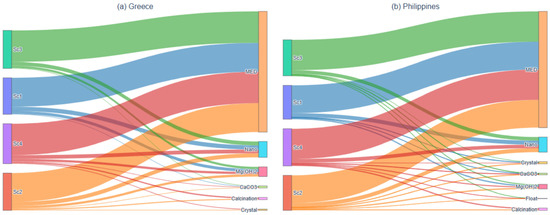
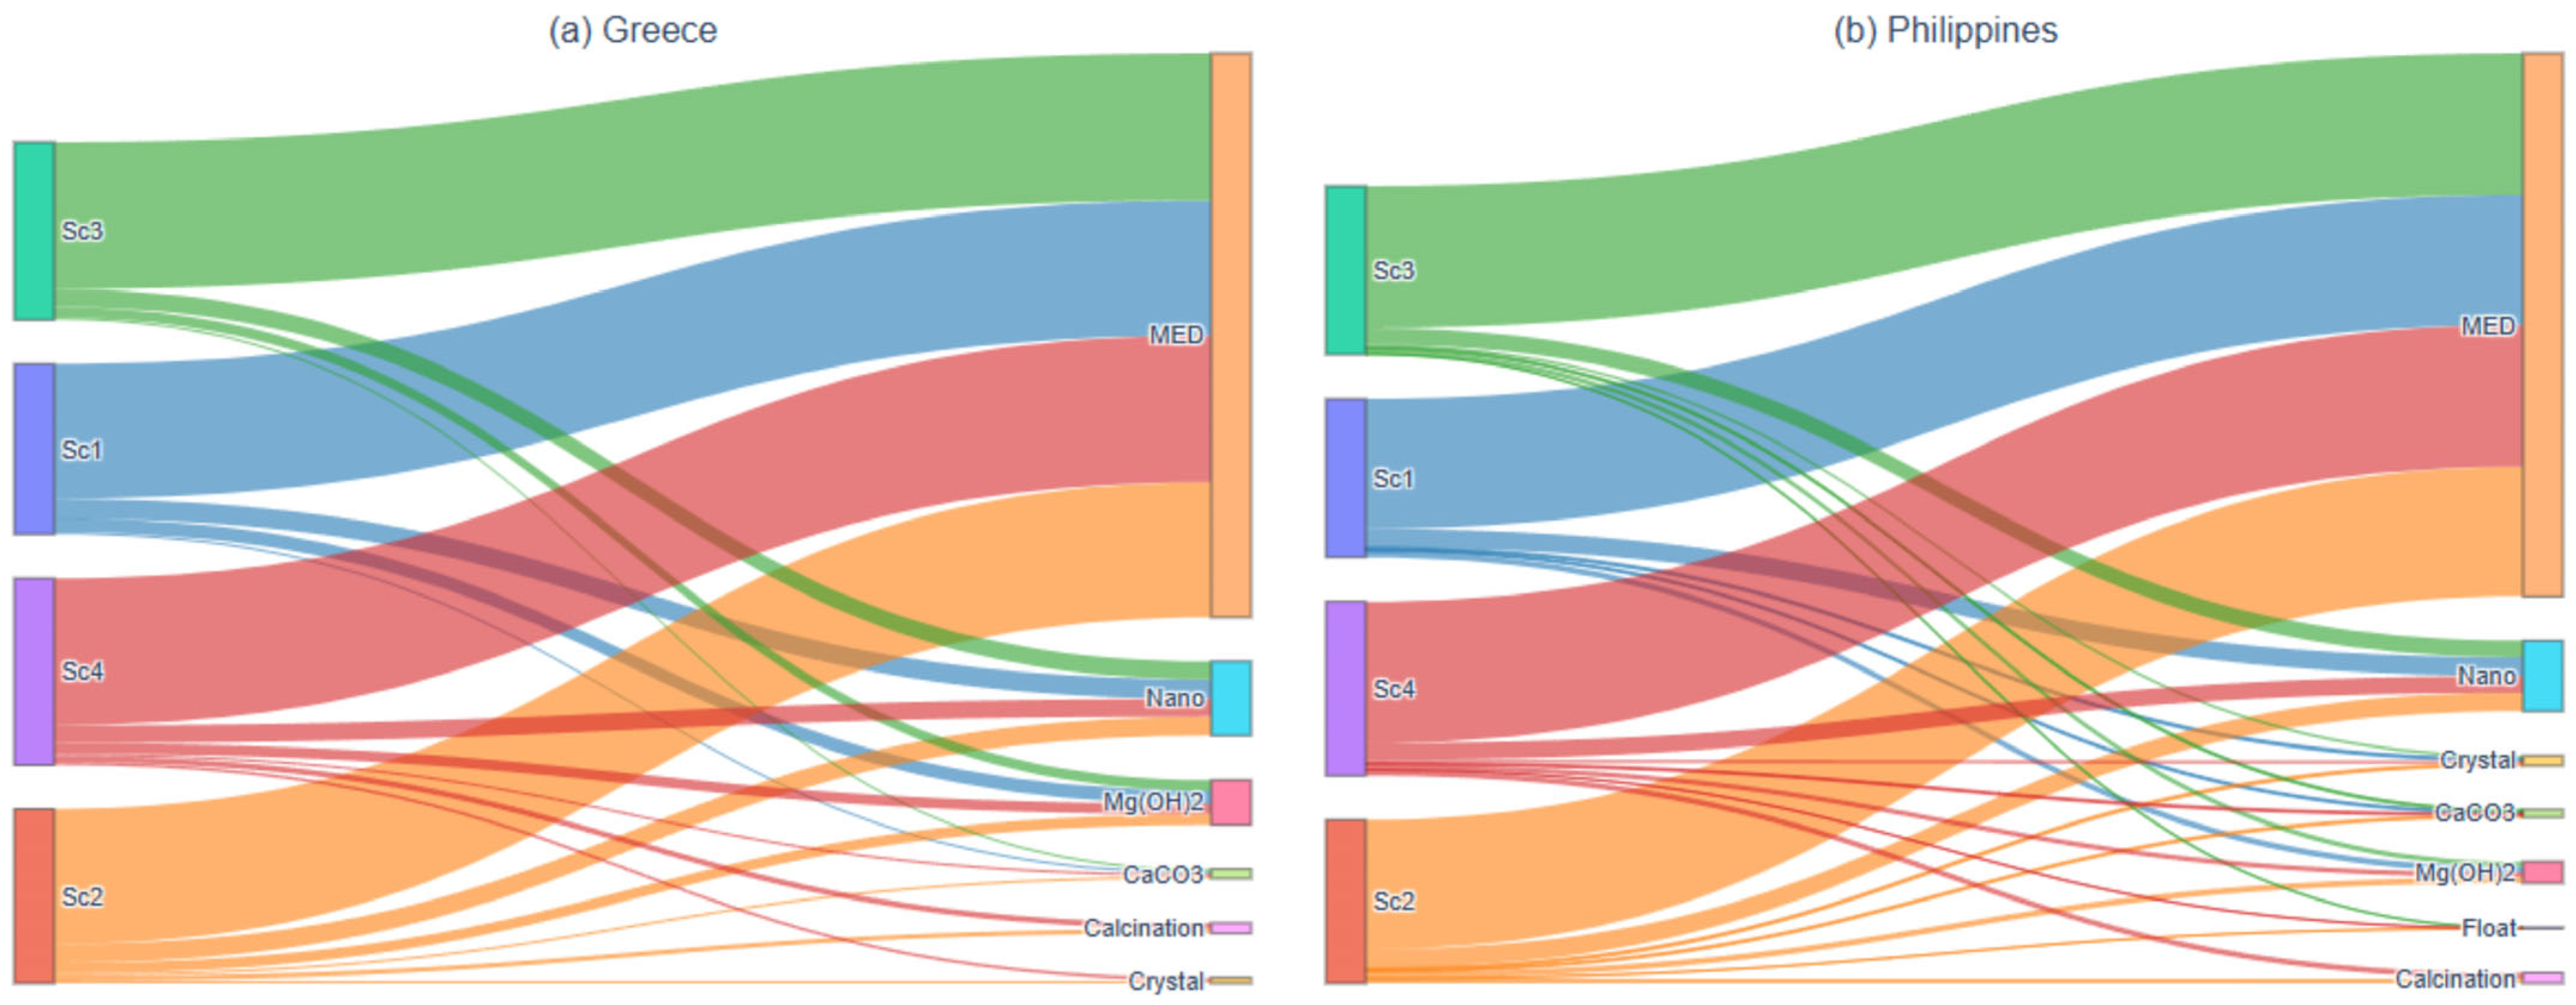
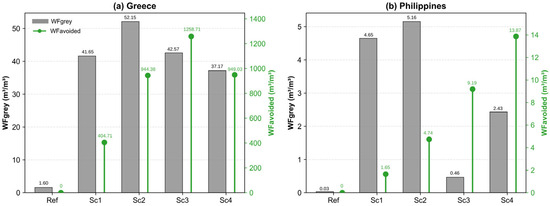
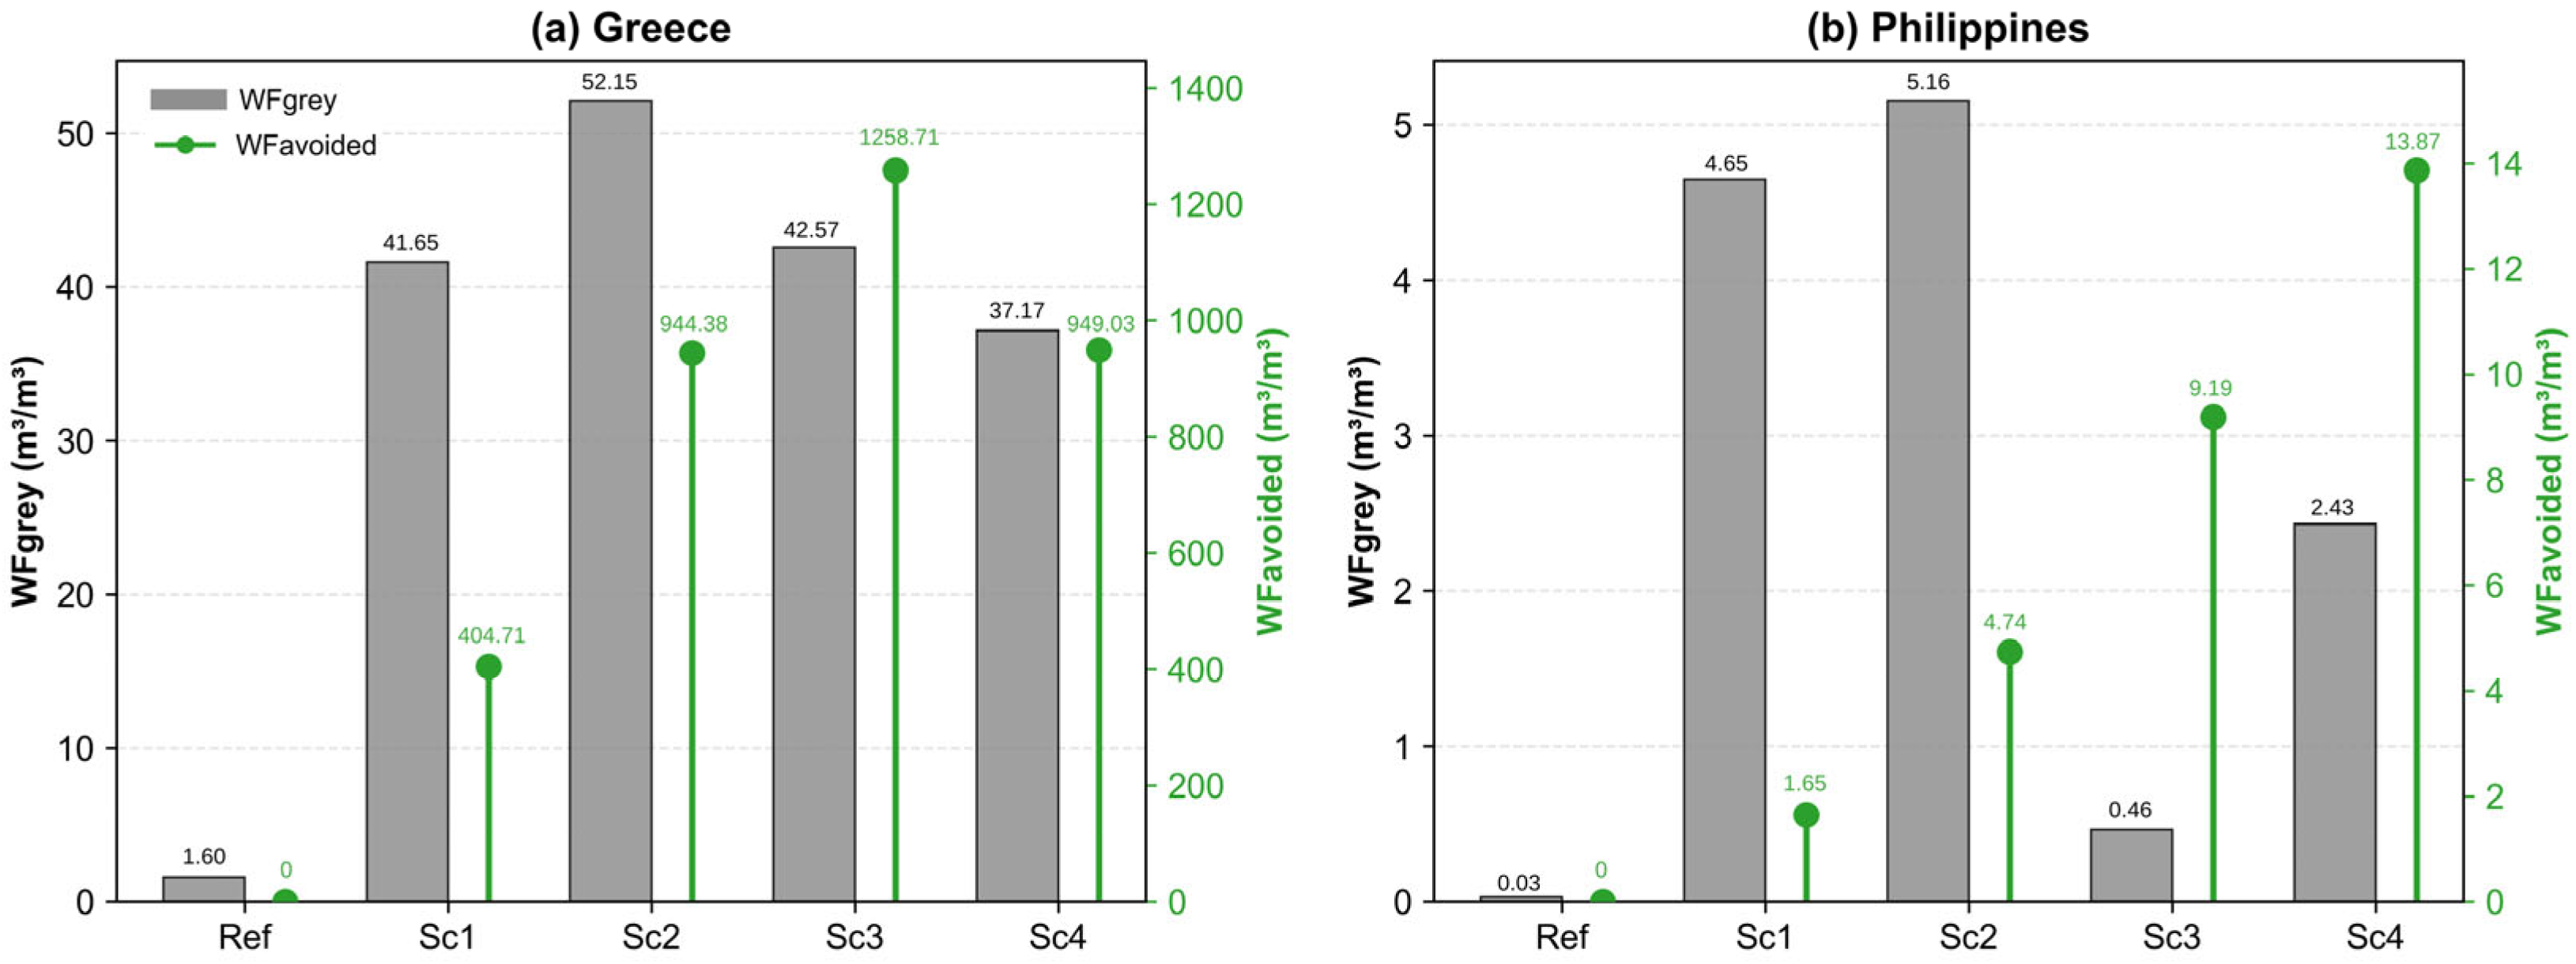
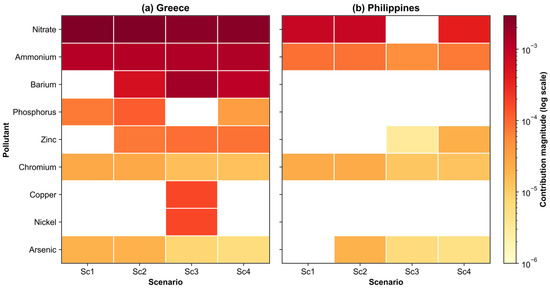
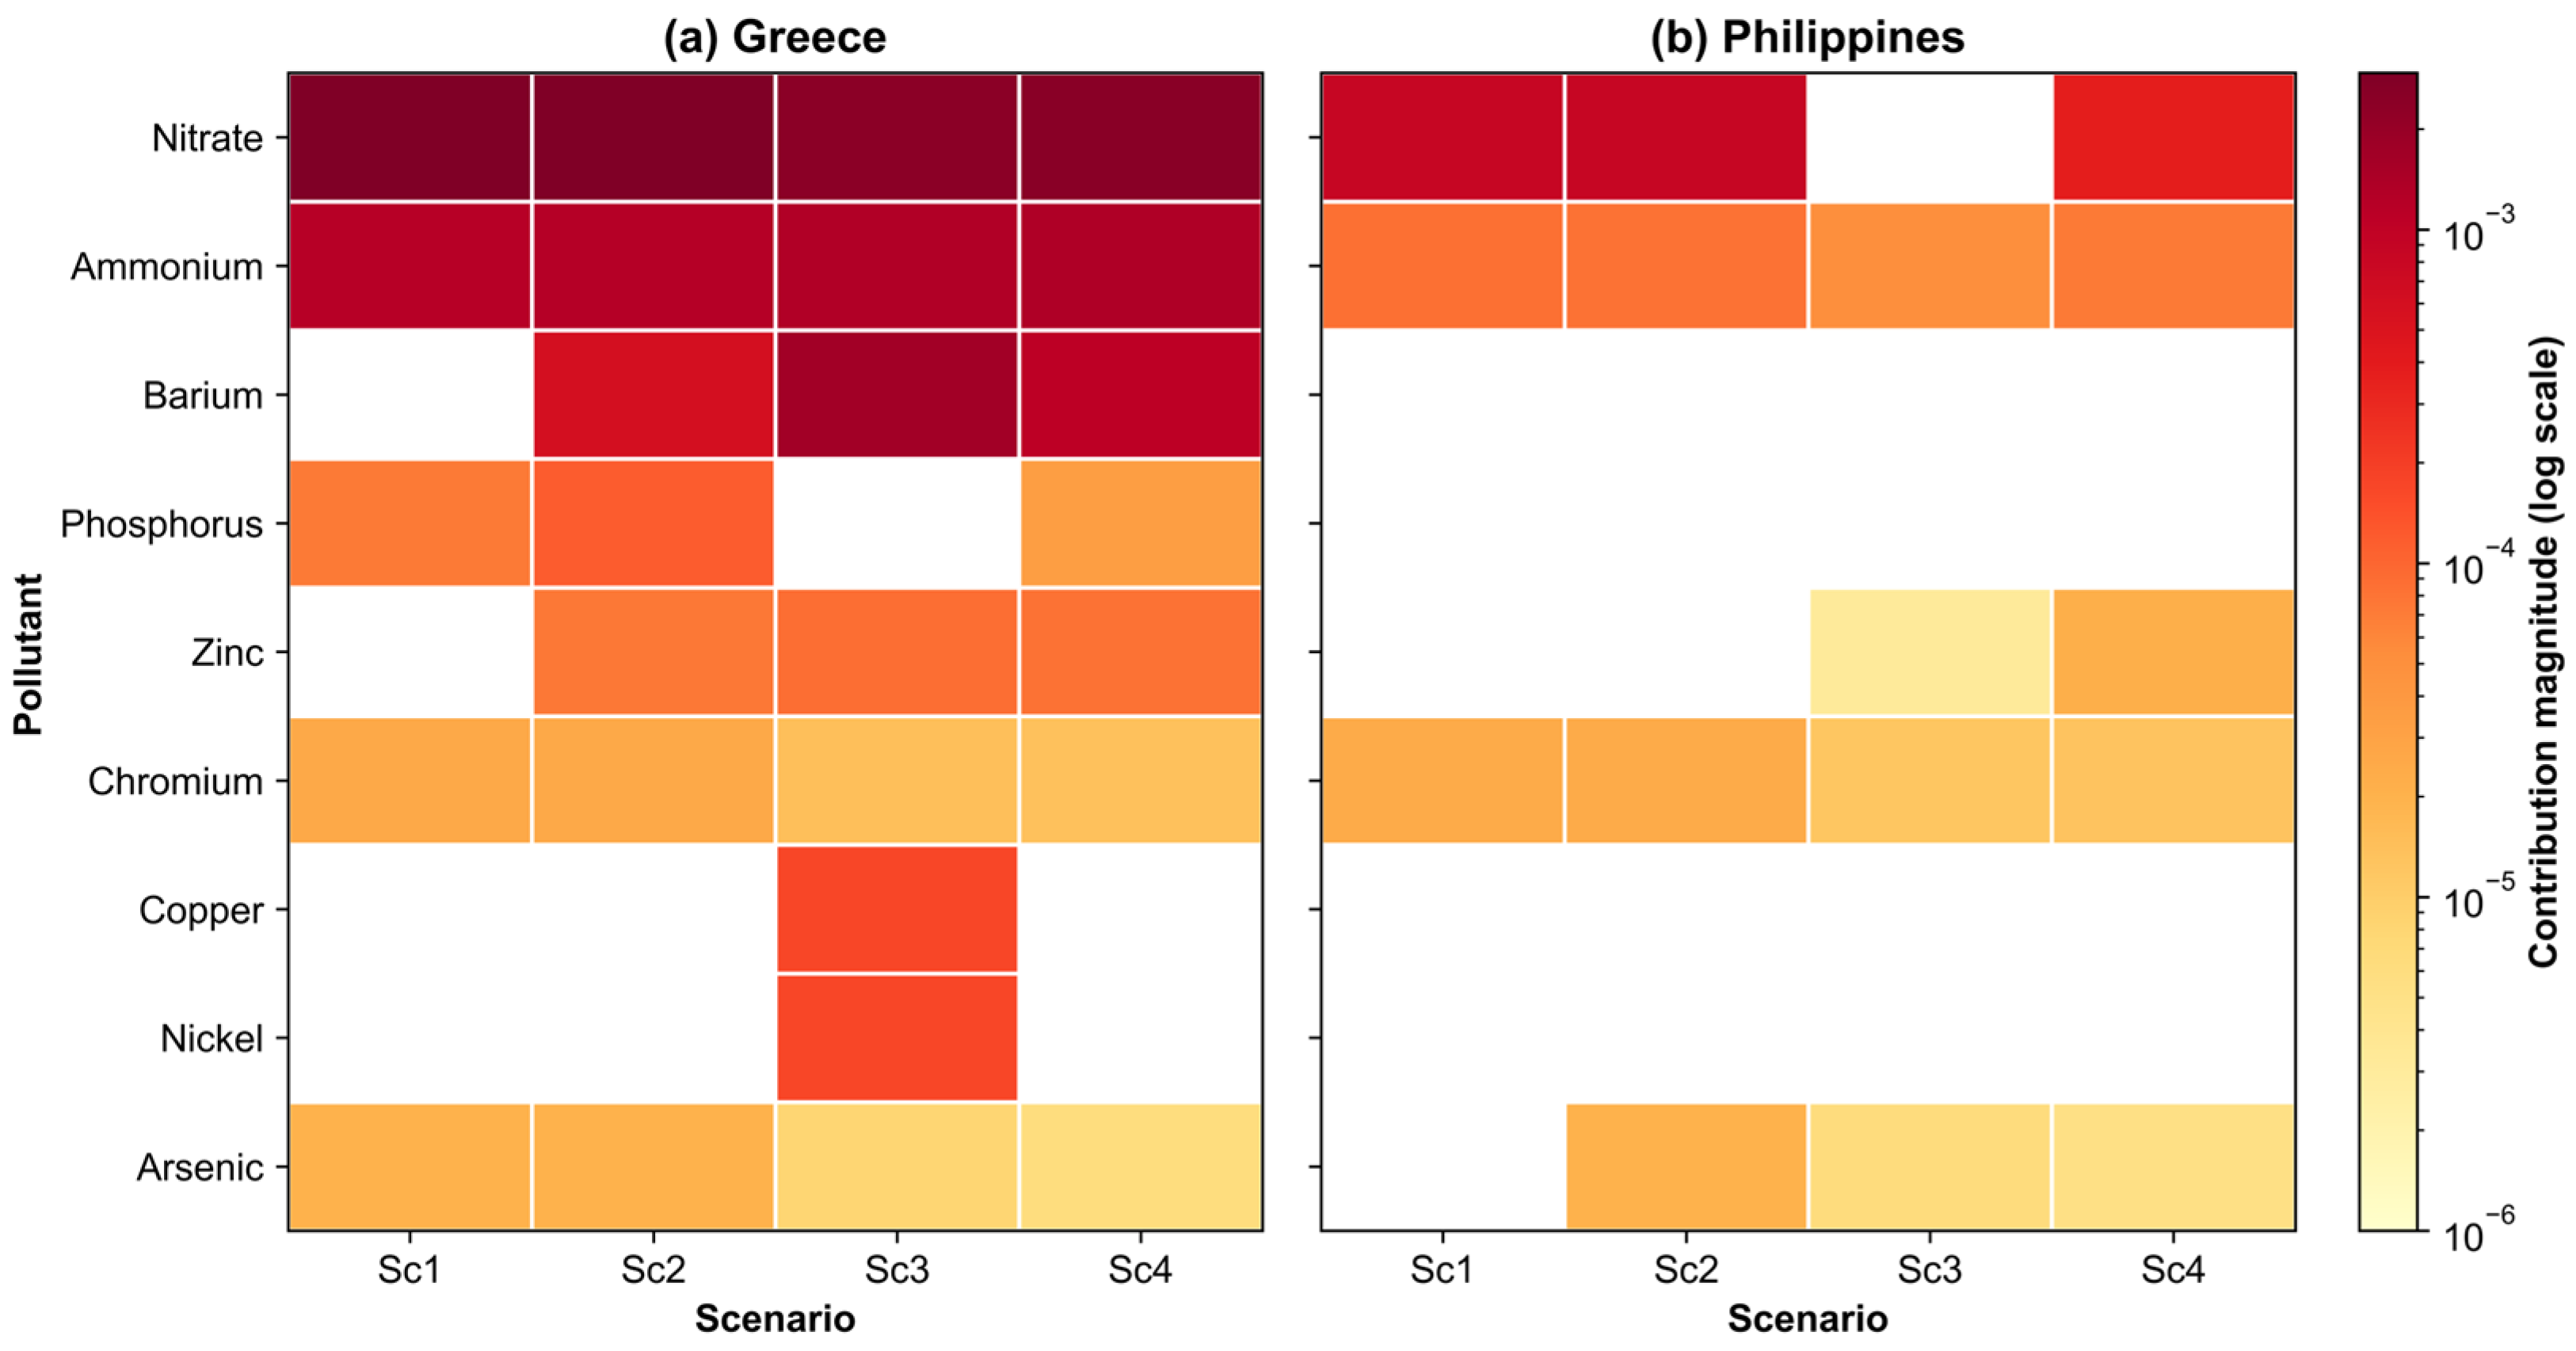
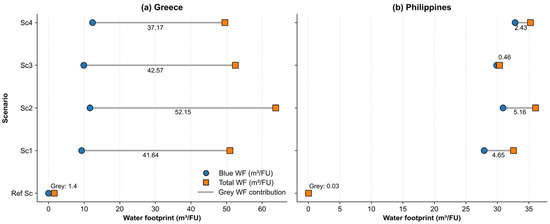
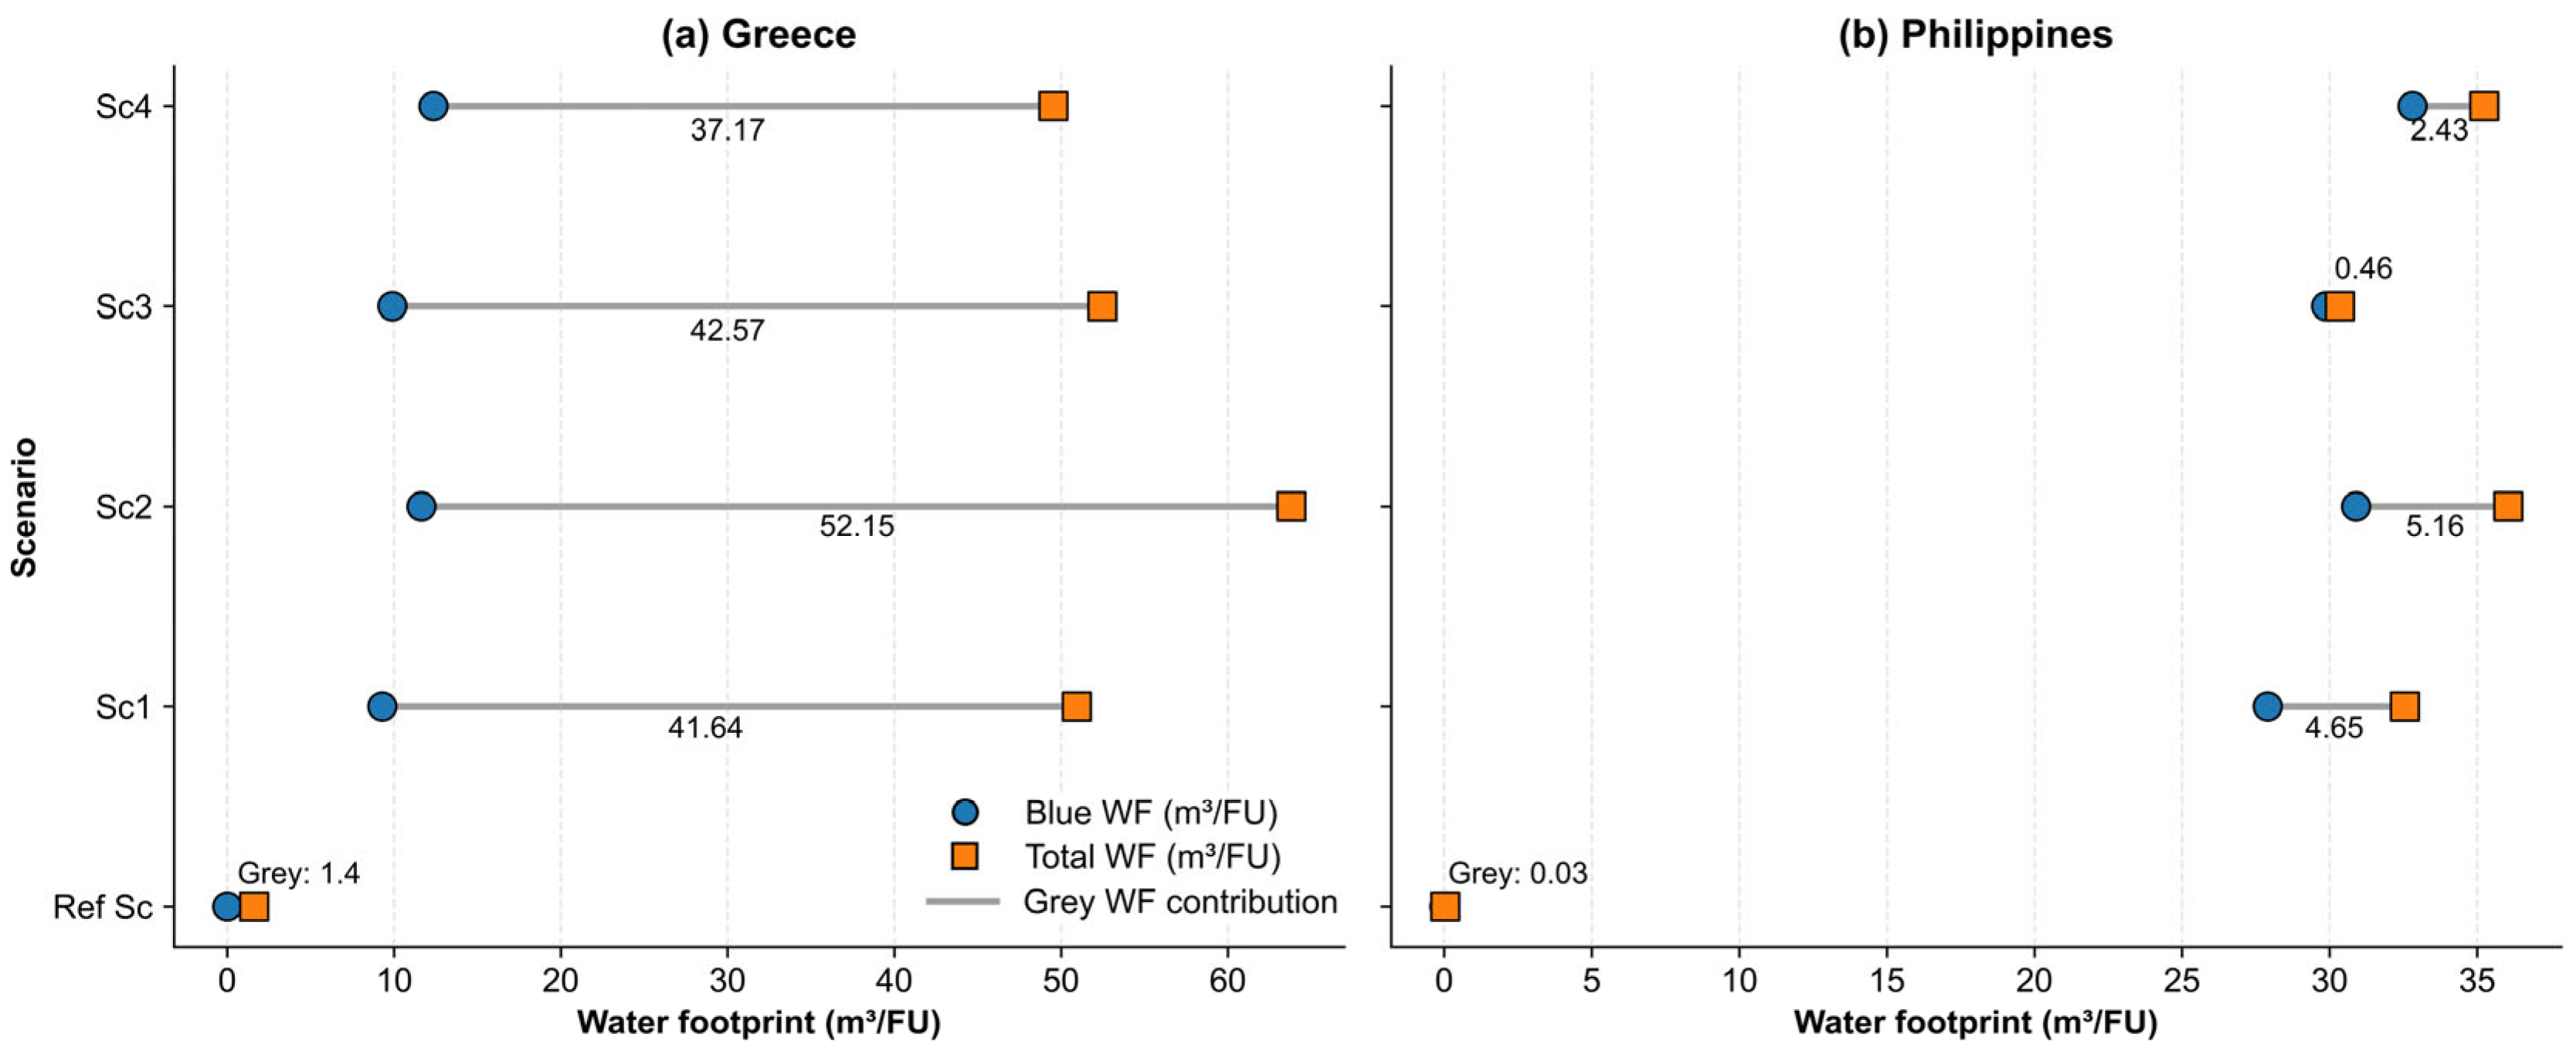
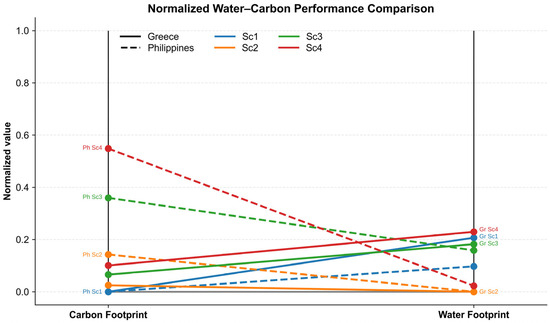
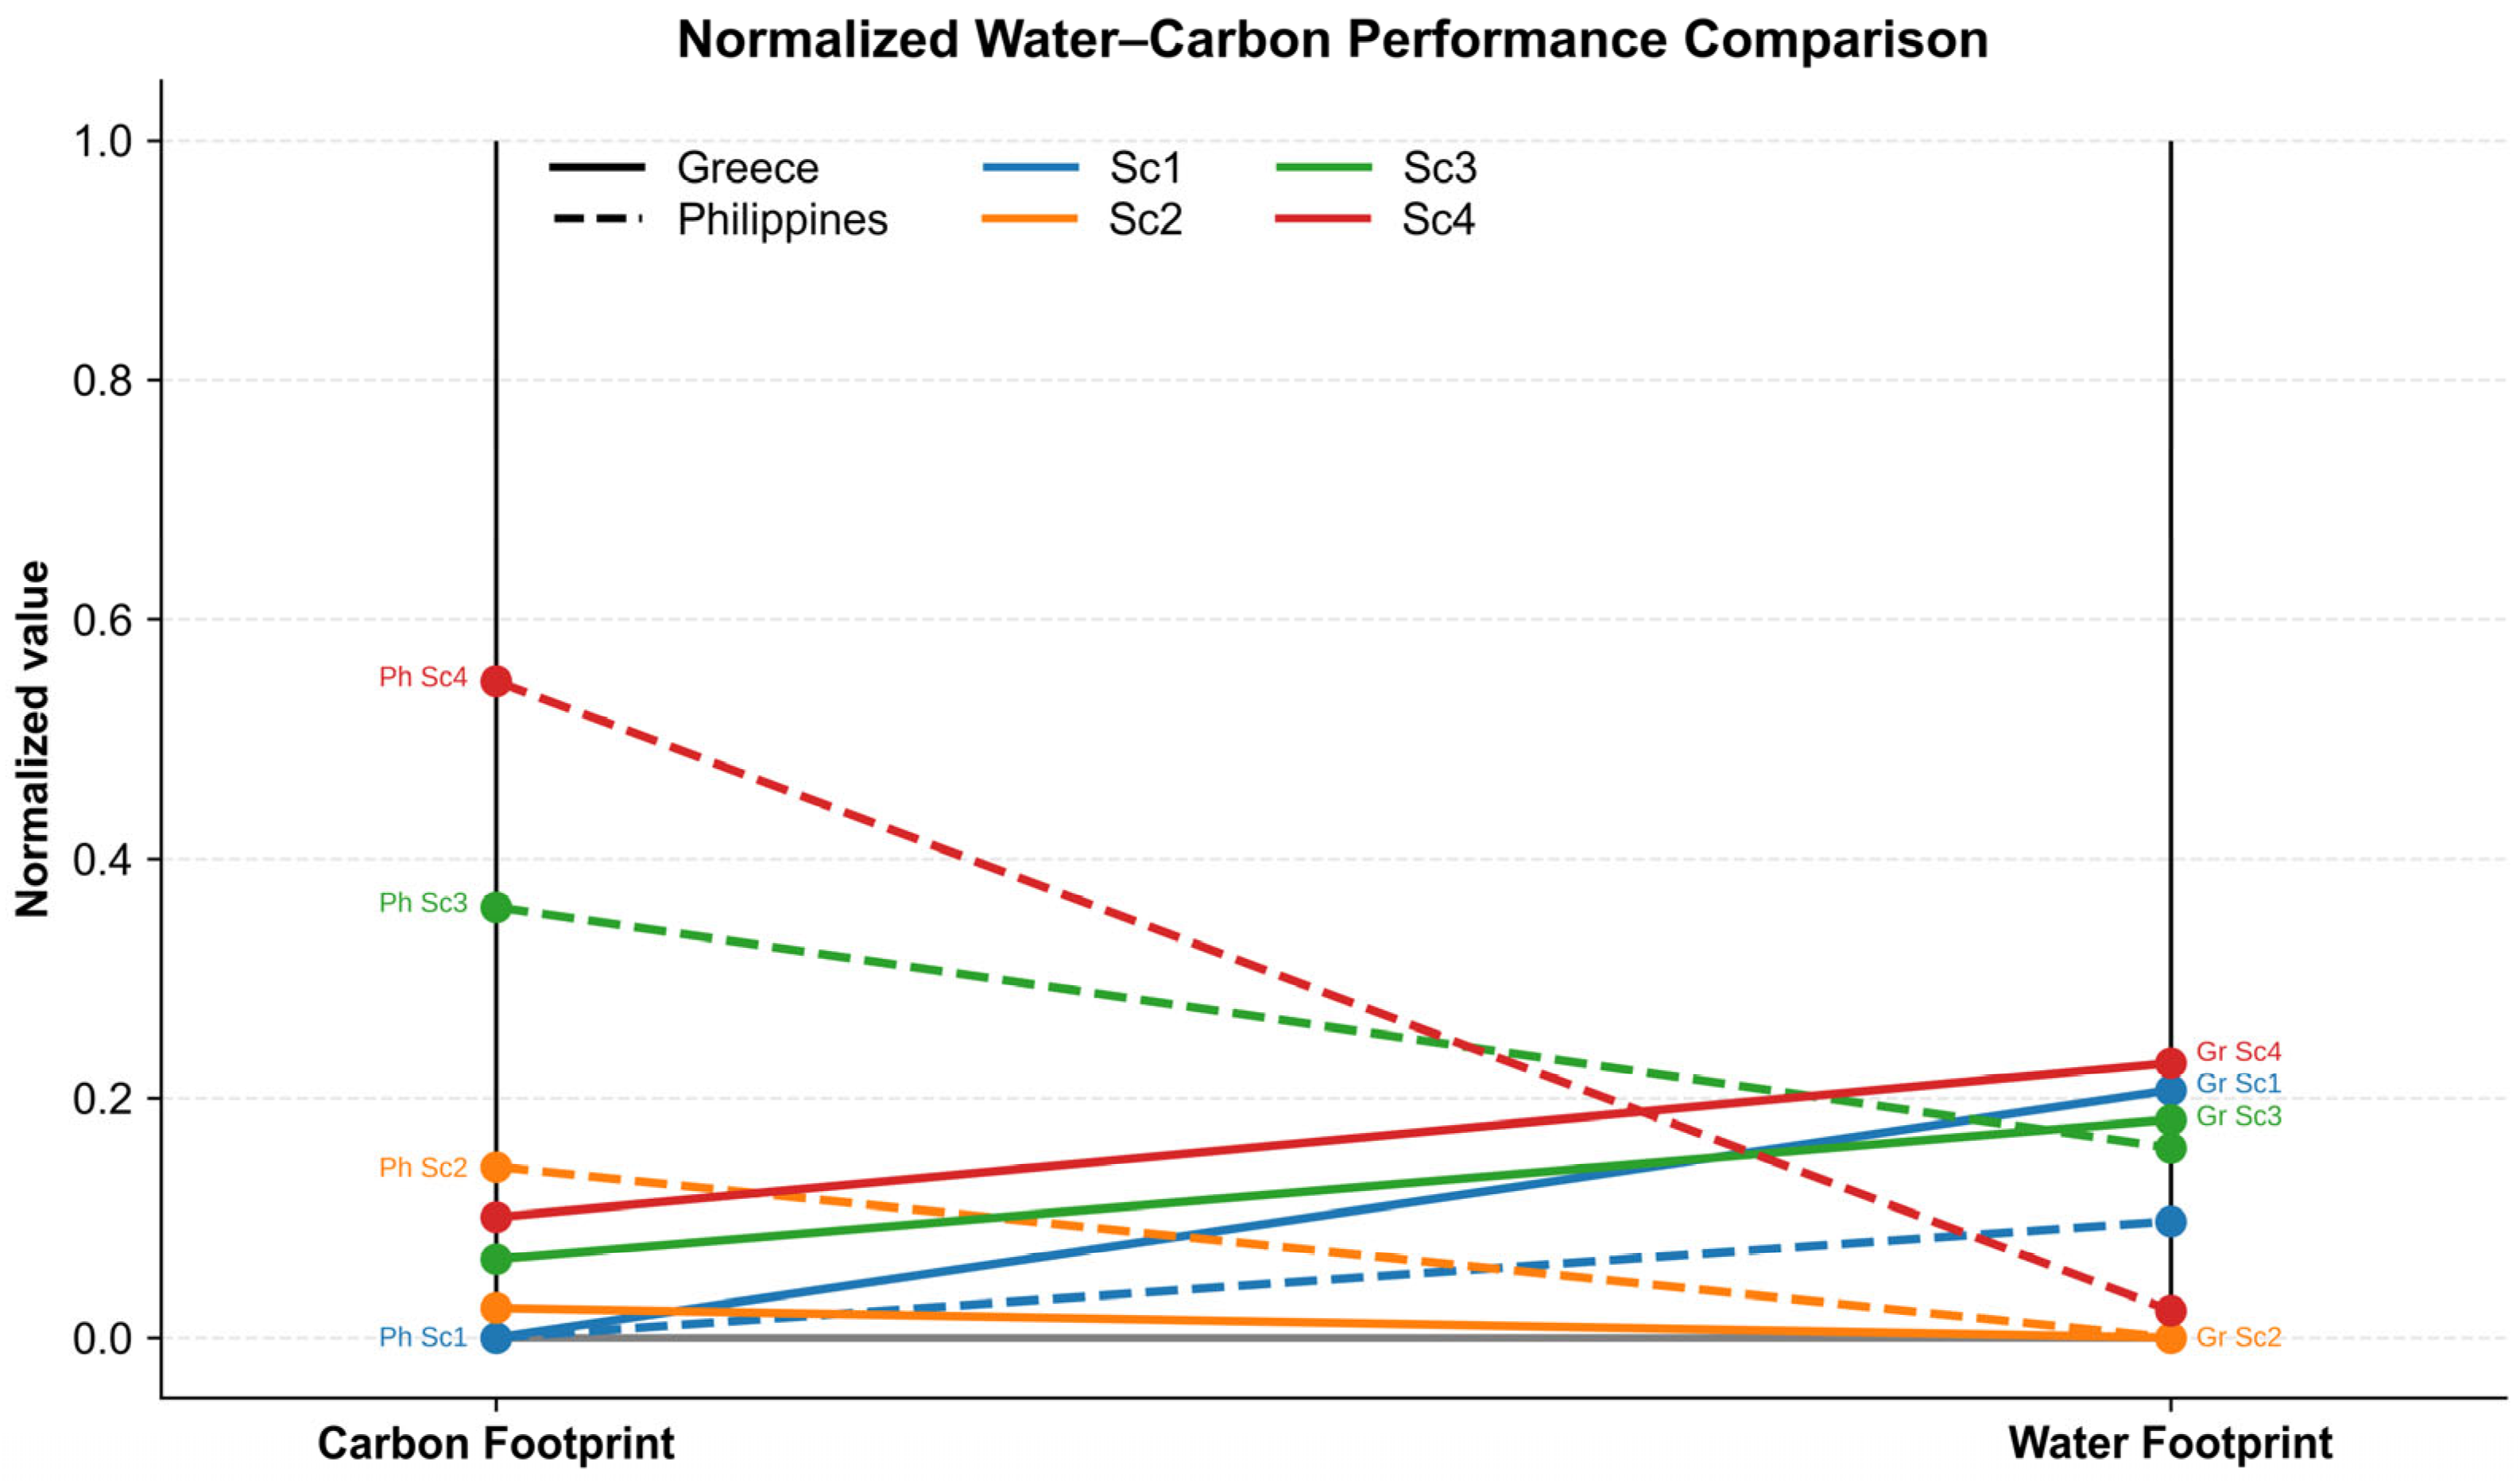
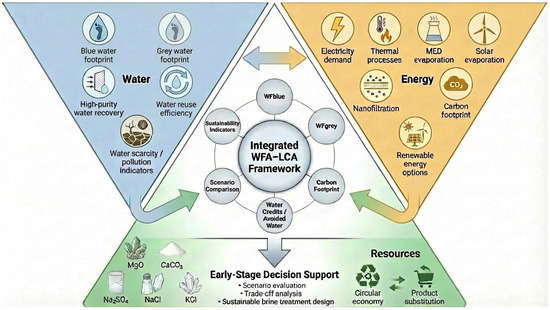
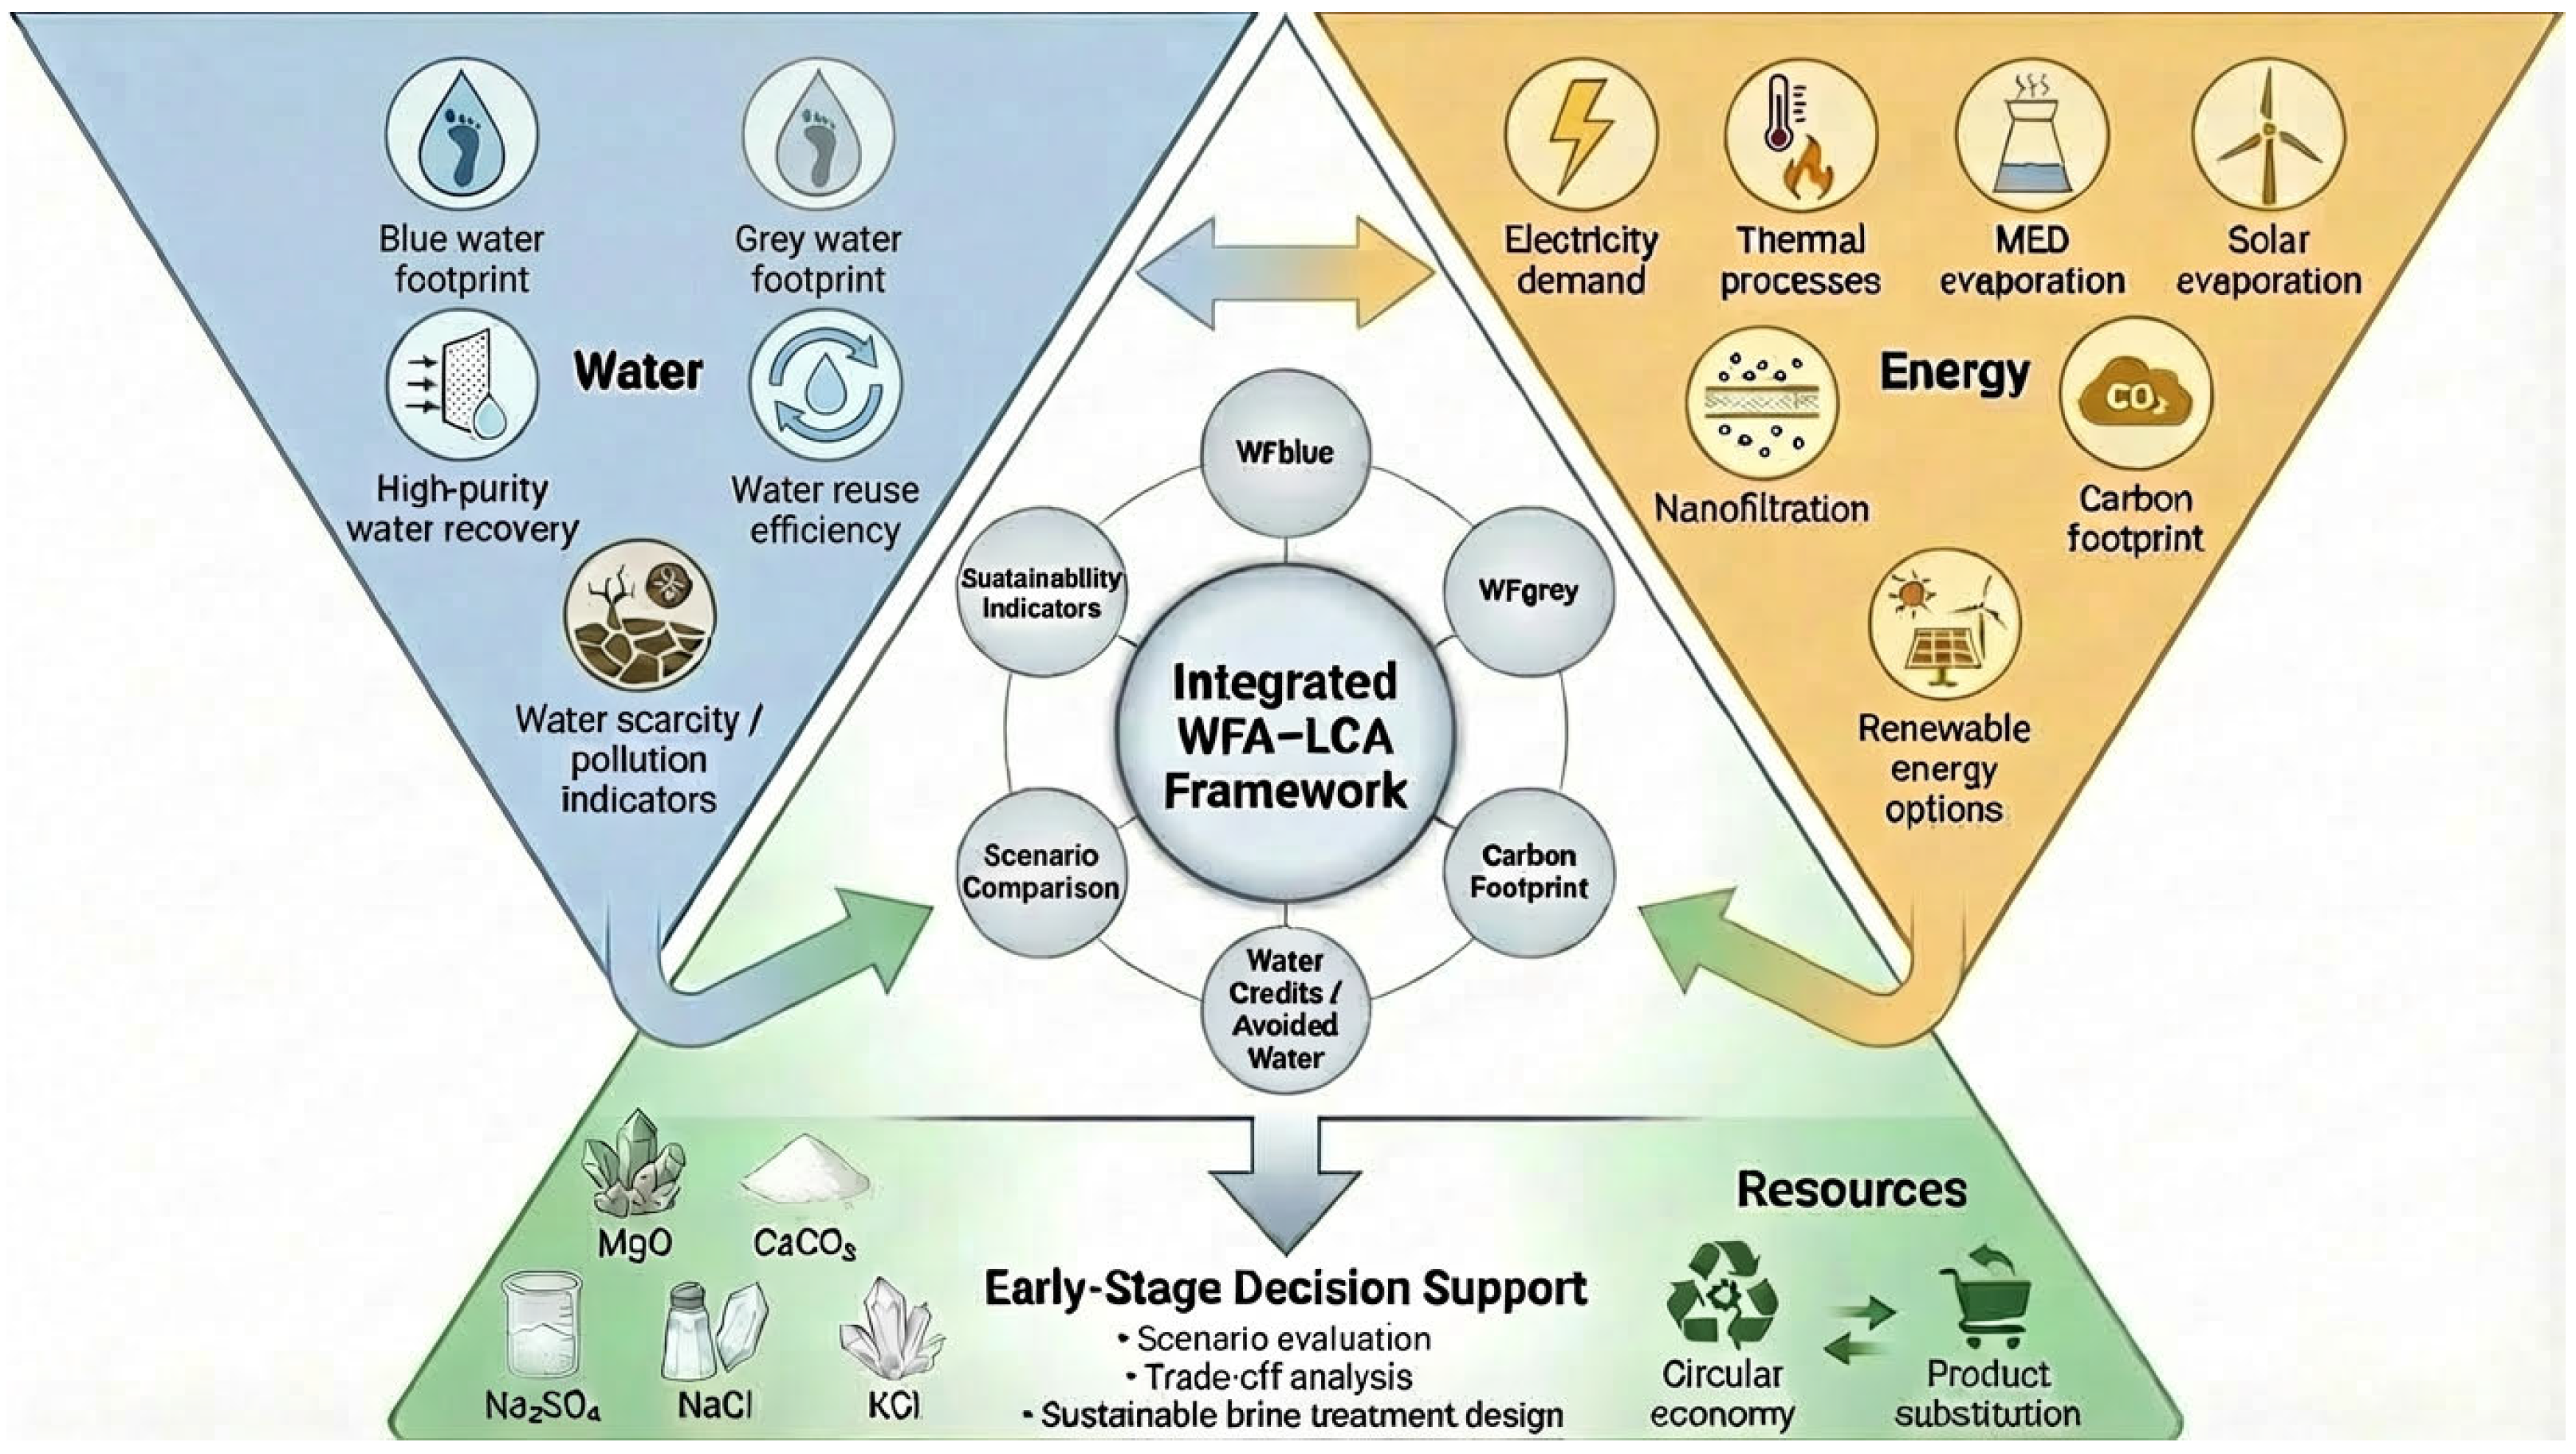

Disclaimer/Publisher’s Note: The statements, opinions and data contained in all publications are solely those of the individual author(s) and contributor(s) and not of MDPI and/or the editor(s). MDPI and/or the editor(s) disclaim responsibility for any injury to people or property resulting from any ideas, methods, instructions or products referred to in the content. |
© 2026 by the authors. Licensee MDPI, Basel, Switzerland. This article is an open access article distributed under the terms and conditions of the Creative Commons Attribution (CC BY) license.