


Abstract
In agriculture, soil amendments like compost, manure, superabsorbent polymers (SAP) and biochar (BC) are already in use to mitigate the effects of water shortage and to obtain a higher yield and survivability. The present study focuses on the impact of BC and SAP under moderate and reduced soil water content (SWC) on the physiological and biochemical response of Chenopodium quinoa Willd. (cv. UDEC-5), a naturally drought-resistant and strategic crop in arid regions, with the aim of further improving its resilience and biomass production. Plants were grown in the presence or absence (control) of SAP (1% or 0.1% g/100 g SAP) or BC (3% g/100 g BC) by taking into account the smallest possible amount of irrigation necessary for optimal growth of the control. Sixty-five days after sowing, the reduced watering approaches started. The irrigation amount was reduced slowly until plants without any amendment showed a significant reduction in CO2/H2O gas exchange and further significant changes in 23 morphological, physiological and biochemical symptoms of water shortage. Each amendment already caused individual plant response in wet conditions: The soil amendments of SAP (1% and 0.1%) and BC had no significant effect on biomass production but caused changes in PS I (portion of oxidized and open centers in PS I), the C/N ratio and N content. The addition of SAP (0.1% and 1%) led to a decrease in gH+, ECStmAu × gH+, RD, RL, the Ci/Catm ratio and ETR/Agross ratio and to an increase in water use efficiency (WUE), especially in the 0.1% SAP treatment. In moderate conditions, 0.1% SAP and 3% BC caused a significant increase in both the LOP and C/N ratio. In the moderate treatments, the application of 0.1% SAP promoted an increased Anet, while 3% BC promoted a significant reduction in malondialdehyde (MDA). The results of the present quinoa experiment indicate the drought avoidance mechanism of the control under low SWC. The reduced transpiration led to increased WUE due to the efficient use of the substomatal CO2 reservoir under low Cs and low E. It could also be confirmed that quinoa plants balanced low soil water potential by the accumulation of compatible solutes to lower the LWP and LOP. Drought led, especially in leaves in the 1% SAP treatment, to significant reductions in CO2/H2O gas exchange (Anet, RD), decreases in Y (II) and ETR in PS II, and an increase in the ETR/A ratio and over-reduced centers in PS I, pointing to an increased appearance of reactive oxygen species (ROS) in the chloroplasts. The latter change was indicated by higher levels of lipid peroxidation (MDA). It could be shown that the response of the test species Chenopodium quinoa to the addition of BC and SAP proved to be highly adaptable. The plant reacted in a very coordinated and specific way to both the danger of oversupply of SAP soil amendments under water shortage conditions and an effective adaptation to a limited water supply with 3% BC and 0.1% SAP by increasing WUE and proline content. However, BC also had a mitigating effect on the level of reactive oxygen species (ROS). It can be assumed that this effect is based on a more plant-compatible, less one-sided ion composition of BC. The results presented indicate that SAP and BC can have an impact on the water and nutrient accessibility for plants. Therefore, optimal biomass production and plant response can only be reached if plant soil interactions and competition between SAP, BC and the plant roots are taken into account when planning for climate-resilient, water-saving agriculture.
Keywords:
biochar; superabsorbent polymers; quinoa; drought; photosynthesis; malondialdehyde; proline 1. Introduction
In recent decades, a continuous increase in the incidence of extreme weather events associated with climate change has been observed all around the world [1]. Rising global temperatures have led to rapid climate changes, together with more intense rainfall events and longer periods of drought [2], leading, among other things, to overall reduced levels of soil moisture [3,4,5]. The rise in temperature will increase evapotranspiration rates, which in turn will result in longer, harder and more frequent periods of drought [5,6,7,8]. In arid and semi-arid regions, in particular, water retention capacity will decline due to the sandy texture and lack of organic matter in the soil [9].
For vegetation, drought is a stressful environmental factor in which insufficient precipitation leads to a progressive reduction in the amount of water available in the soil [10], affecting plant development and other metabolic processes [11]. Plants have evolved defense mechanisms to cope with drought [12].
Different components, such as photosynthetic pigments and photosystems, the electron transport system and CO2/H2O gas exchange processes, can be threatened by water deficiency. In the first response, plants tend to decrease stomatal conductance to increase water use efficiency and photosynthetic productivity, finally leading, among other effects, to a restriction of growth [13]. This is a survival mechanism to conserve water, as plants reduce their transpiration rate to maintain their water balance and protect against wilting. Additionally, plants often increase ATP and NADPH consumption and reduce ROS production through increasing photorespiration in C3 plants and high photosynthetic rates and efficiency in C4 plants [13].
However, to prevent damage to photosynthesis, the supply and demand of electrons must be regulated to maintain a balance. Drought stress impairs the activity of PS I and PS II, which can lead, among other things, to an increase in over-reduction on the PS I acceptor side. One way to reduce PS I acceptor over-reduction while reducing electron demand would be to adjust the cyclic electron flows [14]. The reduction in the supply of electrons is achieved by increasing the level of non-photochemical quenching (NPQ), which dissipates light energy and decreases the efficiency of photochemical reactions in photosynthesis [15].
If the plant’s response to drought stress is not strong enough to protect it, drought can cause severe damage to the photosystems through the generation of oxygen species (ROS) in chloroplasts, which can directly attack membrane lipids and increase lipid peroxidation [16]. Polyunsaturated fatty acids (PUFAs) are major components of the biomembrane and particularly susceptible to attacks by ROS [17]. The degradation of lipid hydroperoxides produces a wide variety of aldehydes, some of which are highly reactive, such as malondialdehyde (MDA), one of the most common reactive aldehydes [17]. As one of the final products of peroxidation of unsaturated fatty acids in phospholipids, MDA aggravates oxidative stress through the production of lipid radicals that can react themselves and damage proteins [18,19]. The amount of free MDA, which causes damage to cell membranes under stressful conditions, has been widely used as a marker for oxidative stress [18,20].
Due to these associated changes, many climate models and emission scenarios assume negative effects of climate change on crop yields [21]. In densely populated regions where agriculture is intensively practiced, such as South-Central Asia, the Southeast of South America, the Southeast of the United States and Central Europe, there is an increased risk to global food security because these regions are exposed to a higher risk of drought [22,23]. Despite worsening conditions, the world population is anticipated to grow to nine billion people in the coming decade [24]. However, if droughts in agriculture increase in the future, it may make sense to use plants that survive and thrive under water shortage conditions such as arid and semi-arid regions. In this context, the cultivation of the resilient Andean crop quinoa (Chenopodium quinoa Willd.) is of particular interest to global agriculture due to its high genetic biodiversity and its adaptability to varying environmental conditions, including nutrient-poor and saline soils and water shortages [25,26,27]. Moreover, quinoa seeds show a superior nutritional profile compared to other, more commonly consumed grains [28]. In addition, due to evolutionary adaptions to dry weather conditions, quinoa plants are particularly efficient in coping with long periods of drought in terms of their morphology and physiology due to drought avoidance mechanisms [29]. Osmotic adjustment plays an important role in quinoa, as a low osmotic potential allows the turgor of the leaves to be maintained even when the soil water potential is extremely low [30]. In addition, quinoa limits the growth and closes stomata during soil drying, maintaining leaf water potential (LWP) and a lower rate of photosynthesis that results in an increased efficiency of water usage [31,32].
This can contain the accumulation of osmolytes such as amino acids (e.g., proline) and soluble sugars. These solutes reduce the osmotic potential of the cell, causing water to enter the cell initiating the major mechanism for maintaining cell turgor when the water potential decreases [33]. Additionally, these solutes in the cell cytoplasm are able to protect enzymes involved in photosynthesis and metabolism and therefore in growth and productivity [34]. Quinoa accumulates protective proteins and solutes such as proline to scavenge free radicals and thus prevents membrane protein denaturation during water shortage [35]. One reason to choose quinoa for the present study was that the cultivation of such pseudo-cereal might be necessary to ensure long-term food security worldwide despite climate change. However, to achieve successful cultivation with optimal yields for quinoa in regions around the world where water shortage is increasing, it is reasonable to optimize soil quality in which plants grow, thereby improving the abilities of this resilient species. It does not make any sense to look at the plant response in isolation and study only certain modes of water transfer. A general consideration of the plant water relations of the whole plant in nature needs to involve the soil–plant–atmosphere continuum (SPAC) [36,37] and especially the soil.
One opportunity to improve the quality of soils with low water retention capacity and high evaporation is to add biochar (BC) [38]. Several studies reported that a positive effect of BC addition on water holding capacity could be shown in a higher extent in coarse-textured and sandy soils, typical for arid regions, than in fine textured and fertile soils [38,39]. The addition of biochar significantly improves the physiochemical properties of the soil, such as organic matter content and water retention capacity [40,41]. Biochar addition also supported the accumulation of osmotic active substance in the plant tissues, which led to improved water uptake by the plants [42,43]. This had a positive effect on the interaction between soil-plant-water, resulting in improved photosynthetic performance through enhanced water use efficiency [44,45,46]. Zhang et al. [47] show that the addition of biochar even led to a significantly improved water use efficiency (WUE) due to leaf stomatal closure and the reduction in transpiration rate during drought stress by soybeans. Additionally, its porous structure and the related surface area enlargement enable increased microbial activity and improve the binding of essential anions (such as nitrate and phosphorous) and important nutritive cations (such as K, Ca and Mg), the latter one because of its high cation exchange capacity (CEC) [41,48]. Besides declining productivity, drought also declines the concentration of nitrogen and phosphorus in plants [49]. The influence of biochar addition on plant leaf nitrogen is discussed quite controversially. Xu et al. [45] showed that biochar increases leaf N accompanied with improved soil available N and biological N fixation. In contrast to that, some studies reported that biochar immobilizes mineral N in the soil due to an increased C/N ratio [50,51]. However, in drought conditions, the uptake of nitrogen can be of eminent importance to enhance oxidative stress response. It has been shown that nitrogen supply could alleviate the adverse effects of drought stress on plants by enhancing antioxidant defense and by inducing proline accumulation [52,53,54].
Another possible option for soil improvement is the application of superabsorbent polymers (SAP). The crosslinked hydrophilic structure of SAP enables them to absorb and store water in their three-dimensional networks, whose weight exceeds their own by a hundred to a thousand times, leading to an extremely high water absorption and retention capacity [55,56,57,58,59]. The correlation analyses of [60] could show that SAP improve the utilization rate of soil water (water use efficiency WUE) and nutrients (nutrient use efficiency NUE) by improving the soil structure, increasing soil organic carbon and microbial enzyme activity. As logical consequence, this led to an increase in yield of winter wheat. Several studies have shown, apart from the capability to increase yields, due to its water-saving and fertilizer-conserving properties, that the water-storage capacity of SAP supports survivability of plants during periods of drought in arid and semi-arid areas. Refs. [61,62,63] reported that ion exchange capacity of SAP in a saline soil hindered an excessive accumulation of toxic ions like Cl− and Na+ to enter plant organs. However, when used in soil, SAP can also influence the overall C/N ratio of the soil by holding water and nutrients. Therefore, SAP can improve plant production in times of water shortage by retaining more water and nutrients in the active rooting zone [64]. However, by retaining water and nitrogen compounds, they can also indirectly and adversely change the soil’s C/N balance over time. Additionally, they can affect nutrient availability (such as Ca2+, Zn, K and Mg2+) for plants, which can negatively affect plant growth and nutrient cycling [65].
Although both BC and SAP share a high potential to improve soil parameter in dry regions. However, the addition of BC and SAP may also have disadvantages and limitations as they could compete with plant roots for scarce water resources. Based on these considerations, we developed the following hypotheses:
- The increasing scarcity of water necessitates the most efficient possible use of irrigation water. However, BC and SAP effect a negative response on biomass production in case of the smallest possible amount of irrigation necessary for optimal growth of the control is applied.
- The increase in WHC caused by the addition of additives such as BC or SAP will result in a higher water demand than in control plants and even at high SWC in symptoms of drought stress.
- The soil additives SAP or BC may prime quinoa for an improved response to subsequent stress at low soil water content.
- Harmful competition of water uptake between plants and the soil additives BC and SAP may cause adverse effects at low soil water content.
- The plant’s ability to handle oxidative stress is linked to its nitrogen (N) uptake and metabolism.
- When quinoa needs to decide because of limited resources at low SWC between two desirable but incompatible features being either growth (e.g., biomass production) or long survival (e.g., resistance to stress, risk avoidance), it will choose latter one.
Given its economic and industrial significance, enhancing the survivability and yield of Chenopodium quinoa Willd. is crucial in times of global climate changes. The research examines and compares the impact of super absorbent polymers or biochar on plant performance, biomass production, photosynthesis activity and ROS defense of quinoa at lower and higher soil water content. The goal is to develop efficient sustainable growth conditions that minimize water usage while optimizing survival and yields of quinoa in arid and semi-arid regions.
2. Materials and Methods
2.1. Plant Material and Growth Conditions
The experiment was carried out in a greenhouse at the University of Giessen, Germany (latitude 50.5873 and longitude 8.67554), under controlled conditions at an average temperature of 22–24 °C/17 °C (day/night), a relative humidity of 60–80% (±10) and a photoperiod of 16/8 h (day/night). The test species was Chenopodium quinoa (Willd.). Seeds of the variety UDEC-5 were kindly provided by the Institute of Plants Ecology, Giessen, Germany. For preparation, the seeds were germinated in a pot with vermiculite. Then, 14 days after germination, the plants were transferred in QuickPot plates with until soil type 0—zero soil (H. Nitsch & Sohn GmbH & Co. KG, Kreuztal, Germany). Fourty-one days after the start of the culture, the emerged seedlings were transferred to pots with a capacity of 1.5 kg (one plant per pot) filled with a mixture of topsoil (69%) and sand (29%) to obtain a low water-holding capacity and perlite (2%) to favor better aeration. We divided the 56 pots into 4 groups (14 pots per treatment): control without any amendment, two different treatments with superabsorber 1% (1% SAP = 15 g/pot) or 0.1% (0.1% SAP = 1.5 g/pot) superabsorber, and one treatment with 3% biochar (3% BC = 30 g/pot). The polymer used in the experiment was STOCKOSORB®, a granular potassium polyacrylate manufactured by Evonik Nutrition & Care GmbH, Krefeld, Germany [66,67,68]. The biochar (Schottdorf-type) used in this study, produced by Carbon Terra, Augsburg, Germany, consisted primarily of silicon (Si), calcium (Ca), potassium (K), iron (Fe), magnesium (Mg), sodium (Na), phosphorus (P) and sulfur (S) [67,68,69]. The treatments of 0.1%SAP and 3% BC were chosen because of a similar water holding capacity. The plants of all four treatments received exactly the same amount of water (7.72 mL H2O/100 g dw soil) which was necessary for optimal growth of the control (=20% water holding capacity). Water-holding capacity was determined according to the methods of [68]. Although this resulted in a constant water content in the soil for all treatments, it also led to a decrease in the percentage water holding capacity at high SWC due to the addition of soil additives (1% SAP: 13.06; 0.1% SAP: 19.41; 3% BC 19.22% WHC). The division of the treatments in wet and dry treatments started at day 65 after sowing. Based on the plants’ daily water usage, the dry treatments received 10 mL less water per day (4.6 mL H2O/100 g dw soil) than the wet treatments. The slow reduction in the soil water content induced a continuous but slowly increase in the water shortage to stop reduction before crossing the permanent wilting point [69]. In this period, pots were weighed every day to control the water usage and to adapt the water supply to the increasing demand of the growing control plants. As a result, the plants of all four wet treatments received exactly the same amount of water (high SWC = 9.65 mL H2O/100 g dw soil), which was necessary to reach 25% WHC of the control soil. Over the entire period, the treatments were fertilized once using a nutrient solution modified after [70]. After 78 days of treatment, a final harvest was carried out.
2.2. Growth Parameter
At the day of harvest, we started to separate the root system from the soil by washing them before moisture was quickly removed from the surface of the plants’ roots with tissue. Then, we measured the fresh weight (FW) of root, stem and leaves separately as well as 100 g soil of each sample. Dry weight (DW) was determined after drying the samples at 90 °C for 24 h in the oven. The water content (WC) was determined by calculating the difference between the FW and DW of plants.
2.3. Water Relations
The leaf water potential was determined with the Scholander pressure chamber [71,72]. For this purpose, the plants (n = 3 replicates) stayed in a darkroom of the greenhouse at night. The measurements were taken on the following day from the first fully developed leaf of the plant. In addition, the concentration of osmotically active particles was measured with an Osmomat 030, GonotecTM, Berlin, Germany. According to [73], the osmotic potential (in MPa) was calculated.
2.4. Light Dependent Reactions of Photosynthesis
The impact of the soil amendments and the water supply to the light dependent reactions of photosynthesis was determined with a MultispeQ V 2.0TM (PhotosynQ Inc., East Lansing, MI, USA) at the first fully developed leaf of each plant (n = 4 replicates). For the recording of the light saturation curves, we used a protocol provided by PhotosynQ “Photosynthesis RIDES Actinic Series 10 2x2000 of Uwe Grueters”.
According to [74], for photosystem II, the potential maximum efficiency of PS II (Fv/Fm), the distribution of the photochemical quantum yield of PS II (Y (II)), the quantum yield of regulated non photochemical energy loss in PS II (Y (NPQ)), and the quantum yield of non-regulated non-photochemical energy loss in PS II, equivalent to Y (NO), were measured, and the electron transport rate (ETR) was calculated. Additionally, we indirectly studied photosystem I and the electrochromic shift generated across the thylakoid membrane during photosynthesis, (ECStmAu) caused by the buildup of a proton gradient and the membrane ATP-synthase activity with the parameters steady state proton flux (vH+), proton conductivity (gH+). By means of extinction-based parameters, we also determined the share of oxidized, open and over reduced centers of the PS I.
2.5. Adjustment of the Stomatal Regulation During Light Independent Reactions of Photosynthesis (CO2/H2O Gas-Exchange)
Parameters of the CO2/H2O gas exchange were determined by using a LI-6400/XT portable photosynthesis system (Li-Cor Inc., Lincoln, NE, USA) with a 6400-40(B) LED light source attached to the leaf chamber at light saturation conditions with a PPFD of 1500 µmol PAR m−2 s−1. Net CO2 assimilation rate (Anet in μmol m−2 s−1), intercellular CO2 concentration (Ci in ppm CO2), stomatal conductance (Cs in mmol m−2 s−1) and transpiration rate (E in mmol m−2 s−1) were measured at the first fully developed leaf of the plant (n = 4 replicates). Water use efficiency (WUE) was calculated as the ratio of Anet/E. According to [75], a saturation curve was created as well as the dark respiration point (RD in μmol CO2 m−2 s−1 at 0 μmol PAR m−2 s−1). Photorespiration (RL in μmol PAR m−2 s−1) was estimated as 1/12 × (ETR − 4 (Anet + RD)) according to [76]. The gross CO2 assimilation rate (Agross in µmol PAR m−2 s−1) was calculated as the sum of net primary production (Anet) and respiratory loss (RD and RL).
2.6. MDA Measurements—Biomarker for Lipid Peroxidation
According to [77] the level of lipid peroxidation and oxidative stress was estimated indirectly by the formation of malondialdehyde (MDA). To determine the content of MDA, leaf material (20 mg FW) was homogenized with a mortar and pestle in 2 mL of ice-cold trichloroacetic acid TCA (1%, w/v) and centrifuged at 15,000× g for 15 min at 4 °C. After that, 2mL of supernatant was mixed with 0.5% (w/v) of thiobarbituric acid (TBA) and heated at 95 °C for 30 min before quickly cooled in an ice bath. The samples were centrifuged (15,000× g for 10 min at 4 °C) and the absorbance was measured in the supernatant at 532 and 600 nm by using a spectrophotometer CAMSPEC M501 (CamSpec Ltd. Sawston, Cambridge, UK). The concentration of MDA was calculated with the help of the extinction coefficient 155 mM−1 cm−1.
2.7. Proline Measurements
Proline concentration was determined according to the method of [78]. An amount of 0.2 g of plant dry material was homogenized with a mortar and pestle in 2 mL of sulphosalicylic acid (3% w/v). Then, the mixture was mixed with the acid ninhydrin solution (2 mL) and the glacial acetic acid (2 mL). The mixture was transferred at 90 °C for 1 h in a water bath and the reaction was stopped using ice. Proline was extracted by adding 4 mL of toluene to each tube, and the absorbance of toluene fraction (aspired from the liquid phase) was measured at 520 nm using a spectrophotometer CAMSPEC M501 (CamSpec Ltd. Sawston, Cambridge, UK). Proline concentration was determined by using calibration curve as μmol proline g−1 DW.
2.8. C/N-Analyse
For the determination of the carbon and nitrogen content an amount of 0.2 g of plant dry material was homogenized with a mortar and pestle and assayed with the Vario MAX CNS analyzer (Elementar Analysensystem GmbH, Hanau, Germany). As standard with known carbon and nitrogen amount, we used increasing quantities of hay and L-glutamic acid. The results of the percentage of carbon and total nitrogen amount were used to calculate the C/N ratio and to calculate the C and N content per g plant dry material.
2.9. Statistics
Between three and four replicates were used for data analyses. Statistical analyses were carried out by one-way analyses of variance using SigmaPlot software version 12.5 [79]. For the statistics of the data collected, the individual values were checked by using a one-way analysis of variance (One way ANOVA) according to Holm–Sidak and a normality test according to Shapiro–Wilk.
3. Results
3.1. Subsection
3.1.1. Growth
The fresh weight of control plants (control high SWC) was on average 23.1 g (n = 4 replicates) at the time of harvest. Reducing the water content led to a significant reduction in the fresh weight (Figure 1). Compared to the control plants, the addition of biochar and SAP did not result in any change in weight at a high soil water content. Drought also led to a decrease in fresh weight in the treatments with added SAP and BC. The dry treatments of 0.1% SAP (9.1 g) and 3% BC (9.2 g) showed the lowest value of the fresh weight.
Figure 1.
Effect of superabsorber or biochar amendment and additional water shortage on plant growth parameters of Chenopodium quinoa Willd. (UDEC-5) at day 78 after sowing. Fresh weight (sum of white and black bar), dry weight (black bar) of the whole plant without the roots. The difference between the FW and DW shows the water content in the plants. Values represent mean ± SE (n = 4 replicates) and the different letters a to c indicate significant differences between the treatments. High soil water content (SWC↑), low soil water content (SWC↓).
The values of the dry weights show a similar result (Figure 1). The dry weight of the control plants was about 3.8 g. A reduced water content led to a tendency decrease to 3.1 g. As compared to the control plants, all treatments with additions (1% SAP%; 0.1% SAP; 3% BC) show a tendency to decrease in the dry weight at less water. Only the decrease in the treatments with 0.1% SAP and 3% BC at low SWC was significant.
It was also shown that drought caused significant reduction in the length of the plant stems and the number of leaves in all treatments.
3.1.2. Water Relation
At low SWC, 0.1% SAP and biochar amendments led to a significant increase in the leaf osmotic potential (LOP) from −2.2 MPa (control) to −1.8 (0.1% SAP) and −1.9 MPa (3% BC), respectively (Figure 2). The plants of all treatments buffered the reduction in soil water potential by a reduction in the leaf water potential, which was mainly reached by a decrease in the leaf osmotic potential. All dry treatments responded to low SWC with a significant decrease in leaf water potential. The addition of 0.1% and 3% BC led a particularly strong decrease in the leaf water potential to less than −2.5 MPa in the mean under dry conditions. It is worth mentioning that the treatment with biochar showed in comparison with the remaining cultures the significantly lowest osmotic potential at low soil water content.
Figure 2.
Effect of superabsorber or biochar amendment and additional water shortage on the plant leaf water potential in Chenopodium quinoa Willd. (UDEC-5) at day 78 after sowing. Leaf osmotic potential (sum of white and black bar), leaf water potential (black bar) and the difference between the leaf osmotic potential (LOP) and the leaf water potential (LWP) enable statements about the remaining turgor. Values represent mean ± SE (n = 4 replicates) and the different letters a to d indicate significant differences between the treatments. High soil water content (SWC↑), low soil water content (SWC↓).
3.1.3. Light Dependent Reactions of Photosynthesis (at PAR1200)
ETR was calculated on base of Y (II). The soil amendments had hardly any effect on the photochemical quantum yield Y (II) and ETR at high soil water content with the exception of 1% SAP (Figure 3A,D). The latter one showed a tendency towards a decrease in Y (II) and ETR. The low soil water content caused a significant decrease in Y (II) and ETR in the SAP treatments (1% SAP and 0.1% SAP) and a non-significant decrease in the control and BC treatments. The changes of Y (II) were balanced mainly by non-photochemical quenching Y (NPQ) (Figure 3B) with two exceptions. The addition of 0.1% SAP and 3% BC caused at low soil water content a significant decrease in non-regulated non-photochemical energy (Y (NO)) (Figure 3C). As shown in Figure 3D, the addition of SAP led to a significant decrease on the electron transport rate (ETR) of PS II at the low soil water content.
Figure 3.
(A) Effect of superabsorber or biochar amendment on the photochemical quantum yield Y (II) in Chenopodium quinoa Willd. (UDEC-5) at day 78 after sowing. (B) Effect of superabsorber or biochar amendment on the regulated non photochemical quenching Y (NPQ) in Chenopodium quinoa Willd. (UDEC-5) at day 78 after sowing. (C) Effect of superabsorber or biochar amendment on the non-regulated non-photochemical quenching Y (NO) in Chenopodium quinoa Willd. (UDEC-5) at day 78 after sowing. (D) Effect of superabsorber or biochar amendment on the electron transport rate in Chenopodium quinoa Willd. (UDEC-5) at day 78 after sowing. Values represent mean ± SE (n = 4 replicates) and the different letters a to b indicate significant differences between the treatments. High soil water content (SWC↑), low soil water content (SWC↓).
The addition of 1% and 0.1% SAP led to a significant increase in oxidized reaction centers at the PS I at high soil water content (Figure 4A). The portion of oxidized centers increased at low SWC in all treatments to the same level. This increase was mirrored by a decrease in the open reaction centers of the PS I (Figure 4B). As shown in Figure 4C, the addition of SAP (1% and 0.1%) caused a significant increase in over-reduced centers at low SWC.
Figure 4.
(A) Effect of superabsorber or biochar amendment on oxidized reaction centers at PS I in leaves of Chenopodium quinoa Willd. (UDEC-5) at day 78 after sowing. (B) Effect of superabsorber or biochar amendment on open reaction centers at PS I in leaves of Chenopodium quinoa Willd. (UDEC-5) at day 78 after sowing. (C) Effect of superabsorber or biochar amendment on over reduced centers at PS I in leaves of Chenopodium quinoa Willd. (UDEC-5) at day 78 after sowing. Values represent mean ± SE (n = 4 replicates) and the different letters a to b indicate significant differences between the treatments. High soil water content (SWC↑), low soil water content (SWC↓).
Low SWC in the control, 0.1% SAP and 3% BC treatments led to a significant and at 1% SAP to a not significant decrease in vH+. SAP (0.1% and 1%) and BC had hardly any effect on the steady-state proton flux (vH+) at high and low SWC (Figure 5A). The addition of SAP (1%; 0.1%) led in contrast to BC (where it was similar to the control) already at high SWC to a significant reduction in steady-state proton conductivity (gH+). Low SWC caused only in the control and BC treatments a decrease in gH+ until both reached similar values as in the treatments with SAP (0.1% and 1%). In comparison to control is the decrease in vH+ and gH+ at high SWC in all treatments an indicator for a reduced potential for ATP synthase activity at low SWC. The addition of SAP or BC had no significant effect on electro-chromatic shift across the thylakoid membrane (ECStmAu) at high SWC. Low SWC led to a decrease in ECStmAu only in both SAP (1% and 0.1%) treatments. The product of ECStmAu × gH+ was calculated as an indicator of the proton transport through the thylakoid membrane, which may be related to the rate of ATP synthesis. The addition of SAP (1%) led, in contrast to 0.1% SAP and BC (where it was similar to the control), to a significant reduction in ECStmAu × gH+. Low SWC led only in the control, 0.1% SAP and BC treatments to a decrease in ECStmAu × gH+ until they reached values similar to the treatment with 1% SAP.
Figure 5.
(A) Effect of superabsorber or biochar amendment on the steady-state rate of proton flux (vH+) in leaves of Chenopodium quinoa Willd. (UDEC-5) at day 78 after sowing. (B) Effect of superabsorber or biochar amendment on the proton conductivity (gH+) in leaves of Chenopodium quinoa Willd. (UDEC-5) at day 78 after sowing. (C) Effect of superabsorber or biochar amendment on the electrochromic shift (ECStmAu) in leaves of Chenopodium quinoa Willd. (UDEC-5) at day 78 after sowing. (D) Effect of superabsorber or biochar amendment on the product of ECStmAu × gH+ in leaves of Chenopodium quinoa Willd. (UDEC-5) at day 78 after sowing. Values represent mean ± SE (n = 4 replicates) and the different letters a to c indicate significant differences between the treatments. High soil water content (SWC↑), low soil water content (SWC↓).
3.1.4. Leaf CO2/H2O Gas Exchange
Plant leaves reached in the control treatment a net CO2 assimilation rate (Anet) of 10.08 µmol CO2 m−2 s−1 (Table 1). Treatment with 0.1% SAP with high soil water content led to an increase in Anet by 46.7% (14.79 µmol CO2 m−2 s−1) (Table 1). In all treatments, drought induced a significant decrease in the max. Anet.
Table 1.
Effect of superabsorber or biochar amendment on leaf gas-exchange and chlorophyll fluorescence parameters of Chenopodium quinoa Willd. (UDEC-5) at light saturation (PPFD of 1000 µmol PAR m−2 s−1) at day 78 after sowing. Values represent mean ± SE (n = 4 replicates) and the different letters a to f indicate significant differences between the treatments.
There was a significant correlation between the values of Anet, stomatal conductivity (Cs) and transpiration (E). Reduced soil water content led to a significant decrease in Cs in all treatments, consequently leading to a significant decrease in Anet and E at lowSWC. In addition, the reduced SWC caused a decrease in Ci/Catm ratio in all treatments independent of the amendment. Compared to the control, treatment with the addition of 1% SAP showed the lowest Anet at low SWC. Consequently, the control treatment and the treatments with the addition of 0.1% SAP and 3% BC were able to improve water use efficiency (WUE) at low SWC. This increase in WUE was highest at high SWC and resulted from a particularly sharp decline in Cs and E. Furthermore, both SAP treatments showed the lowest RL and RD values at high and low SWC. Reduced SWC led to a decrease in RD and RL in the control and BC treatments until they reached the values of the SAP treatments.
3.1.5. ETR/Agross Ratio
The increase in the ETR/Agross ratio can be used as an indicator of the risk of oxidative stress. The addition of SAP or BC shows an increase in the ETR/Agross ratio at low SWC (Table 1). The highest increase is observed in the treatment with the addition of 1% SAP. This result correlated with the increase in over-reduced centers at low soil water content.
3.1.6. MDA Content
The MDA contents in the control treatment were on average 15.9 nm/g FW (Figure 6). Only the addition of biochar led to a significant reduction in the MDA content at high SWC. The MDA content in leaves stabilized in the control and SAP treatments at low SWC in the range of 20 nm/g FW. However, the MDA content in the BC treatment stayed significantly lower than in all other treatments, as well as at low SWC.
Figure 6.
Effect of superabsorber or biochar amendment on MDA content in leaves of Chenopodium quinoa Willd. (UDEC-5) at day 78 after sowing. Values represent mean ± SE (n = 4 replicates) and the different letters a to c indicate significant differences between the treatments. High soil water content (SWC↑), low soil water content (SWC↓).
3.1.7. C/N Ratio
The N content (Figure 7B) had a major impact on the C/N ratio (Figure 7A). The control plants presented a high N content in line with the low C/N ratio at high and low SWC. The addition of 1% SAP resulted in a low N content at high and low SWC, and consequently in a high C/N ratio. Reduced SWC caused in the treatments with 0.1% SAP and 3% BC increase in N content up to the level of the control plants.
Figure 7.
(A) Effect of superabsorber or biochar amendment on C/N ratio in leaf tissues of Chenopodium quinoa Willd. (UDEC-5) at day 78 after sowing. (B) Effect of superabsorber or biochar amendment on N in % in leaf tissues of Chenopodium quinoa Willd. (UDEC-5) at day 78 after sowing. Values represent mean ± SE (n = 4 replicates) and the different letters a to b indicate significant differences between the treatments. High soil water content (SWC↑), low soil water content (SWC↓).
3.1.8. Proline Content
The proline content was at high SWC not significantly different in the control (3.85 mmol/kg) and all other treatments (Figure 8). Reduced SWC caused a significant increase in proline content only in treatments with 0.1% SAP and BC.
Figure 8.
Effect of superabsorber or biochar amendment on proline content in leaves of Chenopodium quinoa Willd. (UDEC-5) at day 78 after sowing. Values represent mean ± SE (n = 4 replicates) and the different letters a to b indicate significant differences between the treatments. High soil water content (SWC↑), low soil water content (SWC↓).
4. Discussion
In this study we analyzed the impact of various soil amendments on growth and physiological responses of Chenopodium quinoa Willd. (cv. UDEC-5) in response to a persistent moderate water stress period. Abiotic stress resistance of plants has proven to be complex. It is shown in this study that the response of the test species to drought and the addition of BC and SAP proved to be very precisely tailored to the respective conditions. However, the plant response patterns were partially surprising and did not match all initial hypotheses and expectations made at the beginning, as will be shown in the following chapters.
- Impact of soil additives at high SWC
First, we looked at the effect of soil additives on plant growth at high SWC. In accordance with Hypothesis 4 the soil amendment of 0.1% SAP and 3% BC at high SWC caused a significant decrease in plant dry weight (Figure 1) and changes in PS1 (portion of oxidized and open centers in PS1) (Figure 4), C/N ratio and N content (Figure 7). The addition of SAP (0.1% and 1%) led to a decrease in the gH+ and ECStmAu × gH+ (indicator of electrical potential across the membrane) (Figure 5), RD, RL, Ci/Catm ratio and ETR/A ratio and to an increase in the WUE (Table 1), especially in the 0.1% SAP treatment. Treatment with 0.1% SAP and 3% BC, both at high SWC, caused a significant increase in the leaf osmotic potential (Figure 2) and no significant increase in C/N ratio (Figure 7A), decrease in N content (Figure 7B) and opposing effects on MDA content (Figure 6). The C/N ratio increased with increasing SAP amendment.
This impact of soil additives is not uncommon. In agreement with the present results, [60] shows that the application of SAP can already, at high SWC, lead to increases in soil organic carbon, soil microbial biomass carbon, soil sucrase and cellulase activities, soil water consumption, water consumption, Anet, leaf WUE, nitrogen use efficiency (NUE) and yield of winter wheat. The correlation analyses of [60] could show that SAP improve the utilization rate of soil water and nutrients by improving the soil structure and increasing soil organic carbon and microbial enzyme activity. However, plants grown with 1% SAP also showed a significant reduction in PS II activity (Y (II) (Figure 3A) and ETR (Figure 3D) in favor of a high Y (NPQ) (Figure 3B) as signs of negative effect from SAP addition.
However, BC treated plants showed significantly lower MDA contents than all other treatments. Several studies have shown that biochar can lead to an improved ion balance, increased proline accumulations and decreases in antioxidant enzyme activity, H2O2 and MDA contents and, thus, improved membrane stability [54,80]. Derbali et al. [81] interpreted this coordinated response to the BC addition as an accompanying priming effect or preparation for possible upcoming stress.
- Impact of reduced SWC on biomass production and water relation of the control plants
In agreement with several other studies [31,32,82], low SWC in the control treatment had a negative effect on net rate of CO2 assimilation (Table 1), Y (II), and ETR (Figure 3D), and consequently the production of fresh and dry matter of the plant (Figure 1). The results of the present quinoa experiment indicate, in accordance with [83], a drought-avoidance mechanism of the control: the reduced transpiration led to increased water use efficiency due to the decrease in the Ci/Catm ratio, stomatal conductance, transpiration (Table 1) and leaf area development. We also confirm that quinoa plants improved water uptake at low SWC by the accumulation of compatible solutes to lower the leaf water potential and the leaf osmotic potential (Figure 2) [35]. There was no significant impact of low SWC on C/N ratio and N content (Figure 7), but surprisingly also not on the proline content (Figure 8) of control plants, as shown by [84].
- Impact of soil additives on biomass production and water relation at reduced SWC
Contrary to expectations, the addition of 0.1% SAP and 3% BC resulted, at low SWC, in a significantly higher reduction in fresh and dry weight (Figure 1) and water potential (Figure 2) compared to the control and 1% SAP treatment. It can be assumed that plants change, under both treatments (0.1% SAP low SWC and 3% BC low SWC), their metabolic activities from growth to the physiological and biochemical responses of the plant to perceived stress [85]. However, in accordance with hypotheses 1.4 and 6, plants grown at low SWC at 0.1% SAP and 3% BC switched from preferred growth (e.g., biomass production) to long survival (e.g., enhanced resilience). The strategy behind this plant response might at least partially be a compensation of the reduced biomass production by an extension in plant development [86]. This compensation phenomenon after temporary abiotic stress has previously been described in maize and quinoa leaves [81,87,88,89] and is thought to maintain the capacity to resume biomass production for a longer period in anticipation of water becoming available again.
The energy reserves saved by the reduced biomass production were used in the 0.1% SAP and 3% BC treatments, among other things, for the accumulation of compatible solutes to lower the osmotic potential and, consequently, also the leaf water potential (Figure 2). The addition of 0.1% SAP (−2.58 WP in MPa) and 3% BC (−2.60 WP in MPa) caused a higher decrease in the water potential than the control and of the 1% SAP treatments. This decrease in the water potential was achieved in the 3% BC treatment with a significantly higher decrease in the osmotic potential than at 0.1% SAP at low SWC and consequently also higher turgor potential. Wang et al. [90] show that with a decrease in soil moisture content, the content of malondialdehyde (MDA) increased significantly in soybean leaves. The BC-mediated higher investigation in the release of soil water resources could be one reason for the lower MDA contents than in other treatments.
- Light dependent reactions of photosynthesis
Drought stress has a significant effect on the light-dependent reactions of photosynthesis, because they are highly dependent on water [13]. Light reactions utilize light energy absorbed by chloroplast for the breakdown of water (photolysis) and to generate ATP via a proton gradient across the thylakoid membrane and NADPH via photosystem II (PS II) and I (PS I), respectively. If the absorbed light energy exceeds the capacity of the photosynthetic machinery because of H2O deficiency, this can lead to light-induced damage in the photosystems (PS I and PS II) [91]. To estimate the response of the reaction centers of PS II, we measured Y (II), Y (NPQ) and Y (NO) among other things.
- Impact of soil additives at high SWC on PS (II) and proton flow of photosynthesis
Non-photochemical quenching (NPQ) mechanisms are responsible for the dissipation of excess excitation energy to generate heat and to prevent overexcitation of chlorophyll molecules, leading to the photodamage of PS II [13,92,93]. Unexpectedly, but in accordance with Hypothesis 2, the treatment with 1% SAP, even at high SWC, led to a decrease in Y (II) and an increase in Y (NPQ) (Figure 3). Dissipation of excess absorbed light energy through zeaxanthin- and ΔpH-dependent photosystem II antenna quenching is considered the major mechanism for non-photochemical quenching and photoprotection [94]. However, the significant increase in Y (NPQ) (Figure 3B) at 1% SAP at high SWC was accompanied by a significant decrease in ECStmAu (electrochromic shift across the thylakoid membrane) (Figure 3C) and ECStmAu × gH+ (indicator of electrical potential across the membrane) (Figure 3D), gH+ (indicator of proton conductivity of the thylakoid membrane) (Figure 5B) and vH+ (steady state proton flux) (Figure 5A). Ivanov et al. [94] interpreted this phenomenon as evidence of a zeaxanthin-independent pathway for dissipation of excess light energy, based within the PSII reaction center, which may also play a significant role in photoprotection. They assumed that PSII reaction centers can be reversibly interconverted from photochemical energy transducers that convert light into ATP and NADPH to efficient, non-photochemical energy quenchers that protect the photosynthetic apparatus from photodamage. It is not clear why this unusual form of energy transduction is carried out at 1% SAP at high SWC but it supports photoprotection by the shown reduction in the ETR in PS (II) (Figure 3D) and the otherwise possible increase in the ETR/Agross (Table 1). It can be assumed that this response, in agreement with Hypothesis 2, is an indicator of a higher water requirement at high SWC of 1% SAP than of control plants and an incipient undersupply of the former.
- Impact of soil additives at reduced SWC on PS (II) and proton flow of photosynthesis
In agreement with the expectations, the reduction in soil water availability in all low SWC treatments, with the exception of 1% SAP, led to a decrease in the quantum yield of PS II (Y (II) (Figure 3A) and to an increase in non-photochemical quenching Y (NPQ) (Figure 3B). The neglectable increase in 1% SAP can be attributed to the early response of the 1% SAP treatment at high SWC (see above).
To prevent damage from photosynthesis, the supply and demand of electrons must be regulated to maintain a balance. However, drought stress impairs the activity of PS I and PS II, which can lead, among other things, to an increase in over-reduction on the PS I acceptor side. One way to reduce PS I acceptor over-reduction while reducing electron demand would be the adjustment of the cyclic electron flows [14]. The electrons in the cyclic electron flow are not passed on to NADP reductase but return to oxidized PS I and absorb light energy again. This energy is used to transport protons to the thylakoid lumen and increase the proton motive force. Huang et al. [95] show that the use of cyclic electron flow during drought stress provides effective protection against over-reduction on the PS I acceptor side.
However, as shown for the 1% SAP treatment at high SWC before, the significant increase in Y(NPQ) at all other low SWC treatments was accompanied by a significant decrease in ECStmAu (Indicator of pH gradient), ECStmAu × gH+ (indicator of electrical potential across the membrane) gH+ (indicator of proton conductivity of the thylakoid membrane) and vH+ (steady state proton flux) (Figure 5). Thus, it appears, after [94], that any environmental condition that increases the reduction state of QA will improve the probability of photoprotection in Quinoa through reaction center quenching. Ivanov et al. [94] argued that the accumulation of reduced QA increases the probability for non-radiative charge recombination within the PS II reaction center with a concomitant decrease in the yield of thermoluminescence.
However, the dissipation of excess excitation to prevent oxidative stress was highest in both SAP treatments. In contrast, at low SWC, the 3% BC treatment showed Y (II) and Y (NPQ) values similar to the control at low SWC but higher gH+, vH+, ECStmAu and ECStmAu × gH+ values, indicating a higher transfer of excess light energy on ATP synthesis. This result indicates that PS II was less affected under these conditions by the addition of BC than both SAP (1%; 0.1%) treatments.
The decreases in quantum yield of PS II (Y (II) (Figure 5A), leaf water potential (Figure 2) and ETR (Figure 3D) are typical responses of plants to water deficiency. However, Y (II) and ETR were more reduced in water deficiency in plants treated with SAP (1%; 0.1%) than in those treated without amendment or with biochar (3%). Derbali et al. [91] showed that a reduced photosynthetic efficiency and ETR are not necessarily a sign of a destructive effect. In fact, this reaction is even important when the energy demand of the non-light-depended reaction is also reduced.
- Impact of soil additives on PS (I) at high SWC
Plants use photosystems I and II (PSI/II) to transfer electrons along the linear electron transfer (LET) chain to NADP+ and to produce a proton gradient to drive ATP synthesis [96]. Under (stromal redox) pressure: NADP+ synthesis controls photosystem I. To measure the fraction of active reaction centers of PS I, we used a saturation pulse followed by light irradiation [97]. Treatment with 0.1% SAP and 3% BC, in comparison to the wet control treatment (SWC↑), had no significant impact on the sunlight-driven transmembrane electron transport: the oxidation of plastocyanin in the inner side of the thylakoid membrane and the reduction in ferredoxin in the stroma [98]. The present results showed that plants of the control, 0.1% SAP and 3% BC treatments had significantly higher fractions of open reaction centers than plants of the 1% SAP treatment (Figure 4B). This one was balanced by an increased fraction of oxidized reaction centers (Figure 4A). This recurring peculiarity of 1% SAP fits well with Hypothesis 3 that non-photochemical energy quenchers in 1% SAP reduce the LET from PS (II) to PS (I) in preparation for a further reduced water supply [94,95,96] and effective protection against over-reduction on the PS I acceptor side.
- Impact of soil additives on PS (I) at reduced SWC
Water deficiency (SWC↓) led to a reduction in electron uptake of PS I via open reaction centers in all treatments with the exception of 1% SAP. This one was already low at 1% SAP. We interpret the already low fraction of open centers of the 1% SAP treatment at high SWC at a preadaptation to reduced water availability (see Hypothesis 3). This decreasing ability to absorb electrons from PS II correlated with the decrease in quantum yields (Y (II)) and ETR. Lima-Melo et al. [99] reported that an imbalance between the electrons from the ETR and acceptor sides of the photosystem I can lead to a PS I photoinhibition. To determine the state of PS I, it is useful to examine the oxidized reaction centers (Figure 4A). We could show the in the mean highest fraction of over reduced centers in plants treated with SAP (1%; 0.1%). A reduction in water content led only in these both treatments to a decrease in open centers (Figure 4B), followed by an increase in over reduced centers (Figure 4C). It can be assumed that an increase in the fraction in over-reduced center can provide evidence for possible oxidative stress (Figure 4C). The so-called PS I photoinhibition is a lethal event for oxygenic phototrophs, and it is prevented by keeping the reaction center chlorophyll (P700) oxidized in excess light conditions [100,101]. Therefore, it can be assumed that the highest danger for a disproportionate supply of electrons at the PS I and oxidative stress occurs at 0.1% SAP and 1% SAP. Additionally, the non-photochemical energy quenchers [94] seem not to be effective enough to avoid the above discussed protection at 1% SAP against over-reduction on the PS I acceptor side.
- Light independent reactions of photosynthesis
- Impact of soil additives at high SWC
The addition of 3% BC at high SWC contrary to Hypothesis 2 had hardly any impact on the CO2/H2O gas exchange (Table 1). However, SAP amendment in both treatments (0.1% SAP and 1% SAP), in accordance with Hypothesis 2, caused a significant reduction in RD, RL and increase in ETR/Agross and WUE. The last one was reached in the 1% SAP treatment by a low ETR and in the 0.1% SAP treatment by a significant increase in Cs and Anet (control high SWC: 10.1 and 0.1% SAP high SWC: 14.8 CO2 µmol m−2 s−1). The combination of these changes according to Hypothesis 3 can be interpreted as a priming effect or a positive impact of eustress on CO2/H2O gas exchange. Effective application of eustress (positive stress), such as mild water deficit or nutritional stress, can provoke tailored plant responses including the activation of physiological and molecular mechanisms and the strategic accumulation of bioactive compounds such as proline necessary for adaptation to suboptimal environments [102]. A study on Arabidopsis thaliana showed a hormetic response of the effective quantum yield of PS II to mild water deficit and the activation of ROS defense responses [103]. The results of quinoa at 0.1% SAP and 1% SAP confirm the assumption of eustress in the present study. A significant increase in the WUE together with a decrease in ETR/Agross point to an adjustment of the CO2/H2O gas exchange. Sepehri et al. [104] suggest that uncertainty exists regarding water accessibility for plants when SAP are utilized. This may lead to competition for water absorption between plants and SAP, potentially reducing the amount of water available for plants [105]. Unlike SAP, there was no proof of any eustress at high SWC when BC was added to the soil, not even a change in the proline content (Figure 8).
- Impact of reduced SWC on light independent reactions of photosynthesis of the control plants
Previous studies have shown that the rate of photosynthetic CO2 assimilation (Anet) is influenced by a decrease in relative water content and leaf water potential [106]. Environmental stress such as water shortage decreased the CO2 assimilation rate in barley leaves due to reduced stomatal conductance [107,108]. In line with these results, the present study also showed a decrease in CO2 assimilation of the control of Quinoa at low SWC condition. This reduction was accompanied by a decreased ETR and a significant increase in the ETR/Agross ratio and a higher risk of oxidative stress [99]. Drought affects both the H2O and the CO2 uptake of the plant. As a primary resource for plant growth and productivity, H2O and CO2 are directly or indirectly involved in photosynthesis [109]. Plant leaf CO2/H2O exchange and water use efficiency (WUE), the ratio of net photosynthesis (Anet) to transpiration (E) are main parameters for estimating plant response, survival and productivity as well as for planning water use in arid and semi-arid area [109]. In the present study, Quinoa responded in with a significant increase in the WUE because of a greater reduction in E than in Anet (Table 1). The latter was supported by a reduction in the Ci/Catm ratio and a more efficient CO2 assimilation at closed stomata. There was a correlation between the decrease in Cs and a decrease in transpiration (E) and a reduction in Anet at low SWC (Table 1).
- Impact of soil additives at reduced SWC on light independent reactions of photosynthesis
In contrast to previous studies, the addition of BC and 1% SAP, in comparison to the control, caused no significant increase in stomatal conductance (Cs), transpiration (E) and CO2 fixation at low SWC [91,110]. The 1% SAP treatment even had a significant negative impact on Anet and ETR/Agross ratio (Table 1). However, the treatment at 0.1% SAP (low SWC) caused a significant increase in the WUE (control low SWC: 7.90 and 0.1% SAP low SWC: 10.45 µmol CO2/mmol H2O) due to a disproportionate reduction in stomatal conductivity Cs and a significantly higher reduction in E (control low SWC: 0.95 and 0.1% SAP low SWC: 0.48 mmol H2O m−2 s−1). In accordance with [111], the decrease in stomatal conductance during water shortage (Table 1) correlates with the decrease in leaf water potential (Figure 2), which significantly decreased in the present study in quinoa plants treated with 0.1% SAP. In addition, plants of this treatment also showed a significantly higher increase in the water use efficiency during drought than the control (Table 1). It can be assumed that 0.1% SAP had an additional impact on the active and effective adaption of the CO2/H2O gas exchange of quinoa plants at reduced SWC. Previous studies have already shown that the addition of SAP can improve the WUE, stomatal conductance and photosynthetic activity during water shortage [62].
The different responses of plants to 0.1% and 1% SAP are presumably caused by an increasing competition for water between plant and soil with increasing SAP concentration. In agreement with [25], the decrease in Anet at 1% SAP at low SWC correlated well with the decrease in photochemical quantum yield of PS II (Y (II) and ETR at low SWC (Figure 3D).
- Indicator of oxidative stress
Finally, plants of all treatments in response to reduced water supply showed a significant increase in ETR/Agross and MDA at low SWC. These results of both parameters are indicators for higher risk of oxidative stress [99] and show that the drought avoidance mechanisms were not sufficient to prevent oxidative stress. Increased ROS generations at water shortage condition according to [91] are indicated by higher levels of lipid peroxidation, significantly higher levels of antioxidant activities, and high proline levels.
- Impact of soil additives on MDA content
Increased lipid peroxidation in the form of MDA (malondialdehyde) accumulation serves as an indicator of oxidative damage that can be caused by the synthesis and accumulation of reactive oxygen species (ROS) under drought stress [112]. It can be assumed that only the addition of biochar mitigated oxidative stress levels under drought conditions (Figure 6). Previous studies have shown that biochar amendment significantly decreased the content of MDA, O2•− and H2O2 in the leaves of Malus hupehensis Rehd. [113]. According to the present study (Figure 6), the MDA concentration in plants treated with biochar (3%) was remarkably lower (~50%) than in the control group, even when water supply was sufficient. Furthermore, there was no significant increase in MDA at low SWC. The presented results agree with the results of [114], who reported that the addition of BC reduced the MDA concentration both under normal irrigation and during drought stress. These results confirm the assumption that the addition of biochar mitigated oxidative stress levels under drought conditions by regulating photosynthetic systems, thereby preventing over reduction on the acceptor side of photosystem I.
Cao et al. [115] showed that the addition of SAP (0.1% until 0.4% SAP) could also improve the drought resistance of Cynodon dactylon (L.) seedlings. The MDA concentration decreased significantly in Cynodon dactylon (L.) at concentrations between 0.1% until 0.4% SAP either at sufficient or limited water supply. However, we were not able to confirm this positive impact of SAP in the present study. The MDA content of quinoa leaves was in all SAP treatments under both irrigation regimes at least as high as in the control plants (Figure 6). It can be assumed that the offered soil water contents led to a competition between plants and SAP for water absorption, which potentially decreases the amount of water available for plants [105]. Sepehri et al. [104] suggested that uncertainty exists regarding water accessibility for plants when SAP are utilized. This may lead to competition between plants and SAP for water absorption, potentially reducing the amount of water available for plants [105]. Therefore, the ability of SAP to store various amounts of water within itself, and thus in the soil, could not be used to improve but to reduce the water availability for plants [116]. This assumption also fits with the response of SAP-treated plants (0.1% and 1%) at low SWC where quinoa was neither able to hinder over reduction in PS I nor to prevent a higher ROS accumulation at low SWC. It seems that optimal plant growth on soil with SAP amendment depends on higher soil water content than control plants and that the application of an appropriate SAP concentration is crucial to ensure optimal growth conditions [117].
Another reason for the missing improvement of the drought resistance of quinoa may be the interaction of soil and SAP due to the physiochemical properties of the soil as well as the chemical properties of SAP. The last one is not only its variation in water absorbing capacity (WAC) but also the possibly negative impact on ion composition in soil water since SAP are cation-absorbing polymers [65,118].
Furthermore, factors such as soil structure, temperature, pH and mineral composition in the water may have impact on the efficiency of SAP, their water retention capacity and overall performance [119].
- Impact of soil additives on Carbon, nitrogen (C/N ratio)
The SAP Stockosorb® is a potassium-based nutrient-free co-polymer [120]. SAP’ primary function is to improve water and nutrient retention in the soil. However, when used in soil, hydrophilic polymers like Stockosorb® can influence the overall C/N ratio of the soil by holding water and nutrients. By retaining water and nutrients, it can indirectly influence the soil’s C/N balance over time and affect nutrient availability for plants which can affect plant growth and nutrient cycling. Biochar is known as soil improver but with the side effect to reduce the plant-available nitrogen (N) owing to their high carbon (C) content, which usually results in N-immobilization in soil [51]. Several recent analyses [121,122,123] showed that reduction in soil N is a widespread response to biochar application. Nguyen et al. [121] found biochar application decreased NH4–N by an average of 11% and NO3–N by 10%. In agreement with these studies and Hypothesis 5, we could show that mainly the addition of SAP (0.1% and 1% SAP) but also of 3% BC led to a significant decrease in the leaf N content and leaf C/N ratio at high SWC (Figure 7). There also seems to be a clear negative correlation between a higher SAP content in the soil and C/N ratio and N content in the leaf (Figure 7) at low SWC. It was found out that low N-concentrations in plant tissues as shown for 1% SAP (Figure 7B) can contribute to changes in leaf photosynthetic capacity, in transpiration fluxes and in WUE, which has consequences for C sequestration capacity [124]. However, besides no significant reduction in the N-content in the control and the 1% SAP at reduced SWC, in the present study, we also found a non-significant increase in the leaf N-content in the 0.1% SAP and a significant increase in the 3% BC treatment at reduced SWC. It can be assumed that the increase in N-content and the related decrease in the C/N ratio caused in these two treatments the upregulation of the adaptation mechanisms of plants against oxidative stress but on cost of biomass production (see Hypothesis 6). One indicator for this N-dependent upregulation was an increased proline accumulation in both treatments. Furthermore, it is clear that plants treated with 1% SAP have difficulties to absorb and accumulate nitrogen (Figure 7), which confirms the assumption of a plant-SAP competition for nitrogen. Together with the antioxidant enzymes, the non-enzymatic antioxidant defense represents a major ROS-scavenging force and eminent importance [125].
- Impact of soil additives on Proline content
Plants of all high SWC treatments showed equally low proline values. There was no clear correlation between proline content and N-content or C/N ratio in leaves of quinoa plants at high SWC. It is well known that quinoa plants respond to drought stress with various stress avoidance mechanisms, including ROS detoxification and the accumulation of protective proteins and solutes such as proline [35]. This is also confirmed by the present study. High SWC especially in plants treated with 3% BC or 0.1% SAP led to more than twice or three times higher proline contents (Figure 8) as part of the upregulation of the adaption mechanisms of plants und oxidative stress. It can be assumed that the addition of 0.1% SAP and 3% BC enables plants to synthesize proline to protect cell functions by scavenging reactive oxygen species [126]. Consequently, it can be assumed that the low increase in the proline content in leaf tissues of the water deficient control or 1% SAP treatments can be explained by disturbances in the regulation of ROS defense. This problem might be enhanced at 1% SAP (high SWC) by insufficient nitrogen supply (Figure 7). Moreover, studies of [127,128] have indicated that SAP can absorb various cations, which may potentially affect plant growth dynamics [104]. Situ et al. [129] demonstrated that cation exchange between potassium-based SAP can result in excessive accumulation of K+, reducing plant development, root biomass, length, and area, while also causing deficiencies in Ca2+ and Mg2+. This interaction may have also affected the efficiency of SAP in the present study under water shortage conditions. In contrast to 1% SAP, in this study, it is shown that the amendment of biochar significantly reduced oxidative stress caused by non-enzymatic ROS response of quinoa during water shortage. It can be assumed that plants treated with biochar were protected from harmful conditions through an improved soil environment (see MDA content). Ref. [130] reported that soil conditions may prime the organism for an improved response to subsequent stress. For example, exposing a plant to mild abiotic stress can improve its resistance to stress that occurs later, such as severe drought. This optimized environment of plants by biochar (3%) may have supported an increased resistance of quinoa to further and more severe reductions in water supply. Compared to both SAP treatments (1%; 0.1%), the lower ROS damage (Figure 6) in the biochar treatment at reduced SWC can in part be explained by the support of N-accumulation and the therefore also possible increase in proline content (Figure 8) as a carbon and nitrogen reservoir to protect the plant from free radical damage and to maintain osmotic balance between the cell vacuole and cytoplasm in the plant cell in combination with an avoidance of over-reduction in PS I centers (Figure 4C) and successful dissipation of light energy.
5. Summary and Conclusions
The purpose of this study was to determine the impact of BC and SAP on the biomass production, extent and intensity of plants’ efforts to water deficit. At the beginning of the study, six hypotheses were formulated to prove which properties the two soil additives BC and SAP share besides a high potential to improve soil parameter in dry regions, as well as their disadvantages and limitations. In summary, the examination of the six hypotheses yielded the following statements:
- −
- Hypothesis (1): BC and SAP effect a negative growth response when the smallest possible amount of irrigation necessary for optimal growth of the control is applied: It is shown, in accordance with hypotheses 1 and 6, that plants grown at low SWC switched at 0.1% SAP and 3% BC from preferred growth (e.g., biomass production) to long survival (e.g., enhanced resilience). The strategy behind this plant response of the plant could be, at least partly, to compensate for this reduction in growth rate by extending the duration of growth.
- −
- Hypothesis (2): The increase in WHC caused by the addition of additives such as BC or SAP will result in a higher water demand as in control plants and even at high SWC to symptoms of drought stress: Unexpectedly, but in accordance with Hypothesis 2, the treatment with 1% SAP even at high SWC led to a decrease in Y (II) and an increase in Y (NPQ) (Figure 3). Dissipation of excess absorbed light energy through zeaxanthin- and ΔpH-dependent photo-system II antenna quenching is considered the major mechanism for non-photochemical quenching and photoprotection. However, the significant increase in Y (NPQ) was accompanied at 1% SAP (high SWC) by a significant decrease in ECStmAu, ECStmAU*H+, gH+ and vH+. This phenomenon can be explained by mounting evidence of a zeaxanthin-independent pathway for dissipation of excess light energy based within the PS II reaction center that may also play a significant role in photoprotection. It can be assumed that this response, in agreement with Hypothesis 2, is an indicator of a higher water requirement at high SWC of 1% SAP than of control plants and an incipient undersupply of the former. The addition of 3% BC at high SWC, contrary to Hypothesis 2, had hardly any impact on the CO2/H2O gas exchange. However, SAP amendment in both treatments (0.1% SAP and 1% SAP), in accordance with Hypothesis 2, caused a significant reduction in RD, RL and increase in ETR/Agross and WUE.
- −
- Hypothesis (3): The soil additives SAP or BC may prime quinoa for an improved response to subsequent stress at low soil water content: The explanations for Hypothesis 2 can also be interpreted, according to Hypothesis 3, as a priming effect or a positive impact of eustress on CO2/H2O gas exchange. The present results showed that plants of the control, 0.1% SAP and 3% BC treatments had significantly higher fractions of open reaction centers than plants of the 1% SAP treatment. The last one was balanced by an increased fraction of oxidized reaction centers. This recurring peculiarity of 1% SAP fits well with Hypothesis 3 that non-photochemical energy quenchers reduce in 1% SAP the LET from PS (II) to PS (I) in preparation for a further reduced water supply and effective protection against over-reduction on the PS I acceptor side. Water deficiency led to a reduction in electron uptake of PS I via open reaction centers in all treatments, with the exception of 1% SAP. This one was already low at 1% SAP. We interpret the already low fraction of open centers at high SWC at 1% SAP as a preadaptation to reduced water availability. This decreasing ability to absorb electrons from PS II correlated with the decrease in quantum yields (Y (II)) and ETR. It can be assumed that an imbalance between the electrons from the ETR and acceptor sides of the photosystem I can lead to a PS I photoinhibition.
- −
- Hypothesis (4): Harmful competition of water absorption between plants and the soil additives BC and SAP may bring about adverse effects at low soil water content: It could be shown that 3% BC and 0.1% SAP can cause a reduction in plant dry weight at high and reduced SWC. This effect can at least partially be explained by the enhanced capacity of soils to bind water in the soil and to reduce soil water potential.
- −
- Hypothesis (5): The plant’s ability to handle oxidative stress is linked to its nitrogen (N) uptake and metabolism: Several recent analyses have shown that reduction in soil N is a widespread response to biochar application. In agreement with Hypothesis 5, it is shown that mainly the addition of SAP (0.1% and 1% SAP), but also of 3% BC, led to a significant decrease in the leaf N content and leaf C/N ratio at high SWC (Figure 7). There seems to be a clear negative correlation between a higher SAP content in the soil and C/N ratio and N content in the leaf at low SWC.
- −
- Hypothesis (6): When quinoa needs to decide at low SWC between either growth or long survival it, will choose the latter: Besides no significant reduction in the N-content in the control and the 1% SAP at low SWC in the present study, we could also observe a tendency for increasing leaf N-content in the 0.1% SAP and a significant increase in the 3% BC treatment at reduced SWC. It can be assumed that the increase in N-content and the related decrease in the C/N ratio in the last two treatments ensure the upregulation of the adaptation mechanisms of plants under oxidative stress but on cost of growth. One indicator for this N-dependent upregulation was an increased proline accumulation in both treatments.
It is shown that the response of the test species Chenopodium quinoa to the addition of BC and SAP proved to be extraordinarily flexible, including fine-tuning to the specific soil conditions. The plant reacted with highly coordinated measures to both the danger of oversupply of SAP soil amendments and water shortage. The targeted adaptation to limited water supply became particularly evident in the 3% BC and 0.1% SAP treatments, among other things, by increased WUE and proline contents. However, BC also had a mitigating effect on the level of reactive oxygen species (ROS). It can be assumed that this effect is based on a more plant-compatible, less one-sided ion composition of BC. Due to the positive effects of biochar on plant adaptation and survivability at water shortage, the use of biochar is recommended. However, the application of SAP in conjunction with biochar may further improve soil properties and the physiological status of quinoa at water shortage. Management practices such as the presented ones play an essential role in soil water and nutrient storage and, by taking the soil conditions into consideration, there is an essential need to combine them with other soil amendments like hydrochar, compost or fertilizer and study their impact on plant response to water shortage.
Author Contributions
Conceptualization, N.K. and H.-W.K.; methodology, N.K. and H.-W.K.; software, N.K. and H.-W.K.; validation, N.K.; formal analysis, N.K. and H.-W.K.; investigation, N.K. and H.-W.K.; resources, H.-W.K.; data curation, N.K.; writing—original draft preparation, N.K.; writing—review and editing, H.-W.K.; visualization, N.K.; supervision, H.-W.K.; project administration, H.-W.K.;. All authors have read and agreed to the published version of the manuscript.
Funding
This research received no external funding.
Data Availability Statement
The original contributions presented in this study are included in the article. Further inquiries can be directed to the corresponding author.
Acknowledgments
The authors thank Pieter Andreas Lennard Claas for reviewing the English language and style of the manuscript and for editing our manuscript.
Conflicts of Interest
The authors declare no conflicts of interest.
Abbreviations
Agross (gross photosynthesis); Anet (net photosynthesis); BC (biochar); CEC (cation exchange capacity); Ci/Catm ratio (carbon intercellular/carbon atmospheric ratio); C/N ratio (carbon/nitrogen ratio); Cs (stomatal conductivity); ctr (control); dw (dry weight); E (transpiration); ECStmAu (electrochromic shift); ECStmAu × gH+ (indicator of the proton transport through the thylakoid membrane); ETR (electron transport rate); fw (fresh weight); gH+ (proton conductivity); LOP (leaf osmotic potential); LWP (leaf water potential); MDA (malondialdehyde); NUE (nutrient use efficiency); PS I/II (photosystem I/II); QA (quinon); RD (dark respiration); RL (light respiration); ROS (reactive oxygen species); SAP (superabsorbent polymers); SPAC (soil-plant-atmosphere-continuum); SWC (soil water content); TBA (Thiobarbituric acid); TCA (Trichloracetic acid); vH+ (steady-state rate of proton flux); WC (water content); WUE (water use efficiency), Y (II) photochemical quantum yield of PS II; Y (NPQ) (non-photochemical energy loss in PS II); Y (NO) (non-regulated non-photochemical energy loss in PS II).
References
- IPCC. Summary for Policymakers. In Climate Change 2023: Synthesis Report. Contribution of Working Groups I, II and III to the Sixth Assessment Report of the Intergovernmental Panel on Climate Change; Core Writing Team, Lee, H., Romero, J., Eds.; IPCC: Geneva, Switzerland, 2023; pp. 1–34. [Google Scholar] [CrossRef] [Scilit]
- Trenberth, K.E. Changes in precipitation with climate change. Clim. Res. 2011, 47, 123–138. [Google Scholar] [CrossRef] [Scilit]
- Dai, A.; Zhao, T.; Chen, J. Climate Change and Drought: A Precipitation and Evaporation Perspective. Curr. Clim. Change Rep. 2018, 4, 301–312. [Google Scholar] [CrossRef] [Scilit]
- Greve, P.; Seneviratne, S.I. Assessment of future changes in water availability and aridity. Geophys. Res. Lett. 2015, 42, 5493–5499. [Google Scholar] [CrossRef] [Scilit]
- Samaniego, L.; Thober, S.; Kumar, R.; Wanders, N.; Rakovec, O.; Pan, M.; Zink, M.; Sheffield, J.; Wood, E.F.; Marx, A. Anthropogenic warming exacerbates European soil moisture droughts. Nat. Clim. Change 2018, 8, 421–426. [Google Scholar] [CrossRef] [Scilit]
- Ruiz, K.; Biondi, S.; Oses, R.; Acuña-Rodríguez, I.; Antognoni, F.; Martinez-Mosqueira, E.; Coulibaly, A.; Canahua-Murillo, A.; Pinto, M.; Zurita-Silva, A.; et al. Quinoa biodiversity and sustainability for food security under climate change. A review. Agron. Sustain. Dev. 2014, 34, 349–359. [Google Scholar] [CrossRef] [Scilit]
- Grillakis, M.G. Increase in severe and extreme soil moisture droughts for Europe under climate change. Sci. Total Environ. 2019, 660, 1245–1255. [Google Scholar] [CrossRef] [Scilit]
- Corwin, D.L. Climate change impacts on soil salinity in agricultural areas. Eur. J. Soil. Sci. 2021, 72, 842–862. [Google Scholar] [CrossRef] [Scilit]
- Huang, J.; Hartemink, A.E. Soil and environmental issues in sandy soils. Earth-Sci. Rev. 2020, 208, 103295. [Google Scholar] [CrossRef] [Scilit]
- Fita, A.; Rodríguez-Burruezo, A.; Boscaiu, M.; Prohens, J.; Vicente, O. Breeding and Domesticating Crops Adapted to Drought and Salinity: A New Paradigm for Increasing Food Production. Front. Plant Sci. 2015, 6, 978. [Google Scholar] [CrossRef] [Scilit] [PubMed]
- Begna, T. Effects of drought stress on crop production and productivity. Int. J. Res. Stud. Agric. Sci. 2020, 6, 34–43. [Google Scholar] [CrossRef] [Scilit]
- Farooq, M.; Wahid, A.; Lee, D.J. Exogenously applied polyamines increase drought tolerance of rice by improving leaf water status, photosynthesis and membrane properties. Acta Physiol. Plant. 2009, 31, 937–945. [Google Scholar] [CrossRef] [Scilit]
- Qiao, M.; Hong, C.; Jiao, Y.; Hou, S.; Gao, H. Impacts of Drought on Photosynthesis in Major Food Crops and the Related Mechanisms of Plant Responses to Drought. Plants 2024, 13, 1808. [Google Scholar] [CrossRef] [Scilit]
- Zhou, R.; Kan, X.; Chen, J.; Hua, H.; Li, Y.; Ren, J.; Feng, K.; Liu, H.; Deng, D.; Yin, Z. Drought-induced changes in photosynthetic electron transport in maize probed by prompt fluorescence, delayed fluorescence, P700 and cyclic electron flow signals. Environ. Exp. Bot. 2019, 158, 51–62. [Google Scholar] [CrossRef] [Scilit]
- Graßes, T.; Pesaresi, P.; Schiavon, F.; Varotto, C.; Salamini, F.; Jahns, P.; Leister, D. The role of ΔpH-dependent dissipation of excitation energy in protecting photosystem II against light-induced damage in Arabidopsis thaliana. Plant Physiol. Biochem. 2002, 40, 41–49. [Google Scholar] [CrossRef] [Scilit]
- Anjum, S.A.; Wang, L.; Farooq, M.; Khan, I.; Xue, L. Methyl Jasmonate-Induced Alteration in Lipid Peroxidation, Antioxidative Defence System and Yield in Soybean Under Drought. J. Agron. Crop Sci. 2011, 197, 296–301. [Google Scholar] [CrossRef] [Scilit]
- Esterbauer, H.; Schaur, R.J.; Zollner, H. Chemistry and biochemistry of 4-hydroxynonenal, malonaldehyde and related aldehydes. Free Radic. Biol. Med. 1991, 11, 81–128. [Google Scholar] [CrossRef] [Scilit] [PubMed]
- Sharma, P.; Jha, A.B.; Dubey, R.S.; Pessarakli, M. Reactive Oxygen Species, Oxidative Damage, and Antioxidative Defense Mechanism in Plants under Stressful Conditions. J. Bot. 2012, 2012, 217037. [Google Scholar] [CrossRef] [Scilit]
- Halliwell, B.; Gutteridge, J.M.C. Free Radicals in Biology and Medicine; Oxford University Press: Oxford, UK, 1989. [Google Scholar]
- Yamauchi, Y.; Furutera, A.; Seki, K.; Toyoda, Y.; Tanaka, K.; Sugimoto, Y. Malondialdehyde generated from peroxidized linolenic acid causes protein modification in heat-stressed plants. Plant Physiol. Biochem. 2008, 46, 786–793. [Google Scholar] [CrossRef] [Scilit] [PubMed]
- Gammans, M.; Mérel, P.; Ortiz-Bobea, A. Negative impacts of climate change on cereal yields: Statistical evidence from France. Environ. Res. Lett. 2017, 12, S239–S286. [Google Scholar] [CrossRef] [Scilit]
- Carrão, H.; Naumann, G.; Barbosa, P. Mapping global patterns of drought risk: An empirical framework based on sub-national estimates of hazard, exposure and vulnerability. Glob. Environ. Change 2016, 39, 108–124. [Google Scholar] [CrossRef] [Scilit]
- Wen, W.; Timmermans, J.; Chen, Q.; van Bodegom, P.M. A Review of Remote Sensing Challenges for Food Security with Respect to Salinity and Drought Threats. Remote Sens. 2021, 13, 6. [Google Scholar] [CrossRef] [Scilit]
- Zeifman, L.; Hertog, S.; Kantorova, V.; Wilmoth, J. A World of 8 Billion. United Nations Department of Economic and Social Affairs. 2022. Available online: https://www.un.org/development/desa/dpad/wp-content/uploads/sites/45/publication/PB_140.pdf (accessed on 29 January 2026).
- Hinojosa, L.; González, J.A.; Barrios-Masias, F.H.; Fuentes, F.; Murphy, K.M. Quinoa Abiotic Stress Responses: A Review. Plants 2018, 7, 106. [Google Scholar] [CrossRef] [Scilit] [PubMed]
- FAO; CIRAD. State of the Art Report on Quinoa Around the World in 2013; Bazile, D., Bertero, H.D., Nieto, C., Eds.; Food and Agriculture Organization of the United Nations (FAO): Santiago, Chile, 2015; Available online: https://agritrop.cirad.fr/575489/1/document_575489.pdf (accessed on 29 January 2026).
- Vega-Gálvez, A.; Miranda, M.; Vergara, J.; Uribe, E.; Puente, L.; Martínez, E.A. Nutrition facts and functional potential of quinoa (Chenopodium quinoa Willd.), an ancient Andean grain: A review. J. Sci. Food Agric. 2010, 90, 2541–2547. [Google Scholar] [CrossRef] [Scilit]
- Pereira, E.; Encina-Zelada, C.; Barros, L.; Gonzales-Barron, U.; Cadavez, V.; Ferreira, I.C.F.R. Chemical and nutritional characterization of Chenopodium quinoa Willd (quinoa) grains: A good alternative to nutritious food. Food Chem. 2019, 280, 110–114. [Google Scholar] [CrossRef] [Scilit] [PubMed]
- Ain, Q.T.; Siddique, K.; Bawazeer, S.; Ali, I.; Mazhar, M.; Rasool, R.; Mubeen, B.; Ullah, F.; Unar, A.; Jafar, T.H. Adaptive mechanisms in quinoa for coping in stressful environments: An update. PeerJ 2023, 11, e14832. [Google Scholar] [CrossRef] [Scilit] [PubMed]
- Bhargava, A.; Shukla, S.; Ohri, D. Chenopodium quinoa—An Indian perspective. Ind. Crops Prod. 2006, 23, 73–87. [Google Scholar] [CrossRef] [Scilit]
- Jacobsen, S.E.; Liu, F.; Jensen, C.R. Does root-sourced ABA play a role for regulation of stomata under drought in quinoa (Chenopodium quinoa Willd.). Sci. Hortic. 2009, 122, 281–287. [Google Scholar] [CrossRef] [Scilit]
- Sun, Y.; Liu, F.; Bendevis, M.; Shabala, S.; Jacobsen, S.-E. Sensitivity of Two Quinoa (Chenopodium quinoa Willd.) Varieties to Progressive Drought Stress. J. Agron. Crop Sci. 2013, 200, 12–23. [Google Scholar] [CrossRef] [Scilit]
- Pérez-López, U.; Robredo, A.; Lacuesta, M.; Mena-Petite, A.; Muñoz-Rueda, A. The impact of salt stress on the water status of barley plants is partially mitigated by elevated CO2. Environ. Exp. Bot. 2009, 66, 463–470. [Google Scholar] [CrossRef] [Scilit]
- Chen, T.; Chen, Y.; Wang, X.; Zhang, L. Osmotic adjustment in roots and leaves of two cotton cultivars with different tolerance to soil salinity. Biomed. J. Sci. Tech. Res. 2019, 15, 1–11. [Google Scholar] [CrossRef] [Scilit]
- Saddiq, M.S.; Wang, X.; Iqbal, S.; Hafeez, M.B.; Khan, S.; Raza, A.; Iqbal, J.; Maqbool, M.M.; Fiaz, S.; Qazi, M.A.; et al. Effect of Water Stress on Grain Yield and Physiological Characters of Quinoa Genotypes. Agronomy 2021, 11, 1934. [Google Scholar] [CrossRef] [Scilit]
- Schweiger, A.H.; Zimmermann, T.; Poll, C.; Marhan, S.; Leyrer, V.; Berauer, B.J. The need to decipher plant drought stress along the soil–plant–atmosphere continuum. Oikos 2023, 2023, e10136. [Google Scholar] [CrossRef] [Scilit]
- Philip, J.R. Plant water relations: Some physical aspects. Annu. Rev. Plant Physiol. 1966, 17, 245–268. [Google Scholar] [CrossRef] [Scilit]
- Alkharabsheh, H.M.; Seleiman, M.F.; Battaglia, M.L.; Shami, A.; Jalal, R.S.; Alhammad, B.A.; Almutairi, K.F.; Al-Saif, A.M. Biochar and Its Broad Impacts in Soil Quality and Fertility, Nutrient Leaching and Crop Productivity: A Review. Agronomy 2021, 11, 993. [Google Scholar] [CrossRef] [Scilit]
- Dubrovina, I. Biochar has Different Effects on Soil Fertility and Spring Barley Productivity in Two Boreal Soils with Contrasting Textures. Agric. Res. 2025, 1–13. [Google Scholar] [CrossRef] [Scilit]
- Hossain, M.Z.; Bahar, M.M.; Sarkar, B.; Donne, S.W.; Ok, Y.S.; Palansooriya, K.N.; Kirkham, M.B.; Chowdhury, S.; Bolan, N. Biochar and its importance on nutrient dynamics in soil and plant. Biochar 2020, 2, 379–420. [Google Scholar] [CrossRef] [Scilit]
- Naz, Z.; Jahan, S.; Rashid, A.; Kamran, A.; Abd-Allah, E.F.; Avila-Quezada, G.D.; Hashem, A. Efficacy of modified biochar for enhancing maize photosynthesis and yield under various irrigation regimes. Sci. Rep. 2025, 15, 32216. [Google Scholar] [CrossRef] [Scilit]
- Kammann, C.I.; Linsel, S.; Gößling, J.W.; Koyro, H.-W. Influence of biochar on drought tolerance of Chenopodium quinoa Willd and on soil–plant relations. Plant Soil 2011, 345, 195–210. [Google Scholar] [CrossRef] [Scilit]
- Paneque, M.; De la Rosa, J.M.; Franco-Navarro, J.D.; Colmenero-Flores, J.M.; Knicker, H. Effect of biochar amendment on morphology, productivity and water relations of sunflower plants under non-irrigation conditions. Catena 2016, 147, 280–287. [Google Scholar] [CrossRef] [Scilit]
- Uzoma, K.C.; Inoue, M.; Andry, H.; Fujimaki, H.; Zahoor, A.; Nishihara, E. Effect of cow manure biochar on maize productivity under sandy soil condition. Soil Use Manag. 2011, 27, 205–212. [Google Scholar] [CrossRef] [Scilit]
- Xu, C.Y.; Hosseini-Bai, S.; Hao, Y.; Rachaputi, R.C.N.; Wang, H.; Xu, Z.; Wallace, H. Effect of biochar amendment on yield and photosynthesis of peanut on two types of soils. Environ. Sci. Pollut. Res. 2015, 22, 6112–6125. [Google Scholar] [CrossRef] [Scilit]
- Rawat, J.; Saxena, J.; Sanwal, P. Biochar: A Sustainable Approach for Improving Plant Growth and Soil Properties; IntechOpen: London, UK, 2019. [Google Scholar] [CrossRef] [Scilit]
- Zhang, Y.; Ding, J.; Wang, H.; Su, L.; Zhao, C. Biochar addition alleviate the negative effects of drought and salinity stress on soybean productivity and water use efficiency. BMC Plant Biol. 2020, 20, 288. [Google Scholar] [CrossRef] [Scilit]
- Atkinson, C.J.; Fitzgerald, J.D.; Hipps, N.A. Potential mechanisms for achieving agricultural benefits from biochar application to temperate soils: A review. Plant Soil 2010, 337, 1–18. [Google Scholar] [CrossRef] [Scilit]
- Bista, D.R.; Heckathorn, S.A.; Jayawardena, D.M.; Mishra, S.; Boldt, J.K. Effects of Drought on Nutrient Uptake and the Levels of Nutrient-Uptake Proteins in Roots of Drought-Sensitive and -Tolerant Grasses. Plants 2018, 7, 28. [Google Scholar] [CrossRef] [Scilit]
- Ippolito, J.A.; Novak, J.M.; Busscher, W.J.; Ahmedna, M.; Rehrah, D.; Watts, D.W. Switchgrass biochar affects two Aridisols. J. Environ. Qual. 2012, 41, 1123–1130. [Google Scholar] [CrossRef] [Scilit]
- Phillips, C.L.; Meyer, K.M.; Garcia-Jaramillo, M.; Weidman, C.S.; Stewart, C.E.; Wanzek, T.; Grusak, M.A.; Watts, D.W.; Novak, J.; Trippe, K.M. Towards predicting biochar impacts on plant-available soil nitrogen content. Biochar 2022, 4, 9. [Google Scholar] [CrossRef] [Scilit]
- Li, S.; Zhou, L.; Addo-Danso, S.D.; Ding, G.; Sun, M.; Wu, S.; Lin, S. Nitrogen supply enhances the physiological resistance of Chinese fir plantlets under polyethylene glycol (PEG)-induced drought stress. Sci. Rep. 2020, 10, 7509. [Google Scholar] [CrossRef] [Scilit]
- Chen, X.; He, H.-Z.; Chen, G.-K.; Li, H.-S. Effects of biochar and crop straws on the bioavailability of cadmium in contaminated soil. Sci. Rep. 2020, 10, 9528. [Google Scholar] [CrossRef] [Scilit] [PubMed]
- Alam, M.Z.; McGee, R.; Hoque, M.A.; Ahammed, G.J.; Carpenter-Boggs, L. Effect of arbuscular mycorrhizal fungi, selenium and biochar on photosynthetic pigments and antioxidant enzyme activity under arsenic stress in mung bean (Vigna radiata). Front. Physiol. 2019, 10, 193. [Google Scholar] [CrossRef] [Scilit]
- Chang, L.; Xu, L.; Liu, Y.; Qiu, D. Superabsorbent polymers used for agricultural water retention. Polym. Test. 2021, 94, 107021. [Google Scholar] [CrossRef] [Scilit]
- Ai, F.; Yin, X.; Hu, R.; Ma, H.; Liu, W. Research into the super-absorbent polymers on agricultural water. Agric. Water Manag. 2021, 245, 106513. [Google Scholar] [CrossRef] [Scilit]
- Oladosu, Y.; Rafii, M.Y.; Arolu, F.; Chukwu, S.C.; Salisu, M.A.; Fagbohun, I.K.; Muftaudeen, T.K.; Swaray, S.; Haliru, B.S. Superabsorbent Polymer Hydrogels for Sustainable Agriculture: A Review. Horticulturae 2022, 8, 605. [Google Scholar] [CrossRef] [Scilit]
- Yang, Y.; Liang, Z.; Zhang, R.; Zhou, S.; Yang, H.; Chen, Y.; Zhang, J.; Yin, H.; Yu, D. Research Advances in Superabsorbent Polymers. Polymers 2024, 16, 501. [Google Scholar] [CrossRef] [Scilit]
- Zohuriaan-Mehr, M.J.; Omidian, H.; Doroudiani, S.; Kabiri, K. Advances in non-hygienic applications of superabsorbent hydrogel materials. J. Mater. Sci. 2010, 45, 5711–5735. [Google Scholar] [CrossRef] [Scilit]
- Yang, Y.; Zhang, S.; Wu, J.; Gao, C.; Lu, D.; Tang, D.W.S. Effect of long term application of super absorbent polymer on soil structure, soil enzyme activity, photosynthetic characteristics, water and nitrogen use of winter wheat. Front. Plant Sci. 2022, 13, 998494. [Google Scholar] [CrossRef] [Scilit] [PubMed]
- Saha, A.; Sekharan, S.; Manna, U. Superabsorbent hydrogel (SAH) as a soil amendment for drought management: A review. Soil Tillage Res. 2020, 204, 104736. [Google Scholar] [CrossRef] [Scilit]
- Yang, F.; Cen, R.; Feng, W.; Liu, J.; Qu, Z.; Miao, Q. Effects of Super-Absorbent Polymer on Soil Remediation and Crop Growth in Arid and Semi-Arid Areas. Sustainability 2020, 12, 7825. [Google Scholar] [CrossRef] [Scilit]
- Shi, Y.; Li, J.; Shao, J.; Deng, S.; Wang, R.; Li, N.; Sun, J.; Zhang, H.; Zhu, H.; Zhang, Y.; et al. Effects of Stockosorb and Luquasorb polymers on salt and drought tolerance of Populus popularis. Sci. Hortic. 2010, 124, 268–273. [Google Scholar] [CrossRef] [Scilit]
- Islam, M.R.; Xue, X.; Mao, S.; Ren, C.; Eneji, A.E.; Hu, Y. Effects of water-saving superabsorbent polymer on antioxidant enzyme activities and lipid peroxidation in oat (Avena sativa L.) under drought stress. J. Sci. Food Agric. 2011, 91, 680–686. [Google Scholar] [CrossRef] [Scilit]
- Martin, C.A.; Ruter, J.M.; Roberson, R.W.; Sharp, W.P. Element absorption and hydration potential of polyacrylamide gels. Commun. Soil Sci. Plant Anal. 1993, 24, 539–548. [Google Scholar] [CrossRef] [Scilit]
- STOCKOSORB 660 Safety Data Sheet; Version 1.0, Revision 11/07/2019; [PDF]; Evonik Industries: Essen, Germany, 2019; Available online: http://apofl.com/wp-content/uploads/2021/08/STOCKOSORB-660-SAFETY-DATA-SHEET.pdf (accessed on 29 January 2026).
- Friede, K. Untersuchungen und Bewertung der Biologischen Qualität von Biokohlekomposten und Deren Wirkungen auf die Lebenraumfunktion von Böden mit dem Ziel der Ableitung von Biologischen Qualittätskriterien. Doctoral Dissertation, Freie Universität Berlin, Berlin, Germany, 2021. Available online: https://refubium.fu-berlin.de/bitstream/handle/fub188/30975/Dissertation_Karin_Friede.pdf?sequence=3 (accessed on 29 January 2026).
- Kammann, C.; Schmidt, H.P.; Messerschmidt, N.; Linsel, S.; Steffens, D.; Müller, C.; Koyro, H.-W.; Conte, P.; Joseph, S. Plant growth improvement mediated by nitrate capture in composted biochar. Sci. Rep. 2015, 5, 11080. [Google Scholar] [CrossRef] [Scilit]
- Akram, M.Z.; Libutti, A.; Rivelli, A.R. Evaluation of Vegetative Development of Quinoa under Water Stress by Applying Different Organic Amendments. Agronomy 2023, 13, 1412. [Google Scholar] [CrossRef] [Scilit]
- Hewitt, E.J. Sand and Water Culture Methods Used in Study of Plant Nutrition, 2nd ed.; Commonwealth Agricultural Bureaux: Farnham Royal, UK, 1966. [Google Scholar]
- Scholander, P.F. The role of solvent pressure in osmotic systems. Proc. Natl. Acad. Sci. USA 1966, 55, 1407–1414. [Google Scholar] [CrossRef] [Scilit]
- Matyssek, R.; Herppich, W.B. Experimentelle Pflanzenökologie; Springer Spektrum: Berlin, Germany, 2020; pp. 425–462. [Google Scholar]
- Bowler, M.G. The physics of osmotic pressure. Eur. J. Phys. 2017, 38, 055102. [Google Scholar] [CrossRef] [Scilit]
- Kuhlgert, S.; Austic, G.; Zegarac, R.; Osei-Bonsu, I.; Hoh, D.; Chilvers, M.I.; Roth, M.G.; Bi, K.; TerAvest, D.; Weebadde, P.; et al. MulDspeQ Beta: A tool for large-scale plant phenotyping connected to the open PhotosynQ network. R. Soc. Open Sci. 2016, 3, 160592. [Google Scholar] [CrossRef] [Scilit]
- Schulte, M.; Offer, C.; Hansen, U. Induction of CO2-gas exchange and electron transport: Comparison of dynamic and steady-state responses in Fagus sylvatica leaves. Trees 2003, 17, 153–163. [Google Scholar] [CrossRef] [Scilit]
- Valentini, R.; Epron, D.; De Angelis, P.; Matteucci, G.; Dreyer, E. In situ estimation of net CO2 assimilation, photosynthetic electron flow and photorespiration in Turkey oak (Q. cerris L.) leaves: Diurnal cycles under different levels of water supply. Plant Cell Environ. 1995, 18, 631–640. [Google Scholar] [CrossRef] [Scilit]
- Heath, R.L.; Packer, L. Photoperoxidation in isolated chloroplasts: I. Kinetics and stoichiometry of fatty acid peroxidation. Arch. Biochem. Biophys. 1968, 125, 189–198. [Google Scholar] [CrossRef] [Scilit] [PubMed]
- Bates, L.S.; Waldren, R.P.; Teare, I.D. Rapid determination of free proline for water-stress studies. Plant Soil 1937, 39, 205–207. [Google Scholar] [CrossRef] [Scilit]
- SigmaPlot for Windows, Version 12; Systat Software Inc.: Bangalore, India, 2012. Available online: https://www.systatsoftware.com (accessed on 29 January 2026).
- Ambaye, T.G.; Vaccari, M.; van Hullebusch, E.D.; Amrane, A.; Rtimi, S. Mechanisms and adsorption capacities of biochar for the removal of organic and inorganic pollutants from industrial wastewater. Int. J. Environ. Sci. Technol. 2021, 18, 3273–3294. [Google Scholar] [CrossRef] [Scilit]
- Derbali, W.; Manaa, A.; Goussi, R.; Derbali, I.; Abdelly, C.; Koyro, H.-W. Post-stress restorative response of two quinoa genotypes differing in their salt resistance after salinity release. Plant Physiol. Biochem. 2021, 164, 222–236. [Google Scholar] [CrossRef] [Scilit]
- Yang, A.; Akhtar, S.S.; Amjad, M.; Iqbal, S.; Jacobsen, S.E. Growth and physiological responses of quinoa to drought and temperature stress. J. Agron. Crop Sci. 2016, 202, 445–453. [Google Scholar] [CrossRef] [Scilit]
- Stikic, R.; Jovanovic, Z.; Marjanovic, M.; Djordjevic, S. The effect of drought on water regime and growth of quinoa (Chenopodium quinoa Willd.). Ratar. I Povrt. 2015, 52, 80–84. [Google Scholar] [CrossRef] [Scilit]
- Elewa, T.A.; Sadak, M.S.; Saad, A.M. Proline treatment improves physiological responses in quinoa plants under drought stress. Biosci. Res. 2017, 14, 21–33. [Google Scholar]
- Lichtenthaler, H.K. The stress concept in plants: An introduction. Ann. N. Y. Acad. Sci. 1998, 851, 187–198. [Google Scholar] [CrossRef] [Scilit]
- Verbraeken, L.; Wuyts, N.; Mertens, S.; Cannoot, B.; Maleux, K.; Demuynck, K.; De Block, J.; Merchie, J.; Dhondt, S.; Bonaventure, G.; et al. Drought affects the rate and duration of organ growth but not inter-organ growth coordination. Plant Physiol. 2021, 186, 1336–1353. [Google Scholar] [CrossRef] [Scilit] [PubMed]
- Avramova, V.; AbdElgawad, H.; Vasileva, I.; Petrova, A.S.; Holek, A.; Mariën, J.; Asard, H.; Beemster, G.T.S. High antioxidant activity facilitates maintenance of cell division in leaves of drought tolerant maize hybrids. Front. Plant Sci. 2017, 8, 84. [Google Scholar] [CrossRef] [Scilit]
- Avramova, V.; AbdElgawad, H.; Zhang, Z.; Fotschki, B.; Casadevall, R.; Vergauwen, L.; Knapen, D.; Taleisnik, E.; Guisez, Y.; Asard, H.; et al. Drought Induces Distinct Growth Response, Protection, and Recovery Mechanisms in the Maize Leaf Growth Zone. Plant Physiol. 2015, 169, 1382–1396. [Google Scholar] [CrossRef] [Scilit]
- Nelissen, H.; Sun, X.-H.; Rymen, B.; Jikumaru, Y.; Kojima, M.; Takebayashi, Y.; Abbeloos, R.; Demuynck, K.; Storme, V.; Vuylsteke, M.; et al. The reduction in maize leaf growth under mild drought affects the transition between cell division and cell expansion and cannot be restored by elevated gibberellic acid levels. Plant Biotechnol. J. 2017, 16, 615–627. [Google Scholar] [CrossRef] [Scilit]
- Wang, X.; Wu, Z.; Zhou, Q.; Wang, X.; Song, S.; Dong, S. Physiological Response of Soybean Plants to Water Deficit. Front. Plant Sci. 2022, 12, 809692. [Google Scholar] [CrossRef] [Scilit]
- Derbali, I.; Derbali, W.; Gharred, J.; Manaa, A.; Slama, I.; Koyro, H.-W. Mitigating Salinity Stress in Quinoa (Chenopodium quinoa Willd.) with Biochar and Superabsorber Polymer Amendments. Plants 2024, 13, 92. [Google Scholar] [CrossRef] [Scilit]
- Falouti, M.; Ellouzi, H.; Bounaouara, F.; Farhat, N.; Aggag, A.M.; Debez, A.; Rabhi, M.; Abdelly, C.; Slama, I.; Zorrig, W. Higher activity of PSI compared to PSII accounts for the beneficial effect of silicon on barley (Hordeum vulgare L.) plants challenged with salinity. Photosynthetica 2022, 60, 508–520. [Google Scholar] [CrossRef] [Scilit]
- Moradi, F.; Ismail, A.M. Responses of Photosynthesis, Chlorophyll Fluorescence and ROS-Scavenging Systems to Salt Stress During Seedling and Reproductive Stages in Rice. Ann. Bot. 2007, 99, 1161–1173. [Google Scholar] [CrossRef] [Scilit]
- Ivanov, A.G.; Sane, P.V.; Hurry, V.; Öquist, G.; Huner, N.P.A. Photosystem II reaction centre quenching: Mechanisms and physiological role. Photosynth. Res. 2008, 98, 565–574. [Google Scholar] [CrossRef] [Scilit] [PubMed]
- Huang, W.; Yang, S.J.; Zhang, S.B.; Zhang, J.-L.; Cao, K.-F. Cyclic electron flow plays an important role in photoprotection for the resurrection plant Paraboearufescens under drought stress. Planta 2012, 235, 819–828. [Google Scholar] [CrossRef] [Scilit]
- Degen, G.E. Under (stromal redox) pressure: NADP+ synthesis regulates photosystem I biogenesis. Plant Physiol. 2022, 189, 1890–1892. [Google Scholar] [CrossRef] [Scilit]
- Kanazawa, A.; Ostendorf, E.; Kohzuma, K.; Hoh, D.; Strand, D.D.; Sato-Cruz, M.; Savage, L.; Cruz, J.A.; Fisher, N.; Froehlich, J.E.; et al. Chloroplast ATP Synthase Modulation of the Thylakoid Proton Motive Force: Implications for Photosystem I and Photosystem II Photoprotection. Front. Plant Sci. 2017, 8, 719. [Google Scholar] [CrossRef] [Scilit] [PubMed]
- Yang, H.; Liu, J.; Wen, X.; Lu, C. Molecular mechanism of photosystem I assembly in oxygenic organisms. Biochim. Biophys. Acta (BBA)-Bioenerg. 2015, 1847, 838–848. [Google Scholar] [CrossRef] [Scilit]
- Lima-Melo, Y.; Alencar, V.T.C.B.; Lobo, A.K.M.; Sousa, R.H.V.; Tikkanen, M.; Aro, E.-M.; Silveira, J.A.G.; Gollan, P.J. Photoinhibition of Photosystem I Provides Oxidative Protection During Imbalanced Photosynthetic Electron Transport in Arabidopsis thaliana. Front. Plant Sci. 2019, 10, 916. [Google Scholar] [CrossRef] [Scilit] [PubMed]
- Zivcak, M.; Kalaji, H.M.; Shao, H.-B.; Olsovska, K.; Brestic, M. Photosynthetic proton and electron transport in wheat leaves under prolonged moderate drought stress. J. Photochem. Photobiol. B Biol. 2014, 137, 107–115. [Google Scholar] [CrossRef] [Scilit]
- Shimakawa, G.; Müller, P.; Miyake, C.; Krieger-Liszkay, A.; Sétif, P. Photo-oxidative damage of photosystem I by repetitive flashes and chilling stress in cucumber leaves. Biochim. Biophys. Acta (BBA)-Bioenerg. 2024, 1865, 149490. [Google Scholar] [CrossRef] [Scilit] [PubMed]
- Rouphael, Y.; Kyriacou, M.C. Enhancing Quality of Fresh Vegetables Through Salinity Eustress and Biofortification Applications Facilitated by Soilless Cultivation. Front. Plant Sci. 2018, 9, 1254. [Google Scholar] [CrossRef] [Scilit]
- Sperdouli, I.; Ouzounidou, G.; Moustakas, M. Hormesis Responses of Photosystem II in Arabidopsis thaliana under Water Deficit Stress. Int. J. Mol. Sci. 2023, 24, 9573. [Google Scholar] [CrossRef] [Scilit]
- Sepehri, S.; Abdoli, S.; Asgari Lajayer, B.; Astatkie, T.; Price, G.W. Changes in phytochemical properties and water use efficiency of peppermint (Mentha piperita L.) using superabsorbent polymer under drought stress. Sci. Rep. 2023, 13, 21989. [Google Scholar] [CrossRef] [Scilit]
- Chen, X.; Mao, X.; Lu, Q.; Liao, Z.; He, Z. Characteristics and mechanisms of acrylate polymer damage to maize seedlings. Ecotoxicol. Env. Saf. 2016, 129, 228–234. [Google Scholar] [CrossRef] [Scilit] [PubMed]
- Lawlor, D.W.; Cornic, G. Photosynthetic carbon assimilation and associated metabolism in relation to water deficits in higher plants. Plant Cell Environ. 2002, 25, 275–294. [Google Scholar] [CrossRef] [Scilit] [PubMed]
- Reddy, A.R.; Chaitanya, K.V.; Vivekanandan, M. Drought-induced responses of photosynthesis and antioxidant metabolism in higher plants. J. Plant Physiol. 2004, 161, 1189–1202. [Google Scholar] [CrossRef] [Scilit]
- Ghotbi-Ravandi, A.A.; Shahbazi, M.; Shariati, M.; Mulo, P. Effects of Mild and Severe Drought Stress on Photosynthetic Efficiency in Tolerant and Susceptible Barley (Hordeum vulgare L.) Genotypes. J. Agron. Crop Sci. 2014, 200, 403–415. [Google Scholar] [CrossRef] [Scilit]
- Zhang, J.; Jiang, H.; Song, X.; Jin, J.; Zhang, X. The Responses of Plant Leaf CO2/H2O Exchange and Water Use Efficiency to Drought: A Meta-Analysis. Sustainability 2018, 10, 551. [Google Scholar] [CrossRef] [Scilit]
- Sarma, B.; Gogoi, N.; Bharali, M.; Mali, P. Field evaluation of soil and wheat responses to combined application of hardwood biochar and inorganic fertilizers in aridic sandy loam soil. Exp. Agric. 2017, 54, 507–519. [Google Scholar] [CrossRef] [Scilit]
- Fghire, R.; Anaya, F.; Ali, O.I.; Benlhabib, O.; Ragab, R.; Wahbi, S. Physiological and photosynthetic response of quinoa to drought stress. Chil. J. Agric. Res. 2015, 75, 174–183. [Google Scholar] [CrossRef] [Scilit]
- Anjum, S.A.; Ashraf, U.; Tanveer, M.; Khan, I.; Hussain, S.; Shahzad, B.; Zohaib, A.; Abbas, F.; Saleem, M.F.; Ali, I.; et al. Drought Induced Changes in Growth, Osmolyte Accumulation and Antioxidant Metabolism of Three Maize Hybrids. Front. Plant Sci. 2017, 8, 69. [Google Scholar] [CrossRef] [Scilit]
- Wang, Y.; Pan, F.; Wang, G.; Zhang, G.; Wang, Y.; Chen, X.; Mao, Z. Effects of biochar on photosynthesis and antioxidative system of Malus hupehensis Rehd. seedlings under replant conditions. Sci. Hortic. 2014, 175, 9–15. [Google Scholar] [CrossRef] [Scilit]
- Khan, Z.; Khan, M.N.; Zhang, K.; Luo, T.; Zhu, K.; Hu, L. The application of biochar alleviated the adverse effects of drought on the growth, physiology, yield and quality of rapeseed through regulation of soil status and nutrients availability. Ind. Crops Prod. 2021, 171, 113878. [Google Scholar] [CrossRef] [Scilit]
- Cao, Y.; Xie, Q.; Wang, J.; Yang, J.; Xie, Z. Effects of super absorbent polymer on the physiological characteristics and drought resistance of bermudagrass [Cynodon dactylon (L.) Pers.] seedlings. Appl. Ecol. Environ. Res. 2020, 18, 4075–4085. [Google Scholar] [CrossRef] [Scilit]
- Tohidi-Moghadam, H.R.; Shirani-Rad, A.H.; Nour-Mohammadi, G.; Habibi, D.; Mashhadi-Akbar-Boojar, M. Effect of Super Absorbent Application on Antioxidant Enzyme Activities in Canola (Brassica napus L.) Cultivars under Water Stress Conditions. Am. J. Agri. Biol. Sci. 2009, 4, 215–223. [Google Scholar]
- Li, L.; Zhang, H.; Zhou, X.; Chen, M.; Lu, L.; Cheng, X. Effects of super absorbent polymer on scouring resistance and water retention performance of soil for growing plants in ecological concrete. Ecol. Eng. 2019, 138, 237–247. [Google Scholar] [CrossRef] [Scilit]
- Abrisham, E.S.; Jafari, M.; Tavili, A.; Rabii, A.; Zare Chahoki, M.A.; Zare, S.; Egan, T.; Yazdanshenas, H.; Ghasemian, D.; Tahmoures, M. Effects of a super absorbent polymer on soil properties and plant growth for use in land reclamation. Arid. Land Res. Manag. 2018, 32, 407–420. [Google Scholar] [CrossRef] [Scilit]
- Abdolmaleki, A.; Dapprich, P.; Bertram, H.; Hollensteiner, J.; Schmitz, M.; Schmitt, A.O.; Gültas, M. Impact of Super Absorbent Polymers (SAP) on the Morphological, Physiological, and Biochemical Responses of Rapeseed and Maize Under Drought Stress. Crop Breed. Genet. Genom. 2025, 7, e250009. [Google Scholar] [CrossRef] [Scilit]
- Ghebru, M.G.; du Toit, E.S.; Steyn, J.M. Water and nutrient retention by Aquasoil® and Stockosorb® polymers. S. Afr. J. Plant Soil 2007, 24, 32–36. [Google Scholar] [CrossRef] [Scilit]
- Nguyen, T.T.N.; Xu, C.Y.; Tahmasbian, I.; Che, R.; Xu, Z.; Wallace, H.M.; Bai, S.H. Effects of biochar on soil available inorganic nitrogen: A review and meta-analysis. Geoderma 2017, 288, 79–96. [Google Scholar] [CrossRef] [Scilit]
- Liu, Q.; Zhang, Y.; Liu, B.; Amonette, J.E.; Lin, Z.; Liu, G.; Ambus, P.; Xie, Z. How does biochar influence soil N cycle? A meta-analysis. Plant Soil 2018, 426, 211–225. [Google Scholar] [CrossRef] [Scilit]
- Gao, S.; DeLuca, T.H.; Cleveland, C.C. Biochar additions alter phosphorus and nitrogen availability in agricultural ecosystems: A meta-analysis. Sci. Total Environ. 2019, 654, 463–472. [Google Scholar] [CrossRef] [Scilit] [PubMed]
- Sardans, J.; Penuuelas, J.; Estiarte, M.; Prieto, P. Warming and drought alter C and N concentration, allocation and accumulation in a Mediterranean shrubland. Glob. Change Biol. 2008, 14, 2304–2316. [Google Scholar] [CrossRef] [Scilit]
- Noctor, G.; Reichheld, J.P.; Foyer, C.H. ROS-related redox regulation and signaling in plants. Semin. Cell Dev. Biol. 2018, 80, 3–12. [Google Scholar] [CrossRef] [Scilit] [PubMed]
- Kaur, G.; Asthir, B. Proline: A key player in plant abiotic stress tolerance. Biol. Plant. 2015, 59, 609–619. [Google Scholar] [CrossRef] [Scilit]
- Zhang, M.; Cheng, Z.; Zhao, T.; Liu, M.; Hu, M.; Li, J. Synthesis, characterization, and swelling behaviors of salt-sensitive maize bran–poly (acrylic acid) superabsorbent hydrogel. J. Agric. Food Chem. 2014, 62, 8867–8874. [Google Scholar] [CrossRef] [Scilit]
- Liu, J.; Li, Q.; Su, Y.; Yue, Q.; Gao, B. Characterization and swelling-deswelling properties of wheat straw cellulose-based semi-IPNs hydrogel. Carbohydr. Polym. 2014, 107, 232–240. [Google Scholar] [CrossRef] [Scilit]
- Situ, Y.; Yang, Y.; Huang, C.; Liang, S.; Mao, X.; Chen, X. Effects of several superabsorbent polymers on soil exchangeable cations and crop growth. Environ. Technol. Innov. 2023, 30, 103126. [Google Scholar] [CrossRef] [Scilit]
- Hilker, M.; Schmülling, T. Stress priming, memory, and signalling in plants. Plant Cell Environ. 2019, 42, 753–761. [Google Scholar] [CrossRef] [Scilit] [PubMed]
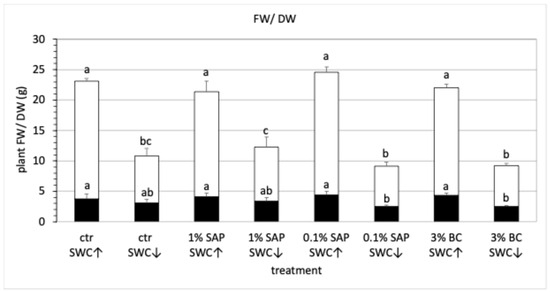
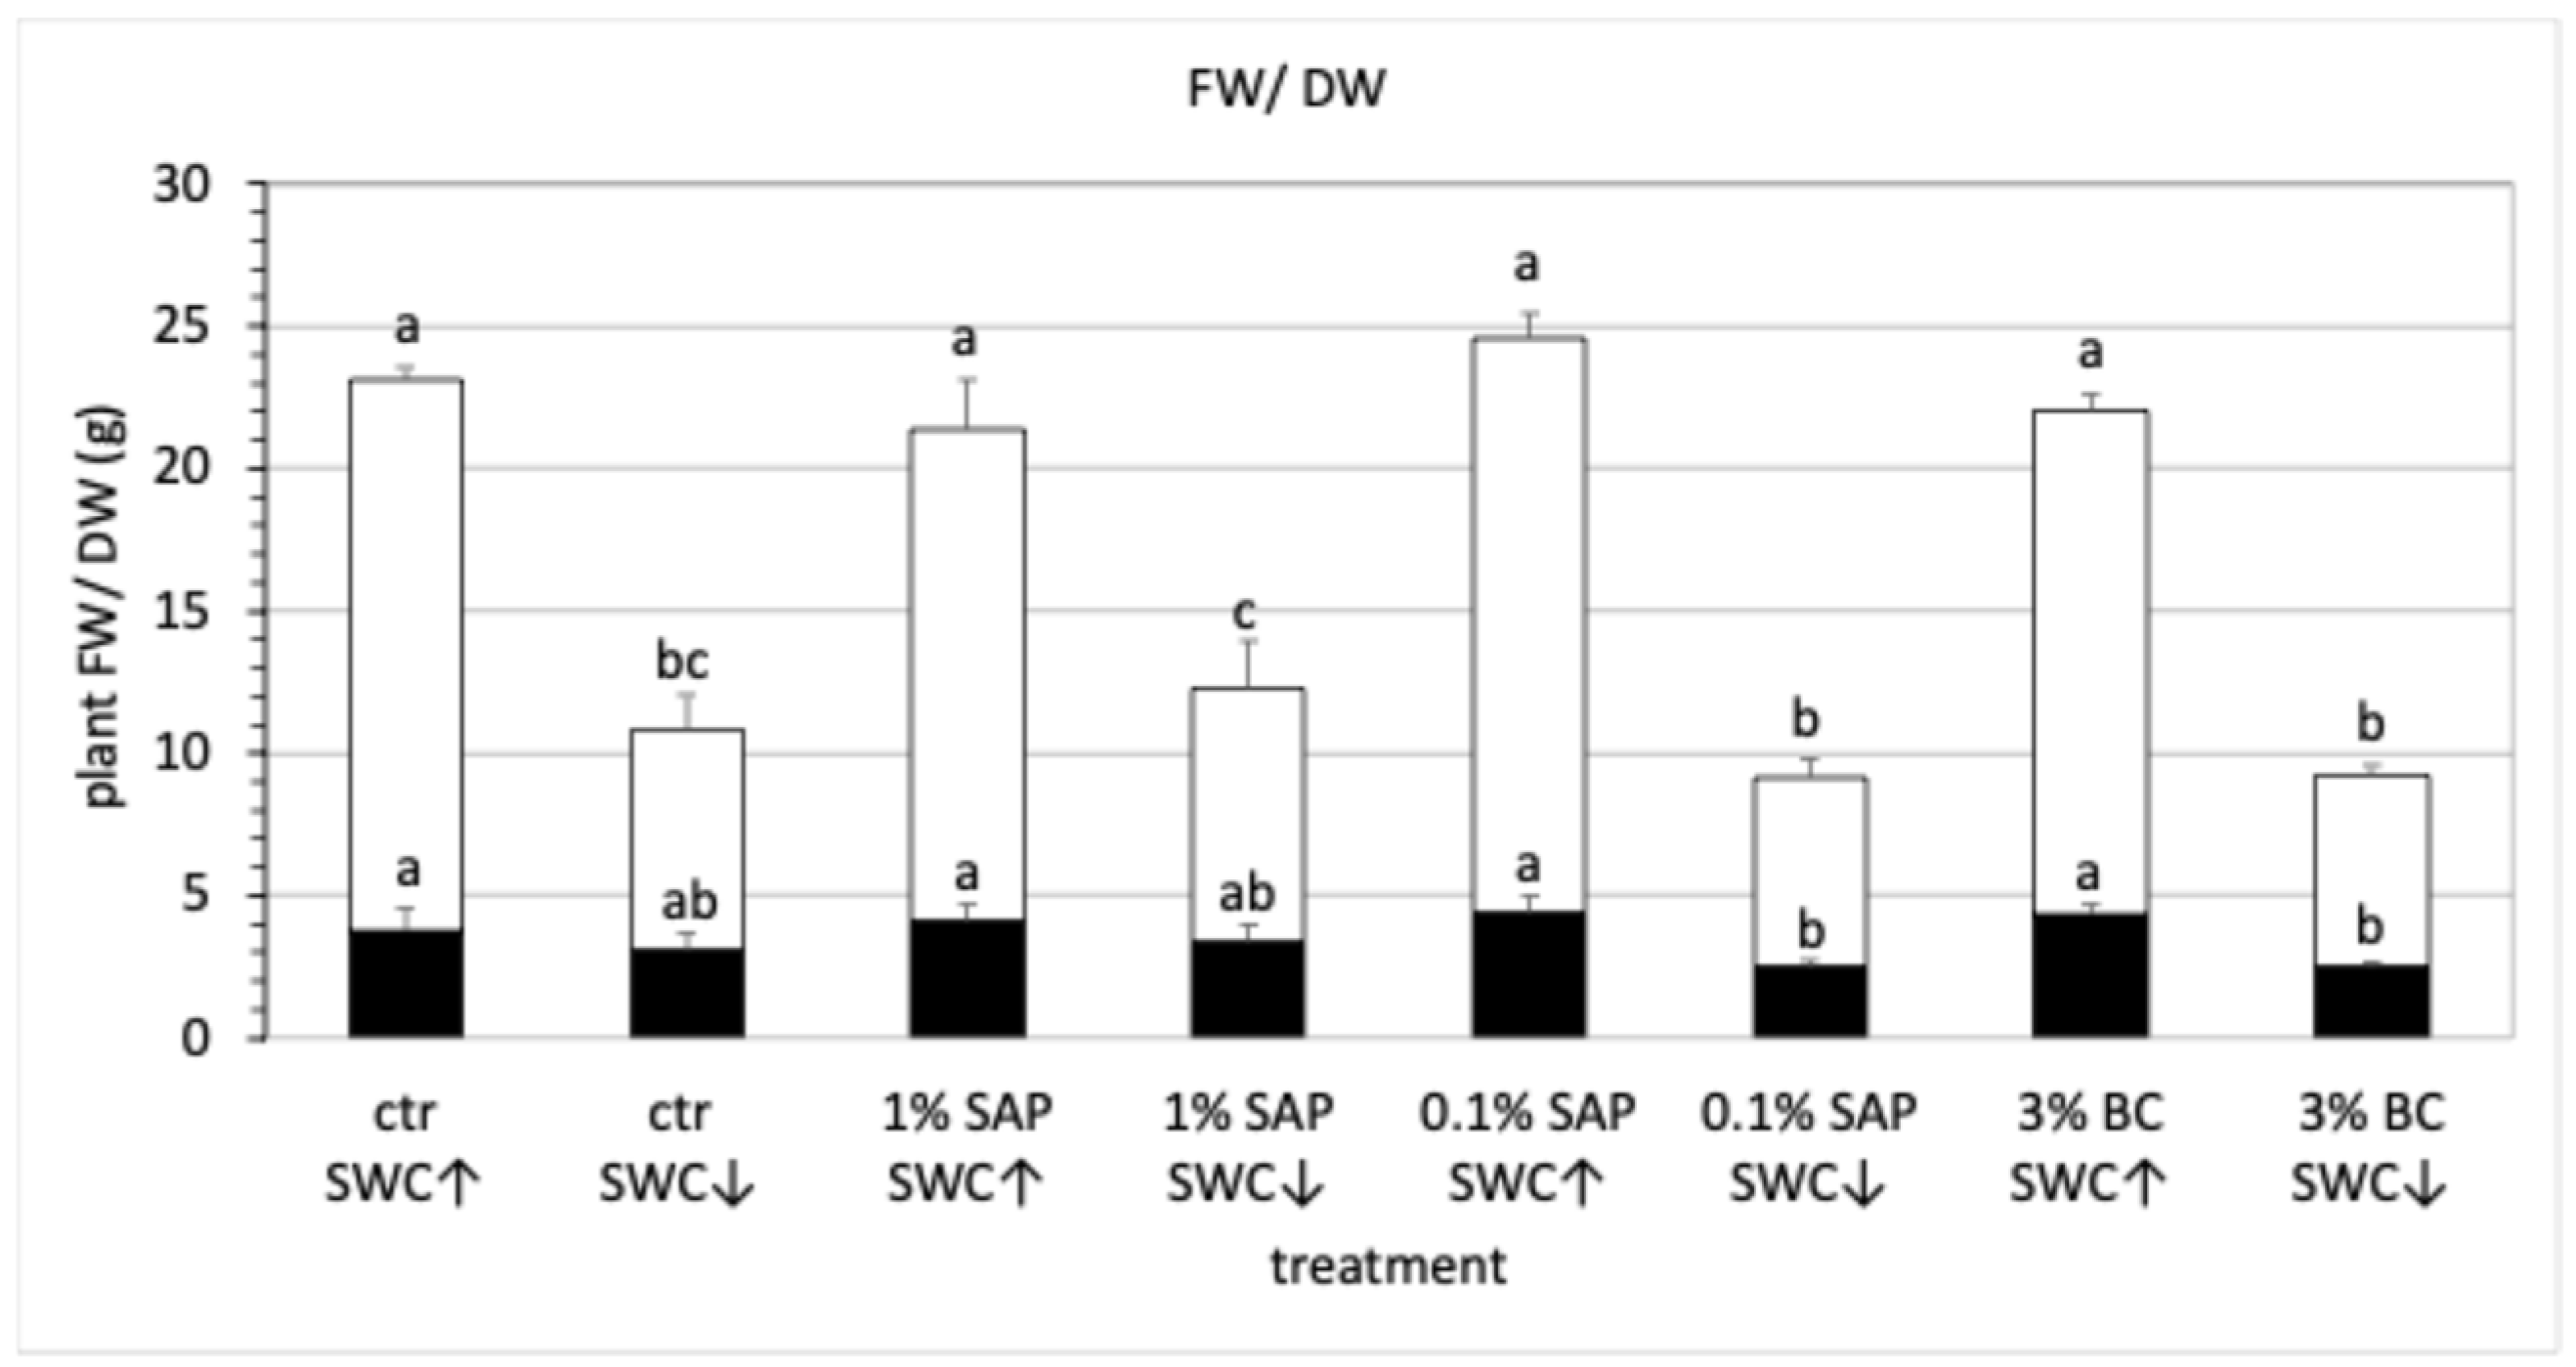
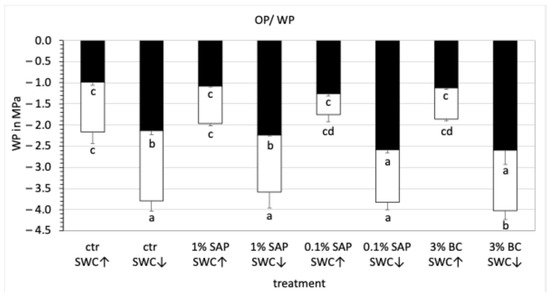
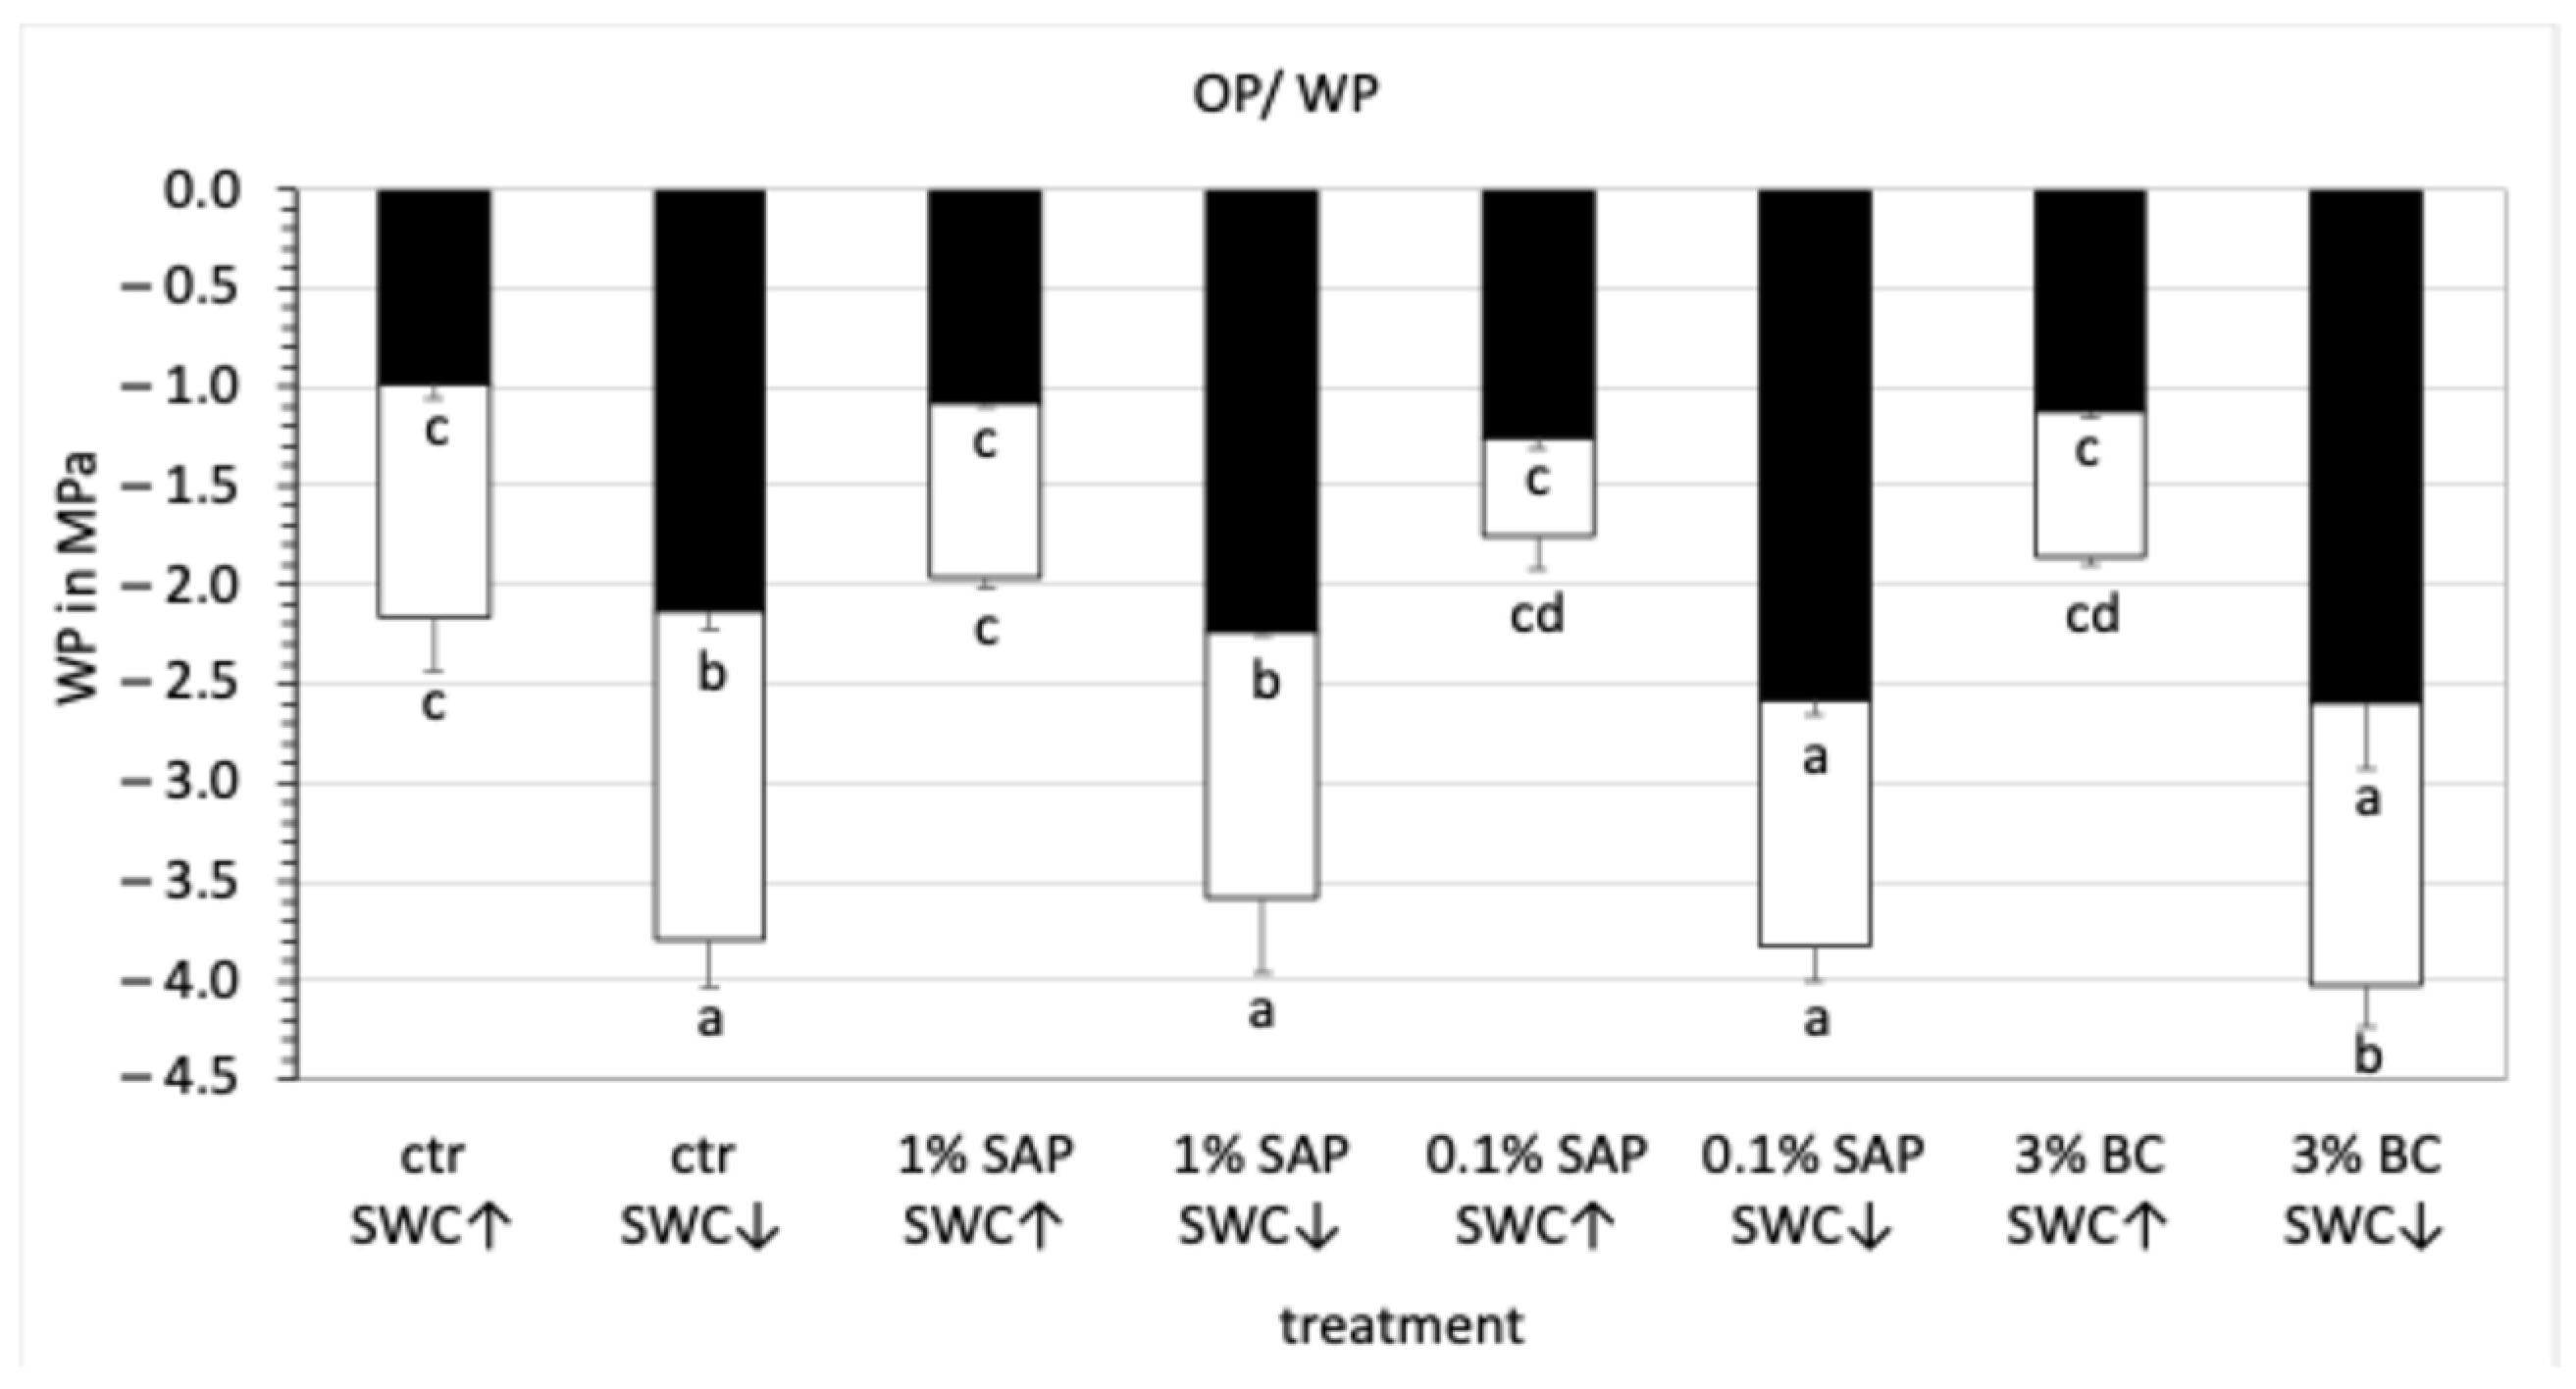
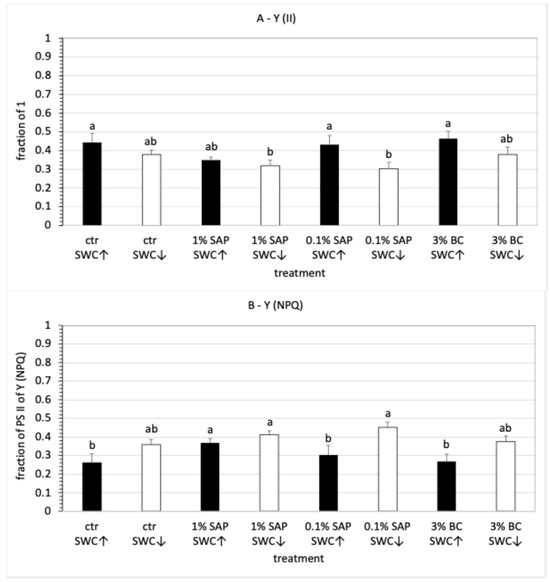
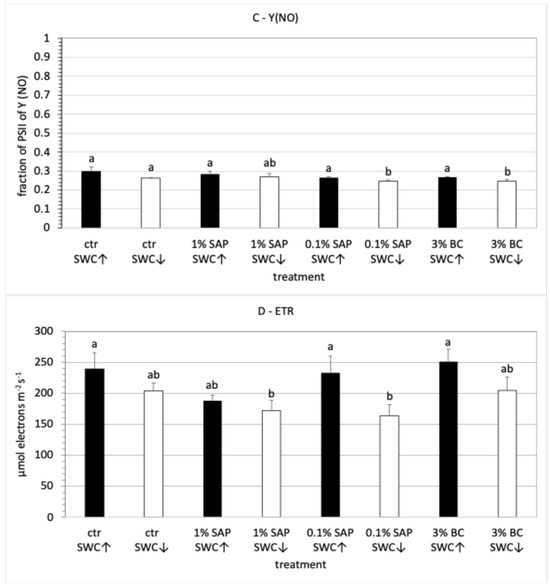
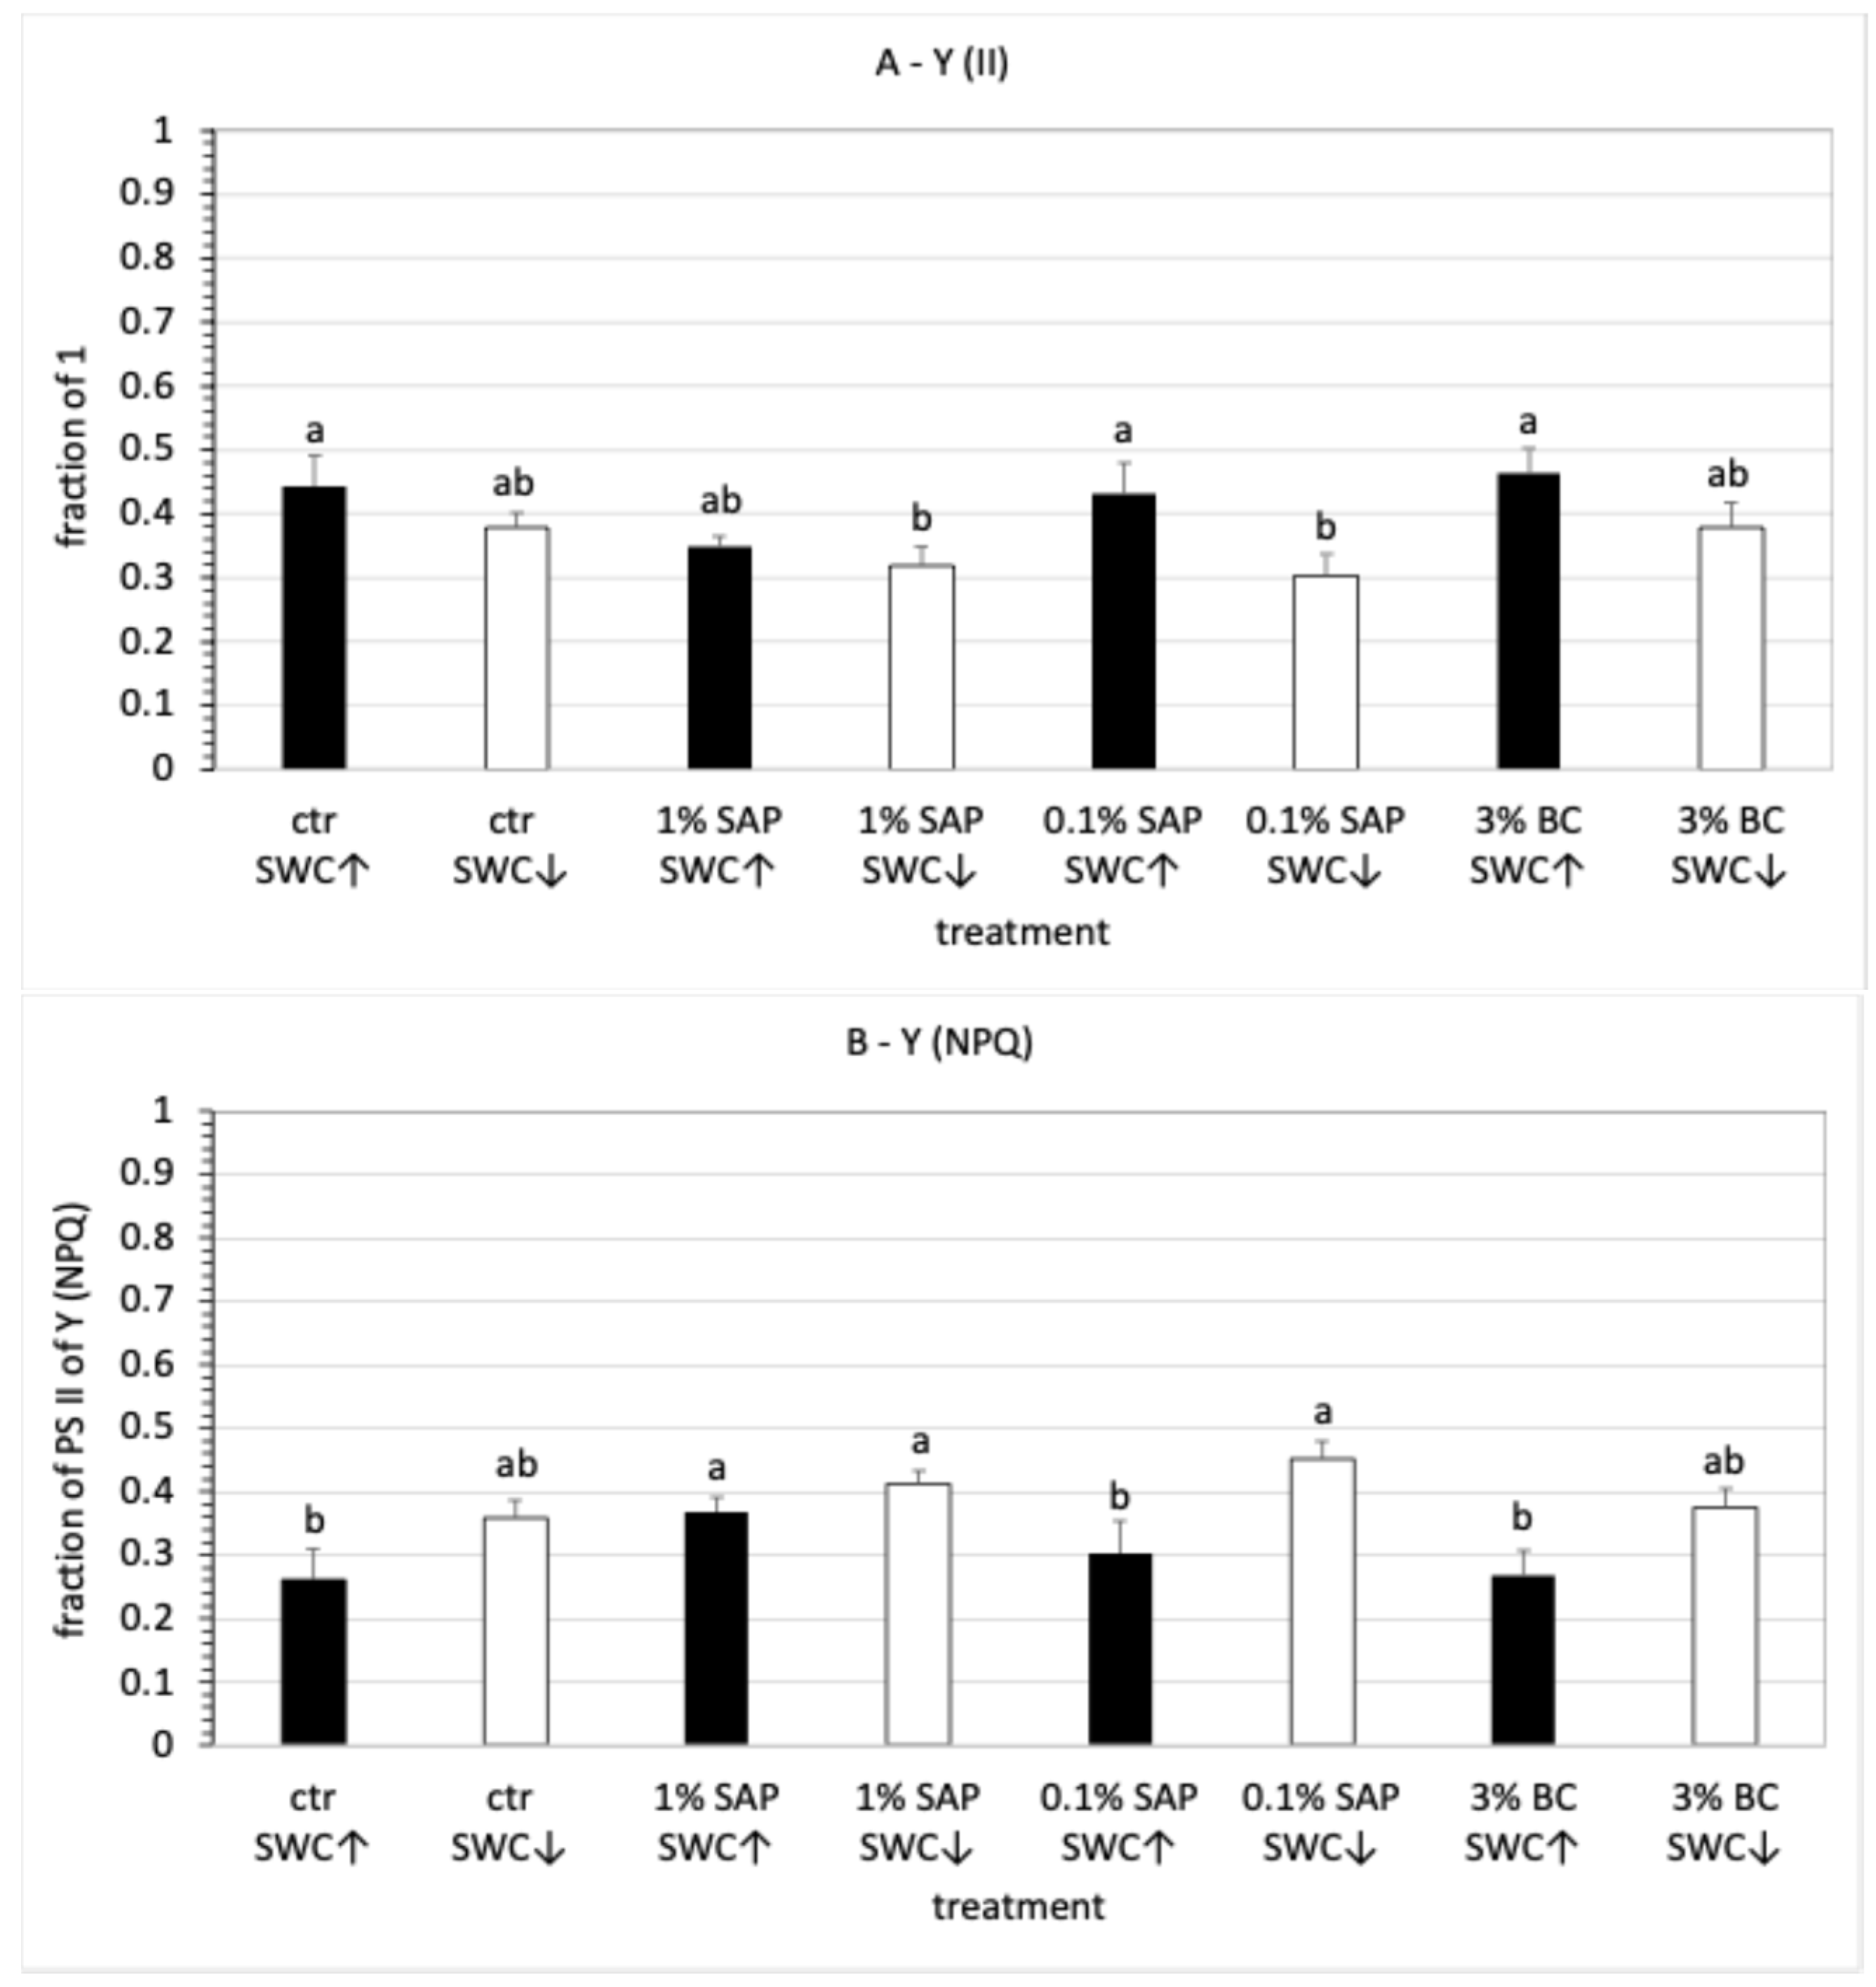
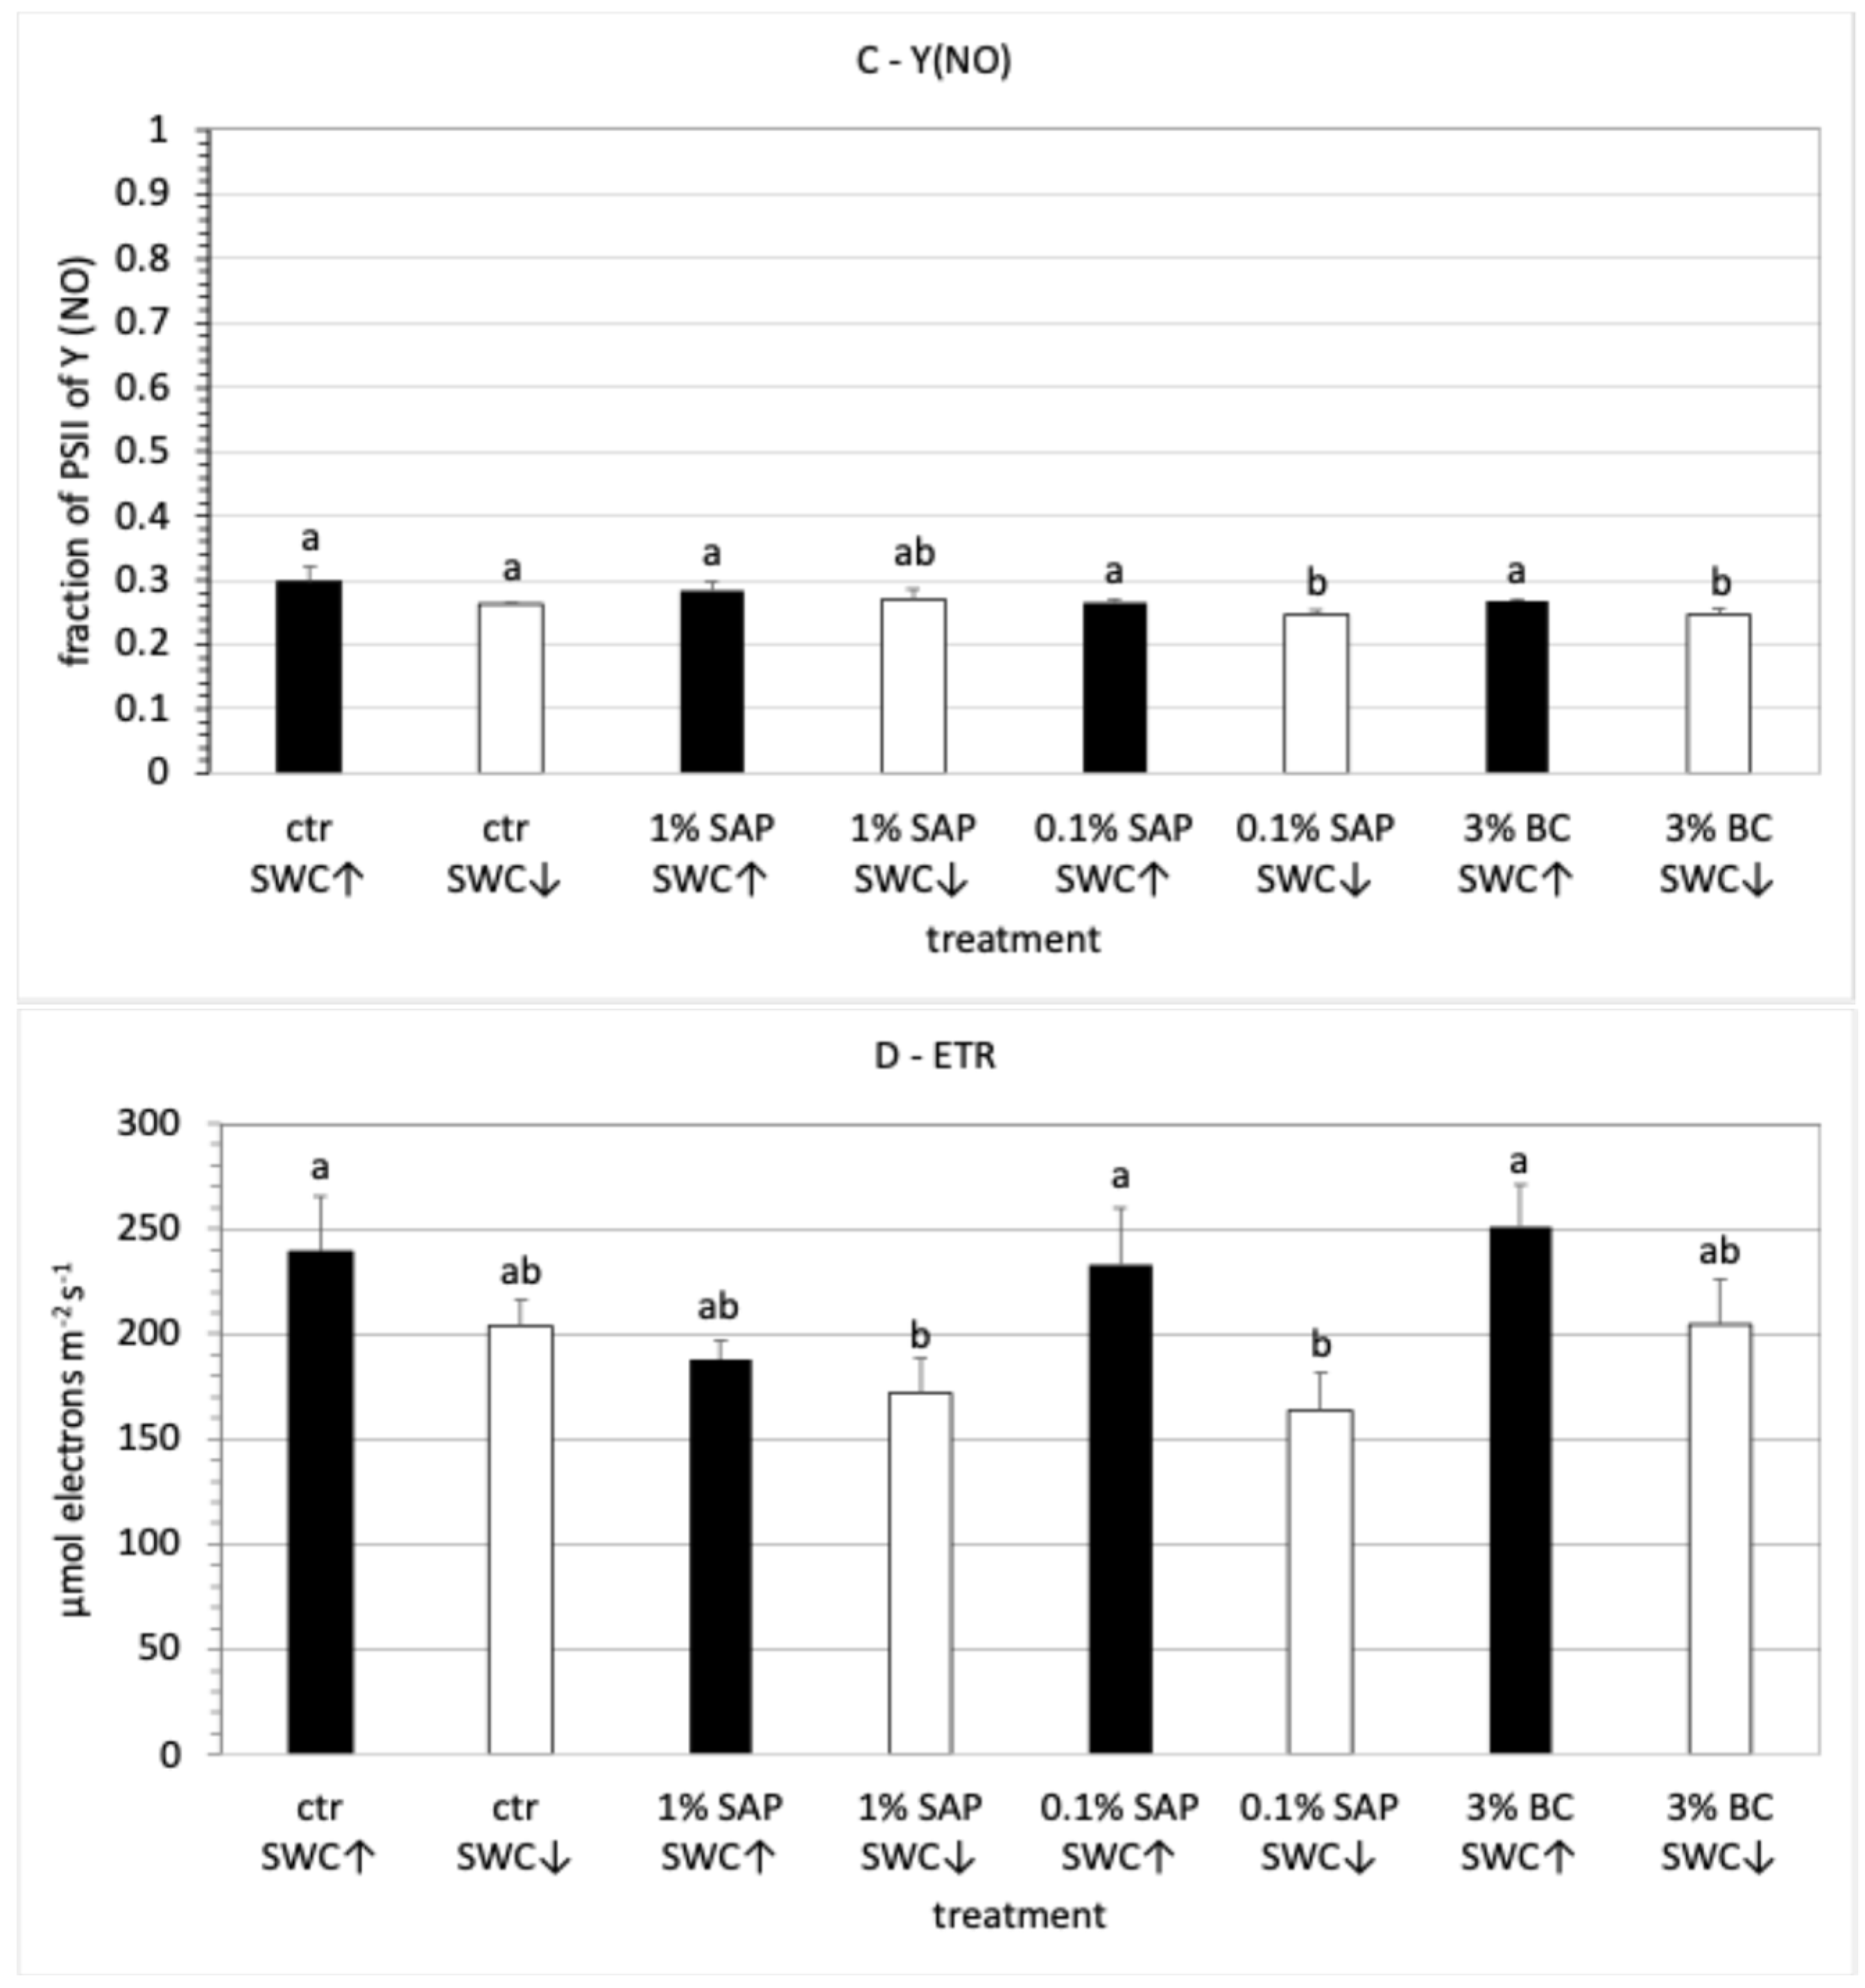
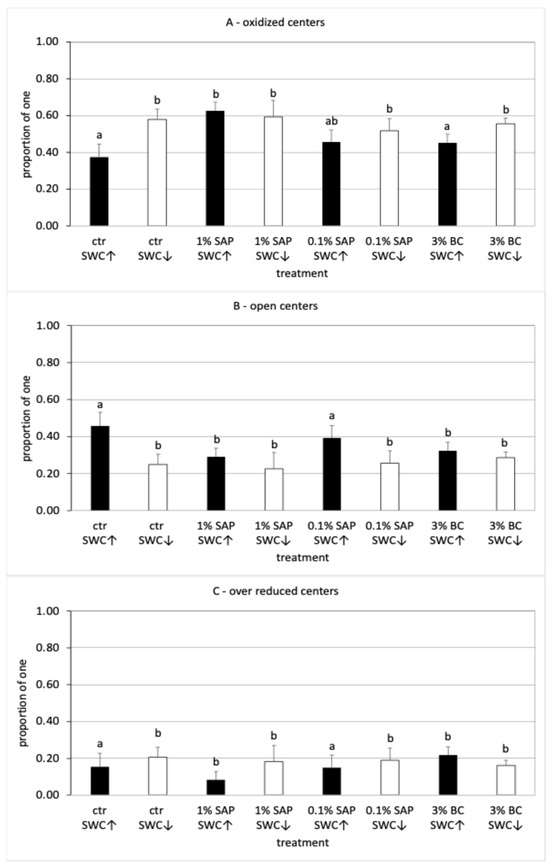
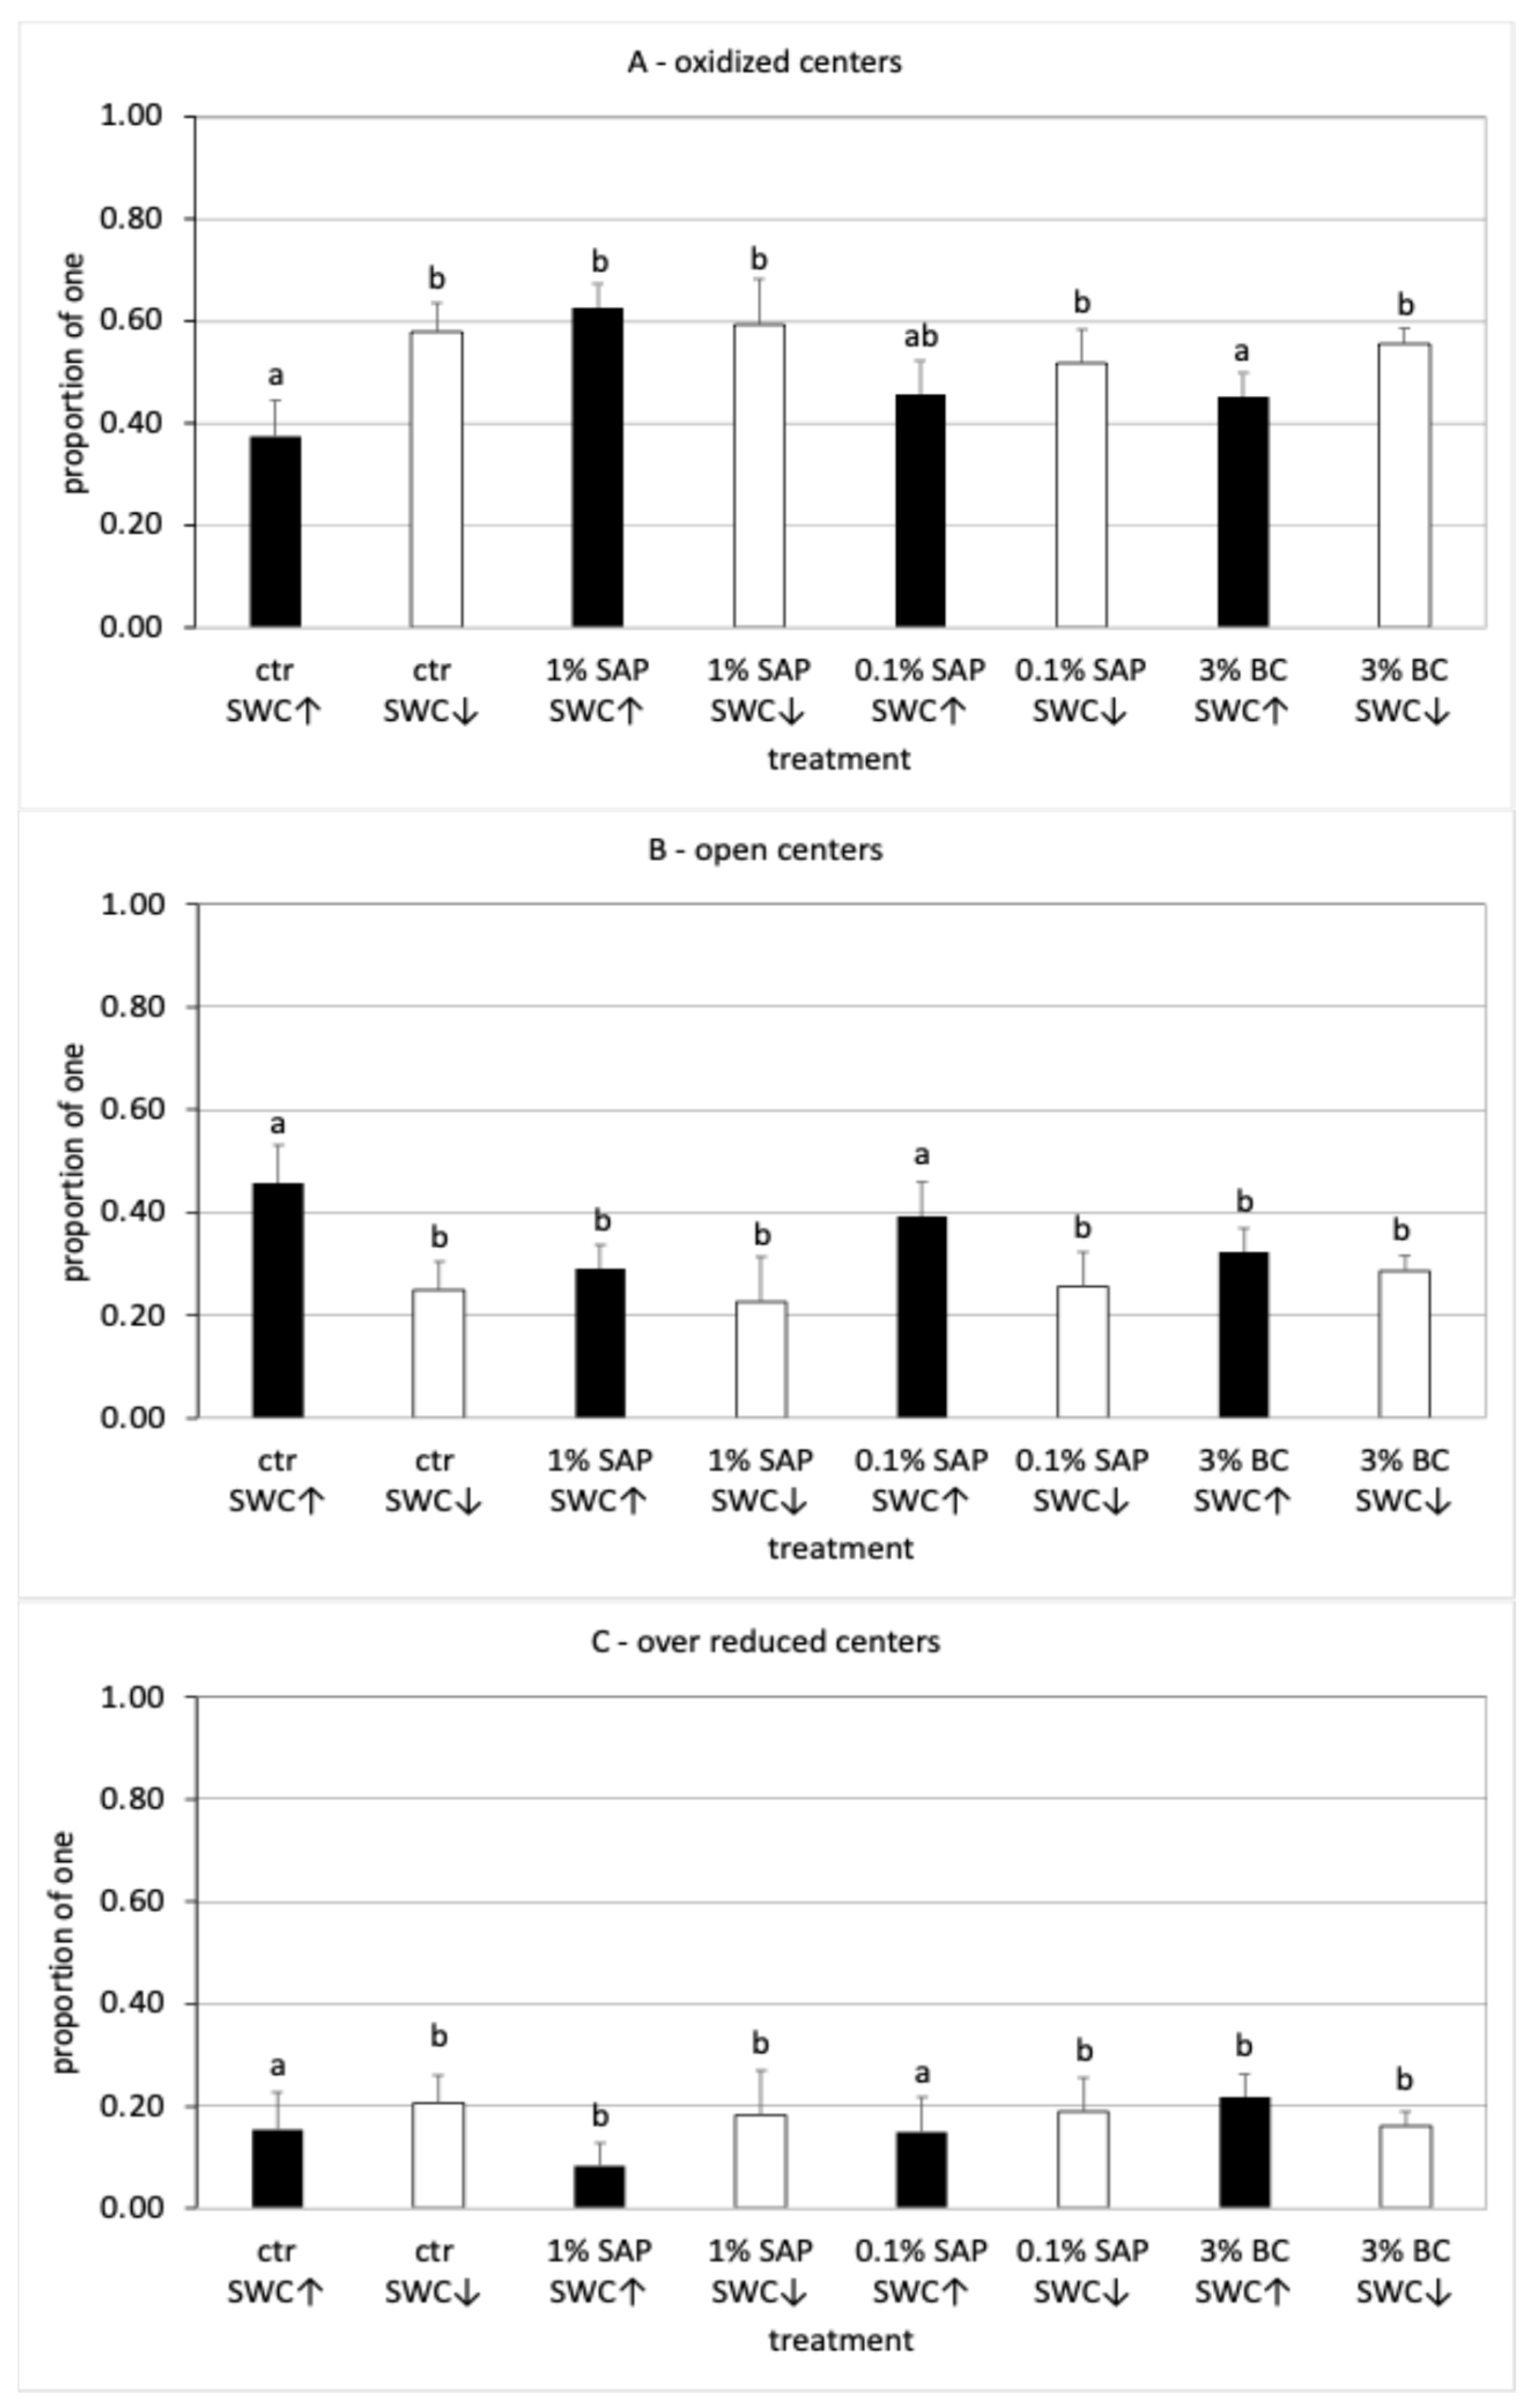
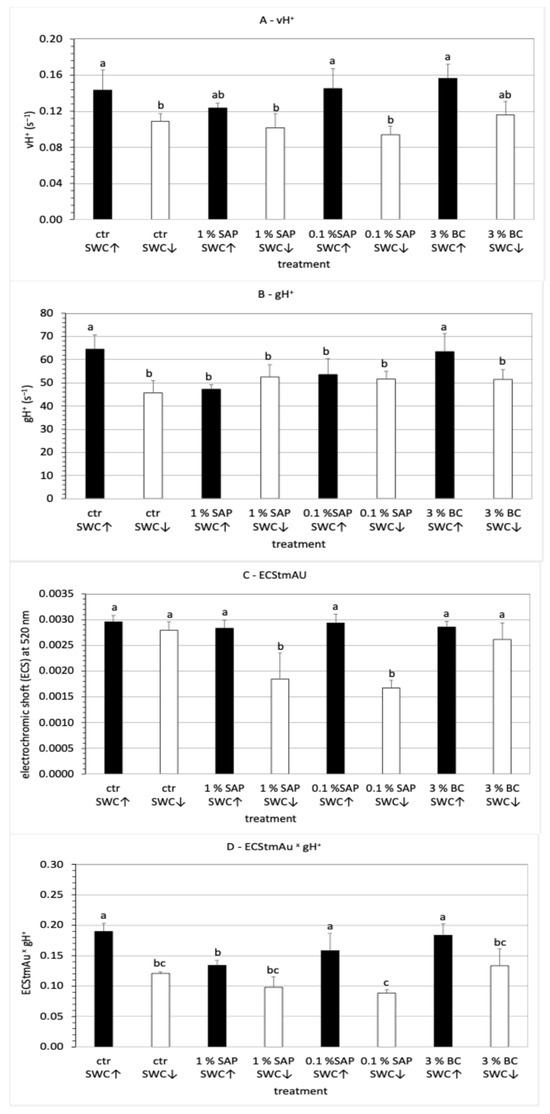
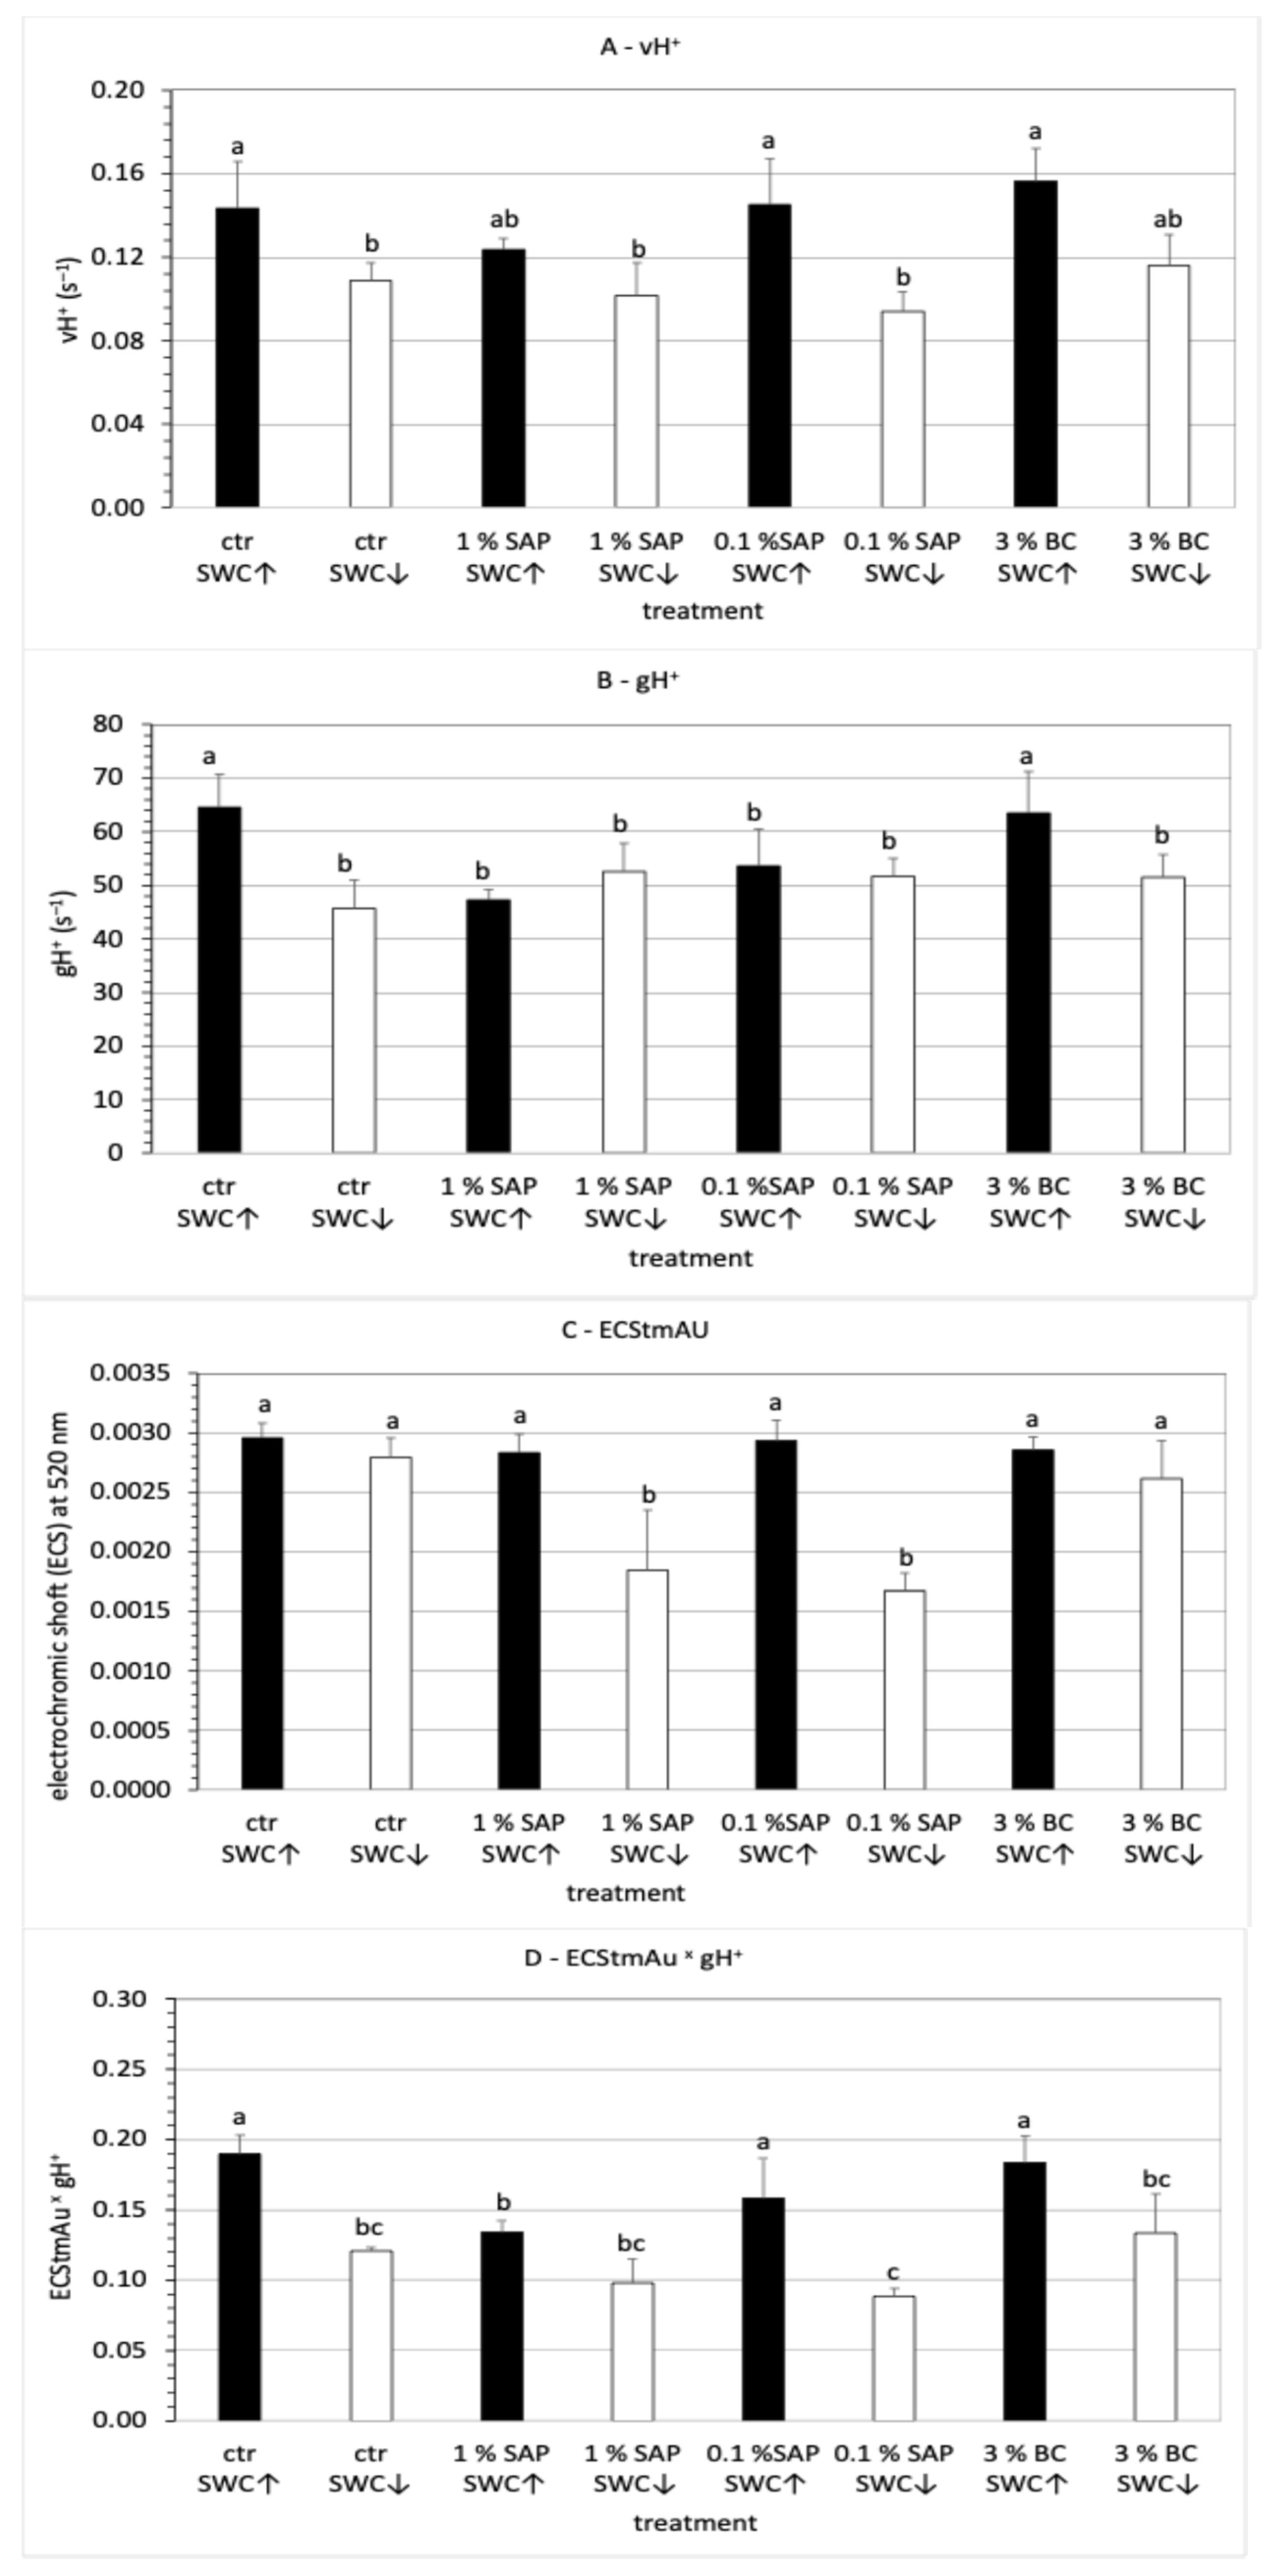
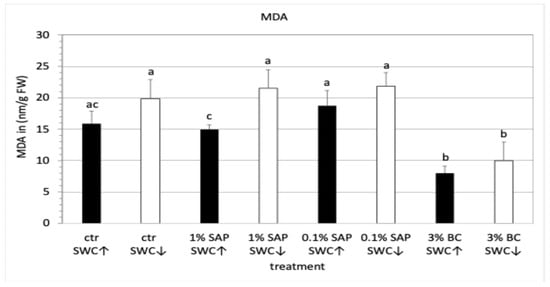
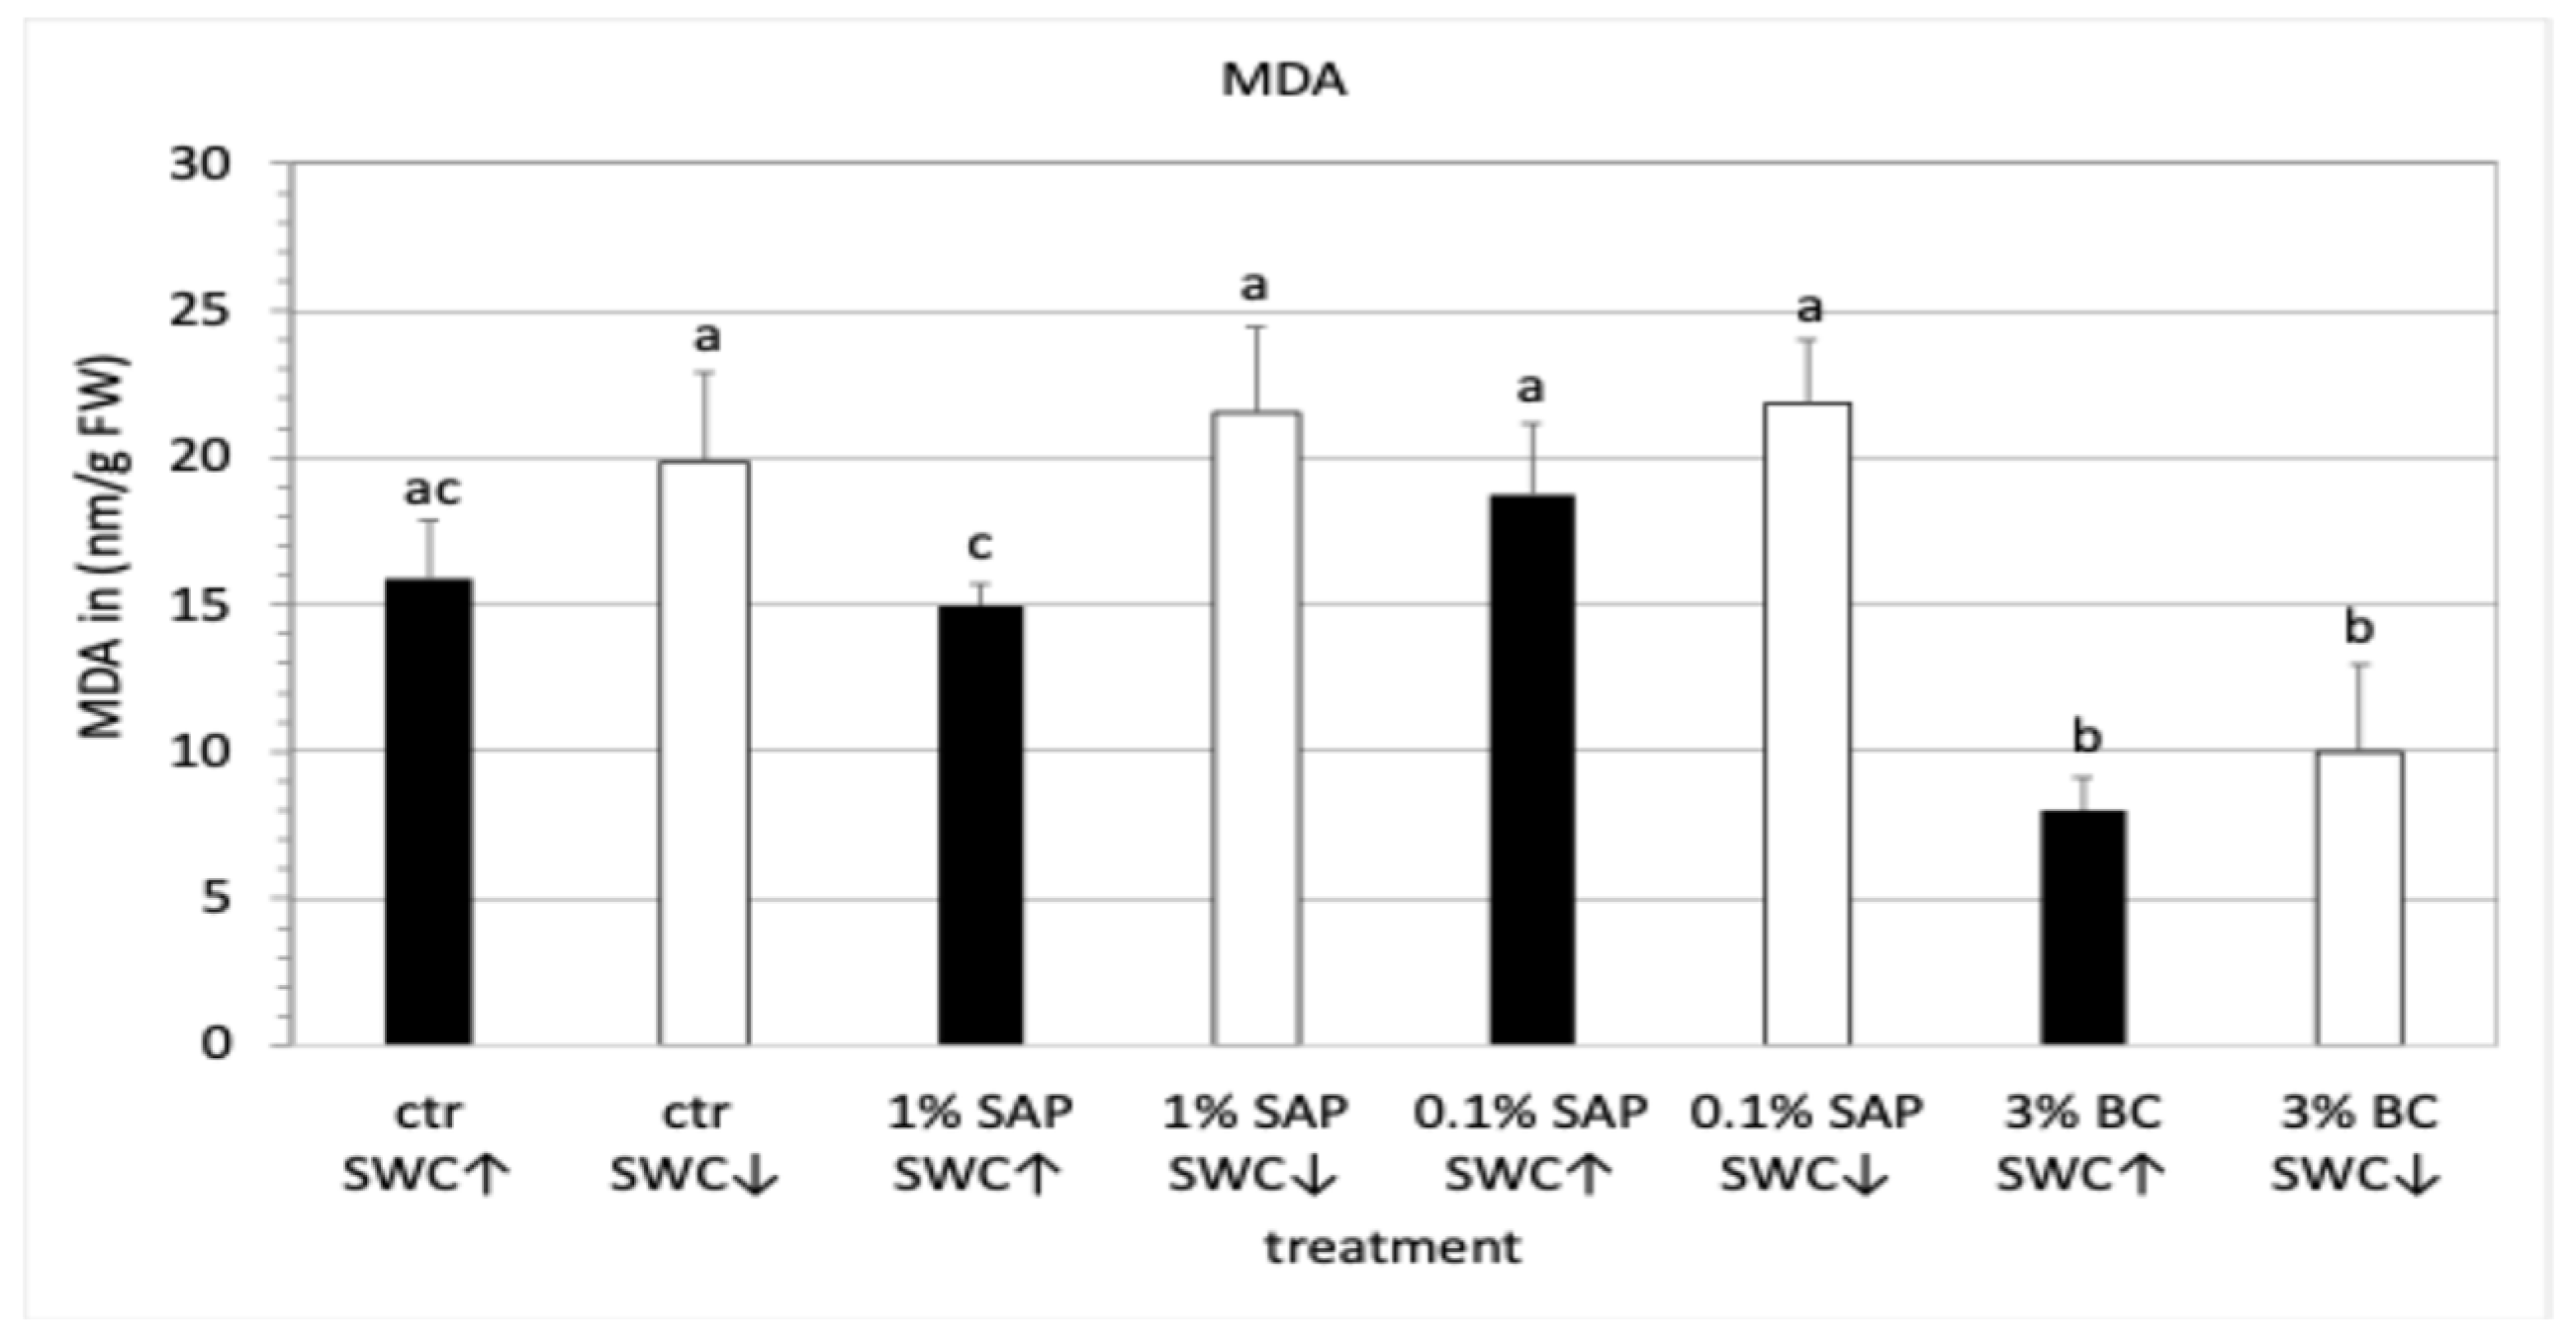
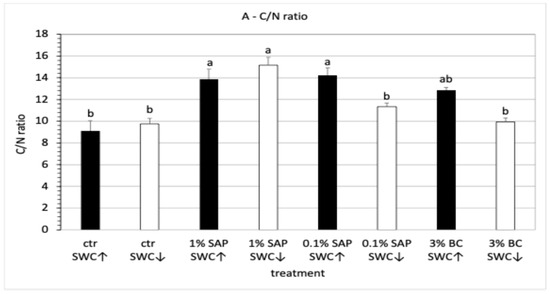
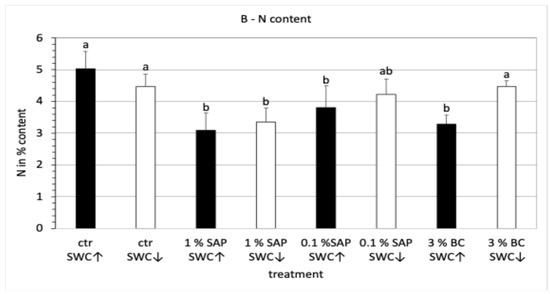
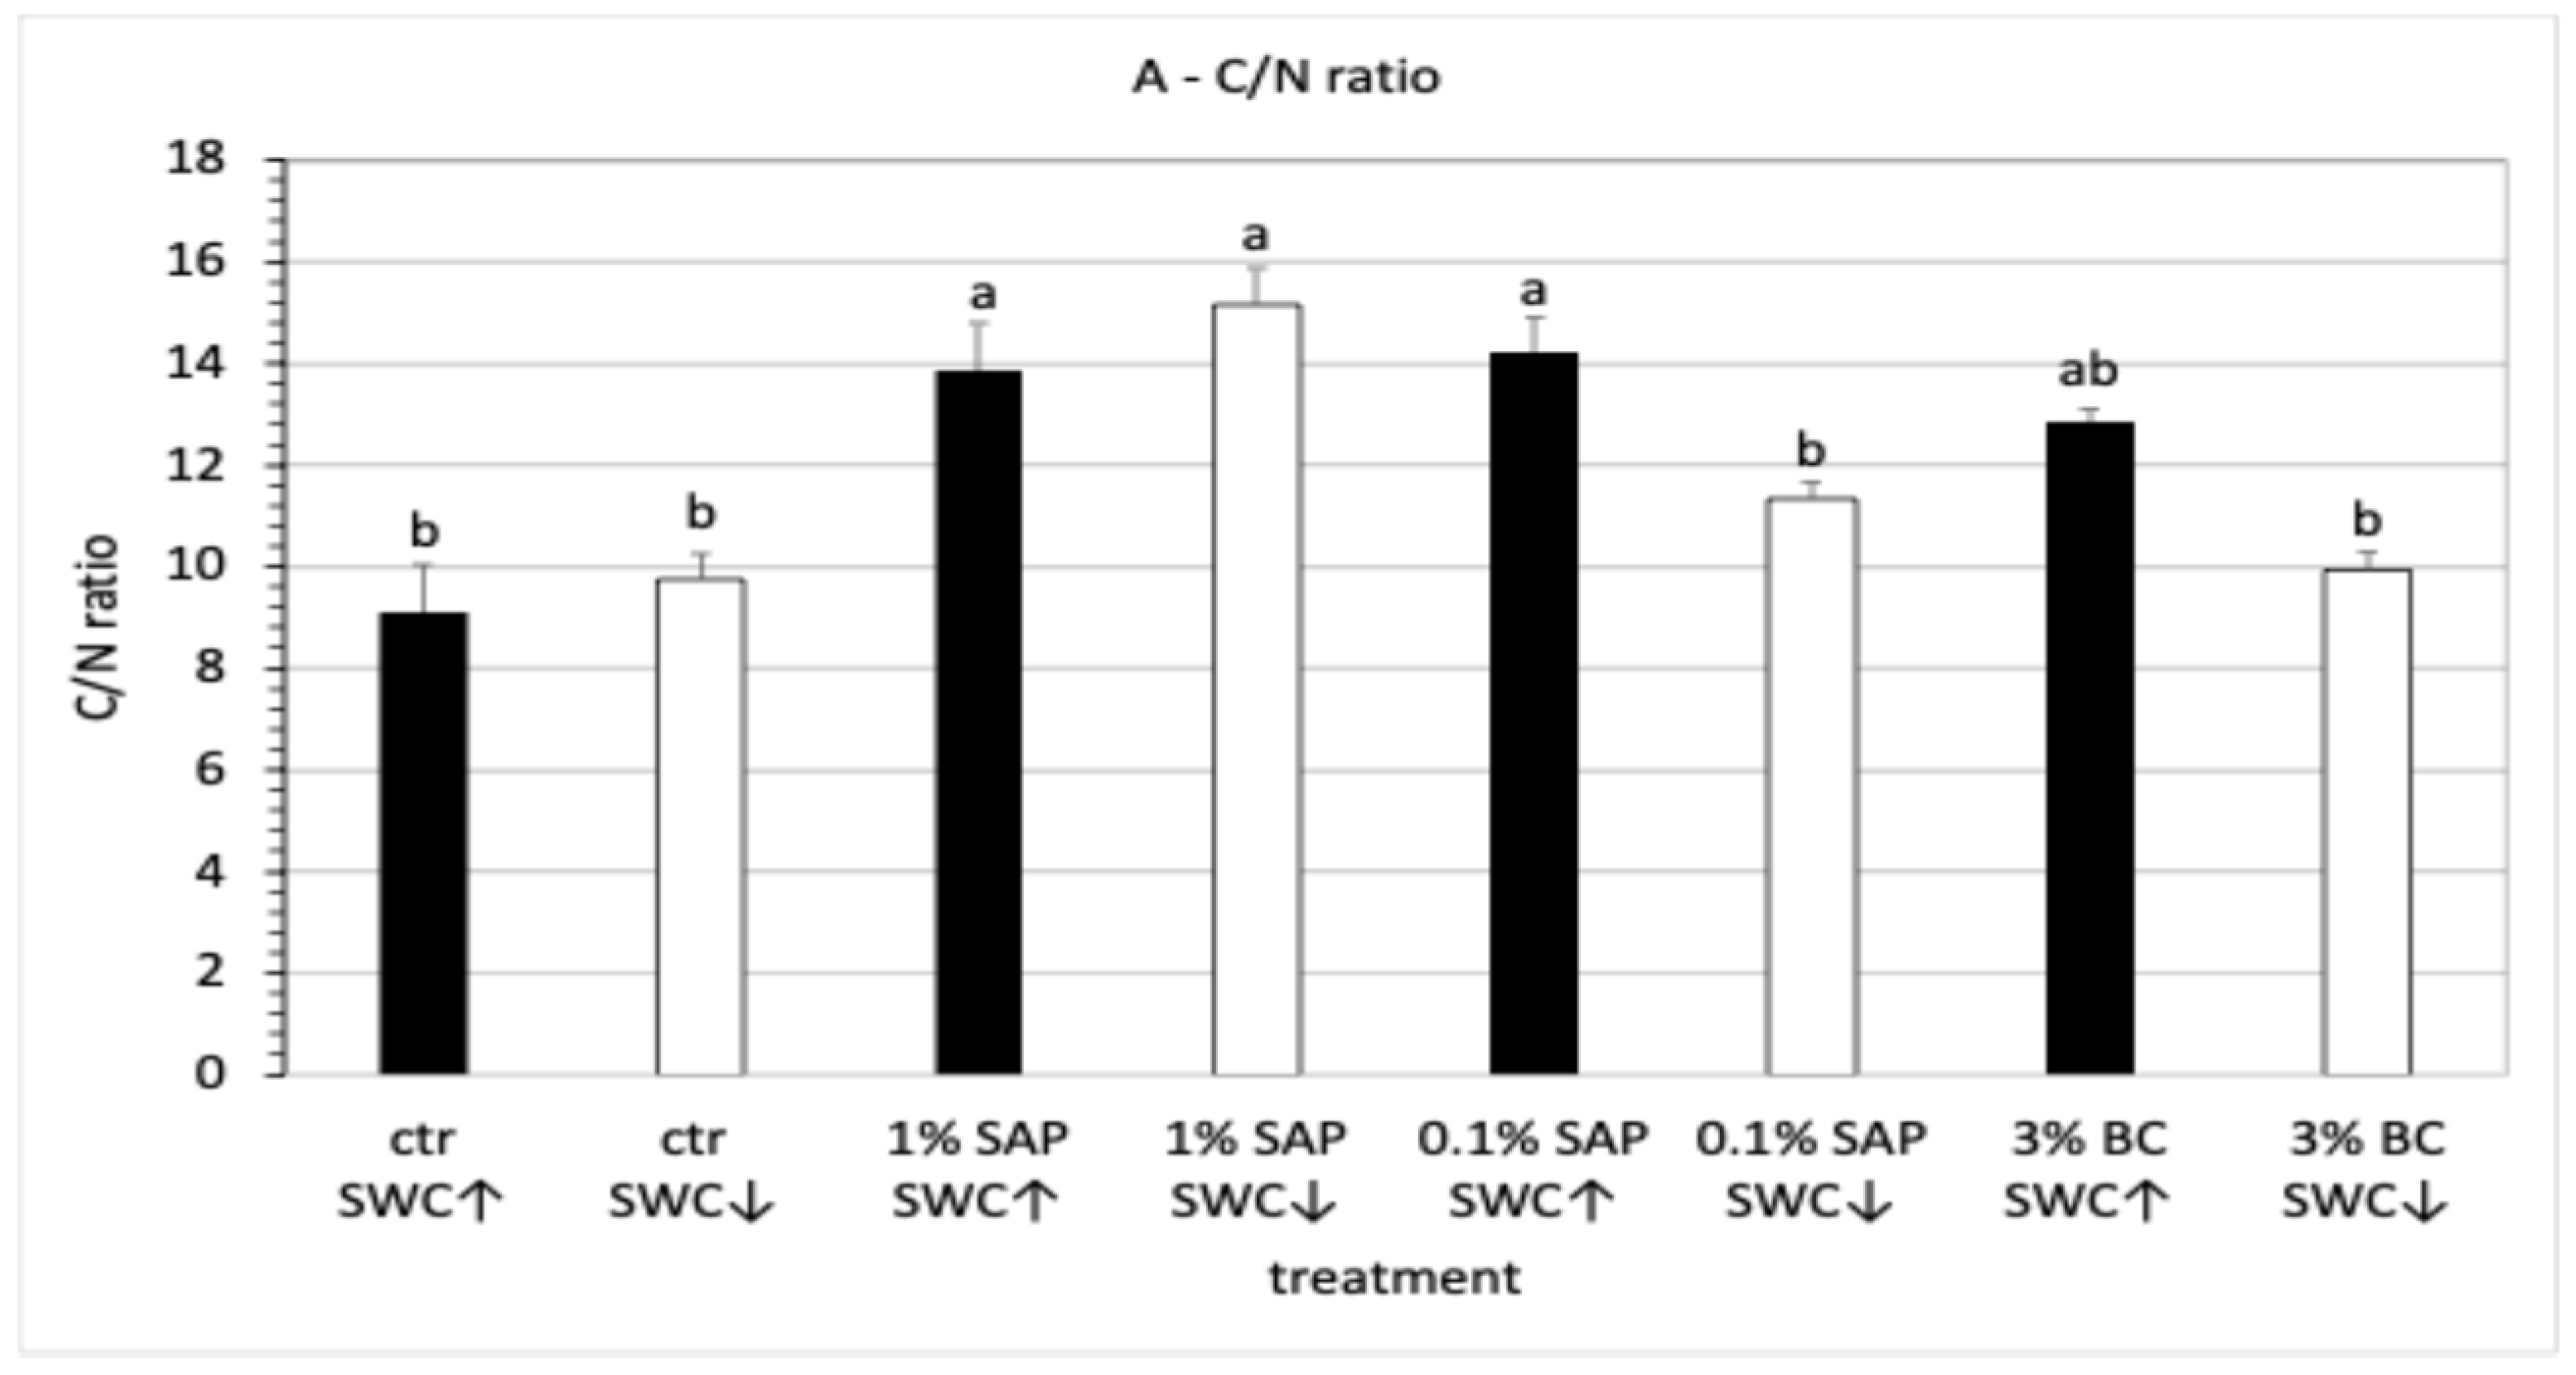
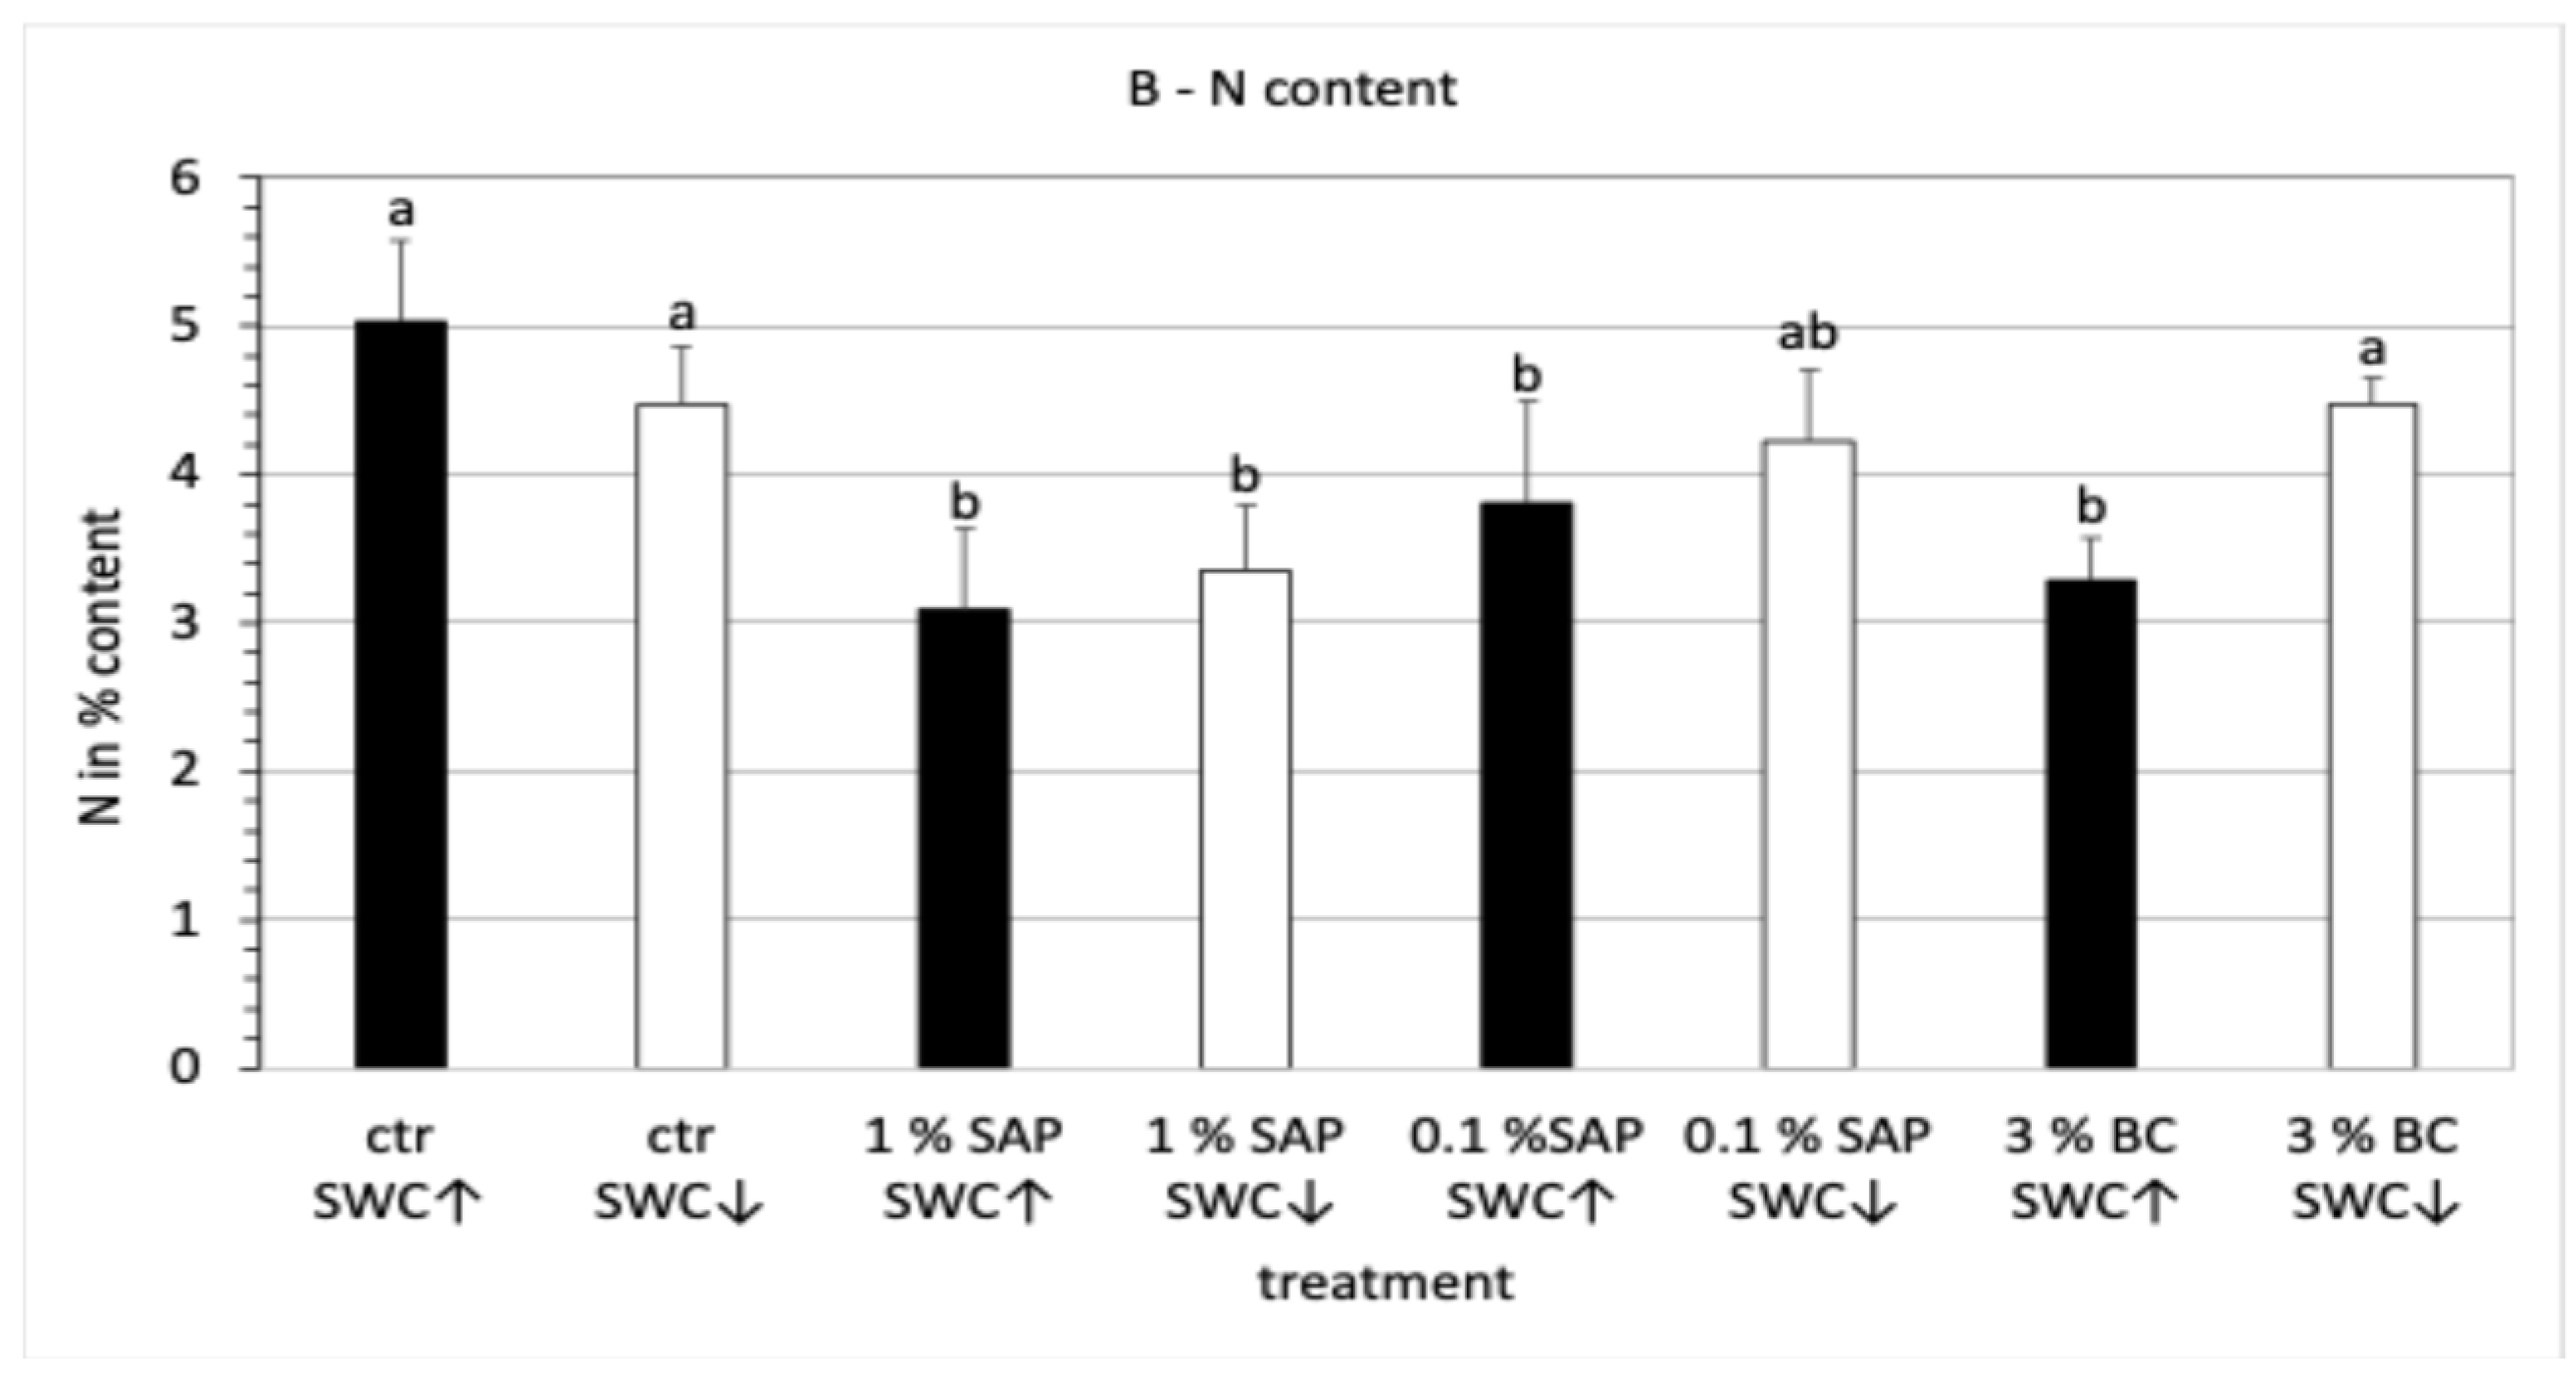
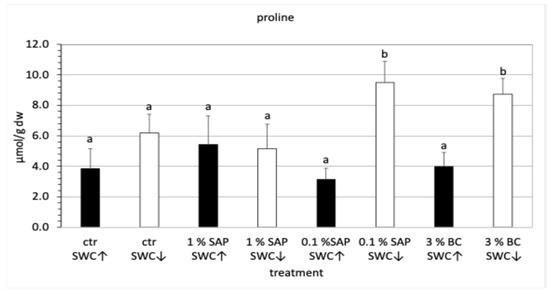
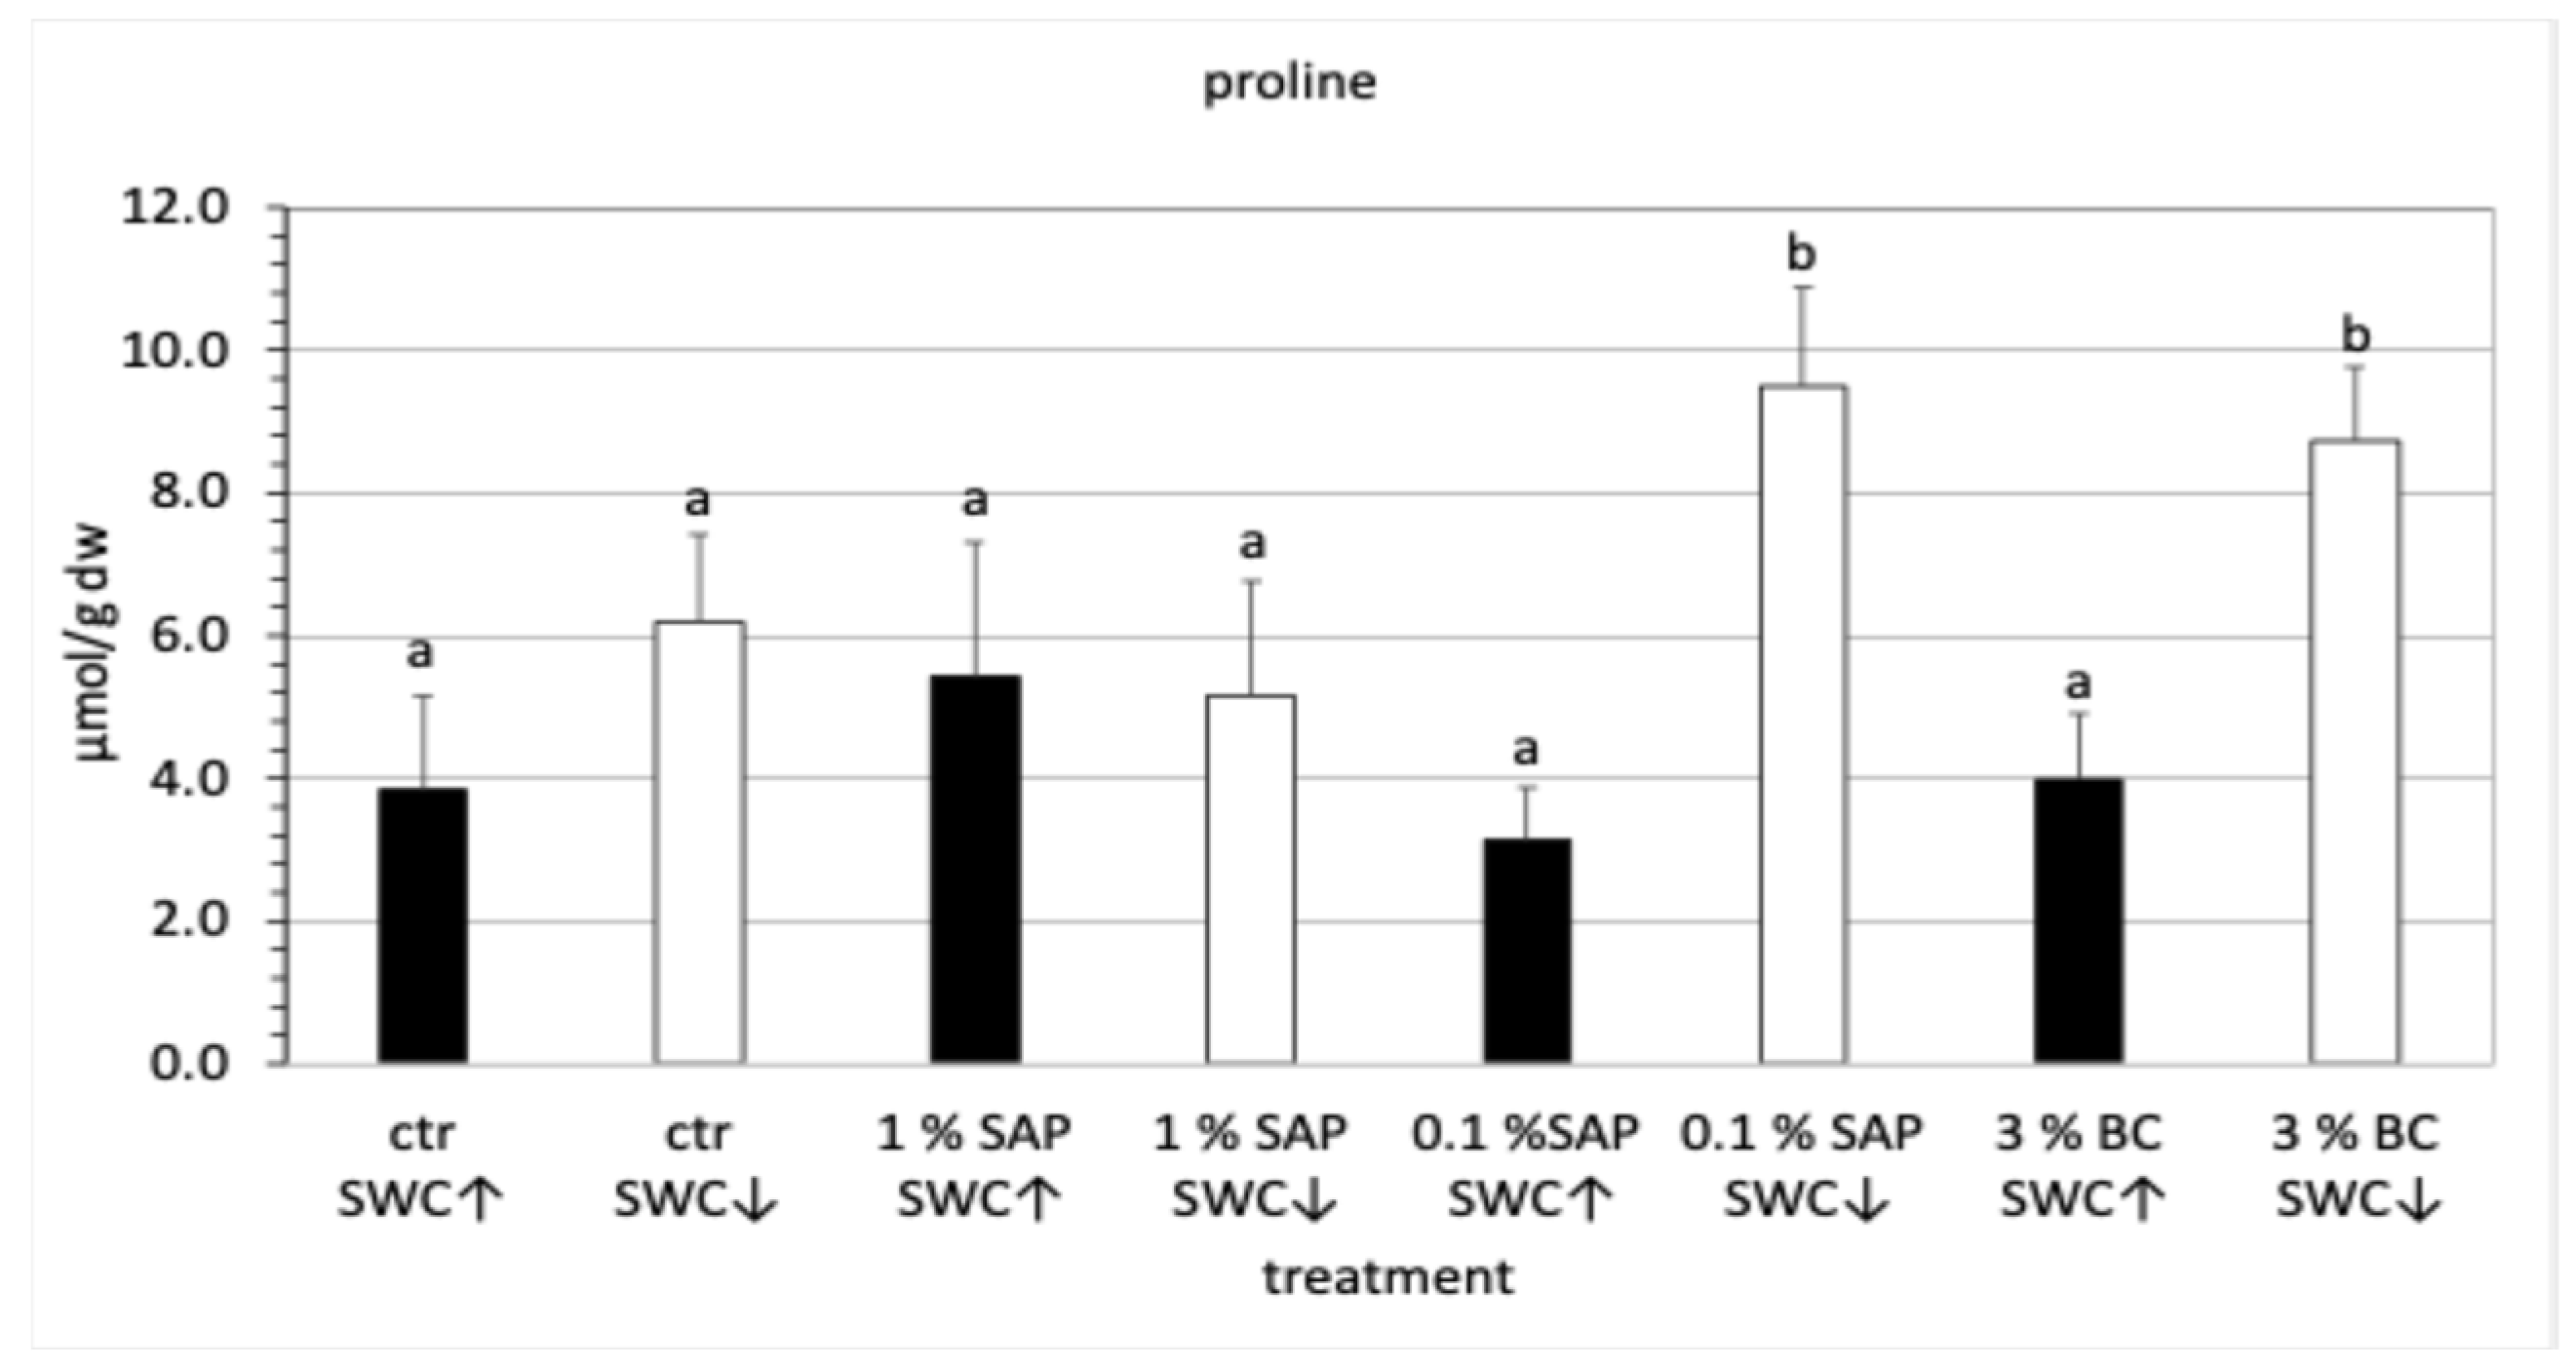

Disclaimer/Publisher’s Note: The statements, opinions and data contained in all publications are solely those of the individual author(s) and contributor(s) and not of MDPI and/or the editor(s). MDPI and/or the editor(s) disclaim responsibility for any injury to people or property resulting from any ideas, methods, instructions or products referred to in the content. |
© 2026 by the authors. Licensee MDPI, Basel, Switzerland. This article is an open access article distributed under the terms and conditions of the Creative Commons Attribution (CC BY) license.