


Abstract
Basaltic geological environments represent spatially heterogeneous regional contexts encompassing diverse mineralogical, hydrological, and geochemical characteristics. This nationwide exploratory ecological study examined whether basalt area ratio (BAR) was associated with dry-eye medication prescription volume across the 47 prefectures of Japan. The outcome was the annual number of bottles dispensed per 1000 population for three dry-eye medications in 2022. BAR was calculated using geographic information system data. Associations were evaluated using LOESS, covariate-adjusted restricted cubic splines, univariable and multiple linear regression, and sensitivity analyses using alternative denominators. Neither the overall spline association nor its nonlinear component was statistically significant. BAR was also not significantly associated with medication prescription volume in either the univariable or multiple linear regression analysis. Although the smoothing curves showed descriptive variation across the observed BAR range, the apparent nonlinear pattern was not statistically supported or consistently reproduced across analytical methods. Thus, the available prefecture-level data provided no statistical evidence of an association between basalt coverage and dry-eye medication utilisation. BAR should be interpreted as an indicator of regional geological context rather than as a measure of natural H2 production or human exposure. Future studies should incorporate direct environmental measurements, finer spatial resolution, seasonal data, and clinical dry-eye outcomes.
1. Introduction
Dry eye disease is a multifactorial disorder of the ocular surface characterised by tear-film instability, ocular discomfort, and visual disturbance [1]. It is common in Japan and represents a clinically and socioeconomically important health burden. In a prospective multicentre survey of 990 ophthalmology outpatients in Japan, 55.7% met the diagnostic criteria for dry eye disease, and 15.2% of patients attending follow-up visits had previously undiagnosed disease [2]. Dry eye disease can impair visual function, daily activities, quality of life, and work productivity, thereby generating substantial consequences for patients and society [3]. Its development and persistence are influenced by demographic, systemic, ocular, behavioural, climatic, and healthcare-related factors, including older age, visual display terminal use, environmental conditions, and access to ophthalmic care [4,5,6,7,8,9,10]. These factors may contribute to geographical variation in both disease burden and treatment utilisation. Accordingly, regional prescription volume may provide a healthcare-utilisation indicator related to, but distinct from, the underlying prevalence of dry eye disease [11,12,13].
Oxidative stress is increasingly recognised as an important component of dry eye pathophysiology [14,15,16,17,18]. Excessive production of reactive oxygen species and impairment of antioxidant defences can damage corneal and conjunctival epithelial cells, promote ocular-surface inflammation, and contribute to a self-perpetuating cycle of tear-film instability and epithelial injury. Accordingly, redox-modulating interventions have attracted interest as potential approaches to dry eye disease [18]. Therapeutically administered molecular hydrogen (H2) has been investigated in several forms, including inhaled H2 gas, hydrogen-rich water or saline, and H2-producing products [19,20,21,22]. Its proposed biological actions include modulation of oxidative stress, inflammatory signalling, mitochondrial function, and cell-death pathways [19,20,22]. Experimental and preliminary clinical studies have also suggested that H2-related interventions may promote tear secretion, protect the lacrimal gland, and maintain tear-film stability [23,24]. However, these findings were obtained under controlled therapeutic or experimental conditions and cannot be directly extrapolated to hypothetical environmental exposure to naturally occurring H2. They provide a biological rationale for future investigation but do not establish that basaltic environments generate H2 at concentrations relevant to ocular health.
Naturally occurring H2 has emerged as an important subject in geological hydrogen research [25,26]. Geological H2 can be generated through several processes, including water–rock reactions involving reduced iron-bearing minerals [25,26,27,28]. Mafic and ultramafic rocks have consequently attracted attention as potential source rocks for geological H2 [26,27,28,29]. Experimental studies have demonstrated that basalt–water interactions can generate H2 under particular physicochemical and redox conditions [29,30,31]. However, the occurrence and magnitude of H2 generation depend strongly on mineralogical composition, reaction temperature, water availability, fluid circulation, and subsurface redox conditions [25,31,32,33,34]. Evidence of H2 generation under experimental or subsurface conditions does not demonstrate its release into the ambient environment or exposure of nearby populations. Therefore, surface basalt coverage alone cannot establish active H2 generation, migration to the surface, or human-relevant environmental exposure.
Environmental determinants of health are generally evaluated using climatic conditions, air pollutants, and features of the built environment [7,8,9,35]. Prefecture-level ecological studies using publicly available Japanese datasets have also demonstrated the feasibility of integrating regional environmental indicators with healthcare-utilisation outcomes [11,12,36]. Geological environments, however, have received comparatively little attention in pharmacoepidemiological research, despite representing stable and spatially heterogeneous background conditions [37,38]. Regional geology may influence mineral and soil composition, groundwater chemistry, hydrological and geothermal processes, and the generation and migration of naturally occurring gases [25,37,38,39]. Geological information may therefore complement demographic, climatic, pollution-related, and healthcare-related indicators when characterising regional environmental context. Nevertheless, geological characteristics should be interpreted as contextual indicators and not as direct measures of individual environmental exposure.
Japan is a tectonically active volcanic archipelago with geographically heterogeneous distributions of volcanic and basaltic formations [40]. This geological diversity provides an opportunity to quantify basalt distribution as a prefecture-level indicator of regional geological context. In the present study, the basalt area ratio (BAR) was evaluated solely as such a contextual indicator and was not treated as a measure or proxy of individual H2 exposure. BAR does not represent H2 concentrations in the atmosphere, soil gas, or groundwater, nor does it establish the occurrence or rate of geological H2 generation. Rather, it may reflect a broader geological setting encompassing mineral composition, soil properties, groundwater chemistry, hydrological conditions, and naturally occurring gas-related processes [41,42]. Natural H2 generation through basalt–water interactions was therefore considered only as one hypothetical pathway within this broader geological context, not as an exposure or mechanism demonstrated by the present study.
Against this background, we conducted a nationwide prefecture-level ecological study to examine the association between BAR and dry-eye medication prescription volume across all 47 Japanese prefectures. Both linear and nonlinear relationships were evaluated using complementary statistical approaches, with adjustment for the proportion of residents aged ≥65 years, annual sunshine duration, annual mean PM2.5 concentration, and board-certified ophthalmologist density. The primary objective was to determine whether the available prefecture-level data provided statistical evidence of an association between regional basalt distribution and dry-eye medication utilisation. The study was exploratory and hypothesis-generating and was not designed to establish causality, individual-level relationships, geological H2 generation, or human exposure to H2.
2. Materials and Methods
2.1. Study Design
This nationwide prefecture-level ecological study was designed as an exploratory, hypothesis-generating analysis to characterise regional patterns and evaluate potential linear and nonlinear relationships between BAR and dry-eye medication prescription volume across Japan. The unit of analysis was the prefecture, and all 47 prefectures were included. The study used publicly available aggregate data and was not designed to estimate causal effects or individual-level associations.
2.2. Dry-Eye Medication Prescription Data
Annual prefecture-level prescription volumes for three dry-eye medications—Mucosta (rebamipide), Mytear (sodium hyaluronate), and Diquas (diquafosol sodium) ophthalmic products—in 2022 were obtained from the National Database of Health Insurance Claims and Specific Health Checkups of Japan (NDB Open Data), maintained by the Ministry of Health, Labour and Welfare [43,44]. The NDB data represent the quantities of ophthalmic products dispensed, expressed as the number of bottles, rather than the number of prescriptions or patients. The NDB captures health-insurance claims from nearly the entire Japanese population [43]. Prefectural population data for the corresponding year were obtained from official national statistics [45]. The quantities of the three ophthalmic products were summed within each prefecture. The primary outcome was the annual number of bottles dispensed per 1000 population, calculated by dividing the summed prefecture-level quantity by the prefectural population and multiplying by 1000. Because population size was already incorporated into the outcome definition, it was not entered separately as an explanatory variable in the multivariable models. Only annually aggregated prescription data were available in the NDB Open Data used in this study; therefore, prescription volume could not be analysed by month or season.
2.3. Geological Data and Calculation of BAR
Geological data were obtained from the Seamless Digital Geological Map of Japan, Version 2, provided by the Geological Survey of Japan, National Institute of Advanced Industrial Science and Technology [40,46]. Basalt polygons were identified from the lithological attributes of the geological map and spatially overlaid with prefectural administrative boundaries in QGIS [47]. For each prefecture, basalt polygons were clipped to the prefectural boundary, their areas were summed, and BAR was calculated as follows: BAR (%) = basalt area within the prefecture (km2)/total prefectural land area (km2) × 100. BAR was treated as a continuous geological indicator in all inferential analyses.
2.4. Covariate Data
Four prefecture-level covariates were selected a priori based on established or plausible determinants of dry eye disease and regional medication utilisation, the availability of consistently defined data corresponding to 2022, and the need to limit model complexity given the 47 observational units. The selected covariates represented four relevant domains: demographic structure, climatic conditions, air pollution, and ophthalmic healthcare availability. These variables were the proportion of residents aged ≥65 years (%), annual sunshine duration (hours/year), annual mean PM2.5 concentration (μg/m3), and board-certified ophthalmologist density (number per 100,000 population). Older age is an established demographic risk factor for dry eye disease, whereas climatic conditions and air pollution may affect ocular-surface symptoms. Board-certified ophthalmologist density was included as an indicator of regional access to specialised ophthalmic care and opportunities for diagnosis and treatment [4,5,6,7,8,9,10].
All covariate data corresponded to 2022. Data on the proportion of residents aged ≥65 years and clinic counts were obtained from publicly available national statistics [45,48]. Prefecture-level counts of board-certified ophthalmologists were obtained from the Board-Certified Ophthalmologist Search database maintained by the Japanese Ophthalmological Society [49]. Annual sunshine duration was obtained from the Japan Meteorological Agency [50]. Annual mean PM2.5 concentrations were obtained from the 2022 Air Pollution Monitoring Data Files available through the Environmental Observatory of the National Institute for Environmental Studies, Japan [51]. Board-certified ophthalmologist density was calculated by dividing the number of board-certified ophthalmologists listed for each prefecture by the corresponding prefectural population and multiplying by 100,000. The total number of clinics of all specialties and the absolute number of board-certified ophthalmologists in each prefecture were additionally used as alternative denominators in sensitivity analyses of prescription volume. Other potentially relevant factors, including humidity, temperature, socioeconomic conditions, occupational and indoor environmental exposures, healthcare-seeking behaviour, and regional prescribing preferences, were not included in the multivariable model. The number of covariates was restricted to maintain model parsimony relative to the 47 observational units and to reduce the risk of overfitting. Potential residual confounding by unmeasured regional characteristics was therefore considered when interpreting the results.
2.5. Geographic Visualisation
The geographic distributions of BAR and dry-eye medication prescription volume per 1000 population were visualised using prefecture-level choropleth maps generated in QGIS [47]. Each variable was classified into ten categories based on its empirical deciles across the 47 prefectures. The category thresholds are reported in Supplementary Table S1. The maps were used for descriptive visualisation and not for statistical inference.
2.6. Statistical Analysis
2.6.1. Descriptive Statistics
Continuous variables were summarised using the mean and standard deviation, median, interquartile range, minimum, and maximum. All analyses used prefecture-level observations (n = 47).
2.6.2. Exploratory LOESS Analysis
The unadjusted relationship between BAR and dry-eye medication prescription volume per 1000 population was examined using locally estimated scatterplot smoothing (LOESS) [52], with a smoothing span (frac) of 0.6. Pointwise 95% confidence intervals were calculated from 300 nonparametric bootstrap resamples [53] of the 47 prefectures, sampled with replacement. No threshold or turning point was prespecified; the LOESS curve was used to visualise the shape of the observed association.
2.6.3. Covariate-Adjusted Restricted Cubic Spline Analysis
To examine the adjusted shape of the relationship between BAR and dry-eye medication prescription volume while allowing for nonlinearity, a restricted cubic spline regression model [54] was fitted with dry-eye medication prescription volume per 1000 population as the dependent variable. BAR was modelled using three knots placed at the 10th, 50th, and 90th percentiles of its distribution. The model was adjusted for the proportion of residents aged ≥65 years, annual sunshine duration, annual mean PM2.5 concentration, and board-certified ophthalmologist density. Adjusted predicted prescription volumes and 95% confidence intervals were estimated across the observed BAR range while holding the covariates at their respective mean values. The overall association between BAR and prescription volume and the nonlinear component of the association were evaluated using nested F tests comparing the relevant reduced and full models.
2.6.4. Sensitivity Analyses Using Alternative Prescription Denominators
To assess whether the descriptive pattern depended on the denominator used to express regional prescription volume, additional LOESS analyses were conducted using prescription volume per 1000 population, prescription volume per clinic of any specialty, and prescription volume per board-certified ophthalmologist. These analyses were used to compare the qualitative shapes of the smoothed curves and were interpreted as sensitivity analyses rather than as independent confirmatory tests.
2.6.5. Univariable and Multiple Linear Regression Analyses
Separate univariable linear regression models were first fitted to estimate the crude association of each explanatory variable with dry-eye medication prescription volume per 1000 population. The explanatory variables were BAR, the proportion of residents aged ≥65 years, annual sunshine duration, annual mean PM2.5 concentration, and board-certified ophthalmologist density. A multiple linear regression model was then fitted as a conventional linear reference analysis to estimate the mutually adjusted associations. Dry-eye medication prescription volume per 1000 population was the dependent variable, and all five explanatory variables were entered simultaneously. For both the univariable and multiple regression analyses, unstandardised coefficients, standard errors, 95% confidence intervals, standardised β coefficients, and p values were calculated. Overall fit of the multiple regression model was summarised using R2, adjusted R2, and the model F test. Multicollinearity in the multiple regression model was assessed using variance inflation factors.
2.6.6. Exploratory Supplementary Random Forest Analysis
Random forest regression [55] was conducted as an exploratory supplementary analysis to assess whether a flexible prediction model identified patterns not captured by the prespecified regression models. The model included BAR, the proportion of residents aged ≥65 years, annual sunshine duration, annual mean PM2.5 concentration, and board-certified ophthalmologist density as explanatory variables, with dry-eye medication prescription volume per 1000 population as the outcome. Predictive performance was evaluated using OOB RMSE and OOB R2. Repeated OOB permutation importance was used to describe the model-specific contribution of each explanatory variable, and the marginal pattern between BAR and predicted prescription volume was visualised using a partial dependence plot [56]. Because the analysis included only 47 prefectures, these outputs were treated as model-specific exploratory results and were not used as evidence of association or causality. Full model specifications, hyperparameter assessment, and graphical outputs are provided in Supplementary Figures S2 and S3 and Supplementary Table S2.
2.6.7. Statistical Inference and Software
All statistical tests were two-sided, with p < 0.05 considered statistically significant. Given the exploratory and hypothesis-generating design, effect estimates, 95% confidence intervals, p values, and overall model performance were considered together. LOESS curves and random forest outputs were treated as descriptive exploratory results and were not interpreted independently as evidence of association. No adjustment for multiple testing was applied. Analyses were performed using Python (version 3.13.9) with pandas (version 2.3.3), NumPy (version 2.3.5), statsmodels (version 0.14.5), scikit-learn (version 1.7.2) [57], and Matplotlib (version 3.10.6). Geospatial processing and mapping were performed using QGIS (version 3.40.10).
2.7. Ethical Considerations
This study used only publicly available aggregate data and included no individual-level or personally identifiable information. Therefore, ethical approval and informed consent were not required under the applicable Japanese ethical guidelines.
3. Results
3.1. Regional Distributions and Descriptive Characteristics
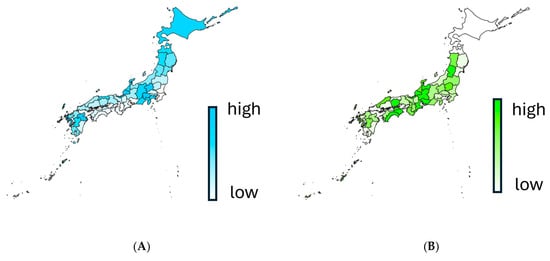
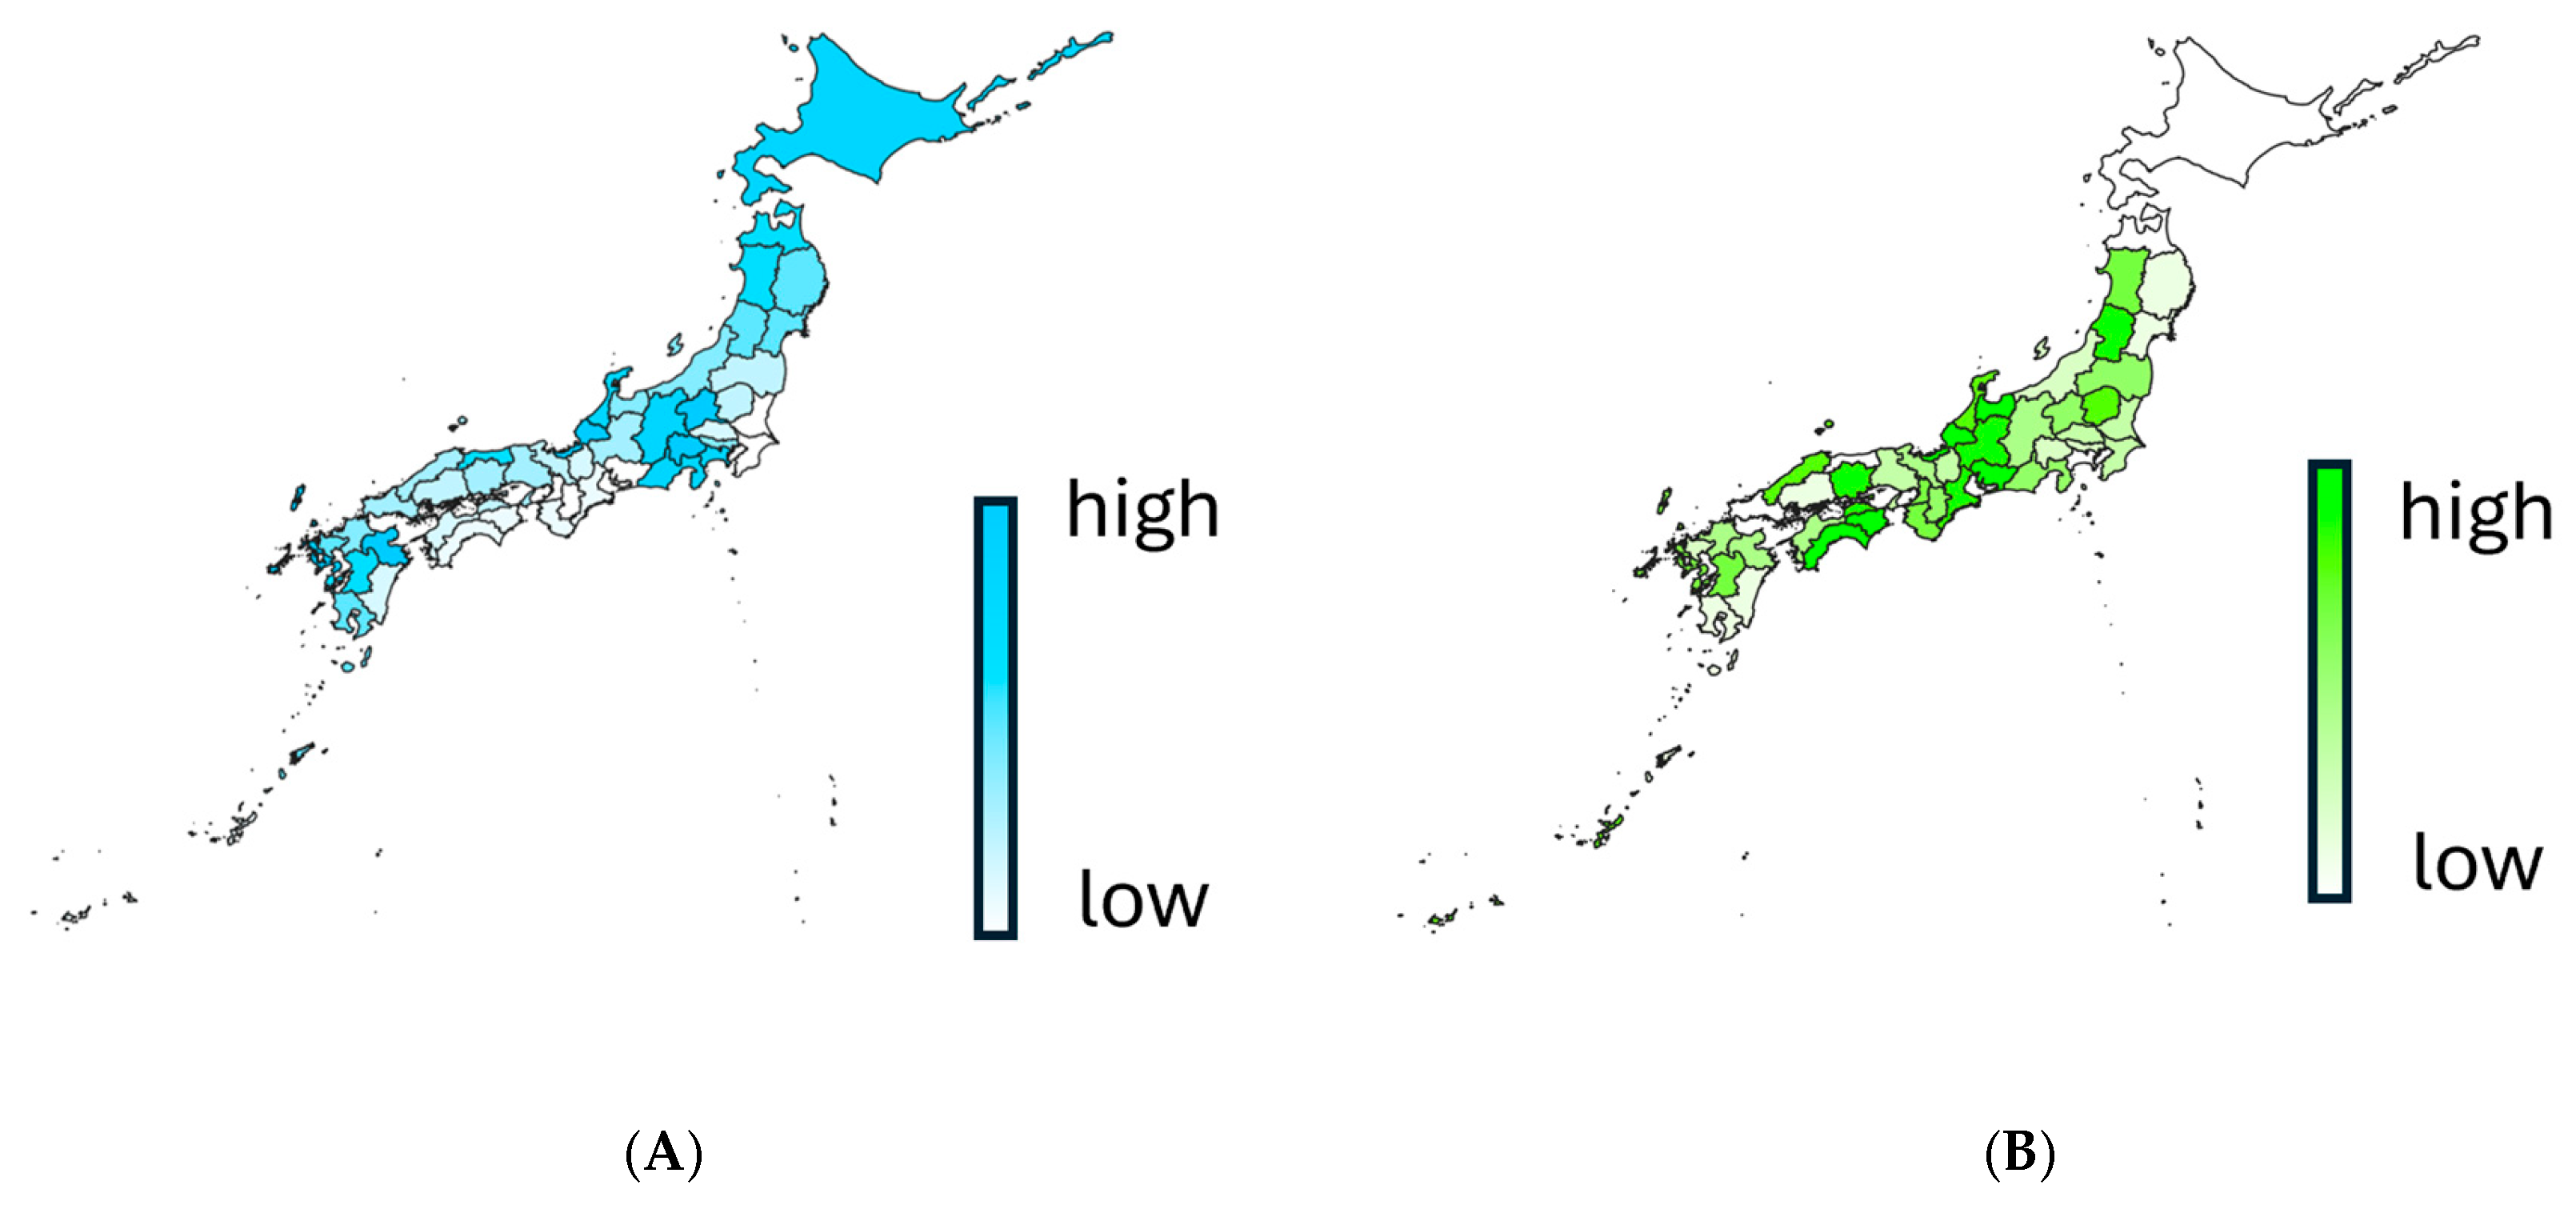
Dry-eye medication prescription volume and BAR varied substantially across the 47 prefectures of Japan (Figure 1). The mean number of bottles dispensed was 479.00 ± 290.11 per 1000 population, with a median of 378.85 and a range of 78.70–1183.40. The mean BAR was 12.41 ± 9.31%, ranging from 0.31% to 32.88%. Descriptive statistics for the outcome, BAR, and covariates are presented in Table 1. The decile thresholds used for the choropleth maps are provided in Supplementary Table S1.
Figure 1.
Geographic distributions of basalt area ratio and dry-eye medication prescription volume across Japan. Prefecture-level choropleth maps show (A) basalt area ratio (BAR, %) and (B) dry-eye medication prescription volume per 1000 population across the 47 prefectures of Japan. Both variables were classified into deciles; the corresponding category thresholds are provided in Supplementary Table S1. Darker colours indicate higher values.
Table 1.
Descriptive characteristics of the study variables across the 47 prefectures of Japan.
3.2. Relationship Between BAR and Dry-Eye Medication Prescription Volume
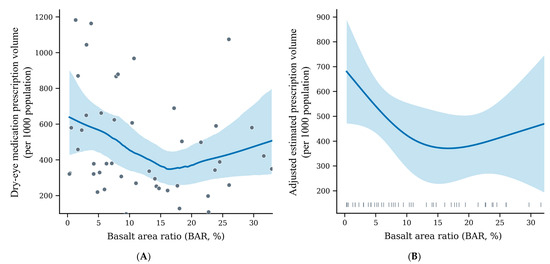
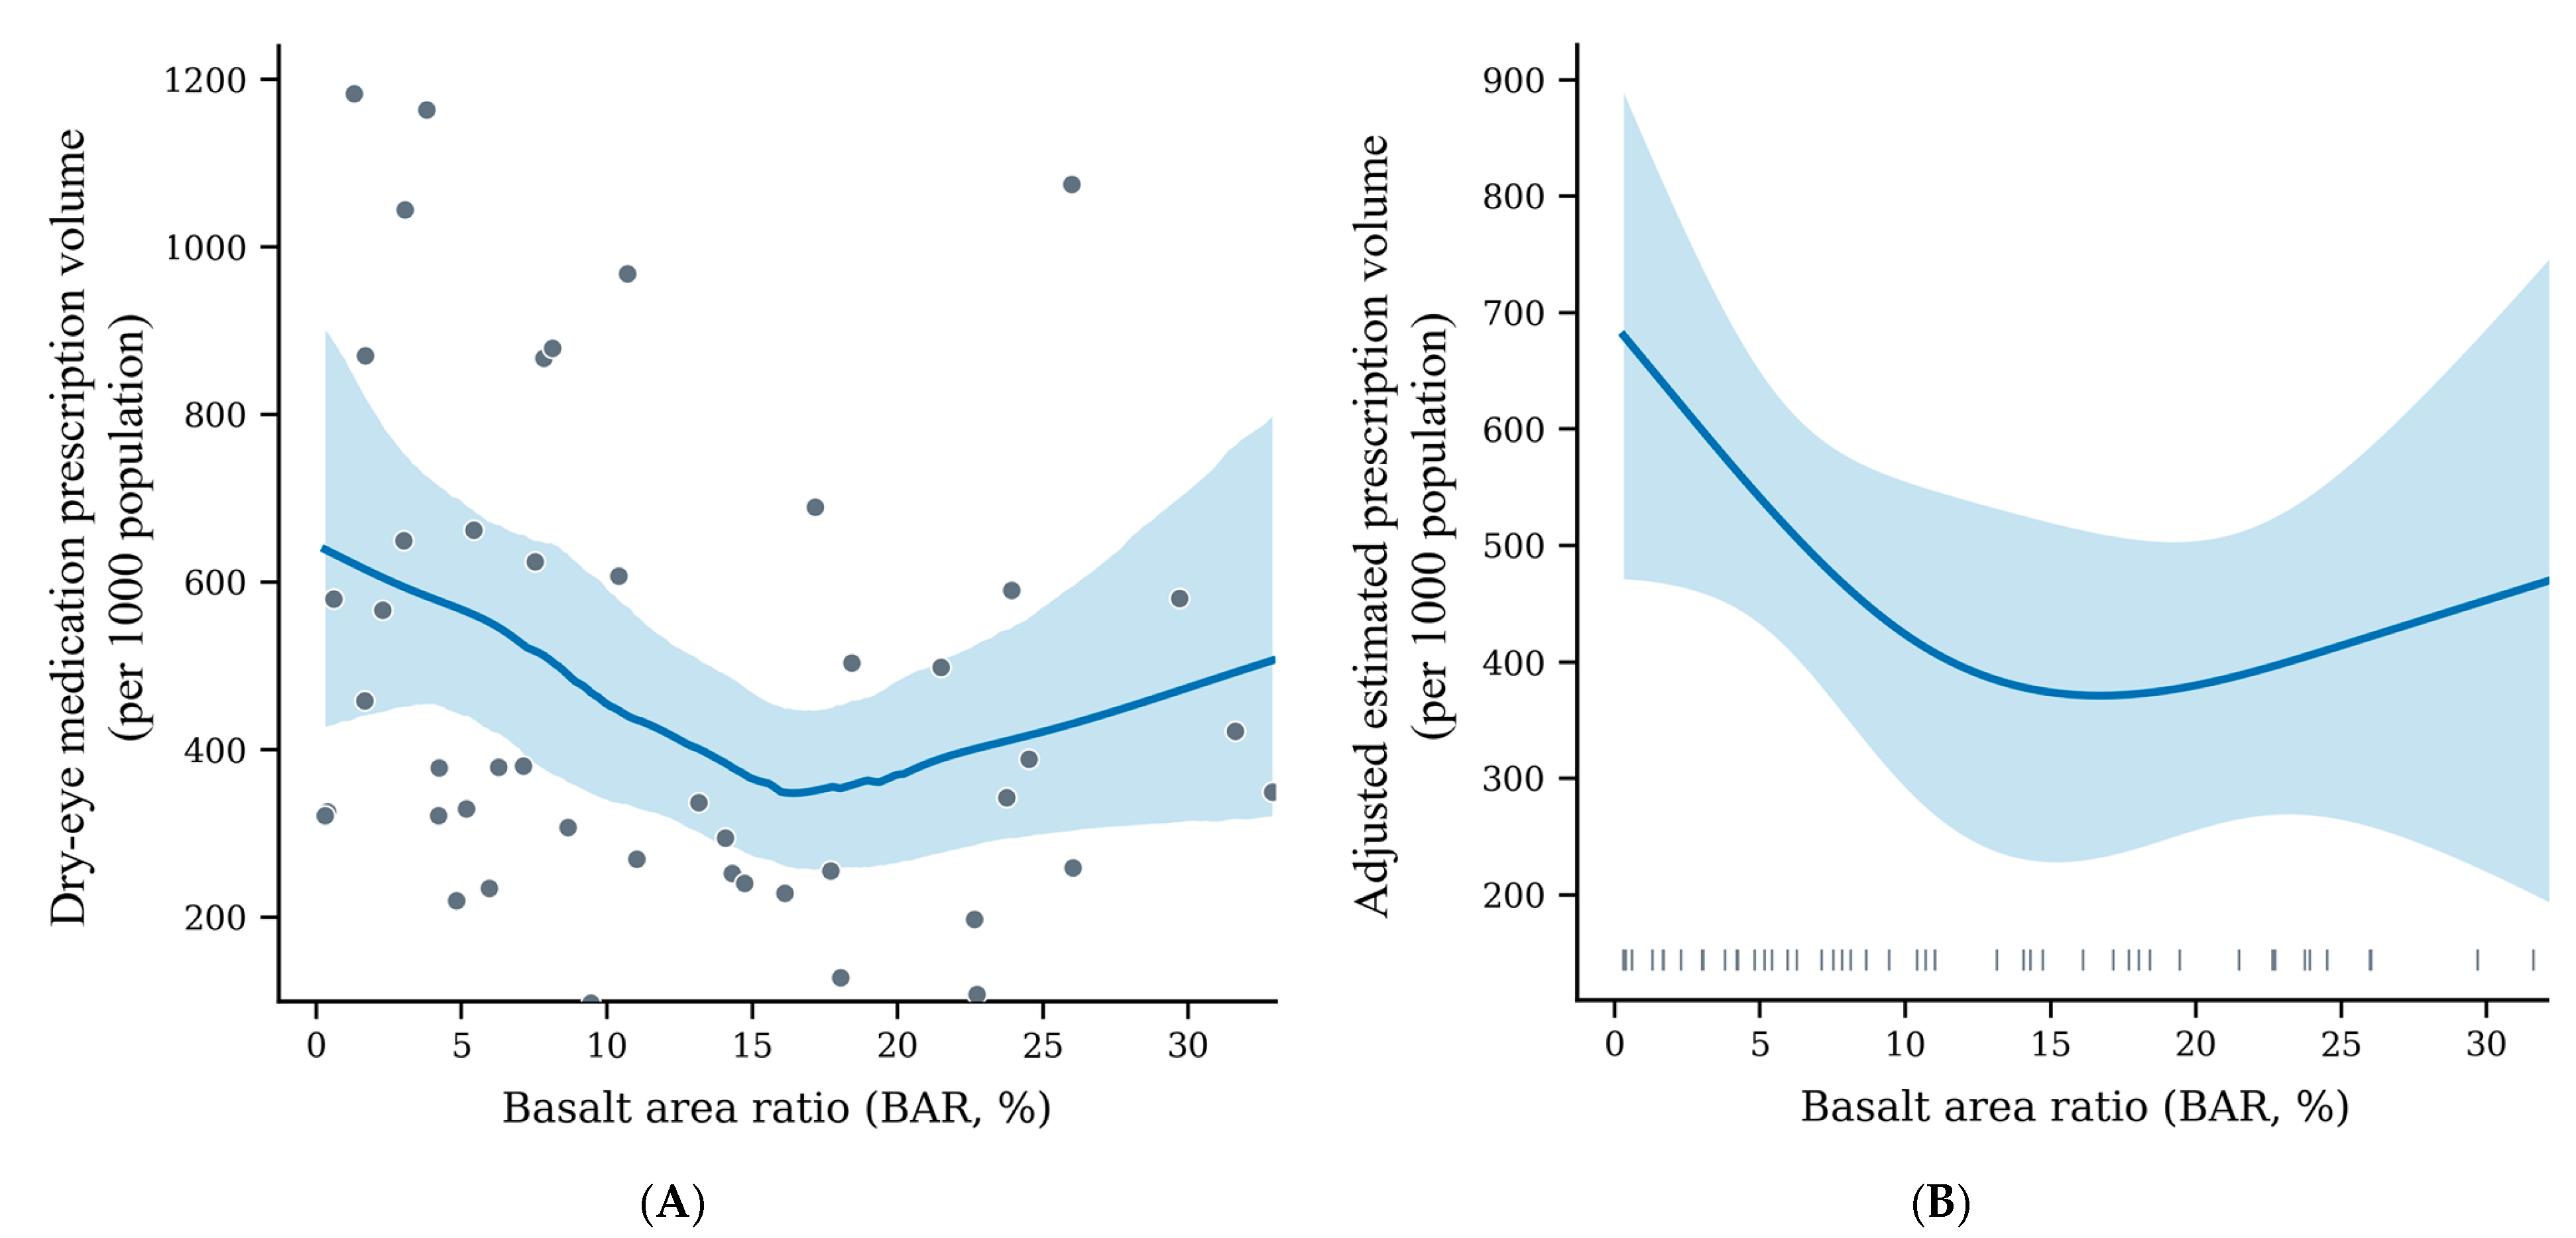
The unadjusted LOESS curve descriptively showed a decrease in dry-eye medication prescription volume from low to intermediate BAR levels, with the lowest fitted values at approximately 15–18% BAR, followed by an increase at higher BAR levels (Figure 2A). Pointwise confidence intervals widened toward the ends of the BAR distribution, where relatively few prefectures were represented. The LOESS curve was used for descriptive visualisation and was not subjected to formal hypothesis testing.
Figure 2.
Relationship between basalt area ratio and dry-eye medication prescription volume. (A) Unadjusted LOESS curve for the prefecture-level number of dry-eye medication bottles dispensed per 1000 population. Points represent individual prefectures. The solid line represents the fitted LOESS curve, and the shaded area represents the pointwise 95% confidence interval estimated using nonparametric bootstrap resampling. (B) Covariate-adjusted restricted cubic spline curve accounting for the proportion of residents aged ≥65 years, annual sunshine duration, annual mean PM2.5 concentration, and board-certified ophthalmologist density. Three knots were placed at the 10th, 50th, and 90th percentiles of the BAR distribution. The solid line represents the adjusted predicted prescription volume, and the shaded area represents its 95% confidence interval. Rug marks indicate the observed BAR values. BAR, basalt area ratio; LOESS, locally estimated scatterplot smoothing; PM2.5, particulate matter with an aerodynamic diameter ≤ 2.5 μm.
The covariate-adjusted restricted cubic spline curve showed a broadly similar descriptive pattern (Figure 2B). However, neither the overall association with BAR nor the nonlinear component was statistically significant (overall association, F(2, 40) = 2.319, p = 0.111; nonlinearity, F(1, 40) = 2.175, p = 0.148). Thus, the spline analysis did not provide statistical evidence of either an overall or nonlinear association between BAR and prescription volume. Sensitivity analyses using prescription volume per 1000 population, per clinic, and per board-certified ophthalmologist showed descriptively comparable LOESS patterns, with the lowest fitted values generally located at intermediate BAR levels (Supplementary Figure S1).
3.3. Univariable and Multiple Linear Regression Analyses
In the univariable analyses, none of the five explanatory variables was statistically significantly associated with dry-eye medication prescription volume (Table 2). The crude coefficient for BAR was −7.90 bottles per 1000 population per one-percentage-point increase in BAR (95% CI: −16.95 to 1.16; standardised β = −0.253; p = 0.086).
Table 2.
Univariable and multiple linear regression analyses of dry-eye medication prescription volume.
In the multiple linear regression model, BAR was not statistically significantly associated with prescription volume after adjustment for the proportion of residents aged ≥65 years, annual sunshine duration, annual mean PM2.5 concentration, and board-certified ophthalmologist density (adjusted coefficient = −7.34, 95% CI: −16.93 to 2.24; standardised β = −0.236; p = 0.129). None of the covariates showed a statistically significant adjusted association. Annual mean PM2.5 concentration had the largest absolute standardised coefficient (standardised β = −0.311; p = 0.078), although its confidence interval included the null. The overall model was not statistically significant and explained a limited proportion of the regional variation in prescription volume (R2 = 0.158; adjusted R2 = 0.055; F(5, 41) = 1.539; p = 0.199). Variance inflation factors ranged from 1.104 to 1.460, indicating no substantial multicollinearity.
3.4. Exploratory Supplementary Random Forest Analysis
The random forest model showed limited predictive performance, with an OOB RMSE of 280.83 bottles dispensed per 1000 population and an OOB R2 of 0.043. Consequently, the permutation-importance ranking and partial-dependence pattern were treated as model-specific descriptive outputs and were not interpreted as evidence of an association between BAR and prescription volume. Full results are presented in Supplementary Figures S2 and S3 and Supplementary Table S2.
4. Discussion
This nationwide prefecture-level ecological study found no statistically significant association between BAR and dry-eye medication prescription volume across the 47 prefectures of Japan. Neither the overall association nor the nonlinear component was statistically significant in the covariate-adjusted restricted cubic spline model. Similarly, BAR was not significantly associated with medication volume in either the univariable or multiple linear regression analysis, and the multiple regression model explained only a limited proportion of the regional variation. The random forest model also showed poor out-of-bag predictive performance. Thus, the present data do not provide statistical evidence that prefecture-level basalt coverage is associated with regional dry-eye medication utilisation.
The LOESS and restricted cubic spline curves showed a descriptive decrease in fitted medication volume from low to intermediate BAR values, followed by an increase at higher values. However, confidence intervals widened toward the extremes of the BAR distribution, and the descriptive pattern was not consistently reproduced across analytical methods. Given the small number of prefectures, the nonsignificant spline tests, and the poor predictive performance of the random forest model, this curve shape should not be interpreted as evidence of a U-shaped or other nonlinear association. At most, it represents a descriptive feature that may be evaluated in future studies with larger samples and direct exposure measurements.
BAR directly quantifies the geographic extent of basaltic formations and was used in this study as an indicator of regional geological context. Geological characteristics may be relevant to environmental health research because they can influence mineral and soil composition, groundwater chemistry, hydrological and geothermal processes, and the generation and migration of naturally occurring gases [25,35,37,38,39]. However, BAR does not quantify any of these processes directly and should not be interpreted as a measure of individual exposure. The present null findings indicate that basalt coverage alone was insufficient to explain regional variation in dry-eye medication utilisation.
Natural H2 generation through water–rock interactions represents one possible but context-dependent process associated with basaltic and other Fe(II)-bearing rocks [25,26,27,28,29,30,33,34]. However, basalt coverage alone does not determine the amount, persistence, migration, or human accessibility of naturally occurring H2. These processes also depend on mineralogy, water availability, temperature, pH, redox conditions, geological structures, and microbial consumption [28,39,58,59,60]. Furthermore, the present study included no measurements of H2 in air, soil gas, or groundwater. Consequently, the present findings neither support nor refute a role of natural H2 in ocular health.
Therapeutically administered molecular H2 has been investigated in several forms, including inhaled H2 gas, hydrogen-rich water or saline, and H2-producing products [19,20,21,22]. Its proposed biological actions include modulation of oxidative stress, inflammatory signalling, mitochondrial function, and cell-death pathways. These mechanisms may be relevant to dry-eye disease, and experimental or preliminary clinical studies have reported potential effects of H2-related interventions on tear secretion, lacrimal-gland injury, and tear-film stability [23,24]. However, these studies involved controlled therapeutic or experimental administration and cannot be extrapolated to unmeasured, potentially trace environmental H2 exposure. They therefore provide a biological rationale for future experimental research but do not explain the prefecture-level results of the present study.
The outcome of this study represents regional medication utilisation and should not be interpreted as a direct measure of dry-eye prevalence. The NDB data quantify the number of medication bottles dispensed [43,44] and therefore reflect a combination of underlying disease burden, diagnostic and prescribing practices, treatment duration, repeated prescription, product selection, adherence, and access to ophthalmic care. The study focused on three commonly used prescription products and did not include all prescription medications, over-the-counter preparations, or nonpharmacological treatments for dry eye. Accordingly, the outcome should be interpreted as a healthcare-utilisation indicator related to, but distinct from, the clinical occurrence and prevalence of dry-eye disease. Several limitations should also be considered. The ecological and cross-sectional design does not permit causal or individual-level inference [61,62], and the sample was necessarily limited to 47 prefectures. Nonlinear estimates, particularly at the extremes of the BAR distribution, were therefore accompanied by uncertainty. Residual confounding is possible because prefectural medication utilisation is affected by numerous clinical, behavioural, socioeconomic, meteorological, and healthcare-related factors. Several potentially relevant variables, including humidity, temperature, wind, socioeconomic conditions, occupational and indoor environmental exposures, healthcare-seeking behaviour, and regional prescribing preferences, were not included because of data availability and the need to limit model complexity with only 47 observational units. Seasonality is another potentially important source of unmeasured variation. Previous studies in Japan have reported seasonal differences in dry-eye-related procedures, tear meniscus volume, and dry-eye signs and symptoms [63,64,65]. However, the NDB Open Data used in the present study provided only annually aggregated medication volumes, precluding month- or season-specific analyses. Seasonal variation and regional meteorological differences may therefore have contributed to residual confounding or obscured prefecture-level associations. Prefectures also contain substantial internal variation, and BAR calculated from total land area may not fully represent the geological environments of populated areas. Spatial autocorrelation and cross-boundary environmental processes were not explicitly modelled. In addition, random forest hyperparameter selection and OOB performance assessment were conducted within the same prefecture-level dataset, and no independent validation dataset was available; therefore, the reported predictive performance should not be interpreted as externally validated. Finally, direct measurements of H2, groundwater chemistry, soil gas, and other potential geochemical mediators were unavailable. These considerations define the scope of the present findings and indicate the measurements needed to examine the proposed mechanisms more directly.
Despite these limitations, this study has several important strengths. It included all 47 Japanese prefectures and integrated nationwide health-insurance claims data with a standardised national geological dataset. BAR was calculated using a reproducible geographic information system procedure and analysed as a continuous measure, allowing the shape of the association to be evaluated without imposing arbitrary exposure categories. The use of complementary analytical methods allowed both linear and nonlinear associations to be evaluated, although none provided robust evidence of an association between BAR and medication volume. Sensitivity analyses using alternative denominators also allowed the influence of outcome normalisation to be examined. More broadly, the study demonstrates a reproducible approach for incorporating geological background as a quantifiable environmental dimension in ecological studies of regional medication utilisation.
Future studies should examine this research question using direct environmental measurements to determine whether basalt distribution corresponds to measurable variation in natural H2 occurrence. Such studies could integrate geological mapping with direct measurements of H2 in groundwater, soil gas, and ambient air, as well as mineralogical composition, groundwater flow, redox conditions, and geological structures relevant to gas generation and migration [32,42,58]. Such analyses would clarify whether regional basalt distribution corresponds to measurable variation in natural H2 occurrence and whether the relevant geological settings overlap with populated areas. Municipality- or residential-level analyses could further reduce exposure misclassification. Combining these data with clinical measures of dry-eye prevalence, severity, tear-film function, and ocular-surface damage would allow potential geological associations to be evaluated using disease-related outcomes rather than medication utilisation alone. Finer-scale analyses and studies in other volcanic regions would also help determine whether any association is reproducible across different geographical settings.
5. Conclusions
This nationwide exploratory ecological study found no statistically significant association between prefecture-level BAR and dry-eye medication prescription volume in Japan. Descriptive smoothing curves showed variation across the observed BAR range, but the apparent nonlinear pattern was not statistically supported or consistently reproduced across analytical methods. BAR should be interpreted as an indicator of regional geological context rather than as a measure of natural H2 production or human exposure. Further studies incorporating direct measurements of environmental H2 and other geochemical characteristics, finer spatial resolution, seasonal data, and clinical measures of dry-eye disease are required before any geological or biological mechanism can be evaluated.
Supplementary Materials
The following supporting information can be downloaded at: https://www.mdpi.com/article/10.3390/environments13100541/s1, Table S1: Decile thresholds used for the prefecture-level choropleth maps; Figure S1: Sensitivity analyses using alternative normalisation methods; Figure S2: Selection of random forest hyperparameters using out-of-bag prediction error; Table S2: Random forest model configuration, performance, and analytical purpose; Figure S3: Random forest assessment of variable importance and the partial dependence of basalt area ratio.
Author Contributions
Conceptualization, R.S. and T.T.; methodology, R.S., G.S., Y.N. and N.T.; software, R.S. and Y.N.; validation, R.S., G.S. and T.T.; formal analysis, R.S., Y.T. and N.T.; investigation, R.S.; resources, R.S. and T.T.; data curation, R.S., Y.T. and G.S.; writing—original draft preparation, R.S. and Y.N.; writing—review and editing, R.S., T.A., A.N. and T.T.; visualization, R.S. and N.T.; supervision, T.A., A.N. and T.T.; project administration, R.S. All authors have read and agreed to the published version of the manuscript.
Funding
This research received no external funding.
Institutional Review Board Statement
Not applicable. This study used only publicly available, prefecture-level aggregate data and included no individual-level or personally identifiable information.
Informed Consent Statement
Not applicable.
Data Availability Statement
The data used in this study were obtained from publicly accessible governmental and institutional databases. Dry-eye medication data were obtained from the National Database of Health Insurance Claims and Specific Health Checkups of Japan (NDB) Open Data, and geological data were obtained from the Seamless Digital Geological Map of Japan provided by the Geological Survey of Japan, National Institute of Advanced Industrial Science and Technology. The prefecture-level dataset derived and analysed in this study is available from the corresponding author upon reasonable request. No individual-level or personally identifiable information was used. Access information for the original data sources is provided in the Materials and Methods section.
Acknowledgments
During the preparation of this manuscript, the authors used ChatGPT (GPT-5, OpenAI) for language editing and improving the structure and clarity of the manuscript. The authors reviewed and edited the output and take full responsibility for the content of this publication.
Conflicts of Interest
The authors declare no conflicts of interest.
Abbreviations
The following abbreviations are used in this manuscript:
| BAR | Basalt area ratio |
| GIS | Geographic information system |
| H2 | Molecular hydrogen |
| LOESS | Locally estimated scatterplot smoothing |
| MSE | Mean squared error |
| NDB | National Database of Health Insurance Claims and Specific Health Checkups of Japan |
| OOB | Out-of-bag |
| PM2.5 | Particulate matter with an aerodynamic diameter of 2.5 μm or less |
| RMSE | Root mean squared error |
| VIF | Variance inflation factor |
References
- Craig, J.P.; Nichols, K.K.; Akpek, E.K.; Caffery, B.; Dua, H.S.; Joo, C.-K.; Liu, Z.; Nelson, J.D.; Nichols, J.J.; Tsubota, K.; et al. TFOS DEWS II Definition and Classification Report. Ocul. Surf. 2017, 15, 276–283. [Google Scholar] [CrossRef] [Scilit] [PubMed]
- Shimazaki, J.; Nomura, Y.; Numa, S.; Murase, Y.; Kakinoki, K.; Abe, F.; Kato, Y.; Okabe, H.; Kishimoto, H.; Yamada, Y. Prospective, Multicenter, Cross-Sectional Survey on Dry Eye Disease in Japan. Adv. Ther. 2020, 37, 316–328. [Google Scholar] [CrossRef] [Scilit] [PubMed]
- Britten-Jones, A.C.; Wang, M.T.M.; Samuels, I.; Jennings, C.; Stapleton, F.; Craig, J.P. Epidemiology and Risk Factors of Dry Eye Disease: Considerations for Clinical Management. Medicina 2024, 60, 1458. [Google Scholar] [CrossRef] [Scilit] [PubMed]
- Qian, L.; Wei, W. Identified Risk Factors for Dry Eye Syndrome: A Systematic Review and Meta-Analysis. PLoS ONE 2022, 17, e0271267. [Google Scholar] [CrossRef] [Scilit] [PubMed]
- Stapleton, F.; Alves, M.; Bunya, V.Y.; Jalbert, I.; Lekhanont, K.; Malet, F.; Na, K.-S.; Schaumberg, D.; Uchino, M.; Ve-hof, J.; et al. TFOS DEWS II Epidemiology Report. Ocul. Surf. 2017, 15, 334–365. [Google Scholar] [CrossRef] [Scilit] [PubMed]
- Uchino, M.; Dogru, M.; Yagi, Y.; Goto, E.; Tomita, M.; Kon, T.; Saiki, M.; Matsumoto, Y.; Uchino, Y.; Yokoi, N.; et al. The features of dry eye disease in a Japanese elderly population. Optom. Vis. Sci. 2006, 83, 797–802. [Google Scholar] [CrossRef] [Scilit] [PubMed]
- Uchino, M.; Yokoi, N.; Uchino, Y.; Dogru, M.; Kawashima, M.; Komuro, A.; Sonomura, Y.; Kato, H.; Kinoshita, S.; Schaumberg, D.A.; et al. Prevalence of dry eye disease and its risk factors in visual display terminal users: The Osaka Study. Am. J. Ophthalmol. 2013, 156, 759–766.e1. [Google Scholar] [CrossRef] [Scilit] [PubMed]
- Alves, M.; Asbell, P.; Dogru, M.; Giannaccare, G.; Grau, A.; Gregory, D.; Kim, D.H.; Marini, M.C.; Ngo, W.; Nowinska, A.; et al. TFOS Lifestyle Report: Impact of environmental conditions on the ocular surface. Ocul. Surf. 2023, 29, 1–52. [Google Scholar] [CrossRef] [Scilit] [PubMed]
- Mandell, J.T.; Idarraga, M.; Kumar, N.; Galor, A. Impact of air pollution and weather on dry eye. J. Clin. Med. 2020, 9, 3740. [Google Scholar] [CrossRef] [Scilit] [PubMed]
- Kim, Y.; Choi, Y.H.; Kim, M.K.; Paik, H.J.; Kim, D.H. Different adverse effects of air pollutants on dry eye disease: Ozone, PM2.5, and PM10. Environ. Pollut. 2020, 265, 115039. [Google Scholar] [CrossRef] [Scilit] [PubMed]
- Shinkai, R.; Tomita, T. A pharmacoepidemiological indicator for detecting potential regional overuse of hypnotics in Japan: A cross-sectional study. Cureus 2025, 17, e96960. [Google Scholar] [CrossRef] [Scilit] [PubMed]
- Shinkai, R.; Amemiya, T.; Tomita, T. Environmental context related to hydrogen sulphide and regional variation in utilisation of ROCK inhibitors in Japan: A nationwide ecological analysis. Sci. Rep. 2026, 16, 26091. [Google Scholar] [CrossRef] [Scilit] [PubMed]
- Shinkai, R.; Shinohara, G.; Amemiya, T.; Tomita, T. Association Between Volcanic Rock Area Ratio and Regional Variation in Acne Medication Utilisation in Japan: A Nationwide Ecological Study. Environments 2026, 13, 537. [Google Scholar] [CrossRef] [Scilit]
- Bron, A.J.; de Paiva, C.S.; Chauhan, S.K.; Bonini, S.; Gabison, E.E.; Jain, S.; Knop, E.; Markoulli, M.; Ogawa, Y.; Perez, V.; et al. TFOS DEWS II Pathophysiology Report. Ocul. Surf. 2017, 15, 438–510, Erratum in Ocul. Surf. 2019, 17, 842. [Google Scholar] [CrossRef] [Scilit] [PubMed]
- Dogru, M.; Kojima, T.; Simsek, C.; Tsubota, K. Potential role of oxidative stress in ocular surface inflammation and dry eye disease. Invest. Ophthalmol. Vis. Sci. 2018, 59, DES163–DES168. [Google Scholar] [CrossRef] [Scilit] [PubMed]
- Kojima, T.; Wakamatsu, T.H.; Dogru, M.; Ogawa, Y.; Igarashi, A.; Ibrahim, O.M.A.; Inaba, T.; Shimizu, T.; Noda, S.; Obata, H.; et al. Age-related dysfunction of the lacrimal gland and oxidative stress: Evidence from the Cu,Zn-superoxide dismutase-1 knockout mice. Am. J. Pathol. 2012, 180, 1879–1896. [Google Scholar] [CrossRef] [Scilit] [PubMed]
- Wakamatsu, T.H.; Dogru, M.; Matsumoto, Y.; Kojima, T.; Kaido, M.; Ibrahim, O.M.A.; Sato, E.A.; Igarashi, A.; Ichihashi, Y.; Satake, Y.; et al. Evaluation of lipid oxidative stress status in Sjögren syndrome patients. Invest. Ophthalmol. Vis. Sci. 2013, 54, 201–210. [Google Scholar] [CrossRef] [Scilit] [PubMed]
- Sies, H.; Berndt, C.; Jones, D.P. Oxidative stress. Annu. Rev. Biochem. 2017, 86, 715–748. [Google Scholar] [CrossRef] [Scilit] [PubMed]
- Ohsawa, I.; Ishikawa, M.; Takahashi, K.; Watanabe, M.; Nishimaki, K.; Yamagata, K.; Katsura, K.; Katayama, Y.; Asoh, S.; Ohta, S. Hydrogen acts as a therapeutic antioxidant by selectively reducing cytotoxic oxygen radicals. Nat. Med. 2007, 13, 688–694. [Google Scholar] [CrossRef] [Scilit] [PubMed]
- Ohta, S. Molecular hydrogen as a preventive and therapeutic medical gas: Initiation, development and potential of hydrogen medicine. Pharmacol. Ther. 2014, 144, 1–11. [Google Scholar] [CrossRef] [Scilit] [PubMed]
- Shinkai, R.; Tomita, T. Hydrogen-enriched saline for redox modulation during hydrosurgical debridement: A hy-pothesis for promoting wound healing. Hydrogen 2026, 7, 64. [Google Scholar] [CrossRef] [Scilit]
- Jin, J.; Yue, L.; Du, M.; Geng, F.; Gao, X.; Zhou, Y.; Lu, Q.; Pan, X. Molecular Hydrogen Therapy: Mechanisms, Delivery Methods, Preventive, and Therapeutic Application. MedComm 2025, 6, e70194. [Google Scholar] [CrossRef] [Scilit] [PubMed]
- Kubota, M.; Kawashima, M.; Inoue, S.; Imada, T.; Nakamura, S.; Kubota, S.; Watanabe, M.; Takemura, R.; Tsubota, K. Randomized, crossover clinical efficacy trial in humans and mice on tear secretion promotion and lacrimal gland protection by molecular hydrogen. Sci. Rep. 2021, 11, 6434. [Google Scholar] [CrossRef] [Scilit] [PubMed]
- Kawashima, M.; Tsuno, S.; Matsumoto, M.; Tsubota, K. Hydrogen-producing milk to prevent reduction in tear stability in persons using visual display terminals. Ocul. Surf. 2019, 17, 714–721. [Google Scholar] [CrossRef] [Scilit] [PubMed]
- Zgonnik, V. The occurrence and geoscience of natural hydrogen: A comprehensive review. Earth-Sci. Rev. 2020, 203, 103140. [Google Scholar] [CrossRef] [Scilit]
- Klein, F.; Tarnas, J.D.; Bach, W. Abiotic sources of molecular hydrogen on Earth. Elements 2020, 16, 19–24. [Google Scholar] [CrossRef] [Scilit]
- Sleep, N.H.; Meibom, A.; Fridriksson, T.; Coleman, R.G.; Bird, D.K. H2-rich fluids from serpentinization: Geochemical and biotic implications. Proc. Natl. Acad. Sci. USA 2004, 101, 12818–12823. [Google Scholar] [CrossRef] [Scilit] [PubMed]
- Mayhew, L.E.; Ellison, E.T.; McCollom, T.M.; Trainor, T.P.; Templeton, A.S. Hydrogen generation from low-temperature water–rock reactions. Nat. Geosci. 2013, 6, 478–484. [Google Scholar] [CrossRef] [Scilit]
- Stevens, T.O.; McKinley, J.P. Abiotic controls on H2 production from basalt–water reactions and implications for aquifer biogeochemistry. Environ. Sci. Technol. 2000, 34, 826–831. [Google Scholar] [CrossRef] [Scilit]
- Al-Yaseri, A.; Desouky, M.; Aljawad, M.S.; Hassanpouryouzband, A. Evidence of hydrogen release during CO2 sequestration in basalt. Int. J. Hydrogen Energy 2025, 101, 1183–1190. [Google Scholar] [CrossRef] [Scilit]
- Huang, L.; Liu, Q.; Steefel, C.; Liu, Y.; Hu, M.; Liu, S.; Zhang, Y.; Tang, X. Generating H2 during CO2 sequestration in basalt formations. Geomech. Geophys. Geo-Energy Geo-Resour. 2025, 11, 4, Correction in Geomech. Geophys. Geo-Energy Geo-Resour. 2025, 11, 127. [Google Scholar] [CrossRef] [Scilit]
- Mao, S.; Yu, S.; Xu, J.; Chen, H.; Zhao, W.; Blunt, M.J.; Kang, Q.; Gross, M.R.; Chen, B.; Van Wijk, J.; et al. Geologic hydrogen: A review of resource potential, subsurface dynamics, exploration, production, transportation, and research opportunities. Energy Environ. Sci. 2025, 18, 9991–10035, Correction in Energy Environ. Sci. 2026, 19, 5549. [Google Scholar] [CrossRef] [Scilit]
- Isah, A.; Samouei, H.; Okoroafor, E.R. Assessing the effect of mineralogy and reaction pathways on geological hydrogen (H2) generation in ultramafic and mafic (basaltic) rocks. Hydrogen 2025, 6, 76. [Google Scholar] [CrossRef] [Scilit]
- Al-Yaseri, A.; Fatah, A.; Amao, A.; Wolff-Boenisch, D. Basalt–hydrogen–water interactions at geo-storage conditions. Energy Fuels 2023, 37, 15138–15152. [Google Scholar] [CrossRef] [Scilit]
- Nuckols, J.R.; Ward, M.H.; Jarup, L. Using geographic information systems for exposure assessment in environ-mental epidemiology studies. Environ. Health Perspect. 2004, 112, 1007–1015. [Google Scholar] [CrossRef] [Scilit] [PubMed]
- Shinkai, R.; Tomita, T. Onion Shipment Volume and Colorectal Cancer Mortality in Japan: An Ecological Study Using a Nationwide Health Insurance Claims Database. Cureus 2025, 17, e92189. [Google Scholar] [CrossRef] [Scilit] [PubMed]
- Skinner, H.C.W. The Earth, source of health and hazards: An introduction to medical geology. Annu. Rev. Earth Planet. Sci. 2007, 35, 177–213. [Google Scholar] [CrossRef] [Scilit]
- Selinus, O.; Alloway, B.; Centeno, J.A.; Finkelman, R.B.; Fuge, R.; Lindh, U.; Smedley, P. Essentials of Medical Geology: Impacts of the Natural Environment on Public Health; Elsevier Academic Press: Amsterdam, The Netherlands, 2005. [Google Scholar]
- Tamburello, G.; Chiodini, G.; Ciotoli, G.; Procesi, M.; Rouwet, D.; Sandri, L.; Carbonara, N.; Masciantonio, C. Global thermal spring distribution and relationship to endogenous and exogenous factors. Nat. Commun. 2022, 13, 6378. [Google Scholar] [CrossRef] [Scilit] [PubMed]
- Geological Survey of Japan; AIST. Seamless Digital Geological Map of Japan V2, 1:200,000. Available online: https://gbank.gsj.jp/seamless/ (accessed on 26 July 2026).
- Pasquet, G.; Idriss, A.M.; Ronjon-Magand, L.; Ranchou-Peyruse, M.; Guignard, M.; Duttine, M.; Ranchou-Peyruse, A.; Moretti, I. Natural hydrogen potential and basaltic alteration in the Asal–Ghoubbet Rift, Republic of Djibouti. BSGF Earth Sci. Bull. 2023, 194, 9. [Google Scholar] [CrossRef] [Scilit]
- Jackson, O.; Lawrence, S.R.; Hutchinson, I.P.; Stocks, A.E.; Barnicoat, A.C.; Powney, M. Natural hydrogen: Sources, systems and exploration plays. Geoenergy 2024, 2, geoenergy2024-002. [Google Scholar] [CrossRef] [Scilit]
- Yasunaga, H. Updated information on NDB. Ann. Clin. Epidemiol. 2024, 6, 73–76. [Google Scholar] [CrossRef] [Scilit] [PubMed]
- Ministry of Health, Labour and Welfare, Japan. NDB Open Data. Available online: https://www.mhlw.go.jp/stf/seisakunitsuite/bunya/0000177182.html (accessed on 15 July 2026).
- Statistics Bureau of Japan. Population Estimates. 2022. Available online: https://www.stat.go.jp/english/data/jinsui/ (accessed on 15 July 2026).
- Wakita, K.; Igawa, T.; Takarada, S.; Fusejima, Y. Creation of seamless geological map of Japan at the scale of 1:200,000 and its distribution through the web: For maximum accessibility and utilization of geological infor-mation. Synth. Engl. Ed. 2008, 1, 73–84. [Google Scholar]
- QGIS Development Team. QGIS Geographic Information System, Version 3.40.10; Open Source Geospatial Foun-dation Project. Available online: https://qgis.org/ (accessed on 15 July 2026).
- Ministry of Internal Affairs and Communications, Japan. e-Stat: Portal Site of Official Statistics of Japan. Available online: https://www.e-stat.go.jp/en (accessed on 15 July 2026).
- Japanese Ophthalmological Society. Board-Certified Ophthalmologist Search. Available online: https://member.nichigan.or.jp/josWebMember/html/senmoni_search_index.html (accessed on 15 July 2026).
- Japan Meteorological Agency. Past Weather Data: Annual Sunshine Duration. 2022. Available online: https://www.data.jma.go.jp/ (accessed on 15 July 2026).
- National Institute for Environmental Studies, Japan. Environmental Observatory: Air Pollution Monitoring Data Files. 2022. Available online: https://tenbou.nies.go.jp/ (accessed on 15 July 2026).
- Cleveland, W.S. Robust locally weighted regression and smoothing scatterplots. J. Am. Stat. Assoc. 1979, 74, 829–836. [Google Scholar] [CrossRef]
- Efron, B.; Tibshirani, R.J. An Introduction to the Bootstrap; Chapman & Hall/CRC: New York, NY, USA, 1993. [Google Scholar]
- Harrell, F.E., Jr. Regression Modeling Strategies, 2nd ed.; Springer: Cham, Switzerland, 2015. [Google Scholar] [CrossRef] [Scilit]
- Breiman, L. Random forests. Mach. Learn. 2001, 45, 5–32. [Google Scholar] [CrossRef] [Scilit]
- Friedman, J.H. Greedy function approximation: A gradient boosting machine. Ann. Stat. 2001, 29, 1189–1232. [Google Scholar] [CrossRef] [Scilit]
- Pedregosa, F.; Varoquaux, G.; Gramfort, A.; Michel, V.; Thirion, B.; Grisel, O.; Blondel, M.; Müller, A.; Nothman, J.; Louppe, G.; et al. Scikit-learn: Machine learning in Python. J. Mach. Learn. Res. 2011, 12, 2825–2830. [Google Scholar]
- Langhi, L.; Strand, J. Exploring natural hydrogen hotspots: A review and soil-gas survey design for identifying seepage. Geoenergy 2023, 1, geoenergy2023-014. [Google Scholar] [CrossRef] [Scilit]
- Anderson, R.T.; Chapelle, F.H.; Lovley, D.R. Evidence against hydrogen-based microbial ecosystems in basalt aq-uifers. Science 1998, 281, 976–977. [Google Scholar] [CrossRef] [Scilit] [PubMed]
- Templeton, A.S.; Ellison, E.T.; Kelemen, P.B.; Leong, J.; Boyd, E.S.; Colman, D.R.; Matter, J.M. Low-temperature hy-drogen production and consumption in partially hydrated peridotites in Oman: Implications for stimulated geo-logical hydrogen production. Front. Geochem. 2024, 2, 1366268. [Google Scholar] [CrossRef] [Scilit]
- Morgenstern, H. Ecologic studies in epidemiology: Concepts, principles, and methods. Annu. Rev. Public Health 1995, 16, 61–81. [Google Scholar] [CrossRef] [PubMed]
- Pearce, N. The ecological fallacy strikes back. J. Epidemiol. Community Health 2000, 54, 326–327. [Google Scholar] [CrossRef] [Scilit] [PubMed]
- Kabata, Y.; Terauchi, R.; Nakano, T. Seasonal variations and environmental influences on dry eye operations in Japan. Sci. Rep. 2024, 14, 30962. [Google Scholar] [CrossRef] [Scilit] [PubMed]
- Ayaki, M.; Negishi, K. Seasonality of tear meniscus volume and dry eye-related symptoms—A cross-sectional retrospective cohort study. Clin. Ophthalmol. 2023, 17, 3809–3816. [Google Scholar] [CrossRef] [Scilit] [PubMed]
- Ayaki, M.; Kawashima, M.; Uchino, M.; Tsubota, K.; Negishi, K. Possible association between subtypes of dry eye disease and seasonal variation. Clin. Ophthalmol. 2017, 11, 1769–1775. [Google Scholar] [CrossRef] [Scilit] [PubMed]

Disclaimer/Publisher’s Note: The statements, opinions and data contained in all publications are solely those of the individual author(s) and contributor(s) and not of MDPI and/or the editor(s). MDPI and/or the editor(s) disclaim responsibility for any injury to people or property resulting from any ideas, methods, instructions or products referred to in the content. |
© 2026 by the authors. Licensee MDPI, Basel, Switzerland. This article is an open access article distributed under the terms and conditions of the Creative Commons Attribution (CC BY) license.