


Abstract
Background/Objectives: Immune alterations in chronic heart failure (CHF) have been characterized mainly at the group level, leaving heterogeneity between patients undefined. We asked whether peripheral blood transcriptomes resolve distinct immune states within CHF, and how the same transcripts behave in tumors relevant to cardio-oncology. Methods: Features were selected from publicly available peripheral blood transcriptomes (CHF = 944, normal = 11) by multiple network analyses and machine learning algorithms, and consensus clustering was applied within the CHF cohort. Clusters were characterized by enrichment analyses and by estimated immune cell composition and immune-related functional signatures. The coordinates separating the clusters were fixed and applied to an independent CHF cohort of 197 patients with measured blood count differentials. Immunohistochemical and overall survival data from public tumor cohorts were examined. Results: Five weakly correlated transcripts (CASP6, CAPNS1, BAK1, CASP4 and BAD) separated the 944 patients with CHF into four clusters placed on two nearly independent coordinates, the dominant one being the balance between lymphoid and myeloid programs. Patients at opposite ends of that axis differed in almost every immune measure and in opposite directions, from a lymphoid-enriched, effector-engaged state to a myeloid-skewed, lymphoid-depleted state. Cluster 1, the largest at 39.5%, lay near the cohort average. Enriched terms were largely shared, so the separation was carried by immune cell composition rather than pathway level divergence. In the independent cohort, the coordinates kept the same relation to measured lymphocyte, neutrophil and monocyte counts. In exploratory tumor analyses, the five transcripts did not keep a single direction outside blood, and their associations with overall survival differed between tumor types. Conclusions: Peripheral blood transcriptomes place patients with CHF along a continuous lymphoid-to-myeloid axis, carried mainly by circulating immune cell composition, on which the four clusters mark positions rather than separate states and which holds in an independent cohort. Immune status in CHF is a property of the individual patient rather than of the population.
1. Introduction
Despite major advances in medical and device therapy, chronic heart failure (CHF) remains a major cause of morbidity and mortality worldwide [1,2]. Beyond mechanical and hormonal disturbances, accumulating evidence indicates that dysregulated immune activity is closely involved in the development and progression of CHF [3,4]. Persistent activation of innate immunity, impaired adaptive immune responses, and chronic inflammation have been implicated in adverse cardiac remodeling [5]. However, although peripheral blood gene-expression studies and circulating immune biomarkers have provided evidence of systemic immune alterations in CHF, how these alterations vary across patients and relate to heterogeneous peripheral immune states remains incompletely understood [6,7].
Peripheral blood provides a readily accessible source of systemic molecular information, while transcriptome-wide profiling enables characterization of gene-expression patterns at scale. Its scalability and relative cost-effectiveness may facilitate broader application of transcriptomic profiling in large patient populations, supporting its potential translational utility for characterizing peripheral immune heterogeneity in CHF. In oncology, the composition and organization of the tumor immune microenvironment have been extensively studied in relation to tumor biology, therapeutic response, and clinical outcome [8,9]. These studies provide a conceptual framework for considering whether heterogeneous immune states can likewise be characterized in CHF. Stratification is not new in CHF, as unsupervised analysis of clinical, echocardiographic and biomarker data has partitioned patient populations into subgroups with distinct profiles and outcomes [10,11], shaping the current view of the syndrome as a set of overlapping phenotypes. The peripheral blood transcriptome has not been used in this way, having been analyzed in CHF almost exclusively as a single group.
Advances in cancer treatment have substantially improved survival in patients with malignancies [12], and heart failure is now a recognized complication of cancer therapy, which has made the interactions between cancer and cardiovascular disease the subject of cardio-oncology [13,14,15]. The reverse direction, in which chronic cardiovascular disease and its systemic inflammatory milieu may influence tumor development, has also been raised [16]. Whether molecular features defined in CHF blood carry any consistent meaning in tumor settings is not known, and that question is approached here only as a secondary and exploratory extension.
In this study, we sought to characterize peripheral immune heterogeneity in CHF and to identify heterogeneous immune states from peripheral blood transcriptomic profiles. We further characterized the molecular, cellular, and functional features associated with these states and, as a secondary and exploratory extension, examined how the features defining them behave in tumor tissue and in tumor cohorts.
2. Materials and Methods
2.1. Data Acquisition and Preprocessing
Gene expression matrices were obtained from the Gene Expression Omnibus (GEO) database https://www.ncbi.nlm.nih.gov/geo/ (accessed on 12 September 2026), including 944 peripheral blood samples from patients with CHF enrolled in the BIOSTAT-CHF study (GSE181114) [17], 11 normal samples (GSE213313) [18], and an independent CHF cohort of 197 samples (GSE77343) [19], for which complete blood count differentials measured at the time of blood collection are also deposited. All three datasets were generated on oligonucleotide microarrays. The data were retrieved with the GEOquery Release 2.80.0 package and each dataset was normalized separately. Batch correction with limma was applied to the merged matrix but returned it unchanged, because dataset and disease group partition the samples identically and the batch coefficient was therefore not estimable. The merged matrix was used uncorrected. Details of the array platforms and preprocessing are given in the Supplementary Methods.
2.2. Differential Expression and Enrichment Analysis
Differential expression was assessed with limma using its empirical Bayes approach. Differentially expressed genes (DEGs) were required to satisfy p < 0.05 and Benjamini–Hochberg adjusted p < 0.05 in every comparison, with the fold change threshold set at |log2FC| > 2 for CHF versus normal and for individual CHF clusters versus normal and at |log2FC| > 0.5 for pairwise comparisons among the CHF clusters.
Functional work used clusterProfiler 4.12.x. Gene Ontology (GO) and Kyoto Encyclopedia of Genes and Genomes (KEGG) analyses were run on 2350 of the 3902 DEGs from the CHF versus normal comparison with mean expression ≥ 5 on the log2 scale (approximately the median across all genes analyzed), and terms were retained at p < 0.05, adjusted p < 0.05 and q < 0.05. Gene sets were taken from the Molecular Signatures Database (MSigDB, version 2024.1.Hs, http://www.gsea-msigdb.org/gsea/index.jsp, accessed on 12 September 2026), using the H hallmark, C2CP canonical pathways, C4 computational, and C7 ImmuneSigDB immunologic signature collections. Gene Set Enrichment Analysis (GSEA) was run with clusterProfiler on the genes from each cluster versus normal comparison at a more permissive cut of |log2FC| > 1, p < 0.05 and adjusted p < 0.05, ranked by log2 fold change, rather than on the full ranked transcriptome, so the background is that selected list. Gene set permutation was used with 1,000,000 permutations in the preliminary step, gene sets were restricted to between 10 and 7000 genes, and terms were considered significant when |normalized enrichment score (NES)| > 1, p < 0.05 and adjusted p < 0.05.
2.3. Weighted Gene Coexpression Network Analysis
A weighted gene coexpression network analysis (WGCNA) was constructed from the merged matrix. The soft-threshold (β = 3) met the scale-free criteria (R2 ≥ 0.85). Modules were obtained by dynamic tree cut and merged by eigengene similarity. The turquoise module contained the most genes and showed the strongest correlation with CHF status (r = 0.99, p < 0.001), which has been carried forward.
2.4. Integrative Machine Learning for Feature Screening
From the intersection of DEGs and the turquoise module genes, we screened features with three algorithms: least absolute shrinkage and selection operator (LASSO), random forest (RF), and support vector machine recursive feature elimination (SVM-RFE). LASSO (glmnet) used ten-fold cross-validation; RF (randomForest) ranked variables by mean decrease in accuracy; SVM-RFE (caret, e1071) used cross-validation to pick the most accurate subset. Genes selected by at least two methods were kept as candidates. These algorithms were used as a heuristic dimensionality-reduction step preceding protein interaction network construction and MCL module detection, not as diagnostic classifiers. The screening cohort carries a 98.85% majority-class imbalance (944 of 955 samples), and the cross-validation estimates are therefore not unbiased measures of classification performance.
2.5. Protein–Protein Interaction Network and Module Detection
Candidate genes were submitted to STRING (https://string-db.org) to build a protein–protein interaction (PPI) network (minimum interaction score 0.4). The Markov cluster algorithm (MCL) (inflation = 2) yielded one core module with five genes (CASP6, CAPNS1, BAK1, CASP4, and BAD), all of which were annotated in the apoptosis modulation and signaling pathway WP1772. These five genes were used in subsequent clustering.
2.6. Molecular Clustering and Visualization
Molecular subtypes were explored with Partitioning Around Medoids (PAM) using ConsensusClusterPlus (Release Version 1.76.0) for the five-gene expression matrix. Pearson correlation served as the distance metric and 100 iterations were used to check stability. Cumulative distribution and delta-area curves indicated k = 4 as the optimal solution. Principal component analysis (PCA) was used to visualize separation among clusters, and violin plots summarized expression differences for the five genes. Two scores were defined from the cluster centroids, between clusters 2 and 4 and between clusters 3 and 1, and applied unchanged to the independent cohort GSE77343, in which each patient was also assigned to the nearest centroid without clustering. The two directions are the unit vectors w1 ∝ c2 − c4 and w2 ∝ c3 − c1, where ci is the centroid of cluster i, and the scores of a sample with standardized five feature vector z are z · w1 and z · w2. For CASP6, CAPNS1, BAK1, CASP4, and BAD, the weights are 0.16, 0.67, 0.13, −0.70, and −0.12 in w1 and −0.09, 0.00, 0.95, 0.19, and −0.24 in w2. Features were standardized within each cohort rather than merged, so that clustering, centroid derivation, and validation were each carried out within a single platform.
2.7. Immune Microenvironment Characterization
Immune profiles were estimated with CIBERSORTx (https://cibersortx.stanford.edu/) and single-sample GSEA (ssGSEA). CIBERSORTx used the LM22 leukocyte signature matrix with 1000 permutations, quantile normalization disabled, and no batch correction mode to derive relative fractions for 22 immune cell types. All 955 samples were retained. These fractions sum to one within a sample and are not proportions of a differential count, no absolute counts were available in either cohort, and the ssGSEA values are enrichment scores on an arbitrary scale, so quantities of different kinds were compared only after standardization within cohort. ssGSEA (GSVA v3.x package) generated scores for predefined immune-related functional signatures. Group differences were displayed with bar charts, heatmaps, and violin plots. Each score was correlated with lymphocyte, neutrophil, and monocyte content, estimated by CIBERSORTx in the CHF cohort and taken from the complete blood count differential in GSE77343, using Pearson and Spearman coefficients. Nonparametric tests (Wilcoxon rank-sum or Kruskal–Wallis) were applied where appropriate.
2.8. Immunohistochemistry and Semi-Quantitative Analysis
Immunohistochemistry (IHC) images and data for the key genes came from the Human Protein Atlas (HPA, https://www.proteinatlas.org/). We reviewed normal heart, lung, and breast tissues and representative tumors (breast invasive ductal carcinoma (IDC), breast invasive lobular carcinoma (ILC), lung adenocarcinoma (LUAD), and lung squamous cell carcinoma (LUSC)). The staining intensity and the proportion of positive cells annotated by the HPA were converted to numeric values using the Remmele–Stegner immunoreactive scoring system [20]. The modified immunoreactive score (IRS, range 0 to 9) was
where is the mean modified IRS for patient j in gene g, tissue or disease o, and antibody a, is staining intensity (0–3), and is the proportion of positive cells (0–3), so the product ranges from 0 to 9. If several representative cell types appeared in one image, we averaged their scores. We limited scoring to functional parenchymal or tumor cells (cardiomyocytes, alveolar cells, glandular cells, and malignant epithelial cells) and excluded lymph nodes or unrelated tissues.
2.9. Statistical Analysis
All computations used R (version 4.4.3). Unless stated otherwise, we used nonparametric tests. Two-group comparisons used the Wilcoxon rank-sum test and multiple groups used the Kruskal–Wallis test, and p < 0.05 was considered significant. For the immune cell fractions and the functional signatures, p values were adjusted across measures with the Benjamini–Hochberg procedure. Survival analyses in solid malignancies relevant to cardio-oncology (breast and lung cancer) were performed using the Kaplan–Meier Plotter (https://kmplot.com/analysis/, accessed on 12 September 2026). The details on preprocessing, parameter choices, and R code appear in the Supplementary Methods.
3. Results
3.1. Peripheral Blood Transcriptomic and Immune Alterations in CHF
The transcriptomic comparison identified 3902 DEGs, of which 152 were upregulated and 3750 were downregulated (CHF vs. normal, Supplementary Figure S1A,B). Downregulated DEGs thus accounted for the large majority of the transcriptional differences, and a substantial proportion of them are immune-related. Because these are normalized relative intensities, the direction describes the comparison as measured and is not evidence of globally reduced transcription. These comparisons are confounded by study and platform, and are used here only to narrow the transcriptome to a candidate set.
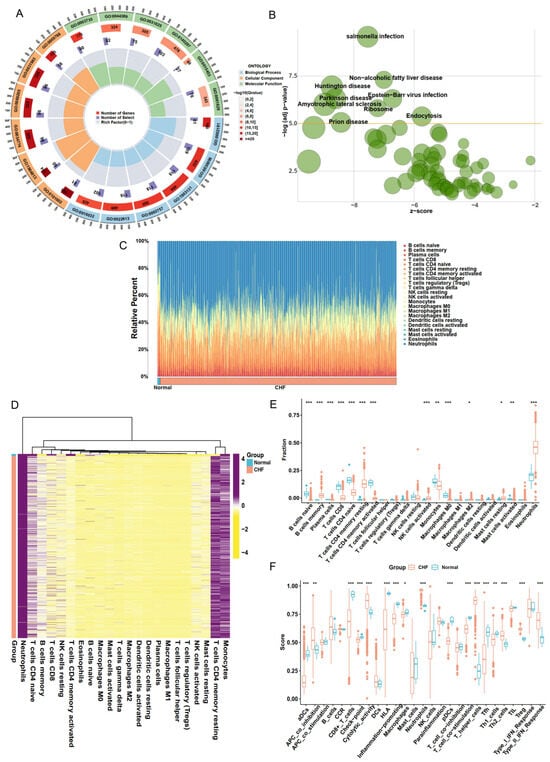
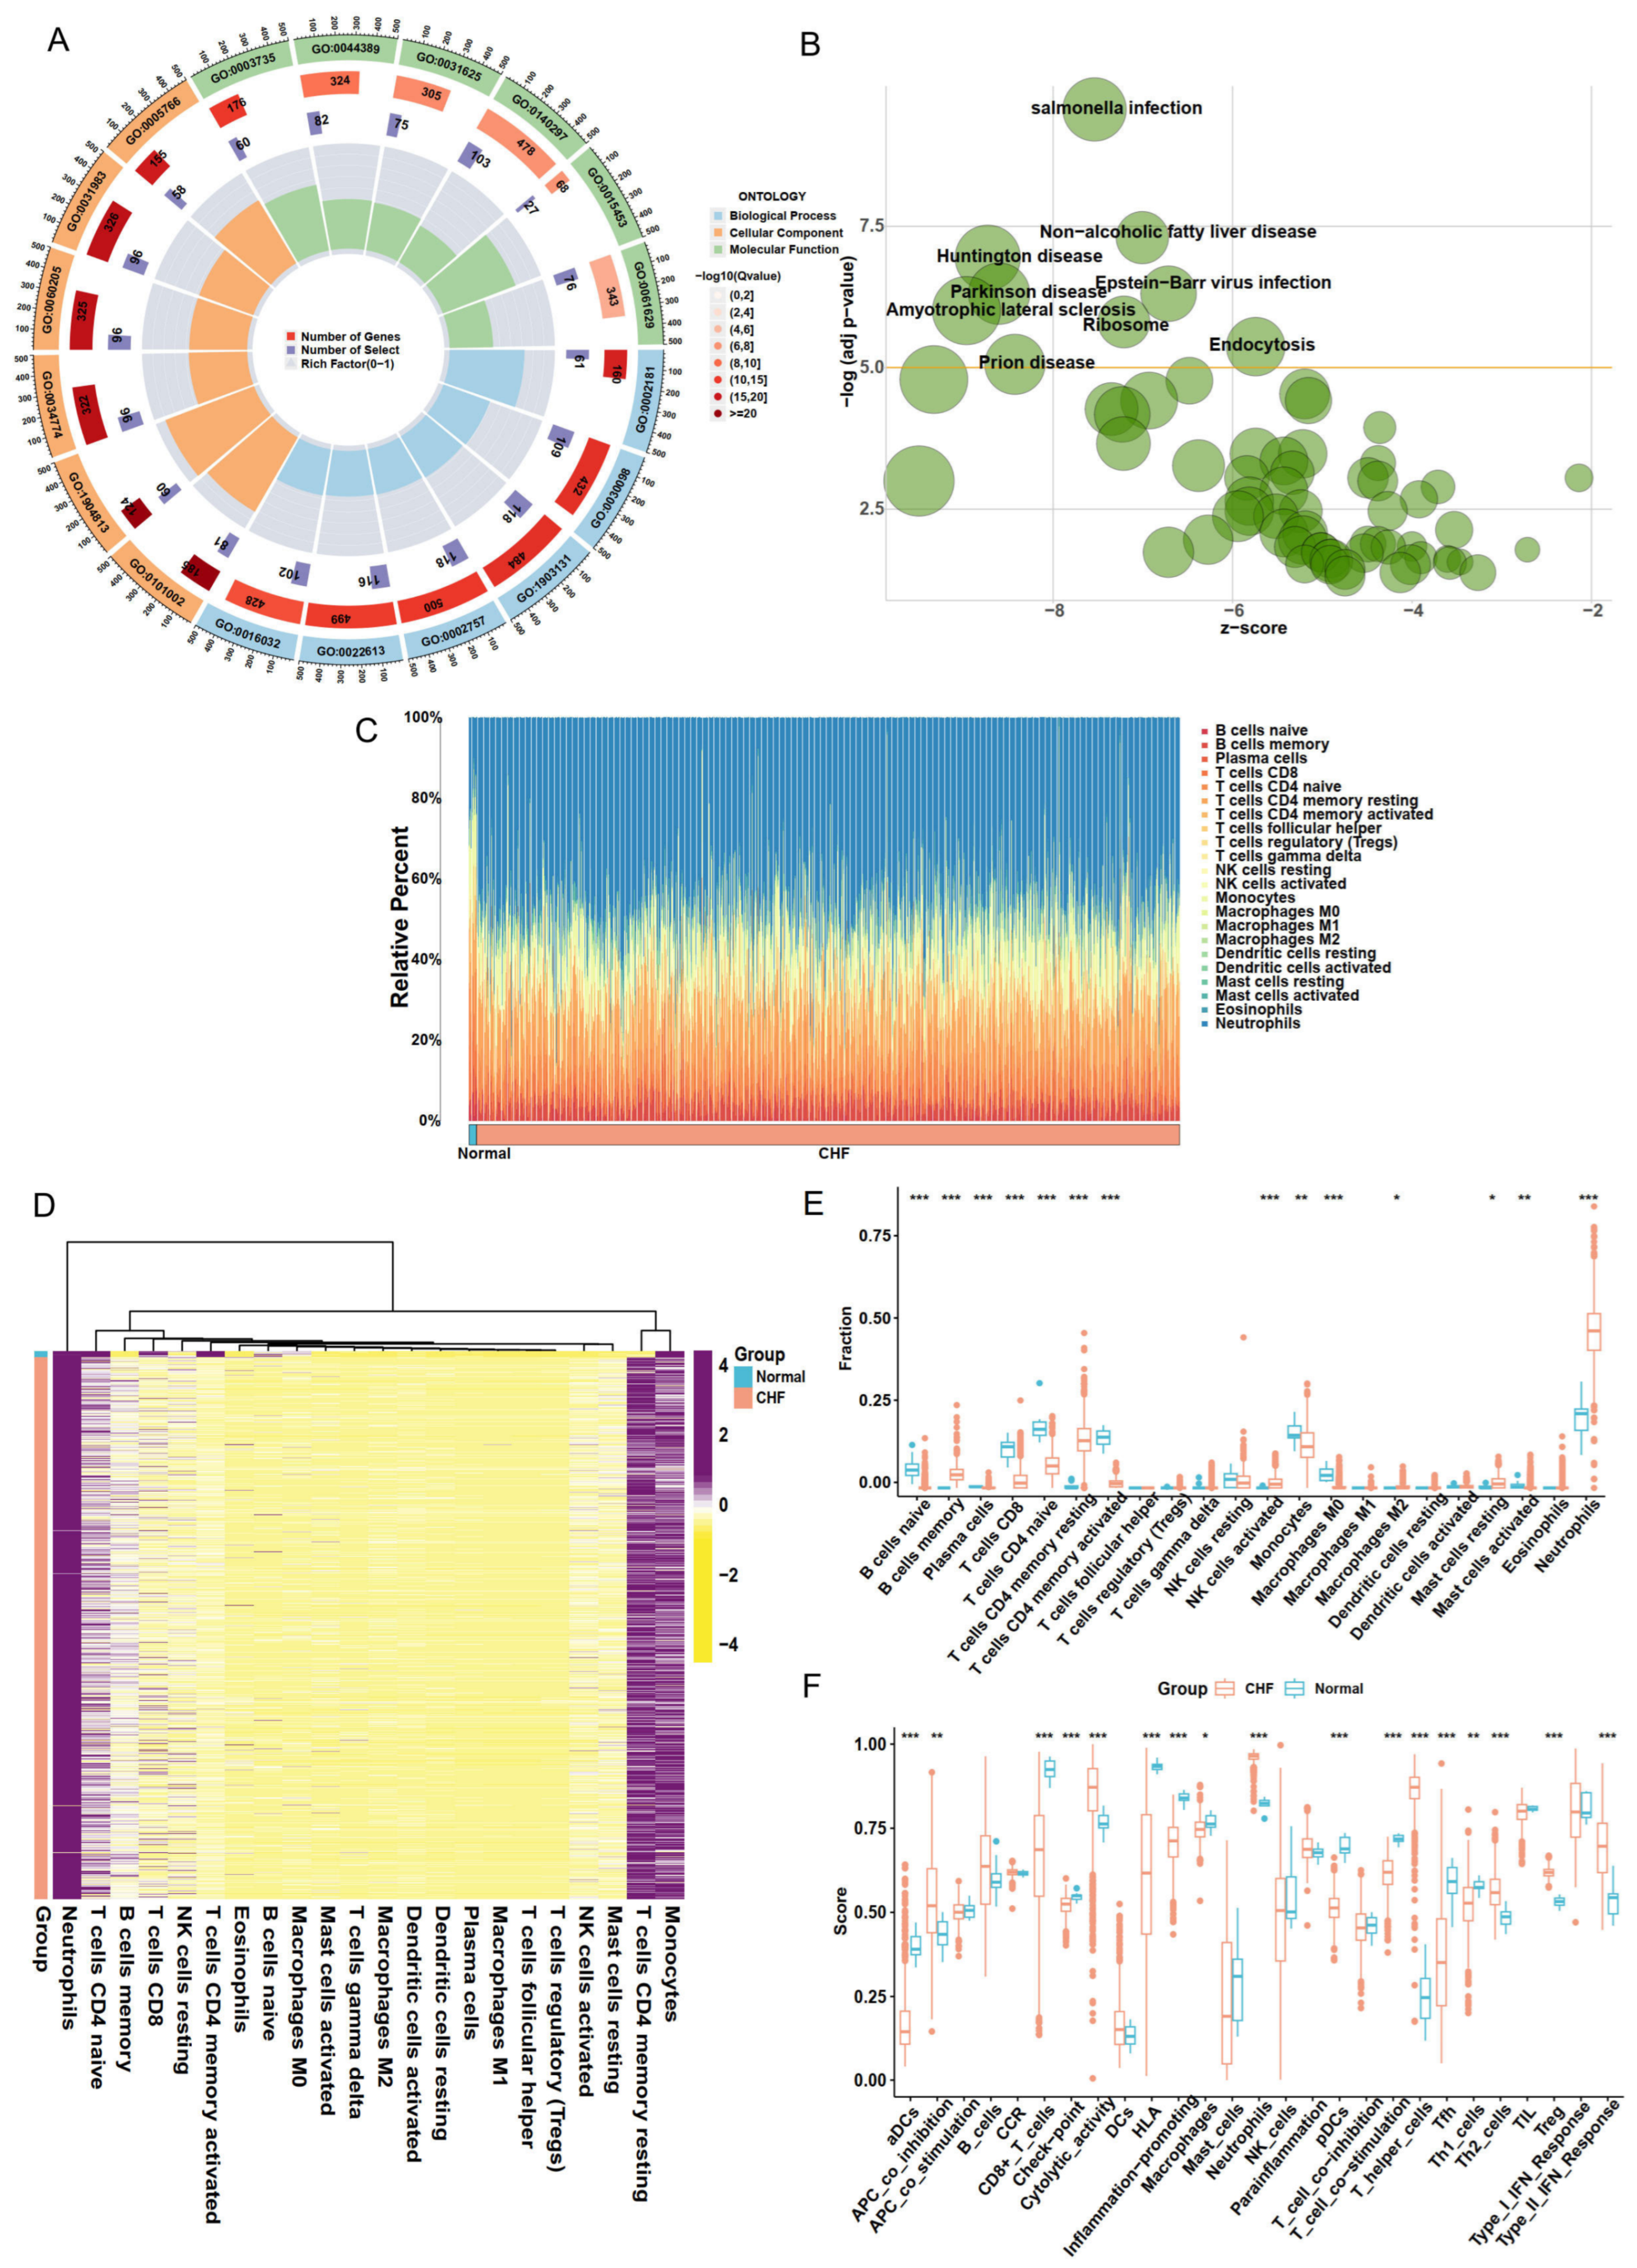
GO enrichment (Figure 1A; Supplementary Table S1) highlighted extensive immune- and vesicle-associated alterations. Biological process terms related to leukocyte-mediated immunity and humoral immune response predominated, consistent with attenuated adaptive activation under persistent inflammatory pressure. Cellular component terms such as ficolin-1-rich granule and secretory-granule lumen pointed to vesicular transport and cytokine storage in circulating immune cells. Molecular function terms including immunoglobulin receptor binding and MHC class II receptor activity indicated alterations in antigen recognition and presentation. KEGG enrichment (Figure 1B; Supplementary Table S2) complemented these findings, showing enrichment in infection- and inflammation-associated signaling as well as several neurodegenerative pathways linked to mitochondrial dysfunction and metabolic imbalance. Together, these results outline a peripheral transcriptional profile in CHF characterized by chronic inflammation, metabolic strain, and reduced adaptive immune activity.
Figure 1.
Transcriptomic and immune profiling of CHF peripheral blood samples. (A) Top six terms in BP, CC, and MF from GO enrichment analysis of DEGs. (B) KEGG pathway enrichment analysis of DEGs. (C) Stacked bar plot of the relative proportions of 22 immune cell types estimated by CIBERSORTx. (D) Heatmap of the immune cell fractions across samples. (E) Comparison of immune cell types between CHF and normal cohorts. (F) Comparison of immune-related functional signatures based on ssGSEA. (*** p < 0.001, ** p < 0.01, * p < 0.05).
The CIBERSORTx deconvolution revealed substantial differences in immune cell composition between CHF and normal samples (Figure 1C–E; Supplementary Table S3). B cell subsets and CD8+ and CD4+ T cells were reduced in CHF, whereas neutrophils, monocytes, mast cells, and M2 macrophages were relatively increased, although the magnitude of these differences varied substantially across individual patients. The LM22 macrophage and mast cell compartments are read here as transcriptional proxies for circulating monocyte states and for basophils and granulocytes, since mature macrophages and mast cells do not circulate in venous blood. This pattern indicates a shift away from adaptive lymphoid populations toward innate and myeloid lineages in CHF peripheral blood.
Assessment of immune function by ssGSEA (Figure 1F; Supplementary Table S4) revealed a corresponding imbalance among immune signatures. Adaptive processes, including antigen presentation, T cell co-stimulation, and cytolytic activity, were consistently reduced in CHF. In contrast, innate and regulatory activities such as APC co-inhibition, Th2 polarization, regulatory T cell signatures, and type II interferon responses were relatively elevated. The coexistence of inflammatory activation with reduced adaptive immune signatures indicates a dysregulated systemic immune profile in CHF peripheral blood.
3.2. Integrated Feature Screening Identifies Molecular Features for Cohort Stratification
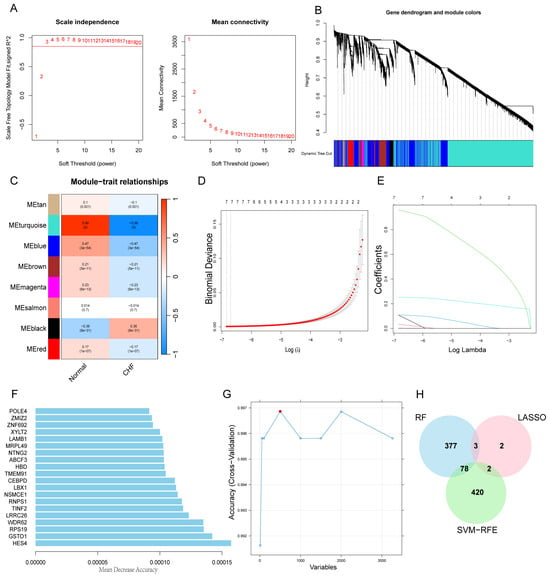
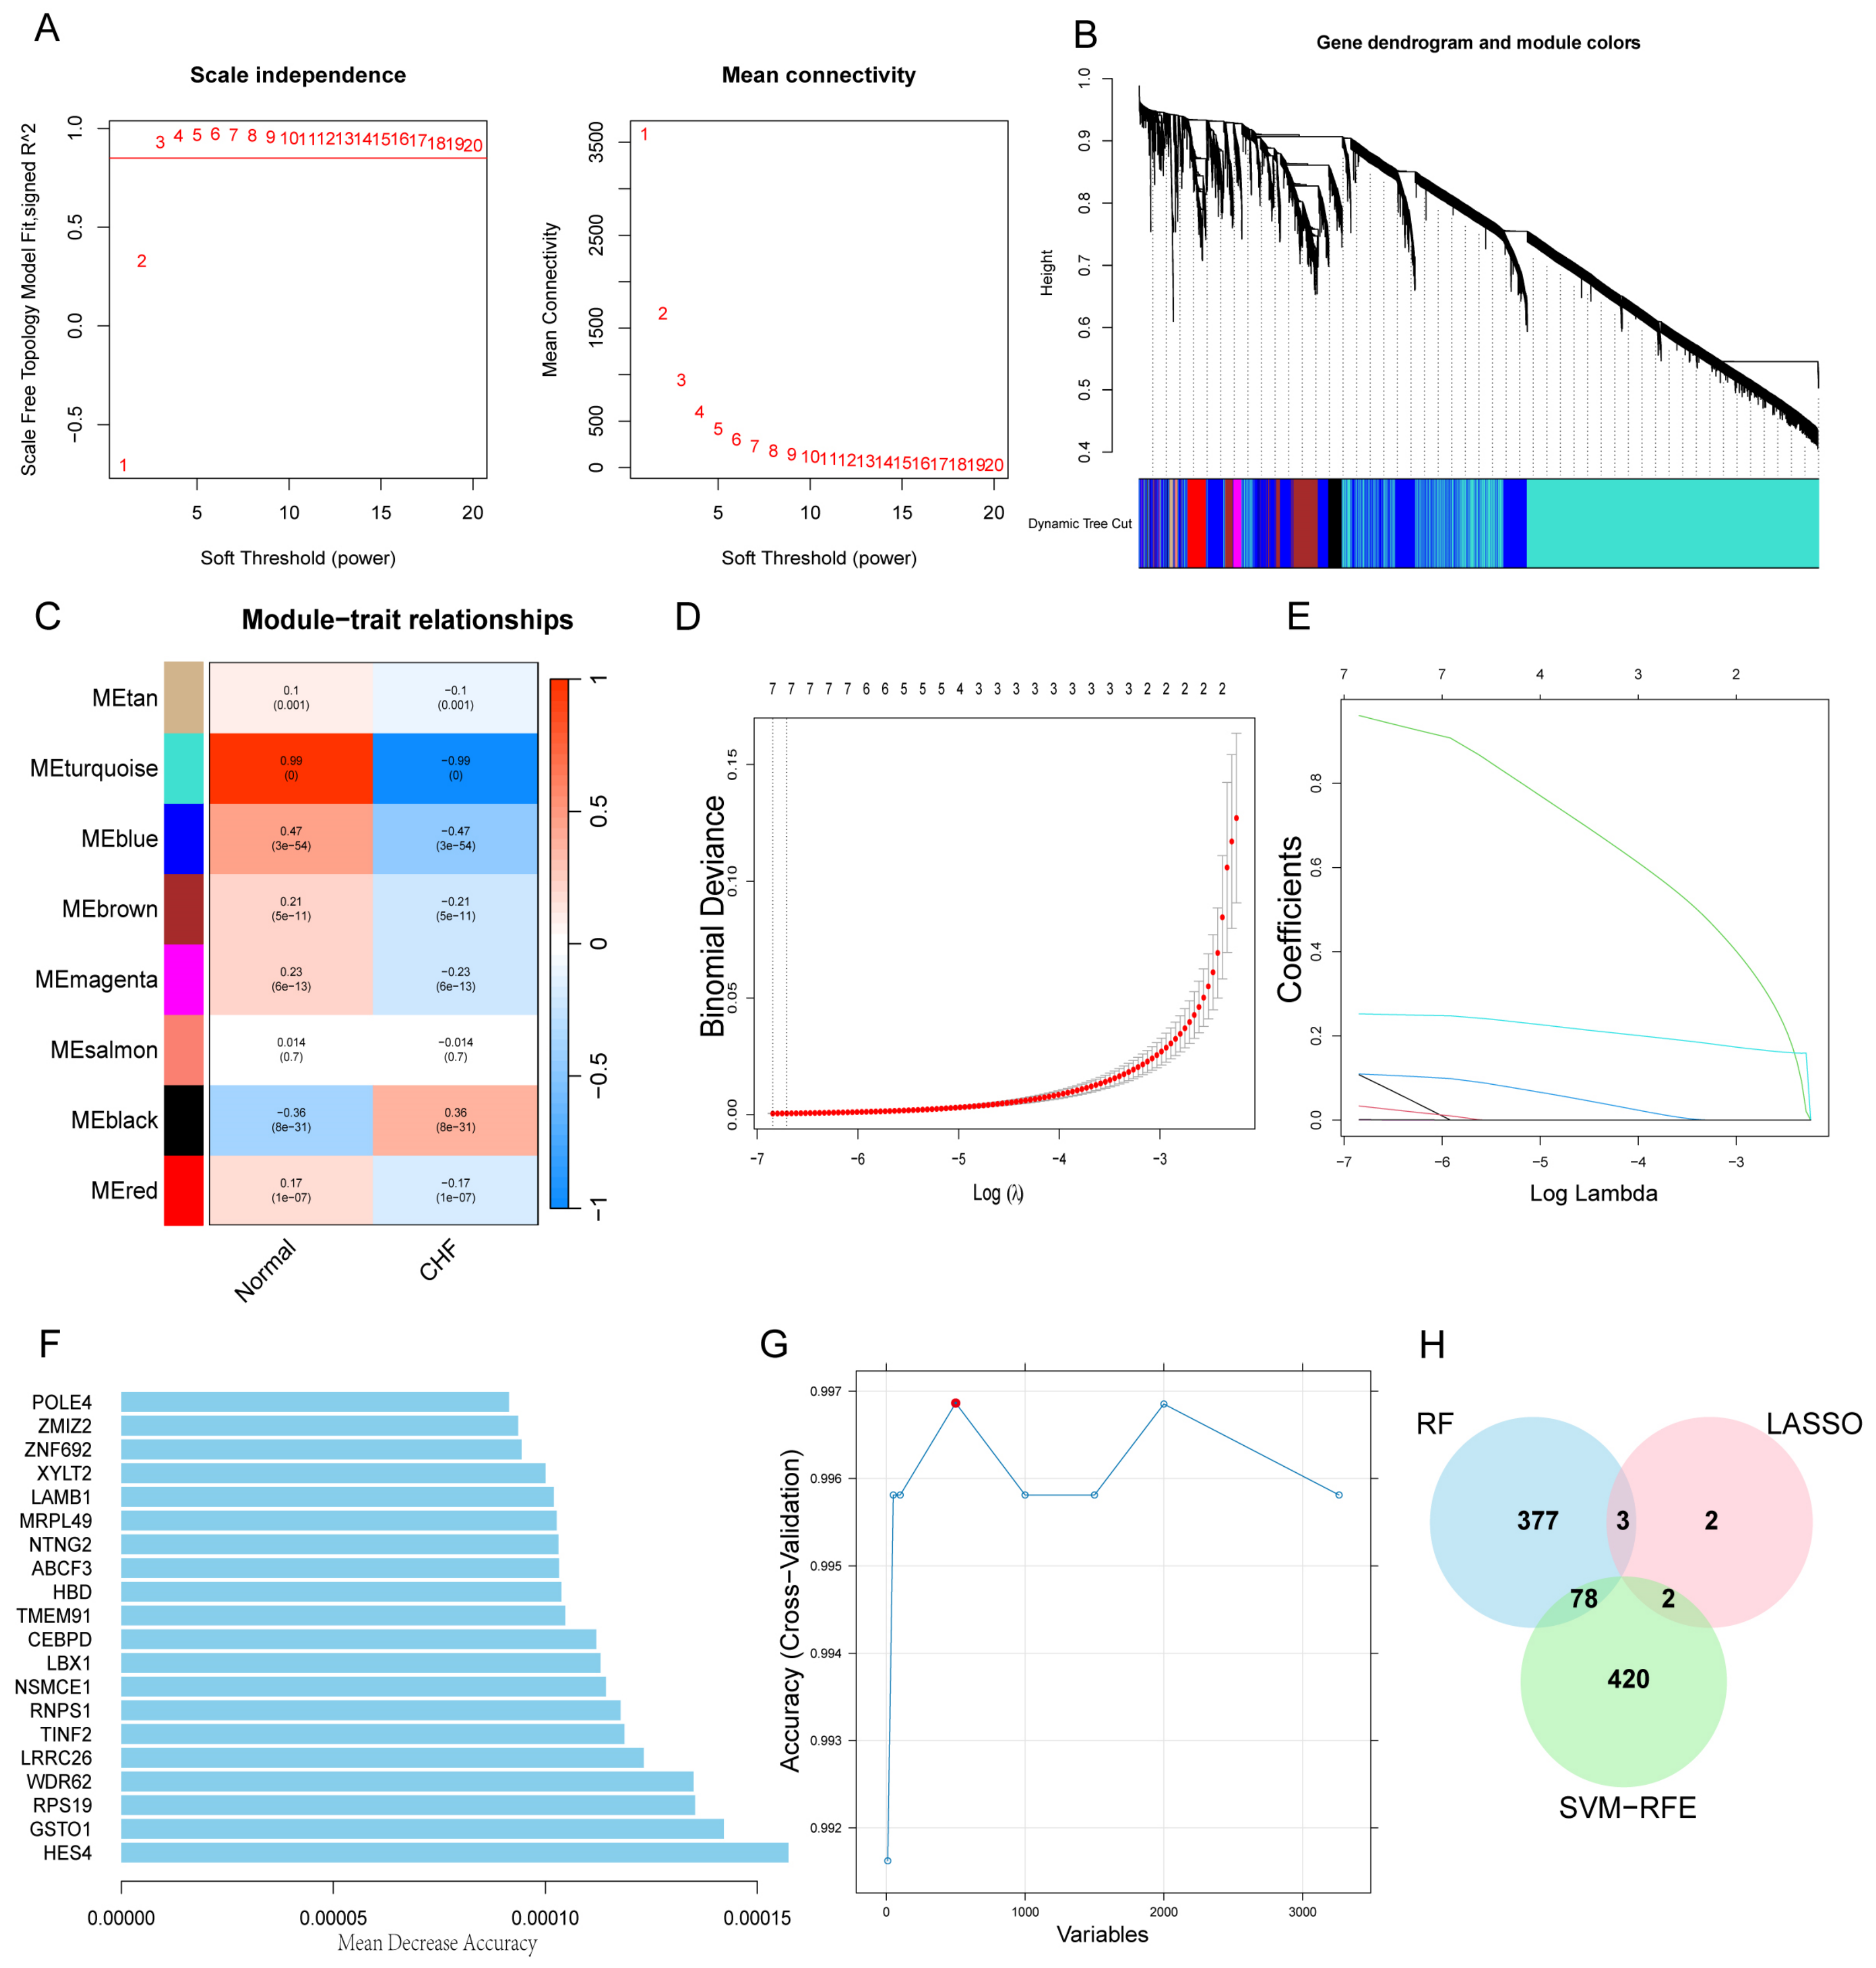
Integrated screening reduced the transcriptome to 83 candidate genes. WGCNA identified the turquoise module as the largest module and the one most strongly correlated with CHF status (n = 7057 genes; r = 0.99, p < 0.001; Figure 2A–C; Supplementary Figure S1C). Because the trait used here coincides exactly with dataset and platform, this correlation measures that contrast rather than a biological difference, and the module served only to define the candidate set. Intersection with the DEGs yielded 3509 genes, of which 3263 were also detected in the independent CHF cohort GSE77343 (n = 197). Applying LASSO, RF, and SVM-RFE to this set, 83 genes were selected by at least two of the three algorithms (Figure 2D–H; Supplementary Tables S5–S7). The three algorithms showed concordant performance in internal cross-validation and were additionally applied to GSE77343 (sensitivity = 1.00 for all three), which comprises CHF samples only. No measure of specificity or overall classification performance can be obtained from this cohort. Among the 83 candidates, correlation analysis and hierarchical clustering (Supplementary Figure S2A,B) indicated internal coherence and separation between CHF and normal samples.
Figure 2.
Feature selection and integration of WGCNA and machine learning algorithms. (A) Determination of the soft threshold power (β = 3) based on the scale-free topology criterion. (B) Dendrogram of gene modules and merged module assignments. (C) Heatmap of module–trait correlations. Each cell shows the correlation coefficient (top) and p-value (bottom) between a module and CHF status. (D) Ten-fold cross-validation curve for selecting the optimal λ in LASSO regression. (E) Coefficient paths of LASSO regression across different values of log(λ). (F) Top 20 genes ranked by Mean Decrease Accuracy in the random forest model. (G) Cross-validation accuracy curve from SVM-RFE feature selection. (H) Venn diagram showing the number of overlapping genes among LASSO, RF, and SVM-RFE.
Among the 83 candidates, 41 genes showed PPI networking with predicted or known interactions (Supplementary Figure S3A). Enrichment analysis of this network returned a single annotated pathway, the apoptosis modulation and signaling pathway (WP1772; FDR = 0.037), corresponding to five genes (CASP6, CAPNS1, BAK1, CASP4, and BAD; Supplementary Table S8). Other enriched terms were confined to tissue expression annotations for respiratory system and lung and to the phosphoprotein keyword. MCL independently partitioned the network into 11 modules (Supplementary Table S9), one of which consisted of exactly these five genes and was annotated as “activation of cysteine-type endopeptidase activity”.
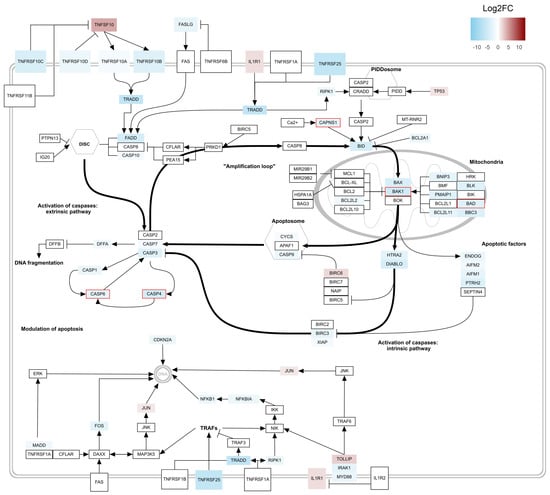
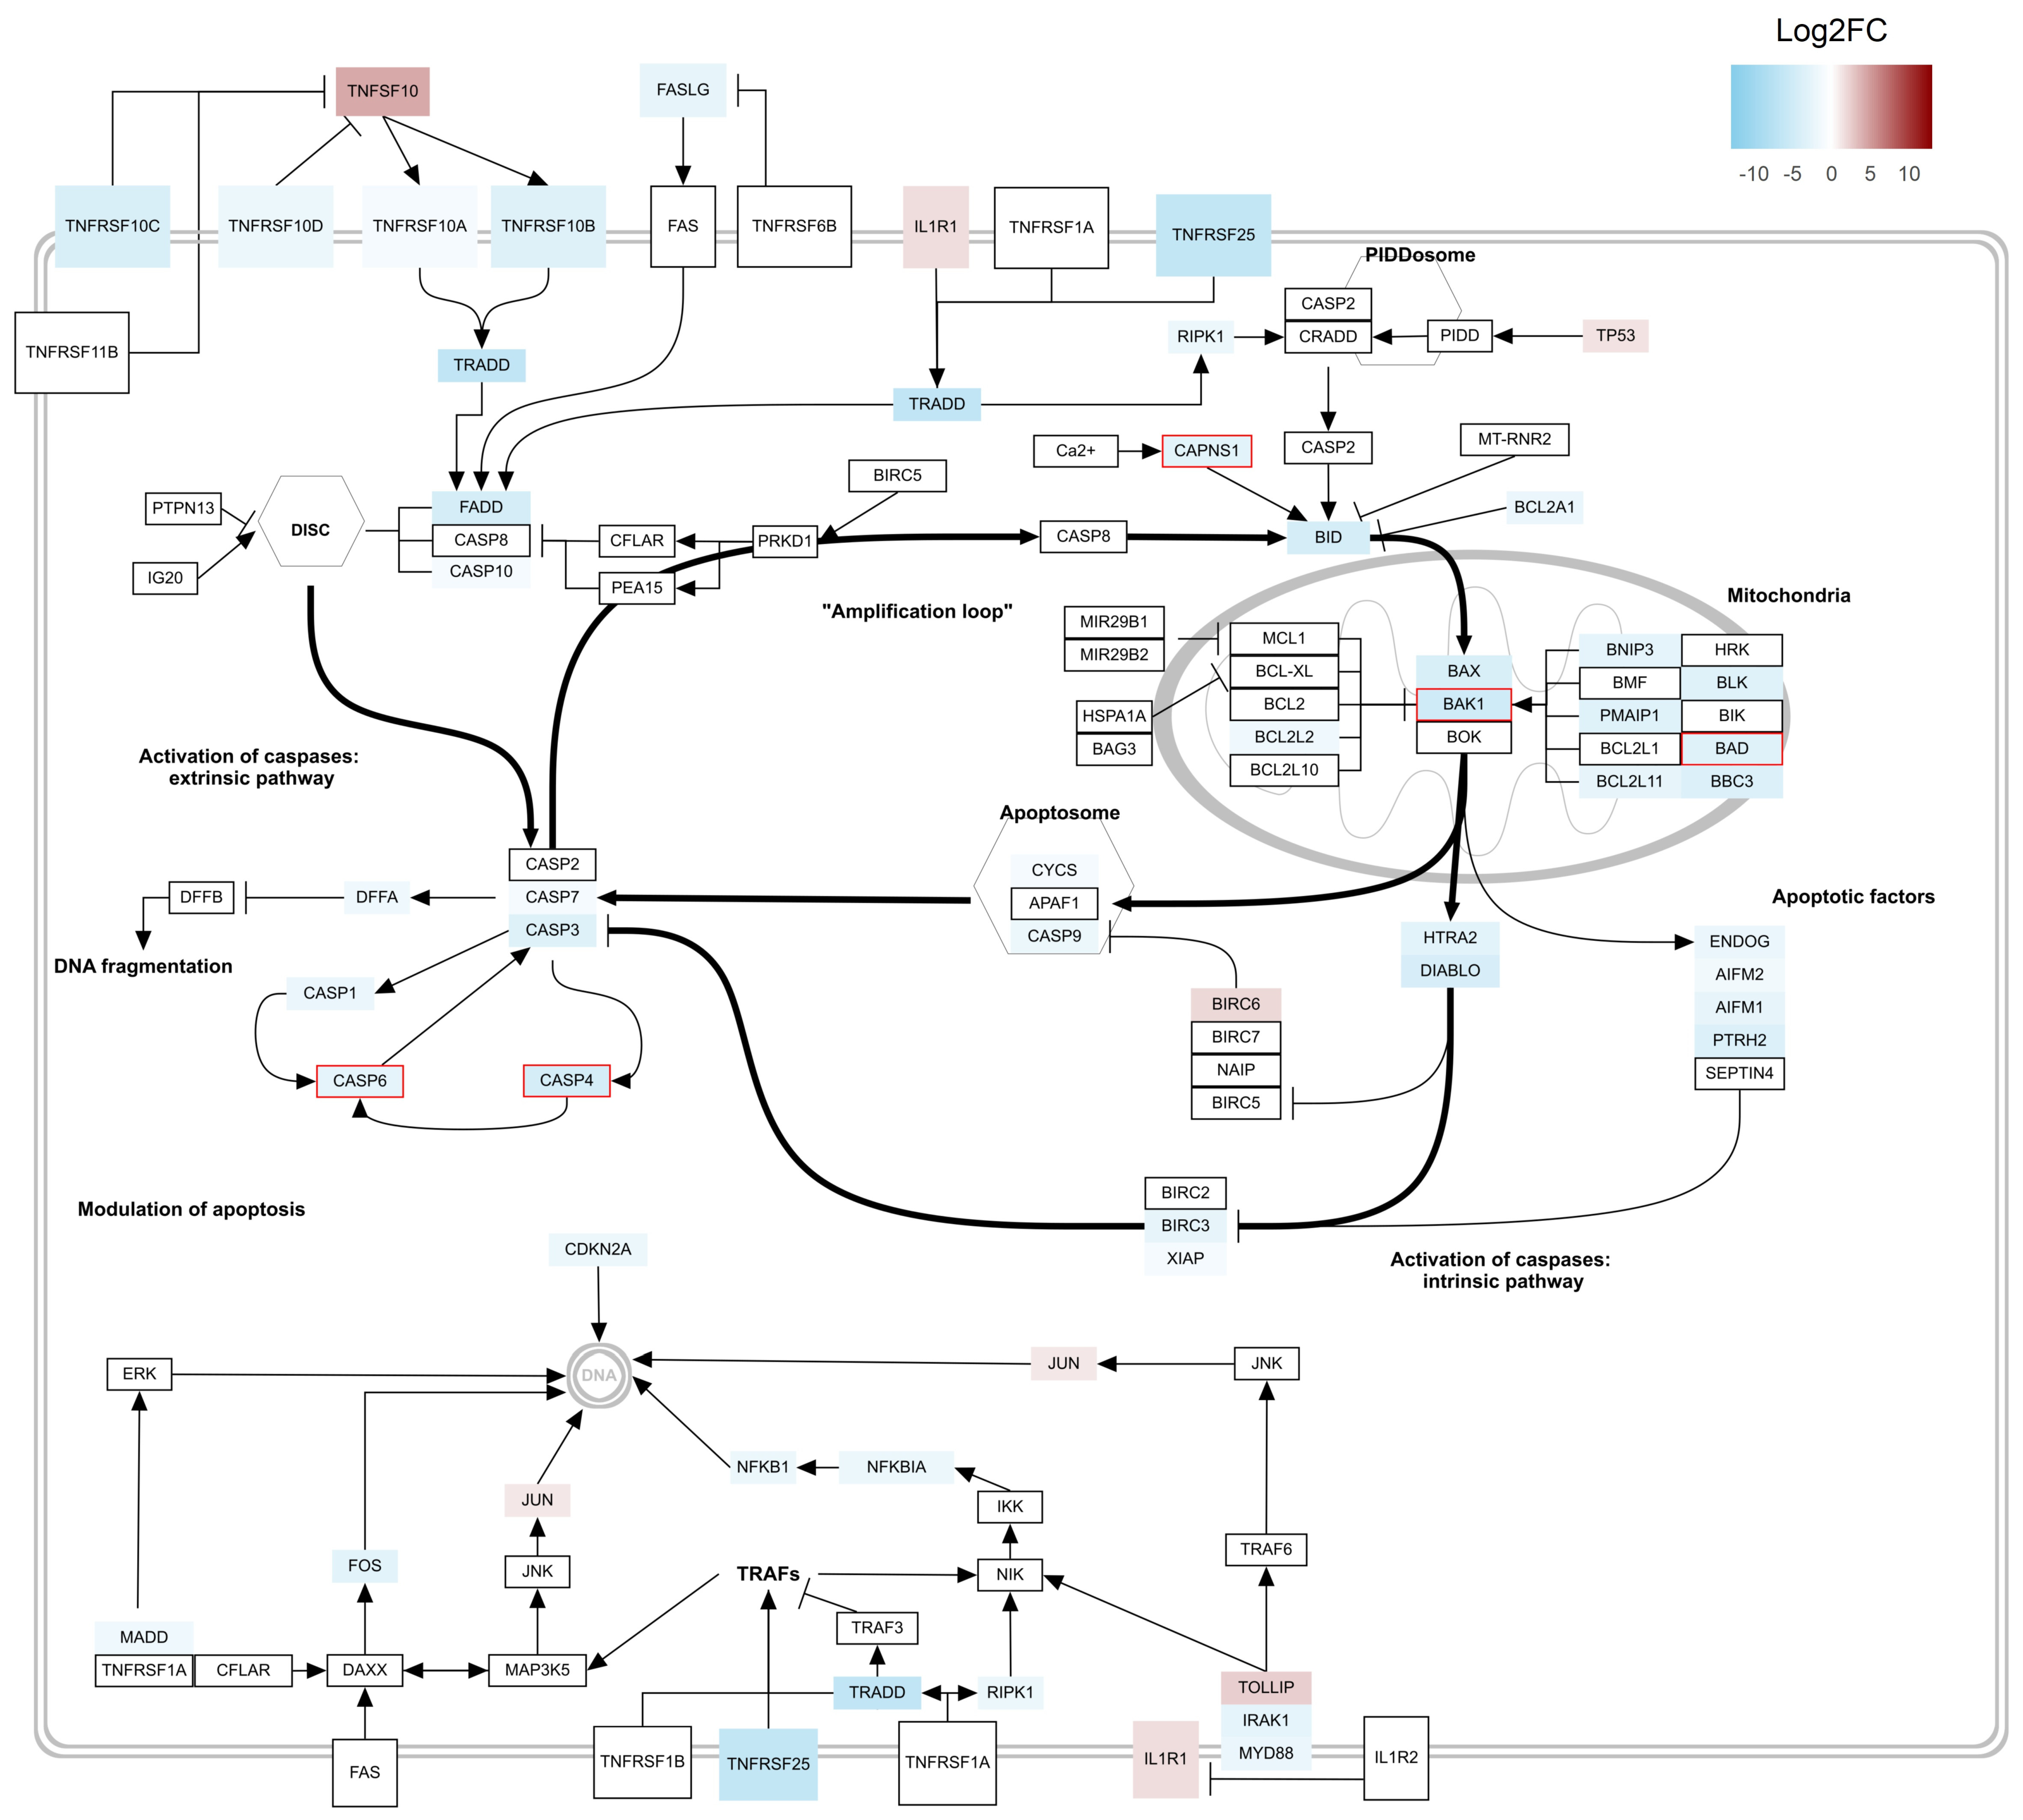
Mapping the DEGs onto WP1772 showed that the majority of annotated components with detectable differential expression were downregulated in CHF peripheral blood, with a smaller number of upregulated components (Figure 3). The five selected features are annotated at different points of the pathway, with BAK1 and BAD within the mitochondrial module, CASP6 and CASP4 within a caspase-3 associated loop in the apoptosis modulation branch, and CAPNS1 on the calcium-dependent branch upstream of BID. Consistent with this distribution, correlations among the five features were generally weak, the strongest being a negative association between CAPNS1 and CASP4 (r = −0.42; Supplementary Figure S3B), indicating that they do not vary as a single coordinated unit in peripheral blood.
Figure 3.
Mapping of DEGs on the WP1772 pathway. Red boxes indicate the selected features identified from the MCL module. Diagram adapted from WikiPathways, licensed under CC BY 2.0.
3.3. Unsupervised Clustering Resolves Four Transcriptomic Clusters Within the CHF Cohort
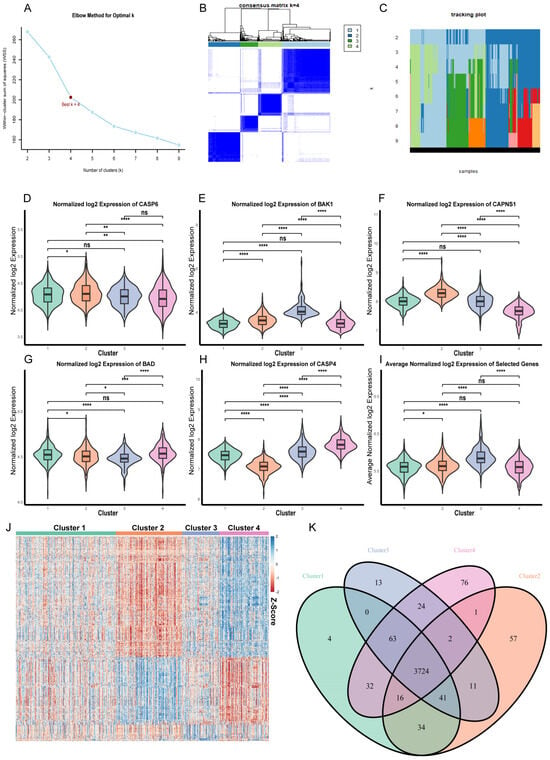
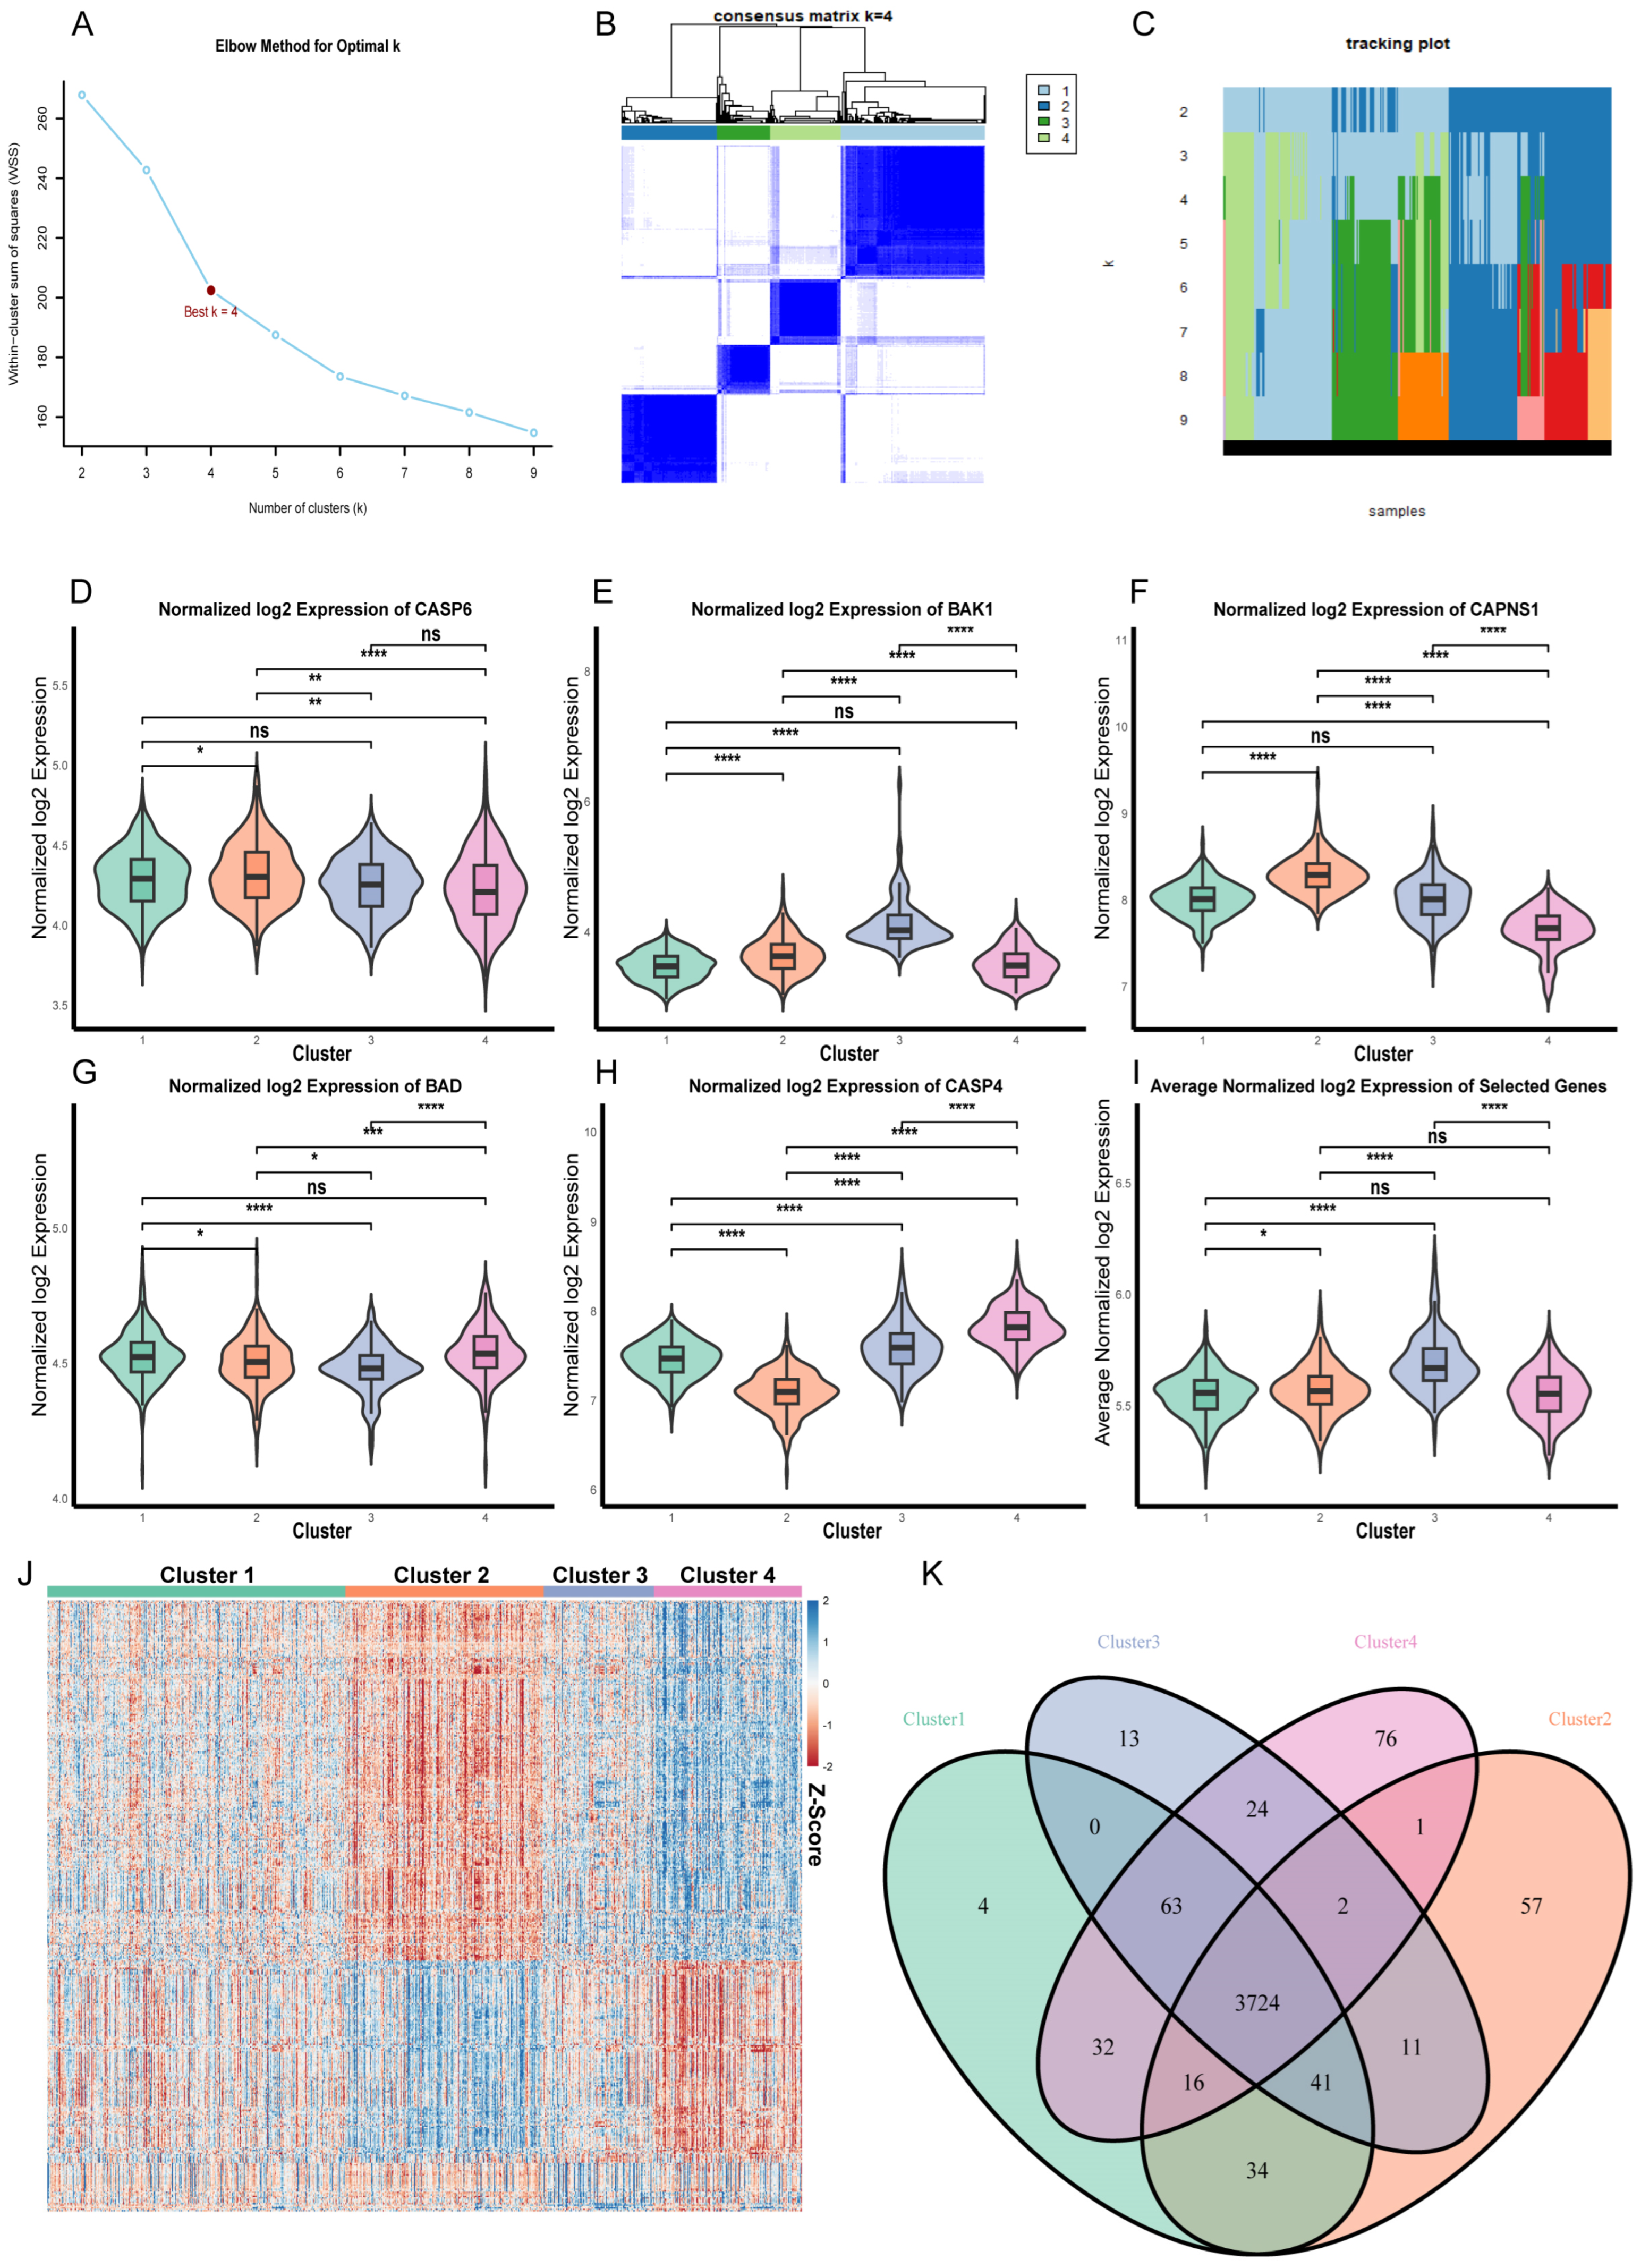
Given the variation observed among individual CHF patients, unsupervised consensus clustering with PAM, based on the five selected features, identified four clusters in the CHF cohort (k = 4; n = 944, with 373, 248, 138 and 185 patients in clusters 1 to 4, or 39.5%, 26.3%, 14.6%, and 19.6% of the cohort), supported by the elbow profile, consensus matrix, and tracking plot (Figure 4A–C) as well as by the CDF and delta area curves (Supplementary Figure S4A,B; Supplementary Table S10). Although only these five features were used for clustering, the immune and functional characterization described below was based on the full transcriptome. An interactive 3D PCA of the full expression matrix showed separation among the four clusters (Supplementary File S1).
Figure 4.
CHF clustering and expression profiles across clusters. (A) Elbow plot showing the optimal number of clusters (k) based on within-cluster dispersion. (B) Consensus matrix heatmap for k = 4 derived from PAM clustering. (C) Tracking plot of cluster assignment across different values of k. (D–I) Violin plots for the individual and average expression levels of CASP6, CAPNS1, BAK1, CASP4 and BAD among the four clusters (**** p < 0.0001, *** p < 0.001, ** p < 0.01, * p < 0.05, ns: not significant). (J) Heatmap of DEGs from the clusters in pairwise comparisons. (K) Venn diagram showing the number of shared and unique DEGs between clusters and normal samples.
Expression of the five features differed across clusters, with most pairwise comparisons reaching significance (Figure 4D–I), as expected for the variables on which the clustering was based. CASP4 distinguished all four clusters, with the lowest levels in cluster 2 and the highest in cluster 4 (Figure 4H). CAPNS1 showed the opposite pattern, being highest in cluster 2 and lowest in cluster 4, while BAK1 was highest in cluster 3 (Figure 4E,F). CASP6 and BAD also differed between most clusters but across a narrower range of expression values (Figure 4D,G), as did the average expression of the five features (Figure 4I). Beyond these features, DEGs from pairwise comparisons between clusters showed distinct expression patterns across the four clusters (Figure 4J; Supplementary Table S11), and comparison of each cluster with normal samples yielded a large set of DEGs shared by all four clusters (n = 3724) together with smaller numbers unique to individual clusters, ranging from 4 in cluster 1 to 76 in cluster 4 (Figure 4K; Supplementary Table S12). The four clusters therefore differ not only in the selected features, whose distributions partly overlap between clusters, but also in their broader transcriptional profiles, indicating that they are distinguishable at the transcriptome level rather than only in the features used to define them.
3.4. CHF Clusters Exhibit Heterogeneous Immune and Functional States
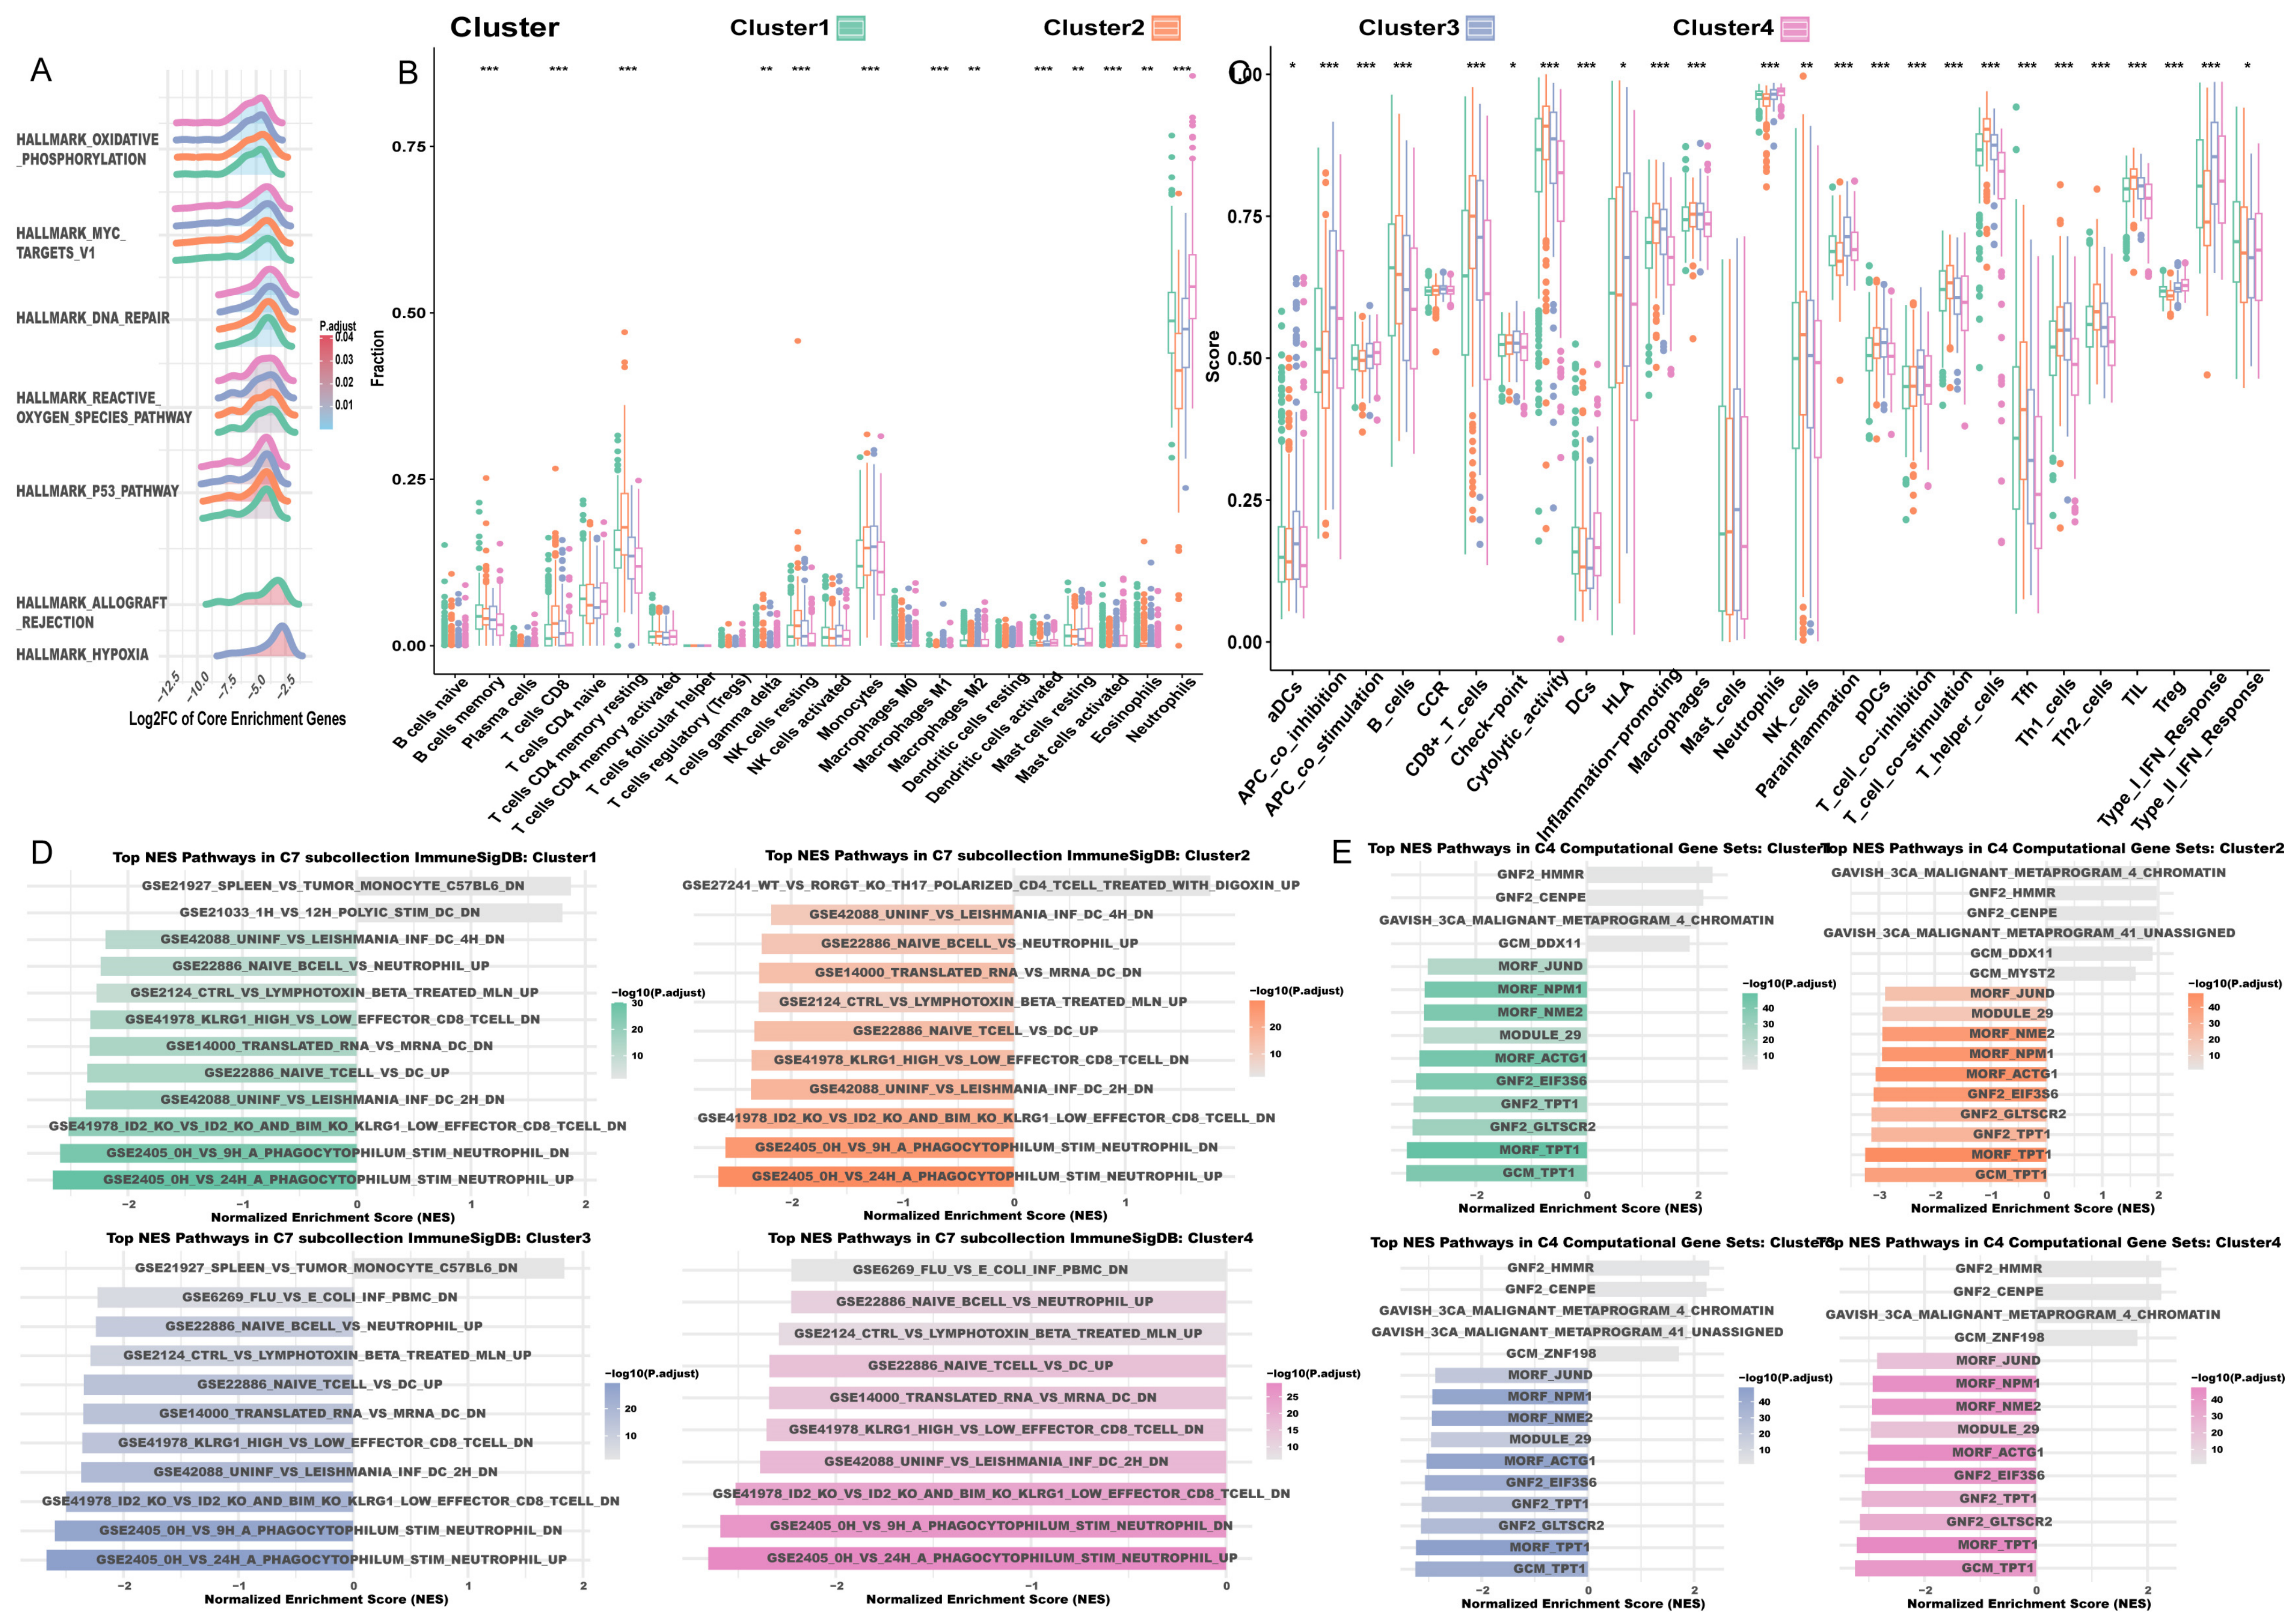
Due to the large overlap of downregulated DEGs between clusters, GO and KEGG analyses were restricted to upregulated DEGs, while GSEA used DEGs from both directions. Enrichment results were largely shared across the four clusters, with most terms appearing in all clusters at closely comparable scores, which is expected between subgroups of a single disease and is further ensured by the use of the same 11 normal samples as the reference for all four comparisons, whereas immune composition and function differed markedly between them (Figure 5A–E; Supplementary Figures S4C–E, S5 and S6; Supplementary Tables S13–S18). These differences followed a single axis defined by the balance between lymphoid and myeloid programs, with clusters 2 and 4 at its ends and clusters 3 and 1 occupying distinct intermediate positions.
Figure 5.
Integrated functional and immune features of CHF clusters. (A) GSEA results of the Hallmark gene set for each cluster. (B) Boxplots of the relative abundance of 22 immune cell types estimated by CIBERSORTx across clusters. (C) Boxplots of 27 immune-related functional signatures (ssGSEA). Significance in (B,C): *** p < 0.001, ** p < 0.01, * p < 0.05. (D,E) GSEA in C7 ImmuneSigDB and C4 computational cancer-related gene sets. Enriched terms were ranked by the absolute value of NES, and the top 10 terms from each direction were selected. For clusters with fewer than 10 positively enriched terms, all available terms are shown.
The two ends of this axis were most clearly separated by immune composition (Figure 5B,C). Every lymphoid measure examined, from CD8+ T cells, resting NK cells, and memory B cells to cytolytic activity, T helper cells, and T cell co-stimulation, was highest in cluster 2 and lowest in cluster 4, while neutrophils ran in the opposite direction. The two clusters also differed in regulatory tone, cluster 2 carrying the lowest APC and T cell co-inhibition scores and cluster 4 the lowest HLA score together with the highest activated mast cell signal, a compartment that in whole blood reflects basophils and granulocytes rather than tissue mast cells and that CIBERSORTx estimates as zero in most samples, so this difference lies in how often a nonzero estimate is returned rather than in the typical value. Enrichment results followed the same division across every collection examined. Among upregulated DEGs, interleukin-15 signaling and T cell selection were confined to cluster 2, whereas tertiary granule and ficolin-1-rich granule membrane components, together with positive regulation of inflammatory cytokine production, were confined to cluster 4 (Supplementary Figure S4C,D; Supplementary Tables S13 and S14). In the canonical pathway collection, cluster 2 alone showed enrichment of extracellular vesicle-mediated signaling, while cluster 4 alone showed further negative enrichment of immune-recognition gene sets, including allograft rejection and cell adhesion molecules (Supplementary Figure S4E; Supplementary Table S16). The division was sharpest in the immunologic signature collection, where cluster 4 was the only cluster without any positively enriched signature and its cluster-specific terms were exclusively negative and restricted to B cell and CD8+ T cell sets, whereas cluster 2 carried a positively enriched Th17-associated signature (Figure 5D; Supplementary Table S17). A comparable pattern was seen in the computational gene set collection, where cluster-specific terms were limited to these two clusters (Figure 5E; Supplementary Table S18). Taken together, cluster 2 corresponds to a lymphoid-enriched and effector-engaged state and cluster 4 to a myeloid-skewed and lymphoid-depleted state, these terms describing the pattern of estimated composition and signature scores rather than measured immune function.
Clusters 3 and 1 lay between these ends but differed from each other in kind. Cluster 3 was intermediate in lymphoid content yet showed the most active antigen-presenting compartment of the four clusters, with a monocyte content among the highest of the four clusters, though not separable from cluster 2, and with the highest scores for HLA, type I interferon response, parainflammation, and activated dendritic cells (Figure 5B,C). This activity was accompanied by the highest APC and T cell co-inhibition scores, and its enriched terms combined innate immune activation with metabolic regulation (Supplementary Figure S4C; Supplementary Table S13), hallmark hypoxia signaling reaching significance in this cluster alone (Figure 5A; Supplementary Table S15). Cluster 3 was also the only other cluster carrying a positively enriched immunologic signature, a monocyte set (Supplementary Table S17). Cluster 1, the largest cluster and accounting for close to 40% of the cohort, remained near the cohort average across cell types and functional signatures and retained the fewest cluster-specific terms in every collection. That so few terms separated the four clusters overall indicates that these immune states were expressed mainly through cell composition rather than through broad divergence in signature enrichment. Read against the phenotypes described in tumor immunology, cluster 2 corresponds to an immune-inflamed or “hot” state and cluster 4 to an immune-depleted or “cold” state, while the combination of active antigen presentation with elevated co-inhibition in cluster 3 resembles an “altered” phenotype, while cluster 1 shows no comparable polarization and sits closest to the cohort baseline.
3.5. The Coordinates Separating the Clusters Are Recovered in an Independent CHF Cohort
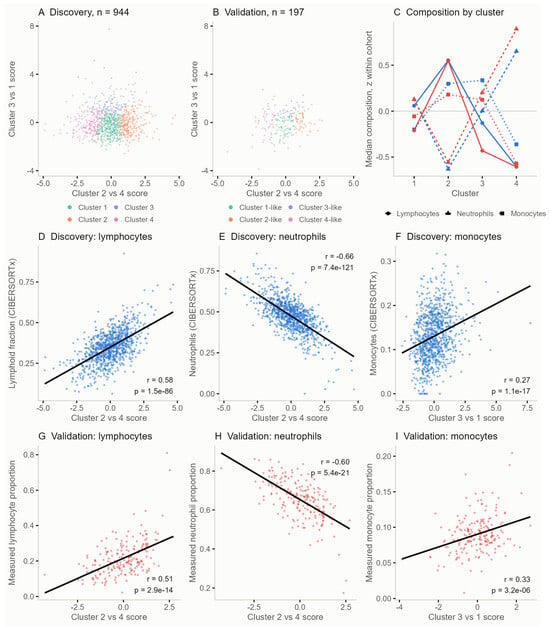
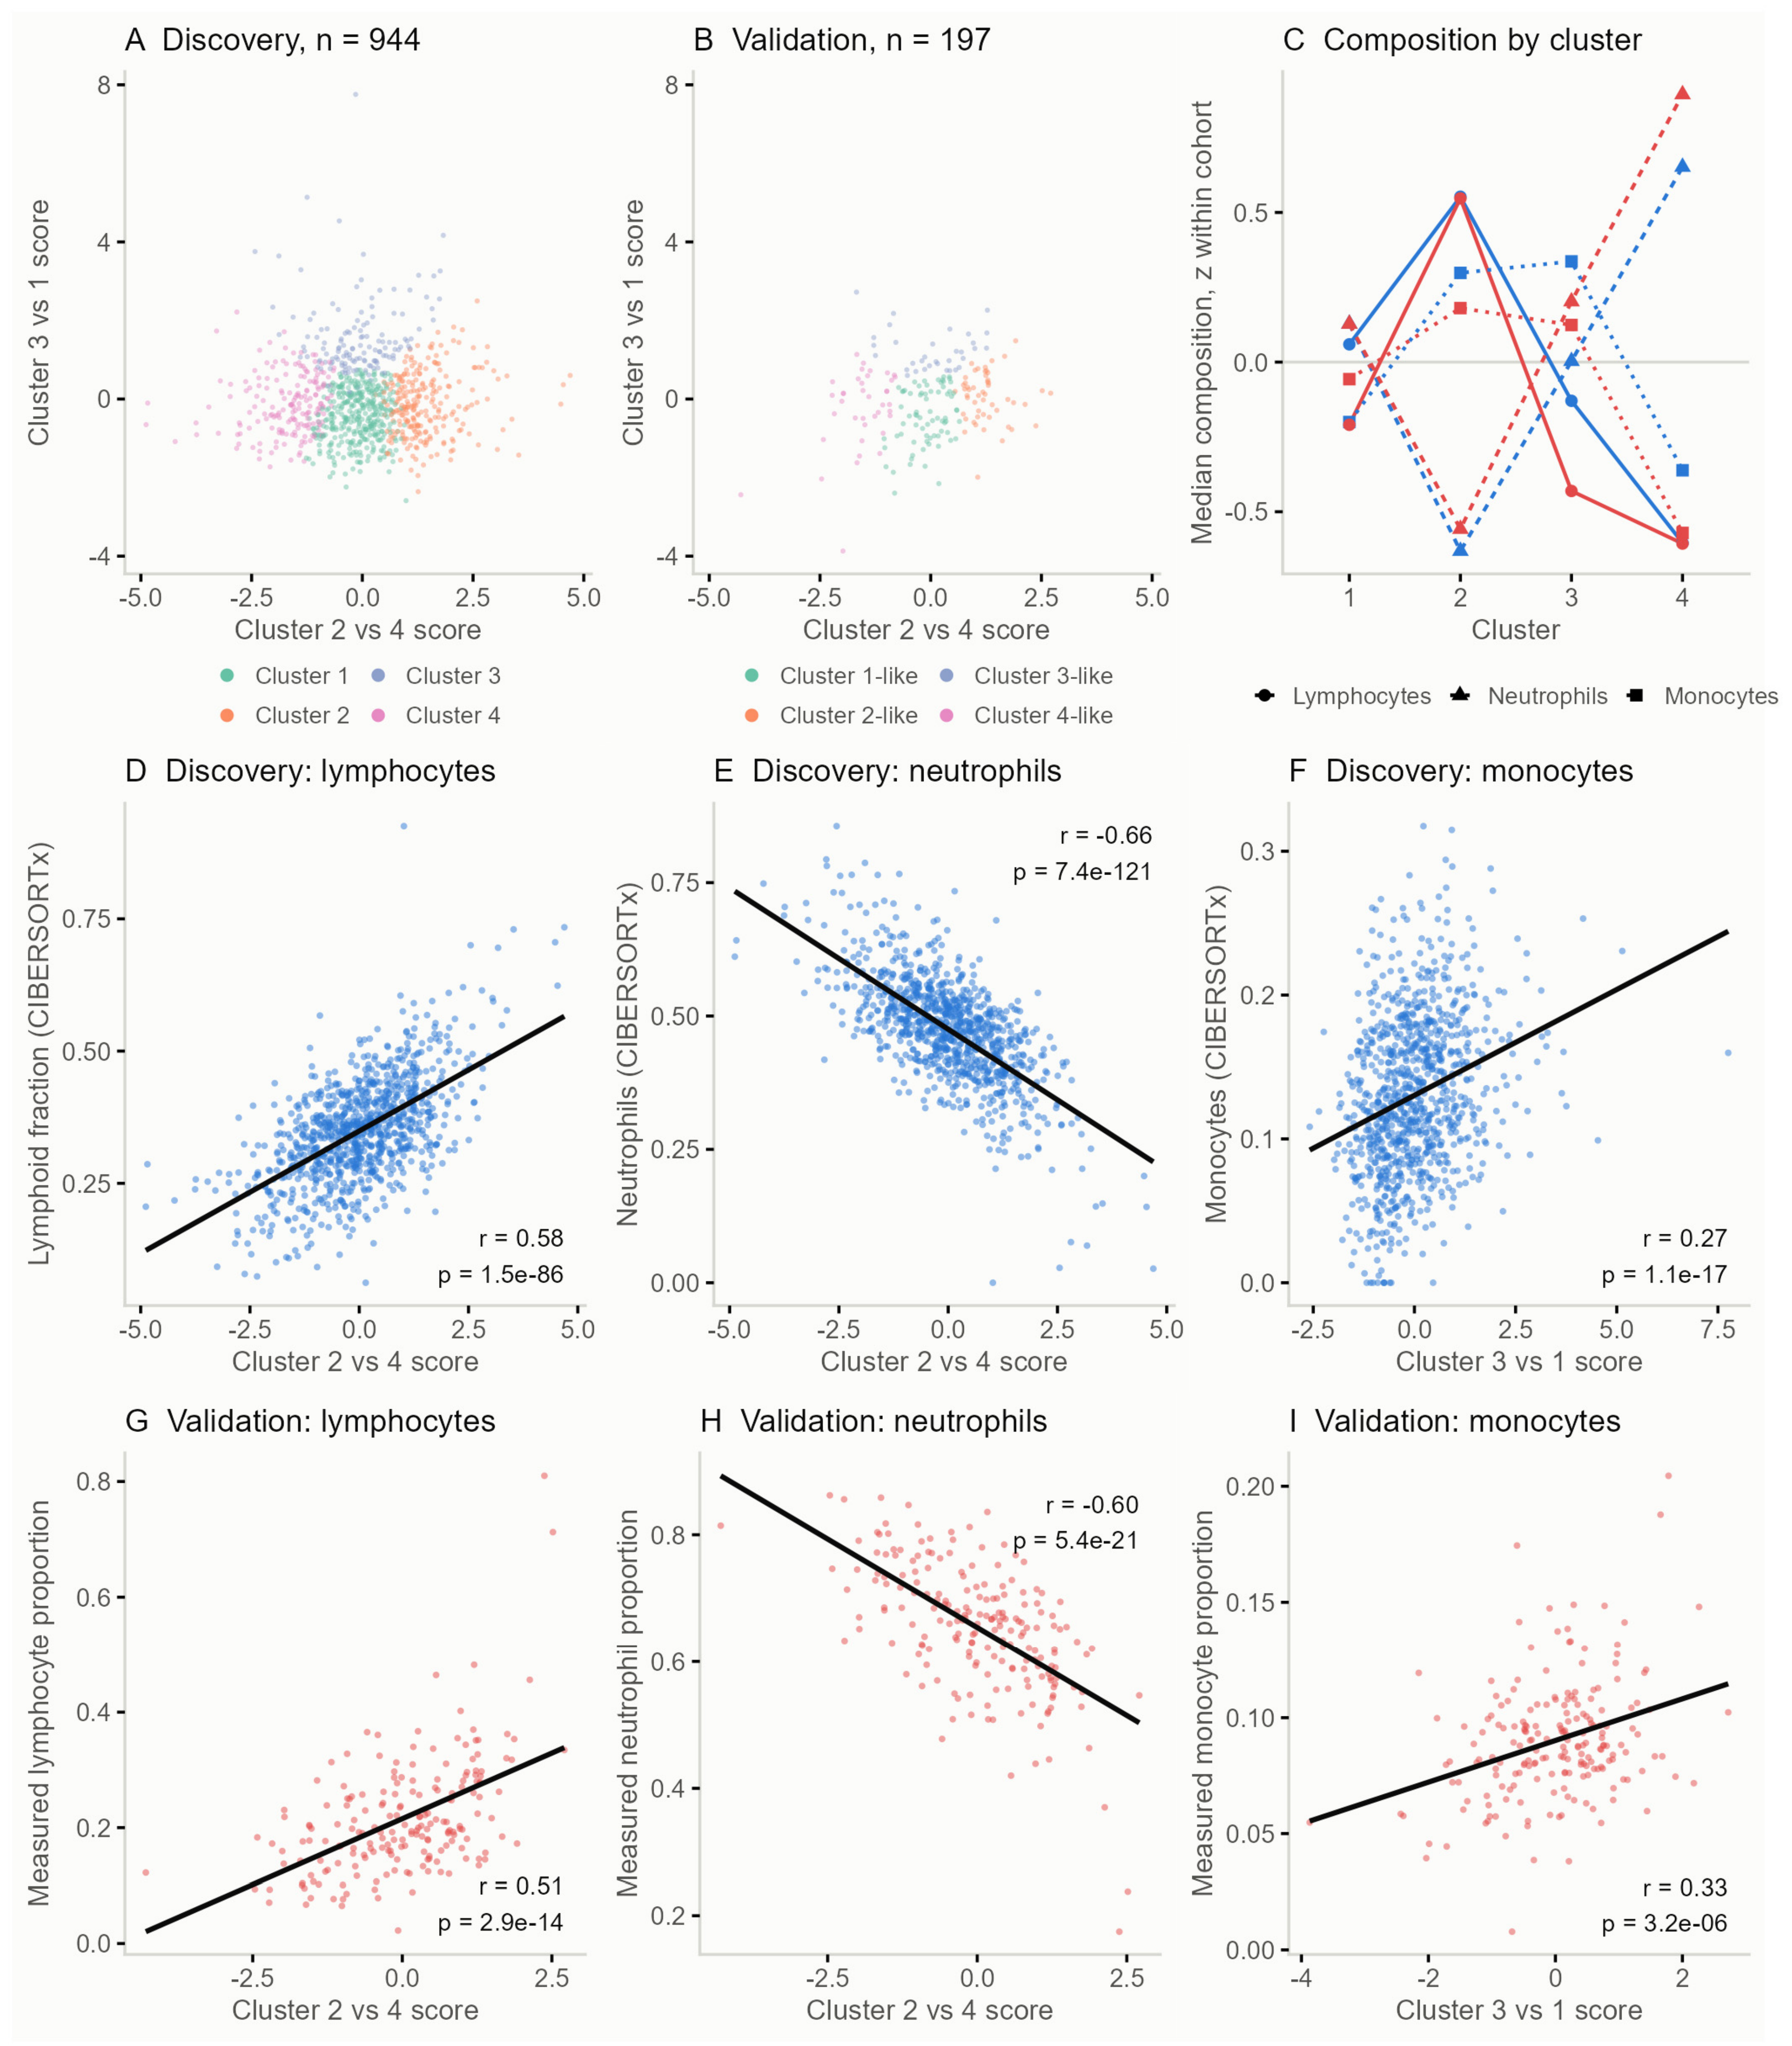
The four cluster centroids define two directions in the five features space, one running from cluster 4 to cluster 2 and the other from cluster 1 to cluster 3. The two are close to orthogonal (cosine 0.002) and together place all four clusters in a plane (Figure 6A). Both sets of weights were fixed in the CHF cohort, so no parameter was estimated in GSE77343, where the 197 patients were placed on the same plane and assigned to the nearest centroid without clustering (Figure 6B; Supplementary Table S19). Assignment places every patient in one of the four groups by construction, so what is tested here is the behavior of the two coordinates against measured cell counts rather than the recurrence of four groups. The cluster 2 versus 4 score behaved there as it had in the CHF cohort. It was associated with lymphocyte content (r = 0.58 and 0.51) and inversely with neutrophil content (r = −0.66 and −0.60), at comparable magnitude and in the same direction (all p < 0.001; Figure 6D,E,G,H), and adjustment for age and sex left both unchanged (r = 0.52 and −0.61). The cluster 3 versus 1 score carried a separate signal. It was associated with monocyte content in both cohorts (r = 0.27 and 0.33, ρ = 0.28 and 0.26, p < 0.001; Figure 6F,I) and retained that association when the cluster 2 versus 4 score was held constant (partial r = 0.27 and 0.28, p < 0.001), while showing no association with lymphocyte or neutrophil content in GSE77343 (r = −0.05 and −0.08, p = 0.50 and 0.27).
Figure 6.
The four CHF clusters and their coordinates in an independent cohort. (A) The discovery cohort (GSE181114, n = 944) in the plane defined by the cluster 2 versus 4 score and the cluster 3 versus 1 score, colored by cluster. (B) The independent cohort (GSE77343, n = 197) on identical axes, colored by the nearest discovery centroid. Cluster 1-like to cluster 4-like denote this assignment. (C) Median lymphocyte, neutrophil, and monocyte content of the four clusters in the two cohorts, standardized within each cohort so that the two kinds of measurement are on one scale. (D–F) Discovery cohort, lymphoid fraction, neutrophils, and monocytes estimated by CIBERSORTx. (G–I) Independent cohort, the corresponding proportions from the complete blood count differential. Lines in (D–I) are least squares fits, with Pearson r and p shown in each panel.
Read across the four clusters, the measured composition of the assigned groups followed the order seen in the CHF cohort (Figure 6C). Lymphocyte content was highest in cluster 2 and lowest in cluster 4 in both cohorts, neutrophil content ran the opposite way, monocyte content was lowest in cluster 4, and cluster 1 stayed close to the cohort median throughout. All three differed across the four groups in GSE77343, as did cluster 2 against cluster 4 (all p < 0.001). The five features did not contribute alike. Against lymphocyte content, CASP6, CASP4, and BAD reproduced the direction of their associations in the CHF cohort (r = 0.43, −0.69 and −0.36, p < 0.001), whereas CAPNS1 and BAK1 did not reach significance (p = 0.39 and 0.53). Against monocyte content, the arrangement was the reverse, with CAPNS1 and BAK1 recovering (r = 0.49 and 0.32, p < 0.001) while the remaining three did not. Each score therefore recovered as a combination rather than as a set of features behaving alike. Because GSE77343 carries measured differentials, the two scores were also compared with the neutrophil-to-lymphocyte ratio (NLR) and the monocyte-to-lymphocyte ratio (MLR) derived from them. The cluster 2 versus 4 score was associated with log NLR (r = −0.54, p < 0.001) and the cluster 3 versus 1 score with log MLR (r = 0.18, p = 0.013), while the cluster 3 versus 1 score showed no association with log NLR (r = −0.01, p = 0.86). The two ratios accounted for 40% and 11% of the variance of the two scores and were themselves strongly correlated (r = 0.83), so they do not resolve two separate directions. The two cohorts measure both quantities by different means, transcript abundance on different array platforms and cell content by deconvolution in the discovery cohort and by the complete blood count differential in the validation cohort, so individual feature correlations are not expected to be numerically comparable between them.
3.6. Protein Expression Across Tissues and Exploratory Survival Associations
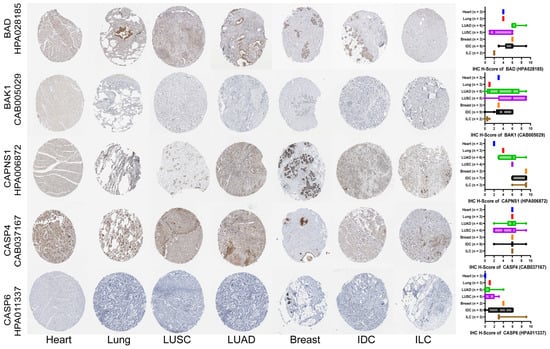
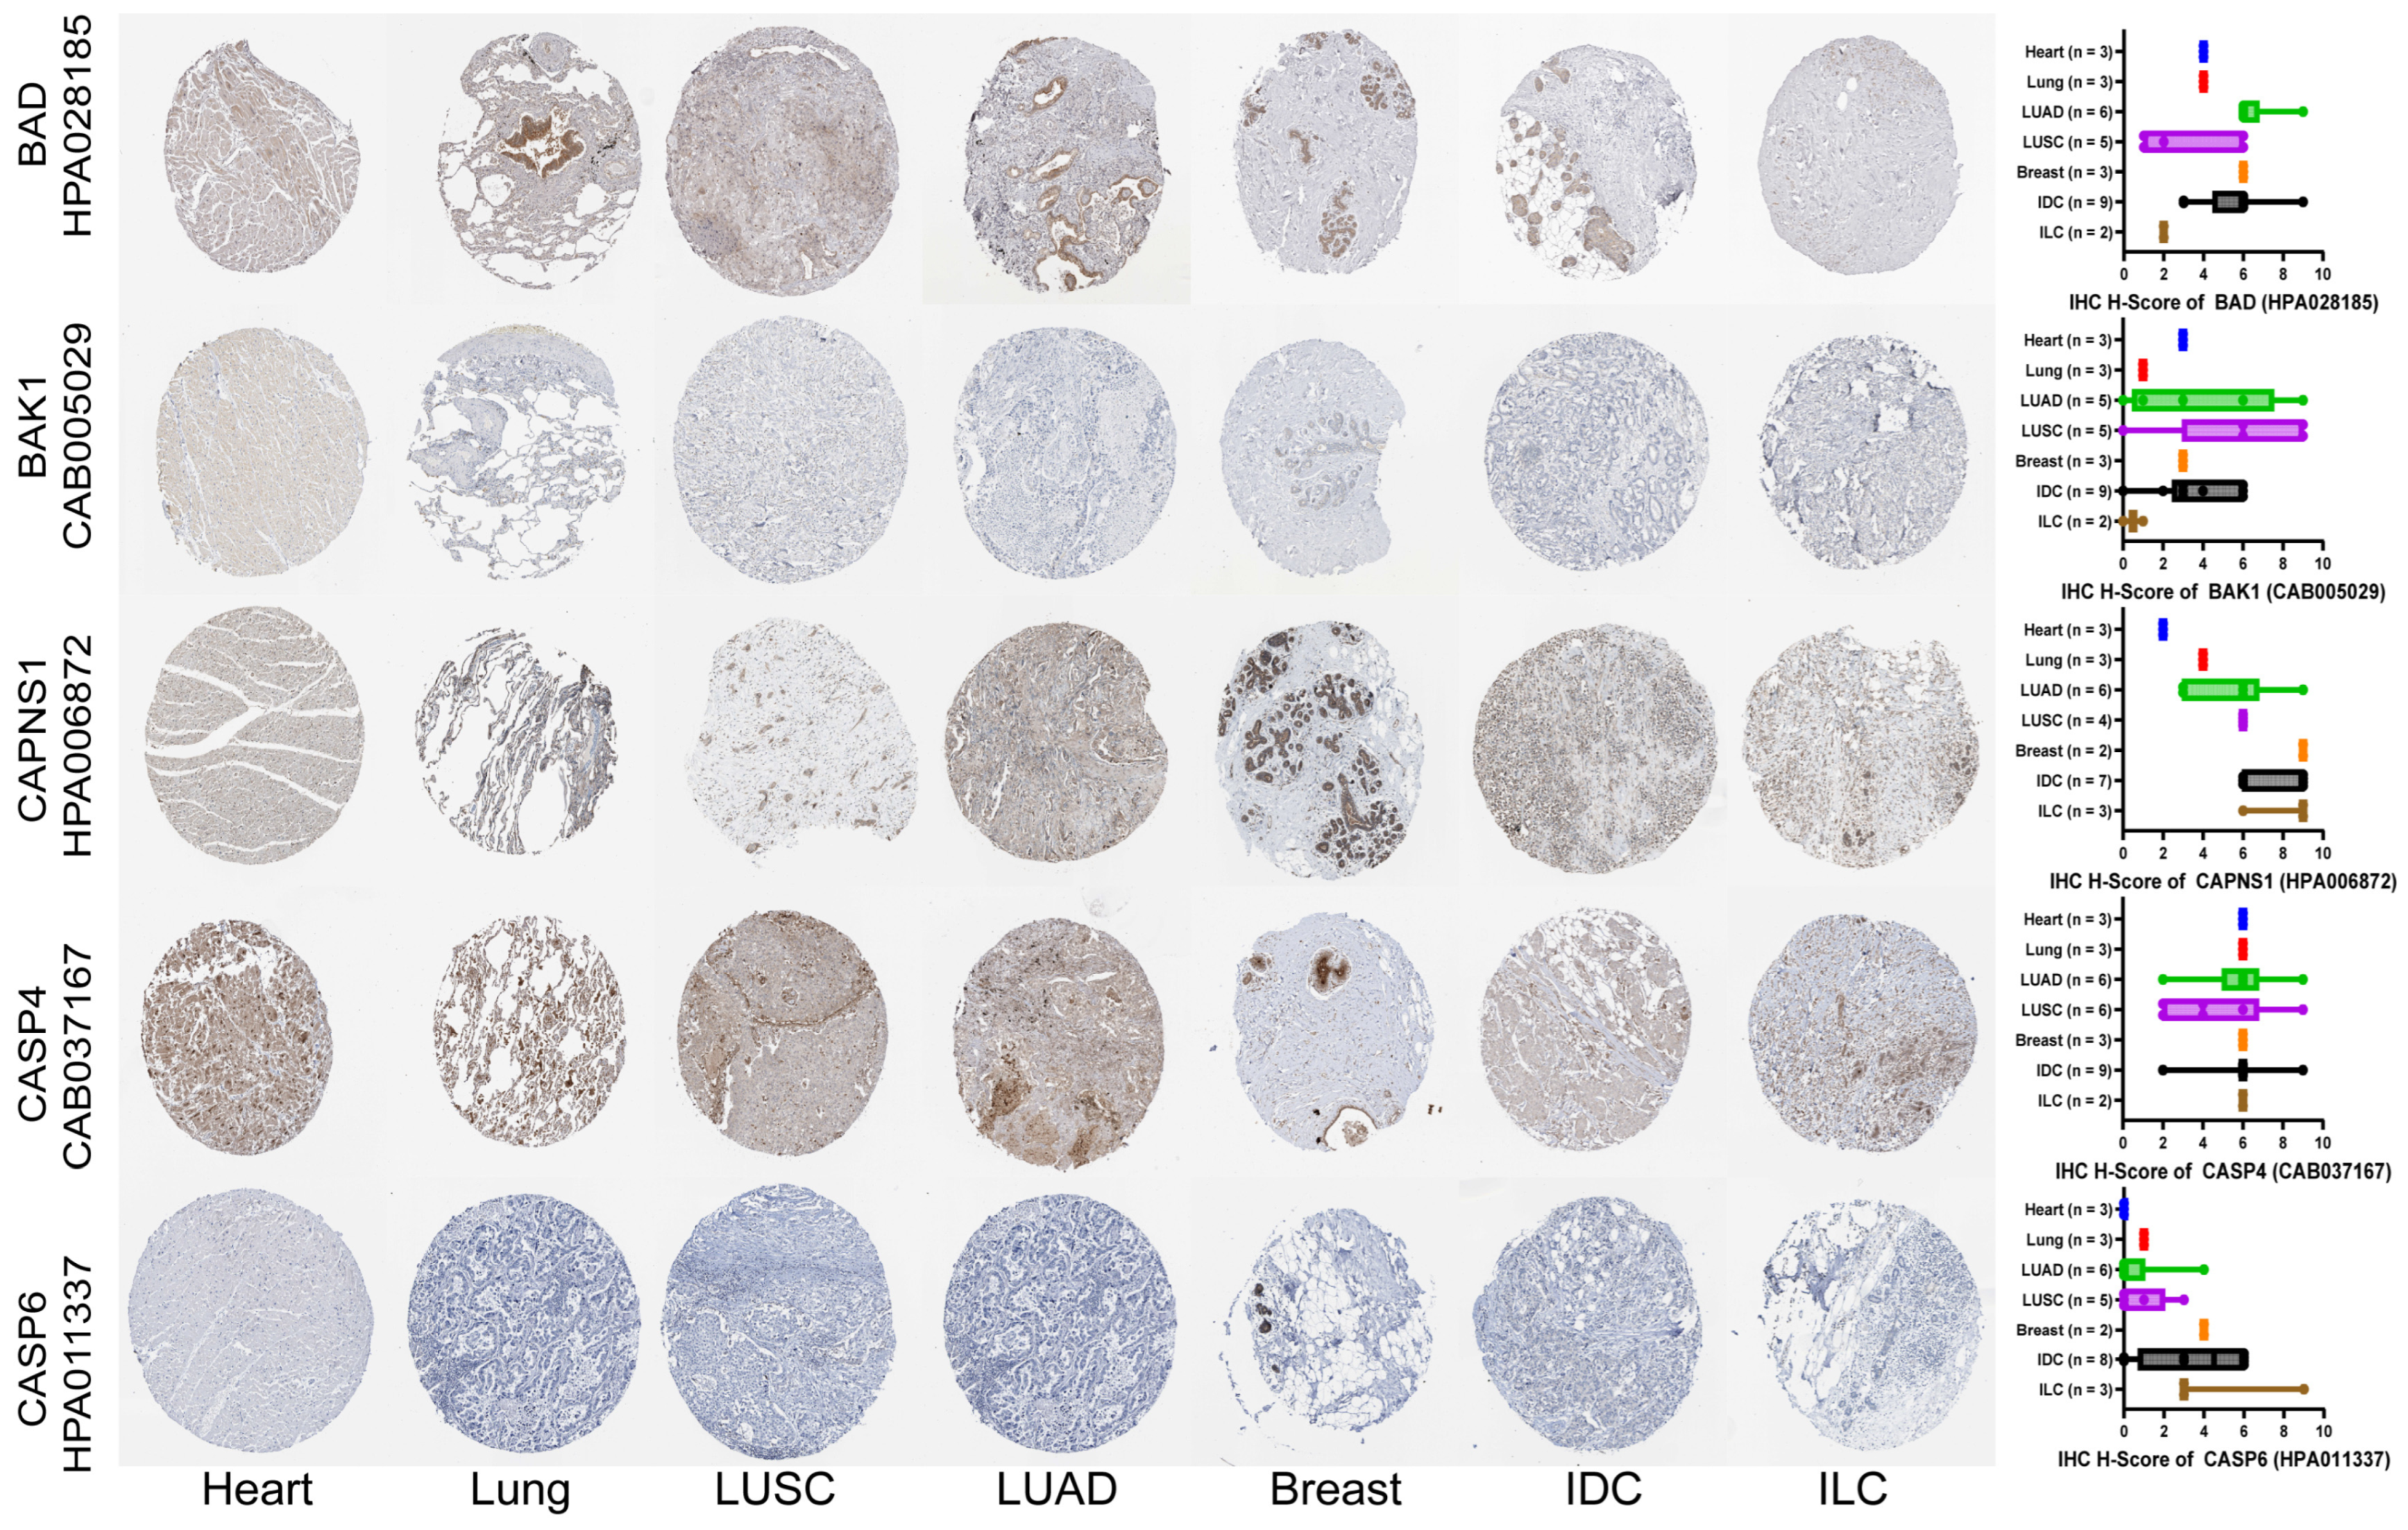
All five features were downregulated in CHF peripheral blood, and organ-matched comparisons showed that this direction was recapitulated in tumor tissue in a histology-dependent manner (Figure 7; Supplementary Table S20). In LUSC, BAD, CASP4, and CASP6 were all lower than in normal lung, and in ILC, BAD, BAK1, and CASP6 were all lower than in normal breast. The adenocarcinoma and ductal subtypes behaved differently: in LUAD, BAD, BAK1, and CAPNS1 were instead higher than in normal lung, and in IDC none of the five features was reduced. Across all four tumor types, CASP6 was the feature most consistent with the blood direction, being reduced in three of them, whereas CAPNS1 was reduced in none and was higher in both lung tumors. Additional antibodies for BAD, CASP4, and CASP6 showed that these differences are antibody-dependent, with several comparisons unchanged and others running in the opposite direction (Supplementary Figure S7). The concordance with the blood direction therefore separated along histological lines rather than by organ, with the squamous and lobular subtypes aligning with the CHF signature and the adenocarcinoma and ductal subtypes diverging from it.
Figure 7.
Representative IHC images and semi-quantitative analysis of the selected features. Representative IHC staining images showing the protein expression of the five selected features (BAD, BAK1, CAPNS1, CASP4, and CASP6) in normal heart, lung, and breast tissues, as well as LUAD, LUSC, IDC, and ILC. Heart sections represent normal myocardium rather than failing myocardium. Gene symbols and corresponding antibody IDs are indicated on the left side of the figure. The right panels display modified IRS distributions based on staining intensity and positive cell fraction. All staining data were obtained from the HPA.
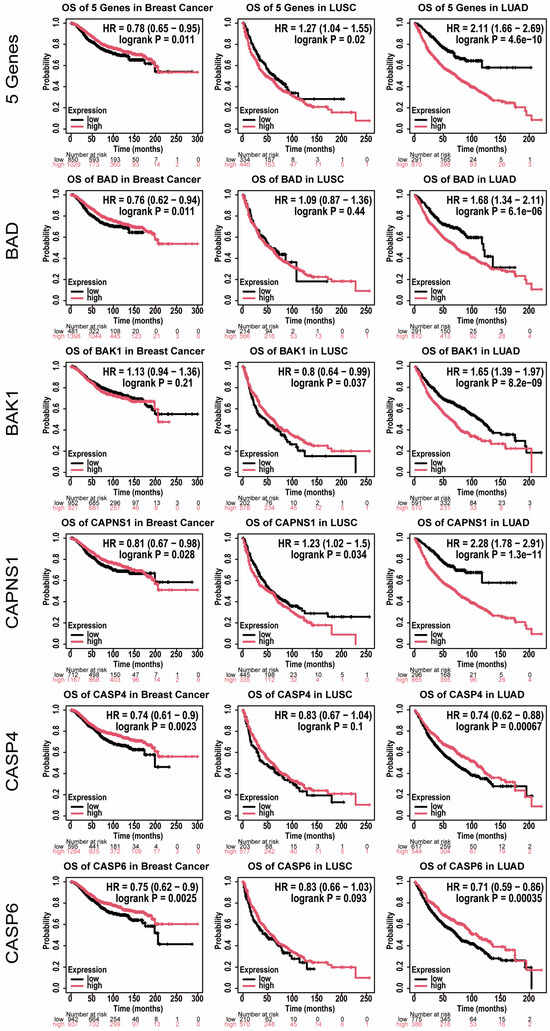
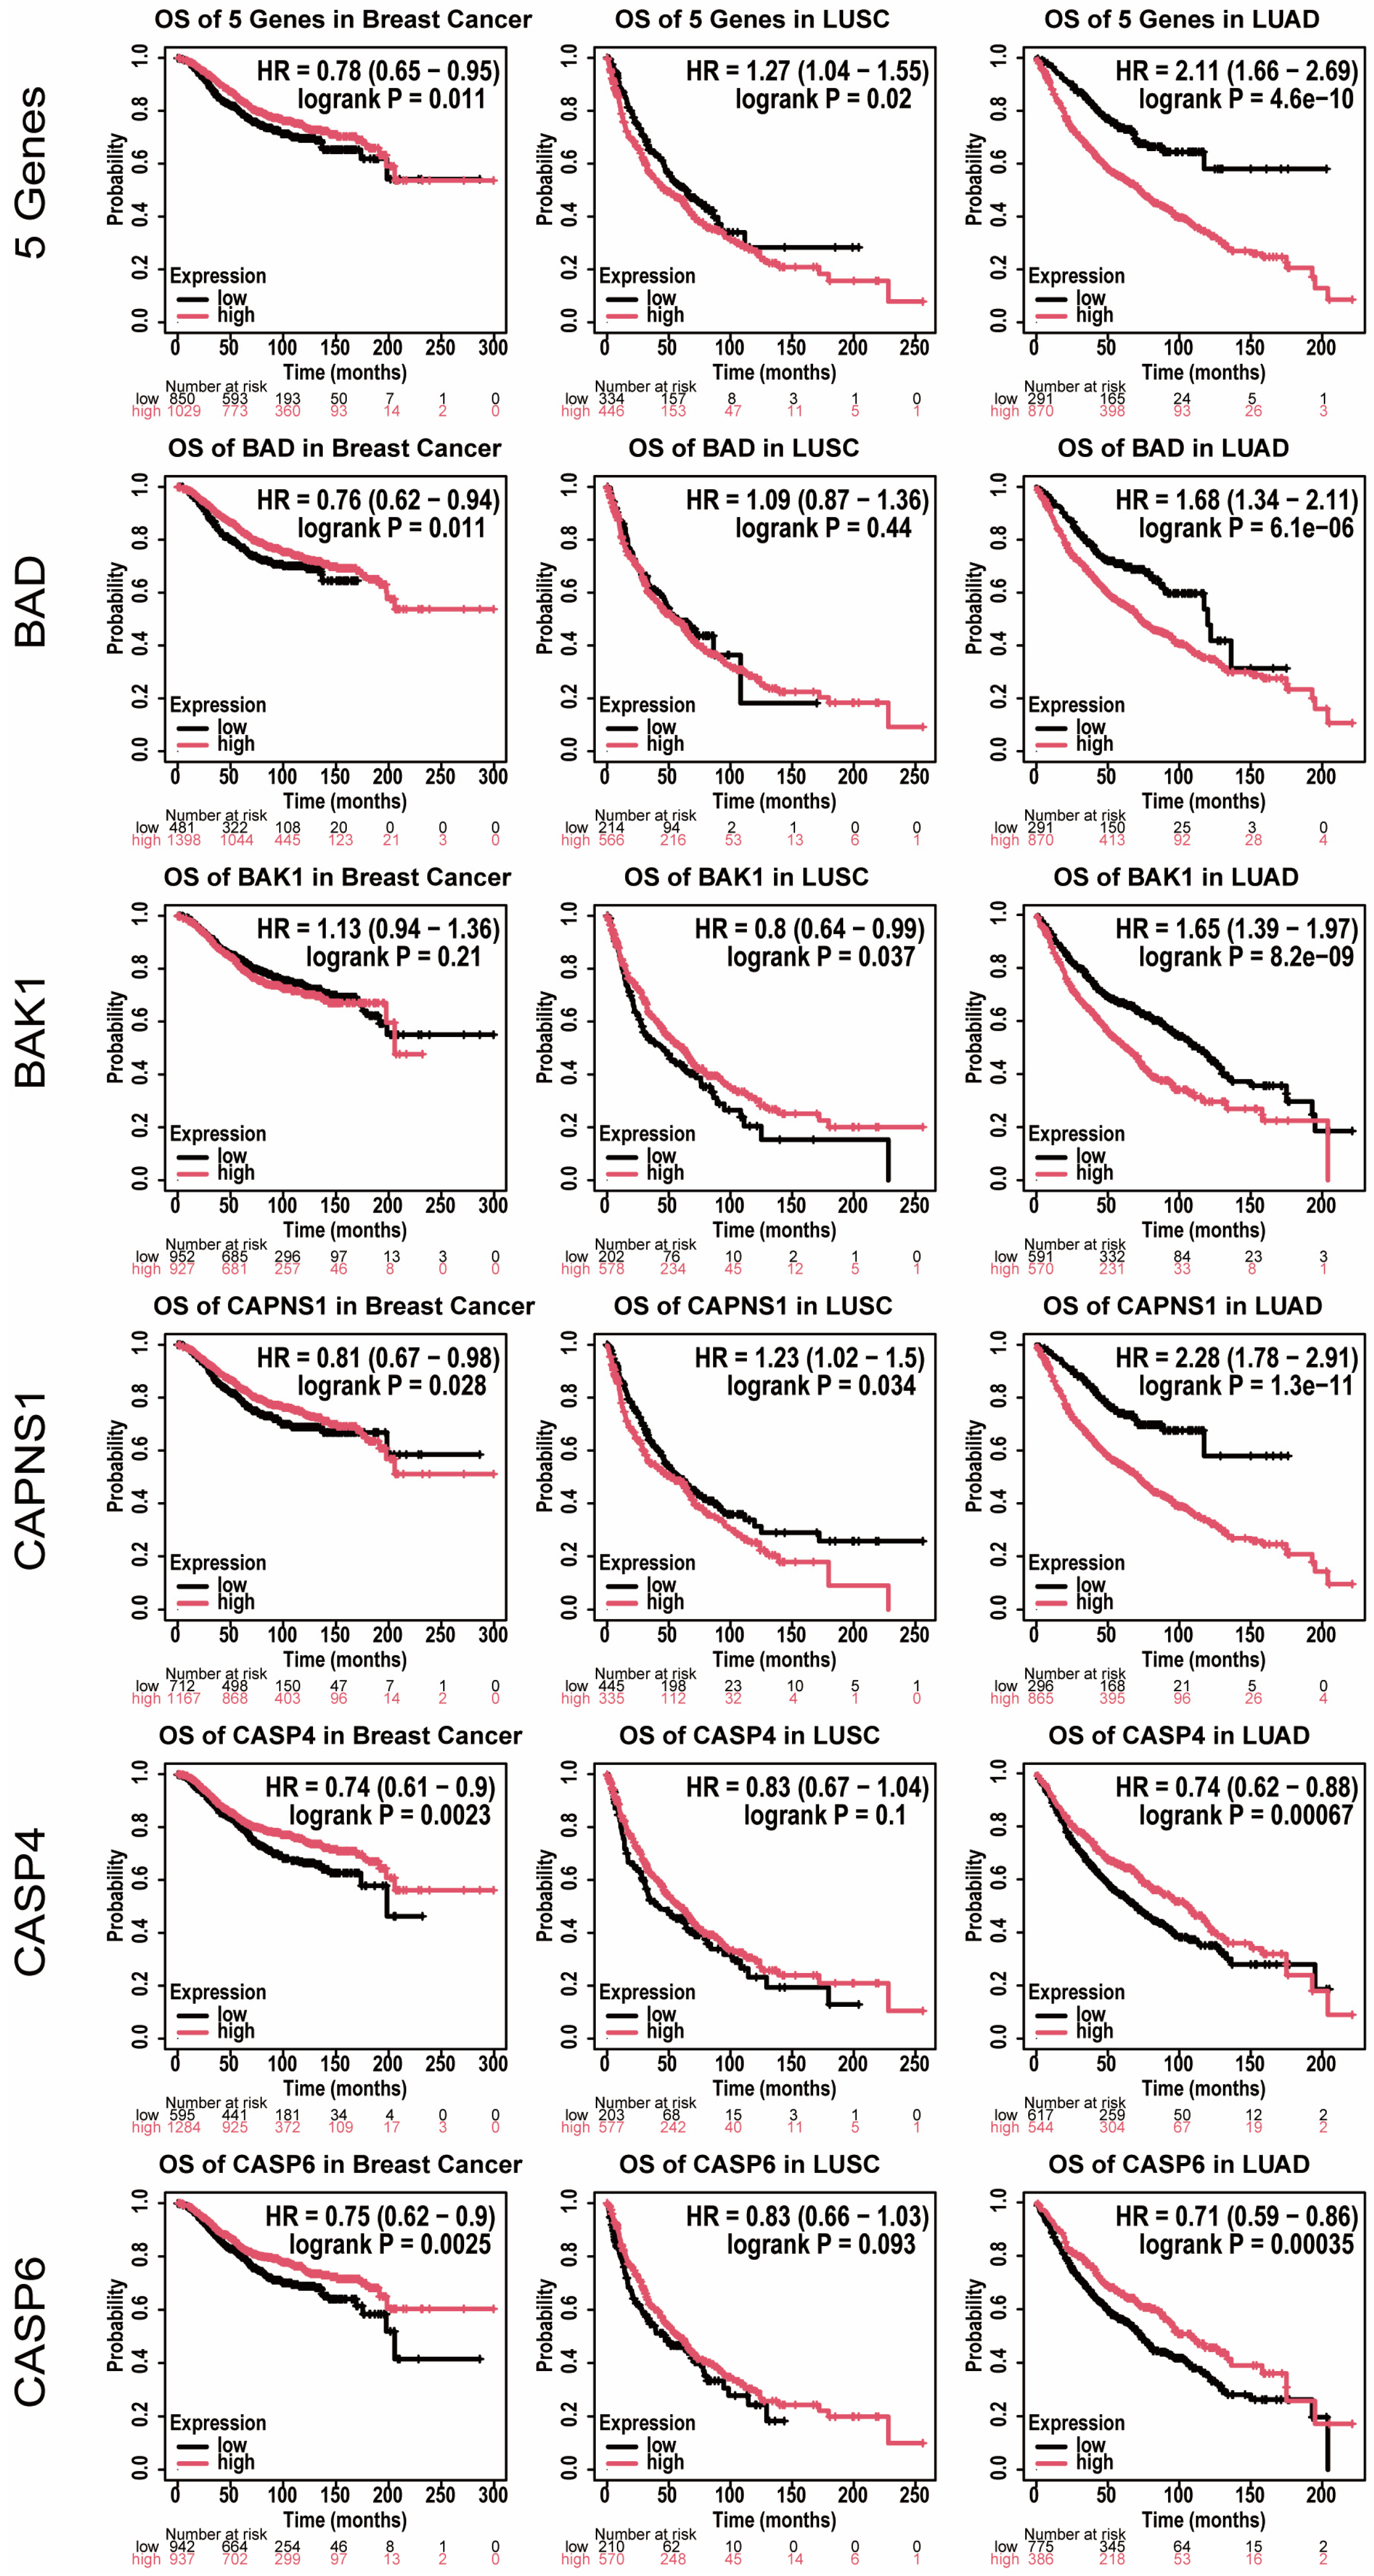
Overall survival, expressed as hazard ratios (HRs) with 95% confidence intervals (CIs), was then examined in lung and breast cancer cohorts, in which treatment-related cardiac dysfunction is a recognized clinical concern (Figure 8). High combined expression of the five genes was associated with worse survival in LUAD (HR 2.11, 95% CI 1.66–2.69, p = 4.6 × 10⁻¹⁰) and LUSC (HR 1.27, 95% CI 1.04–1.55, p = 0.02), but with better survival in breast cancer (HR 0.78, 95% CI 0.65–0.95, p = 0.011). The individual genes did not share this pattern. CASP4 and CASP6 were associated with better survival in both breast cancer and LUAD, and pointed the same way in LUSC without reaching significance. BAD and BAK1 changed direction between cohorts. BAD accompanied better survival in breast cancer and worse survival in LUAD, and BAK1 reversed even between the two lung subtypes, from better survival in LUSC (HR 0.80, 95% CI 0.64–0.99, p = 0.037) to worse survival in LUAD (HR 1.65, 95% CI 1.39–1.97, p = 8.2 × 10⁻⁹). CAPNS1 was the only gene significant in all three cohorts, associated with better survival in breast cancer and with worse survival in both lung subtypes, and carried the strongest association of any feature in LUAD (HR 2.28, 95% CI 1.78–2.91, p = 1.3 × 10⁻¹¹). The split between the two lung subtypes seen in tumor tissue reappeared at the outcome level, most clearly for BAK1, and across the three cohorts the five genes fell into three distinct prognostic behaviors, consistent with the weak correlation already observed among them in peripheral blood. Across the 18 tests, Bonferroni correction left the six associations in LUAD together with CASP4 and CASP6 in breast cancer significant, while the three nominally significant associations in LUSC and the remaining three in breast cancer were not. The combined signature is the mean expression of the five genes as provided by the platform and is not the projection used in the CHF cohort, since the weights of w1 and w2 derive from contrasts between CHF clusters that do not exist in these tumor cohorts.
Figure 8.
Prognostic associations of the selected features in solid malignancies relevant to cardio-oncology (breast and lung cancer). Kaplan–Meier overall survival analyses of the combined signature (CASP6, CAPNS1, BAK1, CASP4, and BAD) and of each feature individually were performed in breast cancer (n = 1879), LUSC (n = 780), and LUAD (n = 1161) cohorts using the KM Plotter platform. Patients were stratified by the optimal cutoff automatically selected by the platform. Hazard ratios (HRs) with 95% confidence intervals were estimated using univariate Cox proportional hazards models, and statistical significance was evaluated using the log-rank test.
4. Discussion
CHF peripheral blood has been described as a broadly immunosuppressed state [3,4,5], and the present cohort reproduced that description in aggregate. The finding reported here is that the aggregate is an average. When the 944 patients were partitioned without reference to it, they did not scatter but separated into four clusters arranged along a single axis, running from a lymphoid-enriched, effector-engaged state at one end to a myeloid-skewed, lymphoid-depleted state at the other, with two distinguishable intermediate states between them. Patients at opposite ends of this axis differed in almost every immune measure examined, and differed in opposite directions. This axis is not itself new. The balance between the two compartments is already tracked in heart failure as a scalar, from the relative lymphocyte concentration in advanced disease [21] to the neutrophil-to-lymphocyte ratio, which predicted cardiovascular events and mortality across 60,087 participants in five randomized trials [22], and recent work has begun to separate that ratio into components carrying different associations [23] and to describe its myeloid side as heterogeneous in its own right [24]. What those indices record as a degree appears here as positions that differ in kind. A description that holds for the cohort as a whole therefore holds for few of the patients within it, and the immunosuppression attributed to CHF is better understood as one position on a distribution than as a property shared by the population.
Immune dysregulation in CHF has been characterized almost entirely at the level of the patient group [3,4,5] through comparisons of patients against controls. That design defines the average difference between two populations and cannot, by construction, reveal whether the difference is shared by the patients who make it up. The distribution of these alterations across individuals has therefore attracted little attention, despite being the level at which any clinical application would operate. Stratification itself is not unfamiliar in heart failure: unsupervised analysis of clinical, echocardiographic, and biomarker data has repeatedly partitioned heart failure populations, particularly heart failure with preserved ejection fraction, into subgroups with distinct profiles and outcomes [10,11,25], and has shaped the current understanding of the syndrome as a set of overlapping phenotypes. In one cohort, these phenogroups also differed in their response to spironolactone [26]. That literature has been explicit about its own limits. Cluster solutions depend on the variables entered and the cohort analyzed, and they have proved difficult to transfer between datasets [27]. What was carried to an independent cohort here was not a partition but a pair of coordinates, and they kept the immunological meaning they had in the cohort where they were defined. Tissue-level work has moved in the same direction, with single-cell and spatial profiling having resolved diverse immune and stromal states within failing and infarcted human myocardium [28,29,30]. Here, the same logic is applied to the peripheral blood transcriptome, which in CHF has been analyzed almost exclusively as a single group [6,7,17]. These 944 samples are a nested case–control sample of the BIOSTAT-CHF study, matched for age and sex, in which the patients who died of a cardiovascular cause within the follow up period carried lower estimated T cell and B cell content and higher neutrophil and basophil content than those who survived, together with an impaired adaptive immune response and reduced T cell co-stimulation and T cell proliferation signaling that persisted after adjustment for cell composition [17]. The axis described here runs along the same contrast, cluster 2 carrying the highest lymphoid content and the highest T cell co-stimulation score of the four clusters and cluster 4 the lowest of both, together with the highest neutrophil content and the highest signal in the compartment that in whole blood stands for basophils and granulocytes. The states described here are not offered as a competing taxonomy. Their potential value lies in the same place: in whether they identify patients who differ in ways that matter clinically.
Differences between the four states were concentrated in immune cell composition rather than distributed evenly across the analyses. Most enriched terms were common to all four clusters and carried closely comparable scores, and although each cluster retained distinctive terms of its own, these were few. Part of this overlap is a property of the design, since the same 11 normal samples served as the reference for all four clusters. Sparse separation at the level of enriched terms is not by itself surprising, since differential expression results in human data are strongly shared across conditions and gene set analyses distinguish them only weakly [31,32]. Immune cell composition and functional signatures, by contrast, diverged across nearly every measure examined. In whole blood, this combination is interpretable rather than paradoxical. Measured expression reflects the mixture of circulating leukocytes at least as much as the regulatory state of any one population [33,34], so a difference that is compositional will appear in deconvolution and in signature scores while leaving pathway level enrichment largely untouched. The heterogeneity described here is accordingly heterogeneity of the circulating immune compartment itself, in the balance between lymphoid and myeloid populations, and this is the level at which peripheral blood can report on it. Within that compartment, the LM22 macrophage and mast cell fractions represent circulating monocyte states and basophils and granulocytes rather than mature macrophages or mast cells, which are not present in venous blood. Variation of this kind is a recognized axis of human immune variation rather than a peculiarity of CHF [35], and composition-defined states have been used to describe severe disease outside oncology, most clearly the dysregulated myeloid compartment of severe COVID 19 [36]. The vocabulary developed for tumor immune phenotypes offers a convenient description of the arrangement [8,9,37]. Cluster 2, lymphoid-engaged and effector-engaged, resembles an immune-inflamed or “hot” configuration, while cluster 4, myeloid-skewed and lymphoid-depleted, resembles a “cold” one. Cluster 3, which combines the most active antigen-presenting compartment with the highest co-inhibitory scores, resembles an “altered” one. The analogy names patterns of immune composition and nothing further, and does not assert that comparable processes operate in CHF peripheral blood and in tumor tissue. Cluster 1 has no counterpart in this vocabulary and is not forced into one. Its position is informative in a different way. Sitting near the cohort average across every measure and carrying the fewest distinctive terms, it is the state that the group-level description of CHF actually describes, and it accounts for well under half of the patients.
The five features on which the stratification was built are annotated to a single pathway, and it would be natural to read them as a coordinated module. The present data indicate otherwise. Their pairwise correlations in peripheral blood were weak throughout, the strongest being a negative association between CAPNS1 and CASP4. On the pathway diagram they occupy separate branches rather than a single step, positions that belong to distinct segments of the cell death machinery [38]. In tumor tissue their directions diverged, CASP6 being lower than normal tissue in three of the four tumor types examined while CAPNS1 was not lower in any of them, and in the survival analyses they fell into three distinct behaviors, with BAK1 reversing direction even between the two lung subtypes. Shared pathway annotation therefore does not describe how these features behave. This is not peculiar to the present pathway, since across gene networks the inference of shared function from association is the exception rather than the rule [39]. CASP4 and CASP6 illustrate the point within the pathway itself. One senses cytosolic lipopolysaccharide and cleaves gasdermin D, the step that commits a cell to pyroptosis [40,41], while the other cleaves receptor interacting protein kinase 1 in an apoptotic context [42]. The division between inflammatory and apoptotic caspases is in any case no longer clean [43]. In blood, the same annotations bear on the leukocyte compartment itself, since apoptotic regulation operates in hematopoietic precursors and caspase activity accompanies myeloid differentiation in the absence of cell death [44,45]. These directions are consistent with where each feature sits in the pathway. CASP4, the cytosolic sensor that cleaves gasdermin D [40,41], is highest at the myeloid end of the axis, where neutrophil content is greatest, whereas CAPNS1 and BAK1, which act in calpain signaling and in the intrinsic apoptotic machinery, respectively, follow monocyte content, the compartment that distinguishes cluster 3. Because these are whole blood measurements, such correspondences follow the composition of the sample and do not establish that the corresponding pathway is active in the cells concerned. The five features move independently of one another, and nothing in these data identifies them as a functional unit. That independence, however, is what makes them usable. Features that varied together would define a single gradient and would place every patient on one line, differing only in degree. Features that vary separately generate combinations, and it was these combinations that resolved the cohort into four states. The form of heterogeneity recovered here therefore depends on the independence of the coordinates used to look for it, in that a correlated set would have described patients as more or less affected, whereas an uncorrelated one distinguished them by the configuration of their circulating immune compartment. Two of these features have described roles in cardiac settings, myeloid-specific deletion of Capns1 limiting infarct injury in mice and BAK1 acting in cardiomyocyte apoptosis in heart failure [46,47]. Neither finding speaks to what produces the states described here. The five features serve in this study as the coordinates of that separation, not as an explanation of what produces it.
Carrying a signature out of blood assumes that its direction travels with it. In this secondary and exploratory extension, it did not. Lung and breast cancer were examined because treatment-related cardiac dysfunction is a recognized concern in these populations [13,14,15,48]. In tissue, concordance with the direction seen in CHF blood followed histological subtype rather than organ, the squamous and lobular subtypes agreeing with it and the adenocarcinoma and ductal subtypes not. That boundary is not one this study drew. Lung squamous carcinoma and lung adenocarcinoma have been characterized as distinct molecular entities [49,50], and invasive lobular carcinoma is separable from invasive ductal carcinoma on the same grounds [51], so the split observed here falls along a division already recognized in tumor taxonomy. In outcome, the divergence was wider. The combined signature was associated with better survival in breast cancer and with worse survival in both lung subtypes, and the individual features separated into three behaviors. Prognostic associations that change with tumor type are a general property of the transcriptome rather than a peculiarity of these five genes [52]. For BAD, the published record is itself divided, with loss of expression having been associated with poor prognosis in non-small cell lung cancer [53], while expression of the BAD pathway marks triple negative status and poor outcome in breast cancer [54], and the associations found here agree with neither, BAD accompanying better survival in breast cancer and worse survival in LUAD. The measurements are not equivalent, since those reports scored protein and pathway activity in surgical series while the present analysis used transcript levels and a cutoff selected by the platform, so the difference is not a contradiction of them. CAPNS1 shows a comparable mismatch. The catalytic subunits of calpain have been reported to promote breast cancer metastasis [55], whereas CAPNS1, the small subunit they share, was associated with better survival in the breast cohort and with worse survival in both lung subtypes here. The prognostic meaning of these molecules is therefore unsettled, and the present analysis adds instances to that record rather than resolving it. They are accordingly not offered as biomarkers, and their role remains the one described above, as coordinates of a separation within one cohort. A separate line of work addresses the opposite direction, reporting that heart failure and myocardial infarction accelerate tumor growth through circulating factors and cardiac extracellular vesicles [16,56]. Nothing measured here speaks to that direction. The present results bear instead on how work of that kind might proceed, since a bidirectional account requires features that can be read at both ends, and what is observed here shows that a feature characterized in one setting cannot be assumed to keep its meaning in another.
The present results are bounded in several respects. The case–control comparison that initiated feature selection is confounded by study and platform and is further limited by the imbalance between the 944 CHF and 11 normal samples. It is therefore used only as a candidate-reduction filter. The clusters, centroids, and coordinates derive from within-cohort variance in GSE181114 and were applied to GSE77343 without re-estimation. The four clusters partition a continuous distribution rather than demonstrating four separate states. Neither of the two scores is distinguishable from a unimodal distribution, a partition into two groups is the most reproducible across resampling, and repeating the clustering with the features standardized or with a Euclidean distance returns partitions only weakly related to the one reported, so the continuous coordinates rather than the partition were carried to the independent cohort. The machine learning step served only to narrow candidates and was not evaluated as a diagnostic classifier. Specificity was not assessed, since the independent cohort contains no control samples. The two coordinates are computed on features standardized within a cohort, so a single sample cannot be placed on the plane without a reference set measured on the same platform. Enrichment analysis was run on differentially expressed genes rather than on the full ranked transcriptome, so the enrichment results describe a selected gene set, and the predominance of negative enrichment scores follows from the predominance of downregulated genes in that set. The sampling was cross sectional, so whether a state persists in an individual or changes over time is not resolved here. Beyond age and sex, the datasets analyzed here carry no clinical annotation, so these states have not been compared with clinical phenotype, treatment, or outcome. The mortality associations published for these samples therefore could not be tested against the clusters, and the correspondence noted above is one of direction only. The 944 samples are also a nested case–control sample selected on outcome, so the cluster proportions reported here are proportions within that sample rather than within a consecutive CHF population. The tissue and survival analyses are exploratory, and the limitation there is a plain one. The tumor cohorts and the CHF cohort comprise different individuals, and no patient contributed to both, so the two settings are connected only through the features examined. In the HPA, each gene and antibody combination is represented by one to three patients in the normal tissues and by two to nine patients in the tumors, and scoring was restricted to parenchymal and malignant epithelial cells, so the comparison also moves from circulating leukocytes to a solid tissue compartment. In the survival analyses the cutoff separating high from low expression was selected by the platform to maximize separation between the two groups, which inflates the type I error rate of each test. Extending this line would require patients in whom heart failure and cancer coexist, together with blood and myocardium sampled from the same person.
5. Conclusions
Peripheral blood transcriptomes place patients with CHF on two nearly independent coordinates, the balance between lymphoid and myeloid programs and the monocyte compartment, along which the four clusters mark positions rather than separate states. The immunosuppressed profile attributed to the disease describes the cohort average and corresponds closely to only one of the four clusters. The five apoptosis-annotated features are the coordinates of that separation rather than an account of what produces it, and outside blood they did not keep a single direction. The heterogeneity described here is carried by the composition of the circulating immune compartment and is therefore accessible without tissue sampling. Its relevance is immunological. Patients with CHF do not share a single immune state, and the axis described here is one on which they can be distinguished.
Supplementary Materials
The following supporting information can be downloaded at: https://www.mdpi.com/article/10.3390/medsci14070779/s1.
Author Contributions
Conceptualization, F.Z., X.W. and Y.Y.; Methodology, X.W. and Y.Y.; Validation, L.Y. and H.Z.; Formal analysis, L.Y., K.C., H.Z. and T.H.; Investigation, L.Y., K.C., F.R., W.C. and K.H.; Data curation, L.Y., K.C., F.R., W.C. and K.H.; Writing—original draft preparation, L.Y., K.C. and Y.Y.; Writing—review and editing, H.Z., T.H., F.R., W.C., K.H., F.Z., X.W. and Y.Y.; Visualization, L.Y., K.C. and T.H.; Supervision, F.Z., X.W. and Y.Y.; Project administration, X.W. and Y.Y.; Funding acquisition, L.Y. All authors have read and agreed to the published version of the manuscript.
Funding
This research was funded by Fujian Provincial Department of Science and Technology, Fujian Joint Fund Project for Scientific and Technological Innovation—Leading Project, grant number 2025Y96010112.
Institutional Review Board Statement
Not applicable.
Informed Consent Statement
Not applicable.
Data Availability Statement
The data presented in this study are available in the Gene Expression Omnibus at https://www.ncbi.nlm.nih.gov/geo/, accessed on 12 September 2026, accession numbers GSE181114, GSE213313 and GSE77343. These data were derived from the following resources available in the public domain: Gene Expression Omnibus (https://www.ncbi.nlm.nih.gov/geo/, accessed on 12 September 2026) and the Human Protein Atlas (https://www.proteinatlas.org/). Analysis code is available at https://github.com/Yizhou-Y/Supplementary-File_Code, accessed on 12 September 2026.
Acknowledgments
During the preparation of this manuscript, the authors used ChatGPT 6 (OpenAI), Claude Opus 5 (Anthropic), and Gemini 3.1 Pro (Google) for the purposes of language editing and assistance in improving the clarity and readability of the manuscript. The authors have reviewed and edited the output and take full responsibility for the content of this publication.
Conflicts of Interest
The authors declare no conflicts of interest.
Abbreviations
The following abbreviations are used in this manuscript:
| APC | antigen-presenting cell |
| BP | biological process |
| CC | cellular component |
| CDF | cumulative distribution function |
| CHF | chronic heart failure |
| CI | confidence interval |
| DEG | differentially expressed gene |
| GEO | Gene Expression Omnibus |
| GO | Gene Ontology |
| GSEA | Gene Set Enrichment Analysis |
| HLA | human leukocyte antigen |
| HPA | Human Protein Atlas |
| HR | hazard ratio |
| IDC | invasive ductal carcinoma |
| IHC | immunohistochemistry |
| ILC | invasive lobular carcinoma |
| IRS | immunoreactive score |
| KEGG | Kyoto Encyclopedia of Genes and Genomes |
| LASSO | least absolute shrinkage and selection operator |
| LUAD | lung adenocarcinoma |
| LUSC | lung squamous cell carcinoma |
| MCL | Markov cluster algorithm |
| MF | molecular function |
| MHC | major histocompatibility complex |
| MLR | monocyte to lymphocyte ratio |
| MSigDB | Molecular Signatures Database |
| NES | normalized enrichment score |
| NLR | neutrophil to lymphocyte ratio |
| OS | overall survival |
| PAM | partitioning around medoids |
| PCA | principal component analysis |
| PPI | protein–protein interaction |
| RF | random forest |
| ssGSEA | single-sample Gene Set Enrichment Analysis |
| SVM-RFE | support vector machine recursive feature elimination |
| WGCNA | weighted gene coexpression network analysis |
References
- Ambrosy, A.P.; Fonarow, G.C.; Butler, J.; Chioncel, O.; Greene, S.J.; Vaduganathan, M.; Nodari, S.; Lam, C.S.P.; Sato, N.; Shah, A.N.; et al. The global health and economic burden of hospitalizations for heart failure: Lessons learned from hospitalized heart failure registries. J. Am. Coll. Cardiol. 2014, 63, 1123–1133. [Google Scholar] [CrossRef] [Scilit]
- Savarese, G.; Becher, P.M.; Lund, L.H.; Seferovic, P.; Rosano, G.M.C.; Coats, A.J.S. Global burden of heart failure: A comprehensive and updated review of epidemiology. Cardiovasc. Res. 2023, 118, 3272–3287. [Google Scholar] [CrossRef] [Scilit]
- Murphy, S.P.; Kakkar, R.; McCarthy, C.P.; Januzzi, J.L., Jr. Inflammation in Heart Failure: JACC State-of-the-Art Review. J. Am. Coll. Cardiol. 2020, 75, 1324–1340. [Google Scholar] [CrossRef] [Scilit]
- Andreadou, I.; Ghigo, A.; Nikolaou, P.E.; Swirski, F.K.; Thackeray, J.T.; Heusch, G.; Vilahur, G. Immunometabolism in heart failure. Nat. Rev. Cardiol. 2025, 22, 751–772. [Google Scholar] [CrossRef] [Scilit]
- Chen, R.; Zhang, H.; Tang, B.; Luo, Y.; Yang, Y.; Zhong, X.; Chen, S.; Xu, X.; Huang, S.; Liu, C. Macrophages in cardiovascular diseases: Molecular mechanisms and therapeutic targets. Signal Transduct. Target. Ther. 2024, 9, 130. [Google Scholar] [CrossRef] [Scilit]
- Cappuzzello, C.; Napolitano, M.; Arcelli, D.; Melillo, G.; Melchionna, R.; Di Vito, L.; Carlini, D.; Silvestri, L.; Brugaletta, S.; Liuzzo, G.; et al. Gene expression profiles in peripheral blood mononuclear cells of chronic heart failure patients. Physiol. Genom. 2009, 38, 233–240. [Google Scholar] [CrossRef] [Scilit]
- Screever, E.M.; Yousif, L.I.E.; Moslehi, J.J.; Salem, J.E.; Voors, A.A.; Sillje, H.H.W.; de Boer, R.A.; Meijers, W.C. Circulating immune checkpoints predict heart failure outcomes. ESC. Heart Fail. 2023, 10, 2330–2337. [Google Scholar] [CrossRef] [Scilit]
- Fridman, W.H.; Zitvogel, L.; Sautès–Fridman, C.; Kroemer, G. The immune contexture in cancer prognosis and treatment. Nat. Rev. Clin. Oncol. 2017, 14, 717–734. [Google Scholar] [CrossRef] [Scilit]
- Binnewies, M.; Roberts, E.W.; Kersten, K.; Chan, V.; Fearon, D.F.; Merad, M.; Coussens, L.M.; Gabrilovich, D.I.; Ostrand-Rosenberg, S.; Hedrick, C.C.; et al. Understanding the tumor immune microenvironment (TIME) for effective therapy. Nat. Med. 2018, 24, 541–550. [Google Scholar] [CrossRef] [Scilit]
- Ahmad, T.; Pencina, M.J.; Schulte, P.J.; O’Brien, E.; Whellan, D.J.; Pina, I.L.; Kitzman, D.W.; Lee, K.L.; O’Connor, C.M.; Felker, G.M. Clinical implications of chronic heart failure phenotypes defined by cluster analysis. J. Am. Coll. Cardiol. 2014, 64, 1765–1774. [Google Scholar] [CrossRef] [Scilit]
- Shah, S.J.; Katz, D.H.; Selvaraj, S.; Burke, M.A.; Yancy, C.W.; Gheorghiade, M.; Bonow, R.O.; Huang, C.C.; Deo, R.C. Phenomapping for novel classification of heart failure with preserved ejection fraction. Circulation 2015, 131, 269–279. [Google Scholar] [CrossRef] [Scilit]
- Siegel, R.L.; Miller, K.D.; Wagle, N.S.; Jemal, A. Cancer statistics, 2023. CA Cancer J. Clin. 2023, 73, 17–48. [Google Scholar] [CrossRef] [Scilit]
- Herrmann, J.; Lenihan, D.; Armenian, S.; Barac, A.; Blaes, A.; Cardinale, D.; Carver, J.; Dent, S.; Ky, B.; Lyon, A.R.; et al. Defining cardiovascular toxicities of cancer therapies: An International Cardio-Oncology Society (IC-OS) consensus statement. Eur. Heart J. 2022, 43, 280–299. [Google Scholar] [CrossRef] [Scilit]
- Lyon, A.R.; Lopez-Fernandez, T.; Couch, L.S.; Asteggiano, R.; Aznar, M.C.; Bergler-Klein, J.; Boriani, G.; Cardinale, D.; Cordoba, R.; Cosyns, B.; et al. 2022 ESC Guidelines on cardio-oncology developed in collaboration with the European Hematology Association (EHA), the European Society for Therapeutic Radiology and Oncology (ESTRO) and the International Cardio-Oncology Society (IC-OS). Eur. Heart J. 2022, 43, 4229–4361. [Google Scholar] [CrossRef] [Scilit]
- Bloom, M.W.; Vo, J.B.; Rodgers, J.E.; Ferrari, A.M.; Nohria, A.; Deswal, A.; Cheng, R.K.; Kittleson, M.M.; Upshaw, J.N.; Palaskas, N.; et al. Cardio-Oncology and Heart Failure: A Scientific Statement From the Heart Failure Society of America. J. Card. Fail. 2025, 31, 415–455. [Google Scholar] [CrossRef] [Scilit]
- Aboumsallem, J.P.; Moslehi, J.; de Boer, R.A. Reverse Cardio-Oncology: Cancer Development in Patients With Cardiovascular Disease. J. Am. Heart Assoc. 2020, 9, e013754. [Google Scholar] [CrossRef] [Scilit]
- Nath, M.; Romaine, S.P.R.; Koekemoer, A.; Hamby, S.; Webb, T.R.; Nelson, C.P.; Castellanos-Uribe, M.; Papakonstantinou, M.; Anker, S.D.; Lang, C.C.; et al. Whole blood transcriptomic profiling identifies molecular pathways related to cardiovascular mortality in heart failure. Eur. J. Heart Fail. 2022, 24, 1009–1019. [Google Scholar] [CrossRef] [Scilit]
- Prebensen, C.; Lefol, Y.; Myhre, P.L.; Luders, T.; Jonassen, C.; Blomfeldt, A.; Omland, T.; Nilsen, H.; Berdal, J.E. Longitudinal whole blood transcriptomic analysis characterizes neutrophil activation and interferon signaling in moderate and severe COVID-19. Sci. Rep. 2023, 13, 10368. [Google Scholar] [CrossRef] [Scilit]
- Shannon, C.P.; Balshaw, R.; Chen, V.; Hollander, Z.; Toma, M.; McManus, B.M.; FitzGerald, J.M.; Sin, D.D.; Ng, R.T.; Tebbutt, S.J. Enumerateblood—An R package to estimate the cellular composition of whole blood from Affymetrix Gene ST gene expression profiles. BMC Genom. 2017, 18, 43. [Google Scholar] [CrossRef] [Scilit]
- Remmele, W.; Stegner, H.E. Recommendation for uniform definition of an immunoreactive score (IRS) for immunohistochemical estrogen receptor detection (ER-ICA) in breast cancer tissue. Pathologe 1987, 8, 138–140. [Google Scholar]
- Ommen, S.R.; Hodge, D.O.; Rodeheffer, R.J.; McGregor, C.G.; Thomson, S.P.; Gibbons, R.J. Predictive power of the relative lymphocyte concentration in patients with advanced heart failure. Circulation 1998, 97, 19–22. [Google Scholar] [CrossRef] [Scilit]
- Adamstein, N.H.; MacFadyen, J.G.; Rose, L.M.; Glynn, R.J.; Dey, A.K.; Libby, P.; Tabas, I.A.; Mehta, N.N.; Ridker, P.M. The neutrophil-lymphocyte ratio and incident atherosclerotic events: Analyses from five contemporary randomized trials. Eur. Heart J. 2021, 42, 896–903. [Google Scholar] [CrossRef] [Scilit]
- Rezig, A.O.M.; Morsy, M.I.; Caiazzo, E.; Iaconelli, A.; Ialenti, A.; Hunter, D.; Cuthbert, J.J.; Kazmi, S.; Guzik, T.J.; Bruzzese, D.; et al. Neutrophil-to-lymphocyte ratio: Link to congestion, inflammation, and mortality in outpatients with heart failure. ESC. Heart Fail. 2025, 12, 1571–1582. [Google Scholar] [CrossRef] [Scilit]
- Ruder, A.V.; Wetzels, S.M.W.; Temmerman, L.; Biessen, E.A.L.; Goossens, P. Monocyte heterogeneity in cardiovascular disease. Cardiovasc. Res. 2023, 119, 2033–2045. [Google Scholar] [CrossRef] [Scilit]
- Uijl, A.; Savarese, G.; Vaartjes, I.; Dahlstrom, U.; Brugts, J.J.; Linssen, G.C.M.; van Empel, V.; Brunner-La Rocca, H.P.; Asselbergs, F.W.; Lund, L.H.; et al. Identification of distinct phenotypic clusters in heart failure with preserved ejection fraction. Eur. J. Heart Fail. 2021, 23, 973–982. [Google Scholar] [CrossRef] [Scilit]
- Cohen, J.B.; Schrauben, S.J.; Zhao, L.; Basso, M.D.; Cvijic, M.E.; Li, Z.; Yarde, M.; Wang, Z.; Bhattacharya, P.T.; Chirinos, D.A.; et al. Clinical Phenogroups in Heart Failure With Preserved Ejection Fraction: Detailed Phenotypes, Prognosis, and Response to Spironolactone. JACC Heart Fail. 2020, 8, 172–184. [Google Scholar] [CrossRef] [Scilit]
- Peters, A.E.; Tromp, J.; Shah, S.J.; Lam, C.S.P.; Lewis, G.D.; Borlaug, B.A.; Sharma, K.; Pandey, A.; Sweitzer, N.K.; Kitzman, D.W.; et al. Phenomapping in heart failure with preserved ejection fraction: Insights, limitations, and future directions. Cardiovasc. Res. 2023, 118, 3403–3415. [Google Scholar] [CrossRef] [Scilit]
- Koenig, A.L.; Shchukina, I.; Amrute, J.; Andhey, P.S.; Zaitsev, K.; Lai, L.; Bajpai, G.; Bredemeyer, A.; Smith, G.; Jones, C.; et al. Single-cell transcriptomics reveals cell-type-specific diversification in human heart failure. Nat. Cardiovasc. Res. 2022, 1, 263–280. [Google Scholar] [CrossRef] [Scilit]
- Kuppe, C.; Ramirez Flores, R.O.; Li, Z.; Hayat, S.; Levinson, R.T.; Liao, X.; Hannani, M.T.; Tanevski, J.; Wünnemann, F.; Nagai, J.S.; et al. Spatial multi-omic map of human myocardial infarction. Nature 2022, 608, 766–777. [Google Scholar] [CrossRef] [Scilit]
- Lee, S.E.; Joo, J.H.; Hwang, H.S.; Chen, S.F.; Evans, D.; Lee, K.Y.; Kim, K.H.; Hyun, J.; Kim, M.S.; Jung, S.H.; et al. Spatial transcriptional landscape of human heart failure. Eur. Heart J. 2025, 46, 3098–3114. [Google Scholar] [CrossRef] [Scilit]
- Ballouz, S.; Pavlidis, P.; Gillis, J. Using predictive specificity to determine when gene set analysis is biologically meaningful. Nucleic Acids Res. 2017, 45, e20. [Google Scholar] [CrossRef] [Scilit]
- Crow, M.; Lim, N.; Ballouz, S.; Pavlidis, P.; Gillis, J. Predictability of human differential gene expression. Proc. Natl. Acad. Sci. USA 2019, 116, 6491–6500. [Google Scholar] [CrossRef] [Scilit]
- Whitney, A.R.; Diehn, M.; Popper, S.J.; Alizadeh, A.A.; Boldrick, J.C.; Relman, D.A.; Brown, P.O. Individuality and variation in gene expression patterns in human blood. Proc. Natl. Acad. Sci. USA 2003, 100, 1896–1901. [Google Scholar] [CrossRef] [Scilit]
- O’Connell, G.C.; Treadway, M.B.; Tennant, C.S.; Lucke-Wold, N.; Chantler, P.D.; Barr, T.L. Shifts in Leukocyte Counts Drive the Differential Expression of Transcriptional Stroke Biomarkers in Whole Blood. Transl. Stroke Res. 2019, 10, 26–35. [Google Scholar] [CrossRef] [Scilit]
- Brodin, P.; Davis, M.M. Human immune system variation. Nat. Rev. Immunol. 2017, 17, 21–29. [Google Scholar] [CrossRef] [Scilit]
- Schulte-Schrepping, J.; Reusch, N.; Paclik, D.; Bassler, K.; Schlickeiser, S.; Zhang, B.; Kramer, B.; Krammer, T.; Brumhard, S.; Bonaguro, L.; et al. Severe COVID-19 Is Marked by a Dysregulated Myeloid Cell Compartment. Cell 2020, 182, 1419–1440 e1423. [Google Scholar] [CrossRef] [Scilit]
- Galon, J.; Bruni, D. Approaches to treat immune hot, altered and cold tumours with combination immunotherapies. Nat. Rev. Drug Discov. 2019, 18, 197–218. [Google Scholar] [CrossRef] [Scilit]
- Galluzzi, L.; Vitale, I.; Aaronson, S.A.; Abrams, J.M.; Adam, D.; Agostinis, P.; Alnemri, E.S.; Altucci, L.; Amelio, I.; Andrews, D.W.; et al. Molecular mechanisms of cell death: Recommendations of the Nomenclature Committee on Cell Death 2018. Cell Death Differ. 2018, 25, 486–541. [Google Scholar] [CrossRef] [Scilit]
- Gillis, J.; Pavlidis, P. “Guilt by association” is the exception rather than the rule in gene networks. PLoS Comput. Biol. 2012, 8, e1002444. [Google Scholar] [CrossRef] [Scilit]
- Shi, J.; Zhao, Y.; Wang, Y.; Gao, W.; Ding, J.; Li, P.; Hu, L.; Shao, F. Inflammatory caspases are innate immune receptors for intracellular LPS. Nature 2014, 514, 187–192. [Google Scholar] [CrossRef] [Scilit]
- Shi, J.; Zhao, Y.; Wang, K.; Shi, X.; Wang, Y.; Huang, H.; Zhuang, Y.; Cai, T.; Wang, F.; Shao, F. Cleavage of GSDMD by inflammatory caspases determines pyroptotic cell death. Nature 2015, 526, 660–665. [Google Scholar] [CrossRef] [Scilit]
- van Raam, B.J.; Ehrnhoefer, D.E.; Hayden, M.R.; Salvesen, G.S. Intrinsic cleavage of receptor-interacting protein kinase-1 by caspase-6. Cell Death Differ. 2012, 20, 86–96. [Google Scholar] [CrossRef] [Scilit]
- Beltran-Visiedo, M.; Soler-Agesta, R.; Sarosiek, K.A.; Green, D.R.; Galluzzi, L. Regulation of inflammatory processes by caspases. Nat. Rev. Mol. Cell Biol. 2025, 26, 884–901. [Google Scholar] [CrossRef] [Scilit]
- Peters, R.; Leyvraz, S.; Perey, L. Apoptotic Regulation in Primitive Hematopoietic Precursors. Blood 1998, 92, 2041–2052. [Google Scholar] [CrossRef] [Scilit]
- Solier, S.; Fontenay, M.; Vainchenker, W.; Droin, N.; Solary, E. Non-apoptotic functions of caspases in myeloid cell differentiation. Cell Death Differ. 2017, 24, 1337–1347. [Google Scholar] [CrossRef] [Scilit]
- Zhang, B.; Mao, S.; Liu, X.; Li, S.; Zhou, H.; Gu, Y.; Liu, W.; Fu, L.; Liao, C.; Wang, P. MiR-125b inhibits cardiomyocyte apoptosis by targeting BAK1 in heart failure. Mol. Med. 2021, 27, 72. [Google Scholar] [CrossRef] [Scilit]
- Xiao, Z.; Wei, X.; Li, M.; Yang, K.; Chen, R.; Su, Y.; Yu, Z.; Liang, Y.; Ge, J. Myeloid-specific deletion of Capns1 attenuates myocardial infarction injury via restoring mitochondrial function and inhibiting inflammasome activation. J. Mol. Cell. Cardiol. 2023, 183, 54–66. [Google Scholar] [CrossRef] [Scilit]
- Fabiani, I.; Chianca, M.; Cipolla, C.M.; Cardinale, D.M. Anthracycline-induced cardiomyopathy: Risk prediction, prevention and treatment. Nat. Rev. Cardiol. 2025, 22, 551–563. [Google Scholar] [CrossRef] [Scilit]
- Cancer Genome Atlas Research, N. Comprehensive genomic characterization of squamous cell lung cancers. Nature 2012, 489, 519–525. [Google Scholar] [CrossRef] [Scilit]
- Cancer Genome Atlas Research, N. Comprehensive molecular profiling of lung adenocarcinoma. Nature 2014, 511, 543–550. [Google Scholar] [CrossRef] [Scilit]
- Ciriello, G.; Gatza, M.L.; Beck, A.H.; Wilkerson, M.D.; Rhie, S.K.; Pastore, A.; Zhang, H.; McLellan, M.; Yau, C.; Kandoth, C.; et al. Comprehensive Molecular Portraits of Invasive Lobular Breast Cancer. Cell 2015, 163, 506–519. [Google Scholar] [CrossRef] [Scilit]
- Uhlen, M.; Zhang, C.; Lee, S.; Sjostedt, E.; Fagerberg, L.; Bidkhori, G.; Benfeitas, R.; Arif, M.; Liu, Z.; Edfors, F.; et al. A pathology atlas of the human cancer transcriptome. Science 2017, 357, eaan2507. [Google Scholar] [CrossRef] [Scilit]
- Huang, Y.; Liu, D.; Chen, B.; Zeng, J.; Wang, L.; Zhang, S.; Mo, X.; Li, W. Loss of Bad expression confers poor prognosis in non-small cell lung cancer. Med. Oncol. 2012, 29, 1648–1655. [Google Scholar] [CrossRef] [Scilit]
- Boac, B.M.; Abbasi, F.; Ismail-Khan, R.; Xiong, Y.; Siddique, A.; Park, H.; Han, M.; Saeed-Vafa, D.; Soliman, H.; Henry, B.; et al. Expression of the BAD pathway is a marker of triple-negative status and poor outcome. Sci. Rep. 2019, 9, 17496. [Google Scholar] [CrossRef] [Scilit]
- Harper, D.; Min, J.Y.; MacLeod, J.A.; Cockburn, S.; Predko, I.; Gao, Y.; Greer, P.A.; Shapovalov, I. Calpain-1 and Calpain-2 Promote Breast Cancer Metastasis. Cells 2025, 14, 1314. [Google Scholar] [CrossRef] [Scilit]
- Meijers, W.C.; Aboumsallem, J.P.; Lyon, A.R.; Moslehi, J.; de Boer, R.A. Forward and reverse cardio-oncology. Physiol. Rev. 2026, 106, 587–644. [Google Scholar] [CrossRef] [Scilit]
Disclaimer/Publisher’s Note: The statements, opinions and data contained in all publications are solely those of the individual author(s) and contributor(s) and not of MDPI and/or the editor(s). MDPI and/or the editor(s) disclaim responsibility for any injury to people or property resulting from any ideas, methods, instructions or products referred to in the content. |
© 2026 by the authors. Licensee MDPI, Basel, Switzerland. This article is an open access article distributed under the terms and conditions of the Creative Commons Attribution (CC BY) license.