


Abstract
Objectives: Alzheimer’s disease and related dementias (ADRD) impose substantial clinical and public health burdens, while treatment options remain limited. We developed a novel mechanism-agnostic Medication-Wide Association Study (MWAS) approach to identify medications associated with ADRD using longitudinal electronic health records and explainable artificial intelligence (AI). Methods: Veterans Health Administration data from 1999–2022 were used to assemble 505,817 matched case–control pairs (1,011,634 Veterans). Cases were defined by ADRD-related diagnosis codes or ADRD-related medication prescriptions, and controls were free of ADRD diagnosis and ADRD-related medication use. Historical features were aggregated into annual intervals ending 1 year before the index date. An upgraded Hybrid Value-Aware Transformer (HVAT 2.0) jointly modeled longitudinal and nonlongitudinal data, including cumulative medication dose. To enhance interpretability, we applied a medication-specific impact score method to estimate model-derived associations between medication exposure and ADRD risk. Results: The model demonstrated stable performance across data partitions, with area under the receiver operating characteristic curve values of 0.791 in the training set, 0.772 in the validation set, and 0.775 in the testing set. Metolazone and varenicline had the most negative population-level impact scores: −0.196 per 1800 mg and −0.134 per 280 mg cumulative dose unit, respectively, suggesting potentially protective associations with new-onset ADRD. Although individual-level impact scores varied, most exposed patients had negative scores, including 12,020 of 12,480 metolazone users (96%) and 8341 of 8786 varenicline users (95%). Conclusions: MWAS combining dose-aware longitudinal modeling and explainable AI can generate medication-repurposing signals from population-scale real-world data. The hypotheses generated require further epidemiologic and clinical validation.
1. Introduction
Alzheimer’s disease (AD) is a leading cause of death and disability, affecting millions of individuals in the United States and worldwide [1,2,3,4,5,6,7,8,9,10,11]. As the population ages, the number of adults aged 65 years or older living with AD is projected to increase from 6.7 million in 2023 to 13.8 million by 2060. The economic burden is substantial, with estimated annual costs of $345 billion for health care, long-term care, and hospice services in 2023, plus an additional $339.5 billion in unpaid caregiving [1]. Despite this growing burden, treatment options remain limited.
Clinically, AD is often indistinguishable from AD and Related Dementias (ADRD) [2], a broader category which includes related dementias such as vascular dementia, which share overlapping risk factors and overlapping symptoms, especially in the later stages. Biomarkers for in vivo biological confirmation have only recently started to be adopted; even then, not adequately; even then, not adequately, and their performance is not yet optimized. Management of ADRD includes both risk reduction and treatment. Risk reduction focuses on adopting health promotion and morbidity prevention methods, as outlined by the Lancet Commission [3], whereas treatment consists primarily of symptomatic therapy and, for biologically confirmed AD, disease-modifying therapy. No available therapy can reverse or definitively halt disease progression. Although novel pharmacologic therapies have emerged for the treatment of ADRD, their clinical benefits remain modest [4,5,12].
Traditional drug discovery and clinical development require years of preclinical and clinical testing. These challenges have increased interest in repurposing existing drugs for ADRD. Several agents, including statins [6], antihypertensives [7], nonsteroidal anti-inflammatory drugs (NSAIDs) [8], pioglitazone [9], and glucagon-like peptide-1 (GLP-1) agonists [10], have been investigated in ADRD, with observational studies suggesting possible associations with reduced dementia risk. Many prior repurposing efforts have leveraged existing biological knowledge, including targeting amyloid-β aggregation, tau phosphorylation, neuroinflammation, metabolic dysfunction, and vascular pathways. However, randomized trials for repurposed drugs have largely yielded negative or inconclusive results, potentially due to the heterogeneity of ADRD pathology [13,14,15,16,17]. To date, no repurposed agent has demonstrated definitive disease risk-modifying efficacy in ADRD.
In contrast, rather than using prior biological knowledge, we used a data-driven, mechanism-agnostic approach within a broader initiative utilizing a paradigm called the Medication-Wide Association Study (MWAS) approach [18]. Hypotheses generated during the MWAS phase will be subsequently tested and validated.
2. Materials and Methods
This study included cohort assembly, feature extraction, AI model development, and model explanation for candidate drug identification. We used a large national electronic health record (EHR) dataset from the Veterans Health Administration (VHA), comprising more than 20 years of longitudinal clinical data. This resource enables evaluation not only of drug initiation, but also of cumulative exposure and its relationship to clinical outcomes. This study was approved by the Institutional Ethics Committee of the Washington DC Veterans Affairs Medical Center (Approval Code: 1673360; Approval Date: 25 February 2022).
The AI model used an upgraded design of the original Transformer-based architecture called the Hybrid Value-Aware Transformer (HVAT) [19]. The Transformer architecture has become a leading deep neural network (DNN) architecture for learning from sequence data, revolutionizing the field of natural language processing and being the foundational technology for most of today’s large language models, including GPT [20], Gemini [21], and Llama [22]. This success has motivated researchers to explore its application in healthcare. Despite the similarities between longitudinal clinical data and natural language data, clinical data presents unique complexities that make adapting the Transformer architecture to this domain challenging, including heterogeneous modalities, irregular temporal structure, and associated numerical values. To address the complexities, we designed HVAT, which can jointly learn from longitudinal and non-longitudinal clinical data and specifically leverage numerical values (e.g., lab values) associated with clinical codes/concepts (e.g., lab tests) from the longitudinal data. For this study, we had to upgrade the original HVAT design to correctly utilize the cumulative dose values associated with medications. The upgraded version is referred to as HVAT 2.0.
The machine learning models capture nonlinear relationships and accommodate a high-dimensional covariate space. However, such models, particularly DNNs, are often criticized as “black boxes” due to their complexity and large number of parameters. To enhance interpretability, we applied the impact score assessment, a novel explainable AI (XAI) method developed by our team, to support robust identification of potential drug candidates [23]. We focused on medication-specific impact scores for ADRD risk (i.e., those medications with the strongest potentially protective or risk-conferring associations). Because the model incorporated cumulative medication dose, the XAI method also enabled estimation of dose–response patterns for included medications.
2.1. Data Source, Study Design, and Cohort Assembly
The primary data source for this analysis is the VHA Corporate Data Warehouse (CDW). A case–control study design was used, with patients with ADRD as cases and those without ADRD as controls. The initial study population comprised 8,424,715 Veterans aged 65 years or older from January 1999 to May 2022. Cases were patients identified as having ADRD indications, which are defined as either ADRD-related diagnosis codes (Table S1) or ADRD-related medication prescriptions (Table S2). Patients with early-onset dementia, defined as those younger than 65 years at the time of first ADRD indication, were excluded because of potential differences in disease etiology and clinical presentation. To improve case ascertainment, patients were also required to have at least 2 distinct ADRD-related encounters.
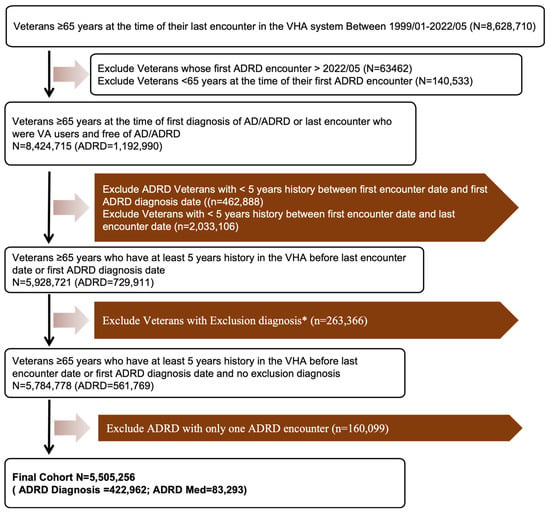
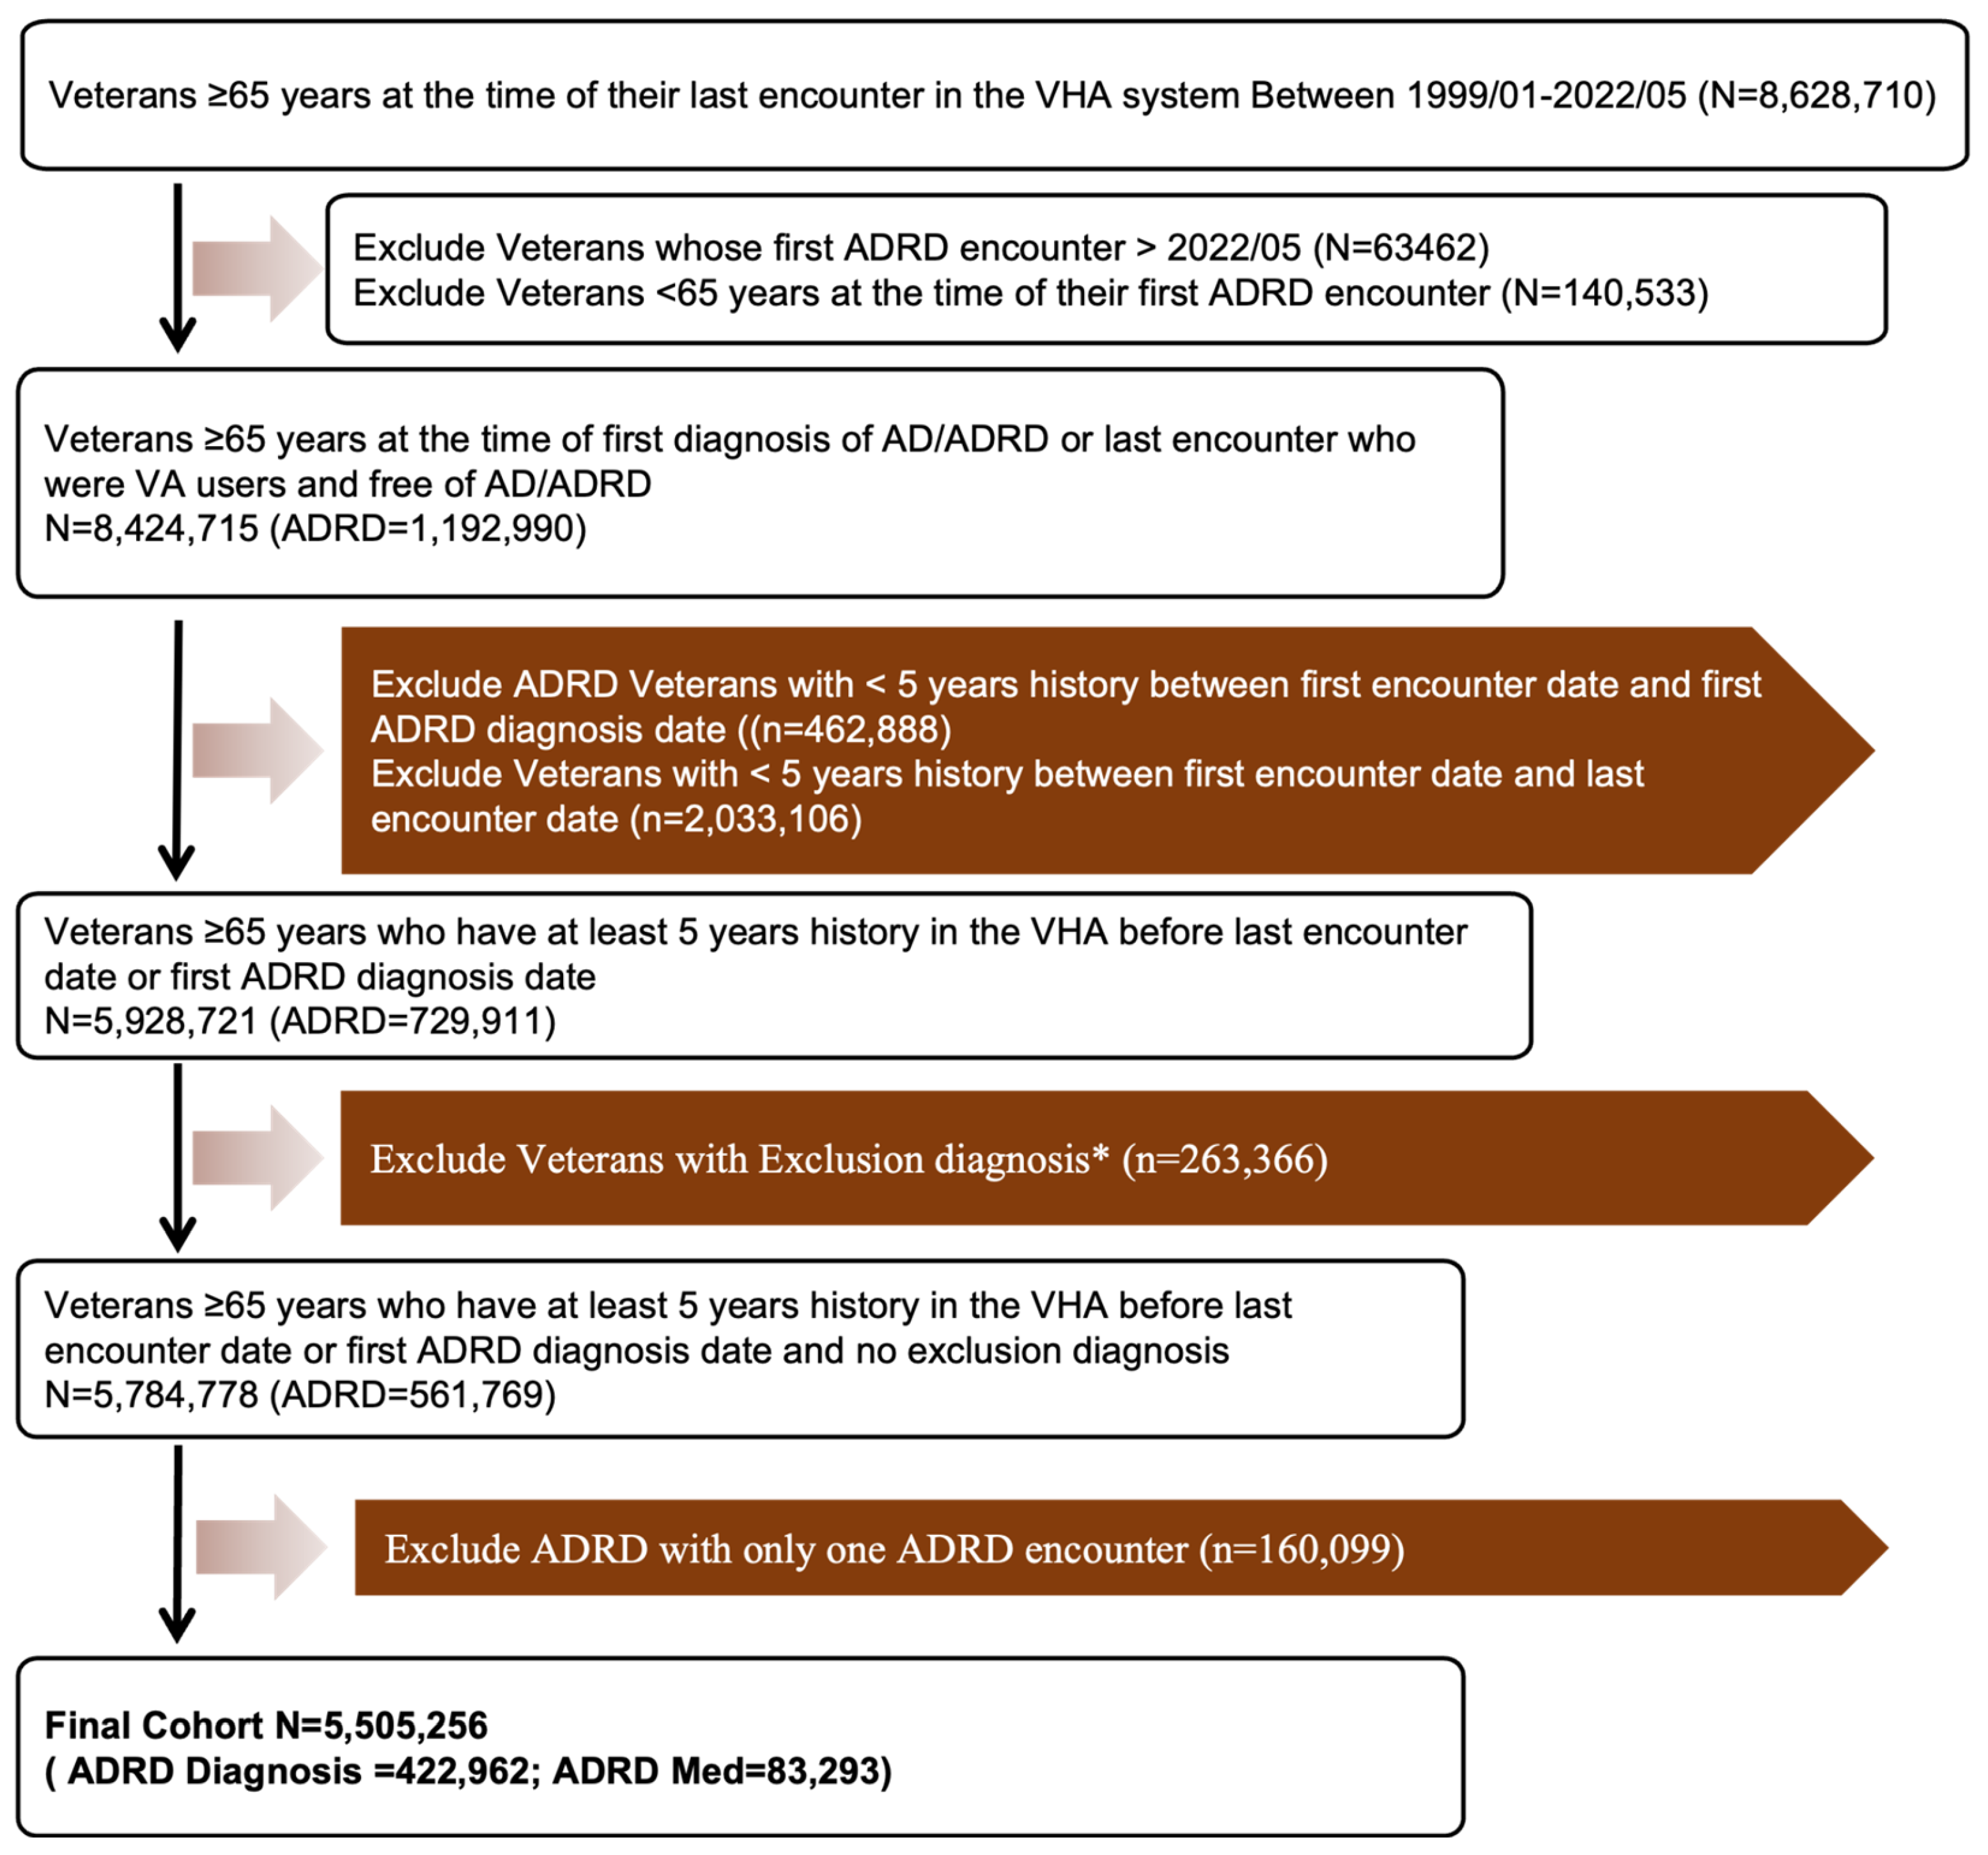
Controls were defined as patients with no ADRD indication by the time of their last VA visit or as of May 2022. For both cases and controls, patients with fewer than 5 years of medical records were excluded. For cases, we required at least 5 years of records before the first ADRD indication. Patients with diagnoses resembling, but distinct from, ADRD, such as senile delusion, were also excluded. The International Classification of Diseases (ICD) codes used for these exclusions are listed in Table S1. After these exclusions, 5,505,256 eligible Veterans remained, including 422,962 first identified through ADRD diagnosis and 83,293 first identified through ADRD medication use (Figure 1).
Figure 1.
Study cohort assembly. The flow diagram summarizes eligibility criteria and exclusions through the eligible pre-matching cohort. Subsequent 1:1 matching yielded 505,817 case–control pairs (1,011,634 Veterans). * Veterans with diagnoses resembling but distinct from ADRD (e.g., senile delusion) were excluded. Relevant ICD-9-CM and ICD-10-CM codes are listed in Supplementary Table S1.
Controls were then matched to cases on sex, race, age at first encounter in CDW, and the first encounter within 6 months to ensure comparable demographic characteristics and timing of entry into the health system. The index date for each matched pair was defined as the date of the case’s first ADRD indication. Controls were required to have at least 12 months of ADRD-free follow-up after the index date within the electronic health record system to confirm the absence of ADRD at the index date. A total of 505,817 matched case–control pairs were identified for analysis, representing 1,011,634 Veterans in the primary analytic cohort.
2.2. Feature Extraction
For each individual, features were extracted from all available historical data up to 1 year before the index date. Data from the year immediately preceding the index date were excluded to avoid capturing prodromal or early manifestations of ADRD, including changes in symptoms, clinical evaluation, or treatment patterns that may precede formal diagnosis. Including this period could bias the model toward short-term predictors of near-term diagnosis rather than longer-term associations with medication exposure.
The observation period was divided into 1-year-long intervals, and features were aggregated within each interval to construct a temporally ordered sequence. Natural numbers 1, 2, 3, … were used to order the 1-year-long intervals backwards from the latest to the earliest. These numbers were referred to as temporal indexes.
Medication histories were obtained from the outpatient pharmacy domain of the VA CDW. We included oral medications used by more than 1% of individuals in the analytic cohort before the index date. We also included insulin, which was categorized as rapid-acting, short-acting, intermediate-acting, long-acting, or combination formulations. Compound medications were separated into individual active ingredients, yielding 243 unique ingredients. Dose strengths were normalized to a common unit for each medication. Medications without strength information were excluded during data cleaning. Prescriptions were assigned to yearly exposure intervals based on dispensing dates.
Other clinical data, including diagnoses, procedures, and note titles, were also aggregated into 1-year intervals. For diagnosis features, ICD-9-CM codes were first mapped to ICD-10-CM codes using the Centers for Medicare & Medicaid Services General Equivalence Mappings, after which codes were grouped into 203 ICD-10-CM code blocks. All model features are listed in Table S3.
Additional details on feature extraction and definitions are provided in Appendix A.
2.3. AI Modeling
2.3.1. HVAT 2.0
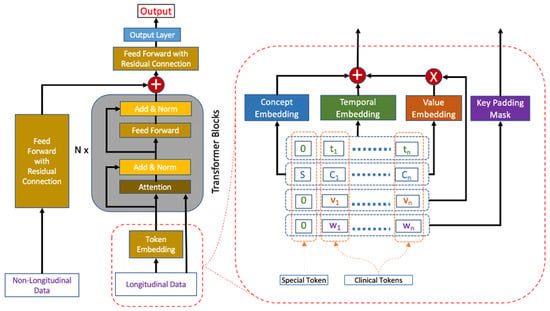
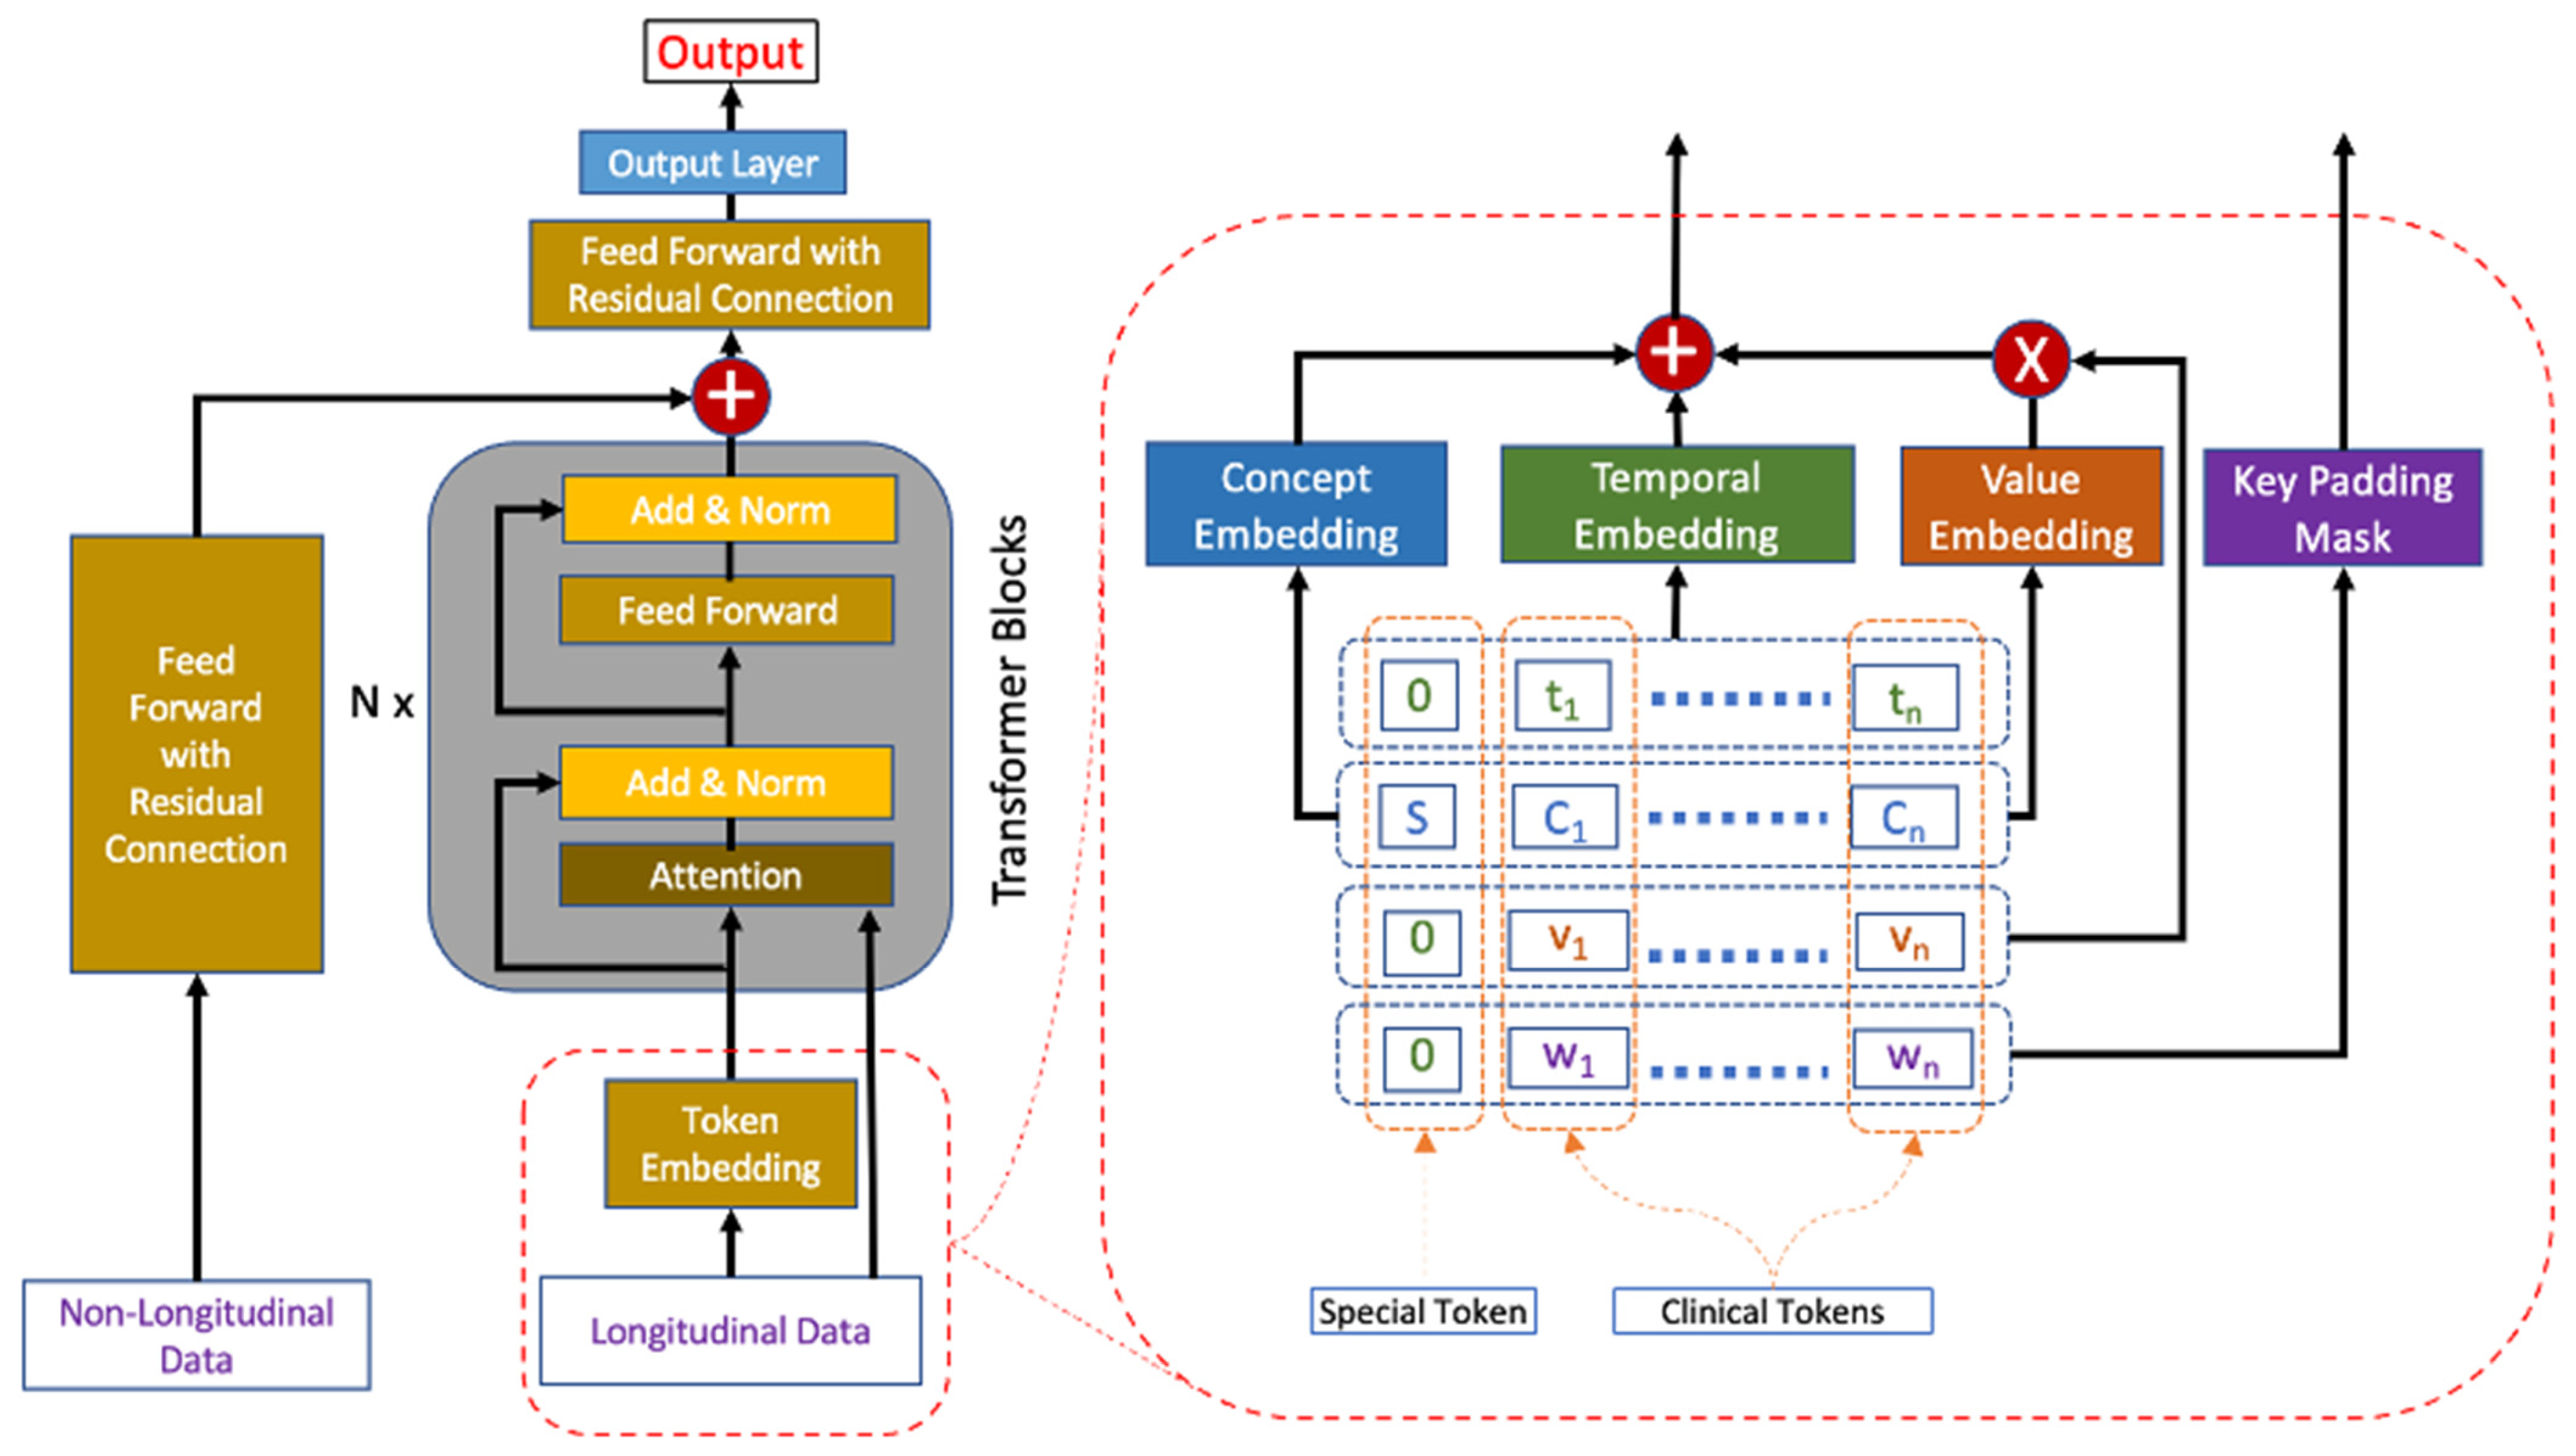
The HVAT 2.0 architecture was an upgrade from the original design and the method of preprocessing the longitudinal data for the HVAT model was also modified from the original design accordingly (Figure 2) [19]. This upgrade was necessary because we realized there were two types of numerical values in the longitudinal data, while the original HVAT was only suitable to handle the first type.
Figure 2.
Hybrid Value-Aware Transformer (HVAT) 2.0 architecture. The left panel shows the full architecture. The red dashed box on the right enlarges the token-embedding component shown in the smaller red dashed box on the left. The two arrows extending from the enlarged box correspond to the two connections from the token-embedding component to the Transformer blocks.
Longitudinal Data Representation
Longitudinal clinical data were represented as data elements containing a patient ID, timestamp, clinical concept, and, when applicable, a numerical value. Numerical values were categorized into two types: those representing a patient’s internal physiologic state (e.g., laboratory results and vital signs) and those representing external interventions or health utilization (e.g., cumulative medication dose, visit count, and length of stay). Each patient’s longitudinal history was divided into equal-length time intervals, and repeated data elements within each interval were aggregated into a single feature, with numerical values aggregated according to their type (Table 1).
Table 1.
Numerical value types and their treatment in HVAT 2.0.
Numerical values were processed differently according to their type. Values representing physiologic states (e.g., laboratory results) were standardized for each clinical concept, whereas values representing interventions or utilization (e.g., medication doses and diagnosis counts) were normalized using the 95th or 99th percentile, log-transformed, and incorporated into the HVAT key padding mask (KPM), allowing smaller values to approach the effect of no intervention. Each clinical token was represented as (t, C, v, w), consisting of a temporal index t, a clinical concept C, and two numerical value fields v and w. The model included 1256 unique clinical concepts: 400 procedures, 400 note titles, 10 laboratory tests, 243 medications, and 203 diagnosis code blocks, along with 10 nonlongitudinal variables representing age, sex, race, and ethnicity.
Additional details on HVAT data representation are provided in Appendix B.
HVAT Architecture and Model Training
The HVAT model consisted of 2 Transformer blocks with an embedding dimension of 48. For each patient, the model generated a single output value, p, ranging from 0 to 1 and representing the predicted probability of case status. The model took as input a sequence of clinical tokens containing values v and w. The values v were incorporated through the value embedding defined in the original HVAT framework, whereas the values w were incorporated as key padding mask (KPM) inputs (Figure 2).
The cohort was divided into 3 subsets: training (80%), validation (10%), and testing (10%). Model performance was evaluated using the area under the receiver operating characteristic curve (AUC). Training was performed using minibatches of 50 patients and the Adam optimizer with a learning rate of 0.0001. After each epoch, AUC was evaluated on the validation set and model weights were saved. Training was stopped when validation AUC failed to improve for 10 consecutive epochs. The model weights corresponding to the best validation AUC were then reloaded to define the final trained model, which was subsequently evaluated on the testing set to obtain the final AUC.
2.3.2. AI Explanation
To interpret the HVAT model, we calculated medication-specific impact scores, first at the individual level (i.e., for each Veteran), and then at the population level. For each medication and for each patient who had been on this medication, the individual-level impact score on the patient was defined as follows:
where was the log odds, x was the sum of all the normalized cumulative dose values on the patient for this medication over all the temporal indices, p was the model output value with the patient’s data as the input, and p0 was the model output with all the tokens having this medication as the concept deleted from the patient’s longitudinal data (i.e., p0 was the model output with the same input data except the total cumulative dose of this medication for this patient was decreased to zero). Note that the individual-level impact score is not defined for patients who had never been on the medication. The population-level impact score was just the mean of the individual-level impact scores for each medication.
We normalized the values in the denominator to make the impact scores of different medications comparable. Recall that the cumulative dose values were normalized using the 95th percentile of the cumulative doses over all the year-long intervals across the entire cohort was used for normalization. This normalization also made the impact scores of different medications comparable to each other. Under this normalization, one unit is exactly the 95th percentile. The impact score can be interpreted as the average change in log-odds of ADRD for each one-unit increase in the normalized total cumulative dose of the medication.
Then we ranked the medications based on the (population-level) impact scores. Medications with the most negative impact scores were prioritized as candidates for further evaluation for ADRD prevention.
3. Results
3.1. Cohort Assembly
The analytic cohort consisted of 1,011,634 Veterans, including 505,817 case–control pairs matched for age, sex, race, and time of first encounter in the healthcare system (Table 2). The mean (SD) age at index was 80.3 (7.5) years. The cohort was predominantly male (990,952 [98.0%]) and White (763,952 [75.5%]), with 108,880 participants (10.8%) Black or African American. Ethnicity was Hispanic or Latino in 37,668 participants (3.7%) and not Hispanic or Latino in 881,295 (87.1%); ethnicity was unknown for 92,671 participants (9.2%).
Table 2.
Demographic characteristics of cases and controls at the index date.
3.2. Model Performance and Candidate Medication Identification
The final analytic sample included 1.01 million individuals. Model performance was stable across data partitions, with an area under the receiver operating characteristic curve of 0.791 in the training set, 0.772 in the validation set, and 0.775 in the testing set.
Model explanation identified metolazone and varenicline as the top 2 candidate medications with negative impact scores, suggesting potentially protective associations with ADRD outcomes. The impact score was −0.196 per unit (1800 mg) of cumulative dose for metolazone and −0.134 per unit (280 mg) for varenicline.
3.3. Patient-Level Impact Analysis for Metolazone and Varenicline
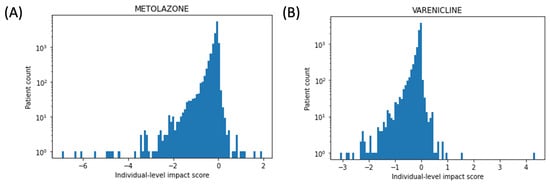
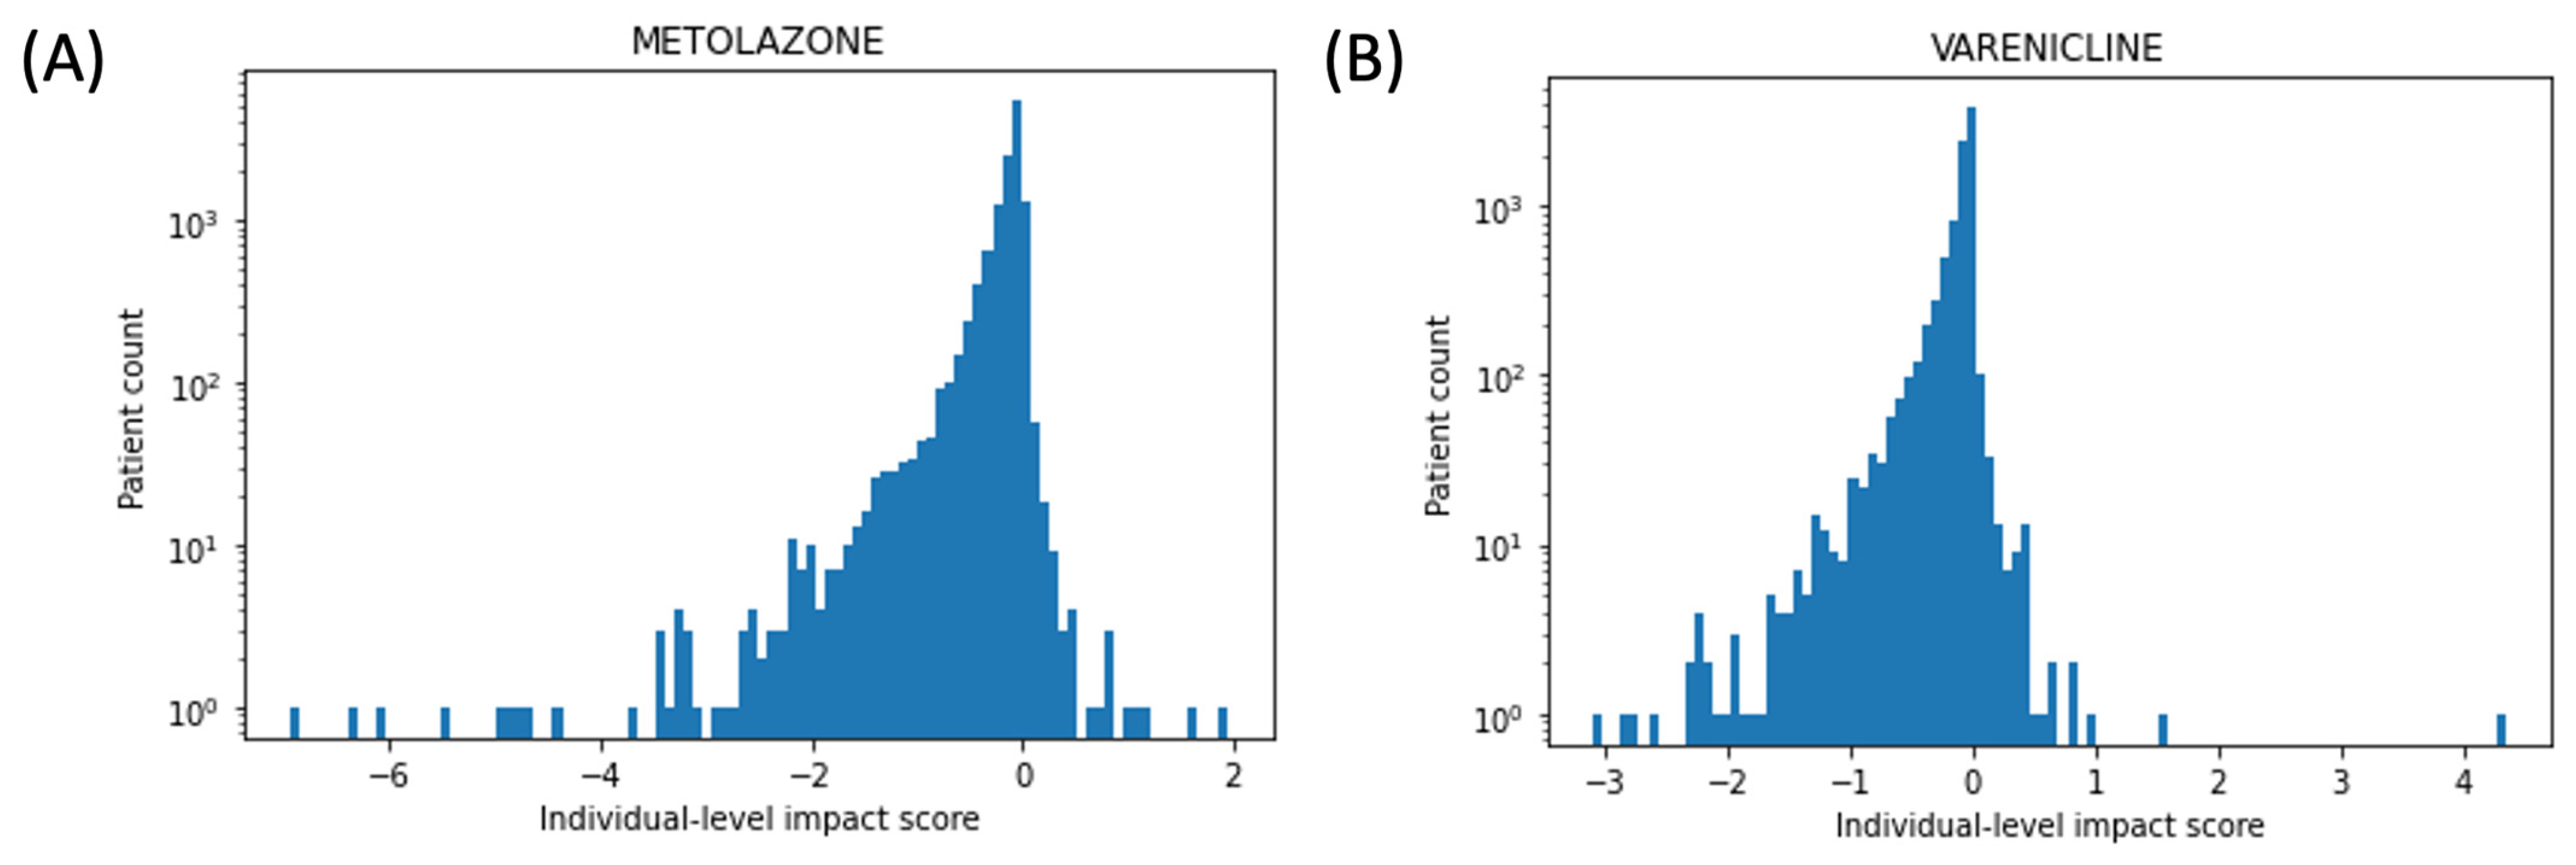
Individual-level impact scores for both metolazone and varenicline were distributed across 0, but most were negative (Figure 3). On the log-scaled histograms, both drugs showed a left-skewed distribution, indicating that a small subset of patients had more strongly negative impact scores. Overall, these findings suggest that in most exposed patients, the model attributed metolazone and varenicline to lower predicted ADRD risk, although the magnitude of this association varied across individuals.
Figure 3.
Histograms of individual-level medication impact scores with a logarithmic y-axis for (A) metolazone and (B) varenicline. Negative values indicate that, for the exposed individual, the model attributed the medication to a lower predicted log-odds of ADRD relative to removal of that medication exposure.
Among 12,480 metolazone users, 12,020 (96%) had negative metolazone impact scores and 460 (4%) had positive impact scores (Table 3). Compared with metolazone users with positive impact scores, those with negative impact scores were younger at the index date (mean age, 79.4 vs. 81.5 years), and had a lower proportion of ADRD cases (44% vs. 55%). Sex distributions were similar between groups. By race, the negative-impact group included a higher proportion of White patients (73% vs. 65%) and a lower proportion of Black patients (16% vs. 22%). Ethnicity distributions were similar between groups.
Table 3.
Characteristics of metolazone and varenicline users stratified by drug-specific individual-level impact on ADRD.
Similarly, among 8786 varenicline users, 8341 (95%) had negative varenicline impact scores and 445 (5%) had positive impact scores, indicating that varenicline exposure was associated with a lower model-predicted ADRD risk in most exposed patients (Table 3). Compared with varenicline users with positive impact scores, those with negative impact scores were younger at the index date (mean age, 72.9 vs. 76.7 years) and had a higher proportion of ADRD cases (47% vs. 26%). Sex and ethnicity distributions were similar between groups. Racial differences were modest, with the negative-impact group including a slightly higher proportion of White patients (84% vs. 83%) and Black patients (9% vs. 7%) and a lower proportion of patients in the other-race category (7% vs. 10%). The negative-impact group also had a slightly lower proportion of Hispanic patients.
4. Discussion
4.1. The MWAS as a Hypothesis-Generating Approach
AD drug repurposing has a long history, with most prior efforts guided by specific mechanisms or preexisting hypotheses [24,25,26,27,28,29,30,31,32,33,34,35,36,37,38,39,40,41,42,43,44,45,46]. For example, prior work has examined antihypertensives, anti-inflammatory agents, and metabolic drugs such as metformin [47] on the basis of known or suspected biologic pathways. In contrast, our approach is hypothesis-free and mechanism-agnostic, leveraging large-scale observational data to identify candidate associations without prespecifying mechanisms. This strategy may reveal unexpected signals that would not emerge from traditional target-based approaches, although such associations require careful validation.
In this study, we assembled a large longitudinal cohort from the VA electronic health record system, enabling comprehensive analysis of cumulative medication exposure and ADRD outcomes. Using this dataset, we trained a deep learning model that demonstrated stable predictive performance. Our explainable artificial intelligence framework identified both potentially novel and previously suggested drug candidates. To our knowledge, this represents one of the first efforts to combine a medication-wide association approach, longitudinal EHR data, and explainable AI for hypothesis generation in ADRD drug repurposing.
4.2. Methodological Innovation in the HVAT Architecture
An important innovation in these analyses was the use of a value-aware transformer architecture. In clinical data, numerical values are important because some concepts have associated values, such as laboratory measurements and medication doses, whereas others do not. This differs from natural language data, in which information is primarily represented as unstructured tokens. Our approach explicitly incorporates both value-bearing and non-value-bearing concepts within a unified framework.
In addition, our architecture distinguishes between different types of numerical values. Some values reflect a patient’s internal physiologic state, such as laboratory results, whereas others reflect the magnitude of an external action or intervention, such as cumulative medication dose. We believe this is an important methodological contribution because these value types differ in clinical meaning and should not be processed in the same way. This value-aware design allowed the model to preserve clinically meaningful information that might otherwise be lost.
4.3. Why We Studied ADRD Rather than AD Alone
This study focused on ADRD rather than AD alone for both practical and clinical reasons. In routine EHR data, the diagnosis of AD is often difficult to distinguish reliably from other related dementias, especially in the absence of biomarker confirmation or autopsy. Accordingly, constructing an ADRD cohort allowed us to study a broader and more clinically realistic phenotype within the available data.
This broader approach may also capture medications that act through mechanisms relevant across multiple dementias rather than only one diagnosis within the ADRD spectrum. For example, some medications may exert more general benefits through anti-inflammatory, antioxidant, nootropic, cardiovascular, or cerebrovascular effects. Such mechanisms may be relevant across the broader ADRD population. At the same time, a medication that works primarily for AD could still emerge as a signal within an ADRD-based analysis if its effect on AD is sufficiently strong, even if that signal is diluted by inclusion of other dementia subtypes.
Thus, although our approach is broad, it can still generate clinically meaningful insights. Signals identified in ADRD can inform subsequent investigation of the mechanism, target population, and disease specificity. In this sense, the present strategy may serve as a first-pass screening approach, with future follow-up studies examining whether identified signals are more relevant to AD specifically or to ADRD more generally.
4.4. Interpretation of MWAS Findings as Signals Rather than Causal Effects
Our AI model incorporated a comprehensive set of clinical concepts, including procedures, note titles, laboratory tests, medications, and diagnosis histories, along with demographic information. This longitudinal clinical context helped account for patients’ underlying clinical conditions and indications for medication use. Furthermore, by incorporating cumulative medication doses, our approach enabled the assessment of dose–response patterns rather than relying solely on medication initiation or binary exposure measures. Together, these features increased our confidence in the identified associations between candidate medications and ADRD diagnosis.
Medications were ranked by their population-level mean impact scores, conceptually similar to GWAS-based candidate screening. Although the standard deviation and range of individual impact scores could describe variability across patients, these measures may also provide valuable information for future subgroup analyses to identify potential heterogeneity in medication-associated effects.
Nevertheless, findings from this MWAS approach should be interpreted as signals or associations rather than evidence of causality. This approach is intended for hypothesis generation, not immediate clinical recommendations. The fact that a medication has a favorable impact score does not mean that it should be used broadly in patients with ADRD. Rather, these findings provide initial insights that require additional interpretation in the context of pharmacology, clinical experience, the existing literature, and further research.
Some identified associations may appear biologically plausible, whereas others may be less intuitive. In either case, the next step is not to assume benefit, but to evaluate the strength, specificity, and clinical plausibility of the signal. This process may support more targeted follow-up studies, including expert review, replication in independent datasets, refined observational analyses, and, where justified, clinical trials. In that sense, this work should be viewed as a starting point. The goal is not to provide definitive answers, but to identify candidate signals that may ultimately lead to repurposable therapies.
4.5. Candidate Medications Identified
Notably, metolazone emerged as a potentially novel candidate. A subsequent cohort analysis suggested an association between metolazone use and lower incident ADRD risk among patients with heart failure [48]. Its potential biological mechanism involves inhibition of the SLC12A3-encoded sodium-chloride cotransporter (NCC), with preliminary genetic evidence linking SLC12A3 variants to ADRD-related outcomes.
Varenicline has been suggested in prior studies [49]. Our cohort study using the All-of-Us dataset shows that Varenicline use is associated with a lower risk of ADRD among older adults receiving smoking cessation therapy [50]. Its potential biological mechanisms involve modulation of nicotinic acetylcholine receptor signaling, acting as a partial agonist at α4β2 and a full agonist at α7 receptors, with potential effects on synaptic plasticity, neuroinflammation, and amyloid-β activity.
A larger set of candidate medications has been identified and is currently undergoing systematic evaluation through expert panel review [51].
4.6. Limitations
Several limitations should be considered. First, the demographic composition of the VA population, which was predominantly male (98.0%) and White (75.5%), may limit generalizability. Medication effects may differ between men and women, and medications used more frequently by women may be underrepresented in this population. Second, ADRD phenotyping remains imperfect, as it relies primarily on diagnosis codes and medication proxies rather than biomarker confirmation. Third, ADRD is a heterogeneous condition, which may obscure subtype-specific associations. Finally, EHR-derived features are subject to data quality limitations, including inaccuracies in coding (e.g., ICD-based comorbidity definitions) and missing or inconsistent data [52]. Additionally, this analysis was limited to oral medications and therefore did not include most GLP-1-based therapies. Moreover, medication exposure was inferred from dispensing records rather than confirmed medication use.
Nevertheless, these AI-informed MWAS analyses may prove to be a useful new lens to identify medications for ADRD that are urgently needed.
4.7. Future Directions
Our future work will focus on continued expert panel validation of identified candidates, prospective cohort validation, and replication in non-VA EHR datasets to assess generalizability and robustness. The concurrent and future analyses will further characterize the expert review framework, including the clinical, pharmacologic, and methodological considerations underlying candidate prioritization, and will also evaluate the translational potential of high-priority medications identified through these analyses.
5. Conclusions
In a national VHA EHR cohort, the MWAS approach combined longitudinal dose-aware modeling with explainable AI to generate medication-level signals associated with ADRD. Metolazone and varenicline showed the most negative model-derived impact scores. These results do not establish causal or protective effects; rather, they demonstrate a scalable strategy for hypothesis generation and prioritization of medication-repurposing candidates for independent epidemiologic validation, expert review, and future clinical investigation.
Supplementary Materials
The following supporting information can be downloaded at: https://www.mdpi.com/article/10.3390/medsci14070778/s1, Table S1, ICD diagnosis codes used for ADRD cohort assembly; Table S2, Medications used for ADRD cohort assembly; Table S3, Features included in the model.
Author Contributions
Y.S. contributed to formal analysis, methodology, and writing the original draft. Y.Y. contributed to data curation, formal analysis, and writing the original draft. Y.C. contributed to data curation and methodology. J.E.M., T.H.T., D.W.T. and M.W.L. provided guidance on investigation and data explanation. S.A. contributed resources and software. A.A., E.Z. and Q.Z.-T. contributed to conceptualization, funding acquisition, and supervision. All authors have read and agreed to the published version of the manuscript.
Funding
This research was funded by the National Institute on Aging, grant R01AG073474, and the U.S. Department of Veterans Affairs, grant I01BX006962-01A1.
Institutional Review Board Statement
The study was approved by the Institutional Review Board of the Washington DC Veterans Affairs Medical Center (Approval Code: 1673360; Approval Date: 25 February 2022).
Informed Consent Statement
Informed consent is exempted for this study because the data obtained were for secondary use only.
Data Availability Statement
The data presented in this study are available from the corresponding author upon request. The data used in this study were obtained from the U.S. Department of Veterans Affairs and are not publicly available due to VA privacy and data security regulations.
Acknowledgments
This work was conducted in the AWS VA Enterprise Cloud Prospect enclave. The authors thank Siamack Ayandeh for the creation of the analytics data mart environment and the VHA Office of Research and Development for funding the cloud credits. During the preparation of this manuscript, the authors used ChatGPT (OpenAI, San Francisco, CA, USA; GPT-5.4 Thinking and GPT-5.6 Sol) for support with grammar, syntax, language clarity, and journal formatting. All scientific content, interpretation, and conclusions were developed and verified by the authors. The views and conclusions expressed in this manuscript are those of the authors and do not necessarily represent the official policies of the National Institutes of Health or the Department of Veterans Affairs.
Conflicts of Interest
The authors declare no conflicts of interest.
Appendix A. Feature Extraction and Construction
For each individual, features were extracted from all available historical data up to 1 year before the index date. Data from the year immediately preceding the index date were excluded to avoid capturing prodromal or early manifestations of ADRD, including changes in symptoms, clinical evaluation, or treatment patterns that may precede formal diagnosis. Including this period could bias the model toward short-term predictors of near-term diagnosis rather than longer-term associations with medication exposure. The observation period was divided into 1-year intervals, and features were aggregated within each interval to construct a temporally ordered sequence. Natural numbers 1, 2, 3, … were used to order the 1-year intervals backwards from the latest to the earliest. These numbers were referred to as temporal indexes.
Appendix A.1. Medication Feature Construction
Medication histories were obtained from the outpatient pharmacy domain of the Veterans Affairs (VA) Corporate Data Warehouse. Because the analysis focused on long-term medication exposure, we included oral medications used by more than 1% of individuals in the analytic cohort before the index date; insulin was also retained because of its common use as a chronic maintenance therapy. Insulin products were categorized as rapid-acting, short-acting, intermediate-acting, long-acting, or combination formulations. Compound medications were separated into individual active ingredients, yielding 243 unique ingredients.
Dose strength was normalized to a common unit for each medication. Medications without strength information, such as “varenicline tab starter pack”, were excluded during data cleaning. Prescriptions were assigned to yearly exposure intervals based on dispensing date rather than actual days of use. Consequently, prescriptions filled near the end of a given year could be allocated to that year even if some of the supplied medication was used in the following year.
Annual cumulative exposure was calculated as dispensed days’ supply multiplied by normalized dose strength. To reduce the influence of implausible values likely attributable to data entry or dispensing errors, daily dose and quantity dispensed were capped at 3 times the 95th percentile for each medication, stratified by dose strength. Medication exposure within each interval was quantified as cumulative dose and summed across prescriptions and refills.
Appendix A.2. Other Longitudinal Features
Other clinical data, including diagnoses, procedures, and note titles, were aggregated into 1-year intervals. For diagnosis features, ICD-9-CM codes were first mapped to ICD-10-CM codes using the Centers for Medicare & Medicaid Services General Equivalence Mappings, after which codes were grouped into 203 ICD-10-CM code blocks. For each occurrence of the code block, we assigned a value of 1 and aggregated the values using sum, so that for each time interval, the code blocks had counts as values. Features with a prevalence greater than 1% in the analytic cohort were retained. Selected laboratory tests were also included, and values were aggregated within each interval using the median. All model features are listed in Table S3.
Appendix B. HVAT 2.0 Data Representation and Encoding
Appendix B.1. Longitudinal Data Representation
The longitudinal data can be abstracted as a set of minimal yet semantically complete data elements, each containing at least three fields: a patient ID, a timestamp, and a clinical concept. The clinical concept may be from a vocabulary of standard terminology (e.g., ICD codes) or of a non-standard terminology (e.g., fitness). Some data elements may also have a fourth piece: a numerical value related to the concept. Whether the data element has a value usually depends on the type of concept it represents. For example, for concepts that are diagnostic codes (e.g., ICD codes), there are usually no values in the data elements; for lab tests or medications, the data elements usually include lab values from the lab tests or dose values from prescriptions or refills.
Appendix B.2. Numerical Value Types and Aggregation
A key feature of our framework is the distinction between two types of numerical values in longitudinal clinical data (Table 1). The first type represents a patient’s internal physiologic state and includes observed or measured values, such as laboratory results and vital signs. The second type represents the magnitude of an external action, or intervention or health utilization, such as cumulative medication dose, visit count, or length of stay. Although these value types may appear similar in the raw record structure, they differ in meaning and therefore require different handling methods during preprocessing and model implementation.
At the data preprocessing stage, each patient’s longitudinal history was divided into equal-length time intervals. Within a given interval, multiple data elements could share the same concept but differ in timestamp; these elements were aggregated into a single feature for feature extraction. When repeated elements for the same concept also contained numerical values, those values were further aggregated into a single summary value. The aggregation method differed according to the type of numerical value, as shown in Table 1.
Appendix B.3. Encoding of Numerical Values
The method for processing values of the first type is given in the original paper [18]. In contrast, the values of the second type required a different approach at the model processing stage. A key property of these values is that, when present, they are always strictly positive (i.e., >0), and the value range can be extended to include 0, which is commonly understood as “no intervention”. Whereas in reality, “absence of the corresponding intervention” is mostly represented by the absence of a record of the “intervention” in the record rather than by a recorded value of 0 for the intervention. For example, nonuse of a medication is typically reflected by the absence of a medication in the record, not by a dose value of 0. In contrast, values of the first type do not have this property, because 0 may represent a valid observed measurement. This distinction required the two value types to be handled differently in the HVAT model.
The HVAT architecture includes an attention mechanism that processes sequences of clinical tokens with optional masks. There are two types of masks: the key padding mask (KPM) and the attention mask, but we will only use the KPM. The original purpose of the KPM is to inform the model which tokens in a sequence are not real but padding tokens to make the sequence align with the other sequences in length in a batch of sequences for batched learning. Usually, the KPM takes binary values: 0 and −∞, with 0 indicating a real token while −∞ indicating a padding token. The HVAT model will ignore the tokens with KPM = −∞. We realized that the KPM values can be extended to any decimal values, while the meanings of the two values 0 and −∞ are preserved. Note that the HVAT model output varies continuously along with the KPM values, and as a KPM value tends to −∞, the model output tends continuously to the one corresponding to the KPM value being −∞, or corresponding to the token being deleted from the sequence. This is crucial for the XAI method to work for this study.
For values of the second type, we assumed that all observed values were positive and that smaller values had effects closer to the absence of values. For each concept with the values of the second type, we first normalize the values through division by a value that is sufficiently large but not exceeding the maximum (e.g., the 95th percentile), so that most of the normalized values lie between 0 and 1. This way of normalization is more robust than simply dividing by the maximum because the maximum could be an outlier (much larger than most of the other values). Next, we take the natural logarithm of the normalized values so that most of them become negative values. Then these values are used as the KPM values to be received by the HVAT model. Since log(0) = −∞, for raw values very close to 0, the KPM values are very close to −∞, and the effects are close to the token being ignored by the model, which fulfills our purpose.
Appendix B.4. Clinical Token Construction
The specific method for data pre-processing (feature extraction) is described in the previous section, followed by the value processing steps described above.
A clinical token is a quadruple (t, C, v, w), where t is the temporal index, C is the concept, v is a value of the first type, and w is a value of the second type. From data elements without values, we generated tokens with v = 0 and w = 0. From data elements with values of the first type, we generated tokens with v equal to the normalized original value and w = 0. From data elements with values of the second type, we generated tokens with v = 0 and w equal to the values processed as described above.
The method for normalizing values of the first type is not unique. In this study, we used standard normalization by subtracting the mean and dividing by the standard deviation, such that the normalized values had mean 0 and standard deviation 1. This was done separately for each concept C. Thus, for each patient, we generated a set of clinical tokens from the longitudinal data. We added a special token, (0, S, 0, 0), to every patient for summarization purposes, where S is an artificial concept defined to be different from all other concepts.
Specifically in this study, the concepts for which data elements had no values were procedures (represented by CPT codes) and note titles; the concepts for which data elements had values of the first type were the selected laboratory tests; and the concepts for which data elements had values of the second type were medications and ICD-10-CM code blocks. The values for medications were cumulative doses, and the values for the code blocks were counts. For cumulative dose values, normalization used the 95th percentile, whereas for code block counts, normalization used the 99th percentile. For the temporal indices, we ordered the time intervals backward (i.e., from latest to earliest) and assigned temporal indices 1, 2, 3, and so forth in that order.
For procedures and note titles, we selected 400 unique procedures and 400 unique note titles with the highest discriminatory power for outcome prediction. We used the selection method described in the original paper [18]. Feature selection was performed exclusively using the training data, prior to model validation and testing. For laboratory tests, we selected 10 features: calcium, cholesterol, creatinine, hemoglobin A1c (HbA1c), high-density lipoprotein (HDL), low-density lipoprotein (LDL), potassium, sodium, triglycerides, and vitamin D. These laboratory tests were selected because they are among the most commonly available and routinely ordered laboratory tests in clinical practice and also represent major health domains relevant to general risk assessment. For medications, we used 243 unique medications, and for diagnosis features, we used a total of 203 unique code blocks. In total, the model input included 1256 unique concepts.
The nonlongitudinal data included age, sex, race, and ethnicity. Age was a continuous variable, and its values were normalized to have a mean of 0 and a standard deviation of 1. Sex was a binary variable. Ethnicity was a categorical variable with 3 categories: (1) Hispanic, (2) non-Hispanic, and (3) unknown. Using non-Hispanic as the reference category, we converted ethnicity into 2 binary variables: Ethn_Hispanic and Ethn_Unknown. Race was a categorical variable with 7 categories: (1) White, (2) Black or African American, (3) Asian, (4) American Indian or Alaska Native, (5) Native Hawaiian or Pacific Islander, (6) other race, and (7) unknown. Using White as the reference category, we converted race into 6 binary variables in a similar way. Overall, there were 10 nonlongitudinal variables.
References
- Alzheimer’s Association. Alzheimer’s disease facts and figures. Alzheimer’s Dement. 2023, 19, 1598–1695. [Google Scholar] [CrossRef] [Scilit]
- Beach, T.G.; Monsell, S.E.; Phillips, L.E.; Kukull, W. Accuracy of the clinical diagnosis of Alzheimer disease at National Institute on Aging Alzheimer Disease Centers, 2005–2010. J. Neuropathol. Exp. Neurol. 2012, 71, 266–273. [Google Scholar] [CrossRef] [Scilit]
- Livingston, G.; Huntley, J.; Liu, K.Y.; Costafreda, S.G.; Selbæk, G.; Alladi, S.; Ames, D.; Banerjee, S.; Burns, A.; Brayne, C.; et al. Dementia prevention, intervention, and care: 2024 report of the Lancet standing Commission. Lancet 2024, 404, 572–628. [Google Scholar] [CrossRef] [Scilit]
- van Dyck, C.H.; Swanson, C.J.; Aisen, P.; Bateman, R.J.; Chen, C.; Gee, M.; Kanekiyo, M.; Li, D.; Reyderman, L.; Cohen, S.; et al. Lecanemab in Early Alzheimer’s Disease. N. Engl. J. Med. 2023, 388, 9–21. [Google Scholar] [CrossRef] [Scilit]
- Bocti, C.; Bergman, H. Anti-Amyloid Therapies for Alzheimer’s Disease: Not the Way Forward. Can. Geriatr. J. 2025, 28, 400–402. [Google Scholar] [CrossRef] [Scilit]
- Westphal Filho, F.L.; Lopes, P.R.M.; de Almeida, A.M. Statin use and dementia risk: A systematic review and updated meta-analysis. Alzheimer’s Dement. Transl. Res. Clin. Interv. 2025, 11, e70039. [Google Scholar] [CrossRef] [Scilit]
- Gray, S.L.; Yu, O.; Gatto, N.M.; Marcum, Z.A.; Latimer, C.S.; Postupna, N.; Su, Y.-R.; Barthold, D.; van Dalen, J.W.; Richard, E.; et al. Angiotensin II-Stimulating Antihypertensive Medications and Dementia-Related Neuropathology. JAMA Netw. Open 2026, 9, e2559113. [Google Scholar] [CrossRef] [Scilit]
- In T’ Veld, B.A.; Ruitenberg, A.; Hofman, A.; Launer, L.J.; van Duijn, C.M.; Stijnen, T.; Breteler, M.M.; Stricker, B.H. Nonsteroidal antiinflammatory drugs and the risk of Alzheimer’s disease. N. Engl. J. Med. 2001, 345, 1515–1521. [Google Scholar] [CrossRef] [Scilit]
- Ha, J.; Choi, D.W.; Kim, K.J.; Kim, K.Y.; Nam, C.M.; Kim, E. Pioglitazone Use and Reduced Risk of Dementia in Patients with Diabetes Mellitus with a History of Ischemic Stroke. Neurology 2023, 100, e1799–e1811. [Google Scholar] [CrossRef] [Scilit]
- Du, H.; Meng, X.; Yao, Y.; Xu, J. The mechanism and efficacy of GLP-1 receptor agonists in the treatment of Alzheimer’s disease. Front. Endocrinol. 2022, 13, 1033479. [Google Scholar] [CrossRef] [Scilit]
- Zhang, C.; Chen, X.; Sun, Y. The growing burden of dementia in Asia: Comparative insights from Japan, China, and India. J. Prev. Alzheimer’s Dis. 2026, 13, 100614. [Google Scholar] [CrossRef] [Scilit]
- Zhang, J.; Kong, G.; Yang, J.; Pang, L.; Li, X. Pathological mechanisms and treatment progression of Alzheimer’s disease. Eur. J. Med. Res. 2025, 30, 625. [Google Scholar] [CrossRef] [Scilit]
- Jordan, F.; Quinn, T.J.; McGuinness, B.; Passmore, P.; Kelly, J.P.; Smith, C.T.; Murphy, K.; Devane, D. Aspirin and other non-steroidal anti-inflammatory drugs for the prevention of dementia. Cochrane Database Syst. Rev. 2020, 4, CD011459. [Google Scholar] [CrossRef] [Scilit]
- Lawlor, B.; Segurado, R.; Kennelly, S.; Rikkert, M.G.M.O.; Howard, R.; Pasquier, F.; Börjesson-Hanson, A.; Tsolaki, M.; Lucca, U.; Molloy, D.W.; et al. Nilvadipine in mild to moderate Alzheimer disease: A randomised controlled trial. PLoS Med. 2018, 15, e1002660. [Google Scholar] [CrossRef] [Scilit]
- Aisen, P.S.; Schafer, K.A.; Grundman, M.; Pfeiffer, E.; Sano, M.; Davis, K.L.; Farlow, M.R.; Jin, S.; Thomas, R.G.; Thal, L.; et al. Effects of rofecoxib or naproxen vs placebo on Alzheimer disease progression: A randomized controlled trial. JAMA 2003, 289, 2819–2826. [Google Scholar] [CrossRef] [Scilit]
- Burns, D.K.; Alexander, R.C.; Welsh-Bohmer, K.A.; Culp, M.; Chiang, C.; O’Neil, J.; Evans, R.M.; Harrigan, P.; Plassman, B.L.; Burke, J.R.; et al. Safety and efficacy of pioglitazone for the delay of cognitive impairment in people at risk of Alzheimer’s disease (TOMMORROW): A prognostic biomarker study and a phase 3, randomised, double-blind, placebo-controlled trial. Lancet Neurol. 2021, 20, 537–547. [Google Scholar] [CrossRef] [Scilit]
- Cummings, J.L.; Atri, A.; Sano, M.; Zetterberg, H.; Scheltens, P.; Knop, F.K.; Johannsen, P.; A Wichmann, C.; Abschneider, R.M.; Leon, T.; et al. Efficacy and safety of oral semaglutide 14 mg (flexible dose) in early-stage symptomatic Alzheimer’s disease (evoke and evoke+): Two phase 3, randomised, placebo-controlled trials. Lancet 2026, 407, 2167–2179. [Google Scholar] [CrossRef] [Scilit]
- Cheng, Y.; Zamrini, E.; Ahmed, A.; Wu, W.C.; Shao, Y.; Zeng-Treitler, Q. Medication-Wide Association Study Plus (MWAS+): A Proof of Concept Study on Drug Repurposing. Med. Sci. 2022, 10, 48. [Google Scholar] [CrossRef] [Scilit]
- Shao, Y.; Cheng, Y.; Nelson, S.J.; Kokkinos, P.; Zamrini, E.Y.; Ahmed, A.; Zeng-Treitler, Q. Hybrid Value-Aware Transformer Architecture for Joint Learning from Longitudinal and Non-Longitudinal Clinical Data. J. Pers. Med. 2023, 13, 1070. [Google Scholar] [CrossRef] [Scilit]
- OpenAI. Introducing ChatGPT. Available online: https://openai.com/index/chatgpt/ (accessed on 26 October 2026).
- Google, I. Introducing Gemini, Your New Personal AI Assistant. Available online: https://gemini.google/assistant/ (accessed on 26 October 2026).
- Meta, A.I.I. Introducing Meta Llama 3: The Most Capable Openly Available LLM to Date. Available online: https://ai.meta.com/blog/meta-llama-3/ (accessed on 26 October 2026).
- Shao, Y.; Todd, K.; Shutes-David, A.; Millard, S.P.; Brown, K.; Thomas, A.; Chen, K.; Wilson, K.; Zeng, Q.T.; Tsuang, D.W. Identifying probable dementia in undiagnosed Black and White Americans using machine learning in Veterans Health Administration electronic health records. medRxiv 2023. [Google Scholar] [CrossRef] [Scilit]
- Saxena, B.; Sisodiya, N.; Khabiya, R.; Pandit, A.; Rajput, M.S.; Gupta, R. AI-Driven Precision Medicine in Alzheimer’s Disease: Drug Repurposing, Digital Therapeutics and Clinical Decision Support. Curr. Pharm. Des. 2026, 32, 1–27. [Google Scholar] [CrossRef] [Scilit]
- Dubey, A.; Chaurasia, A.; Ansari, Z.; Kushwaha, S.K.; Saraf, I.; Kashaw, S.; Swami, R.; Kushwah, V. Targeting Autophagy in Alzheimer’s Disease: Role of the AMPK/mTOR Pathway and Drug Repurposing. Drug Dev. Res. 2026, 87, e70344. [Google Scholar] [CrossRef] [Scilit]
- More, P.S.; Rangari, S.W.; Lade, S.N.; Unidrwade, D.S.; Burle, S.S.; Umekar, M.J.; Lohiya, R.T.; Zanwar, A.S. Drug repurposing in Alzheimer’s disease: Emerging therapeutic strategies and promising candidates. Ageing Res. Rev. 2026, 118, 103113. [Google Scholar] [CrossRef] [Scilit]
- Khan, S.A.; Raza, K.; Tiwari, P.; El-Tanani, M.; Rabbani, S.A.; Parvez, S. Mechanisms to medicines: Navigating drug repurposing strategies in Alzheimer’s disease. Front. Aging Neurosci. 2025, 17, 1676065. [Google Scholar] [CrossRef] [Scilit]
- Demsey, L.L.; Burch, D.; Lin, E.; Quach, D.; Podvin, S.; Boyarko, B.; Levey, A.I.; Weinshenker, D.; Edland, S.; Galasko, D.; et al. Atomoxetine Drug Properties for Repurposing as a Candidate Alzheimer’s Disease Therapeutic Agent. ACS Pharmacol. Transl. Sci. 2025, 8, 3757–3772. [Google Scholar] [CrossRef] [Scilit]
- Corbett, A.; Sultana, J.; Stych, K.; Mills, R.; Cummings, J.L.; Williams, G.; Ismail, Z.; Soto-Martin, M.; Mintzer, J.; Gauthier, S.; et al. Drug repurposing for Alzheimer’s disease: A Delphi consensus and stakeholder consultation. Alzheimer’s Res. Ther. 2025, 17, 237. [Google Scholar] [CrossRef] [Scilit]
- Gurikar, S.; Ahmed, S.S.; Raghunatahanaidu, B.D. Targeting Oligodendrocyte Dysfunction in Alzheimer’s Disease: A New Frontier for Drug Repurposing with Antihistamines and Serotonin Receptor Agonists. J. Mol. Neurosci. 2025, 75, 139. [Google Scholar] [CrossRef] [Scilit]
- Figueiredo-Pereira, M.E.; Serrano, P.A.; Rockwell, P. Six promising drug repurposing candidates for Alzheimer’s disease and their sex-specific mechanisms and efficacy. Neural Regen. Res. 2026, 21, 2882–2888. [Google Scholar] [CrossRef] [Scilit]
- Cummings, J.L.; Zhou, Y.; Van Stone, A.; Cammann, D.; Tonegawa-Kuji, R.; Fonseca, J.; Cheng, F. Drug repurposing for Alzheimer’s disease and other neurodegenerative disorders. Nat. Commun. 2025, 16, 1755. [Google Scholar] [CrossRef] [Scilit]
- Zulhafiz, N.A.; Teoh, T.C.; Chin, A.V.; Chang, S.W. Drug repurposing using artificial intelligence, molecular docking, and hybrid approaches: A comprehensive review in general diseases vs Alzheimer’s disease. Comput. Methods Programs Biomed. 2025, 261, 108604. [Google Scholar] [CrossRef] [Scilit]
- Roberts, J.A.; Varma, V.R.; Jones, A.; Thambisetty, M. Drug Repurposing for Effective Alzheimer’s Disease Medicines: Existing Methods and Novel Pharmacoepidemiological Approaches. J. Alzheimer’s Dis. 2024, 101, S299–S315. [Google Scholar] [CrossRef] [Scilit]
- Boyarko, B.; Podvin, S.; Greenberg, B.; Arnold, S.; Juanes, A.M.; van der Kant, R.; Goldstein, L.; Momper, J.D.; Bang, A.; Silverman, J.; et al. Challenges and Opportunities for Consideration of Efavirenz Drug Repurposing for Alzheimer’s Disease Therapeutics. ACS Pharmacol. Transl. Sci. 2024, 7, 2924–2935. [Google Scholar] [CrossRef] [Scilit]
- Yan, C.; Grabowska, M.E.; Dickson, A.L.; Li, B.; Wen, Z.; Roden, D.M.; Stein, C.M.; Embí, P.J.; Peterson, J.F.; Feng, Q.; et al. Leveraging generative AI to prioritize drug repurposing candidates for Alzheimer’s disease with real-world clinical validation. npj Digit. Med. 2024, 7, 46. [Google Scholar] [CrossRef] [Scilit]
- Anderson, C.; Bucholc, M.; McClean, P.L.; Zhang, S.D. The Potential of a Stratified Approach to Drug Repurposing in Alzheimer’s Disease. Biomolecules 2023, 14, 11. [Google Scholar] [CrossRef] [Scilit]
- Grabowska, M.E.; Huang, A.; Wen, Z.; Li, B.; Wei, W.Q. Drug repurposing for Alzheimer’s disease from 2012-2022-a 10-year literature review. Front. Pharmacol. 2023, 14, 1257700. [Google Scholar] [CrossRef] [Scilit]
- Lessmann, V.; Kartalou, G.I.; Endres, T.; Pawlitzki, M.; Gottmann, K. Repurposing drugs against Alzheimer’s disease: Can the anti-multiple sclerosis drug fingolimod (FTY720) effectively tackle inflammation processes in AD? J. Neural Transm. 2023, 130, 1003–1012. [Google Scholar] [CrossRef] [Scilit]
- Golzari-Sorkheh, M.; Liyanage, I.; Reed, M.A.; Weaver, D.F. Alzheimer’s Disease and COVID-19 Pathogenic Overlap: Implications for Drug Repurposing. Can. J. Neurol. Sci. 2024, 51, 161–172. [Google Scholar] [CrossRef] [Scilit]
- Neha, P.S. Emerging therapeutics agents and recent advances in drug repurposing for Alzheimer’s disease. Ageing Res. Rev. 2023, 85, 101815. [Google Scholar] [CrossRef] [Scilit]
- Padhi, D.; Govindaraju, T. Mechanistic Insights for Drug Repurposing and the Design of Hybrid Drugs for Alzheimer’s Disease. J. Med. Chem. 2022, 65, 7088–7105. [Google Scholar] [CrossRef] [Scilit]
- Nykamp, M.J.; Zorumski, C.F.; Reiersen, A.M.; Nicol, G.E.; Cirrito, J.; Lenze, E.J. Opportunities for Drug Repurposing of Serotonin Reuptake Inhibitors: Potential Uses in Inflammation, Infection, Cancer, Neuroprotection, and Alzheimer’s Disease Prevention. Pharmacopsychiatry 2022, 55, 24–29. [Google Scholar] [CrossRef] [Scilit]
- Xu, Y.; Kong, J.; Hu, P. Computational Drug Repurposing for Alzheimer’s Disease Using Risk Genes from GWAS and Single-Cell RNA Sequencing Studies. Front. Pharmacol. 2021, 12, 617537. [Google Scholar] [CrossRef] [Scilit]
- Singh, R.K. Recent Trends in the Management of Alzheimer’s Disease: Current Therapeutic Options and Drug Repurposing Approaches. Curr. Neuropharmacol. 2020, 18, 868–882. [Google Scholar] [CrossRef] [Scilit]
- Zhang, X.Z.; Quan, Y.; Tang, G.Y. Medical genetics-based drug repurposing for Alzheimer’s disease. Brain Res. Bull. 2015, 110, 26–29. [Google Scholar] [CrossRef] [Scilit]
- Liao, W.; Xu, J.; Li, B.; Ruan, Y.; Li, T.; Liu, J. Deciphering the Roles of Metformin in Alzheimer’s Disease: A Snapshot. Front. Pharmacol. 2021, 12, 728315. [Google Scholar] [CrossRef] [Scilit]
- Ahmed, A.; Zhang, S.; Shao, Y.; Zullo, A.R. Metolazone and Alzheimer’s disease related dementia (ADRD): Artificial intelligence approach to drug repurposing. Innov. Aging 2025, 9, igaf122.4265. [Google Scholar] [CrossRef] [Scilit]
- Kim, S.Y.; Choi, S.H.; Rollema, H.; Schwam, E.M.; McRae, T.; Dubrava, S.; Jacobsen, J. Phase II crossover trial of varenicline in mild-to-moderate Alzheimer’s disease. Dement. Geriatr. Cogn. Disord. 2014, 37, 232–245. [Google Scholar] [CrossRef] [Scilit]
- Ma, P.; Zhou, J.; Cheng, Y.; McGeary, J.E.; Taveira, T.H.; Ahmed, A.; Wu, W.-C.; Zamrini, E.; Dugger, B.N.; Sevilla, L.N.C.; et al. Varenicline as a Repurposable Drug Candidate for ADRD Prevention. medRxiv 2026. [Google Scholar] [CrossRef] [Scilit]
- Zamrini, E.; Ahmed, A.; Dugger, B.; Deedwania, P.; Taub, D.; Zullo, A.; Faselis, C.; Vargas, J.; Shao, Y.; Nelson, S.; et al. A novel framework to evaluate drugs for repurposing against dementia. In Proceedings of the APHA 2025 Annual Meeting and Expo, Washington, DC, USA, 2–5 November 2025. [Google Scholar]
- Nelson, S.J.; Yin, Y.; Trujillo Rivera, E.A.; Shao, Y.; Ma, P.; Tuttle, M.S.; Garvin, J.; Zeng-Treitler, Q. Are ICD codes reliable for observational studies? Assessing coding consistency for data quality. Digit. Health 2024, 10, 20552076241297056. [Google Scholar] [CrossRef] [Scilit]

Disclaimer/Publisher’s Note: The statements, opinions and data contained in all publications are solely those of the individual author(s) and contributor(s) and not of MDPI and/or the editor(s). MDPI and/or the editor(s) disclaim responsibility for any injury to people or property resulting from any ideas, methods, instructions or products referred to in the content. |
© 2026 by the authors. Licensee MDPI, Basel, Switzerland. This article is an open access article distributed under the terms and conditions of the Creative Commons Attribution (CC BY) license.