


Abstract
Introduction and Objective: Monitoring short-term changes in functional and neuromotor performance among older adults during a two-week hospital stay remains challenging in everyday geriatric practice. In this context, the present exploratory observational study aims at investigating the potential of the Clock Drawing Test, evaluated by means of quantitative geometric and kinematic parameters, as a method for capturing short-term fluctuations in visuomotor performance in routine multimodal inpatient care. The aim of the study is not to identify the isolated causal effects of single pharmacological or physical interventions, but to formulate hypotheses on the evolution of graphomotor trajectories within the framework of the usual clinical management. Methods: We conducted a prospective observational study involving 90 older adults hospitalized with chronic medical comorbidities and receiving multimodal inpatient care, including pharmacological treatments and physical rehabilitation techniques such as kinesiotherapy and TECAR therapy. Participants were classified into three diagnostic groups according to their cognitive status: no cognitive impairment (n = 40), mild cognitive impairment (n = 25), and dementia (n = 25). Results of the Clock Drawing Test performed at admission (T0) were compared with those performed at discharge (T14), focusing on contour integrity, numeral spacing, hand placement precision, and digital kinematic parameters. As the primary longitudinal outcome, paired T0 and T14 drawings were compared to evaluate short-term visuomotor changes. As a secondary exploratory analysis, baseline (T0) cognitive status classification was evaluated using Random Forest and Multilayer Perceptron models through participant-level 5-fold stratified cross-validation to determine how baseline neurocognitive and vascular profiles frame short-term graphomotor trajectories. Additionally, a binary (two-way) classification experiment (no cognitive impairment, n = 40, vs. cognitive impairment combining MCI and dementia, n = 50) was conducted, and the Structural Similarity Index (SSIM) was employed to objectively quantify whole-image morphological differences between CDT images obtained at admission (T0) and discharge (T14) using a standardized clock as ground truth. Results: Across the 90 complete pairs, significant Time × Regimen Cluster interactions were observed (p < 0.001). In Cluster 1 (multimodal physical and neurotrophic rehabilitation, n = 55), discharge evaluations showed significant improvements in contour closure gap (from 9.12 ± 2.45 mm to 1.78 ± 0.64 mm, p < 0.001), angular hand placement error (from 27.9° ± 6.8° to 4.1° ± 1.9°, p < 0.001), air-to-paper time ratio (from 1.84 ± 0.42 to 1.36 ± 0.31, p < 0.001), and Z-axis pressure stability (p < 0.001), whereas conceptual time-representation errors remained unchanged. Conversely, the small exploratory Cluster 2 subgroup that was treated with central nervous system depressants for acute inpatient insomnia or agitation showed a decline in graphomotor parameters (contour gap 2.15 ± 0.70 mm to 7.85 ± 2.30 mm, p = 0.016). This pattern could be a marker of either the pharmacodynamic sedation or the underlying acute neuropsychiatric conditions that warranted treatment. Conversely, Cluster 3 (standard medical maintenance, n = 27) remained stable (p > 0.20). For the secondary baseline classification task, the regularized Random Forest and Multilayer Perceptron models achieved promising internal cross-validation (out-of-fold) balanced accuracies of 86.00% and 88.13%, respectively. When reformulated as a two-way classification task (no impairment vs. MCI + dementia), out-of-fold overall accuracies increased to 92.22% (balanced accuracy 92.00%) for Random Forest and 94.44% (balanced accuracy 94.25%) for Multilayer Perceptron. Across 83 paired image sets, mean SSIM between T0 and T14 was 0.7494 ± 0.1016, while mean SSIM relative to the ground-truth clock changed from 0.7527 ± 0.0609 at T0 to 0.7352 ± 0.0687 at T14 (p < 0.001). Conclusions: Quantitative geometric and kinematic CDT parameters captured short-term changes in visuomotor execution over a 14-day hospitalization, while conceptual clock-drawing deficits remained associated with baseline diagnostic status in this exploratory observational cohort. Confounding by indication, practice effects and relief of pain or fatigue may also contribute to the observed trajectories in non-randomized multimodal care. Controlled trials and external multi-center validation cohorts are needed to confirm broader model generalizability and establish the independent effects of specific therapies.
1. Introduction
The epidemic occurrence of neurodegenerative diseases worldwide, especially the many forms of dementia, and mild cognitive impairment, which is often considered a prodromal stage of dementia, is a major challenge for healthcare systems and clinical management [1,2,3]. The early identification of these patients is crucial because the rates of progression from MCI to overt dementia are significantly different and the pathological progression calls for careful monitoring to delay the overall deterioration of cognition [4,5]. The accuracy and efficacy of modern neurological interventions depend on clinical assessments sensitive to small changes in neurocognitive abilities and autonomy in daily living in the absence of certain curative drug therapy [6].
The Clock Drawing Test is a fundamental clinical tool in the repertoire of neuropsychological assessment methods in recent decades, recognized for its simplicity, short administration time and remarkable diagnostic accuracy [7,8,9]. Unlike traditional tests that often do not evaluate some areas of the brain, the CDT simultaneously assesses many important cognitive domains, including executive functions, visuospatial skills, motor planning, sustained attention, and semantic memory [10,11]. The main clinical relevance of the CDT in the assessment of dementia patients is not only to obtain a cross-sectional quantitative score for diagnosis, but the qualitative analysis of the execution errors is basically the key to the continuous assessment of the effectiveness of the treatment [12,13,14].
Educational attainment and cognitive reserve are also affected by conceptual and spatial planning errors (disproportionate numeral spacing, perseveration or inaccurate hand placement) arising from dysfunction across fronto-parietal and temporo-parietal networks [15]. Consequently, quantitative metrics of CDT are being increasingly studied as potential markers to track functional trajectories beyond clinical management [16]. Moreover, the transition to digital examination formats continues to evolve, reinforcing the use of machine learning algorithms in the evaluation of clinical data, thus transforming the accuracy of treatment monitoring [17,18]. This approach allows immediate evaluation of kinematic variables such as response time, stylus pressure on the tablet and motor delays, which are important in the detection of early-stage dementia or assessment of neurocognitive disorders [17,19,20]. Recent advances in digital pen technology and the use of tablets for graphomotor capture have demonstrated that sub-second kinematic features, such as in-air pause duration, stroke velocity variability, and pressure modulation, are correlated with the functional integrity of the fronto-striatal and parieto-occipital networks [21,22,23,24]. Furthermore, validation studies have demonstrated that digital graphomotor biomarkers are sensitive to subtle executive and visuoconstructive deficits and allow longitudinal neuropsychological monitoring by comparing digital CDT metrics to established neuropsychological batteries and neuroimaging or fluid biomarkers [25,26,27,28,29]. Machine learning classifiers applied to multimodal clinical and grapho-motor data in geriatric settings require stringent participant-level cross-validation and regularization to avoid overfitting in small clinical populations [30,31,32].
Non-pharmacological approaches, such as cognitive-motor rehabilitation and diverse treatments in physical medicine, rehabilitation, and balneology, are important parts of the holistic care of patients with MCI and dementia, in addition to standard pharmacological therapies [33]. The use of structured physical activity programs in the elderly with neurodegenerative conditions has evident neuroprotective effects, helping to maintain autonomy, reduce the frailty syndrome, and improve neuroplasticity [34]. Within the framework of multimodal inpatient care, serial CDT assessments may be used to document short-term variations of visuoconstructive and neuromotor function related to physical rehabilitation and pharmacological treatment and to formulate hypotheses for focused longitudinal monitoring [33,34].
This observational study investigates the Clock Drawing Test as a dynamic assessment tool for short-term functional monitoring during a 14-day hospital stay. The independent pharmacological efficacy of single medications can only be assessed in randomized controlled trials. Therefore, the main goal of this study is to longitudinally assess geometrical and kinematic graphomotor changes (contour closure, eccentricity, angular hand posture and stylus pressure stabilization) from T0 to T14 in real-world, multimodal inpatient protocols. As a secondary exploratory aim, we evaluate regularized Random Forest and Multilayer Perceptron classifiers to characterize baseline (T0) cognitive status based on systemic comorbidities and initial neuromotor features, using participant-level cross-validation. This baseline stratification provides an internal context for interpretation of the 14-day longitudinal observations allowing the differentiation between dynamic biomechanical and kinematic parameters that fluctuate in concert with multimodal rehabilitation or acute neuropsychiatric and sedative changes and fixed conceptual deficits that are rooted in the baseline diagnostic severity.
2. Materials and Methods
2.1. Study Participants and Collection of Clinical Information
Patients were consecutively sampled for a prospective observational study with a 14-day follow-up following ethics committee approval. We screened 104 patients admitted for neurological, musculoskeletal, or internal medicine rehabilitation between December 2025 and February 2026. Assessments were scheduled at two time points: T0 (admission, prior to therapeutic procedures) and T14 (discharge, after 2 weeks of inpatient treatment). During screening, 8 patients were excluded due to severe receptive aphasia or severe motor dysfunction of the dominant extremity. Of the remaining 96 eligible patients, 6 were discharged early (prior to day 14) and thus excluded due to incomplete follow-up. This resulted in a final, fully enrolled analytical cohort of 90 patients, all of whom completed both the paired T0 and T14 assessments.
The study population consisted of 90 subjects with a mean age of 74.86 ± 6.2 years. Of these, 63 (70%) were females and 27 (30%) males. On admission (T0) participants were divided in three diagnosis categories: mild cognitive impairment (n = 25), mild-to-moderate dementia (n = 25) and no significant cognitive impairment (n = 40). Diagnostic classification was independently performed by an interdisciplinary clinical team of board-certified specialists in geriatrics, neurology and psychiatry, according to standardized clinical criteria (DSM-5 and NIA-AA guidelines) and the assessment of functional independence of Activities of Daily Living (ADL and IADL) scores were included.
The efficiency of the clock drawing test as a tool for monitoring was evaluated in a group of 90 hospitalized patients with chronic health problems for a period of 14 days. The sample formulation indicates a rather high complexity of factors that have direct influence on fine motor skills. In general, the majority of patients have co-morbidities that have a profound impact on upper-limb biomechanics and stability, such as Parkinson’s disease, resting and action tremors, bradykinesia, rigidity, post-stroke problems, hemiparesis, spasticity, motor asymmetry, chronic heart failure and ischemic heart disease, peripheral capillary perfusion restrictions, neuromuscular weakness, cervical spondylosis, altered innervation of the upper limb, grip on writing instruments and generalized frailty syndromes. Table 1 summarizes the baseline demographic and clinical characteristics of the cohort and their biomechanical impact on graphomotor execution. Advanced age is associated with reduced joint elasticity and slower visuomotor processing, whereas sex-related differences influence grip strength and Z-axis stylus pressure. Furthermore, the high prevalence of Parkinson’s disease, post-stroke sequelae, and cervical spondyloarthrosis contributes to jagged trajectories, eccentric contours, frequent micro-pauses, and impaired fine finger manipulation.
Table 1.
Influence on graphical representation of the examination according to common parameters.
Inclusion criteria were: adults aged ≥50 years admitted to inpatient rehabilitation (most were ≥60 years old, with a small subset of cognitively intact controls in their sixth decade, as illustrated in the age distribution plots), ability to perform the required writing/drawing tasks, adequate visual and auditory perception to understand instructions, and provision of informed consent. The exclusion criteria included severe motor dysfunction of the dominant extremity, severe dementia with inability to understand basic verbal commands, severe receptive aphasia, delirium, recent acute cerebrovascular accident, and incomplete testing at T0 or T14. Throughout the manuscript, when we refer to patients with more advanced cognitive decline, we mean patients at the lower functional boundary of moderate dementia who were able to understand enough to attempt the drawing task.
Demographic and clinical data were collected from each participant including age, gender, place of residence, cognitive status and comorbidities. Cardiovascular, metabolic, neurological, psychiatric diseases and the syndrome of geriatric frailty and other relevant chronic diseases were also recorded. Environmental factors, tobacco and alcohol use were also observed. The burden of multimorbidity was operationalized through three additive unweighted composite indices, calculated as the sum of documented binary diagnoses (1 point for the presence of the disease). These were: (1) Vascular Risk Score (range 0–5), the sum of arterial hypertension, ischemic heart disease, generalized atherosclerosis, atrial fibrillation and chronic heart failure/prior stroke history; (2) Metabolic Risk Score (range 0–3), the sum of type 2 diabetes mellitus, dyslipidemia and obesity; and (3) Psychiatric Risk Score (range 0–3), the sum of depressive syndrome, anxiety disorder and chronic sleep disorder.
The study was conducted in accordance with the Declaration of Helsinki, and approved by the In-stitutional Ethics Committee of County Hospital “Saint Apostle Andrew” Galați, (reg. no. 25,699 dated 18 November 2025), the Ethics Committee of the Galați College of Physicians (reg. no. 1361 dated 2 December 2025), the competent ethics committee (ref. no. 4509 dated 25 February 2026) and the Head of Department (based on request no. 25,700 dated 7 November 2025). Informed consent was obtained from all subjects involved in the study or their legally authorized representatives.
2.2. Clock Drawing Test and Data Gathering
The CDT was performed using a standardized instruction consisting of drawing a clock face, placing numbers 1 to 12, and drawing the time 10:11. The assessments included contour qualities (coherence and completeness), features of the drawings, distribution and cohesion of the numbers, and quantity, location and accuracy of the hands.
Each participant was assessed with a single standardized test at admission (T0) and discharge (T14) using a synchronized dual-capture setup. To this end, a standardized A4 sheet of paper (80 g/m2, Navigator; The Navigator Company, Setúbal, Portugal) was directly attached to an active electromagnetic digitizer tablet (Wacom Intuos Pro Paper Edition, model PTH-860P; Wacom Co., Ltd., Kazo, Saitama, Japan), coupled with a pressure- and tilt-sensing inking stylus (Wacom Ballpoint Pen, model KP13200D; Wacom Co., Ltd., Kazo, Saitama, Japan). The stylus sampled spatial coordinates (X, Y) and axial pressure (Z-axis force in Newtons, calibrated against standard reference weights before each session) at 200 Hz. The simultaneous acquisition ensured that each drawing produced a synchronized real-time kinematic data stream (on-paper contact durations, in-air stylus elevation times, and stroke velocity) and a physical ink trace that was subsequently digitized via flatbed optical scanning (CanoScan LiDE 400; Canon Inc., Tokyo, Japan) at 600 DPI, eliminating order or fatigue effects between media. Automated Python scripts (Python version 3.10.16; Python Software Foundation, Wilmington, DE, USA) utilizing OpenCV (opencv-python, version 4.9.0.80; OpenCV Team, Palo Alto, CA, USA) and SciPy (version 1.11.4; Enthought, Inc., Austin, TX, USA) were used to pre-process images and extract features. Scanned images were adaptively thresholded and morphologically skeletonized. Semi-major and semi-minor axes were obtained through least-squares ellipse fitting. Probabilistic Hough transform was used to detect clock-hand vectors. Action tremor was quantified from the kinematic trajectory using Fast Fourier Transform (FFT) spectral analysis in the 4–12 Hz band. Geometric boundaries were checked by two independent raters who were blinded to the clinical group assignment and automated feature extraction was done blind to the clinical diagnosis and time point. This analysis revealed good inter-rater agreement (intraclass correlation coefficient > 0.92).
For methodological rigor and to avoid statistical pseudoreplication, our workflow meticulously partitioned three distinct data tiers: (1) an auxiliary technical calibration corpus of ~310 preliminary clock sketches, including standardized templates designed by the authors to exemplify typical error phenomena, utilized solely offline for calibrating the optical scanning pipeline and contour-extraction scripts and never integrated into the clinical cohort, Figure 1; (2) a longitudinal clinical dataset comprising 180 paired clock drawings from 90 enrolled patients evaluated at two time points, admission (T0) and discharge (T14), employed exclusively for within-subject longitudinal analyses (T14 vs. T0); and (3) a machine learning classification dataset composed of N = 90 independent baseline patient profiles (40 no impairment, 25 MCI, and 25 dementia at T0). Statistical independence was maintained by not recording repeated illustrations of the same subject as separate observations in the machine learning algorithms.
Figure 1.
Illustrative reference sketches created by the authors during offline calibration to exemplify the three conceptual graphomotor trajectories: (a) baseline inaccuracy followed by post-intervention structural improvement; (b) stationary graphical execution; and (c) baseline accuracy followed by post-intervention deterioration. These schematic templates illustrate the scoring methodology and do not represent empirical patient outcomes.
2.3. Geometric and Biomechanical Approaches for Analysis and Characterization of Therapeutic Interventions
To objectively assess graphic performance, metrological and biomechanical features of the illustration were extracted. These were the consistency and irregularity of the clock dial, contour closure errors, angular misalignment of hands, displacement of the centroid of hands, variability in applied pressure, and ratio of time airborne to time in contact with paper. These parameters were used to give a coherent evaluation of spatial organization, motor accuracy and control of graphic performance.
To avoid circular reasoning, the three observational treatment clusters were defined a priori based on the inpatient clinical regimen prescribed in the medical chart during the 14-day stay and prior to the extraction or inspection of discharge (T14) CDT outcomes. Cluster 1 (n = 55) consisted of patients who received intensive multimodal neuromotor rehabilitation for post-stroke, extrapyramidal or musculoskeletal deficits. The rehabilitation included daily kinesiotherapy (45 min/day, 5 days/week) and upper-limb capacitive/resistive TECAR therapy (300 kHz–1 MHz, 20 min/day) delivered via a BTL-6000 TR-Therapy unit (BTL Industries Ltd., Stevenage, UK), and parenteral or oral neurotrophic and vasoactive support comprising Cerebrolysin (10 mL/day IV; EVER Neuro Pharma GmbH, Unterach am Attersee, Austria) and/or standardized Ginkgo biloba extract EGb 761 (Tanakan®, 80–120 mg/day; Ipsen Pharma, Boulogne-Billancourt, France) for 10–14 days, alongside adjunctive metabolic-trophic or cognitive therapy where clinically indicated, including procaine hydrochloride (Gerovital H3®, 100 mg/day; Zentiva S.A., Bucharest, Romania), vitamins B1, B6, and B12 (Milgamma® N; Wörwag Pharma GmbH & Co. KG, Böblingen, Germany), and piracetam (Nootropil®; UCB Pharma S.A., Brussels, Belgium). Cluster 2 included patients requiring acute initiation or titration of central nervous system depressants during hospitalization for severe insomnia, anxiety or psychomotor agitation—specifically alprazolam (Xanax®, 0.25–0.5 mg/day; Pfizer Inc., New York, NY, USA), gabapentin (Neurontin®, 300–600 mg/day; Pfizer Inc., New York, NY, USA), or haloperidol (Haloperidol-Richter®, 0.5–2 mg/day; Gedeon Richter Romania S.A., Târgu Mureș, Romania)—and minimal participation in physical rehabilitation (n = 8). Cluster 3 (n = 27) was made up of patients who received standard maintenance treatments for internal medicine, cardiovascular and metabolic diseases, without initiation of acute sedatives or intensive upper-limb physical rehabilitation. Across the cohort, additional background symptomatic or maintenance medications included memantine (Ebixa®; H. Lundbeck A/S, Valby, Denmark), sertraline (Zoloft®; Pfizer Inc., New York, NY, USA), dexketoprofen (Tador®; Menarini International Operations Luxembourg S.A., Luxembourg City, Luxembourg), tolperisone hydrochloride (Mydocalm®; Gedeon Richter Plc., Budapest, Hungary), and carbamazepine (Tegretol®; Novartis Pharma AG, Basel, Switzerland). In this observational setting, treatment allocation was based on clinical indication and baseline multimorbidity rather than randomization, and overlapping background medications were observed across the cohort. Therefore, between-cluster comparisons should be interpreted with caution as exploratory.
2.4. Framework for Statistical Evaluation and Machine Learning Verification
Data processing, statistical analysis and machine learning modeling were carried out in Python (version 3.10.16; Python Software Foundation, Wilmington, DE, USA) with the help of pandas (version 2.0.0), NumPy (version 1.26.3), SciPy (version 1.11.4), statsmodels (version 0.14.1), and scikit-learn (version 1.3.2), while graphical visualizations were generated using Matplotlib (version 3.8.2) and Seaborn (version 0.13.1). Longitudinal changes in geometric and kinematic parameters between admission (T0) and discharge (T14) were evaluated using a two-way repeated-measures mixed-effects analysis of variance, treating time (T0 vs. T14) as the within-subject factor and the observational regimen cluster as the between-subject factor, supplemented by paired Student’s t-tests or Wilcoxon signed-rank tests. To strictly control the family-wise error rate across all clusters, a global Holm–Bonferroni correction was applied to all within-subject longitudinal comparisons (T14 vs. T0), with the adjusted two-tailed significance threshold set at p < 0.05.
We examined exploratory multidimensional structure and comorbidity co-occurrence across 90 unique patient profiles using Principal Component Analysis, three-dimensional volumetric risk mapping, two-dimensional Kernel Density Estimation, and Pearson correlation matrices. Longitudinal analyses were conducted on a complete case basis. Because the final analytical cohort strictly comprised the 90 patients who successfully completed both the T0 and T14 evaluations (following the exclusion of early discharges), no missing data imputation was required for the paired comparisons. For the secondary supervised three-class classification task, the prediction target was the baseline (T0) clinical cognitive diagnosis across no cognitive impairment (n = 40), mild cognitive impairment (n = 25) and mild-to-moderate dementia (n = 25). Models were trained on the full baseline predictor set, comprising the baseline quantitative CDT features alongside the demographic and clinical comorbidity variables (age, biological sex, arterial hypertension, ischemic heart disease, generalized atherosclerosis, atrial fibrillation, chronic heart failure, stroke sequelae, type 2 diabetes mellitus, dyslipidemia, obesity, depressive syndrome, anxiety disorder, chronic sleep disorder, and Parkinson’s disease). We utilized two architectures, a regularized Random Forest classifier and a feed-forward Multilayer Perceptron neural network.
In addition to the primary three-way classification (no impairment vs. MCI vs. dementia), we conducted a secondary two-way (binary) classification experiment comparing cognitively intact participants (n = 40) against a combined cognitive impairment group (MCI + dementia, n = 50) using the exact same 5-fold participant-level cross-validation splits to evaluate binary screening performance. Furthermore, to objectively quantify global morphological differences between admission (T0) and discharge (T14) clock drawings across n = 83 valid image comparison sets, the Structural Similarity Index (SSIM) was computed using scikit-image (version 0.22.0) against a standardized ground-truth reference clock and evaluated longitudinally via the paired Wilcoxon signed-rank test.
To avoid overfitting and data leakage, a strict 5-fold Stratified Cross-Validation procedure was applied at the participant level, taking into consideration the sample size of 90 independent patients. (1) Individual-Level Division: The 90 unique patient profiles at baseline (T0) were divided into 5 mutually exclusive groups (k = 5), where each group consisted of 72 training subjects and 18 testing subjects, preserving the exact class distribution (8 no impairment, 5 MCI, and 5 dementia per test group). Each patient was represented by a unique feature vector and thus multiple samples of the same patient were never included simultaneously in both training and testing datasets. (2) In-Fold Preprocessing: Feature standardization (StandardScaler, zero mean and unit variance) was included in a scikit-learn (version 1.3.2) Pipeline, where scaling parameters were calculated using the 72 training samples in each fold and applied to the 18 held-out test samples. (3) Hyperparameter Regularization: Both classifiers were regularized via an inner-loop grid search to constrain model complexity relative to the sample size. Crucially, this inner-loop tuning was performed using a 3-fold cross-validation strictly within the 72 training samples of each outer fold, preventing data leakage into the test set. For the RF classifier, the optimal constrained parameters were found to be n_estimators = 100, max_depth = 4, min_samples_split = 5, min_samples_leaf = 3, and class_weight = ‘balanced’. The MLP classifier was configured with two hidden layers of 32 and 16 neurons, ReLU activation function, Adam optimizer with learning rate of 0.001, L2 weight decay regularization with alpha equal to 0.05, maximum of 500 iterations and early stopping enabled. (4) To assess internal cross-validation performance without in-sample data leakage, confusion matrices and performance indicators were computed only on the aggregated out-of-fold predictions across all five test folds (N = 90 withheld predictions). We report Overall Accuracy, Balanced Accuracy, Precision, Recall, Specificity, Macro-F1, Weighted-F1 and Matthews Correlation Coefficient with 95% confidence intervals (95% CI) over 1,000 stratified bootstrap iterations [30,31].
3. Results
3.1. Utility of the Clock Drawing Test in Follow-Up of Short-Term Therapy
The analysis of the graphics in the CDT during the 14 days of hospitalization shows a specific utility. It mainly reflects the stabilization of the visuomotor functions, not the correction of the spatial reasoning. The progression of the illustrations shows consistent improvements in contour delineation as patients evolve from micrographic or distorted shapes to larger, symmetrical circles on discharge. Table 2 provides a descriptive clinical overview of the qualitative graphic changes noted during the two-week hospitalization, whereas the formal quantitative longitudinal comparisons, paired effect estimates, and repeated-measures ANOVA statistics are presented in Section 3.4.
Table 2.
Changes in graphic parameters of the CDT over 14 days.
The inpatient observational protocols differed graphically in their trajectories by the administration of physical and pharmacological interventions alone or in multimodal combinations. The greatest structural improvements occurred in patients undergoing combined physical and neurotrophic therapies, along with concurrent stabilization of motor control and spatial attention. Table 3 summarizes correlations of drawing performance with inpatient treatments.
Table 3.
Inpatient treatment protocols and graphomotor patterns documented over a 14 day period.
To summarize, the clock-drawing test is a subtle tool for assessment of immediate motor rehabilitation and confidence in the drawing task but does not reflect a rapid improvement of the spatial reasoning deficiencies or of the conceptual illustration of the time, including the 24-h format and the correct representation of the specified time.
3.2. Graphic Performance Measurement and Mathematical Assessment Frameworks
To eliminate the evaluative bias, the graphical parameters of the test should be converted into quantitative parameters. Traditional scoring models are used only for their physical and spatial parameters, irrespective of clinical diagnostic standards. The clock design is evaluated according to three key aspects: shape structure, numerical series arrangement and angular accuracy of time markers.
3.2.1. Structure and Cohesion
The initial motor activity of the clock face drawing necessitates a smooth rotation of the radiocarpal joint supported by stability of the elbow and shoulder.
A perfect circle has an eccentricity of zero. Motor control deficits along specific movement axes—frequently observed in pyramidal or extrapyramidal syndromes—deform the circular contour into an ellipse, quantified as follows:
- i.
- The geometric eccentricity is given by Equation (1).
In this context the variable a is the semi-major axis and b is the semi-minor axis of the figure in question. The high eccentricity index indicates a high imbalance in the regulation of the upper limb.
- ii.
- The closure error of the contour is the Euclidean distance (Equation (2)) between the starting contact point of the writing tool and the terminal point.
Within our scoring framework, an operational heuristic threshold of > 2 mm, derived from our offline calibration corpus, was used to flag impaired contour closure, which may reflect reduced visuomotor precision or upper-limb motor control deficits rather than a definitive focal neurological lesion.
Line quality and tremor analysis show that a smooth line is due to sustained muscle tension, irregularities, roughness, or tiny pauses indicate action tremor or partial rigidity.
3.2.2. Spatial Arrangement of Numbers
The 12 digits on the dial test mechanical spatial organization and the ability to divide a circle’s circumference into equal 30 degree segments.
Spacing and crowding were assessed by calculating the radial and angular separations between successive digits. The physical clustering of the digits, e.g., putting the numbers 1–12 only in the right hemisphere of the circle, is a major spatial calibration error, regardless of the cognitive retention of the numbers.
The cardinal anchoring was assessed by measuring the angular deviation of digits 12, 3, 6, and 9 from the optimal vertical and horizontal axes. A large divergence shows the difficulty to create symmetry benchmarks on a sheet of paper.
3.2.3. Angular Resolution and Vector Source
The problem of drawing the clock hands for a certain time (10:11) is considered with the use of the vector geometry parameters.
Center shift: hands must converge upon some central focus to have structural coherence. The offset is given by the distance from the center of gravity of the inscribed circle to the intersection point of the two hands pointed out by the patient. The vector differentiation is expressed by Equation (3).
An operational heuristic cutoff of Rhands ≤ 1.2 indicated reduced proportional differentiation with the target minute-to-hour hand proportion approximating 1.4–1.5. This cutoff may suggest executive planning or fine motor scaling difficulties when clinical findings are present. The absolute angular error ( further describes how much the drawn trajectory deviates from the target angle (specifically, 300° for the 10 o’clock hour hand and 66° for the 11-min hand).
3.3. Classifications
3.3.1. Cluster 1: Neuro-Motor Optimization Synergism, Positive Trend
This is the common trend in patients who followed an intensive treatment of Kinesiotherapy, TECAR, Cerebrolysin and procaine hydrochloride/EGb761, with minimal sedative influence. Rather than post-hoc outcome selection, the exploratory within-group trajectories were the longitudinal graphic improvements observed at discharge since this cluster was defined a priori by the prescribed multimodal rehabilitation regimen. Theoretically, these observed graphomotor gains are hypothesized to reflect concurrent peripheral soft-tissue relaxation, improved local perfusion, and short-term neuromotor adaptation. Empirically, this cluster is characterized by measurable improvements in contour continuity and spatial digit organization. Table 4 provides a compact quantitative summary of the baseline (T0), discharge (T14), and within-subject change estimates across all three clusters, whereas Table 5 and Table 6 summarize the qualitative profiles and theoretical rationales for Clusters 2 and 3.
Table 4.
Compact summary of longitudinal quantitative CDT metrics across all three observational clusters (T14 vs. T0).
Table 5.
Matrix of geometric and kinematic modifications (T0 vs. T14).
Table 6.
Matrix of geometric and kinematic changes (T0 vs. T14).
3.3.2. Cluster 2: Exploratory Profile of Acute Graphomotor Deterioration in Patients Receiving CNS Depressants
This trajectory (n = 8) is strictly exploratory and is characterized by relatively favorable baseline graphometric indicators pre-treatment (T0) that worsened post-treatment (T14). Members of this small subgroup presented in hospital with acute sleep disturbances, severe anxiety or psychomotor agitation and required clinical initiation or titration of central nervous system depressants (alprazolam, gabapentin or haloperidol) and minimal engagement in physical rehabilitation. Empirically, patients in this cluster showed acute graphomotor deterioration at T14, characterized by micrographia, lower stylus pressure, and irregular strokes. However, graphomotor changes cannot be attributed definitively to CNS depressant treatment alone, given the considerable confounding by indication and extremely small sample size (n = 8). An equally plausible alternative explanation that may directly impair fine motor control and visuospatial organization is the underlying acute clinical conditions leading to treatment, such as severe insomnia, acute anxiety, psychomotor agitation, and attentional exhaustion, that may occur independently of or in addition to pharmacodynamic sedation. These graphic changes, when visible in the clinic, may serve as an exploratory warning sign prompting a reevaluation of the patient’s acute neuropsychiatric status and their sedative doses.
3.3.3. Cluster 3: Fixed Advancement, Ceiling Effect and Major Lesions
This third cluster exhibits stationary graphic performance across the 14-day observation period and comprises two biomechanically distinct subgroups. The first group comprises patients without fine motor deficits, e.g., hospitalized for blood pressure regulation or lipid-reducing treatments, who produce a perfect geometric drawing on entry. No intervention affects the innervation of the upper limb and the drawing remains unchanged. The second subgroup comprised patients at the lower functional boundary of moderate dementia or with chronic post-ischemic sequelae, who empirically showed stable spatial disorganization at both time points. This lack of short-term graphic change indicates that severe underlying structural deficits, hypothesized to be characterized by massive fronto-parietal network disruption, are resistant to functional rehabilitation within a two-week time window.
3.4. Digitally Recorded Kinematic Parameters
For the full longitudinal cohort (N = 90 paired assessments), two-way repeated-measures mixed-effects ANOVA revealed statistically significant Time (T0 vs. T14) × Regimen Cluster interaction effects on the main geometric and kinematic CDT outcome measures: contour closure error Dgap (F(2, 87) = 84.6, p < 0.001, partial η2 = 0.66), eccentricity e (F(2, 87) = 49.2, p < 0.001, partial η2 = 0.53), angular hand error θerror (F(2, 87) = 92.4, p < 0.001, partial η2 = 0.68), hand-center offset (F(2, 87) = 61.8, p < 0.001, partial η2 = 0.59), and Ratio of Air Time to Paper Time (RATPT; F(2, 87) = 19.5, p < 0.001, partial η2 = 0.31).
Table 4 provides a compact summary of the paired baseline (T0) and discharge (T14) estimates, mean changes, and globally Holm-adjusted p-values for all three clusters. Within Cluster 1 (n = 55 analyzed pairs), paired within-subject comparisons demonstrated substantial improvements from T0 to T14 across both kinematic and geometric parameters: (1) RATPT decreased from 1.84 ± 0.42 at T0 to 1.36 ± 0.31 at T14 (within-person change Δ = −0.48, 95% CI: −0.59 to −0.37, t(54) = −8.72, p < 0.001), suggesting reduced cognitive-motor hesitation; (2) Z-axis stylus force stabilized from a fluctuating baseline of 2.25 ± 1.18 N (range: 0.50–4.50 N) at T0 to 2.31 ± 0.14 N (range: 2.00–2.50 N) at T14, with within-subject pressure standard deviation decreasing significantly (ΔSD = −0.82 N, 95% CI: −0.98 to −0.66 N, t(54) = −10.15, p < 0.001); (3) high-frequency action tremor amplitude (4–12 Hz spectral band) and stroke velocity variability showed consistent attenuation; and (4) geometric errors decreased markedly for contour closure Dgap (from 9.12 ± 2.45 mm to 1.78 ± 0.64 mm; Δ = −7.34 mm, 95% CI: −8.01 to −6.67 mm, t(54) = −21.8, p < 0.001), eccentricity e (from 0.74 ± 0.12 to 0.35 ± 0.09; Δ = −0.39, 95% CI: −0.43 to −0.35, t(54) = −19.4, p < 0.001), angular error θerror (from 27.9° ± 6.8° to 4.1° ± 1.9°; Δ = −23.8°, 95% CI: −25.6° to −22.0°, t(54) = −26.1, p < 0.001), and hand-center offset (from 8.35 ± 2.10 mm to 2.10 ± 0.75 mm; Δ = −6.25 mm, 95% CI: −6.84 to −5.66 mm, t(54) = −21.1, p < 0.001). Figure 2 shows a simulated mathematical force profile parameterized by the empirical mean and variance boundaries observed in Cluster 1 at T0 vs T14, avoiding confounding schematic modeling with raw sensor traces to visually illustrate Z-axis pressure stabilization.
Figure 2.
Schematic simulated Z-axis force model. The simulated model is based on the empirical pressure boundaries of Cluster 1. At admission (T0), there were high amplitude pressure fluctuations (0.5–4.5 N), while at discharge (T14), the pressure regime had stabilized (2.0–2.5 N).
In the exploratory Cluster 2 subgroup (n = 8 analyzed pairs), patients treated with central nervous system depressants for acute inpatient insomnia or agitation experienced a paradoxical worsening between T0 and T14, with increases in contour gap Dgap (2.15 ± 0.70 mm to 7.85 ± 2.30 mm; Δ = +5.70 mm, 95% CI: +3.82 to +7.58 mm, Holm-adjusted Wilcoxon p = 0.016), angular error θerror (6.4° ± 2.5° to 24.2° ± 5.9°; Δ = +17.8°, 95% CI: +12.9° to +22.7°, Holm-adjusted p = 0.016), and RATPT (1.42 ± 0.28 to 2.05 ± 0.39; Δ = +0.63, 95% CI: +0.35 to +0.91, Holm-adjusted p = 0.023), as well as micrographia and increased hand-center offset. Such results should be considered as exploratory only due to the strong indication bias and the very small sample size (n = 8). The observed graphomotor decline cannot be confidently attributed to CNS depressant treatment alone, as the acute clinical conditions that underlie pharmacotherapy (severe inpatient insomnia, acute anxiety or psychomotor agitation) represent a primary alternative explanation that may independently disrupt visuomotor integration alongside any pharmacodynamic sedation or muscle relaxation. For Cluster 3 (n = 27 pairs analyzed), longitudinal changes between T0 and T14 were statistically non-significant and negligible for all metrics both before and after Holm adjustment (ΔDgap = −0.18 mm, 95% CI: −0.52 to +0.16 mm, t(26) = −1.09, unadjusted p = 0.28, Holm-adjusted p > 0.99; Δe = −0.02, unadjusted p = 0.41; Δθerror = −0.6°, unadjusted p = 0.34; ΔRATPT = −0.04, unadjusted p = 0.52). These results may reflect a baseline ceiling effect in motorically intact cardiovascular patients or fixed spatial disorganization in patients with moderate dementia and chronic post-stroke sequelae.
For the secondary baseline classification analysis on the 90 independent patient profiles at T0, we computed Random Forest feature importance (Gini impurity reduction) over the 5 stratified cross-validation folds to rank the relative predictive contribution of demographic and clinical variables. This indicates non-causal predictive association within the model and not formal statistical significance or causal influence.
A wide range of clinical features was available: age, gender, hypertension, ischemic heart disease, atherosclerosis, atrial fibrillation, dyslipidemia, heart failure, depression, anxiety, post-stroke complications, diabetes, obesity, sleep disorders and Parkinson’s Disease, Figure 3. The importance of predictors was evaluated by the RF algorithm, particularly in terms of the impact of age and the cardiovascular-cognitive relation on the graphical performance. The mean feature importance scores based on Gini impurity (±standard deviation, SD) across the 5 stratified cross-validation folds confirmed the predominant effect of age (0.372 ± 0.034) followed by vascular comorbidities: arterial hypertension (0.061 ± 0.012) and ischemic heart disease (0.057 ± 0.011), and cardiometabolic or neuropsychiatric factors, such as sleep disorders (0.052 ± 0.010), obesity (0.050 ± 0.009), sex (0.050 ± 0.008), atherosclerosis (0.049 ± 0.009), atrial fibrillation (0.047 ± 0.008), dyslipidemia (0.046 ± 0.007), and heart failure (0.046 ± 0.008). These cross-validated importance estimates in our cohort suggest an associative relationship between cognitive stratification and age-related neurovascular burden.
Figure 3.
Random Forest feature importance scores (mean ± SD over 5 stratified folds, N = 90 patients) to distinguish no impairment, MCI and dementia.
The fact that age is so prevalent in the feature importance chart is a reflection of a basic neurobiological fact: neurodegeneration, by definition, is an age-related disease. Cognitive reserve and cortical degeneration decrease with age.
The early occurrence of vascular diseases, hypertension and ischemic heart disease, among the primary predictive factors supports the hypothesis of a multifactorial origin of cognitive impairment in the elderly. MCI and then dementia, usually vascular or mixed, are thought to be due to microangiopathy and chronic cerebral hypoperfusion due to hypertension or ischemic damage.
The recognition of sleep disorders and obesity as important factors emphasizes the role of chronic low-grade inflammation and poor sleep in glymphatic clearance of neurotoxic proteins, e.g., beta-amyloid, a critical process in the avoidance of neurodegeneration.
The exploratory multidimensional analyses provided a broader perspective on how clinical characteristics vary across the different stages of cognitive decline, Figure 4. Principal component analysis, presented in Figure 4a, brought the clinical variables together in a two-dimensional representation. Rather than forming three clearly separated groups, the results showed a gradual distribution, with considerable overlap between cognitively intact individuals (purple), patients with mild cognitive impairment (teal), and those with dementia (yellow). From a clinical perspective, this finding reflects the complexity of cognitive decline and the fact that the transition from normal cognition to dementia is not always clearly defined. It also suggests that demographic characteristics and associated medical conditions may help describe a patient’s overall risk profile, but are not sufficient on their own to distinguish between diagnostic stages. Functional and visuospatial assessments, particularly those provided by the Clock Drawing Test, may therefore offer additional information when evaluating cognitive status.
Figure 4.
Statistical analysis. (a) PCA representation of the dataset for dimensionality reduction; (b) average risk footprint by volumetric space assessment of cognitive deterioration; (c) average risk footprint; (d) clinical constellation network; (e) risk topography based on patient density; (f) microscopic age distribution; (g) progression of pathological profile.
Figure 4b presents the distribution of patients within a three-dimensional risk space based on age, cardiovascular risk, and metabolic risk. The overlap between the mild cognitive impairment and dementia groups becomes more evident at older ages and in the presence of a greater cardiometabolic burden. This observation highlights the fact that cognitive impairment in older adults often develops alongside several interacting health conditions, rather than being associated with a single isolated risk factor. The radar chart in Figure 4c offers a complementary view of these differences. Patients with dementia show a risk profile largely associated with advanced age and vascular burden, while the psychiatric component appears more prominent among patients with mild cognitive impairment.
The heatmap in Figure 4d provides further insight into the medical conditions commonly found together within the cohort. Arterial hypertension and ischemic heart disease were the most frequent combination, occurring in 25 patients, followed by the association between depression and anxiety, identified in 20 patients. These findings illustrate the considerable burden of multimorbidity in the studied population and highlight the importance of considering the patient’s overall clinical condition when assessing cognitive decline.
Figure 4e uses kernel density estimation to show how patients are distributed according to age and vascular risk. The highest concentration of cognitively intact individuals (purple) is found among younger participants with lower vascular risk scores. In contrast, patients with dementia (yellow) are more frequently concentrated at older ages and at higher levels of vascular burden. This distribution is consistent with the clinical observation that advancing age and vascular comorbidities frequently accompany more severe cognitive impairment, although the relationship between these factors is not necessarily causal.
The combined violin-and-swarm plot in Figure 4f provides a closer look at the age distribution within each diagnostic group, while also displaying individual patient values. Patients with dementia are most frequently represented between 80 and 85 years of age. By comparison, the cognitively intact group covers a much wider age range, extending from the sixth through the ninth decade of life. This finding is particularly relevant from a clinical perspective, as it shows that chronological age alone does not determine cognitive status. Older age may increase vulnerability, but preserved cognitive function remains possible even in advanced age.
Finally, Figure 4g depicts the group-specific prevalence (%) of three important clinical phenotypes, namely arterial hypertension, anxious-depressive phenotype and cardiac insufficiency, in the three diagnostic categories. The group prevalences are not mutually exclusive due to the high occurrence of overlapping comorbidities, and therefore, their cumulative display exceeds 100% when stacked. Arterial hypertension is highly prevalent throughout the cohort, affecting 70% of cognitively intact individuals, 72% of patients with mild cognitive impairment, and 64% of those with dementia. Heart failure, on the other hand, becomes more frequent across the diagnostic categories, reaching 36% in the dementia group. The anxious-depressive profile is more frequently observed among cognitively intact individuals and patients with mild cognitive impairment, with prevalences of 32% and 28%, respectively, and is considerably less prominent in the dementia group. Clinically, this difference may partly reflect changes in emotional awareness, communication, and the ability to recognize or report psychological symptoms as cognitive impairment progresses. In more advanced stages, reduced insight, including anosognosia, may also contribute to the lower reporting of affective symptoms.
The absolute patient co-occurrence frequencies (counts) are shown in Figure 4d and the pairwise Pearson correlation matrix (r, from −1 to +1) for the 14 baseline demographic and clinical variables are shown in Figure 5 (N = 90 patients). These correlation coefficients represent linear directional relationships between binary and continuous variables, not probabilities of co-occurrence of disease.
Figure 5.
Pairwise Pearson correlation matrix (r) for baseline demographic and clinical comorbidity variables.
In terms of the quantitative correlation, the strongest positive correlation was found for depressive syndrome and anxiety disorders (r = 0.94, p < 0.001), suggesting the frequent presence of an anxious-depressive phenotype in older adults with subjective or prodromal cognitive complaints. Also, there was a moderate-strong correlation between atrial fibrillation and heart failure (r = 0.58, p < 0.001) and arterial hypertension and ischemic heart disease (r = 0.30, p = 0.004) and a strong correlation between obesity and sleep disorders (r = 0.87, p < 0.001).
This is in line with the lower prevalence of self-reported affective symptoms in the older dementia subgroup, Figure 4g. Age was positively correlated with heart failure (r = 0.29, p = 0.005) and Parkinson’s disease (r = 0.25, p = 0.017) and negatively correlated with depression (r = −0.24, p = 0.022). These interrelated cardiometabolic and neuropsychiatric clusters highlight the need to consider collinearity and non-linear interactions in modeling cognitive status.
We evaluated the ability of non-linear relationships between clinical comorbidities and baseline graphomotor metrics to classify baseline cognitive status by analyzing the internal cross-validation performance of regularized Random Forest and Multilayer Perceptron classifiers using aggregated out-of-fold predictions from a participant-level 5-fold stratified cross-validation procedure (N = 90 unique patients). The internal out-of-fold confusion matrices of the Random Forest classifier and the Multilayer Perceptron classifier are presented in Figure 6.
Figure 6.
Out-of-fold (5-fold stratified cross-validation) confusion matrices for cognitive status classification across the N = 90 independent patients: (a) Random Forest classifier; (b) Multilayer Perceptron classifier.
Both models showed promising internal cross-validation performance when evaluated over the five stratified test folds, see Figure 6 and Table 7. The Random Forest classifier correctly identified 78 of 90 patients in panel (a) with an internal out-of-fold overall accuracy of 86.67% (95% CI: 78.89–93.33%), balanced accuracy of 86.00% (95% CI: 78.1–91.8%), macro-F1 score of 0.858, and Matthews Correlation Coefficient of 0.796. RF classified 36/40 no-impairment cases correctly (3 cases misclassified as MCI, 1 as dementia), 20/25 MCI cases correctly (3 cases misclassified as no impairment, 2 as dementia), and 22/25 dementia cases correctly (3 cases misclassified as MCI).
Table 7.
Out-of-fold classification performance metrics (5-fold stratified cross-validation, N = 90 independent patients) for Random Forest (RF) and Multilayer Perceptron models.
In panel (b), the Multilayer Perceptron showed a slightly better internal cross-validation performance, correctly classifying 80 out of 90 patients, corresponding to an out-of-fold overall accuracy of 88.89% (95% CI: 82.22–94.44%), balanced accuracy of 88.13% (95% CI: 81.0–94.1%), macro-F1 score of 0.881, and MCC of 0.830. The MLP model correctly classified 37 out of 40 no impairment subjects (3 were predicted as MCI), 21 out of 25 MCI subjects (2 were predicted as no impairment, 2 as dementia), and 22 out of 25 dementia subjects (3 were predicted as MCI).
Clinically, the majority of the out-of-fold misclassifications in both models were found at neighboring diagnostic thresholds, particularly between mild dementia and no impairment or MCI. This finding is in agreement with the continuous clinicopathological gradient observed in our PCA and KDE analyses, Figure 4a,e. The classification task performance was significantly improved when reframed as a binary (two-way) experiment discriminating between no cognitive impairment (n = 40) and combined cognitive impairment (MCI + dementia, n = 50) on the same 5-fold out-of-fold predictions. The Random Forest classifier achieved a two-way out-of-fold overall accuracy of 92.22% (83/90 correct; 95% CI: 86.67–97.78%), balanced accuracy of 92.00%, sensitivity of 94.00% (47/50), specificity of 90.00% (36/40), macro-F1 score of 0.921, and MCC of 0.842. The Multilayer Perceptron achieved a two-way overall accuracy of 94.44% (85/90 correct; 95% CI: 88.89–98.89%), balanced accuracy of 94.25%, sensitivity of 96.00% (48/50), specificity of 92.50% (37/40), macro-F1 score of 0.944, and MCC of 0.887. Internal cross-validation results suggest that the vascular-metabolic comorbidity profiles combined with quantitative CDT metrics capture meaningful neurocognitive variance in our cohort without in-sample overfitting. External validation on independent multi-center cohorts is necessary to establish broader model generalizability.
The Structural Similarity Index (SSIM) was used to quantify whole-image morphological differences between CDT drawings at admission (T0) and discharge (T14), using a standardized clock image as the ground truth (Figure 7). Across 83 paired image sets, the mean within-patient SSIM between admission and discharge drawings was 0.7494 ± 0.1016, indicating moderate-to-high structural similarity alongside substantial interindividual variability. Relative to the reference clock, the mean SSIM was 0.7527 ± 0.0609 at admission and 0.7352 ± 0.0687 at discharge, representing a mean decrease of 0.0176 over the 14-day hospitalization. Individual paired comparisons revealed increased structural similarity in 26 cases (31.3%) and decreased similarity in 57 cases (68.7%). An exploratory paired Wilcoxon signed-rank test confirmed a statistically significant shift in SSIM between T0 and T14 (p < 0.001) toward lower whole-image similarity relative to the reference template.
Figure 7.
The distribution of the Structural Similarity Index shows comparable mean values across all three comparisons (0.7352–0.7527), indicating consistent structural similarity between the temporal assessments and the Ground Truth, with relatively low variability and a few lower outlier values.
Before calculating SSIM, the clock images underwent standardized preprocessing. Images were converted to grayscale, the clock region was consistently cropped, and all images had identical dimensions. When appropriate, clock contours were also spatially aligned.
These steps were especially important because differences in image position, scale, rotation, or background can reduce SSIM values independently of the correctness of the clock drawing.
4. Discussion
The longitudinal graphomotor changes observed between admission (T0) and discharge (T14) should be interpreted strictly when considering an exploratory observational cohort receiving individualized multimodal inpatient care, rather than randomized monotherapy. The geometric and kinematic behavior patterns described below are not due to individual interventions and do not show the independent causal efficacy of any single pharmacological or physical agent, treatment synergy or definitive neurobiological mechanisms, as treatment allocation was guided by clinical indication and patients received overlapping combinations of physical rehabilitation and pharmacotherapy, Table 8, refs. [35,36,37,38]. Short-term gains in CDT performance during a 14-day hospitalization may also be due to non-specific factors such as test–retest practice and task familiarity effects, relief of acute musculoskeletal pain by analgesic therapy, reduction in hospitalization-related anxiety or fatigue, and baseline motor floor or ceiling boundaries. In addition, our machine learning algorithms had good internal cross-validated performance at T0. Nevertheless, internal classification accuracy in a single cohort of N = 90 does not provide evidence of external generalizability, does not translate into longitudinal responsiveness, or validate the CDT as a stand-alone tool to inform medication adjustments. Thus, the working hypotheses in Section 4.1, Section 4.2, Section 4.3, Section 4.4, Section 4.5, Section 4.6 and Section 4.7 below are based on the literature and refer to the theoretical interaction between multimodal care components and neuromotor execution, not to the treatment effects observed in the present study.
Table 8.
Incidence of therapeutic interventions across the 14-day hospitalization period.
4.1. Kinesiotherapy and Mechanical Function: Working Hypotheses
The theoretical goal of kinesiotherapy is to restore the kinematic sequence of writing, including shoulder stability, elbow excursion, wrist rotation, and the pincer grip of the writing instrument between the thumb, index, and middle fingers. A common baseline finding in patients with post-stroke sequelae or disuse atrophy is contour fragmentation. This is represented by a circle with short, overlapping lines dotted around it that result from the inability to sustain a continuous muscle contraction around a 360-degree arc. In patients who received multimodal inpatient care including two weeks of daily fine motor and active mobilization activities, discharge assessments revealed reduced closure error (Dgap) and eccentricity. In our observational design, these gains cannot be differentiated from concurrent treatment or practice effects. Nonetheless, we suggest that repetitive motor training may assist in the regulation of eccentric and concentric function of the forearm musculature, as well as horizontal-plane motion control [39].
4.2. TECAR Therapy: Hypothesized Biomechanical Contributions
TECAR therapy uses high-frequency currents (from 300 kHz to 1 MHz) to induce deep endogenous hyperthermia, which is documented in the rehabilitation literature to improve local vasodilation, tissue oxygenation and reduction in connective tissue stiffness and upper-limb spasticity. In our cohort, 68.9% of subjects received TECAR therapy along with kinesiotherapy and neurotrophic medications, and this multimodal group showed stabilization of line quality and Z-axis stylus pressure at discharge. In the present study TECAR therapy was not used as a single treatment and therefore a direct causal effect on stylus pressure cannot be confirmed. Alternatively, we propose that the reduction in antalgic motor inhibition during concurrent kinesiotherapy could be facilitated by the thermal reduction in muscle contractures and periarticular joint pain, especially in patients with cervical spondyloarthrosis or arthritis, and this mechanism needs to be verified in controlled trials [40].
4.3. Cerebrolysin and Kinematic Timing: Theoretical Considerations
Cerebrolysin is a neuropeptide drug studied for its neuroprotective and neurotrophic properties. Preclinical and clinical stroke studies have suggested that it may be involved in the maintenance of dendritic spines and synaptic plasticity via the modulation of GAP-43. In our observational cohort, patients receiving multimodal regimens that included Cerebrolysin (65.6% of the cohort) exhibited reduced in-air hesitation time (RATPT), improved alignment of cardinal anchors (digits 12, 3, 6, and 9), and smaller hand-center deviation at discharge. However, Cerebrolysin itself cannot be credited with these kinematic improvements, as it was co-administered with physical rehabilitation and vasoactive agents over a brief 14-day period that is insufficient for structural axonal regeneration. We hypothesize that short-term functional modulation of fronto-parietal and oculomotor networks would be indicative of any potential contribution of neurotrophic support within a multimodal protocol, which can only be tested in randomized monotherapy studies [41,42].
4.4. EGb 761 and Visuospatial Execution: Exploratory Hypotheses
Ginkgo biloba extract (EGb 761) has been reported in the literature to support cerebral microcirculation, modulate microvascular tone, and help neuronal energy metabolism. In our study, patients who received EGb 761 as part of their multimodal inpatient regimen (67.8% of the cohort) had better numerical interpolation and lower vector angular error at discharge when representing the time 10:11. Our data do not allow for an independent effect of EGb 761 on visuospatial processing due to the non-randomized, overlapping treatment structure and the possible influence of test–retest familiarity. We instead propose an exploratory hypothesis that sustained attention on visual and spatial information during multimodal rehabilitation could be supported by microvascular perfusion of fronto-subcortical networks. This hypothesis deserves a targeted evaluation in future controlled studies [43].
4.5. Procaine Hydrochloride and Tremor Mitigation: Theoretical Rationale
The possible effects of procaine hydrochloride formulations on capillary microcirculation and mild monoamine oxidase inhibition have been studied in geriatric populations. In our cohort, patients (41.1%) receiving procaine hydrochloride in the multimodal metabolic-trophic regimen had a decrease in line roughness and a decrease in the amplitude of high-frequency action tremors (4–12 Hz band) at T14. Because these patients received simultaneous treatment with supportive hospital care, B-complex vitamins, and physical therapy, we cannot specifically attribute the observed tremor attenuation to procaine hydrochloride. We present these observations merely as a hypothesis-generating rationale that systemic microvascular support and reduced inpatient fatigue may work in concert to promote efferent neuromuscular stability, which merits a dedicated controlled investigation [44].
4.6. Memantine Initiation and Motor Coordination: Potential Confounding Factors
Memantine is a well-established agent for medium- and long-term stabilization of cognition in moderate-to-severe dementia via NMDA receptor antagonism, but preclinical and clinical literature suggests that early titration may sometimes be associated with transient adjustments of motor coordination. In our cohort, discharge drawings of patients treated with memantine (15.6% of the group) were mostly stationary in their mechanical profiles, characterized by persistent difficulties in proportional hand-length differentiation (Rhands) and terminal stroke accuracy. In this observational setting, the lack of short-term mechanical improvement over 14 days is unlikely to be attributable to memantine itself, being heavily confounded by the more advanced baseline neurodegenerative severity and concurrent psychotropic medications that characterize this subgroup. Early NMDA titration effects appear to be a secondary theoretical possibility [45].
4.7. CNS Depressants, Confounding by Indication, and Exploratory Graphomotor Deterioration
Central nervous system depressants such as alprazolam, gabapentin, and haloperidol may cause systemic muscle relaxation, central sedation, and delayed neural impulse conduction. In the purely exploratory Cluster 2 subgroup (n = 8), patients treated with acute initiation or titration of these sedatives for hospital-emergent insomnia, anxiety, or psychomotor agitation showed three qualitative and quantitative graphomotor changes at discharge: (i) marked micrographia with clock contours limited to a small area of the page; (ii) unilateral crowding or omission of digits; and (iii) faint, unanchored clock-hand strokes associated with increased RATPT. The very small sample size (n = 8) and substantial confounding by indication are critical factors, and this graphomotor decline cannot be confidently attributed to CNS depressant medication. The underlying clinical conditions that necessitated treatment (acute sleep deprivation, severe anxiety, psychomotor agitation, and attentional exhaustion) offer an immediate alternative explanation that could independently compromise visuomotor planning and graphomotor stability in addition to or in place of pharmacodynamic sedation [46]. Therefore, acute deterioration of CDT in this context should be read as an exploratory clinical signal to assess both the patient’s medication regimen and the underlying neuropsychiatric disturbance.
4.8. Clinical Context and Multimodal Therapeutic Partnerships
Pharmacological therapy and physical rehabilitation are components of a comprehensive geriatric care plan and are not isolated monotherapies in the routine practice of geriatric inpatient care. Table 8 summarizes the real-world distribution of inpatient interventions. In our cohort of 90 patients, the within-group graphomotor trajectories in Cluster 1 were clearly distinguishable when comparing drawings between admission (T0) and discharge (T14), Figure 8. Our study did not utilize parallel numerical test scores during hospital stay, but directly stratified patients based on their established clinical diagnoses (no impairment, MCI, and dementia). However, our observations are consistent with current research on digital drawing biomarkers and longitudinal functional monitoring [17,18,19,20,21,22,23,24,25,26,27,28,29,30,31,32]. Previous work in the field has demonstrated that subtle kinematic and spatial features captured during digital clock drawing are significantly correlated with comprehensive clinical and neuropsychological assessments and structural and metabolic neuroimaging markers [7,18,23,24,25,26,27]. Similarly, recent machine learning studies on the drawing dynamics from tablets have shown comparable classification accuracy (usually in the range of 80–90%) in classifying clinically diagnosed MCI and dementia from healthy aging [19,21,28,29,32,47]. In addition, our classification experiments with three-way and two-way (no impairment vs. MCI + dementia) classifications show that merging MCI and dementia into one category of cognitive impairment improves out-of-fold accuracy from 86.67% to 92.22% for Random Forest and from 88.89% to 94.44% for MLP. This is because the boundary misclassifications arising from the clinicopathological overlap between MCI and mild dementia are eliminated, Figure 4a,e, making the binary framework particularly suitable for primary inpatient cognitive screening. The exploratory nature of our findings, including the analysis of paired drawings at admission and discharge within clinical diagnostic categories, suggests that quantitative CDT metrics are sensitive to short-term changes in visuomotor execution associated with multimodal inpatient care or acute neuropsychiatric and sedative episodes. Conversely, more profound conceptual errors in time representation seem to be relatively stable over a two-week period [47,48].
Figure 8.
Empirical group mean values of the measured geometric parameters in Cluster 1 (T0 vs. T14): comparative patient evaluations recorded at admission (Day 1) and discharge (Day 14) following multimodal physical therapy, TECAR therapy, and neurotrophic support.
These findings also highlight both the potential and the methodological limitations of automated whole-image similarity metrics for the longitudinal assessment of the CDT in hospitalized older adults. While the mean within-patient SSIM between admission and discharge (0.7494 ± 0.1016) indicates that global clock morphology remained broadly consistent across hospitalization, the wide standard deviation reflects substantial interindividual heterogeneity across cognitive stages, motor limitations, and multimodal regimens. Notably, the slight reduction in mean SSIM relative to the reference clock at discharge (0.7352 ± 0.0687 vs. 0.7527 ± 0.0609 at admission) contrasts with the targeted geometric and kinematic improvements observed in Cluster 1.
This divergence occurs because global SSIM evaluates pixel-level luminance, contrast, and local structural overlap rather than clinical or geometric accuracy; it does not isolate numeral sequence, contour closure, or hand angles, and is highly sensitive to benign shifts in drawing scale (such as macrographic expansion from baseline micrographia), translation, rotation, and stroke thickness.
Consequently, a lower global SSIM score relative to a static template does not imply cognitive or motor deterioration, as functional improvements in drawing size and stroke firmness can reduce rigid pixel-wise overlap with a standardized template.
Methodologically, our results support using SSIM strictly as a complementary indicator of global morphological variation rather than a standalone measure of therapeutic response. Integrating explicit geometric and kinematic descriptors (such as contour closure, eccentricity, angular hand error, and stylus pressure dynamics) with conventional clinical CDT scoring remains essential to distinguish meaningful neuromotor changes from variations in drawing scale or alignment.
5. Limitations of the Study
Several important methodological limitations should be considered when interpreting the results of our study. The clinical cohort size is small for initial multi-class machine learning analyses (N = 90 unique patients: 40 without cognitive impairment, 25 with MCI and 25 with dementia). Despite using strict 5-fold stratified cross-validation at the participant level, with in-fold standardization and hyperparameter regularization to reduce overfitting and prevent data leakage, our results indicate promising internal cross-validation performance within a single center, rather than evidence of wider model generalizability; independent external validation cohorts from multiple institutions are required to confirm generalizability [30,31]. Second, this was an observational, non-randomized inpatient study with overlapping combinations of multimodal treatments tailored to the individual patient’s clinical comorbidities. Due to treatment overlap and confounding by indication, the observed CDT changes cannot be attributed to a specific pharmacological agent (e.g., Cerebrolysin, EGb 761, procaine hydrochloride, or memantine) or physical modality (kinesiotherapy or TECAR therapy), and thus all the treatment-specific mechanisms discussed in this work are purely hypothetical. Third, the Cluster 2 subgroup (n = 8) is very small and vulnerable to important confounding by indication. The graphomotor decline observed in this group cannot be conclusively attributed to CNS depressant treatment, as the acute clinical conditions that led to treatment (severe insomnia, anxiety, or psychomotor agitation) provide a significant alternative explanation. Fourth, the 14-day observation period is insufficient to assess long-term cognitive stabilization or structural neuroplasticity and non-specific factors such as test–retest practice effects, analgesic pain relief and reduced hospitalization fatigue cannot be ruled out although it does capture short-term changes in neuromotor execution.
Lastly, cognitive stratification of our dataset utilized established clinical diagnoses (no impairment, MCI, and dementia) rather than concurrent longitudinal scoring with auxiliary scales at both T0 and T14. Future prospective studies should incorporate bi-temporal dCDT kinematics with standardized multi-domain psychometric batteries.
6. Novelty of the Study
This exploratory study investigates the possibility of converting the traditional cross-sectional cognitive screening tool, the Clock Drawing Test, into a dynamic short-term monitoring indicator over the course of a 14-day geriatric hospitalization. Our methodology explores the variations of quantitative geometric and kinematic parameters that accompany multimodal inpatient rehabilitation and sedative exposure by analyzing paired drawings at admission (T0) and discharge (T14). Moreover, the combination of these graphomotor indicators with the clinical comorbidity profile in a participant-level cross-validated machine learning framework (Random Forest and Multilayer Perceptron) offers a hypothesis-generating perspective on the relationship between cardiometabolic burden and iatrogenic factors and visuomotor execution in a real-world clinical setting.
7. Conclusions
Despite the small sample size (N = 90), short follow-up (14 days), observational design, and absence of a randomized control group, the present study offers exploratory, proof-of-concept evidence of the utility of computational and longitudinal CDT analysis in geriatric inpatients.
Chronological age is the major baseline predictor of cognitive stratification, as evidenced by cross-validated predictive models. It also interacts tightly with cardiovascular, metabolic and affective comorbidities throughout the cognitive continuum. Using rigorous participant-level 5-fold stratified cross-validation, both the regularized Random Forest and Multilayer Perceptron models attained balanced accuracies of 86.00% and 88.13%, respectively, indicating successful internal cross-validation within our cohort. However, external validation in larger, independent multi-center cohorts is required to confirm model generalizability.
Furthermore, longitudinal observations suggest that paired CDT assessments at admission and discharge reveal short-term changes in graphomotor execution, such as improved contour closure and pressure stability after multimodal inpatient rehabilitation or exploratory micrographia and spatial disarray in patients with acute neuropsychiatric symptoms and CNS depressant exposure, while core conceptual time-representation deficits remain stable over a two-week period. Bi-temporal graphomotor metrics in combination with machine learning frameworks provide an exploratory hypothesis-generating approach to track functional visuomotor trajectories during short-term inpatient care, rather than establishing causative efficacy of individual drugs or physical modalities.
The average SSIM between T0 and T14 was 0.7494 ± 0.1016, suggesting a moderate to high structural similarity with substantial individual variability. Average SSIM values at T0 and T14 were 0.7527 ± 0.0609 and 0.7352 ± 0.0687, respectively, relative to the reference clock. These results indicate a slight shift in whole-image structural similarity at discharge, reflecting variations in drawing scale and alignment rather than clinical deterioration. Our results indicate that SSIM may serve as a complementary quantitative measure to monitor visuospatial and motor changes in geriatric patients. However, global SSIM should be interpreted together with traditional clinical CDT scoring, as it does not independently assess numeral placement or hand position.
Author Contributions
Conceptualization, M.G. and S.M.; methodology, M.G. and L.L.A.A.; software, S.M. and L.L.A.A.; validation, S.M., M.G. and A.R.; formal analysis, S.M., M.G. and A.R.; investigation, M.G.; resources, M.G.; data curation, A.R.; writing—original draft preparation, M.G.; writing—review and editing, A.R. and L.L.A.A.; visualization, S.M., M.G. and A.R.; supervision, A.R. and L.L.A.A.; project administration, M.G.; funding acquisition, S.M., M.G., A.R. and L.L.A.A. All authors have read and agreed to the published version of the manuscript.
Funding
This research received no external funding.
Institutional Review Board Statement
The study was conducted in accordance with the Declaration of Helsinki, and approved by the Institutional Ethics Committee of County Hospital “Saint Apostle Andrew” Galați, (reg. no. 25,699 dated 18 November 2025), the Ethics Committee of the Galați College of Physicians (reg. no. 1361 dated 2 December 2025), the competent ethics committee (ref. no. 4509 dated 25 February 2026) and the Head of Department (based on request no. 25,700 dated 7 November 2025).
Informed Consent Statement
Informed consent was obtained from all subjects involved in the study. In the case of patients with dementia and impaired decision-making capacity, written informed consent was obtained from their legally authorized representatives. Written informed consent has been obtained from the patients or their representatives to publish this paper. To ensure confidentiality, patient names and other personal data were not included in the dataset analysis and were replaced by numerical identifiers. Additionally, typical graphical phenotypes during offline optical calibration are depicted in the example reference sketches shown in Figure 1. The authors generated these sketches and they are not part of the clinical or machine learning datasets, and thus do not need specific patient permissions.
Data Availability Statement
The original contributions presented in the study are included in the article, further inquiries can be directed to the corresponding authors.
Conflicts of Interest
The authors declare no conflicts of interest.
Abbreviations
| AI | Artificial Intelligence |
| ANOVA | Analysis of Variance |
| CDSS | Clinical Decision Support System |
| CDT | Clock Drawing Test |
| CERAD | Consortium to Establish a Registry for Alzheimer’s Disease |
| CI | Confidence Interval |
| dCDT | Digital Clock Drawing Test |
| DPI | Dots Per Inch |
| HTA | Arterial Hypertension |
| KDE | Kernel Density Estimation |
| MCC | Matthews Correlation Coefficient |
| MCI | Mild Cognitive Impairment |
| MLP | Multilayer Perceptron |
| NMDA | N-Methyl-D-Aspartate |
| OOF | Out-of-Fold |
| PCA | Principal Component Analysis |
| PET | Positron Emission Tomography |
| PPV | Positive Predictive Value |
| RATPT | Ratio of Air Time to Paper Time |
| RF | Random Forest |
| SCV | Stratified Cross-Validation |
| SD | Standard Deviation |
| TECAR | Capacitive and Resistive Electric Transfer |
| SSIM | Structural Similarity Index |
References
- Ferri, C.P.; Prince, M.; Brayne, C.; Brodaty, H.; Fratiglioni, L.; Ganguli, M.; Hall, K.; Hasegawa, K.; Hendrie, H.; Huang, Y.; et al. Global prevalence of dementia: A Delphi consensus study. Lancet 2005, 366, 2112–2117. [Google Scholar] [CrossRef] [Scilit] [PubMed]
- Petersen, R.C. Mild cognitive impairment as a diagnostic entity. J. Intern. Med. 2004, 256, 183–194. [Google Scholar] [CrossRef] [Scilit] [PubMed]
- Hugo, J.; Ganguli, M. Dementia and cognitive impairment: Epidemiology, diagnosis, and treatment. Clin. Geriatr. Med. 2014, 30, 421–442. [Google Scholar] [CrossRef] [Scilit] [PubMed]
- Morris, J.C. Mild cognitive impairment is early-stage Alzheimer disease: Time to revise diagnostic criteria. Arch. Neurol. 2006, 63, 15–16. [Google Scholar] [CrossRef] [Scilit] [PubMed]
- Bowen, J.; Teri, L.; Kukull, W.; McCormick, W.; McCurry, S.M.; Larson, E.B. Progression to dementia in patients with isolated memory loss. Lancet 1997, 349, 763–765. [Google Scholar] [CrossRef] [Scilit] [PubMed]
- Pinto, E.; Peters, R. Literature review of the Clock Drawing Test as a tool for cognitive screening. Dement. Geriatr. Cogn. Disord. 2009, 27, 201–213. [Google Scholar] [CrossRef] [Scilit] [PubMed]
- Palsetia, D.; Rao, G.P.; Tiwari, S.C.; Lodha, P.; De Sousa, A. The Clock Drawing Test versus Mini-mental Status Examination as a Screening Tool for Dementia: A Clinical Comparison. Indian J. Psychol. Med. 2018, 40, 1–10. [Google Scholar] [CrossRef] [Scilit] [PubMed]
- Shulman, K.I. Clock-drawing: Is it the ideal cognitive screening test? Int. J. Geriatr. Psychiatry 2000, 15, 548–561. [Google Scholar] [CrossRef] [PubMed]
- Hazan, E.; Frankenburg, F.; Brenkel, M.; Shulman, K. The test of time: A history of clock drawing. Int. J. Geriatr. Psychiatry 2018, 33, e22–e30. [Google Scholar] [CrossRef] [Scilit] [PubMed]
- Park, J.; Jeong, E.; Seomun, G. The clock drawing test: A systematic review and meta-analysis of diagnostic accuracy. J. Adv. Nurs. 2018, 74, 2742–2754. [Google Scholar] [CrossRef] [Scilit] [PubMed]
- Juby, A.; Tench, S.; Baker, V. The value of clock drawing in identifying executive cognitive dysfunction in people with a normal Mini-Mental State Examination score. Can. Med. Assoc. J. 2002, 167, 859–864. [Google Scholar]
- Sunderland, T.; Hill, J.L.; Mellow, A.M.; Lawlor, B.A.; Gundersheimer, J.; Newhouse, P.A.; Grafman, J.H. Clock drawing in Alzheimer’s disease. A novel measure of dementia severity. J. Am. Geriatr. Soc. 1989, 37, 725–729. [Google Scholar] [CrossRef] [Scilit] [PubMed]
- Rouleau, I.; Salmon, D.P.; Butters, N.; Kennedy, C.; McGuire, K. Quantitative and qualitative analyses of clock drawings in Alzheimer’s and Huntington’s disease. Brain Cogn. 1992, 18, 70–87. [Google Scholar] [CrossRef] [Scilit] [PubMed]
- Beber, B.C.; Kochhann, R.; Matias, B.; Chaves, M.L.F. The Clock Drawing Test: Performance differences between the free-drawn and incomplete-copy versions in patients with MCI and dementia. Dement. Neuropsychol. 2016, 10, 227–231. [Google Scholar] [CrossRef] [Scilit] [PubMed]
- Teixeira Fabricio, A.; Aprahamian, I.; Sanches Yassuda, M. Qualitative analysis of the Clock Drawing Test by educational level and cognitive profile. Arq. Neuropsiquiatr. 2014, 72, 289–295. [Google Scholar] [CrossRef] [Scilit] [PubMed]
- Riedel, O.; Klotsche, J.; Förstl, H.; Wittchen, H.U.; GEPAD Study Group. Clock drawing test: Is it useful for dementia screening in patients having Parkinson disease with and without depression? J. Geriatr. Psychiatry Neurol. 2013, 26, 151–157. [Google Scholar] [CrossRef] [Scilit] [PubMed]
- Chang, S.H.; Lin, H.L.; Qian, H.; Liu, Z.T.; Lu, J.; Zhong, B.L. Diagnostic accuracy of digital clock drawing test for Alzheimer disease and mild cognitive impairment. npj Digit. Med. 2026, 9, 503. [Google Scholar] [CrossRef] [Scilit] [PubMed]
- Müller, S.; Herde, L.; Preische, O.; Zeller, A.; Heymann, P.; Robens, S.; Elbing, U.; Laske, C. Diagnostic value of digital clock drawing test in comparison with CERAD neuropsychological battery total score for discrimination of patients in the early course of Alzheimer’s disease from healthy individuals. Sci. Rep. 2019, 9, 3543. [Google Scholar] [CrossRef] [Scilit] [PubMed]
- Souillard-Mandar, W.; Davis, R.; Rudin, C.; Au, R.; Libon, D.J.; Swenson, R.; Price, C.C.; Lamar, M.; Penney, D.L. Learning Classification Models of Cognitive Conditions from Subtle Behaviors in the Digital Clock Drawing Test. Mach. Learn. 2016, 102, 393–441. [Google Scholar] [CrossRef] [Scilit] [PubMed]
- Cohen, J.; Penney, D.L.; Davis, R.; Libon, D.J.; Swenson, R.A.; Ajilore, O.; Kumar, A.; Lamar, M. Digital Clock Drawing: Differentiating “thinking” versus “doing” in younger and older adults with depression. J. Int. Neuropsychol. Soc. 2014, 20, 920–928. [Google Scholar] [CrossRef] [Scilit] [PubMed]
- Davoudi, A.; Dion, C.; Amini, S.; Tighe, P.J.; Price, C.C.; Libon, D.J.; Rashidi, P. Classifying Non-Dementia and Alzheimer’s Disease/Vascular Dementia Patients Using Kinematic, Time-Based, and Visuospatial Parameters of Digital Clock Drawing Test. J. Alzheimers Dis. 2021, 82, 47–57. [Google Scholar] [CrossRef] [Scilit] [PubMed]
- Dion, C.; Arias, F.; Amini, S.; Davis, R.; Penney, D.; Libon, D.J.; Price, C.C. Cognitive correlates of digital clock drawing metrics in older adults with and without mild cognitive impairment. J. Alzheimers Dis. 2020, 75, 73–83. [Google Scholar] [CrossRef] [Scilit] [PubMed]
- Rentz, D.M.; Papp, K.V.; Mayblyum, D.V.; Sanchez, J.S.; Klein, H.; Souillard-Mandar, W.; Sperling, R.A.; Johnson, K.A. Association of digital clock drawing with PET amyloid and tau pathology in normal older adults. Neurology 2021, 96, e1844–e1854. [Google Scholar] [CrossRef] [Scilit] [PubMed]
- Yuan, J.; Au, R.; Karjadi, C.; Ang, T.F.; Devine, S.; Auerbach, S.; DeCarli, C.; Lin, H. Associations between the digital clock drawing test and brain volume: Large community-based Framingham Heart Study. J. Med. Internet Res. 2022, 24, e34513. [Google Scholar] [CrossRef] [Scilit] [PubMed]
- Chan, J.Y.C.; Bat, B.K.K.; Wong, A.; Chan, T.K.; Huo, Z.; Yip, B.H.K.; Kowk, T.C.Y.; Tsoi, K.K.F. Evaluation of digital drawing tests and paper-and-pencil drawing tests for the screening of mild cognitive impairment and dementia: A systematic review and meta-analysis of diagnostic studies. Neuropsychol. Rev. 2022, 32, 566–576. [Google Scholar] [CrossRef] [Scilit] [PubMed]
- Binaco, R.; Calzaretto, N.; Epifano, J.; McGuire, S.; Umer, M.; Emrani, S.; Wasserman, V.; Libon, D.J.; Polikar, R. Machine learning analysis of digital clock drawing test performance for differential classification of mild cognitive impairment subtypes versus Alzheimer’s disease. J. Int. Neuropsychol. Soc. 2020, 26, 690–700. [Google Scholar] [CrossRef] [Scilit] [PubMed]
- Matusz, E.F.; Price, C.C.; Lamar, M.; Swenson, R.; Au, R.; Emrani, S.; Wasserman, V.; Penney, D.L.; Libon, D.J. Dissociating Statistically Determined Normal Cognitive Abilities and Mild Cognitive Impairment Subtypes with Connected Speech and Digital Clock Drawing. J. Int. Neuropsychol. Soc. 2023, 29, 148–158. [Google Scholar] [CrossRef] [Scilit] [PubMed]
- Amini, S.; Zhang, L.; Hao, B.; Gupta, A.; Song, M.; Karjadi, C.; Lin, H.; Kolachalama, V.B.; Au, R.; Paschalidis, I.C. An artificial intelligence-assisted method for dementia detection using images from the clock drawing test. J. Alzheimers Dis. 2021, 83, 581–589. [Google Scholar] [CrossRef] [Scilit] [PubMed]
- Sato, K.; Niimi, Y.; Mano, T.; Iwata, A.; Iwatsubo, T. Automated evaluation of conventional clock-drawing test using deep neural network: Potential as a mass screening tool to detect individuals with cognitive decline. Front. Neurol. 2022, 13, 896403. [Google Scholar] [CrossRef] [Scilit] [PubMed]
- Vabalas, A.; Gowen, E.; Poliakoff, E.; Casson, A.J. Machine learning algorithm validation with a limited sample size. PLoS ONE 2019, 14, e0224365. [Google Scholar] [CrossRef] [Scilit] [PubMed]
- Collins, G.S.; Moons, K.G.M.; Dhiman, P.; Riley, R.D.; Beam, A.L.; Van Calster, B.; Ghassemi, M.; Liu, X.; Reitsma, J.B.; van Smeden, M.; et al. TRIPOD+AI statement: Updated guidance for reporting clinical prediction models that use regression or machine learning methods. BMJ 2024, 385, e078378. [Google Scholar] [CrossRef] [Scilit] [PubMed]
- Poldrack, R.A.; Huckins, G.; Varoquaux, G. Establishment of best practices for evidence for prediction: A review. JAMA Psychiatry 2020, 77, 534–540. [Google Scholar] [CrossRef] [Scilit] [PubMed]
- Grecu, M.; Romila, A.; Moldovanu, S.; Condratovici-Plesa, A.; Anghel, L.; Oprea, V.D.; Bocancia, L.A. Early-stage research and new pharmacological targets in the management of Alzheimer’s dementia—A review of the literature. Balneo PRM Res. J. 2026, 17, 1024. [Google Scholar]
- Grecu, M.; Romilă, A.; Moldovanu, S.; Tănase, C.; Oprea, D. Impact of exercise on geriatric neurodegenerative disease management. Ann. “Dunarea de Jos” Univ. Galati Fascicle XV Phys. Educ. Sport Manag. 2026, 2, 146–157. [Google Scholar] [CrossRef] [Scilit]
- Apescaritei Apostol, L.L.; Ștefan, C.S.; Grecu, M.; Moldovanu, S.; Verga, G.I.; Lungu, M.; Prada, G.I.; Romila, A. Comparative Analysis by Machine Learning of Geriatric Frailty and Alzheimer’s Disease Classification Using Independent Datasets. Life 2026, 16, 1324. [Google Scholar] [CrossRef] [Scilit] [PubMed]
- Werner, P.; Rosenblum, S.; Bar-On, G.; Heinik, J.; Korczyn, A. Handwriting process variables discriminating mild Alzheimer’s disease and mild cognitive impairment. J. Gerontol. B Psychol. Sci. Soc. Sci. 2006, 61, P228–P234. [Google Scholar] [CrossRef] [Scilit] [PubMed]
- Impedovo, D.; Pirlo, G. Dynamic handwriting analysis for the assessment of neurodegenerative diseases: A pattern recognition perspective. IEEE Rev. Biomed. Eng. 2018, 12, 209–220. [Google Scholar] [CrossRef] [Scilit] [PubMed]
- Kawa, J.; Bednorz, A.; Stępień, P.; Derejczyk, J.; Bugdol, M. Spatial and dynamical handwriting features in patients with mild cognitive impairment and dementia. Artif. Intell. Med. 2022, 128, 102295. [Google Scholar]
- Nagasaki, H.; Itoh, H.; Hashizume, K.; Furuna, T.; Maruyama, H.; Kinugasa, T. Walking patterns and finger rhythm of older adults. Percept. Mot. Ski. 1996, 82, 435–447. [Google Scholar] [CrossRef] [Scilit] [PubMed]
- Osti, R.; Pari, C.; Salvatori, G.; Massari, L. Tri-length laser therapy associated to TECAR therapy in the treatment of knee osteoarthritis. Lasers Med. Sci. 2015, 30, 407–412. [Google Scholar] [CrossRef] [Scilit] [PubMed]
- Masliah, E.; Díez-Tejedor, E. The pharmacology of neurotrophic treatment with Cerebrolysin: Brain protection and repair to counteract pathologies of acute and chronic neurological disorders. Drugs Today 2012, 48, 3–24. [Google Scholar] [CrossRef] [Scilit] [PubMed]
- Guekht, A.; Vester, J.; Heiss, W.D.; Gusev, E.; Hoemberg, V.; Rahlfs, V.W.; Bajenaru, O.; Popescu, B.O.; Doppler, E.; Winter, S.; et al. Safety and efficacy of Cerebrolysin in motor function recovery after stroke: A meta-analysis of the CARS trials. Neurol. Sci. 2017, 38, 1761–1769. [Google Scholar] [CrossRef] [Scilit] [PubMed]
- Gauthier, S.; Schlaefke, S. Efficacy and tolerability of Ginkgo biloba extract EGb 761 in dementia: A systematic review and meta-analysis of randomized placebo-controlled trials. Clin. Interv. Aging 2014, 9, 2065–2077. [Google Scholar] [CrossRef] [Scilit] [PubMed]
- Gradinaru, D.; Ungurianu, A.; Margina, D.; Moreno-Villanueva, M.; Bürkle, A. Procaine-based formulations: Molecular mechanisms and geriatric applications in vascular and neuromotor aging. Exp. Gerontol. 2021, 154, 111521. [Google Scholar]
- Reisberg, B.; Doody, R.; Stöffler, A.; Schmitt, F.; Ferris, S.; Möbius, H.J. Memantine in moderate-to-severe Alzheimer’s disease. N. Engl. J. Med. 2003, 348, 1333–1341. [Google Scholar] [CrossRef] [Scilit] [PubMed]
- Billioti de Gage, S.; Pariente, A.; Bégaud, B. Is there really a link between benzodiazepine use and the risk of dementia? Expert Opin. Drug Saf. 2015, 14, 733–747. [Google Scholar] [CrossRef] [Scilit] [PubMed]
- Kourtis, L.C.; Regele, O.B.; Wright, J.M.; Jones, G.B. Digital biomarkers for Alzheimer’s disease: The mobile/wearable devices opportunity. npj Digit. Med. 2019, 2, 9. [Google Scholar] [CrossRef] [Scilit] [PubMed]
- De Vrijer, M.; Nissen, K.; Van der Flier, W.M.; Sikkes, S.A.M. Longitudinal digital cognitive monitoring in preclinical and prodromal Alzheimer’s disease: A systematic review. Alzheimers Dement. 2024, 20, 2145–2160. [Google Scholar]
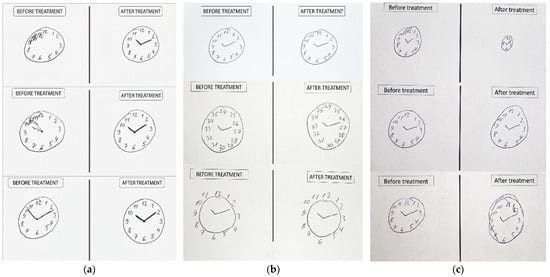
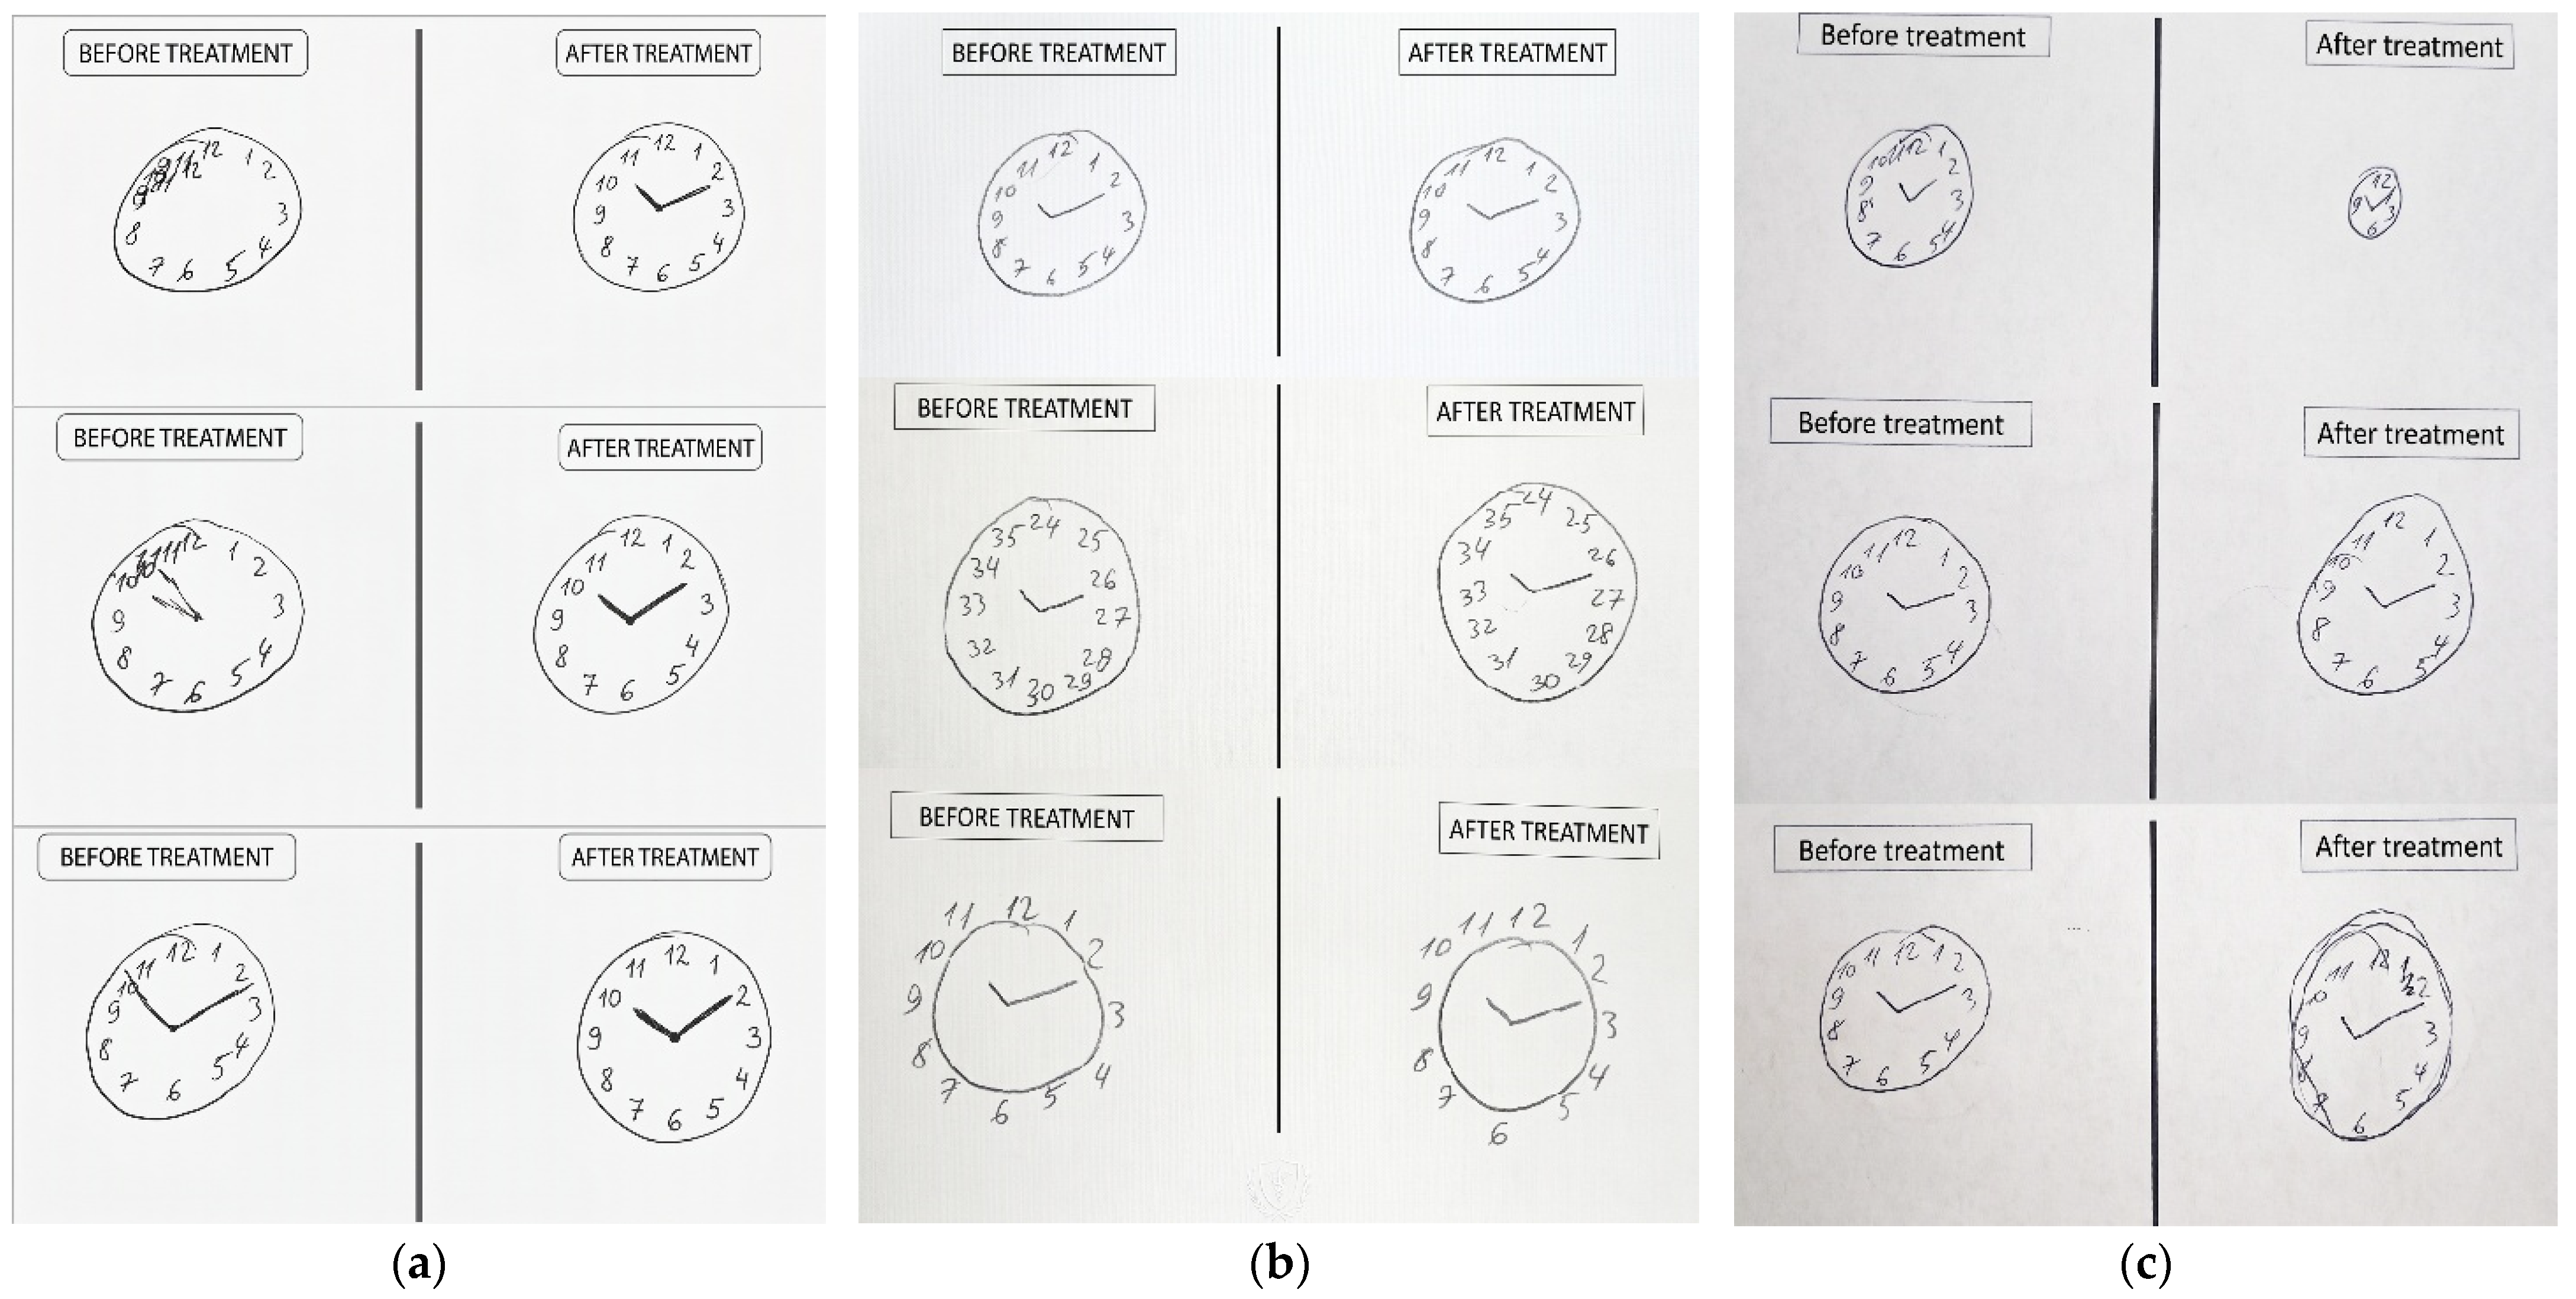
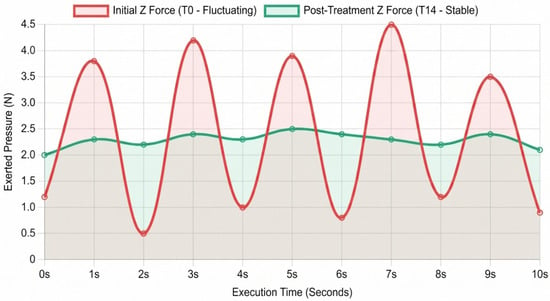
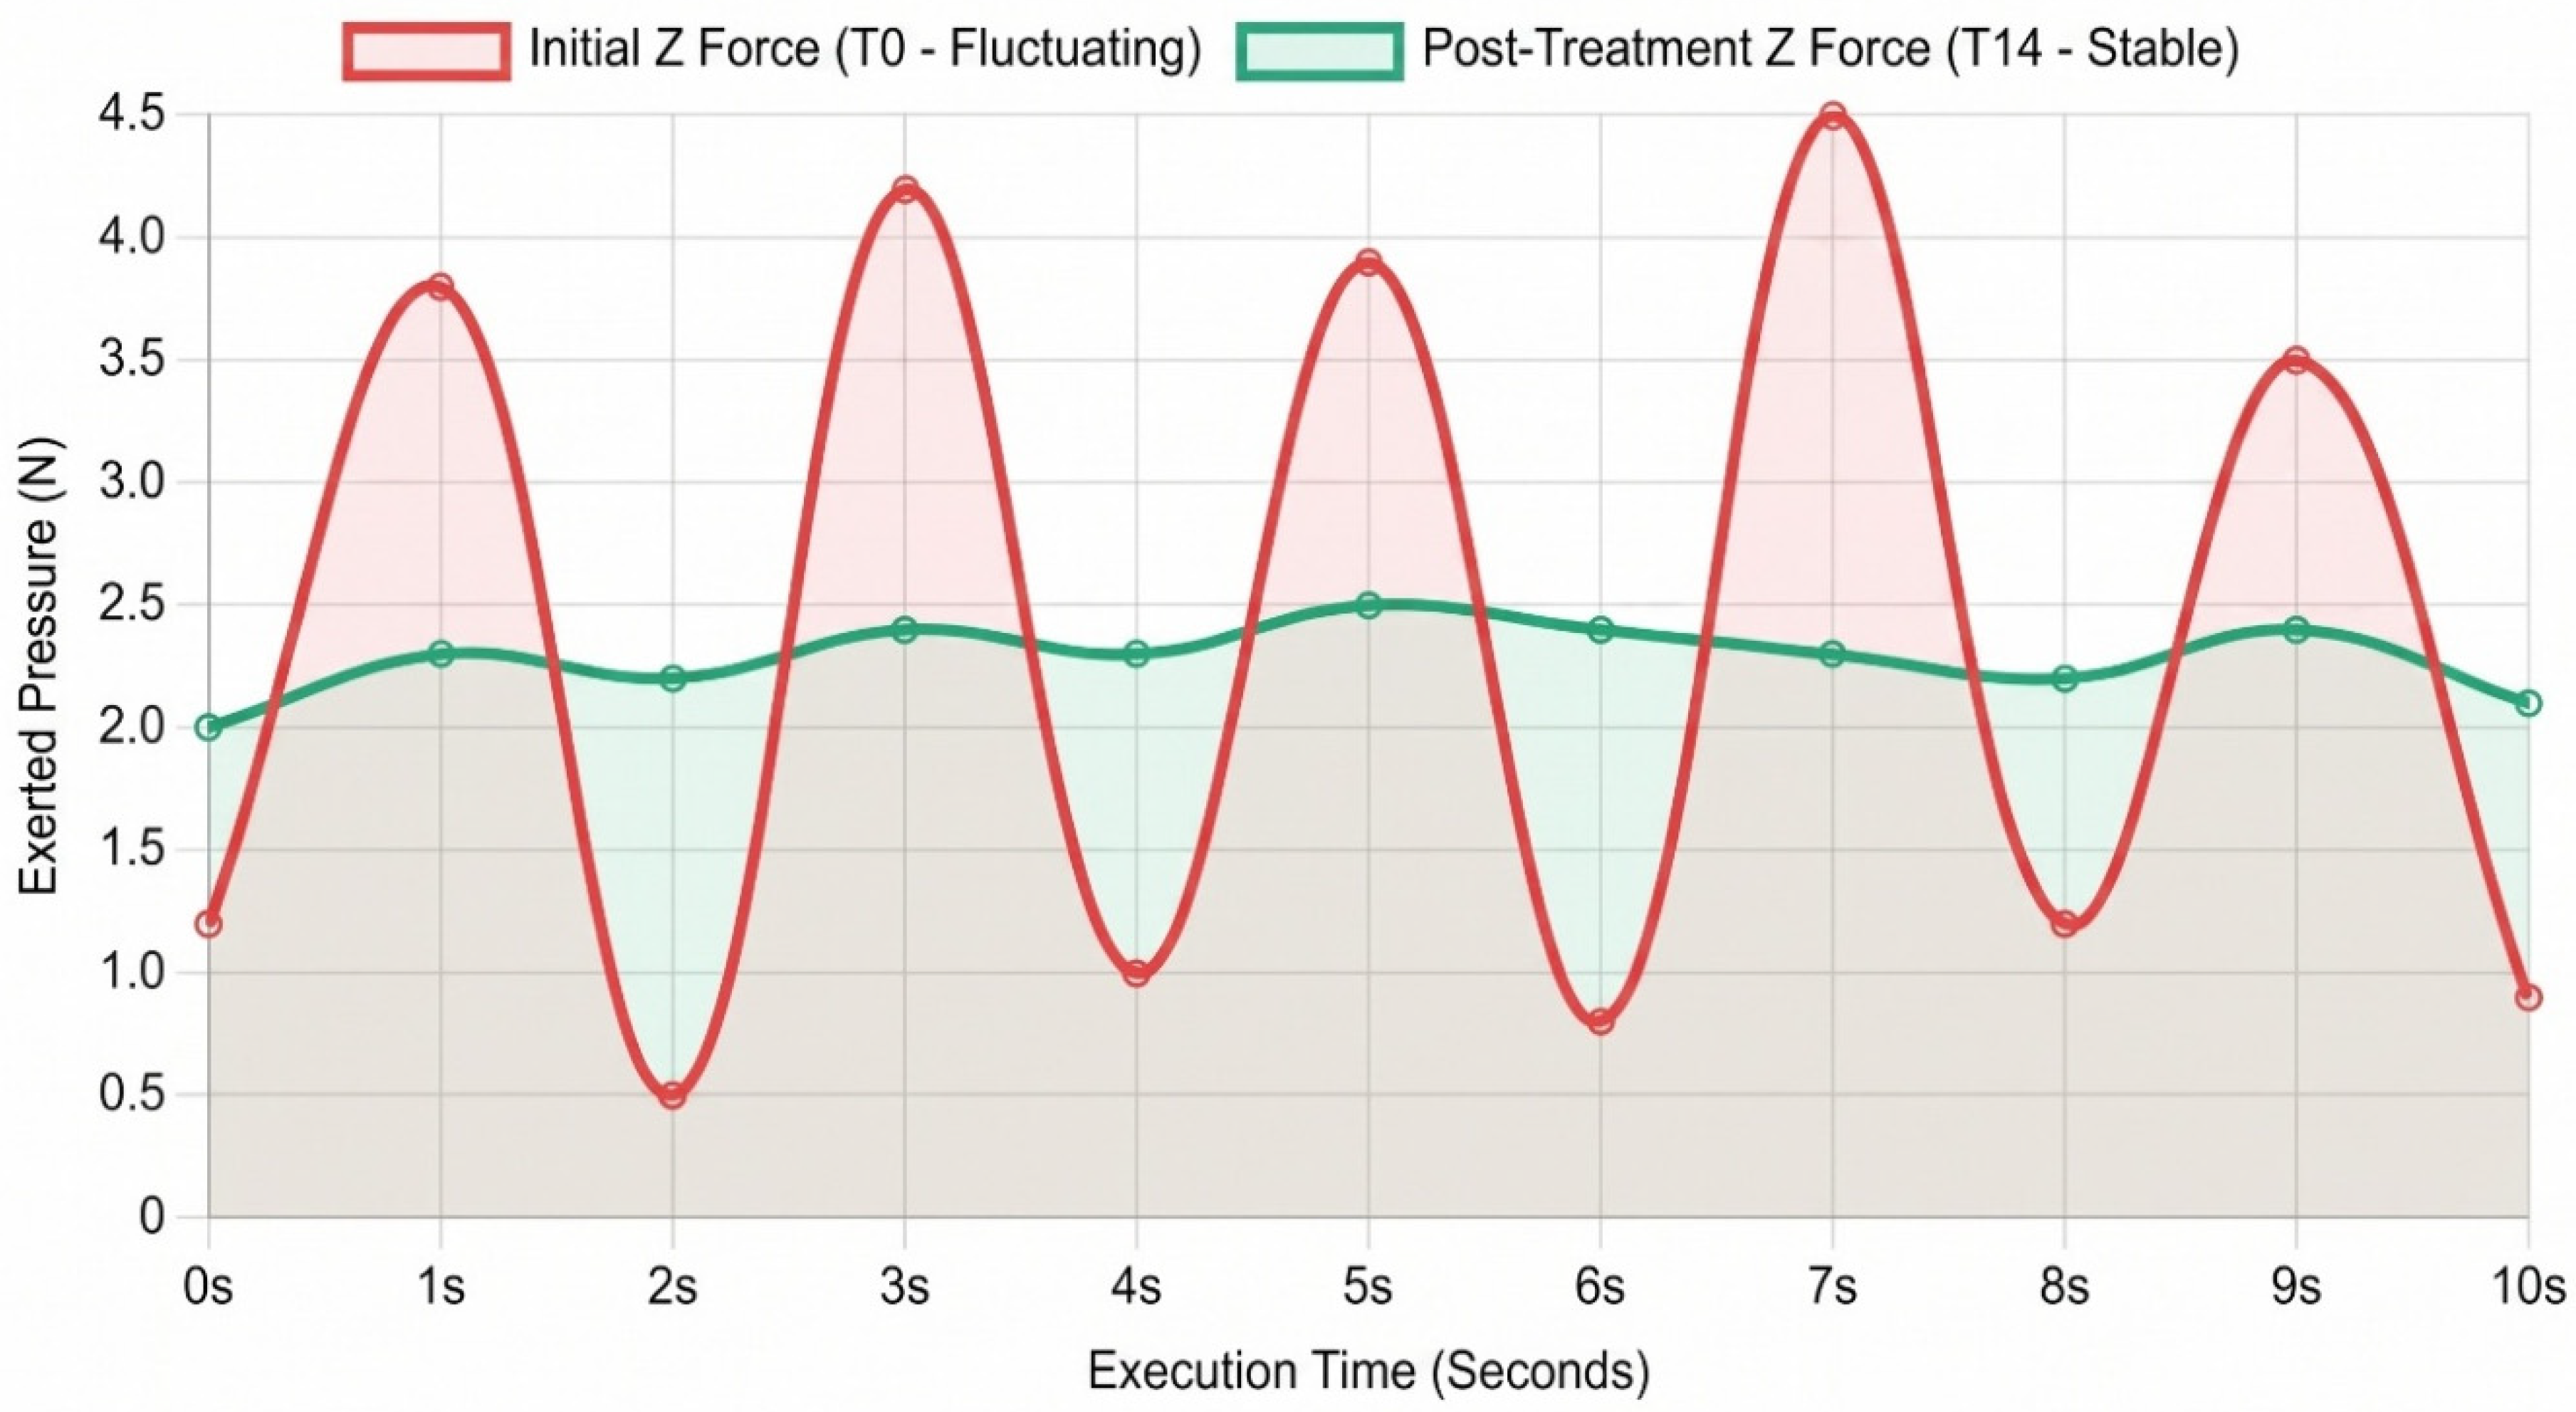
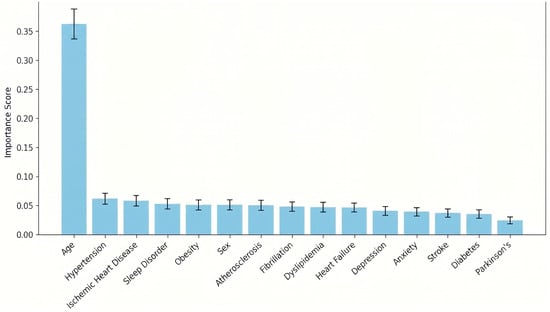
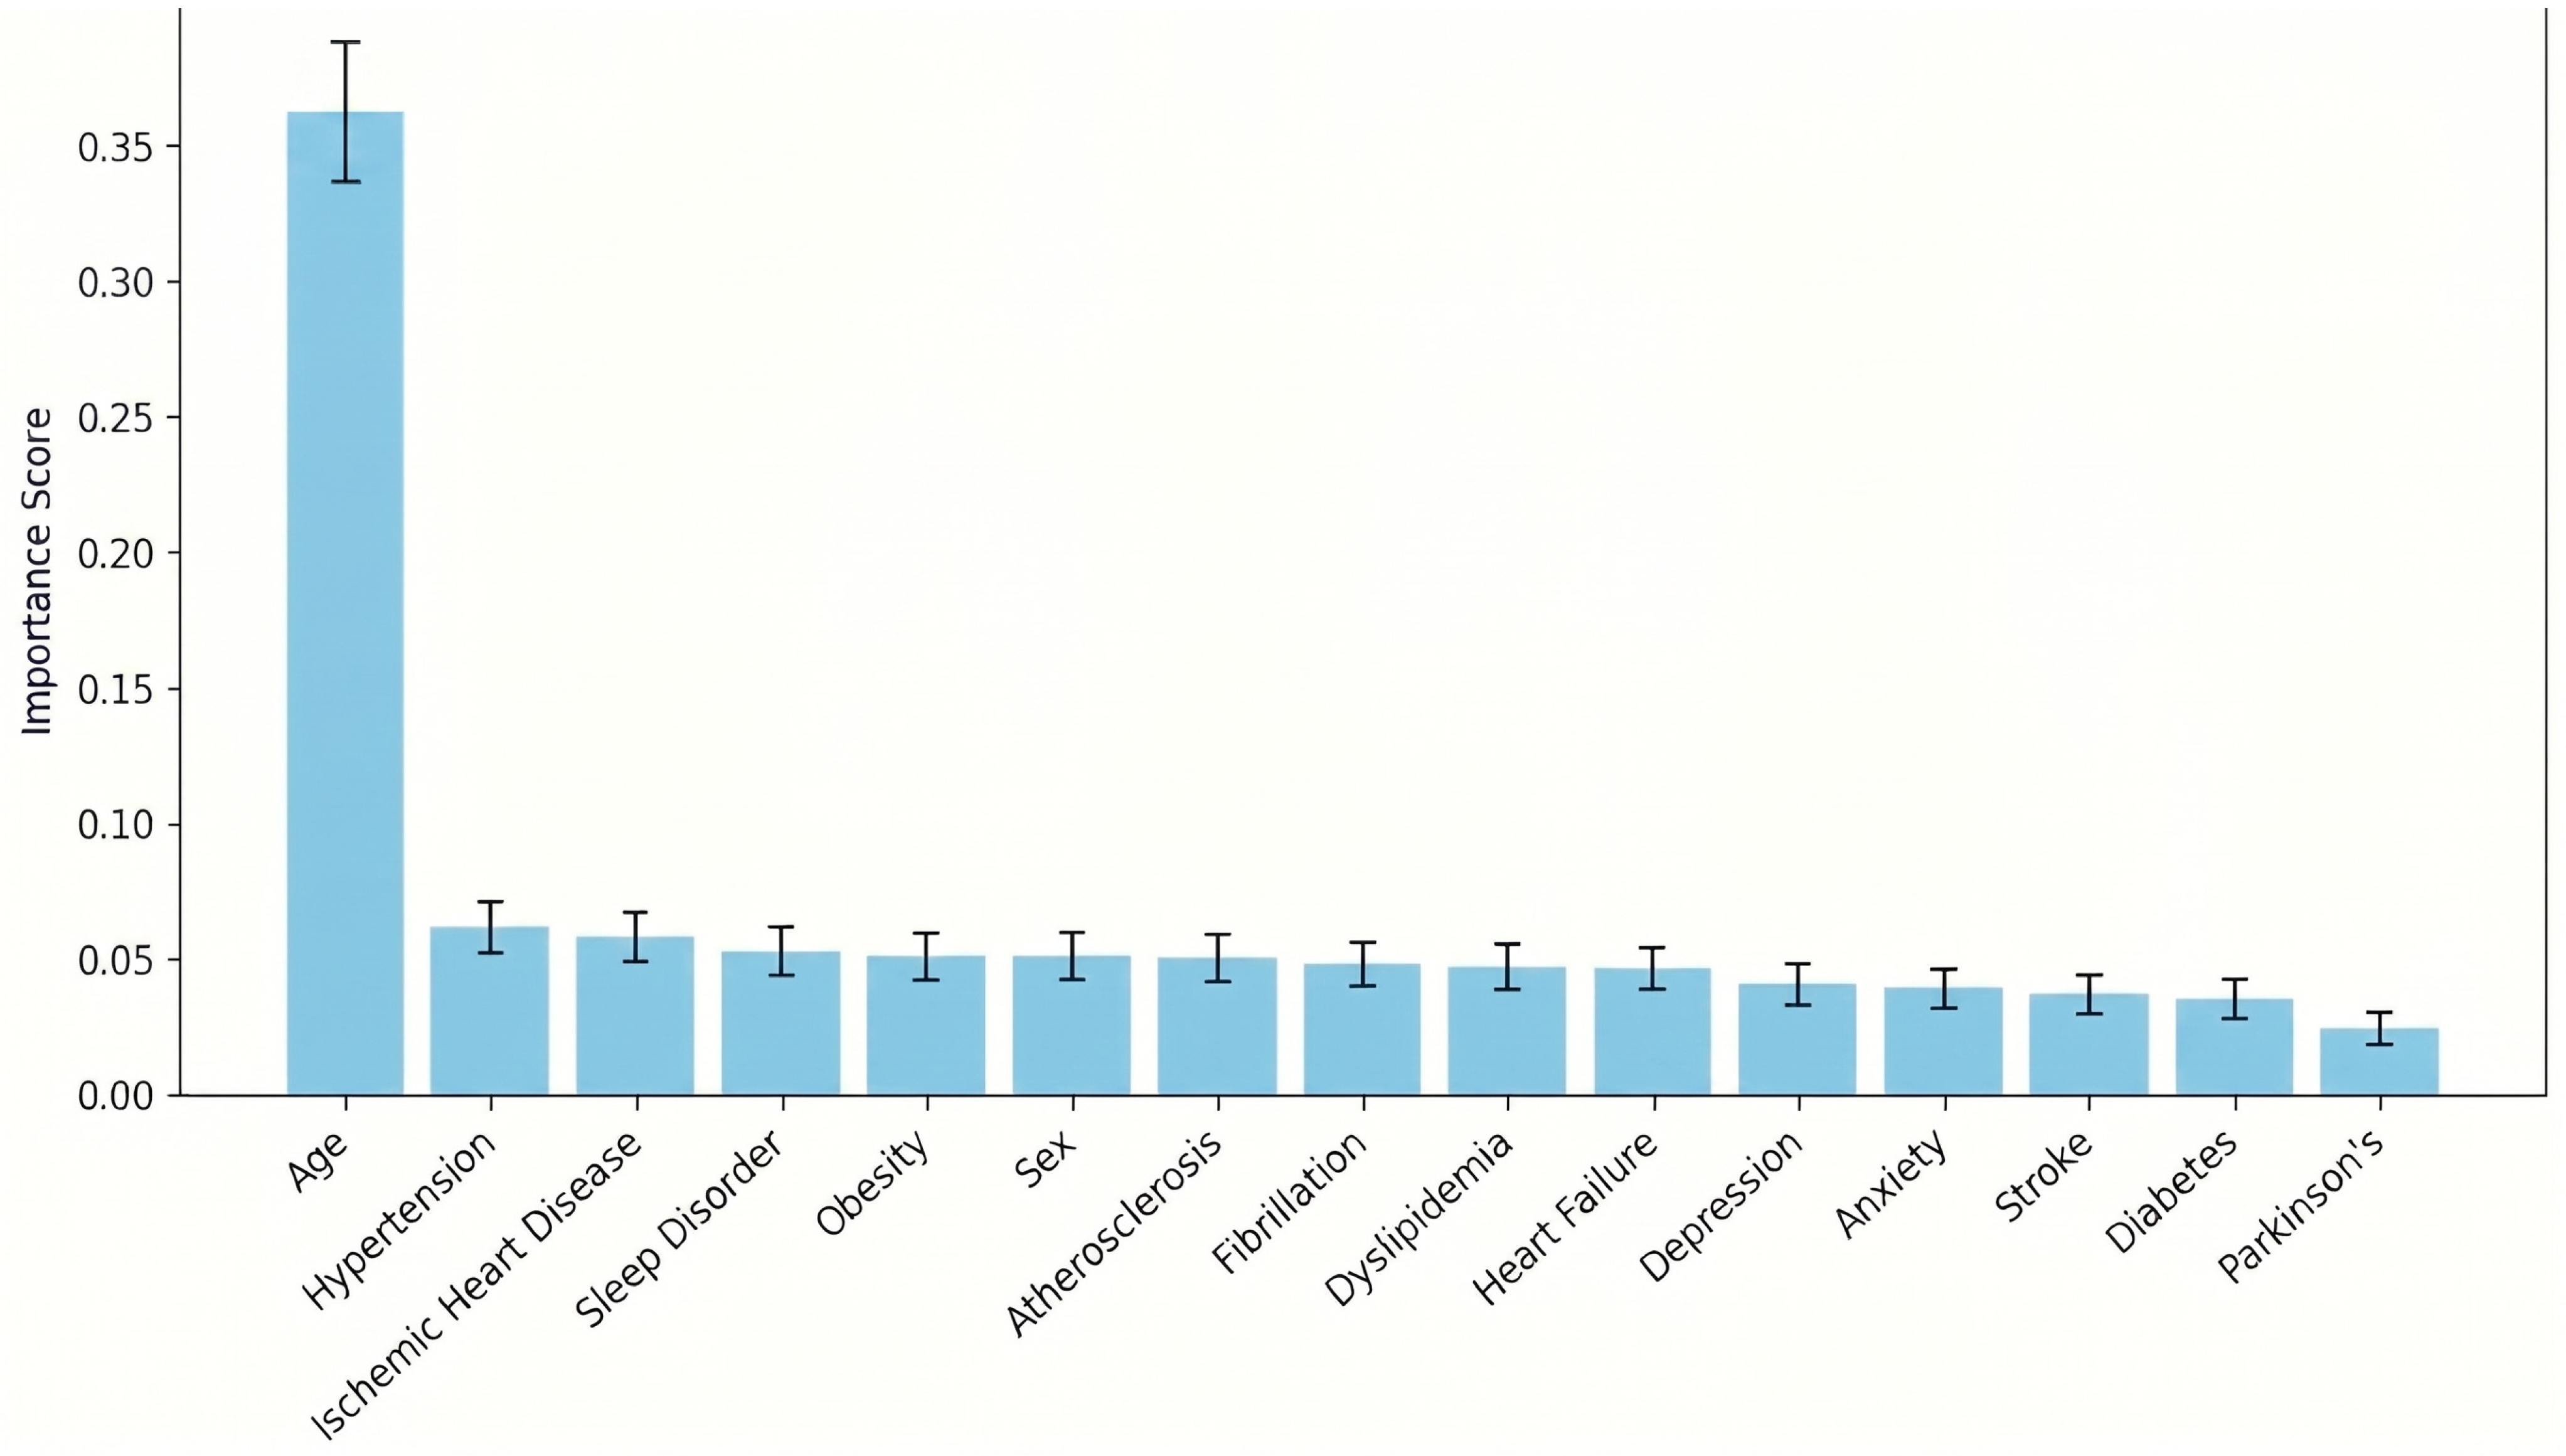
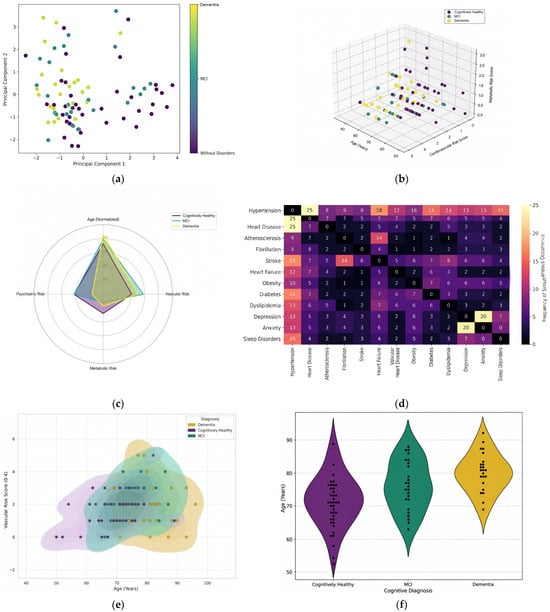
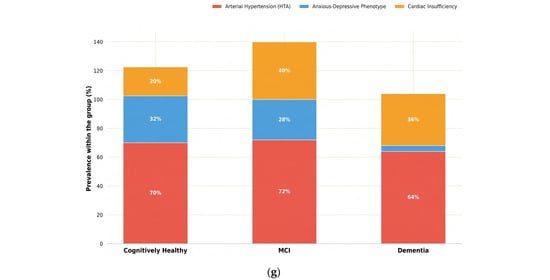
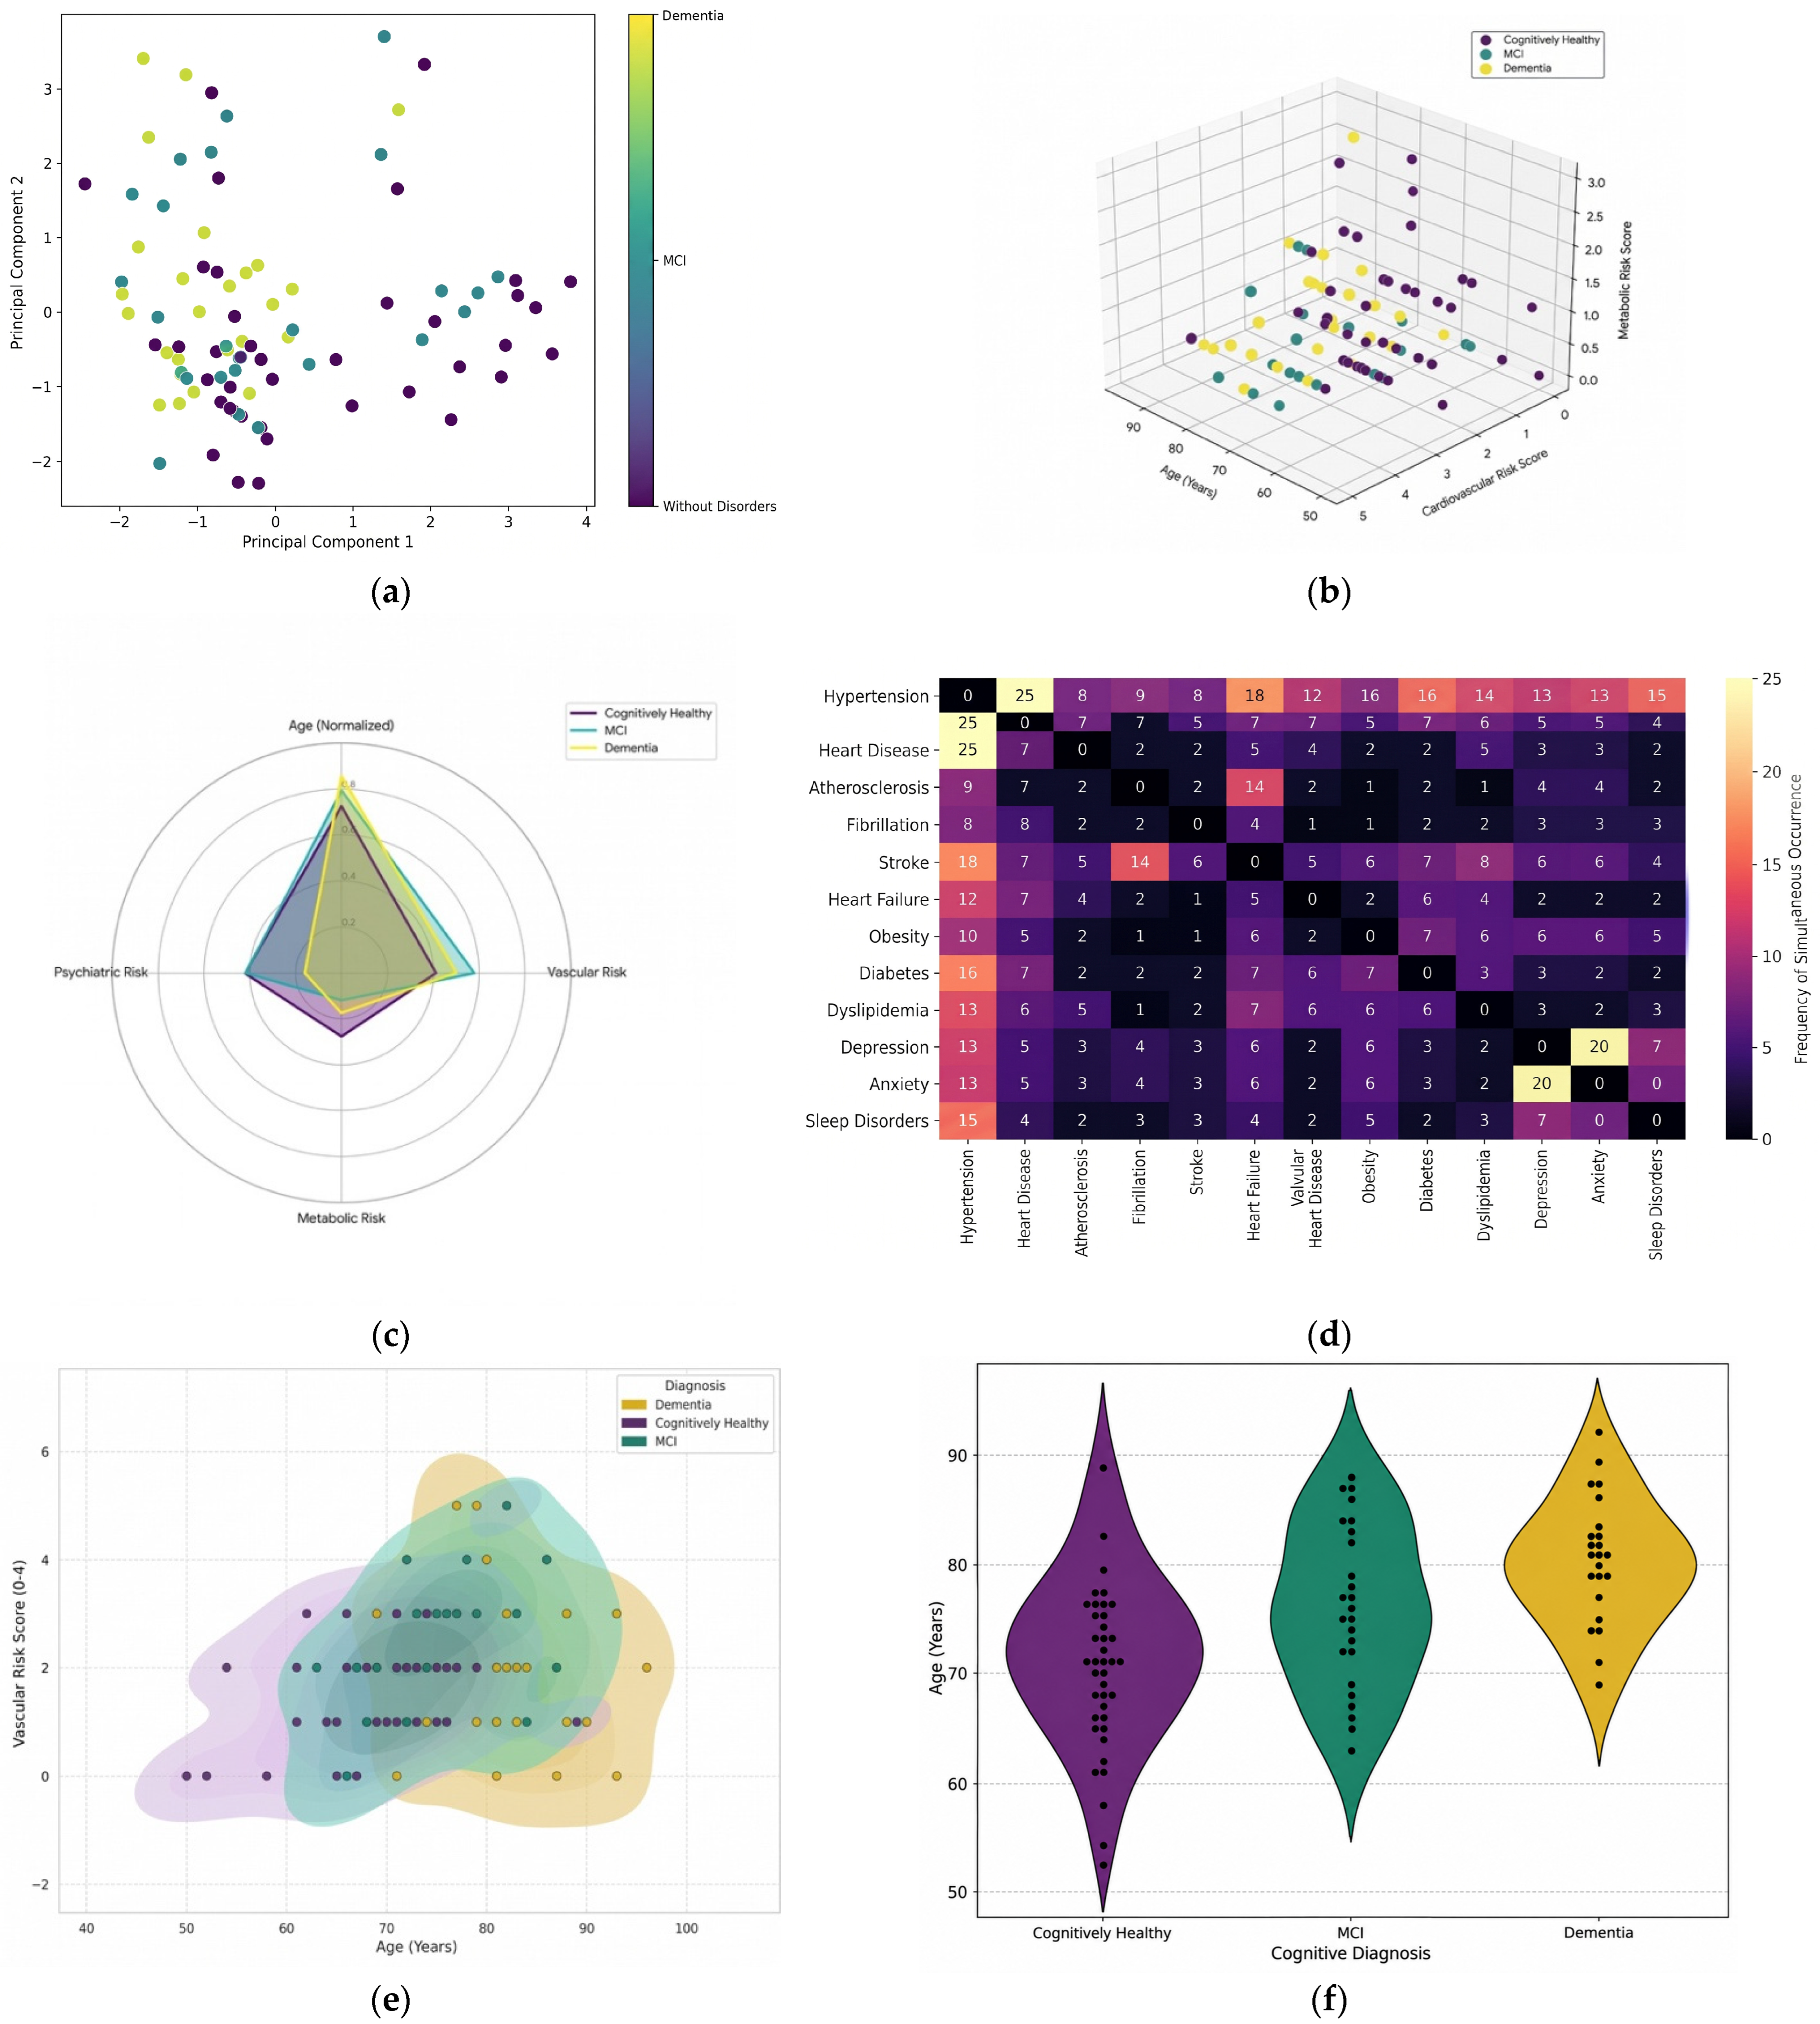
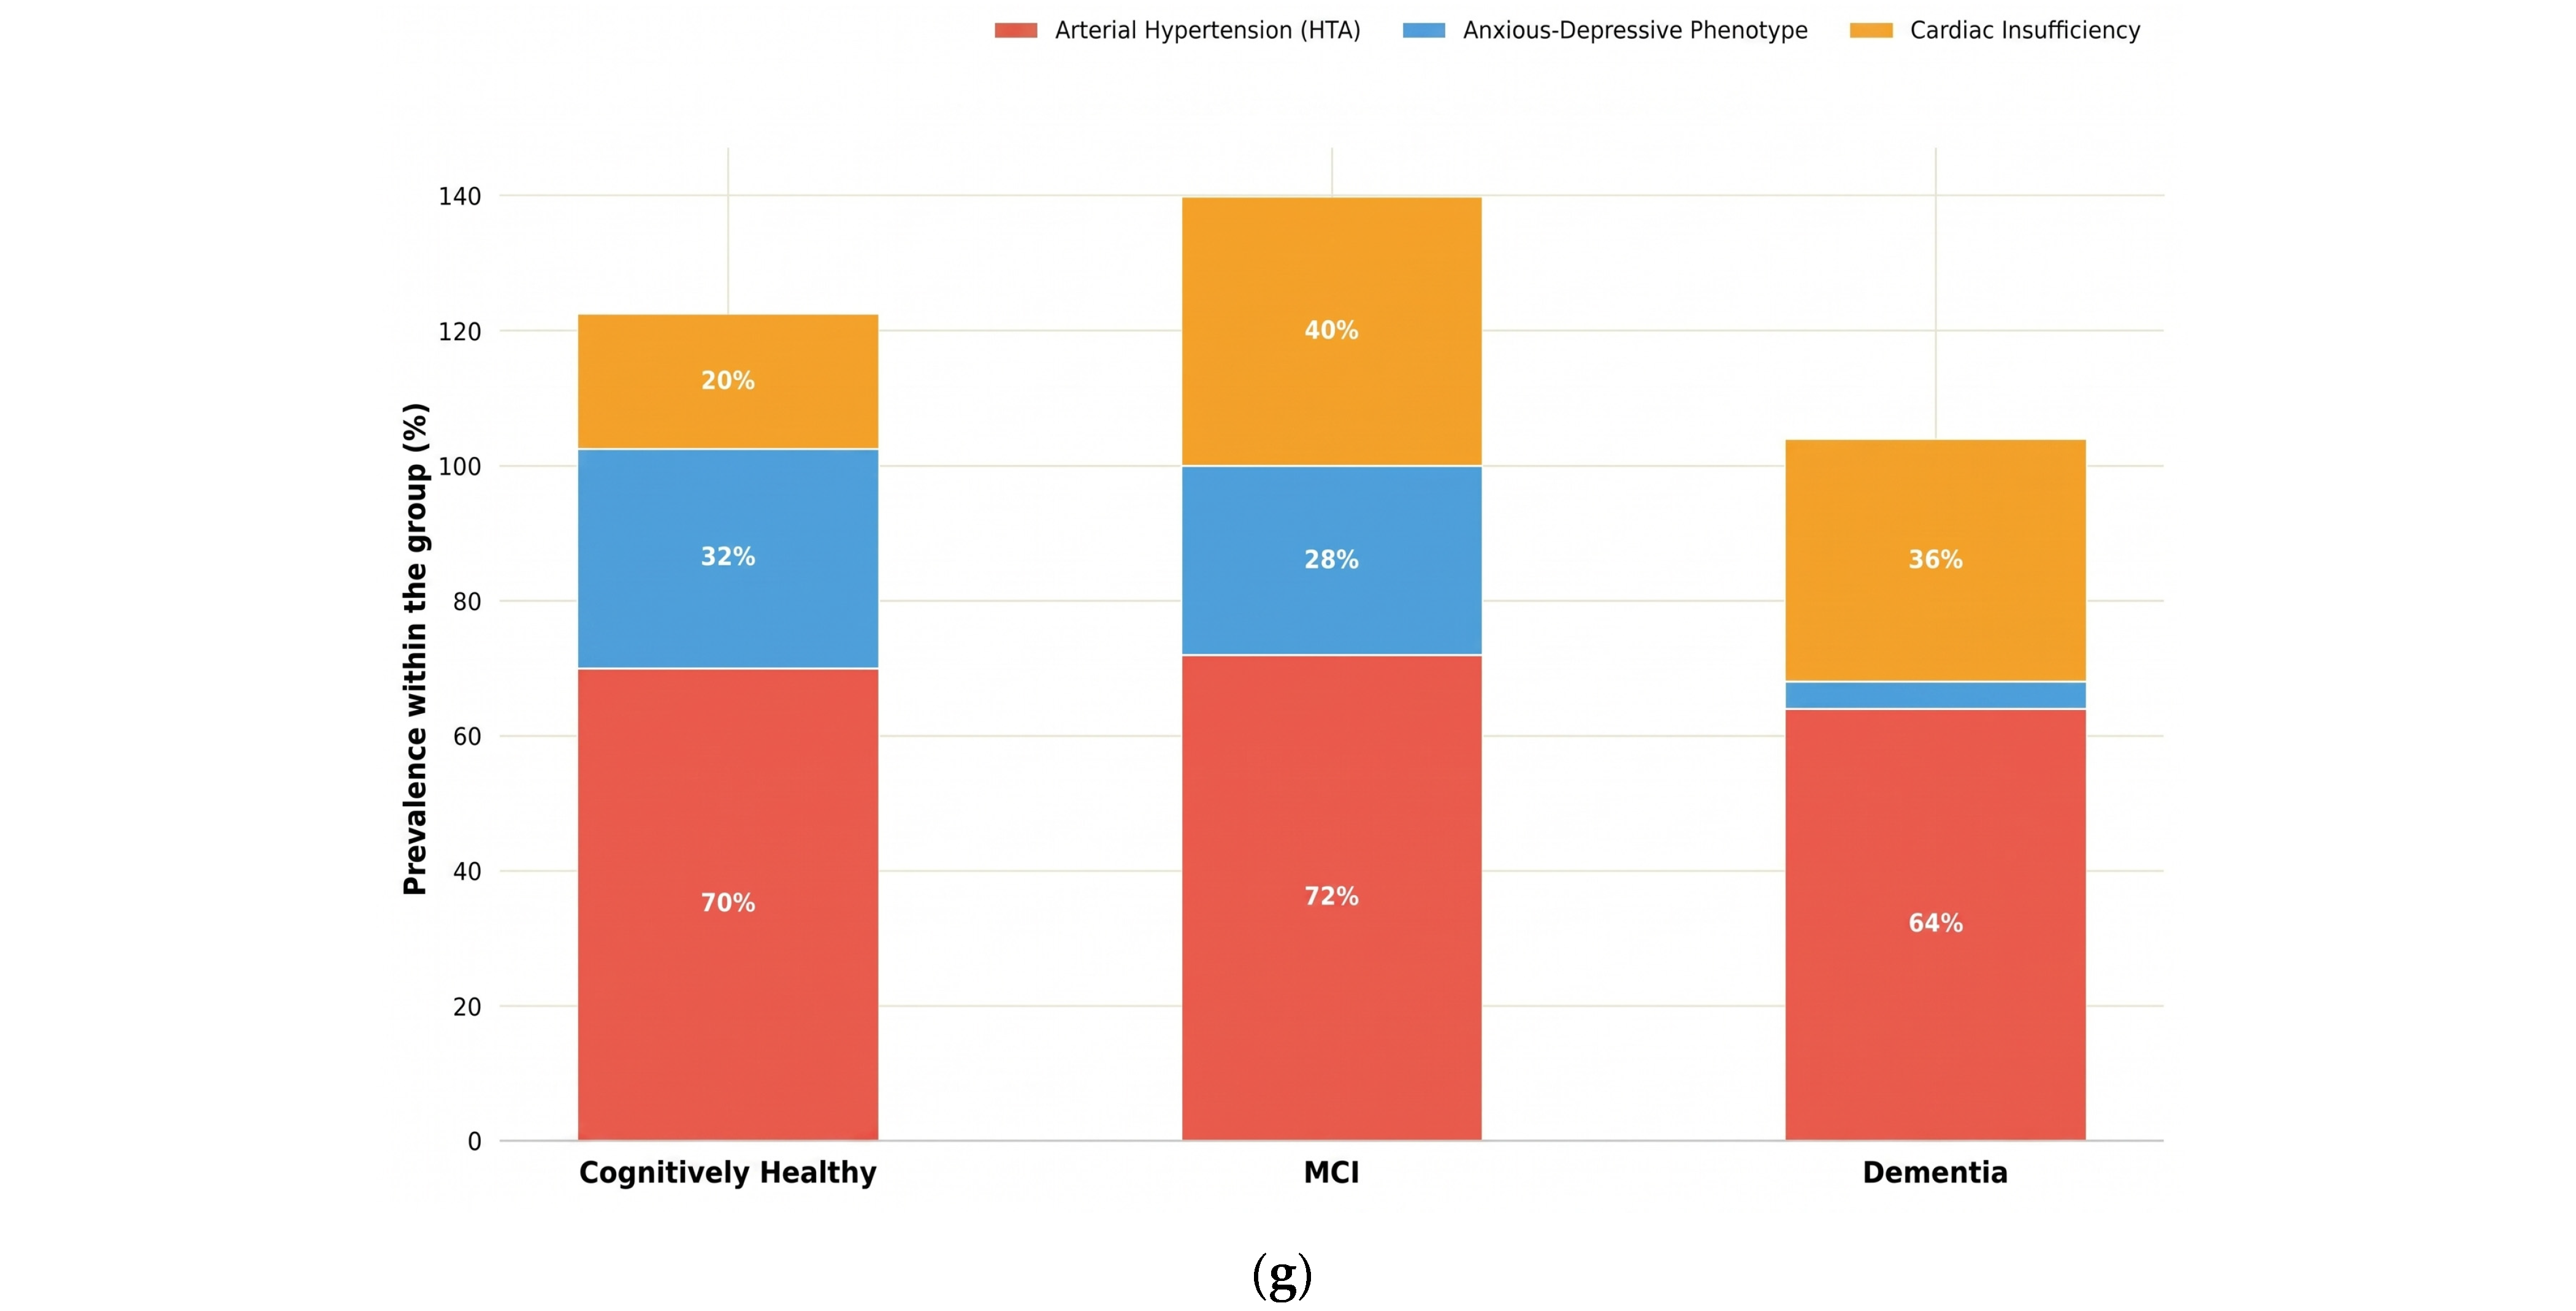
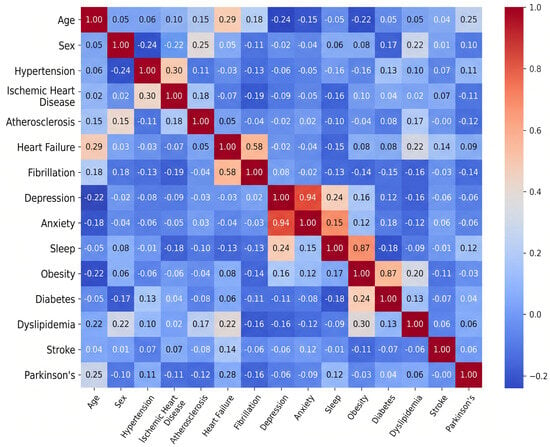
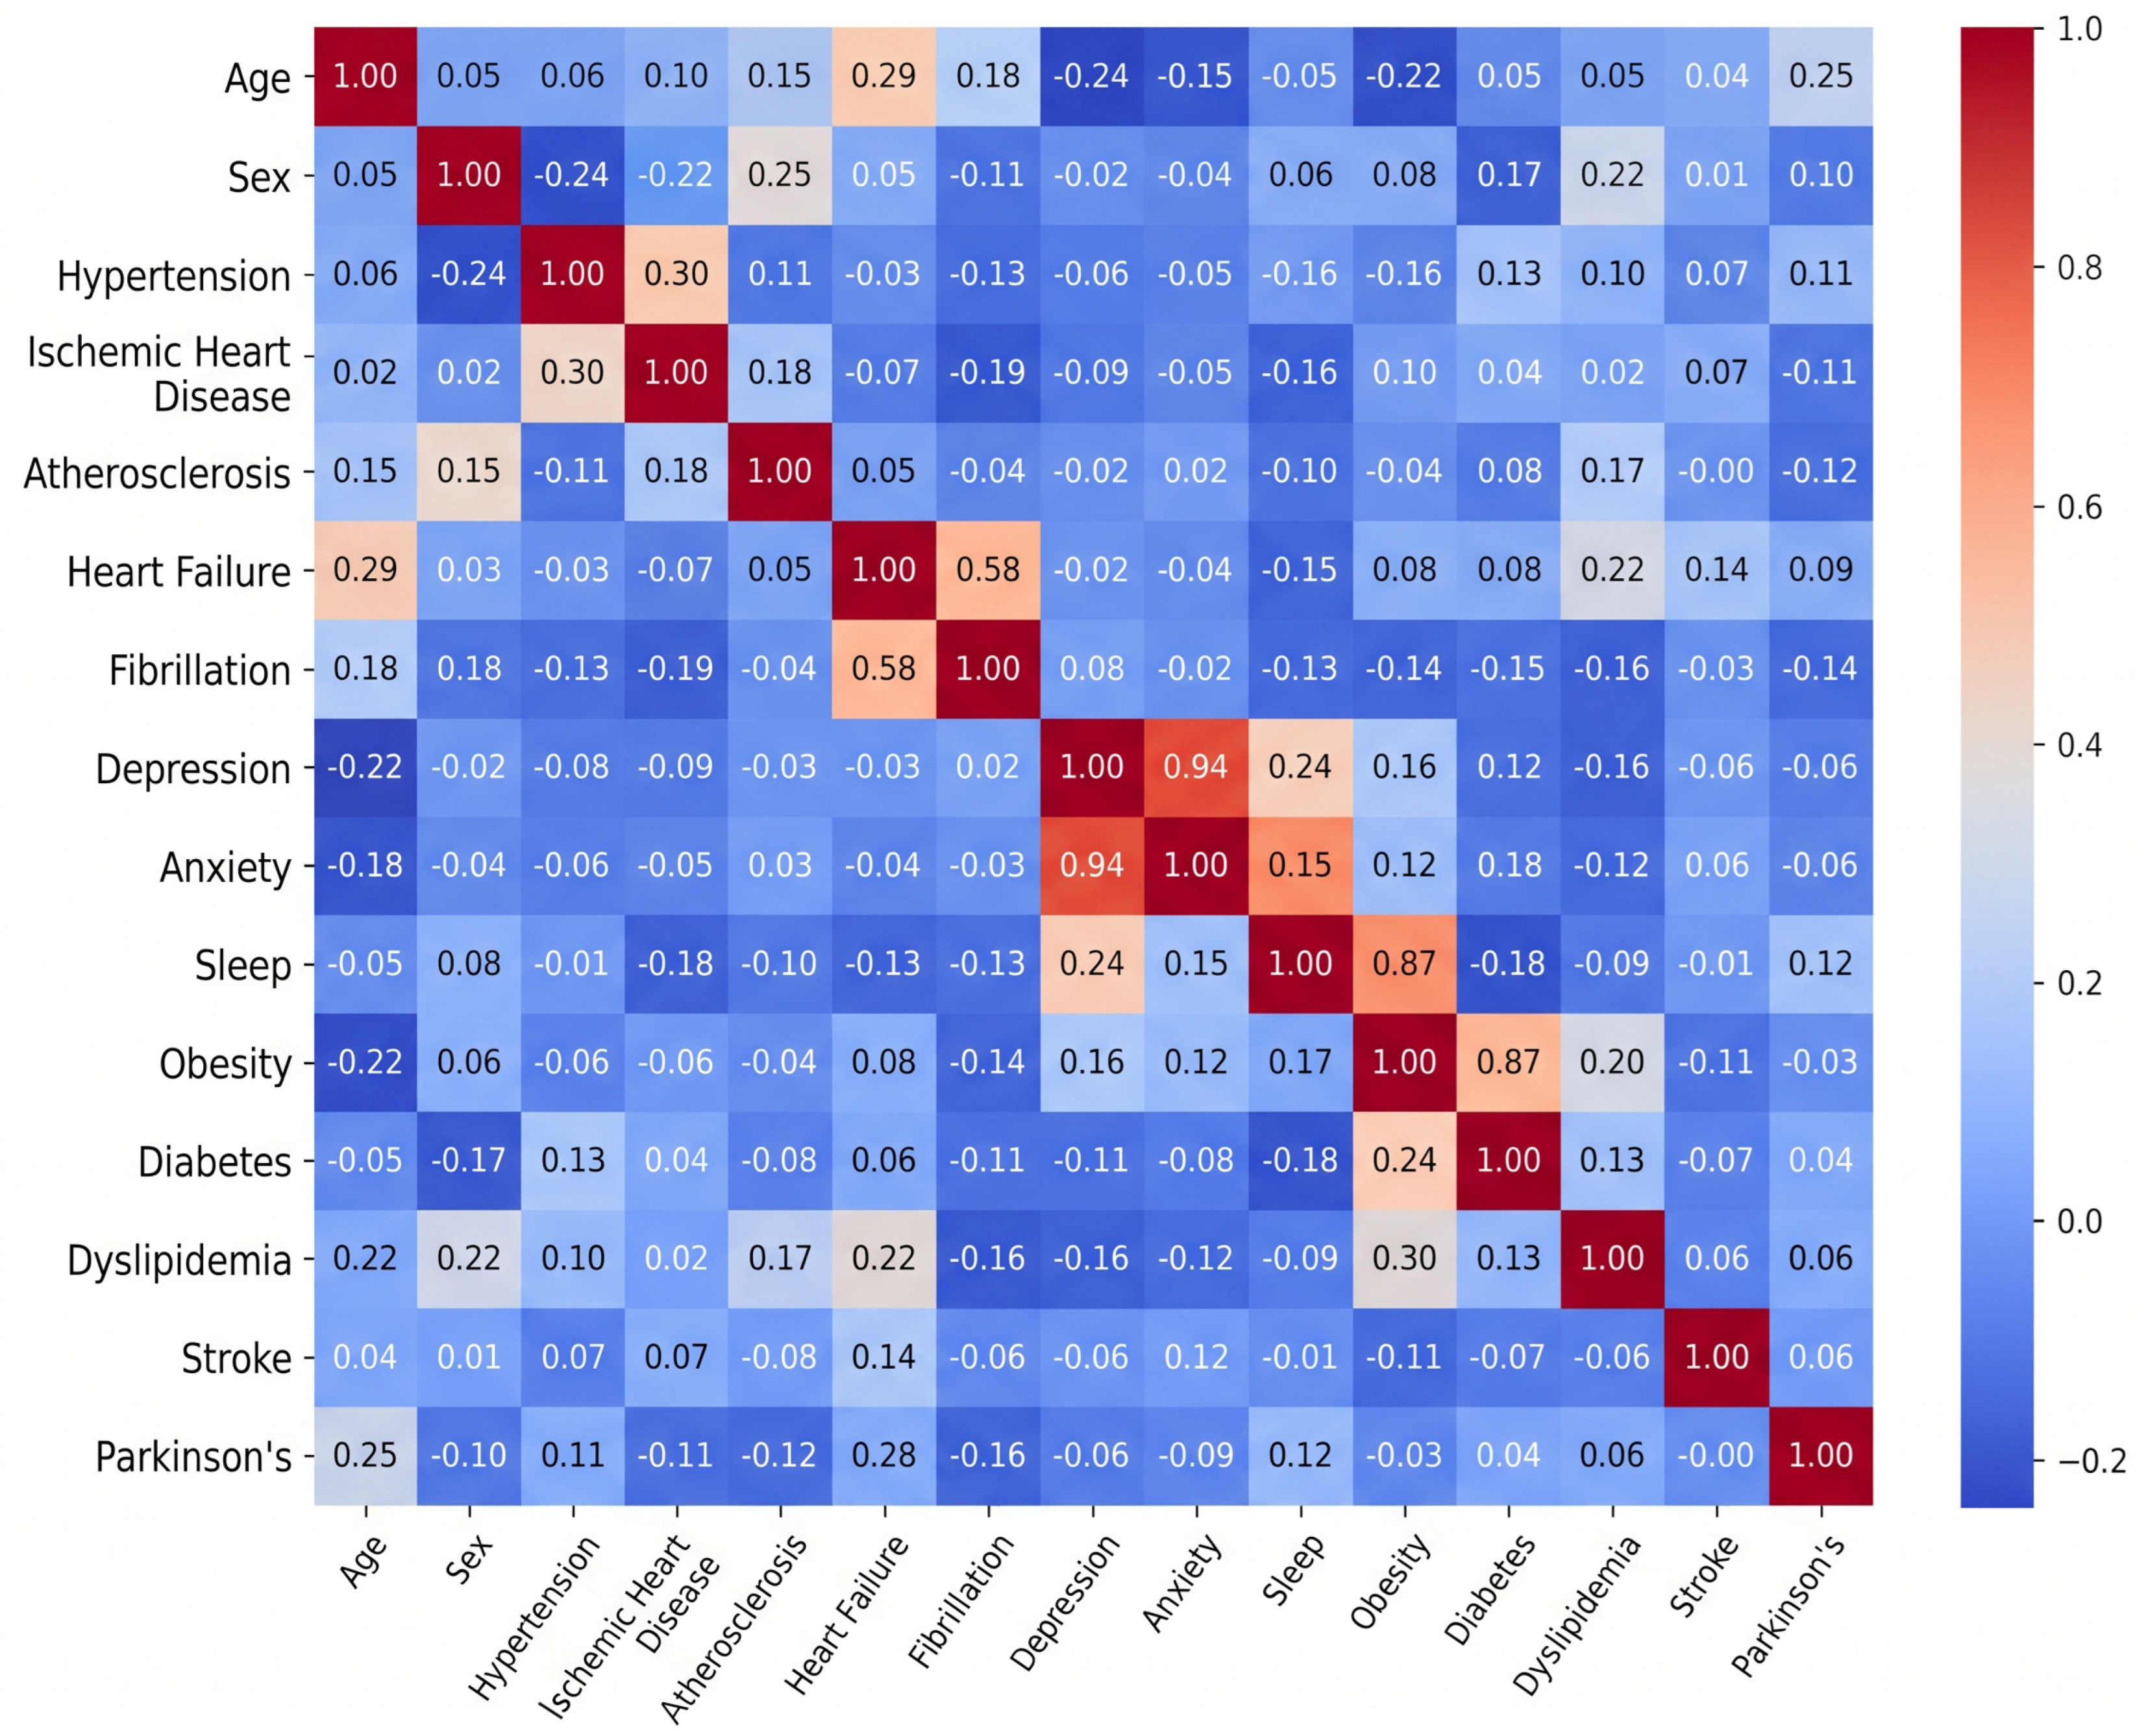
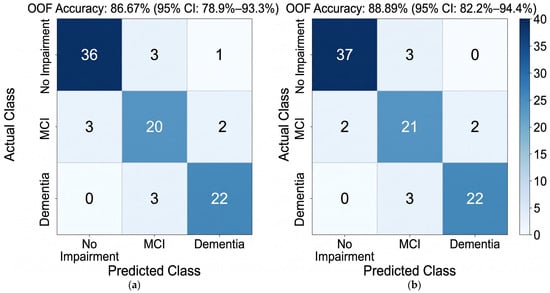
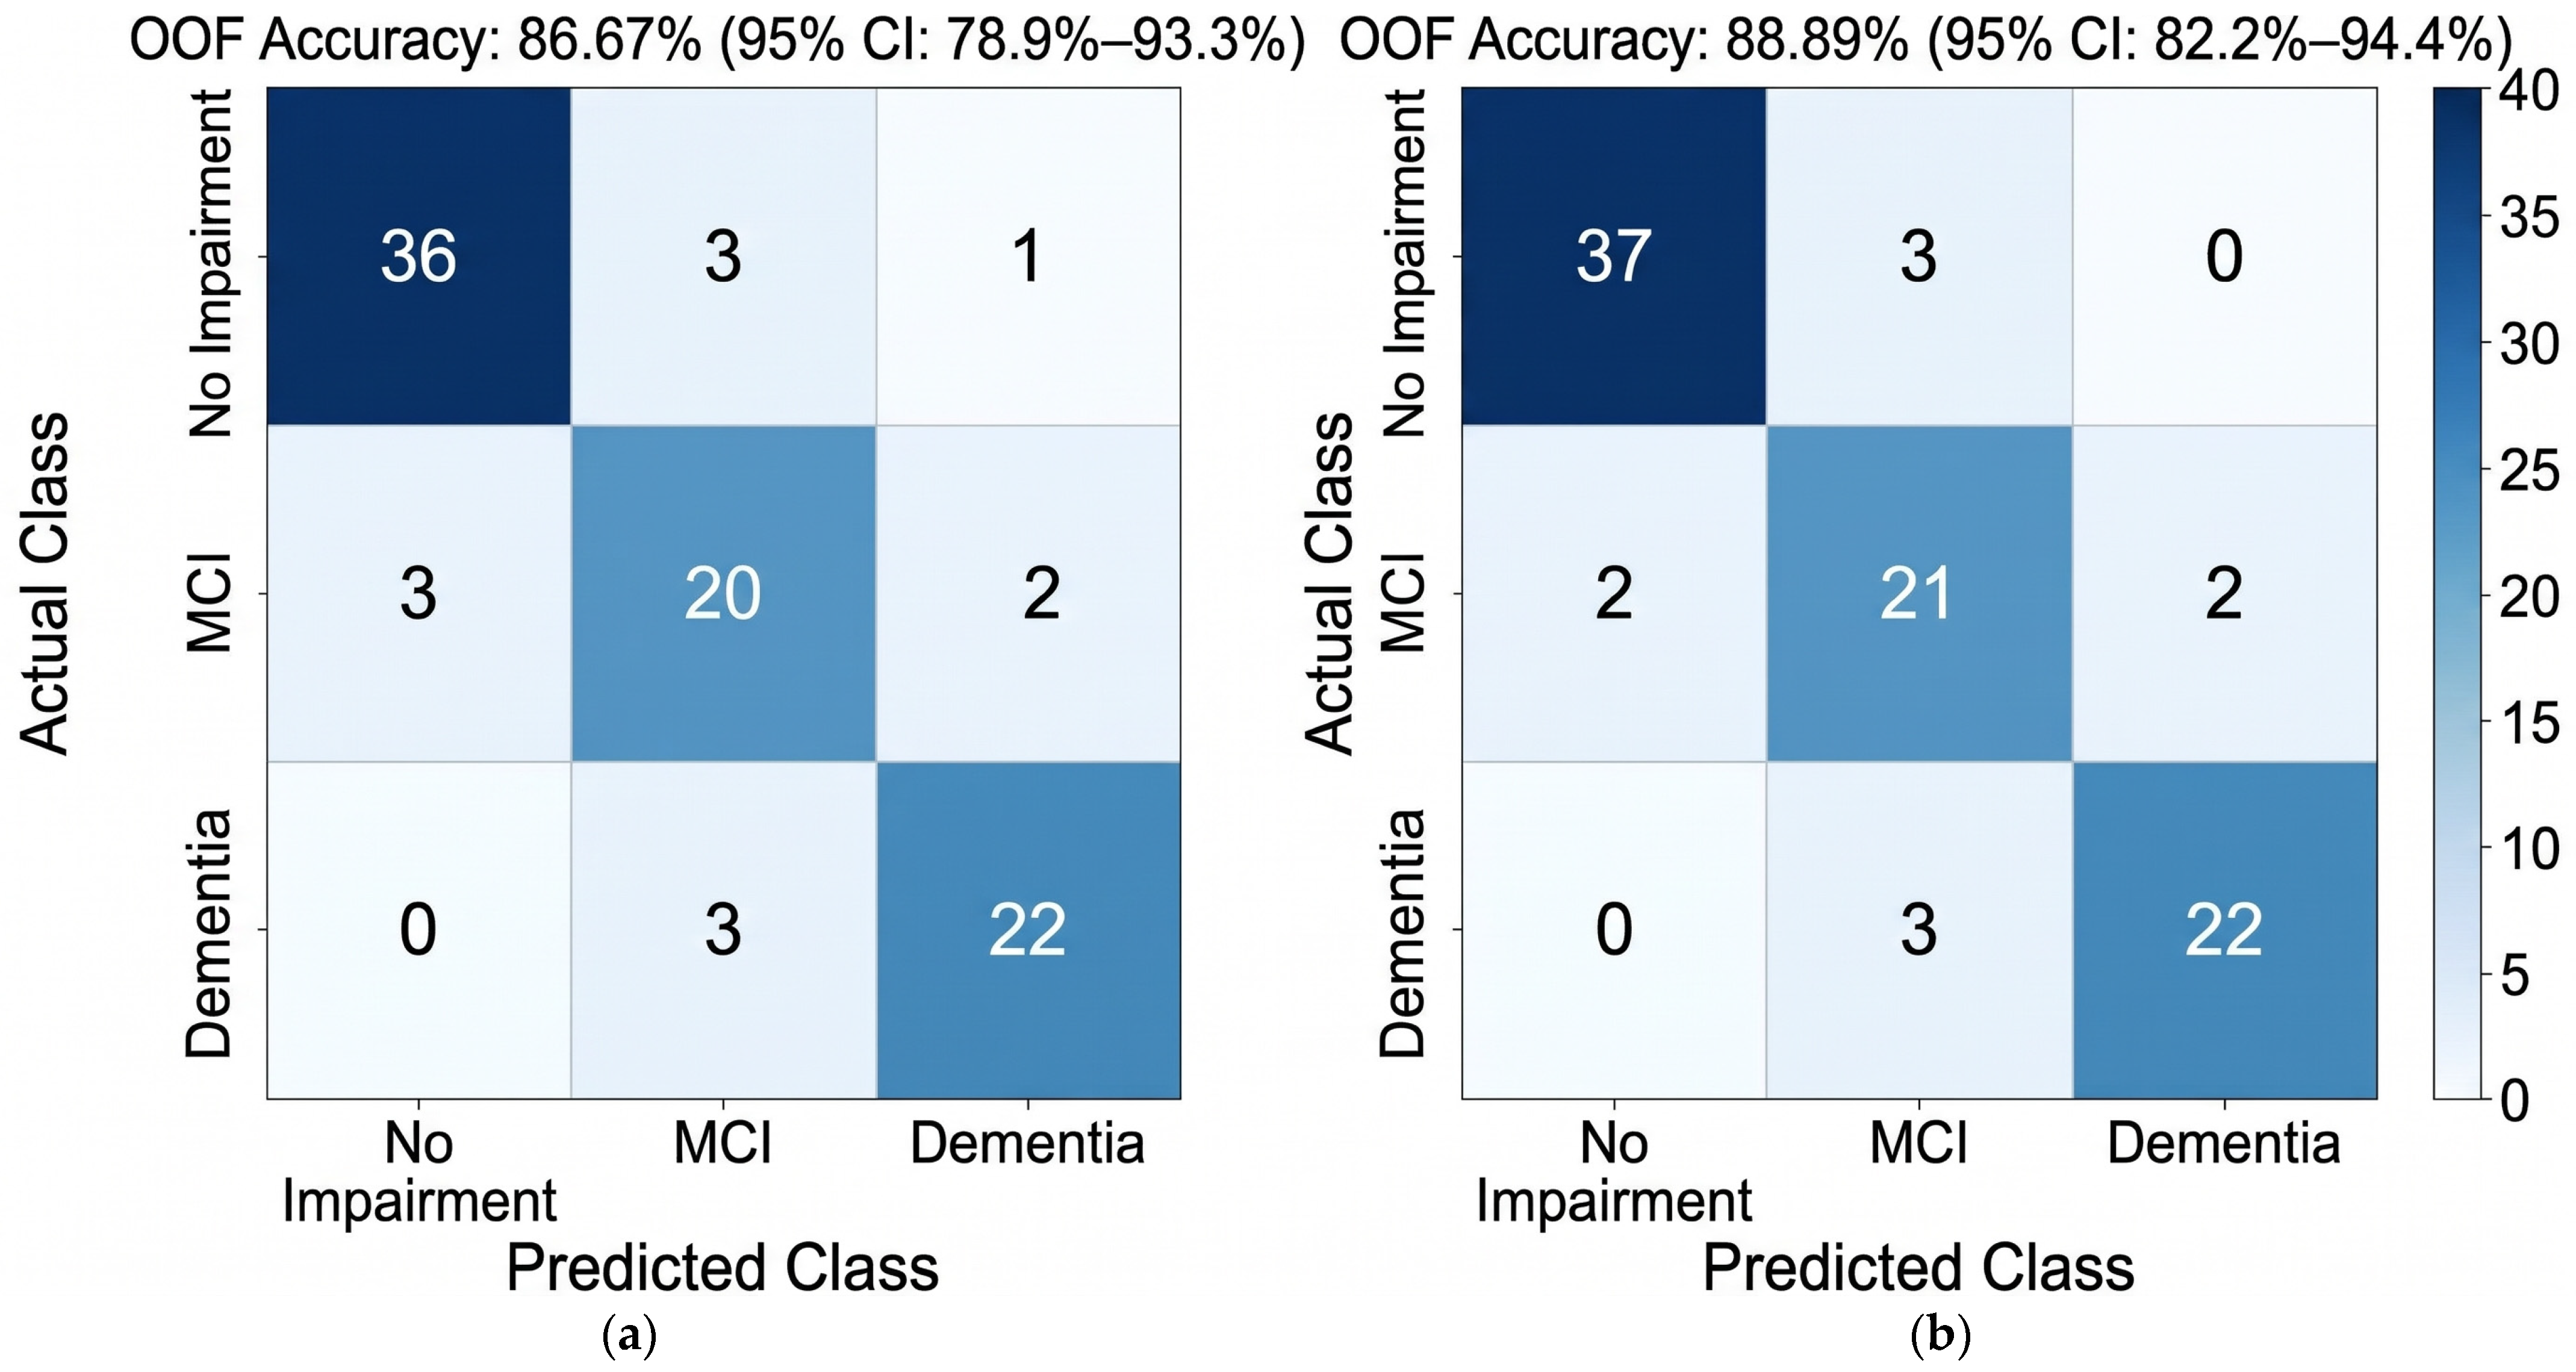
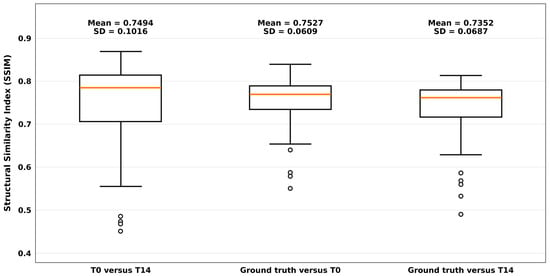
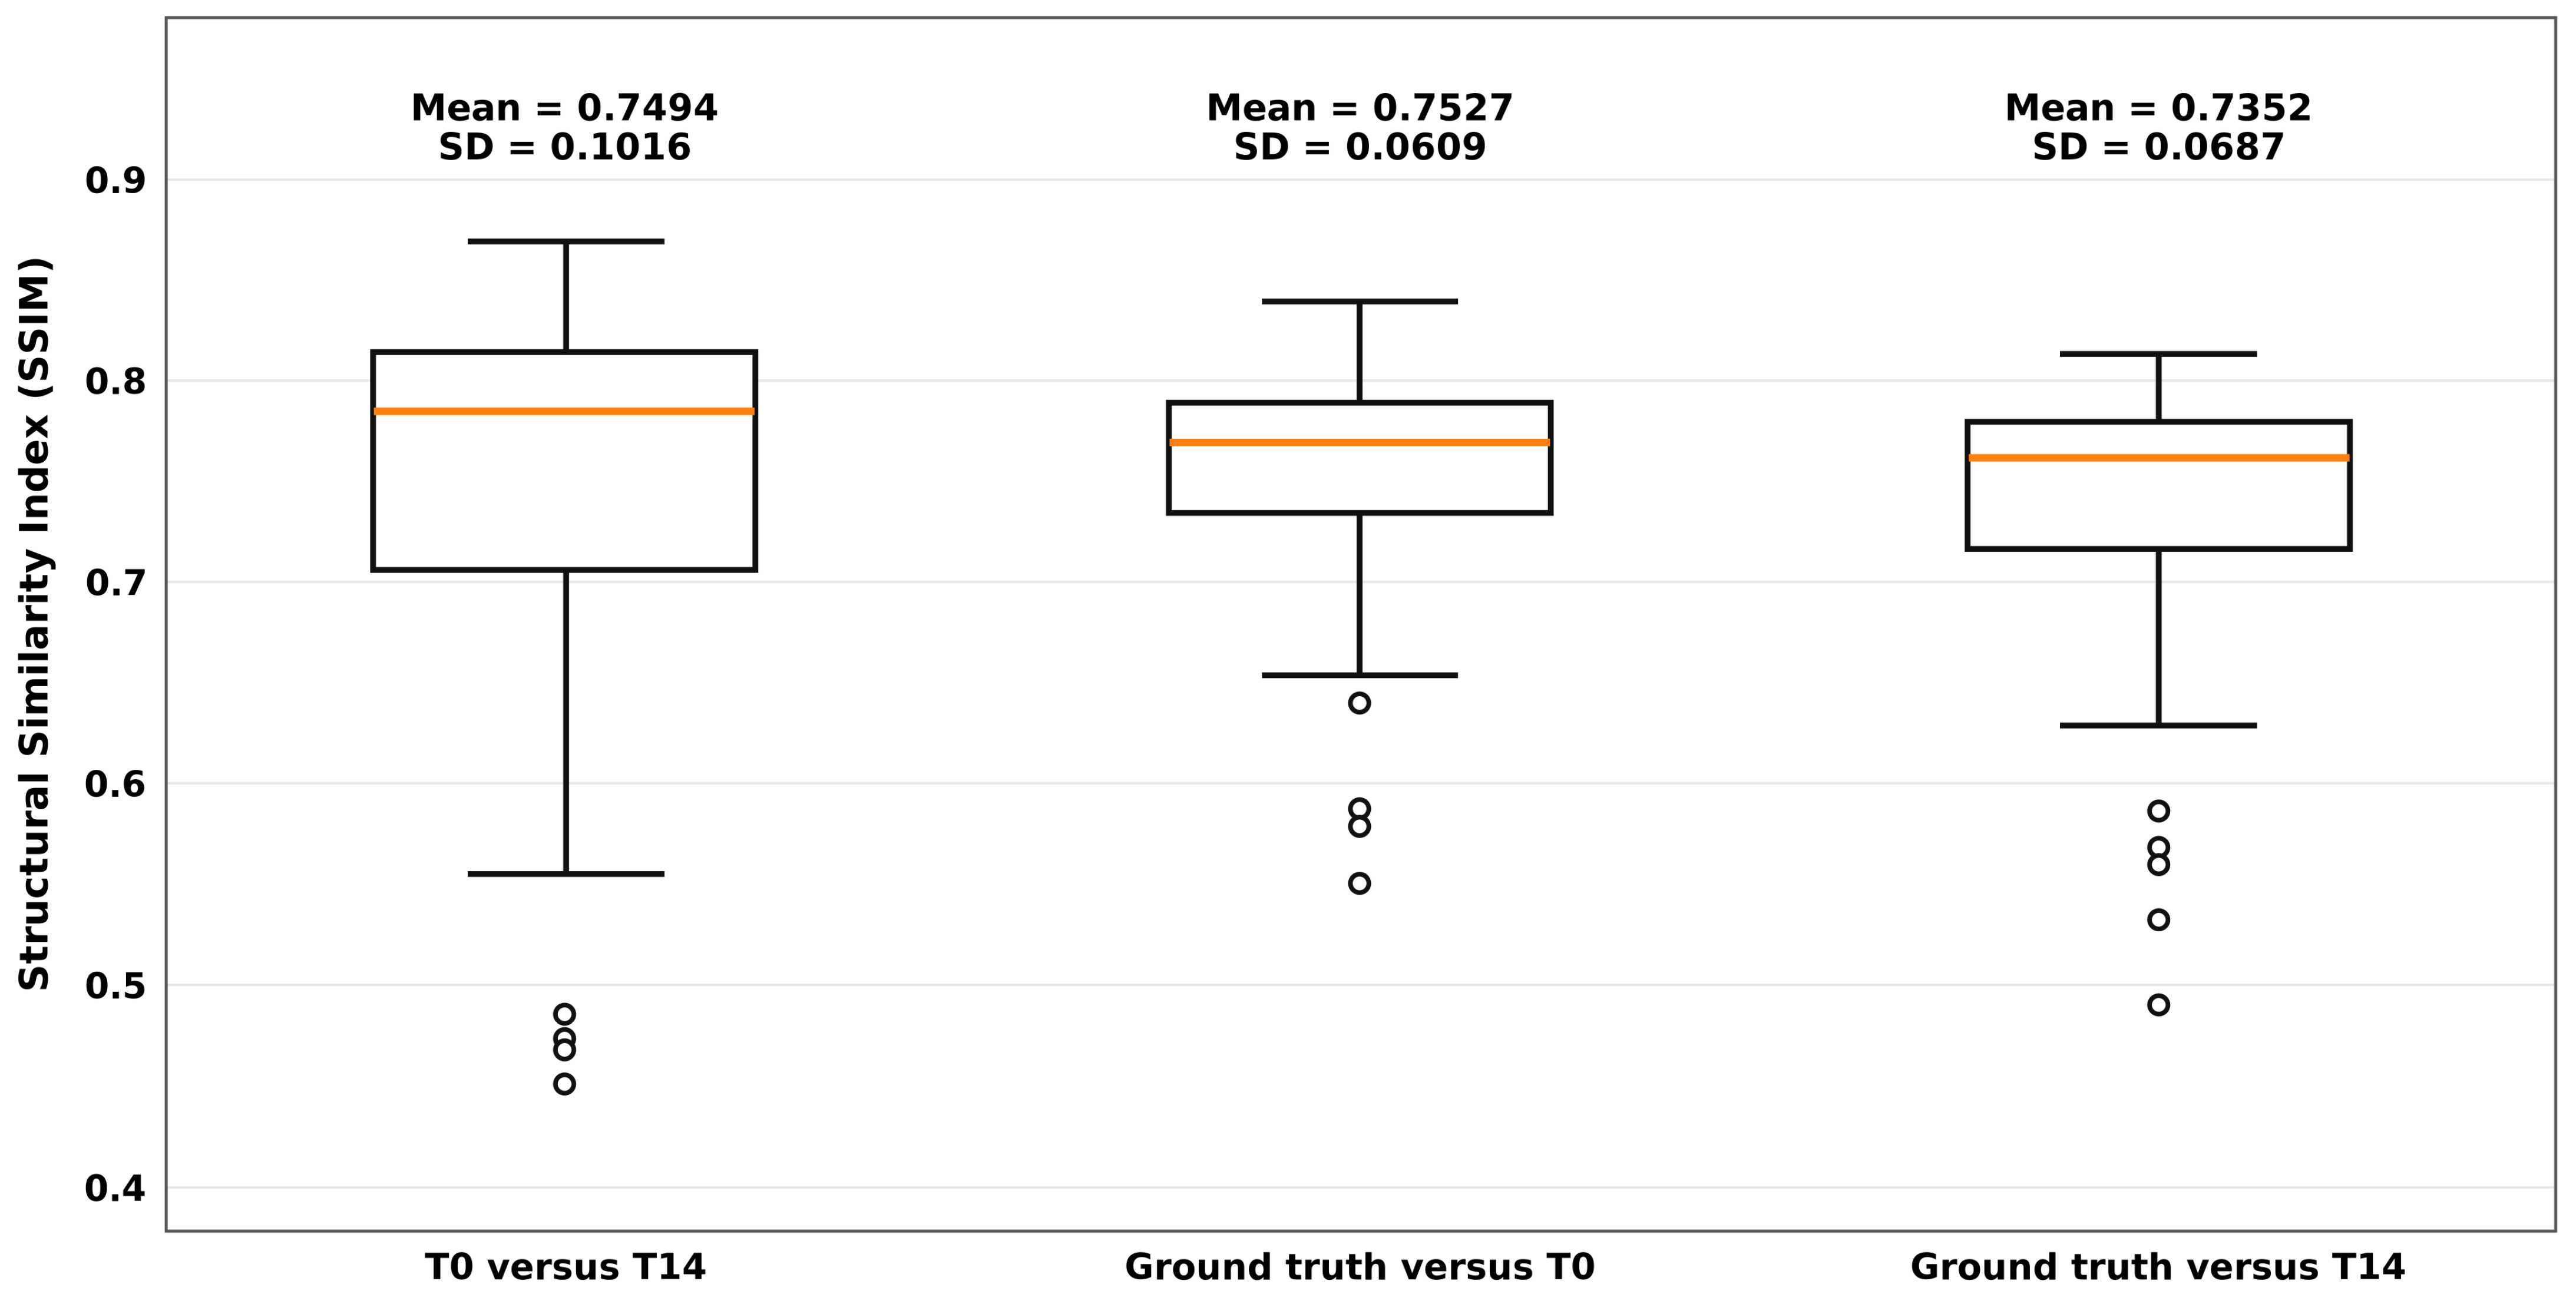
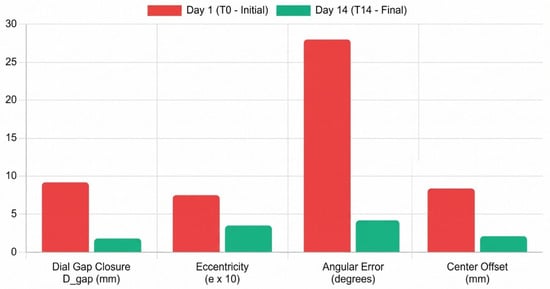
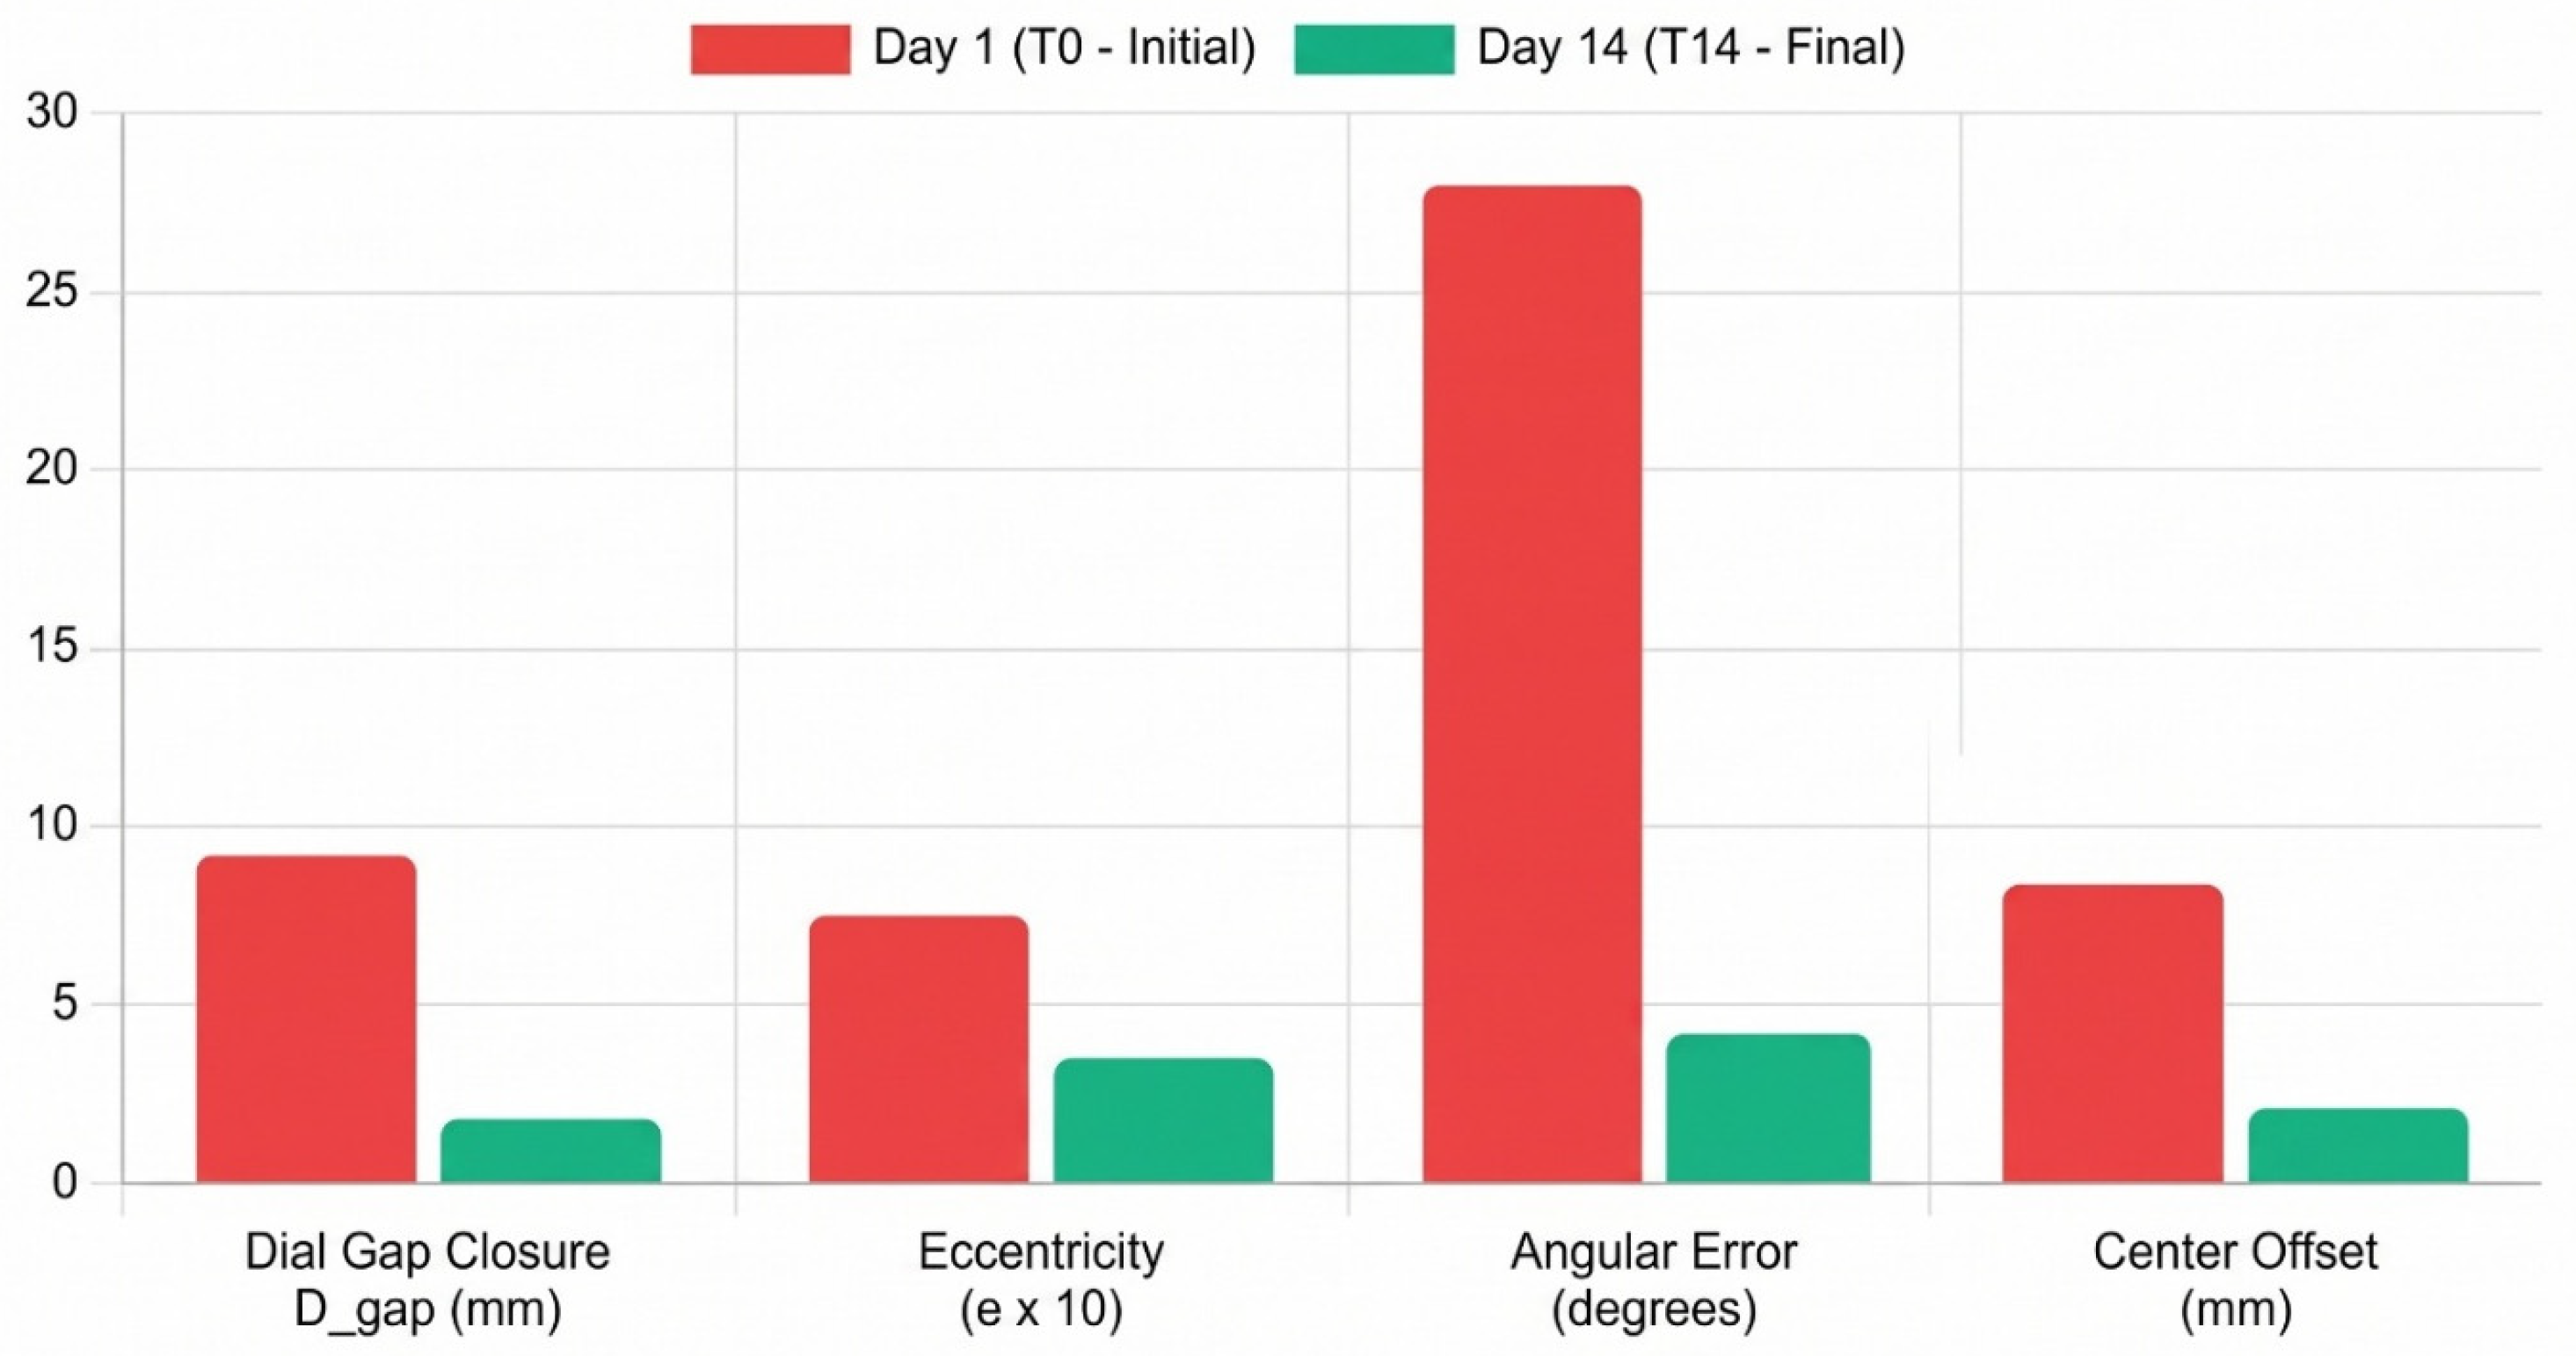

Disclaimer/Publisher’s Note: The statements, opinions and data contained in all publications are solely those of the individual author(s) and contributor(s) and not of MDPI and/or the editor(s). MDPI and/or the editor(s) disclaim responsibility for any injury to people or property resulting from any ideas, methods, instructions or products referred to in the content. |
© 2026 by the authors. Licensee MDPI, Basel, Switzerland. This article is an open access article distributed under the terms and conditions of the Creative Commons Attribution (CC BY) license.