


Abstract
The linking zone between Claritas Fossae and Noctis Labyrinthus represents one of the most structurally complex areas on Mars and has so far received limited attention in the scientific literature. In this work, we aim to reconstruct the tectonic structural framework of this area by combining regional-scale geological structural mapping of tectonic lineaments and agglomerative hierarchical clustering. For the clustering analysis, five attributes were considered for each of the 1729 mapped lineament: azimuth, sinuosity, length, position, and the age of the terrain on which they occur. A total of 68 tests were conducted using different combinations of attributes and relative weights. The most geologically and statistically meaningful solution identified six clusters with specific orientations occurring on both Noachian and Hesperian terrains. This allowed us to relate individual clusters with the different phases of evolution proposed in the literature for the Thaumasia region. In addition, comparison with previous regional tectonic models indicates that some clusters can be confidently related to the Claritas Fossae, others to the Noctis Labyrinthus. Results indicate that the study area effectively represents the place where the two regional-scale tectonic domains interacted during multiple phases of deformation. The highlighted polyphase evolution started during the Noachian and continued through episode(s) of reactivation during the Hesperian, as a result of the tectonic interference between Claritas Fossae and Noctis Labyrinthus.
1. Introduction
The Thaumasia region, located in the south-eastern portion of Tharsis, represents one of the most complex regions on Mars. It is bounded by the Valles Marineris to the north-northeast, Thaumasia Highlands to the south, Claritas Fossae to the west, and Noctis Labyrinthus to the north [1,2]. These regional-scale tectonic provinces represent outstanding laboratories for reconstructing the volcano-tectonic history of the region [3,4,5]; nevertheless, widely accepted models are still lacking and their origin and evolution are still debated [1,3,4,5]. Several studies focused on the structural domains of Valles Marineris, Noctis Labyrinthus, Claritas Fossae, and Thaumasia Highlands [6,7,8,9,10,11,12,13,14], while the areas that link these tectonic provinces are still poorly investigated. Highlighting the geo-tectonic setting of the linking zones might provide significant insights into the origin and evolution of the single tectonic provinces, including the overall development of Thaumasia. In this regard, the linking zone between Claritas Fossae and Noctis Labyrinthus represents an emblematic example. This area is affected by a dense network of tectonic structures (e.g., horsts, grabens, and scarps) which shows continuity with both tectonic provinces. To address the aim of the possible connection between Claritas Fossae and Noctis Labyrinthus, in this work, we conducted a regional-scale tectonic investigation on the tectonic structures (hereinafter referred to as lineaments) longer than 10 km. The analysis was carried out in two main stages: first, lineaments identification and mapping using satellite image mosaics. Second, geostatistical analysis of the mapped lineaments using an agglomerative hierarchical clustering approach to determine whether clusters of lineaments sharing similar geometric, spatial, and geological properties could be identified. Five attributes, considered significant for the aim of the analysis, were derived for each lineament: azimuthal orientation, sinuosity, length, spatial distribution, and geological context. These attributes were subsequently standardized and used to group the lineaments into clusters based on their mutual dissimilarity, testing different combinations of attributes and weights and considering different numbers of clusters. The clustering procedure was conducted on 68 tests in order to explore the geologically reasonable combination(s) of attributes and weights. The statistical robustness of the results was evaluated using the Silhouette index [15,16], employed as an objective criterion. The obtained cluster arrangements were then analyzed individually in order to derive a reliable geological-structural interpretation. We compared the results with existing regional tectonic models and with detailed studies conducted in the southern Claritas Fossae and the north-eastern Noctis Labyrinthus, assessing their influence on the study area [1,2,3,4,12,13,17]. The results demonstrate that the study area effectively represents the linking zone between two regional structural domains and records a polyphasic tectonic history affected by the origin, development and reactivation of the Claritas Fossae and the Noctis Labyrinthus.
2. Geological Setting
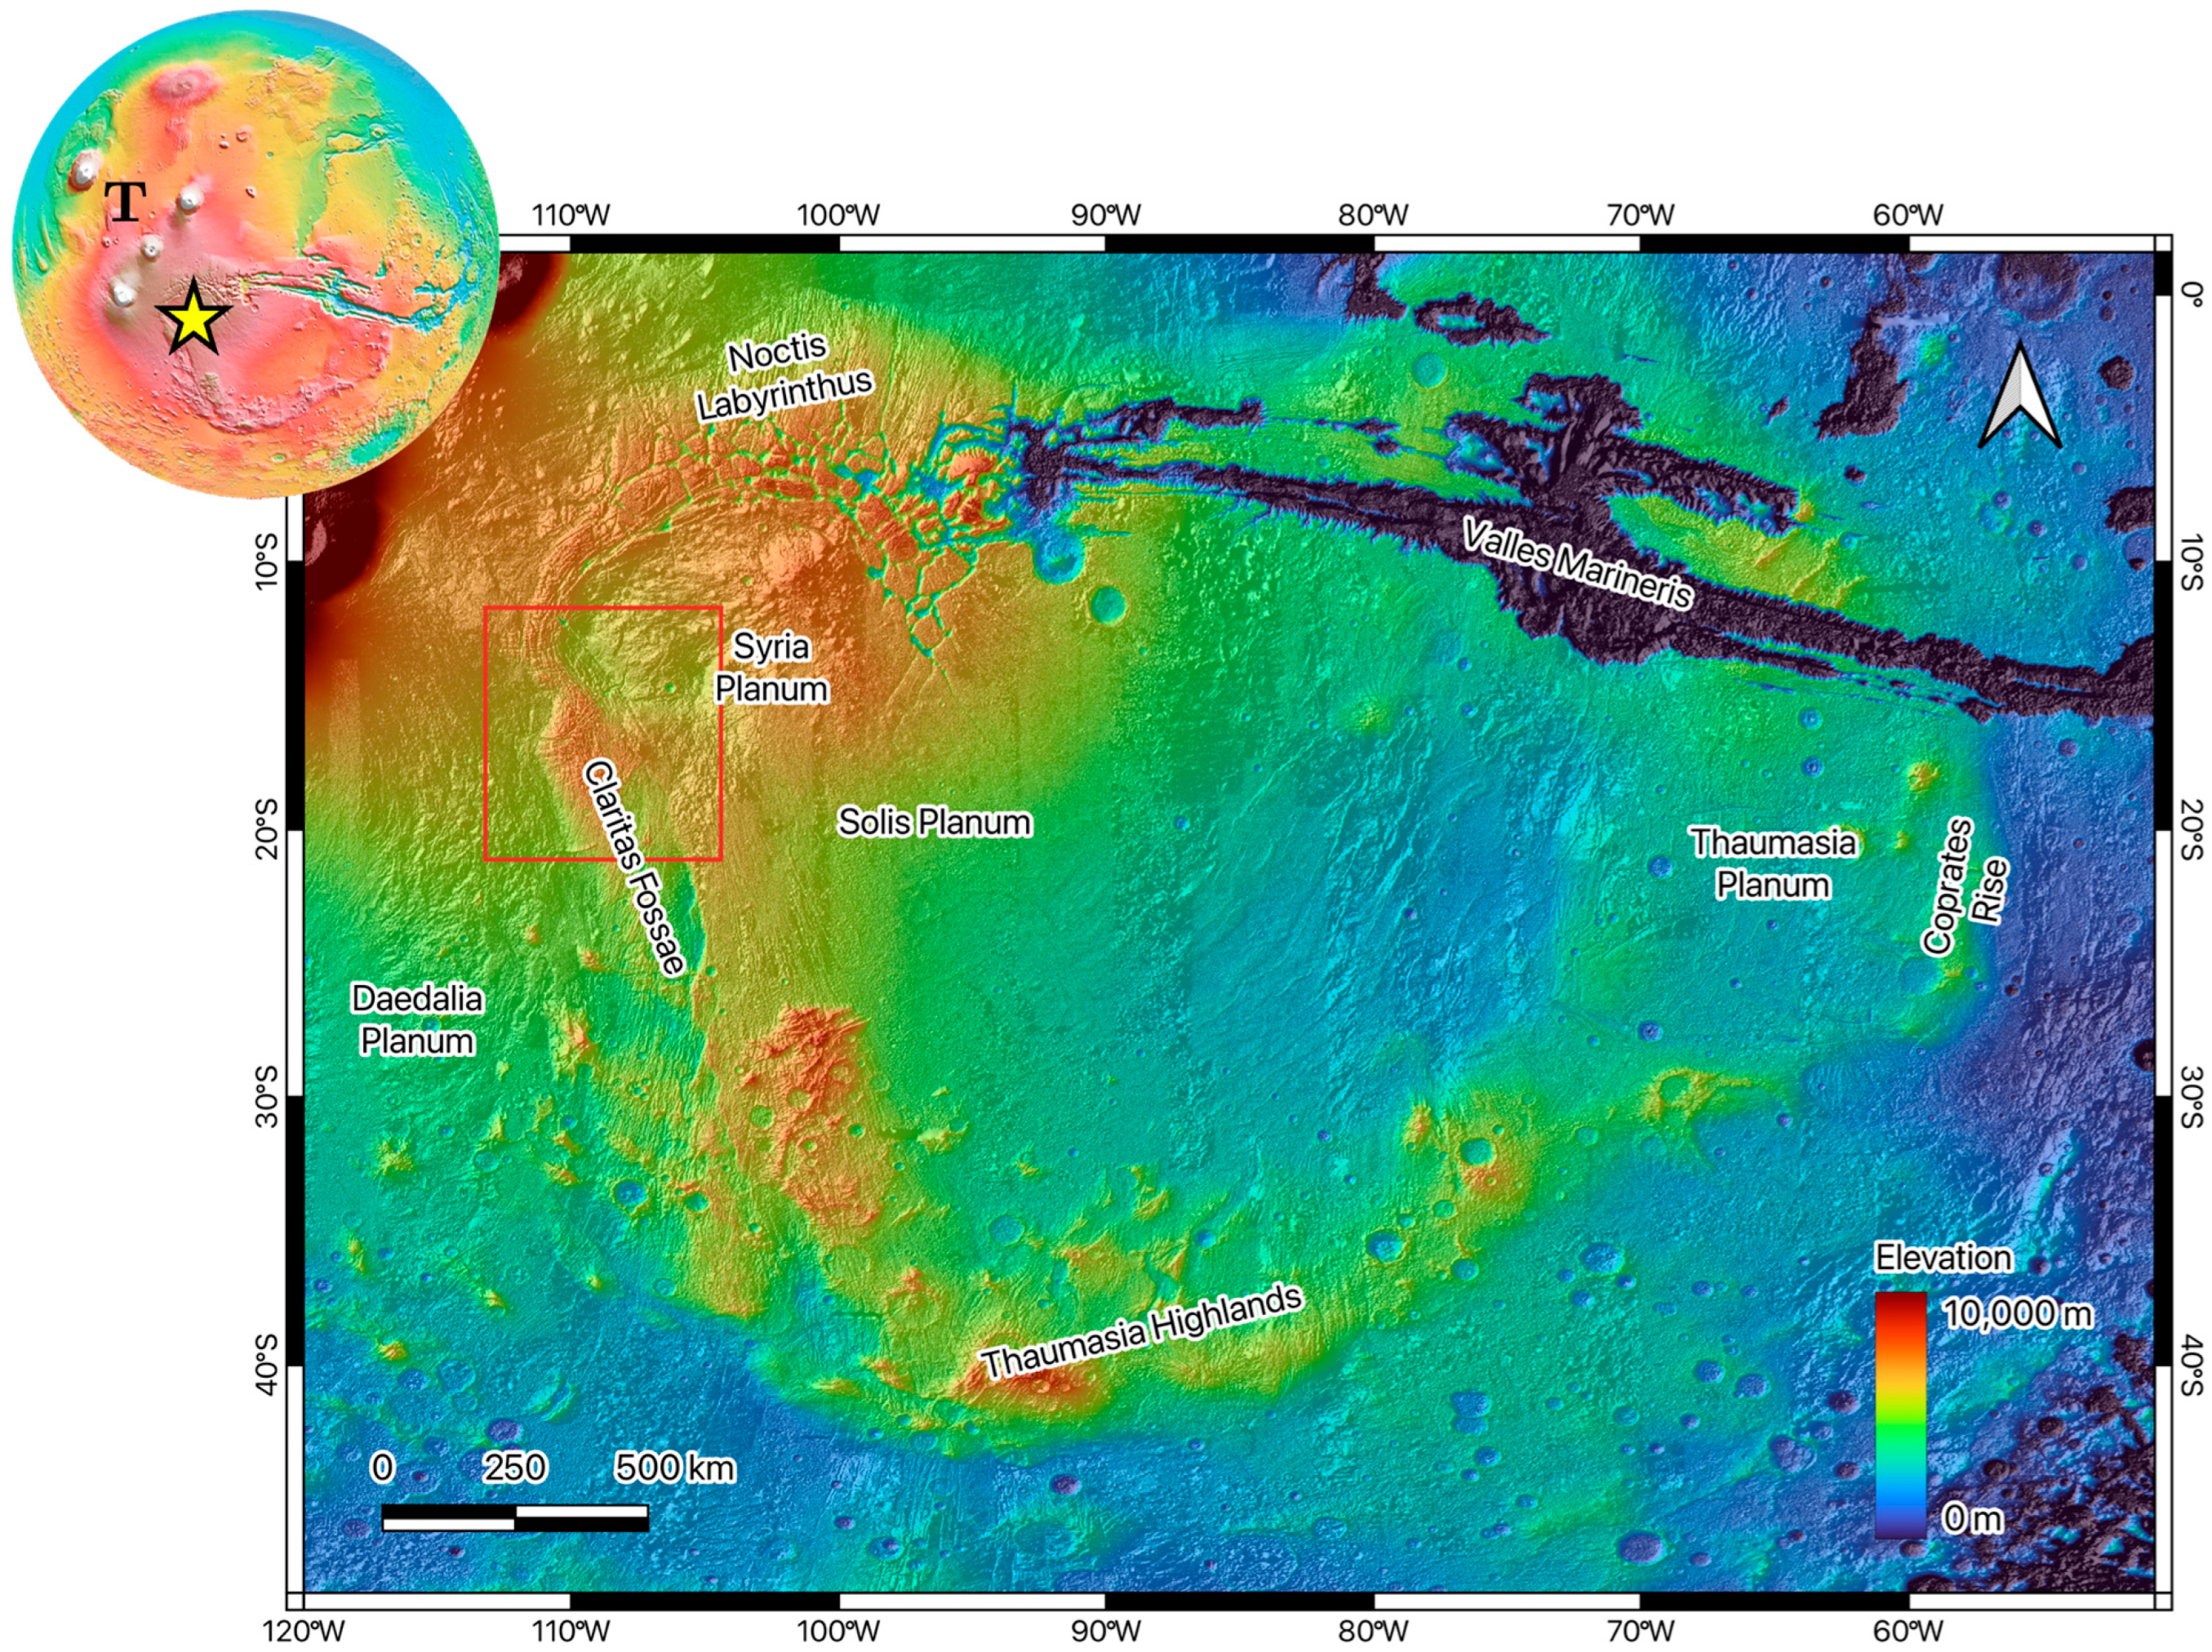
The study area is located in the north-western sector of the Thaumasia volcano-tectonic province, between 104–113° W and 12–21° S (Figure 1). This sector lies between Daedalia Planum to the west and Syria Planum to the east and represents a key structural domain where two of the major tectonic systems of Western Mars appear to interact: the Claritas Fossae to the south and the Noctis Labyrinthus to the north-east.
At the planetary scale, the geological evolution of this region is closely linked to the development of the Tharsis rise, the largest volcano-tectonic province on Mars and one of the most prominent topographic and geodynamic features of the Solar System. Tharsis has strongly influenced the tectonic evolution of the western hemisphere of Mars since the early history of the planet, producing widespread faulting, fracturing, volcanic resurfacing, and large-scale lithospheric deformation, including surface evidence of shortening and extensional structures [3,9,18,19]. The main phase of tectonic activity associated with Tharsis occurred between the Late Noachian and Early Hesperian, although volcanic and tectonic processes continued, with decreasing intensity, throughout later Martian history [3,9].
Thaumasia forms the south-eastern sector of the Tharsis province and consists of a broad volcanic plateau approximately 2900 km long, with a mean elevation of about 3550 m [2]. It includes several volcanic plains, such as Syria Planum, Sinai Planum, Solis Planum and Thaumasia Planum, mainly composed of extensive volcanic units emplaced from the Late Noachian to the Late Hesperian [1,2]. The province is bounded to the north by the Valles Marineris and Noctis Labyrinthus, to the west by the Claritas Fossae, and to the south and southeast by the Thaumasia Highlands [1,2]. The accumulation of volcanic material and associated intrusive activity related to Tharsis generated regional stress fields responsible for the development of several fracture, fault and graben systems, particularly concentrated in areas such as Valles Marineris, Noctis Labyrinthus, and Claritas Fossae [3,5,18].
Figure 1.
Colour-coded Digital Elevation Model (Mars MGS MOLA—MEX HRSC Blended DEM Global 200 m) of the Thaumasia region combined with its shaded relief (synthetic lightning condition from NW). The location of Thaumasia within the Tharsis Volcanic Province is represented by the yellow star in the top left planisphere (T = Tharsis). Mars_2000 geographic coordinate system [20]. Red box bounds the study area of this work.
The tectonic evolution of Thaumasia has been interpreted as polyphase. Refs. [1,2] proposed that the region experienced multiple episodes of faulting from the Noachian to the Amazonian, with magmatic activity associated with most of these tectonic events. At a broader scale, ref. [3] reconstructed five main stages of tectonic activity in the western hemisphere of Mars, based on the spatial distribution and cross-cutting relationships of tectonic structures. In this model, the earliest and most intense stage of deformation was centred near the Claritas Fossae during the Noachian, whereas later stages involved a progressive migration of tectonic centers toward Valles Marineris, Syria Planum, Alba Patera and the Tharsis Montes region. The location of the present study area, close to both the Claritas Fossae and Syria Planum tectonic centers, suggests that it may preserve the effects of different regional stress fields and deformation phases.
Claritas Fossae represents the western boundary of the Thaumasia region and consists of an elongated, approximately N-S-trending deformation corridor more than 900–1000 km long and about 150 km wide [12,13,17,21]. It is characterized by a complex association of fault scarps, grabens, semi-graben-like depressions, ridges, and fracture systems developed mainly on Noachian and Hesperian terrains [12,22,23]. The origin of the Claritas Fossae has been debated. Some authors interpreted it primarily as an extensional structure related to Tharsis-centered deformation and to the development of a large crustal-scale normal fault system [1,17]. Other studies emphasized the role of strike-slip or transtensional tectonics, based on the occurrence of en-echelon patterns, pull-apart and restraining-bend geometries, and Riedel-type arrangements [5,12,24]. In particular, ref. [12] proposed a polyphase evolution involving an early right-lateral strike-slip phase during the Noachian–Early Hesperian, followed by Late Hesperian–Early Amazonian transtensional reactivation with a significant normal dip-slip component.
North-east of the study area, Noctis Labyrinthus marks the western termination of the Valles Marineris canyon system. It is composed of a complex network of interconnected troughs, grabens, horsts, pit-crater chains, and collapsed depressions, commonly interpreted as the result of extensional tectonics, volcanic activity, subsurface collapse, and volatile loss related to the evolution of Tharsis and Syria Planum [4,25,26,27]. Ref. [4] identified multiple deformational stages in Noctis Labyrinthus, including an older transtensional phase and a younger extensional phase related to the development of the Noctis Labyrinthus–Valles Marineris system. More recently, ref. [27] suggested that the formation of Noctis Labyrinthus was controlled by early extension, magmatic plumbing associated with Syria Planum, and later deformation linked to the Tharsis rise.
The study area occupies a structurally critical position between two major tectonic domains: the Claritas Fossae deformation corridor and the Noctis Labyrinthus–Valles Marineris system. Its topography is relatively high compared with the surrounding plains, with elevations ranging from about 3515 m to 7958 m and a mean elevation of approximately 6223 m, based on the Mars MGS MOLA–MEX HRSC Blended DEM Global 200 m dataset. The highest elevations occur in the central part of the study area. From this topographic high, elevation decreases toward Syria Planum to the northeast and Daedalia Planum to the southwest (Figure 2A). This pronounced topographic gradient is associated with a dense network of linear to slightly curvilinear morphotectonic features, including scarps, grabens, fault-controlled depressions and locally pit-crater chains.
Figure 2.
(A) Topography of the study area (red box in Figure 1) derived from the Mars MGS MOLA–MEX HRSC Blended DEM Global 200 m overlapped to the Mars Odyssey THEMIS-IR Day Global Mosaic 100 m. (B) Geologic sketch of the study area derived from the geologic map of the Thaumasia region from [2]. Nb = basement complex; Nf = older fractured materials; Nfc = older flow and construct materials; Hf = younger fractured materials; Hsu = upper member, Syria Planum Formation; Hsl1 = older flows of the lower member, Syria Planum Formation; AHt3 = member 3 of the Tharsis Montes Formation [28].
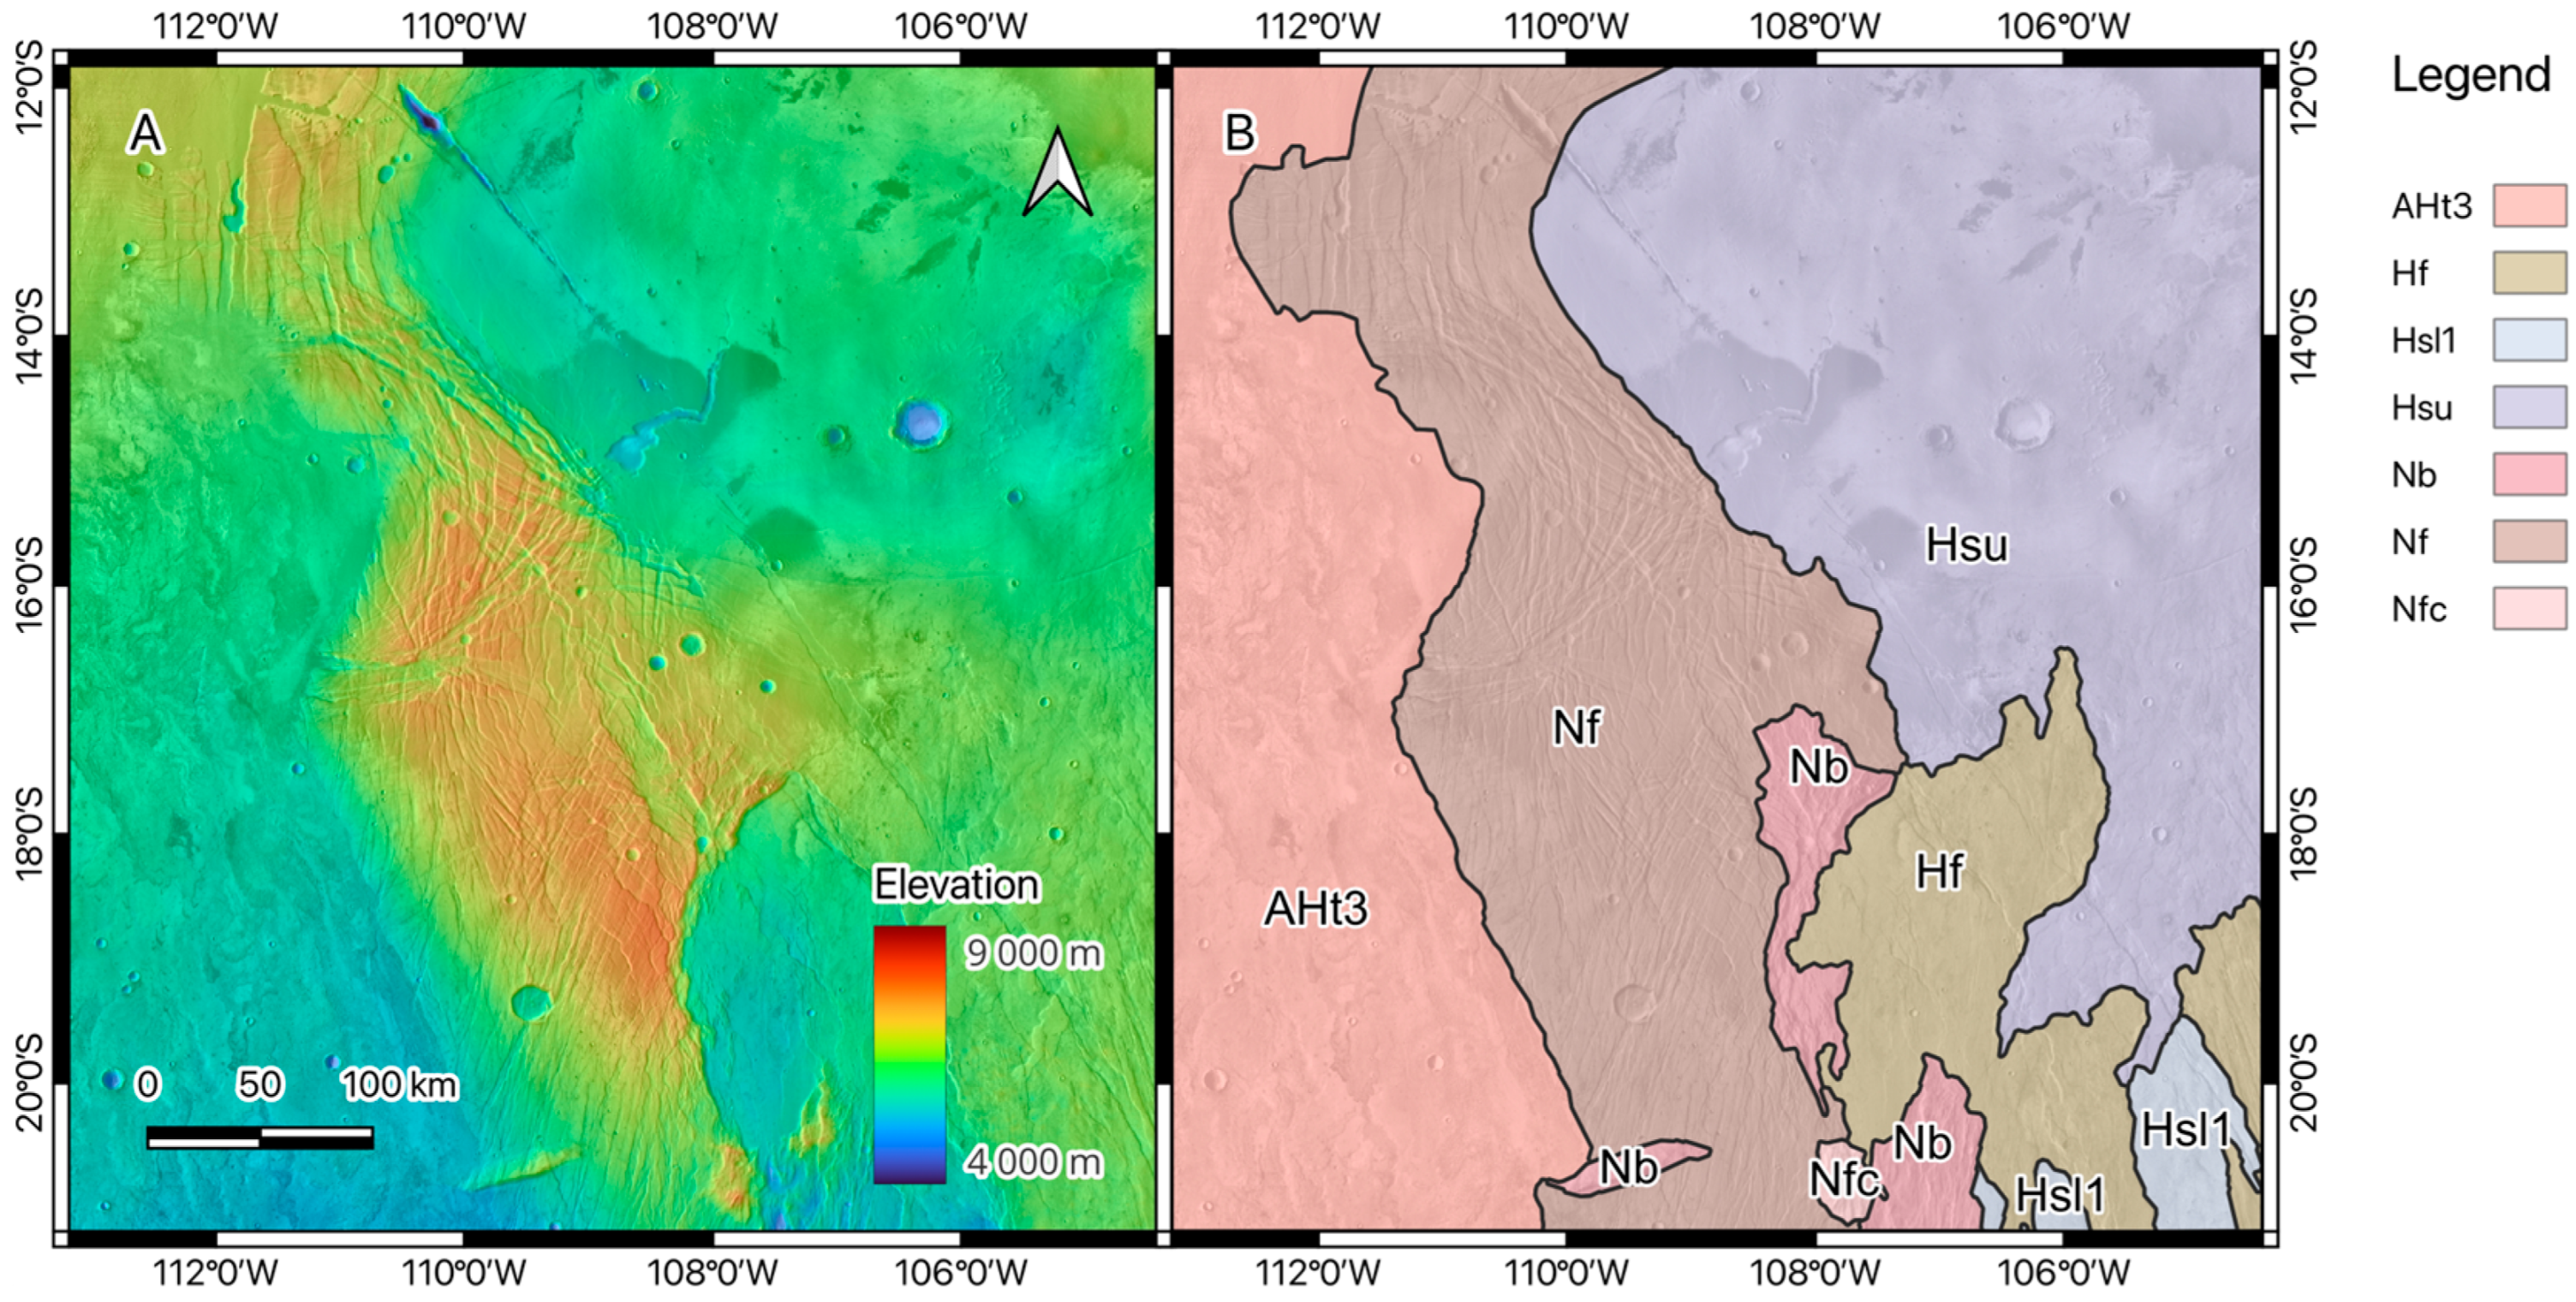
The geological units exposed in the study area include Noachian, Hesperian, and Hesperian–Amazonian terrains (Figure 2B). The dominant Noachian unit is the older fractured material unit, Nf, which crops out along a N-S oriented belt and consists of highly fractured basement rocks affected by dense networks of faults, scarps, and grabens [2]. This unit represents the main structural substrate of the study area and preserves evidence of intense brittle deformation. Additional Noachian units include the basement complex, Nb, exposed in the south-eastern part of the area, and the older flow and construct materials, Nfc, interpreted as eroded volcanic flows and edifices [2]. Hesperian units include younger fractured materials, Hf, and lava-flow units of the Syria Planum Formation, including Hsu and Hsl1. These volcanic units are less pervasively deformed than the Noachian basement but are locally cut by tectonic lineaments, indicating deformation after their emplacement. In the western sector, toward Daedalia Planum, younger volcanic flows assigned to the Hesperian–Amazonian interval are also present, AHt3, documenting prolonged volcanic resurfacing in the region [2]. It should be noted that the original geologic map of [2] ends at 15° S, leaving uncovered the northernmost part of the area analyzed in this work. Therefore, we extended to the north the boundaries of Dohm’s map following mapping criteria as faithful as possible to the originals. These criteria are presented in the Materials and Methods section.
The coexistence of highly deformed Noachian basement and less deformed, but locally faulted, Hesperian volcanic cover units suggests that the study area experienced a long-lived tectonic history. Older structures preserved in the Noachian units may record early deformation related to the development of the Claritas Fossae and the first stages of Tharsis-related tectonism, whereas lineaments affecting Hesperian units may reflect later deformation and/or reactivation of pre-existing weakness zones [1,3]. This is consistent with regional tectonic models that identify multiple deformation phases in Thaumasia and with local studies documenting polyphase deformation in both Claritas Fossae and Noctis Labyrinthus [1,3,4,12,13].
The preservation of such an ancient and complex structural record is favored by the very low erosion rates that characterize the Martian surface over geological timescales. Unlike Earth, where tectonic landforms are commonly modified or erased by erosion, sedimentation, and vegetation, the cold and arid conditions prevailing on Mars have allowed fault scarps, grabens, and fracture systems to remain recognizable for billions of years [23,29,30,31].
In summary, the study area represents a structurally complex transition zone between Claritas Fossae and Noctis Labyrinthus tectonic systems. Its geological setting is characterized by a dense network of tectonic lineaments distributed across different stratigraphic units: from the highly fractured Noachian basement to the Hesperian volcanic cover units affected by younger structures. This configuration suggests that the present-day structural architecture results from the superposition of multiple deformation phases, including early Noachian to Early Hesperian tectonics and later Hesperian to Amazonian reactivation. For this reason, the linking zone between the Claritas Fossae and Noctis Labyrinthus provides an ideal natural laboratory for investigating polyphase tectonics, structural inheritance, and the interaction between adjacent regional tectonic domains on Mars.
3. Materials and Methods
The structural analysis of the study area was carried out using an integrated approach consisting of: (i) regional scale geological-structural mapping of linear and curvilinear features outcropping on the Martian surface, and (ii) geostatistical analysis of the resulting datasets through agglomerative hierarchical clustering.
3.1. Geological-Structural Mapping
The geological-structural mapping was carried out in a GIS environment (QGIS v3.42) using two satellite image mosaics: the Mars MGS MOLA—MEX HRSC Blended DEM Global (nominal spatial resolution 200 m/px), and the daytime and nighttime infrared acquisitions of the Thermal Emission Imaging System (THEMIS—nominal resolution 100 m/px). The combined use of daytime and nighttime THEMIS-IR mosaics enabled comparison of surface thermal responses, highlighting structural alignments of contrasts related to material thermal properties under different day/night conditions. In addition, the MOLA DEM was further processed to obtain four different lighting conditions (0°, 45°, 90°, and 135°). This proved to be particularly helpful for a more accurate photo-geologic interpretation, helping in revealing lineaments that could be hidden using a single direction of the light [13,32,33]. Using both datasets allowed us to jointly evaluate topographic and tone contrast variations related to tectonic lineaments such as faults, graben, and semi-graben. The scale at which the geological-structural mapping was carried out (1:2 500,000) was selected according to the spatial resolution of the two used datasets, ensuring consistency with the level of detail that can be reliably interpreted. At this scale, the minimum distinguishable size on screen (≈0.5 mm) corresponds to ~1250 m on the ground. Consequently, we focused the mapping on kilometric-scale lineaments (typically >10 km) to avoid interpretations exceeding the resolution limits of the datasets.
The geo-tectonic features analyzed in this work are well-defined, regionally distributed lineaments with regional-scale dimensions, corresponding to morphologies of primary tectonic and/or volcanic origin (some examples are shown in Figure 3). Note that, Mars has experienced very low rates of erosion over its entire history, comparable to that of cratonic areas on Earth [23,29,30]. Therefore, exogenous processes have a negligible impact in shaping the regional scale landscapes on Mars and the evidence of endogenous processes that have acted since the formation of the planet has been preserved up to the present. Consequently, erosional features cannot be resolved at the scale of our analysis and the lineament network exposed in the linking zone between Claritas Fossae and Noctis Labyrinthus can be interpreted as a well-preserved record of regional tectonic activity rather than as the product of recent erosional processes.
Figure 3.
Examples of the of different lineaments mapped as lineaments (A) study area on the Odyssey THEMIS-IR Day Global Mosaic 100 m. (B) Volcano-tectonic structures: collapsed lava tubes and pit chains. (C,D) Extensive tectonic lineaments such as grabens, semi-grabens, and normal fault scarps.
We used consistent criteria to map lineaments based on the adopted regional observation scale and the morphological characteristics of the lineaments. These criteria are the followings:
- Scarps were represented by segments traced along the scarp edge.
- Grabens were mapped by tracing both bounding scarps, considering spacing of less than 2 km as a minimum threshold. The 2 km threshold was defined in relation to the resolution of the HRSC-MOLA DEM: with a nominal resolution of 200 m/pixels, 2000 m corresponds to 10 pixels. Scarps delimiting grabens with spacing less than 2 km are difficult to distinguish at the adopted scale; therefore, a single representative lineament was traced along the central axis of the depression.
- Lineaments intersected or interrupted by discontinuities that did not show evident lateral displacement at the used scale were mapped as continuous lines, to preserve structural continuity and avoid artificial fragmentation.
- Pit crater chains were mapped by tracing the central axis of the alignment.
- The minimum length of lineaments included in the final dataset was set at 10 km. Lineaments less than 10 km long were excluded during dataset construction/validation. This threshold was established primarily based on data resolution (10 km = 50 pixels with the MOLA DEM resolution of 200 m/pixel) and, secondarily, on the need to map tectonic lineaments of regional significance useful for understanding the tectonic-structural framework of the study area.
- Isolated circular features (i.e., not arranged along alignments as in the case of pit chains) were excluded from the mapping. These include impact and isolated volcanic craters.
Mapped lineaments were stored as a vector layer, eventually used for the clustering analysis.
3.2. Clustering Analysis
Clustering methods are increasingly being used both on Earth and on other planetary surfaces to unravel tectonically controlled regions [21,32,34,35,36,37,38,39]. These methods allow grouping objects into clusters based on their intrinsic characteristics, technically referred to as attributes, thereby reducing operator subjectivity [16,21,40,41]. Resulting clusters are homogeneous and distinct so that each cluster includes only objects sharing the most similar attributes [16,21,42]. Four main clustering methods are conventionally distinguished based on the adopted categorization model [43]: partitioning, hierarchical, arbitrary origin, and mutual similarity methods. In the case of multivariate analyses (i.e., considering two or more variables measured for each object), hierarchical methods are preferred in many fields including waste management [44], engineering [45], and tectonic investigations [46,47,48,49,50,51]. The advantage of hierarchical approach is that in a single run, it can handle all possible clusters, therefore, reproducing the hierarchical structure of the data, classifying multivariate populations, and identifying significant groups or clusters [52]. Two main hierarchical techniques exist: divisive and agglomerative. With the agglomerative approach, each object represents at first one single cluster (n objects = n clusters). Then, the algorithm progressively groups objects into clusters as a function of their degree of dissimilarity (or statistical distance) which measures how two objects differ from each other. The analysis ends when all the objects are included in a single cluster (n objects = 1 cluster). On the contrary, the divisive technique starts with a single cluster including all the objects and ends with all the objects representing one single cluster. In this work, we applied agglomerative hierarchical clustering on the lineaments mapped over the study area following the method presented in [20]. We executed the algorithm through the “cluster” package (v2.1.8.1—[53]) in R environment (v4.5.2). To compute the dissimilarity matrix, we used the “daisy” function which implements the Gower dissimilarity coefficient [54]. Gower’s method allows specifying weights to each single attribute. In this way, we have been able to evaluate the geological relevance of the different attributes of each lineament and, eventually, of each cluster. Then, we used the “hclust” function, based on the “Ward.D2” agglomeration method [55,56] that during each step groups the clusters that produce the smallest possible increase in the sum of the squares of the intra-cluster deviations. This approach tends to form compact clusters, minimizing in-between-cluster inhomogeneity and promoting a greater separation between clusters.
3.2.1. Agglomerative Hierarchical Clustering: Parameters and Criteria
The effectiveness of the agglomerative hierarchical clustering method critically depends on two main aspects: (1) the selection of the attributes and their relative weighting, and (2) the selection of the optimal number of clusters [21].
- The choice of the attributes (in our study case azimuth, length, sinuosity, position, and geology) greatly influences the structure of the resulting clusters; therefore, they should be selected according to the intrinsic properties of the objects under investigation. In geological applications objects may be described by several different attributes related to different relevant characteristics (e.g., geometry, spatial distribution, stratigraphic relationships). Consequently, this choice should be guided also considering the final objective on the analysis.
- Agglomerative hierarchical clustering does not stop when the “best” group of clusters is obtained but when all objects are included in a single cluster. Several methods exist to determine the optimal number of clusters. In the present study, we used the Silhouette index (—see Section 3.2.4) [16] which evaluates the statistical robustness of the obtained clusters and groups of clusters and is sensitive to the number of attributes, their weight, and degree of variability. Nevertheless, the final selection of cluster cannot rely exclusively on a statistical criterion. The coherence of clusters with respect to the geological context and the investigated objects must be considered as well to evaluate the geological significance of the resulting cluster distribution.
It follows that the geological expertise of the operator is essential in both the design and execution of the analysis. In one case, the Silhouette index provides a statistical measure but does not replace verification of the geological significance of the results. On the other hand, only a specific geological knowhow can combine the scale, the objective of the analysis, and the nature of the investigated objects to provide the most meaningful combination of attributes.
3.2.2. Attributes
As stated in the previous paragraph, the choice of the attributes represents one of the most critical aspects of the clustering method and it should be guided by the nature of the objects and the ultimate purpose of the analysis [21]. In this study, five attributes were selected among the most relevant geological characteristics of the lineaments: azimuth, length, sinuosity, centroid position, and age of the terrain on which the lineament occur. All attributes were calculated or derived in QGIS:
- The azimuth represents the clockwise angle between geographic north and the lineament. The clustering algorithm operates on absolute numerical values and does not account for the circular nature of directional data. Therefore, it cannot distinguish the relation between opposite angles which, in geology, refer to the same direction. In other words, two lineaments with, for instance, azimuth 45° and 225° are considered by the algorithm as two very different objects with no relations (i.e., high dissimilarity) despite they are parallel and can be grouped in the same cluster by the azimuthal point of view. This represents a major issue that needs to be addressed to properly use the azimuth in such analysis. In this work, the azimuth was expressed in the range 0° to 179°. To further handle boundary effects associated with N-S or nearly N-S directions, lineaments included in the arbitrary defined interval of 10° between 0–9.99° and 170–179.99° were duplicated. The duplicated values were then shifted by −180° and +180°, respectively, generating two additional groups within the ranges −10° to −0.01° and 180° to 189.99°. This procedure allows the clustering algorithm to correctly evaluate similarity between lineaments with near-boundary orientations, preventing artificial separation due to numerical discontinuities. Following the clustering analysis, duplicated lineaments were inspected and, based on the distribution of clusters, only one lineament from each duplicated pair was retained for interpretation. Although this procedure introduces a degree of subjectivity, its impact is expected to be negligible. In this study, duplicated lineaments represent less than 2% of the total dataset and, therefore, do not significantly affect the statistical results. In cases where duplication affects larger portions of the dataset, the narrow angular interval involved makes it likely that entire clusters are replicated, rendering the choice of which duplicate to retain effectively equivalent. Overall, this approach proved effective in allowing the algorithm to identify and group parallel or sub-parallel N–S-oriented lineaments, avoiding artifacts related to the use of absolute angular values.
- Length is the effective length in kilometers of the lineament.
- Sinuosity was defined as the ratio between the effective length of the lineament and the Euclidean distance between the two vertices. With this definition, values span from 1 (perfectly linear object) to +∞ (circular object).
- Defining the coordinates of the centroid of each lineament in such a way they could be properly used in the clustering algorithm is another issue that needed to be addressed. Latitude and longitude represent two values strictly connected that the clustering algorithm handles like two different parameters with no mutual relation, similarly to opposite angles for the azimuth. Therefore, finding a single value that combined latitude and longitude to uniquely represent the position of each lineament was fundamental. In this work, we decided to use the Euclidean distance, calculated through the Pythagorean theorem, between each centroid and the origin (i.e., latitude 0° and longitude 0°) of the reference system used (Mars_2000_(Sphere)—ESRI: 104971—[20]) to define the position of the lineament in space.
- To define the age of the terrains, we used as reference the geologic map of the Thaumasia region from [2] whose regional scale is the closest to that applied in this work. Since the study area extends partially beyond the northern boundaries of Dohm’s map, it was necessary to extend the original geological mapping further north (Figure 2B). This extension was made possible by the reduced extension of the area to be integrated and by the clear morphological boundaries among the just three units involved (Hesperian lava flow units—Hsu, Amazonian lava flow units—AHt3, and the underlying Noachian basement—Nf). The geological mapping was carried out through digitization and vector “merge” operations within QGIS using daytime THEMIS-IR and Mars MGS MOLA DEM [57,58,59]. We identified the geological units adjacent to the northern margin of the Dohm’s map, then we traced the geological contacts through morphological and stratigraphic interpretation following those defined by [2]. The resulting, extended geological map was finally used to assign to each lineament the age of the terrain on which they occur. In those cases, in which a lineament affects multiple terrains, we assigned the age of the youngest. The study area includes units of all three geological periods of Mars, including some internal subdivision. To ease the analysis, we decided to classify lineaments following just the three main periods: Noachian (4.1–3.7 Gy), Hesperian (3.7–2.9 Gy), and Amazonian (2.9 Gy-present). Since the clustering algorithm operates on numerical variables, non-numerical attributes must be encoded. To this end, each geological period was assigned an arbitrary numerical value: Noachian = 50, Hesperian = 100, and Amazonian = 150. This encoding represents a necessary simplification to incorporate geological information into the clustering analysis.
3.2.3. Data Preparation and Standardization
The five attributes where organized in a matrix with dimension, where is the number of mapped lineaments and is the number of attributes considered in the test (from 1 to 5 in this study case). The values of the five considered attributes are characterized by ranges and scales very different one to each other; therefore, a z-score (z) standardization was applied to allow the comparison using the following equation:
where is the value of each attribute, is the mean, and is the standard deviation. This allowed all the attributes to be standardized within ranges of values with mean null and standard deviation equal to 1. In this way, the attributes can be used in the clustering analysis avoiding different weight due to distribution or variability.
3.2.4. Silhouette Index
As anticipated in Section 3.2.1, in the present work the Silhouette index () [15,16] was used to evaluate the statistical robustness of the resulting clusters and groups of clusters. The following equation define the Silhouette index for each object in a cluster :
is the average dissimilarity of a single object with respect to all other objects in (internal dissimilarity); is the minimum average dissimilarity between object and all observations in any other cluster and it is defined as follows:
where d(i, C) is the average dissimilarity between object and objects in cluster .
varies in the range from −1 to +1. Values close to +1 indicate well-classified objects within the cluster. Values close to 0 refer to objects at the boundary between two clusters, whereas negative values indicate objects likely assigned to a wrong cluster.
For each group of clusters the mean Silhouette is computed to assess the robustness of the entire subdivision by averaging for all objects in the in the dataset (). Following [16], in Table 1, the interpretation of the different possible values of are shown. The optimal number of clusters is defined when is as highest. The mean Silhouette index was used as a quantitative criterion to compare clustering solutions. However, the final selection of the number of clusters was based on a compromise between statistical robustness and geological significance.
Table 1.
Statistical interpretation of the clustering structure as a function of , modified after [16].
4. Results
4.1. Statistical Characterization of the Mapped Lineaments
The combined analysis of daytime and nighttime THEMIS thermal mosaics, and of four shaded-relief images derived from the Mars MGS MOLA–MEX HRSC Blended DEM Global 200 m dataset, led to the identification of 1729 lineaments (Figure 4). Mapped lineaments are mainly localized in an NNW-SSE trending corridor, representing the Noachian basement and the most elevated topography (Figure 2A). Here, 1303 lineaments, approximately 75% of the total dataset, were mapped. The remaining 25% (426 lineaments) crop out within Hesperian units in the eastern and southern sectors of the study area. Mapped lineaments are characterized by complex cross-cutting patterns and multiple azimuthal directions. The azimuthal analysis of the 1729 lineaments, represented by the rose diagram in Figure 4, revealed a dominant NNE–SSW trend and two secondary NW-SE, and ENE-WSW trends.
Figure 4.
Map of the 1729 identified lineaments overlain on the daytime THEMIS-IR mosaic (Mars Odyssey THEMIS-IR Day Global Mosaic 100 m v12). On the (top right), the cumulative rose diagram of all mapped lineaments is shown. Nb = basement complex; Nf = older fractured materials; Nfc = older flow and construct materials; Hf = younger fractured materials; Hsu = upper member, Syria Planum Formation; Hsl1 = older flows of the lower member, Syria Planum Formation; AHt3 = Tharsis Montes Formation.
Regarding sinuosity, the mean and modal values, respectively, 1.01 and 1.00, indicate that the mapped lineaments are predominantly rectilinear. The length distribution shows a mean value of 26.3 km and a modal value of 16.7 km with only 6 lineaments exceeding 100 km. The statistical parameters of the attributes used for the subsequent clustering analysis (excluding geology due to the artificial encoding, see Section 3.2.2) are shown in Table 2.
Table 2.
Statistical parameters of azimuth, sinuosity, length, and centroid position for the 1729 mapped lineaments.
4.2. Lineament Classification Based on the Clustering Analysis
A total of 68 tests were performed using the following attributes: azimuth, sinuosity, length, position, and the age of the terrain on which each lineament occurs. These attributes were used both individually and in different combinations. Additional tests were also performed by assigning different weights to selected attributes.
Although the clustering procedure goes from to 1 cluster including all objects, we selected for each test the results obtained with 3 to 6 clusters. This range was selected because solutions with the number of clusters consistently led to excessive fragmentation of the dataset and low to very low mean Silhouette values, indicating statistically weak to poorly defined clustering structures (Table 1). Below, only the two tests used for the geological interpretation are described, hereinafter referred to CR1 and CR2 (CR = Clustering Result). Specifically, CR1 considered the attributes already successfully used by [21] for the tectonic investigation of the Claritas Fossae. In CR2 we introduced the geology as a new attribute to prove its applicability in clustering analysis for tectonic investigations and its influence in the results. A selection of the most meaningful tests is reported in the Supplementary Materials to show to the readers the variability of the results based on the attributes used, their statistical weight, and the number of clusters.
The two tests deemed the most geologically and statistically meaningful for the present work are CR1 and CR2, shown in Figure 5. A number of clusters k = 6 and the following combinations of attributes were considered:
Figure 5.
Distribution of the clusters obtained from: (A) CR1: 2Azimuth + Sinuosity + Length + Position and k = 6; (B) CR2: 3Azimuth + Sinuosity + Length + Position + 2Geology and k = 6. Nb = basement complex; Nf = older fractured materials; Nfc = older flow and construct materials; Hf = younger fractured materials; Hsu = upper member, Syria Planum Formation; Hsl1 = older flows of the lower member, Syria Planum Formation; AHt3 = Tharsis Montes Formation.
- CR1: Azimuth, sinuosity, length, and centroid position, with double weight assigned to azimuth (2Azimuth + Sinuosity + Length + Position—Figure 5A);
- CR2: Azimuth, sinuosity, length, centroid position, and geology, with triple weight assigned to azimuth and double to geology (3Azimuth + Sinuosity + Length + Position + 2Geology—Figure 5B).
The decision to assign greater weight to azimuth and geology was based on the aim of subordinating secondary geometric parameters, such as length and sinuosity, to the primary structural/geological attributes, i.e., orientation and relative age.
In both CRs, the first three clusters include lineaments cutting Noachian units, namely Nb, Nf, and Nfc, whereas the latter three include lineaments occurring within the Hesperian lava-flow cover units, namely Hf, Hsu, and Hsl1. The comparison between CR1 and CR2 shows that the overall cluster subdivision is broadly similar. This is shown in Table 3, where even the attributes that had a lower influence on the final subdivision display comparable, and in some cases, identical, mean values, and standard deviations, such as the mean length of Clusters 1 and 2. Nevertheless, the inclusion of the geology attribute produces a non-negligible redistribution of lineaments among clusters, especially where lineaments with similar azimuthal orientations occur in geologically different terrains. More specifically:
Table 3.
Mean values and standard deviations of the attributes for each cluster identified in the CRs shown in Figure 5. In CR2, the geology attribute was included using the numerical coding described in the Methods section.
- Cluster 1 is substantially comparable in both CRs. The number of assigned lineaments increases only slightly in CR2, from 415 to 442, and the NNE–SSW orientation remains basically unchanged, with mean azimuths of 18° and 17°, respectively. The spatial distribution is also similar, with both clusters mainly occurring in the central part of the study area, within the Noachian basement.
- Cluster 2 maintains the same general ENE–WSW orientation in both CRs, with mean azimuths of 75° and 76°, respectively. However, in CR2, the number of lineaments decreases by approximately 23%, from 454 to 350. This decrease is related to the separation between lineaments occurring in the Noachian basement and those cutting the Hesperian cover units. In CR2, Cluster 2 is, therefore, more strictly associated with the Noachian basement, whereas the ENE–WSW Hesperian lineaments are separated and grouped into Cluster 4.
- Cluster 3 shows a more pronounced difference between the two CRs, both in terms of mean orientation, 144° versus 154°, and in the number of assigned lineaments, which increases substantially in CR2, from 355 to 512. This increase suggests that, with the inclusion of the geology attribute and the different weighting of the other parameters, part of the lineaments assigned to Cluster 4 in CR1 were reclassified into Cluster 3 in CR2. These lineaments mainly occur in the central part of the study area and remain associated with the Noachian basement.
- Cluster 4 is the cases in which the geology attribute produces the most evident variation. This is reflected both in the mean orientation, which changes from 172° to 69°, and in the number of assigned lineaments, which decreases markedly from 228 to 74. This change is also coupled with a different spatial distribution, shifted toward the eastern sectors of the study area in CR2. This indicates that the inclusion of geology not only redistributes part of the lineaments assigned to Cluster 4 in CR1 into other groups, especially Cluster 3 in CR2, but also isolates a distinct group of ENE–WSW lineaments associated with the Hesperian cover units. These lineaments are, therefore, distinguished from the ENE–WSW lineaments attributed to the Noachian basement, which in CR1 were included in Cluster 2.
- Cluster 5 maintains a nearly unchanged NW–SE orientation in both CRs, with mean azimuths of 154° and 153°, respectively. The number of assigned lineaments increases moderately, from 149 to 242, and the spatial distribution remains similar in both CRs. With the inclusion of the geology attribute, Cluster 5 becomes more clearly defined, incorporating lineaments associated with the Hesperian cover units that, in CR1, were distributed among other clusters, especially Cluster 3.
- Cluster 6 shows good correspondence between the two CRs, both in terms of mean orientation, 6° versus 11°, corresponding to an NNE–SSW trend, and in the number of assigned lineaments, which decreases only slightly from 128 to 109. The spatial distribution remains unchanged.
In summary, the inclusion of the geology attribute efficiently discriminates lineaments with similar orientations but belonging to geologically different terrains. In addition, CR2 shows higher statistical robustness than CR1, as indicated by the mean Silhouette index: in CR1, the mean Silhouette value is 0.26, corresponding to a weak clustering structure, by contrast, in CR2, the mean Silhouette value reaches 0.52, indicating a reasonable structure and therefore a more robust classification according to the criteria proposed by [16]. This provides an additional criterion supporting the selection of CR2, which is, therefore, considered the most significant solution for the geological–structural interpretation of the clusters discussed in the next section.
5. Discussion
The objective of the present work was to analyze the geological-structural setting of the transition zone between Claritas Fossae and Noctis Labyrinthus for better understanding the tectonic evolution of the Thaumasia region on Mars. The adopted approach involved a geological–structural mapping using satellite image mosaics integrated with an agglomerative hierarchical clustering workflow. Among the numerous clustering tests conducted on the 1729 mapped lineaments, CR2 was considered the most significant for tectonic interpretations from both statistical () and geological points of view.
For a better visualization, the six clusters obtained with CR2 are shown individually in Figure 6. The orientation of the six clusters, represented through the rose diagrams, shows that two clusters (2, 4) are nearly parallel with a E-W orientation while the other four (1, 3, 5, 6) clusters span from NNW-SSE to NNE-SSW. The spatial distribution of the clusters shows that three (1, 2, 3) developed on Noachian basement units (Nb, Nf, and Nfc) and three (4, 5, 6) within Hesperian lava flow units (Hf, Hsu, and Hsl1). In detail, Cluster 1 (Figure 6A—26% of the total dataset) consists of NNE–SSW oriented lineaments mainly concentrated in the central-southern portion of the study area, following the northward trend of the Claritas Fossae. Cluster 2 (Figure 6B—20%) is characterized by ENE–WSW orientation and it is distributed within the north-central portion of the Noachian basement, with an azimuthal direction similar to the main structural trend of the Noctis Labyrinthus. Cluster 3 (Figure 6C) is the most populated cluster of the entire dataset (30%) and includes lineaments relatively uniformly distributed across the Noachian basement with a predominant NNW-SSE orientation. Cluster 4 (Figure 6D—4%), Cluster 5 (Figure 6E—14%), and Cluster 6 (Figure 6D—6%) outcrop within Hesperian units and share similar orientations with Cluster 2, Cluster 3, and Cluster 1, respectively. Moreover, Clusters 1, 5, 6 present a high spatial density located in the southern portion of the study area.
Figure 6.
Individual clusters obtained from cCR2. Each panel shows the spatial distribution of a single cluster superimposed on the daytime THEMIS-IR mosaic, together with the boundaries and abbreviations of the geological units derived from the modified map of [2]. The rose diagram in each panel shows the orientation distribution of the lineaments belonging to the corresponding cluster. (A) Cluster 1; (B) Cluster 2; (C) Cluster 3; (D) Cluster 4; (E) Cluster 5; (F) Cluster 6. Nb = basement complex; Nf = older fractured materials; Hf = younger fractured materials; Hsu = Upper member, Syria Planum Formation; Hsl1 = Older flows of the lower member, Syria Planum Formation; AHt3 = Tharsis Montes Formation.
Clusters occurring in Noachian terrains collectively include 1304 lineaments, corresponding to 75% of the total dataset, highlighting that the oldest terrains of the study area between the Claritas Fossae and Noctis Labyrinthus record most of the identified tectonic deformation. This may reflect the effect of Hesperian lava flows, which likely obliterated part of the tectonic lineaments developed within the Noachian basement, and/or a decrease in tectonic activity during the Hesperian, as also suggested by other authors [1,3]. On the other hand, the azimuthal similarities between clusters on different terrains (i.e., Cluster 1-Cluster 6, Cluster 2-Cluster 4; Cluster 3-Cluster 5) may suggest that a regional-scale tectonic event occurred during the Hesperian leading to the reactivation and eastward propagation on Hesperian units of older Noachian tectonic lineaments or to the formation of new lineaments with orientations similar to the pre-existing ones. To analyze the geological implications of our findings, in the following paragraphs, we compare the spatial distribution and the orientation of the clusters with the tectonic evolution of the peripheral regional tectonic domains (i.e., Claritas Fossae and Noctis Labyrinthus), and with the regional deformational phases of the Thaumasia region proposed in the literature.
5.1. Structural Relations with Peripheral Regional Scale Tectonic Domains
To assess whether the clusters exhibit structural relation with the Claritas Fossae to the south and Noctis Labyrinthus to the north, we compared our results with two studies based on similar methodological approaches: [12], focused on the Claritas Fossae, and [4], focused on the Noctis Labyrinthus. The results of this comparison are shown in Figure 7 and summarized in Table 4. It is important to highlight that, in the present study, sense of movement and cross-cutting relationships were not analyzed; therefore, kinematic interpretations are inferred only through both azimuthal and spatial consistency with previous works. Similar approaches have been successfully used on other planetary surfaces, e.g., [60].
Figure 7.
Distribution of the clusters from CR2, superimposed on the Mars Odyssey THEMIS-IR Day Global Mosaic 100 m v12 and the MOLA DEM. The red box outlines the study area. The circular boxes to the bottom of each panels show the rose diagrams of Set 1 (red), Set 2 (yellow), and Set 4 (purple) from [21], and of the D2 phase (grey) from [4]. On the right of each panel, the rose diagrams of the clusters identified in this study are shown: Cluster 1 (green), Cluster 5 (pink), Cluster 6 (purple), Cluster 2 (red), Cluster 4 (blue), and Cluster 3 (yellow). (A) Clusters 1 (green), 5 (pink), and 6 (purple) show affinity with the Claritas Fossae tectonic province. (B) Clusters 2 (red) and 4 (blue) are associated with the Noctis Labyrinthus tectonic province. (C) Cluster 3 (yellow) shows intermediate characteristics between both tectonic provinces.
Table 4.
Comparison between the cluster of CR2 and the sets from [12] for the Claritas Fossae and the phases from [4] for the Noctis Labyrinthus. The last column shows the most similar structural domain (CF: Claritas Fossae; NL: Noctis Labyrinthus).
5.1.1. Claritas Fossae
251 regional-scale tectonic lineaments were mapped by [12] within the Claritas Fossae. The authors identified four main sets based on their orientation and spatial distribution. The sets were interpreted as part of a Riedel shear structural framework in which Set 1 (azimuth 172°) is parallel to the Principal Displacement Zone (PDZ), Set 2 (20°) corresponds to R-shear structures, Set 3 (92°) to tensional structures (T-structures), and Set 4 (140°) to P-shear structures. Overall, the proposed framework was included in a right-lateral transtensional geodynamic setting consisting of two main phases of deformation: (i) Late Noachian to Early Hesperian right-lateral strike-slip regime responsible for the development of the Riedel-type structural pattern, and (ii) Late Hesperian/Early Amazonian right-lateral transtensional reactivation. This latter phase was characterized by a stronger extensional component which led to the formation of the Claritas Rupes, interpreted as the superficial manifestation of a crustal scale listric normal fault [11,12,13,17].
Comparison between the clusters identified in this study and the four sets from [12] revealed significant similarities (Figure 7A, Table 4). Specifically, Cluster 1 is parallel to Set 2 (azimuth 17° and 20°, respectively); Cluster 3 (azimuth 154°, s.d. 19°) shows azimuthal correspondence with both Set 1 (azimuth 172°, s.d. 13°) and Set 4 (azimuth 140°, s.d. 10°). All these clusters and sets developed on Noachian terrains, suggesting that Clusters 1 and 3 may represent the northward propagation of the deformation occurred during the first Late Noachian to Early Hesperian right-lateral strike-slip phase. Cluster 5 (azimuth 153°, s.d. 20°) and Cluster 6 (azimuth 11°, s.d. 10°) show azimuthal correspondence respectively with Set 1 (azimuth 172°, s.d. 13°), which developed in both Noachian and Hesperian terrains, and Set 2 (azimuth 17°, s.d. 6°), which occurs only in Noachian terrains. Clusters 5 and 6 both developed primarily on Hesperian terrains, suggesting a more recent formation likely related to the second proposed Late Hesperian/Early Amazonian phase of reactivation. In addition, Clusters 1, 5, and 6 are located in the southernmost part of the study area, therefore, closer to the Claritas Fossae rather than to the Noctis Labyrinthus. These similar azimuthal and spatial distribution might relate Clusters 1, 5, and 6 of the present study and Sets 1 and 2 from [12] to a common geo-tectonic origin. On the other hand, Cluster 3 is widespread over the entire Noachian basement, suggesting a possible influence of both the regional tectonic domains.
5.1.2. Noctis Labyrinthus
Ref. [4] reconstructed the tectonic evolution of Noctis Labyrinthus through kinematic analysis and cross-cutting relations, identifying two main deformational phases at the scale of their study, namely D1 and D2. D1 includes several Noachian major faults with a NE–SW trend, interpreted as the result of a left-lateral transtensional deformation. D2 is a predominantly extensional phase related to the development of the Noctis Labyrinthus-Valles Marineris system (Late Noachian-Early Hesperian) and is characterized by a dominant WNW–ESE trend and a secondary NNW-SSE trend. A third phase (D3) is also described by the authors, but it does not affect Noctis Labyrinthus referring to the Valles Marineris alone; therefore, D3 was not considered in this study.
Within the framework proposed by [4], Cluster 2 (azimuth 76°, s.d. 20°) and Cluster 4 (azimuth 69°, s.d. 16°) resemble the WNW-ESE orientation of the phase D2. Their spatial distribution is mainly centered in the central-northernmost part of the study area, further supporting a closer spatial relation with the Noctis Labyrinthus rather than to the Claritas Fossae. In this way, Clusters 2 and 4 may represent the south-westward propagation of the deformation which led to the development of the Noctis Labyrinthus-Valles Marineris system occurred in the period Late Noachian-Early Hesperian. This interpretation is also supported by [61]. The authors described structures identified in Noctis Labyrinthus as inherited lineaments formed along azimuthal trends compatible with those of Clusters 2 and 4. While this comparison does not allow a direct one-to-one correlation between the individual clusters and specific tectonic phases, it reinforces the interpretation that lineaments in the northern portion of the study area belong to the Noctis Labyrinthus structural domain.
5.2. Regional Deformational Phases of the Thaumasia Region
Among the numerous studies conducted on Tharsis and, more specifically, on the Thaumasia region to reconstruct the volcano-tectonic evolution, we decided to compare our results with those of [1]. Initially, we also considered the model proposed by [3], which provides a complementary geological reconstruction of the deformational history of the region. Although the two studies adopt similar methodological approaches, they work at very different spatial scales: hemispheric for [3], regional and focused on Thaumasia for [1]. Local-scale interpretations cannot be separated from the regional tectonic context and the influence of the main surrounding tectonic lineaments. However, considering that the study area investigated in this work is limited to the north-western portion of the Thaumasia region, and given the regional mapping scale adopted (1:2,500,000), the geological interpretation of the identified clusters was ultimately based exclusively on the palaeotectonic map of [2] (scale of 1:5,000,000) derived from [1] (Figure 2B). This map represents the most suitable cartographic reference in terms of scale and resolution and is therefore compatible with the present study. This allowed the comparison in terms of azimuthal orientation and spatial distribution between the clusters identified in this work and the phases reported in the palaeotectonic map. This comparison was carried out considering the 1729 lineaments mapped in this study and the 1284 tectonic structures derived from [1,2] falling within the study area (Figure 8).
Figure 8.
Correlation between the clusters identified in this study (left-hand panels) and the tectonic structures and related phases identified by [1,2] (right-hand panels). The left-hand panels (A,C,E) show the spatial distribution of the clusters from this study in the related phases (Phase 1: Noachian; Phase 3: Early–Late Hesperian; Phase 4: Late Hesperian–Early Amazonian), together with their respective rose diagrams, which show the dominant azimuthal direction. The right-hand panels (B,D,F) show the tectonic lineaments attributed to Phase 1, Phase 3, and Phase 4 from [1,2], respectively, superimposed on the geological map modified [2] and accompanied by the corresponding rose diagrams.
5.2.1. Noachian Phase
Clusters occurring within the Noachian basement (Clusters 1, 2, and 3) show a correlation with the tectonic lineaments mapped and assigned to Phase 1 by [1,2] (Figure 8A,B). Phase 1 (Figure 8B) was dated to the Noachian (4.1–3.7 Ga) and corresponds to the maximum regional tectonic activity in the deformational history of the Thaumasia region. According to [1,2], this phase is associated with the formation and uplift of the Thaumasia region, the development of radial extensional deformation, the origin of 14 volcanoes distributed along rift systems, and the development of thrust faults along the southern and eastern margins of the region. The comparison with Phase 1, therefore, indicates that the Noachian basement within the study area preserves the record of the phase of maximum regional tectonic activity described by [1,2]. Since Cluster 1 can be related to the Claritas Fossae tectonic province (Figure 7A), Cluster 2 (Figure 7B) to the Noctis Labyrinthus tectonic province, and Cluster 3 to both provinces (Figure 7C), we suggest that the study area represents a transitional sector between the northern part of the Claritas Fossae and the south-western projection of extensional tectonic lineaments of the Noctis Labyrinthus. The study area is thus a linking zone between Noctis Labyrinthus and Claritas Fossae and its structural setting results from the tectonic events that affected the nearby provinces during the Noachian.
5.2.2. Hesperian Phase
In the case of the Hesperian units, Clusters 4, 5, and 6 (Figure 8C,E) show a correlation with lineaments of Phases 3 and 4 defined by [1,2] (Figure 8D,F). According to [1,2], Phase 3, dated from the Early to Late Hesperian (3.6–2.8 Ga), corresponds to the formation of the younger ridged plains, consisting of extensive basaltic lava flows marking the peak of regional volcanism, and is associated with the development of grabens radial to Syria Planum and wrinkle ridges. Phase 4, dated between the Late Hesperian and Early Amazonian (~2.9 Ga), instead corresponds to a phase of significant reduction in tectonic activity within the Thaumasia region. Among the three clusters identified in this study, Cluster 6 (Figure 8C) shows correspondence with Phase 3 (Figure 8D): its NNE-SSW main trend and its spatial distribution are compatible with those of the structures interpreted by [1,2] for this phase. The relatively limited number of lineaments assigned to this cluster (109, approximately 6% of the whole dataset) suggests that tectonic deformation during this phase was less intense than that recognized within the Noachian basement. Cluster 5 occupies an intermediate position, as it presents characteristics compatible with both Phase 3 and 4 (Figure 8F). This cluster may, therefore, reflect a transitional stage between the two phases. Finally, Cluster 4 shows correlation with Phase 4, since its ENE–WSW trend is similar to that of some of the lineaments attributed to this phase, and its distribution within the central-eastern portion of the study area is compatible with the youngest structures represented in the palaeotectonic map of [2].
Overall, the comparison with Phases 3 and 4 indicates that the study area continued to record tectonic activity during the Hesperian, although at lower intensity than during the Noachian. The small number of lineaments assigned to Clusters 4, 5, and 6 suggests a progressive decrease in deformation throughout this period. The observed correlation between clusters and phases is also consistent with a polyphase tectonic deformation history, as previously proposed in the literature for the Claritas Fossae, Noctis Labyrinthus and, generally, for the whole Thaumasia Region (e.g., [12] for Claritas Fossae and [4] for Noctis Labyrinthus). According to [1,2], tectonic activity in these provinces ended between the Late Hesperian and Early Amazonian for the Claritas Fossae, and during the Early Amazonian for the Noctis Labyrinthus.
5.3. Regional Tectonic Model
The correlation between the clusters obtained from CR2 and the adjacent regional-scale studies (Section 5.1) together with the regional deformational phases (Section 5.2), suggest that the study region represents a structural link between the Claritas Fossae and Noctis Labyrinthus structural domains. The studied linking zone records a complex and long-lasting deformational history began in the Noachian and followed by subsequent reactivation(s) during the Hesperian.
The comparison with the two adjacent tectonic provinces further strengthens the polyphasic interpretation and also allows the various clusters to be correlated with larger-scale structural domains. Based on the correlation with the evolutionary model presented in [12], the structural pattern observed in the southern portion of the study area is compatible with the right lateral transtensional/strike-slip setting described for the Claritas Fossae and characterized by a first Noachian event (cluster 1 and 3—Phase I in Figure 9) and a subsequent late Hesperian/Early Amazonian reactivation (cluster 5 and 6—Phase II in Figure 9). In the northern part of the study area, the correlation of Cluster 2 (Noachian—Figure 9) and Cluster 4 (Hesperian—Figure 9) with the Noctis Labyrinthus tectonic province also suggests a reactivation of ENE–WSW pre-existing lineaments. This is in accordance with the tectonic evolutionary model proposed by [4] for the Noctis Labyrinthus-Valles Mariners system and, in particular, with the predominantly extensional D2 tectonics phase.
Figure 9.
The distribution of the cluster over the two phases of deformation interpreted for the study area are shown. To the (left), the first phase of deformation occurred during the Noachian led to the formation of Cluster 1, related to the development of the Claritas Fossae, Cluster 2, related to the development of the Noctis Labyrinthus, and Cluster 3, which share characteristics with both structural domains. To the (right), the second Late Hesperian/Early Amazonian phase of deformation recorded by the studied linking zone, led to the formation of Clusters 5 and 6 related to the reactivation of the Claritas Fossae, and of Cluster 4 related to the Noctis Labyrinthus. Nb = basement complex; Nf = older fractured materials; Nfc = older flow and construct materials; Hf = younger fractured materials; Hsu = upper member, Syria Planum Formation; Hsl1 = older flows of the lower member, Syria Planum Formation; AHt3 = Tharsis Montes Formation.
In summary, the results indicate that the study area records the same polyphase evolution that likely affected both Claritas Fossae to the south and Noctis Labyrinthus to the north involving at least two main events. The first event (Phase I in Figure 9) occurred in the Noachian, during the maximum regional tectonic activity of the Thaumasia region (showing similarities with Phase I from [1,2]). It led to the formation of Cluster 1 and Cluster 2, related to the early development of Claritas Fossae and Noctis Labyrinthus, respectively, together with Cluster 3, which can be related to both structural domains. The second event (Phase II in Figure 9) occurred between the Hesperian and the Early Amazonian (showing similarities with both Phase 3 and 4 from [1,2]) and developed Cluster 5 and 6 related to the reactivation of the Claritas Fossae and Cluster 4, related to the Noctis Labyrinthus.
A final interesting aspect worth briefly discussing is the possible direct interaction between Claritas Fossae and Noctis Labyrinthus recorded in the linking zone during coeval tectonic events. This hypothesis is supported by two main observations: the first one involves Cluster 3 which, unlike the other clusters, includes lineaments widespread across the entire Noachian basement, suggesting a possible genesis related to the coeval influence of both regional tectonic domains. The second point of interest is provided by the counterclockwise rotation exhibited by the northern sector of the Claritas Fossae relative to its general structural trend in the southern sector. This rotation is reflected in i) the different angular relationships between Set 2 (R-shear) and Set 1 (PDZ) to the south, equal to 28° [12], and Cluster 5 (parallel to the PDZ) and Cluster 6 (parallel to R-shear) to the north, which is 38°; ii) and in the shift towards a mean N-S trend of the Noachian clusters (1 and 2) and of the Hesperian clusters (6 and 4) (Table 3). The overall rotation of the Claritas Fossae might be related to the northward propagation of the deformation during the development/reactivation that was opposed by the south-westward propagation of the Noctis Labyrinthus structure. This is consistent with extensional event D2 proposed by [4] and therefore with the development of the Noctis Labyrinthus. This aspect deserves further investigation in future works, in order to verify whether this rotation is actually attributable to such direct-coeval connection between the two regional-scale tectonic domains or to other factors.
6. Conclusions
The objective of the present work was to analyze the geological-structural setting of the transition zone between Claritas Fossae and Noctis Labyrinthus. Due to its position in-between two of the most significant regional scale tectonic lineaments of Mars, this area represents a crucial node for unravelling the tectonic evolution of the Thaumasia region. The adopted approach involved the integration of a geological-structural mapping based on the analysis of satellite image mosaics with an agglomerative hierarchical clustering analysis of the mapped lineaments. This allowed the identification of clusters of tectonic lineaments based on geologic attributes, namely azimuth, sinuosity, length, position, and age of the terrain underlying the mapped lineaments (referred to as “geology”). Based on the resulting cluster subdivision, the study area represents a structural link between Claritas Fossae and Noctis Labyrinthus. We provide evidence which confirm the polyphase tectonics, in line with previous larger regional-scale studies. Specifically, we found (i) clusters formed during the Noachian and related to the development of the Claritas Fossae (Cluster 1), to the Noctis Labyrinthus (Cluster 2), and to both (Cluster 3); and (ii) clusters related to the Hesperian/Early Amazonian reactivation of the regional deformation of both domains (Cluster 5 and 6—Claritas Fossae; Cluster 4—Noctis Labyrinthus).
Supplementary Materials
The following supporting information can be downloaded at: https://www.mdpi.com/article/10.3390/geosciences16070278/s1, Six supplementary clustering tests to complement the two presents in the manuscript. Here Figures and Tables from S1 to S6, one for each test, are shown and described.
Author Contributions
Conceptualization, F.M., E.B., P.C. and G.F.; methodology, F.M., E.B., P.C. and G.F.; software, F.M. and G.F.; validation, E.B., P.C. and G.F.; formal analysis, F.M.; data curation, P.C. and G.F.; writing—original draft preparation, F.M., E.B., P.C. and G.F.; writing—review and editing, F.M., E.B., P.C. and G.F. All authors have read and agreed to the published version of the manuscript.
Funding
This research received no external funding.
Data Availability Statement
Data will be available under request.
Acknowledgments
PC kindly acknowledges the financial support of University of Genova (FRA, Fondi Ricerca Ateneo, grant (100022-2024-FRA-2024-Cianfarra). The authors would like to acknowledge the open-source software QGIS v3.42 and the R packages v4.5.2 used for the clustering workflow. The authors also acknowledge the two anonymous reviewers whose suggestions surely improved the quality of the work.
Conflicts of Interest
The authors declare no conflicts of interest.
Abbreviations
The following abbreviations are used in this manuscript:
| PDZ | Principal Displacement Zone |
| CF | Claritas Fossae |
| NL | Noctis Labyrinthus |
References
- Dohm, J.M.; Tanaka, K.L. Geology of the Thaumasia region, Mars: Plateau development, valley origins, and magmatic evolution. Planet. Space Sci. 1999, 47, 411–431. [Google Scholar] [CrossRef] [Scilit]
- Dohm, J.M.; Tanaka, K.L.; Hare, T.M. Geologic Map of the Thaumasia Region, Mars: U.S. Geological Survey Geologic Investigations Series I–2650, 3 Sheets. 2001. Available online: https://pubs.usgs.gov/imap/i2650/ (accessed on 29 May 2026).
- Anderson, R.C.; Dohm, J.M.; Golombek, M.P.; Haldemann, A.F.C.; Franklin, B.J.; Tanaka, K.L.; Lias, J.; Peer, B. Primary centers and secondary concentrations of tectonic activity through time in the western hemisphere of Mars. J. Geophys. Res. Planets 2001, 106, 20563–20585. [Google Scholar] [CrossRef] [Scilit]
- Bistacchi, N.; Massironi, M.; Baggio, P. Large-scale fault kinematic analysis in Noctis Labyrinthus (Mars). Planet. Space Sci. 2004, 52, 215–222. [Google Scholar] [CrossRef] [Scilit]
- Montgomery, D.R.; Som, S.M.; Jackson, M.P.A.; Schreiber, B.C.; Gillespie, A.R.; Adams, J.B. Continental-scale salt tectonics on Mars and the origin of Valles Marineris and associated outflow channels. Geol. Soc. Am. Bull. 2009, 121, 117–133. [Google Scholar] [CrossRef] [Scilit]
- Smith, M.R.; Gillespie, A.R.; Montgomery, D.R.; Batbaatar, J. Crater–fault interactions: A metric for dating fault zones on planetary surfaces. Earth Planet. Sci. Lett. 2009, 284, 151–156. [Google Scholar] [CrossRef] [Scilit]
- Nahm, A.L.; Schultz, R.A. Evaluation of the orogenic belt hypothesis for the formation of the Thaumasia Highlands, Mars. J. Geophys. Res. Planets 2010, 115, E04008. [Google Scholar] [CrossRef] [Scilit]
- Hood, D.R.; Judice, T.; Karunatillake, S.; Rogers, D.; Dohm, J.M.; Susko, D.; Carnes, L.K. Assessing the geologic evolution of Greater Thaumasia, Mars. J. Geophys. Res. Planets 2016, 121, 1753–1769. [Google Scholar] [CrossRef] [Scilit]
- Bouley, S.; Baratoux, D.; Paulien, N.; Missenard, Y.; Saint-Bézar, B. The revised tectonic history of Tharsis. Earth Planet. Sci. Lett. 2018, 488, 126–133. [Google Scholar] [CrossRef] [Scilit]
- Pieterek, B.; Laban, M.; Ciążela, J.; Muszyński, A. Explosive volcanism in Noctis fossae on Mars. Icarus 2022, 375, 114851. [Google Scholar] [CrossRef] [Scilit]
- Pieterek, B.; Brož, P.; Hauber, E.; Stephan, K. Insight from the Noachian-aged fractured crust to the volcanic evolution of Mars: A case study from the Thaumasia graben and Claritas Fossae. Icarus 2024, 407, 115770. [Google Scholar] [CrossRef] [Scilit]
- Balbi, E.; Ferretti, G.; Tosi, S.; Crispini, L.; Cianfarra, P. Polyphase tectonics on Mars: Insight from the Claritas Fossae. Icarus 2024, 411, 115972. [Google Scholar] [CrossRef] [Scilit]
- Balbi, E.; Marini, F. Lineament domain analysis to unravel tectonic settings on planetary surfaces: Insights from the Claritas Fossae (Mars). Geosciences 2024, 14, 79. [Google Scholar] [CrossRef] [Scilit]
- Carboni, F.; Karagoz, O.; Kenkmann, T. Morphometry and kinematics correlation of wrinkle ridges on Mars: Insights from Trishear modelling. Icarus 2025, 425, 116330. [Google Scholar]
- Rousseeuw, P.J. Silhouettes: A graphical aid to the interpretation and validation of cluster analysis. J. Comput. Appl. Math. 1987, 20, 53–65. [Google Scholar] [CrossRef] [Scilit]
- Kaufman, L.; Rousseeuw, P.J. Finding Groups in Data: An Introduction to Cluster Analysis; Wiley: Hoboken, NJ, USA, 1990. [Google Scholar] [CrossRef] [Scilit]
- Hauber, E.; Kronberg, P. The large Thaumasia graben on Mars: Is it a rift? J. Geophys. Res. Planets 2005, 110, E07003. [Google Scholar] [CrossRef] [Scilit]
- Solomon, S.C.; Head, J.W. Evolution of the Tharsis province of Mars: The importance of heterogeneous lithospheric thickness and volcanic construction. J. Geophys. Res. Planets 1982, 87, 9755–9774. [Google Scholar] [CrossRef] [Scilit]
- Karagoz, O.; Kenkmann, T.; Wulf, G. Circum-Tharsis wrinkle ridges at Lunae Planum: Morphometry, formation, and crustal implications. Icarus 2022, 374, 114808. [Google Scholar] [CrossRef] [Scilit]
- Duxbury, T.C.; Kirk, R.L.; Archinal, B.A.; Neumann, G.A. Mars Geodesy/Cartography Working Group recommendations on Mars cartographic constants and coordinate systems. In Proceedings of the Geospatial Theory, Processing and Applications: ISPRS Commission IV Proceedings, Ottawa, ON, Canada, 9–12 July 2002. [Google Scholar]
- Balbi, E.; Cianfarra, P.; Crispini, L.; Tosi, S.; Ferretti, G. Hierarchical-agglomerative clustering analysis of geomorphic features applied to tectonic investigation of terrestrial planets: An example from Claritas Fossae, Mars. Icarus 2024, 420, 116197. [Google Scholar] [CrossRef] [Scilit]
- Tanaka, K.L.; Skinner, J.A.; Dohm, J.M.; Irwin, R.P.; Kolb, E.J.; Fortezzo, C.M.; Platz, T.; Michael, G.G.; Hare, T.M. Geologic Map of Mars; U.S. Geological Survey Scientific Investigations Map: Reston, VA, USA, 2014. [CrossRef] [Scilit]
- Vaz, D.A.; Spagnuolo, M.G.; Silvestro, S. Morphometric and geometric characterization of normal faults on Mars. Geomorphology 2014, 204, 348–365. [Google Scholar] [CrossRef] [Scilit]
- Yin, A. Structural analysis of the Valles Marineris fault zone: Possible evidence for large-scale strike-slip faulting on Mars. Lithosphere 2012, 4, 286–330. [Google Scholar] [CrossRef] [Scilit]
- Schultz, R.A. Multiple-process origin of Valles Marineris basins and troughs, Mars. Planet. Space Sci. 1998, 46, 827–834. [Google Scholar] [CrossRef] [Scilit]
- Kling, C.L.; Byrne, P.K.; Atkins, R.M.; Wegmann, K.W. Tectonic deformation and volatile loss in the formation of Noctis Labyrinthus, Mars. J. Geophys. Res. Planets 2021, 126, e2020JE006555. [Google Scholar] [CrossRef] [Scilit]
- El Yazidi, M.; Orgel, C.; Sefton-Nash, E.; De Marchi, G.; Rickbir, B.; Baratoux, D.; Bouley, S.; Filiberto, J.; D’INcecco, P.; Leone, G.; et al. Analysis of faults and pit chains in Noctis Labyrinthus: Implications for early extension and possible magmatic plumbing. Icarus 2024, 415, 116075. [Google Scholar] [CrossRef] [Scilit]
- Scott, D.H.; Tanaka, K.L. Geologic Map of the Western Equatorial Region of Mars (No. 1802-A); US Geological Survey: Reston, VA, USA, 1986. [CrossRef] [Scilit]
- Golombek, M.P.; Bridges, N.T. Erosion rates on Mars and implications for climate change: Constraints from the Pathfinder landing site. J. Geophys. Res. Planets 2000, 105, 1841–1853. [Google Scholar] [CrossRef] [Scilit]
- Golombek, M.P.; Grant, J.A.; Crumpler, L.S.; Greeley, R.; Arvidson, R.E.; Bell, J.F.; Weitz, C.M.; Sullivan, R.; Christensen, P.R.; Soderblom, L.A.; et al. Erosion rates at the Mars Exploration Rover landing sites and long-term climate change on Mars. J. Geophys. Res. Planets 2006, 111, E12S10. [Google Scholar] [CrossRef] [Scilit]
- Golombek, M.P.; Phillips, R.J. Mars tectonics. In Planetary Tectonics; Watters, T.R., Schultz, R.A., Eds.; Cambridge University Press: Cambridge, UK, 2010. [Google Scholar]
- Cianfarra, P.; Morelli, D.; Salvini, F. Geostatistical analysis of lineament domains: The study case of the Apennine Seismic Province of Italy. Geosciences 2024, 14, 131. [Google Scholar] [CrossRef] [Scilit]
- Wise, D.U.; Funiciello, R.; Parotto, M.; Salvini, F. Topographic lineament swarms: Clues to their origin from domain analysis of Italy. Geol. Soc. Am. Bull. 1985, 96, 952–967. [Google Scholar] [CrossRef] [Scilit]
- Ouillon, G.; Castaing, C.; Sornette, D. Hierarchical geometry of faulting. J. Geophys. Res. 1996, 101, 5477–5487. [Google Scholar] [CrossRef] [Scilit]
- Mazzarini, F.; D’Orazio, M. Spatial distribution of cones and satellite-detected lineaments in the Pali Aike Volcanic Field (southernmost Patagonia): Insights into the tectonic setting of a Neogene rift system. J. Volcanol. Geotherm. Res. 2003, 125, 291–305. [Google Scholar] [CrossRef] [Scilit]
- Cianfarra, P.; Salvini, F. Ice sheet surface lineaments as nonconventional indicators of East Antarctica bedrock tectonics. Geosphere 2014, 10, 1411–1418. [Google Scholar] [CrossRef] [Scilit]
- Rossi, C.; Cianfarra, P.; Salvini, F.; Mitri, G.; Massé, M. Evidence of transpressional tectonics on the Uruk Sulcus region, Ganymede. Tectonophysics 2018, 749, 72–87. [Google Scholar] [CrossRef] [Scilit]
- Aydin, O. Graph-Based Evidence Accumulation for Clustering 3D Orientation Measurements in Planetary Surface Mapping Under Relational Constraints. Appl. Comput. Geosci. 2025, 28, 100309. [Google Scholar] [CrossRef] [Scilit]
- Schmidt, G.; Galluzzi, V.; Sepe, A.; Buoninfante, S.; De Toffoli, B.; Ferranti, L.; Palumbo, P. Origin of the bulge topography within Caloris basin, Mercury. J. Geophys. Res. Planets 2026, 131, e2025JE009233. [Google Scholar] [CrossRef] [Scilit]
- Ansari, A.; Noorzad, A.; Zafarani, H. Clustering analysis of the seismic catalog of Iran. Comput. Geosci. 2009, 35, 475–486. [Google Scholar] [CrossRef] [Scilit]
- Paasche, H.; Eberle, D.G. Rapid integration of large airborne geophysical data suites using a fuzzy partitioning cluster algorithm: A tool for geological mapping and mineral exploration targeting. Explor. Geophys. 2009, 40, 277–287. [Google Scholar] [CrossRef] [Scilit]
- Mirkin, B. Mathematical Classification and Clustering; Springer: Berlin/Heidelberg, Germany, 1996. [Google Scholar] [CrossRef] [Scilit]
- Sneath, P.H.A.; Sokal, R.R. Numerical Taxonomy: The Principles and Practice of Numerical Classification; W. H. Freeman: New York, NY, USA, 1973. [Google Scholar]
- Samkhaniani, M.; Moghaddam, S.S.; Mesghali, H.; Ghajari, A.; Gozalpour, N. A machine learning approach to feature selection and uncertainty analysis for biogas production in wastewater treatment plants. Waste Manag. 2025, 197, 14–24. [Google Scholar] [CrossRef] [Scilit] [PubMed]
- Kang, Z.; Li, Y.; Liao, Y.; Yang, X.; Li, Z. A Dual-Branch Feature Construction for Hot Jet Remote Sensing of a Certain Aero-Engine Under Diverse Operating Conditions. Aerospace 2026, 13, 350. [Google Scholar] [CrossRef] [Scilit]
- Mazzarini, F. Volcanic vent self-similar clustering and crustal thickness in the northern Main Ethiopian Rift. Geophys. Res. Lett. 2004, 31, L04604. [Google Scholar] [CrossRef] [Scilit]
- Davey, S.C.; Ernst, R.E.; Samson, C.; Grosfils, E.B. Hierarchical clustering of pit crater chains on Venus. Can. J. Earth Sci. 2013, 50, 109–126. [Google Scholar] [CrossRef] [Scilit]
- Šilhavý, J.; Minár, J.; Mentlík, P.; Sládek, J. A new artefacts resistant method for automatic lineament extraction using Multi-Hillshade Hierarchic Clustering (MHHC). Comput. Geosci. 2016, 92, 9–20. [Google Scholar] [CrossRef] [Scilit]
- Akahashi, A.; Hashimoto, M.; Hu, J.C.; Takeuchi, K.; Tsai, M.C.; Fukahata, Y. Hierarchical cluster analysis of dense GPS data and examination of the nature of the clusters associated with regional tectonics in Taiwan. J. Geophys. Res. Solid Earth 2019, 124, 5174–5191. [Google Scholar] [CrossRef] [Scilit]
- Prabhakaran, R.; Bertotti, G.; Urai, J.; Smeulders, D. Investigating spatial heterogeneity within fracture networks using hierarchical clustering and graph distance metrics. Solid Earth 2021, 12, 2159–2209. [Google Scholar] [CrossRef] [Scilit]
- Kaas, O.; Šilhavý, J.; Kolingerová, I.; Čada, V. Accelerated multi-hillshade hierarchic clustering for automatic lineament extraction. J. Geogr. Syst. 2023, 26, 73–90. [Google Scholar] [CrossRef] [Scilit]
- Mojena, R. Hierarchical grouping methods and stopping rules: An evaluation. Comput. J. 1977, 20, 359–363. [Google Scholar] [CrossRef] [Scilit]
- Mächler, M.; Rousseeuw, P.; Struyf, A.; Hubert, M.; Hornik, K. Cluster: Cluster Analysis Basics and Extensions; R Package Version 2.0.4; R Project: Vienna, Austria, 2016. [Google Scholar]
- Gower, J.C. A general coefficient of similarity and some of its properties. Biometrics 1971, 27, 857–871. [Google Scholar] [CrossRef] [Scilit]
- Ward, J.H., Jr. Hierarchical grouping to optimize an objective function. J. Am. Stat. Assoc. 1963, 58, 236–244. [Google Scholar] [CrossRef]
- Murtagh, F.; Legendre, P. Ward’s hierarchical agglomerative clustering method: Which algorithms implement Ward’s criterion? J. Classif. 2014, 31, 274–295. [Google Scholar] [CrossRef] [Scilit]
- Laura, J.; Fergason, R.L. Modeling martian thermal inertia in a distributed memory high performance computing environment. In Proceedings of the 2016 IEEE International Conference on Big Data (Big Data), Washington, DC, USA, 5–8 December 2016; pp. 2919–2928. [Google Scholar] [CrossRef] [Scilit]
- Fergason, R.L.; Hare, T.M.; Laura, J. HRSC and MOLA Blended Digital Elevation Model at 200m v2. Astrogeology PDS Annex, U.S. Geological Survey. 2018. Available online: https://astrogeology.usgs.gov/search/map/mars_mgs_mola_mex_hrsc_blended_dem_global_200m (accessed on 29 May 2026).
- Fergason, R.L.; Laura, J.R.; Hare, T.M. THEMIS-Derived Thermal Inertia on Mars: Improved and flexible algorithm. In Proceedings of the 48th Lunar and Planetary Science Conference (Abstract No. 1563), Woodlands, TX, USA, 20–24 March 2017; Available online: https://www.hou.usra.edu/meetings/lpsc2017/pdf/1563.pdf (accessed on 29 May 2026).
- Rossi, C.; Cianfarra, P.; Salvini, F.; Bourgeois, O.; Tobie, G. Tectonics of Enceladus’ south pole: Block rotation of the tiger stripes. J. Geophys. Res. Planets 2020, 125, e2020JE006471. [Google Scholar] [CrossRef] [Scilit]
- Tanaka, K.L.; Davis, P.A. Tectonic history of the Syria Planum province of Mars. J. Geophys. Res. 1988, 93, 14893–14917. [Google Scholar] [CrossRef] [Scilit]
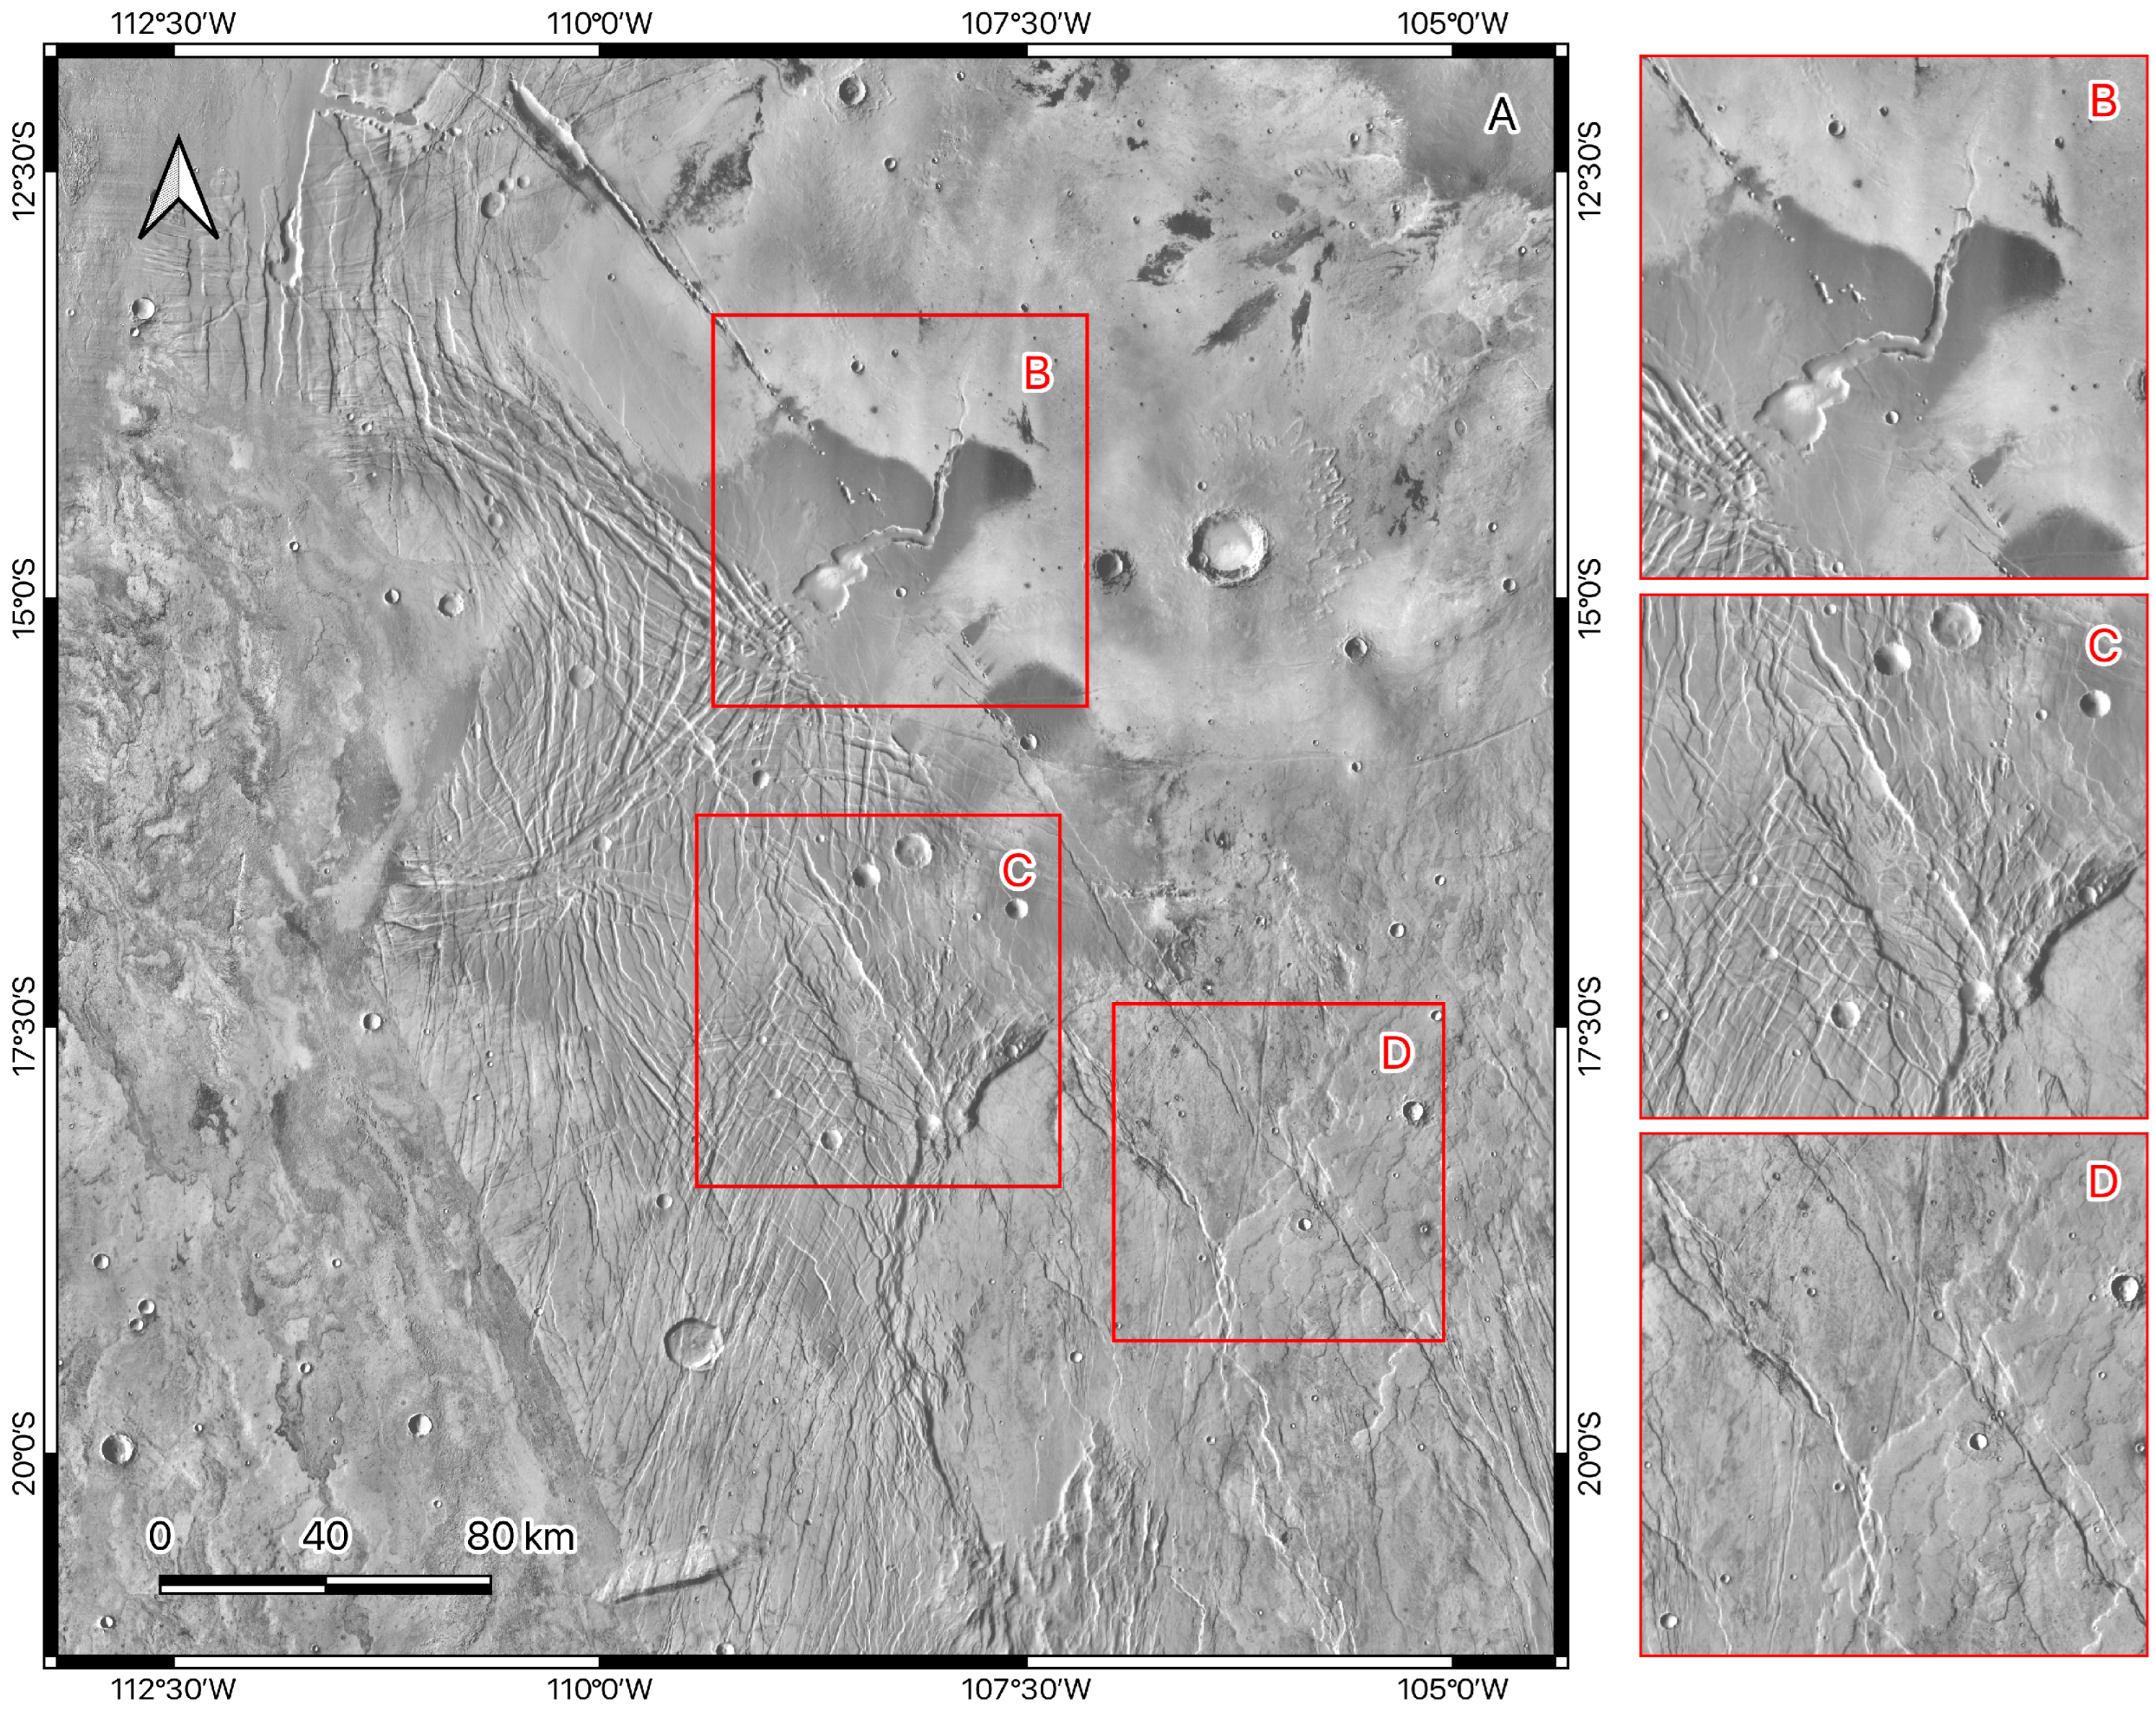
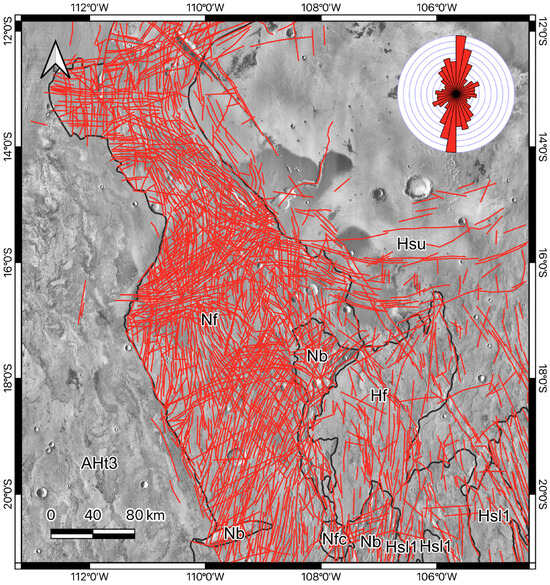
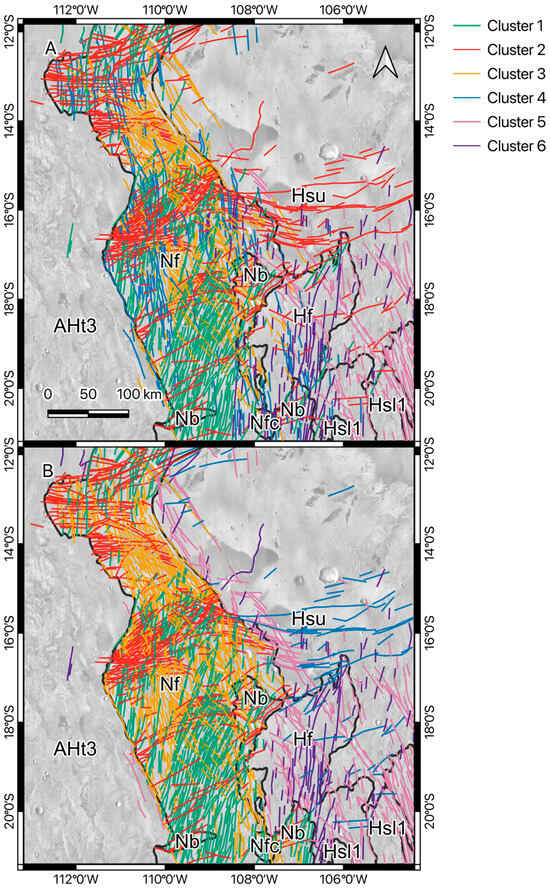
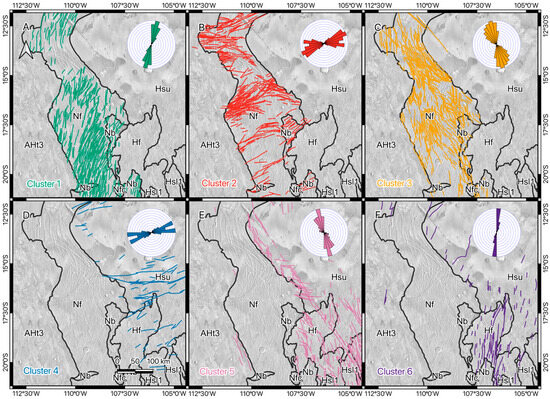
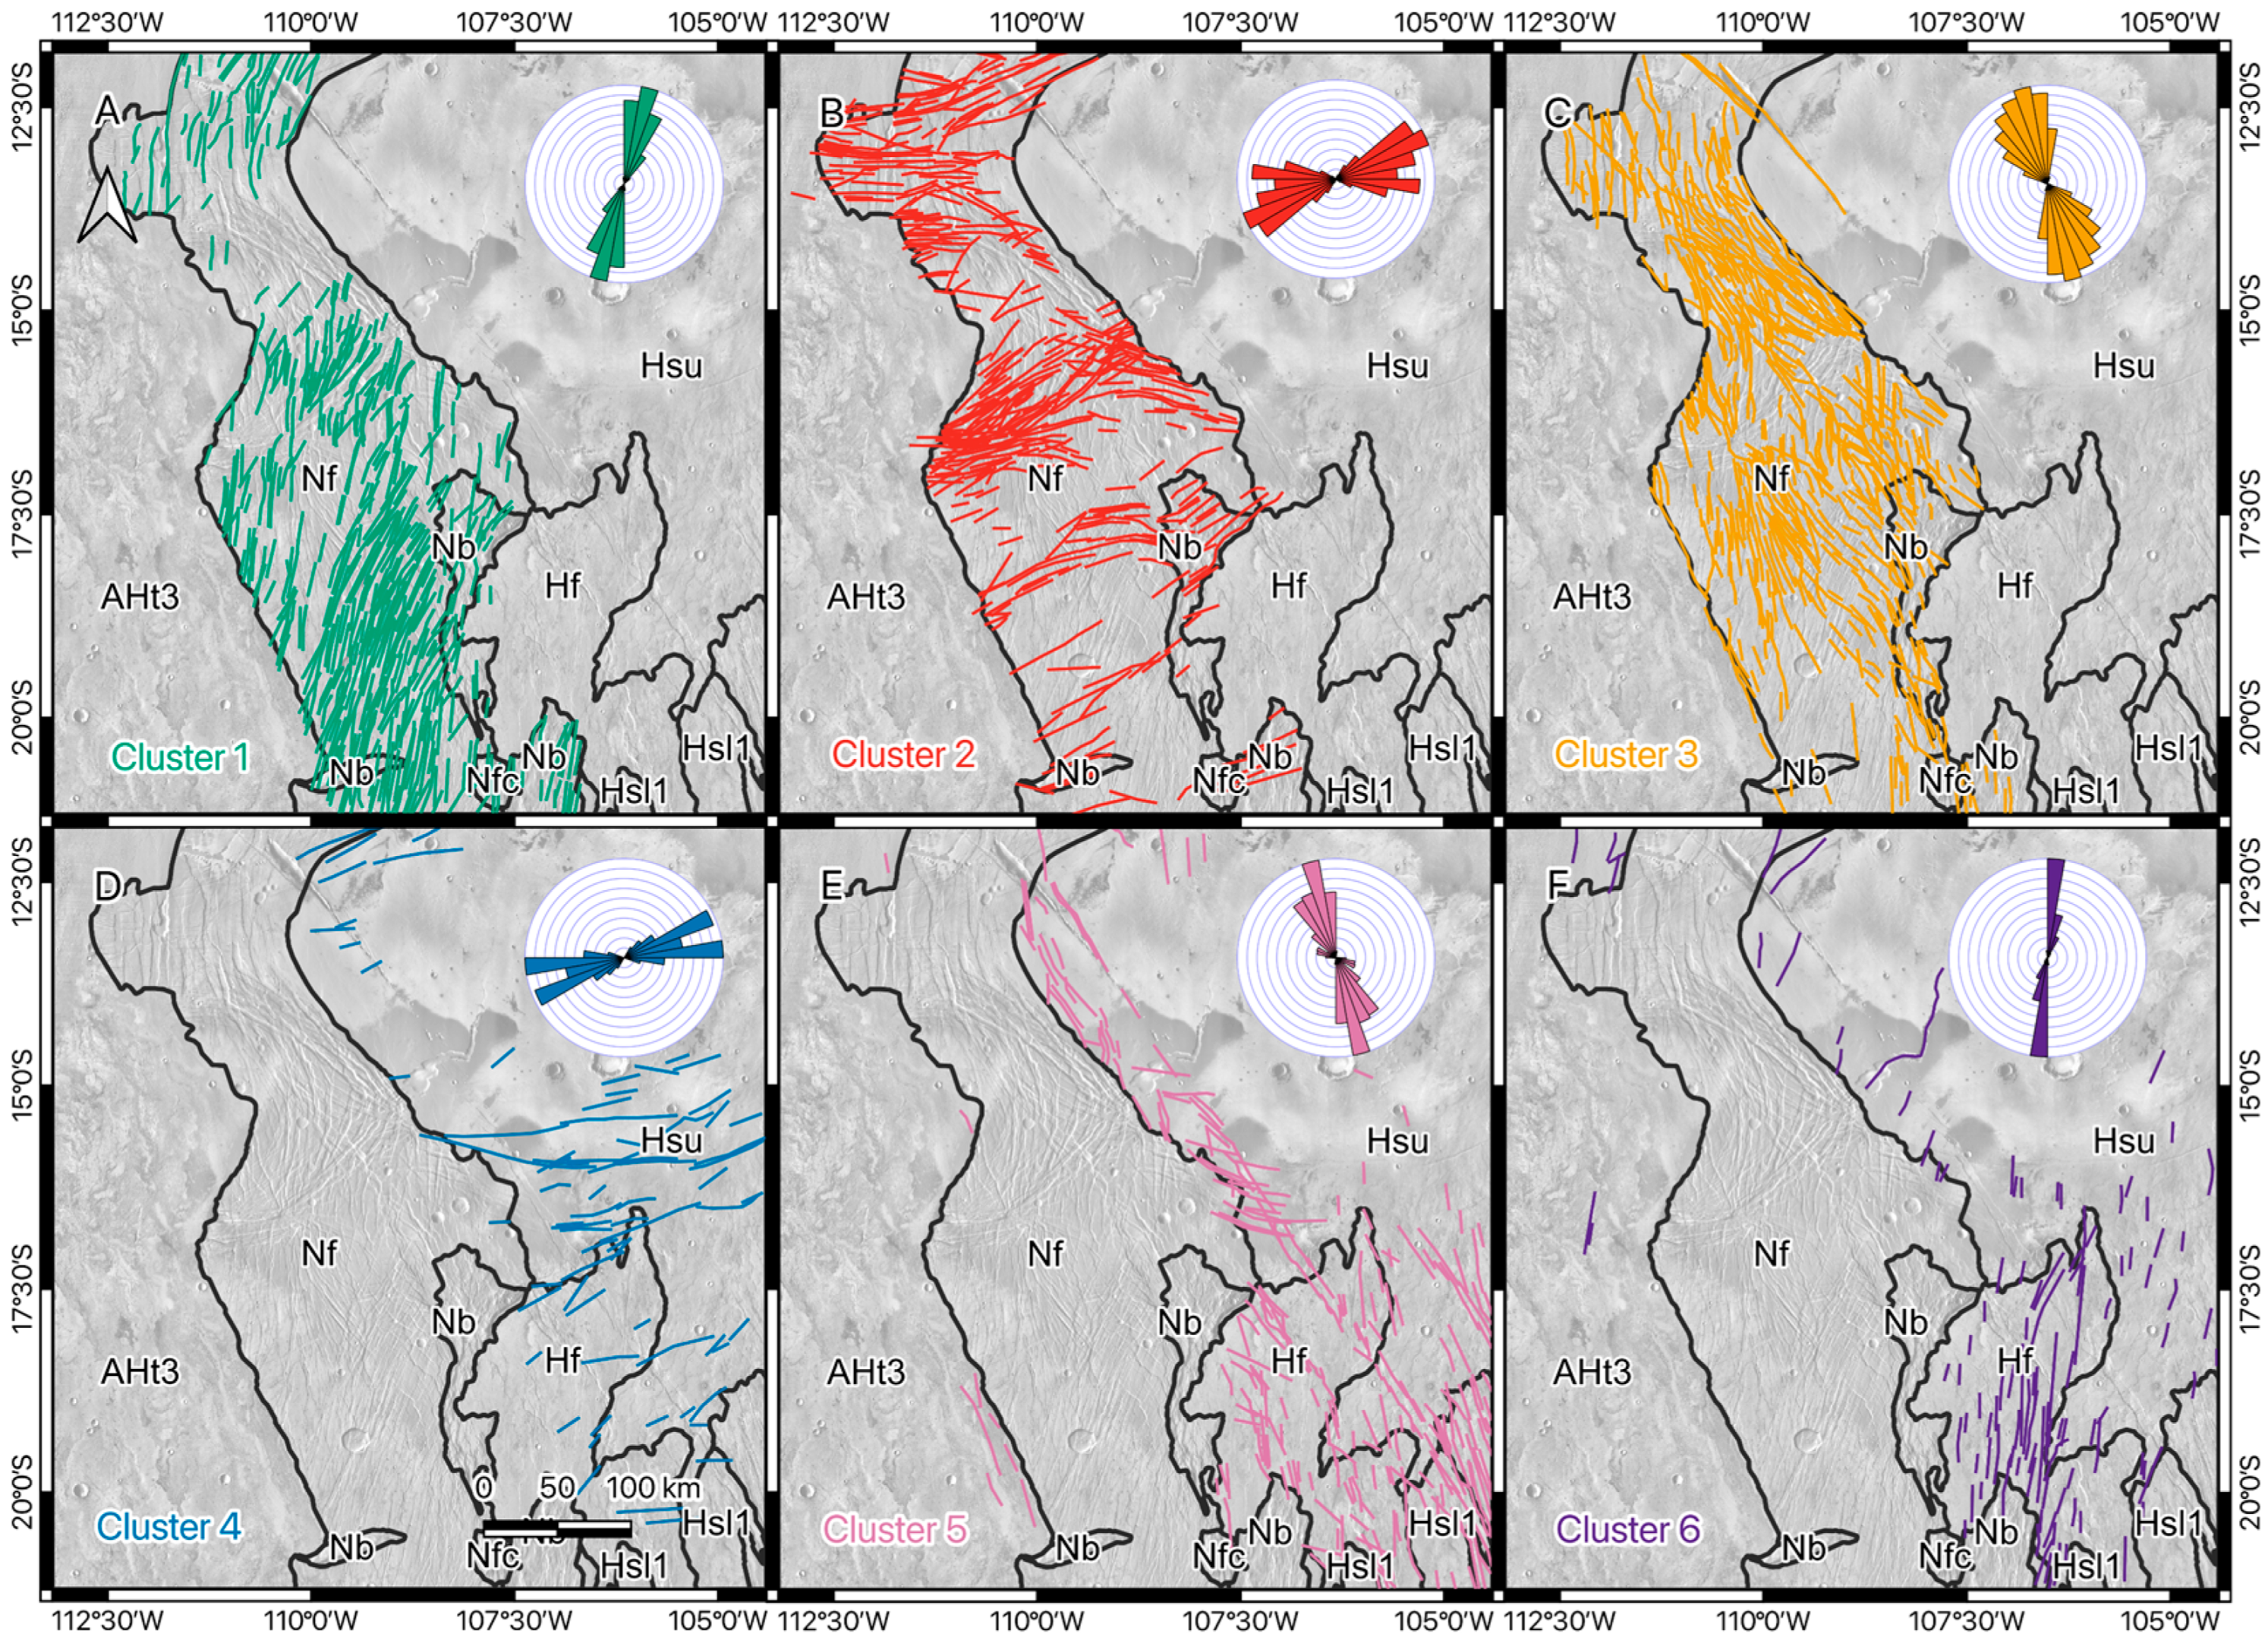
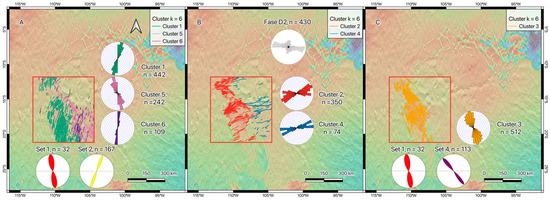
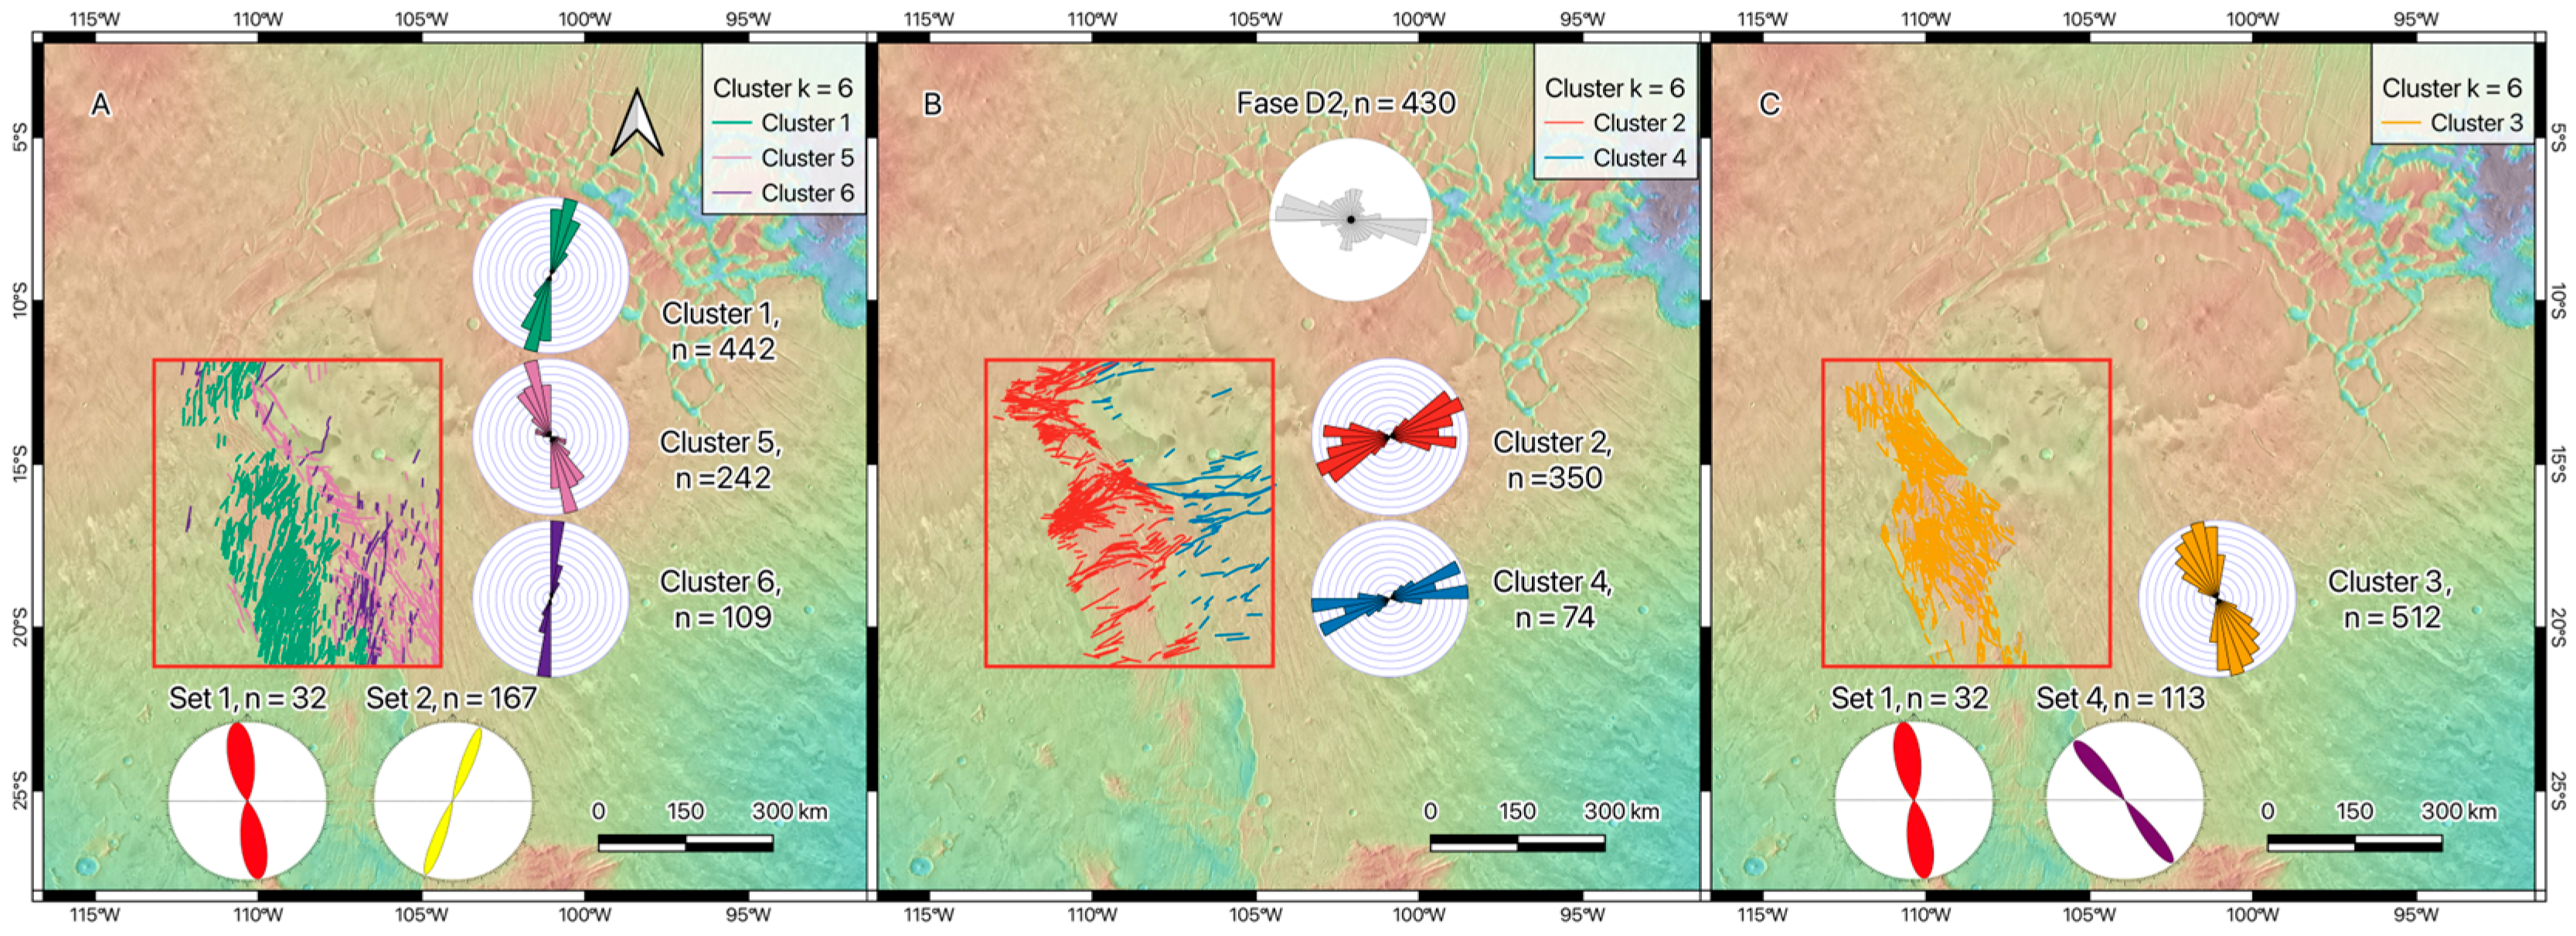
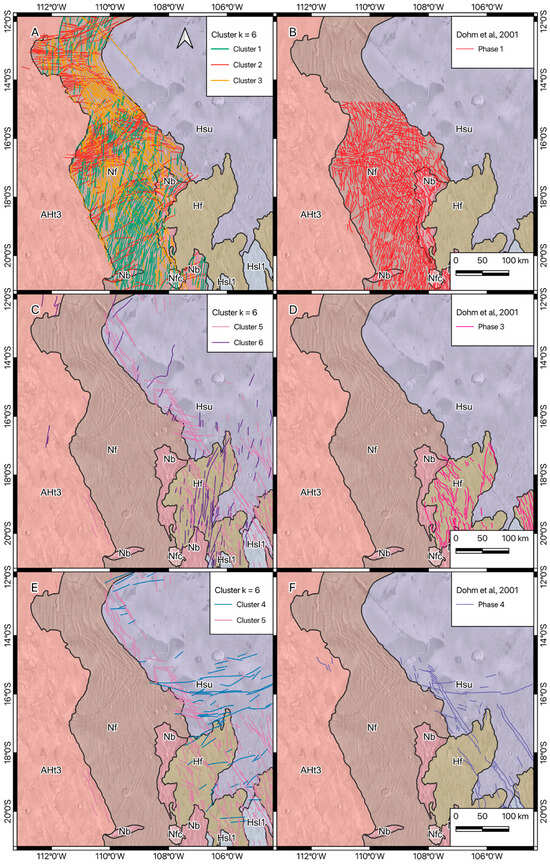
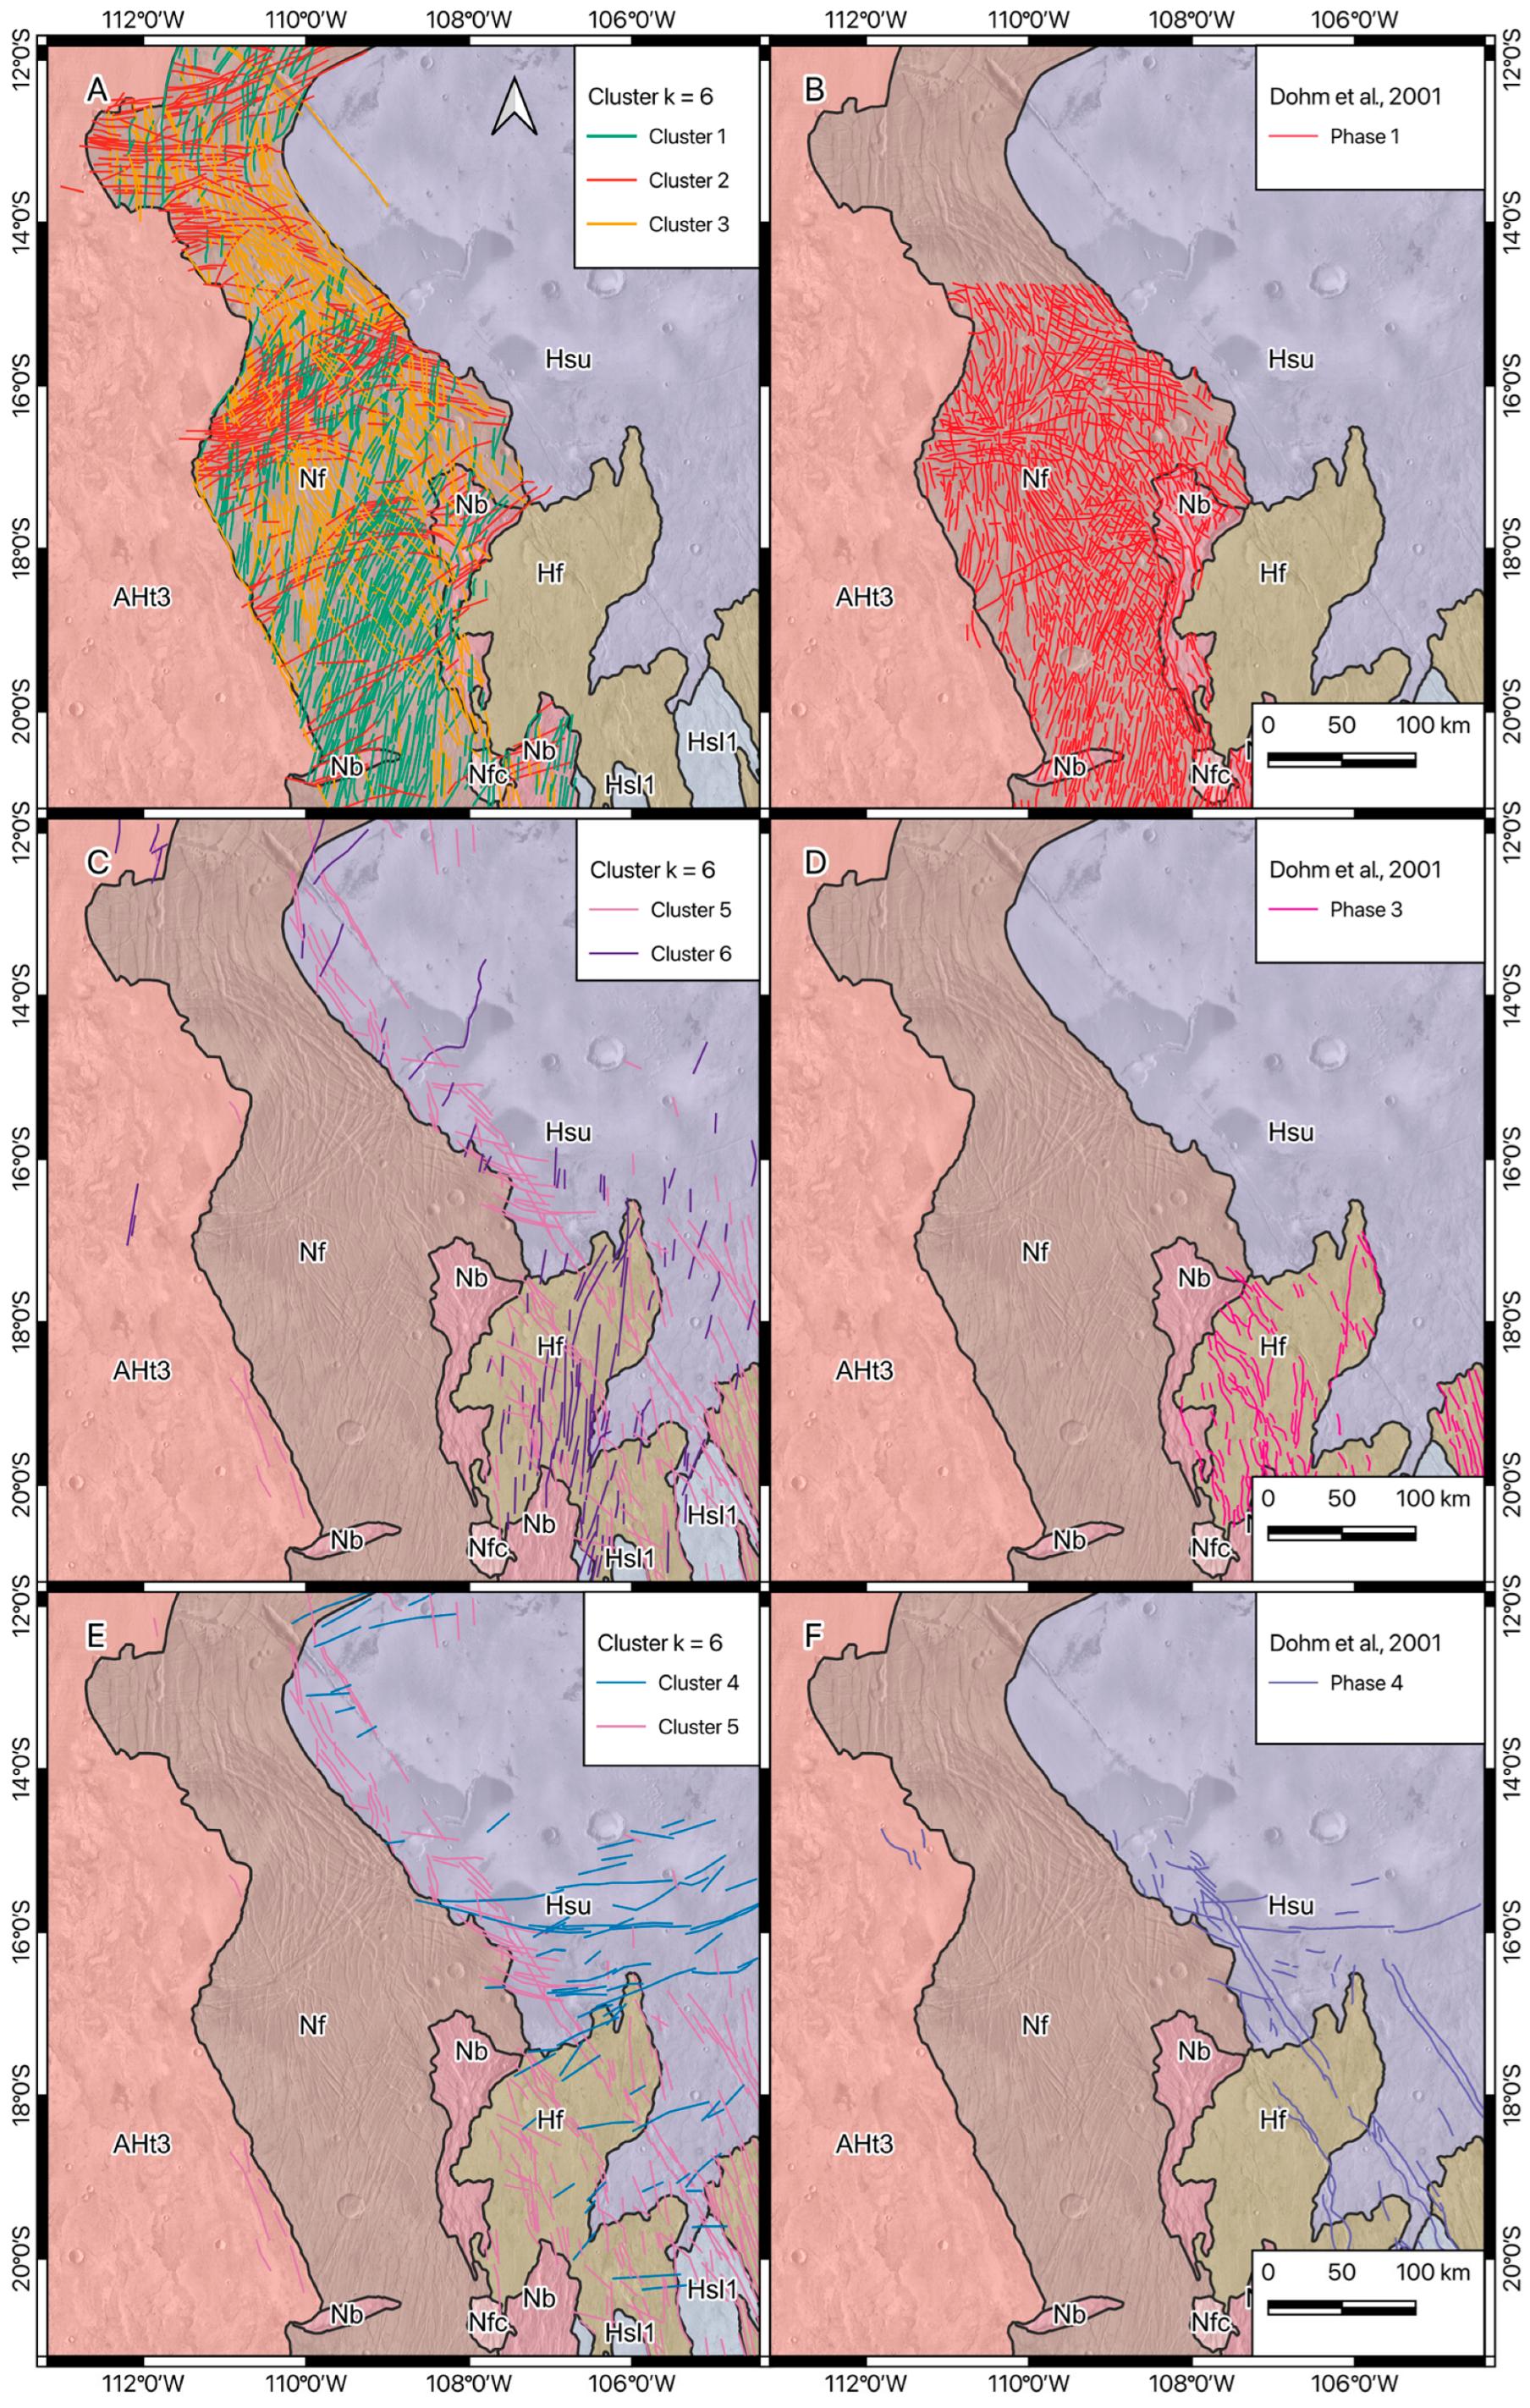
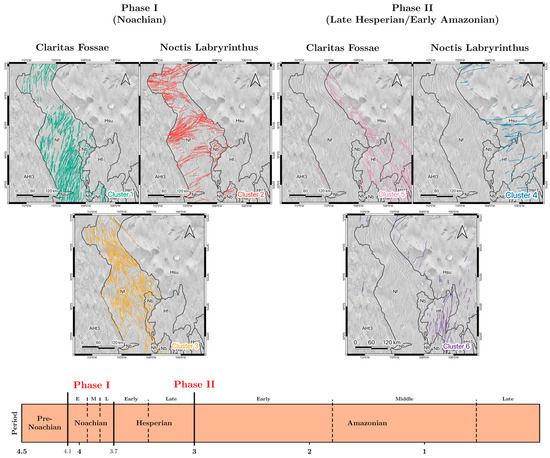
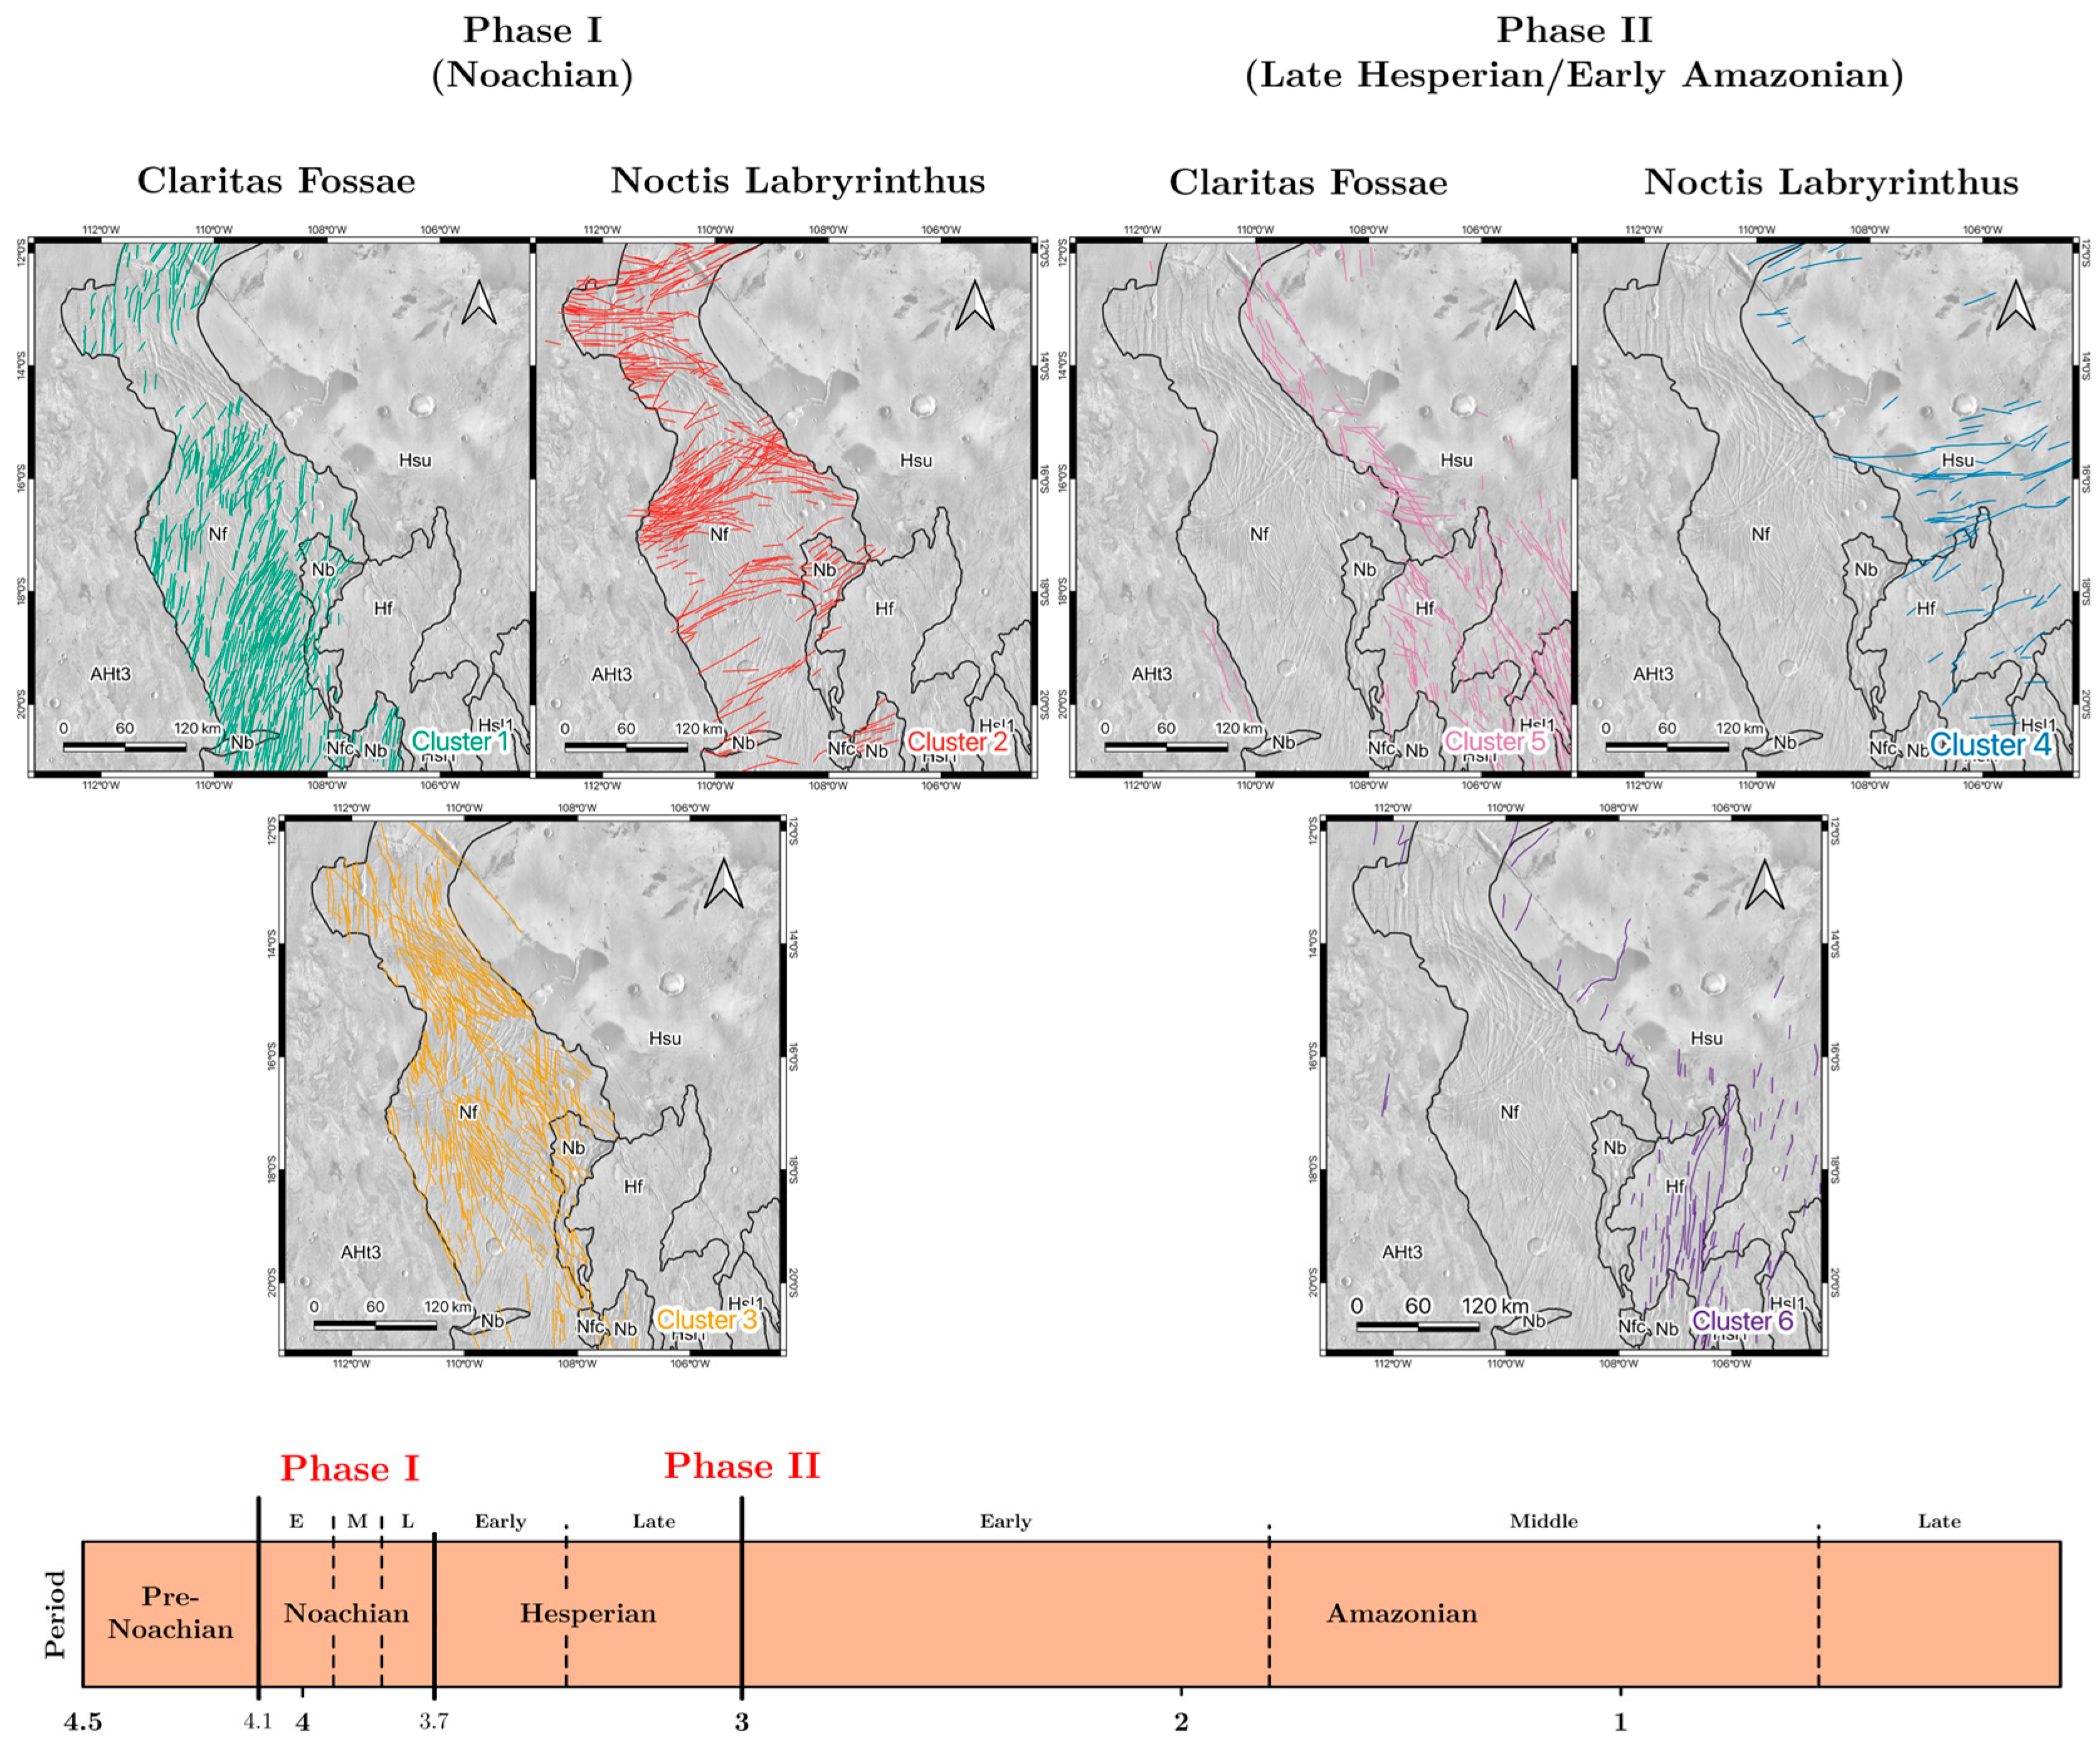

Disclaimer/Publisher’s Note: The statements, opinions and data contained in all publications are solely those of the individual author(s) and contributor(s) and not of MDPI and/or the editor(s). MDPI and/or the editor(s) disclaim responsibility for any injury to people or property resulting from any ideas, methods, instructions or products referred to in the content. |
© 2026 by the authors. Licensee MDPI, Basel, Switzerland. This article is an open access article distributed under the terms and conditions of the Creative Commons Attribution (CC BY) license.