1. Introduction
As mining and tunneling operations extend to ever-increasing depths: exemplified by the Jinchuan Nickel Mine in China (>1000 m) [
1], the Gotthard Base Tunnel in Switzerland (about 2450 m) [
2], and the Mponeng Gold Mine in South Africa (>4000 m) [
3], rock blasting is confronted with a hostile environment characterized by high in situ stresses, elevated temperatures, and high pore pressures [
4]. Among these factors, high in situ stress plays a particularly critical role in constraining blasting efficiency [
5]: it not only suppresses stress wave propagation but also imposes a strong directional bias on crack growth, frequently leading to overbreak or underbreak [
6]. Consequently, a fundamental understanding of stress wave propagation and crack evolution under coupled high in situ stress and dynamic blast loading is essential for achieving efficient rock fragmentation at depth.
Substantial research efforts have been devoted to understanding rock blasting under confining stress [
7,
8,
9]. Experimental studies using high-speed photography and caustics have qualitatively shown that hydrostatic compression suppresses radial cracks while promoting circumferential damage in a blasthole [
10,
11,
12]. Theoretical and numerical investigations have further revealed that stress wave propagation and crack development are strongly dependent on the magnitude and anisotropy of the in situ stress field; for instance, under non-hydrostatic conditions [
13,
14,
15], cracks preferentially extend along the direction of the maximum principal stress [
16,
17,
18]. However, further investigation is needed on three critical subjects: (a) no predictive mathematical relationship has been established between crack length and in situ stress magnitude; (b) the complete hoop stress phase transition (compression–tension–compression) has not been systematically characterized under different confining pressures; and (c) the quantitative effect of the lateral stress coefficient on anisotropic crack growth remains unknown.
To fill these gaps, the present study combines theoretical analysis with numerical simulations. Gap (a) is addressed by establishing an explicit exponential scaling relationship between crack length and in situ stress. Gap (b) is addressed by identifying a hoop stress phase transition: when the hydrostatic stress reaches approximately 30 MPa, the tensile phase of the hoop stress disappears entirely, marking a transition from tension-dominated to compression-shear-dominated fragmentation. Gap (c) is addressed by quantifying the anisotropic crack propagation behavior, where the crack aspect ratio follows a logistic growth curve with the lateral stress coefficient. The originality of this study lies in the introduction of a unified dimensionless confinement parameter that combines mean and deviatoric stresses, and the establishment of a quantitative predictive relationship that, for the first time, links crack length to the in situ stress state under both hydrostatic and non-hydrostatic conditions. These findings provide a theoretical basis for optimizing blasting design and quantitatively predicting fragmentation extents in deep rock masses under high in situ stress.
2. Propagation and Distribution of Blast-Induced Stress Waves in Rock Mass
2.1. Generation and Propagation of Blast-Induced Stress Waves
When a high-energy explosive detonates, the detonation wavefront reaches the explosive–medium interface, and high-temperature, high-pressure gaseous products expand at supersonic speeds, causing abrupt compression of the surrounding medium [
19]. A significant pressure gradient exists between the detonation products and the ambient gas, and the system undergoes relaxation oscillations until pressure equilibrium is achieved [
20]. Due to impedance mismatch at the interface between explosion gases and the surrounding medium, compression waves continuously superimpose and converge, ultimately forming an initial shock wave with a steep front. The expansion behavior of detonation products can be approximated by Equation (1) [
21]:
where
PH is the initial gas pressure,
γ is the adiabatic expansion coefficient of detonation products,
γ = 3, and
VOD and
ρe are the detonation velocity and density of the explosive, respectively.
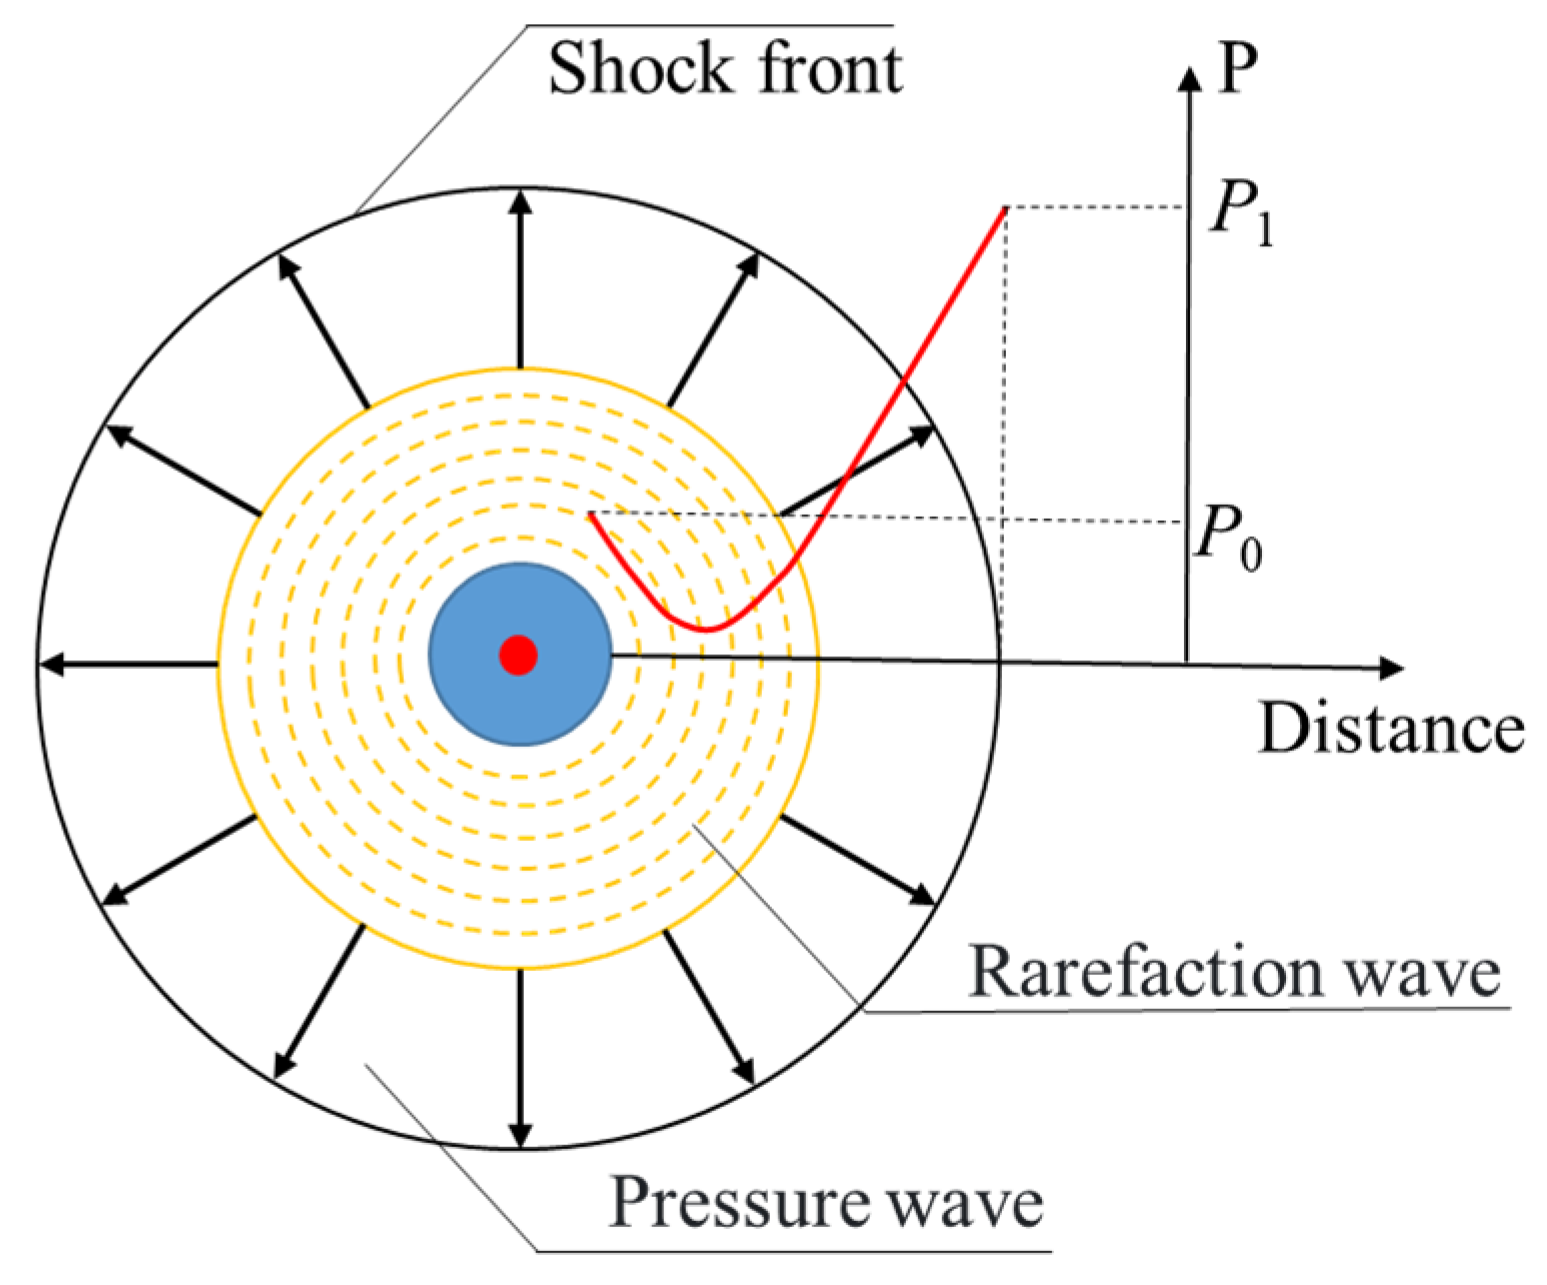
After initial overexpansion, the product pressure drops rapidly, generating a rarefaction wave that propagates backward to achieve pressure equilibrium. The pressure wave, rarefaction wave, and explosion products continue moving forward, forming a blast-induced stress wave with a distinctive negative pressure region behind the advancing front [
22] (
Figure 1).
The shock wave propagates radially from the blasthole wall, with its energy gradually dissipating [
23]. Within a certain range, the wave decays into a stress wave and an elastic seismic wave [
24]. The overpressure at the wave front maintains supersonic propagation, while pressure decay in the tail region reduces its velocity to sonic speed [
25]. Blast-induced stress waves show clear attenuation in peak pressure and wave velocity during propagation, due to both energy dissipation and thermodynamic mechanisms [
26]. Key parameters at different propagation stages are summarized in
Table 1.
2.2. Static and Dynamic Stress Fields Around a Blasthole
2.2.1. Static Stress Field
For deep rock excavation by blasting, the original rock stress field can be simplified as a biaxial problem. The rock mass is assumed to be homogeneous and linear-elastic. The stress distribution around a blasthole induce by in situ stress is characterized using classical elastic solutions [
27]. The radial stress
, hoop stress
, and shear stress
at a radial distance
r from the blasthole center are given by
where
a is the blasthole radius and
r is the radial distance from the center of the blasthole,
σx and
σy represent the in situ stress components in the horizontal and vertical directions, respectively and
K is defined as the lateral stress coefficient of the in situ stress, given by
σx/
σy =
K.
2.2.2. Dynamic Stress Field
The analysis assumes the blasthole is situated within a homogeneous, elastic, isotropic rock mass. The dynamic load generated instantaneously by explosive detonation acts directly on the blasthole wall. Under these premises, the stress field evolution around the blasthole is simplified as a biaxial problem [
28]. The governing equation for elastic wave propagation in deep rock masses is expressed as
with initial conditions
φ(
r, 0) = 0 and boundary condition
=
P(
t), where
φ(
r,
t) is the displacement potential function,
vp is the P-wave velocity, and
P(
t) is the dynamic load on the blasthole wall, express as
. The dynamic radial and hoop stresses are related to the displacement potential function through [
28,
29]:
To obtain the solution, the Laplace transform is applied to convert the problem into the complex frequency domain. This yields the transformed displacement potential function:
where
s1 =
P(
m)/(
λ + 2
µ),
s2 =
m/
vp,
t′= (
r −
a)/
vp,
w =
vp/
vs,
m is the Laplace transform parameter,
vs is the shear wave velocity of the rock mass,
H(
t −
t′) is Heaviside function, and
K0 and
K1 are the modified Bessel functions of the second kind of orders 0 and 1.
The time-domain solution is then obtained via numerical inversion using the Durbin algorithm [
30,
31,
32,
33], which demonstrates superior stability and accuracy compared with other inversion methods.
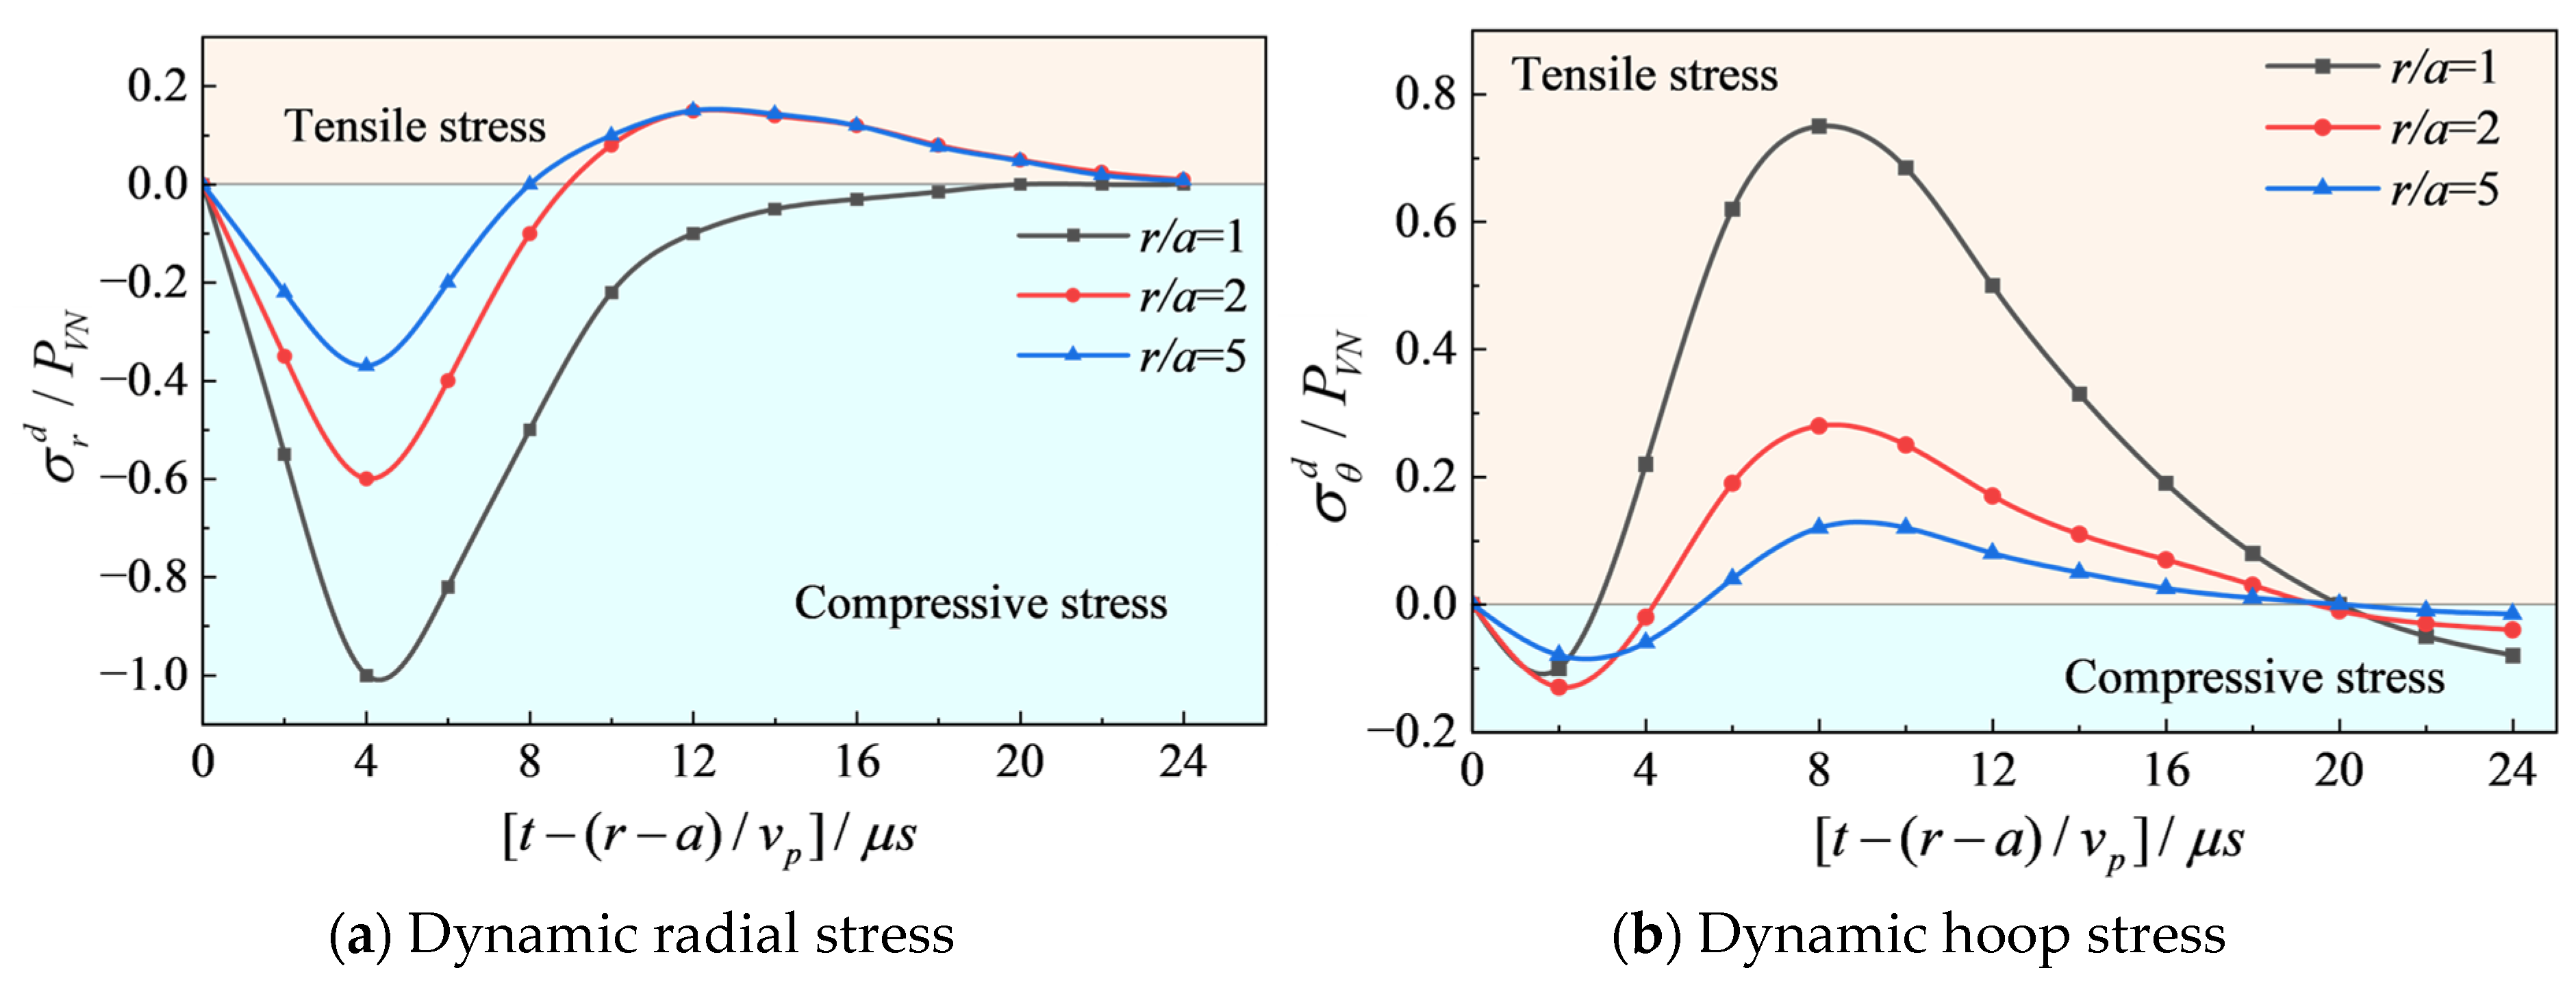
Figure 2 illustrates the variation in stress waves at different distances from the blasthole. As shown in
Figure 2a, the dynamic radial stress rises sharply to a peak compressive value at the blasthole wall (
r/
a = 1) and then decays, transitioning from compressive to tensile with increasing distance. The peak tensile stress initially increases and then gradually decreases. The dynamic hoop stress (
Figure 2b) exhibits three characteristic peaks: an initial compressive peak, a tensile peak, and a secondary compressive peak. The tensile peak is the largest in magnitude and plays a dominant role in crack initiation, since the dynamic tensile strength of rock is considerably lower than its compressive strength.
The theoretical solutions presented above provide two testable predictions that serve as quantitative benchmarks for validating the numerical model. The first prediction is that under hydrostatic stress (
K = 1), the hoop stress at the blasthole wall should be isotropic and increase linearly with confining pressure, following the relationship given in Equation (2). The second prediction is that under non-hydrostatic stress, the stress distribution should exhibit a cos2
θ dependence, with the maximum compressive hoop stress occurring at
θ = 90° when
K < 1 and at
θ = 0° when
K > 1. In
Section 4.1, we compare the numerically obtained hoop stress distributions with these analytical predictions to verify the correctness of the numerical model. This comparison confirms that the numerical model accurately reproduces the theoretical stress distributions, thereby validating the static stress initialization and the overall model reliability.
3. Materials and Methods
Theoretical calculations often simplify rock as homogeneous elastic material to obtain analytical solutions. At the actual blasting work area, the complex field condition and difficult parameter acquisition made it challenging to accurately capture the internal stress distribution and crack propagation. Consequently, numerical simulation has gained widespread application in rock blasting research due to its efficiency and convenience.
3.1. Numerical Models
The explicit dynamic finite element method demonstrated an outstanding performance in handling problems involving high strain rates and large deformations [
34,
35]. LS-DYNA R12.0 was widely applied for dynamic response analysis across multiple engineering disciplines, including civil engineering, blasting engineering, and mining engineering.
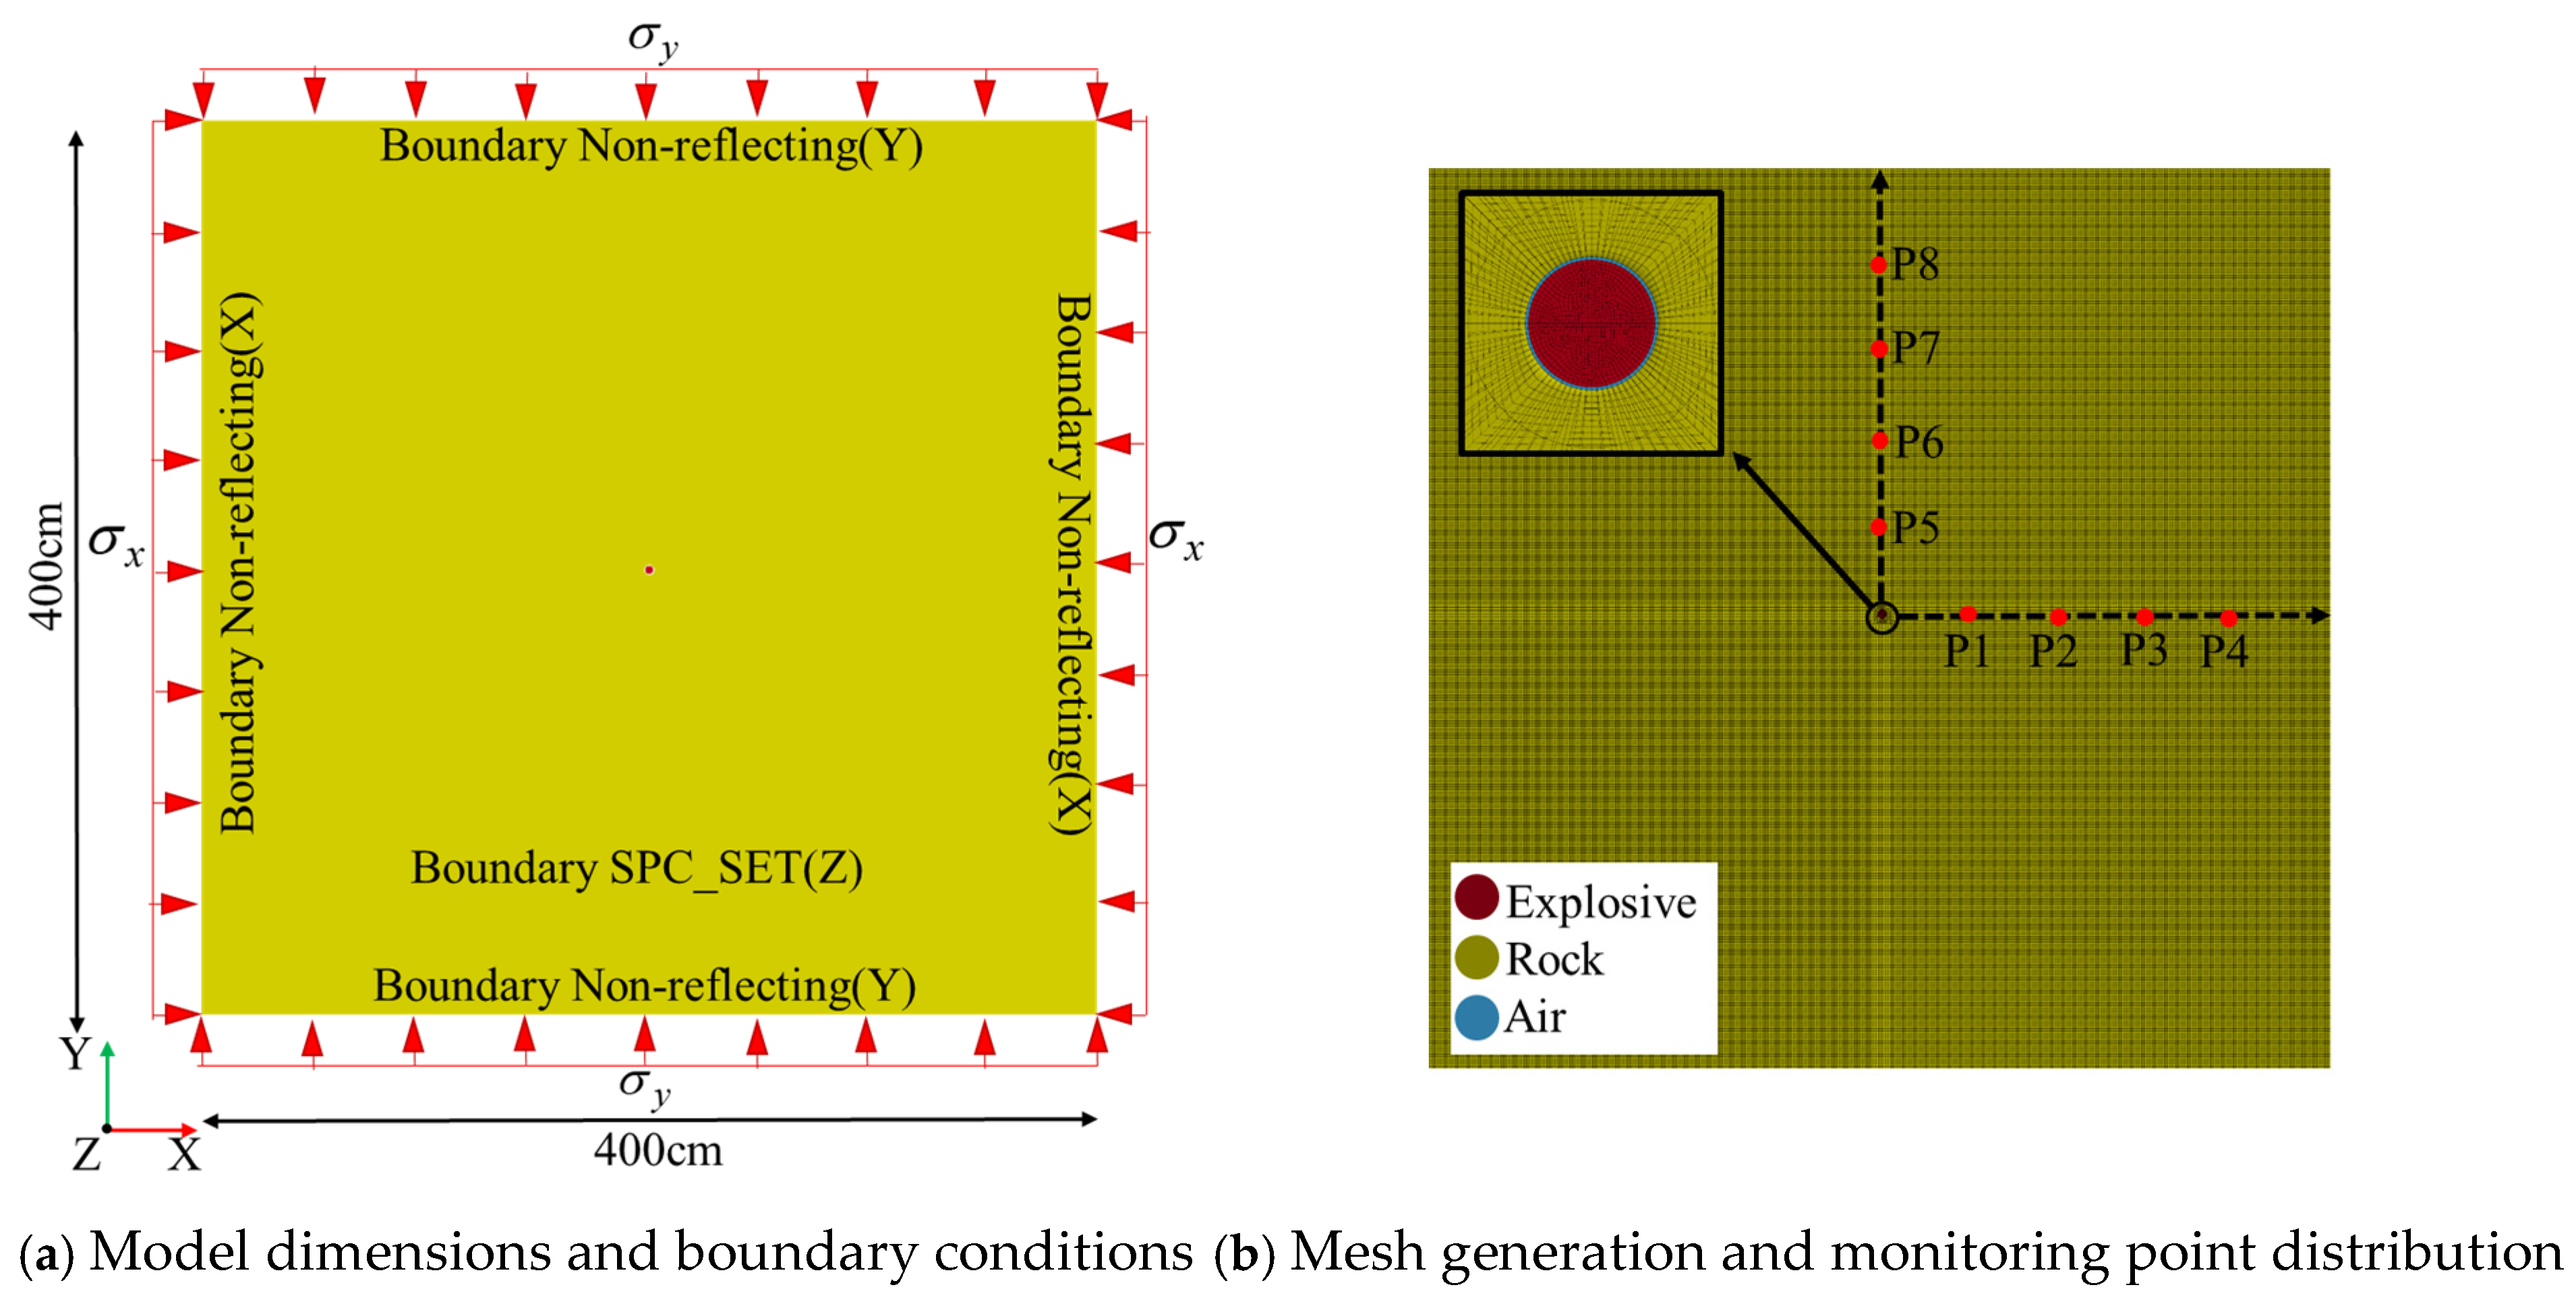
The Ashele Copper Mine is located in Altay City, Habahe County, Xinjiang. This deposit represents a submarine eruption-sedimentary deposit with volcanic rock as the host rock, comprising both sedimentary facies and vent facies. The surrounding rock primarily consists of altered volcanic-sedimentary clastic rock, supplemented by quartz porphyry, andesitic porphyry, and basalt. This study established a quasi-3D single-blasthole numerical model based on the mine’s excavation conditions, as shown in
Figure 3. The blasthole was positioned at the model center, with a diameter of 4.2 cm, employing radially decoupled charge loading. To balance simulation efficiency and accuracy, the mesh around the blasthole was refined, resulting in approximately 199,000 hexahedral elements in the complete model. The explosive and air elements shared common nodes, are treated as fluid, and were placed in the same multi-material group. Non-reflecting boundary condition and normal constraints were applied to the model edges to eliminate stress wave reflections from truncated boundaries and maintain zero displacement in the out-of-plane direction. The in situ stresses in the x and y directions (horizontal and vertical) were applied in the numerical model, corresponding to the biaxial stress condition shown in
Figure 3. No out-of-plane in situ stress component was applied. The fluid–structure interaction algorithm was subsequently implemented to characterize the deformation and damage behavior of fluid and solid elements under blast loading.
3.2. Constitutive Model and Parameters of Rock
Several constitutive models are commonly used in numerical simulation of rock blasting responses, including the Continuous Surface Cap Model (CSCM), Holmquist–Johnson–Cook (HJC), and Johnson–Holmquist (JH) series models [
36,
37]. Yet these models still exhibit limitations in simulating rock damage and fracture behavior under complex stress states. For example, the HJC model failed to accurately describe tensile–shear composite fracture behavior under dynamic loading. To address this issue, Riedel et al. [
38] proposed the Riedel–Hiermaier–Thoma (RHT) model. The RHT model was selected over other available models [
39,
40] (e.g., HJC, CSCM) for three reasons: (1) it explicitly accounts for pressure-dependent strength surfaces that are essential for high confining pressures (up to 40 MPa in this study); (2) it incorporates strain-rate enhancement for both compression and tension, which is critical for blast loading (strain rates > 10
2·s
−1); and (3) it distinguishes between tensile and compressive damage accumulation, allowing accurate simulation of the ‘compression–tension–compression’ hoop stress transition observed in blasting. In contrast, the HJC model does not capture the tensile damage mechanism adequately.
This study is set against the engineering background of blasting excavation in a tunnel of the Ashele Copper Mine in Xinjiang, China. Prior to the numerical simulations, the basic physical and mechanical parameters of the rock were determined. The basic mechanical parameters of the rock were obtained through uniaxial compression tests. The tests yielded a uniaxial compressive strength of 160 MPa, a uniaxial tensile strength of 15 MPa, and an elastic modulus of 22 GPa. Additional basic physical parameters of the rock include a density of 2630 kg/m
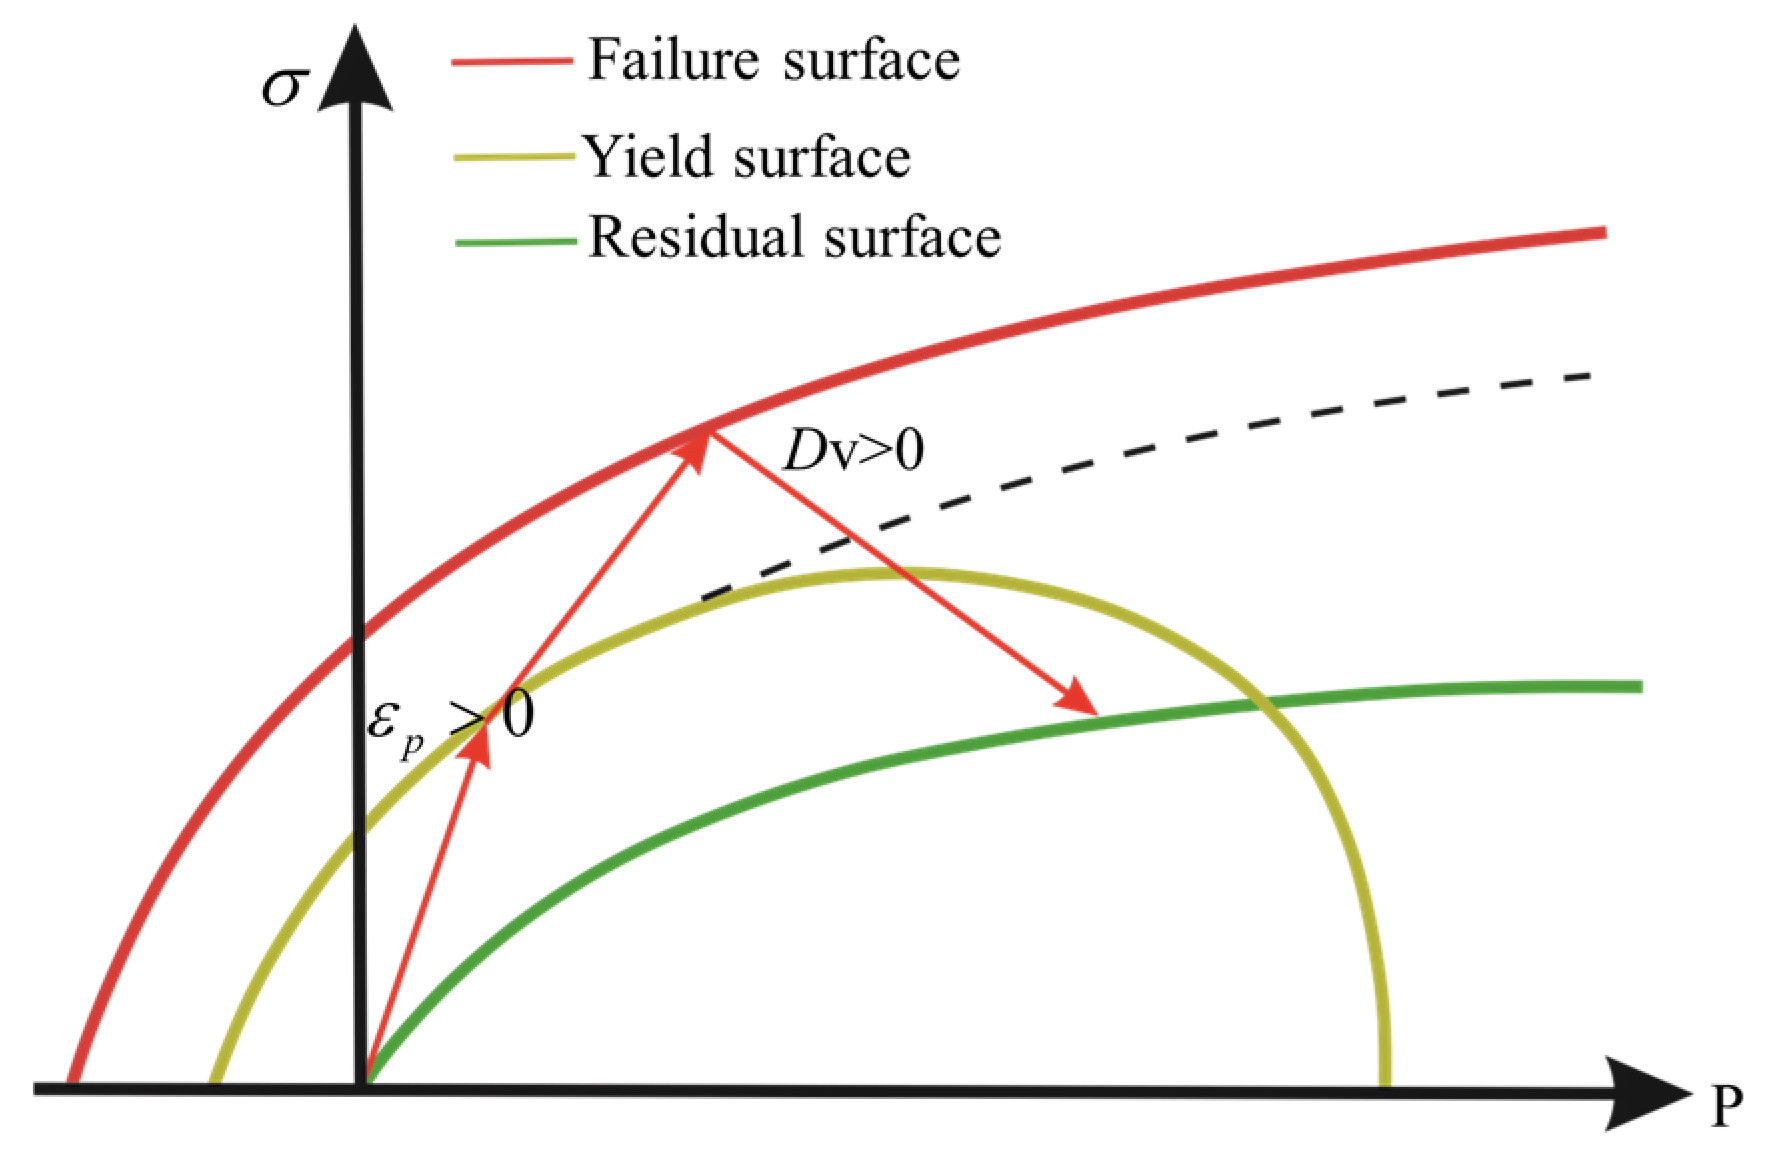
3. The RHT model employed multiple yield surfaces to describe the complete loading path of rock behavior, as shown in
Figure 4.
This path progressed from linear elasticity through elastoplastic transition to damage softening at the failure surface [
41]. Ultimately, the residual friction surface carried the load at complete damage (
D = 1). This framework accurately simulated the entire process from rock deformation to fragmentation [
42]. It proved particularly suitable for rock blasting analysis under high confining pressures and strain rates. The rock damage variable was defined by Equation (6).
where Δ
εp is the accumulated plastic strain,
εf is the failure strain, and
D = 0 indicates the material is intact, while
D = 1 represents complete material failure.
The most critical parameters in the RHT model, including mass density
ρ, elastic shear modulus SHEAR, and uniaxial compressive strength
Fc, were determined directly from the laboratory tests on the Ashele Copper Mine rock samples. For the remaining parameters that could not be measured directly, we adopted values from previous studies [
43,
44,
45] that investigated rock types with comparable mechanical properties. For example, the damage parameters
D1 = 0.04 and
D2 = 1, the failure surface parameters
A and
N, and the Lode angle dependence factor
Q0 were taken from studies on granite-like hard rocks that exhibit similar compressive and tensile strength ratios to our rock mass. The compatibility of these adopted parameters with our numerical model was verified by comparing the numerically obtained static hoop stress distributions with the analytical solutions in
Section 4.1, which show excellent agreement. This verification confirms that the adopted parameters are appropriate for the present study. All RHT parameters adopted in this study are listed in
Table 2.
3.3. Material Parameters of Explosive and Air
The *HIGH_EXPLOSIVE model in the LS-DYNA R12.0 material library is commonly used to simulate the constitutive behavior of an explosive. This is described by the *Jones–Wilkins–Lee (JWL) equation of state, which characterizes the relationships among the instantaneous high pressure, large volume, and high energy of detonation products. The calculation formula for the equation of state (EOS) [
46] is given by Equation (7) as follows:
where
P is the detonation pressure generated by the explosive (Pa);
V is the relative specific volume of the detonation products, defined as
V =
v/
v0, in which
v0 is the initial specific volume and
v is the current specific volume;
E0 is the initial specific internal energy of the detonation products; and
A,
B,
R1,
R2, and ω are material constants. The parameters of the No. 2 emulsion explosive used in this numerical simulation, including its material and equation of state parameters, are listed in
Table 3.
During explosive detonation, the surrounding air can be approximated as an ideal gas. In LS-DYNA R12.0, air is typically modeled using the *MAT_NULL material model combined with the *EOS_LINEAR_POLYNOMIAL equation of state. This EOS describes the relationship between gas pressure, density, and internal energy [
47], with its expression given by Equation (8),
where
pair is the gas pressure, Pa;
C0~
C6 are polynomial equation coefficients, typically set as
C0 =
C1 =
C2 =
C3 =
C6 = 0,
C4 =
C5 =
γ − 1;
u is the dynamic viscosity coefficient, defined as
u =
ρ/
ρ0 − 1, where
ρ and
ρ0 are the current density and initial density of the material, respectively; and
is the internal energy per unit volume of gas. The specific parameter settings for air are listed in
Table 4.
3.4. Application of Initial In Situ Stress
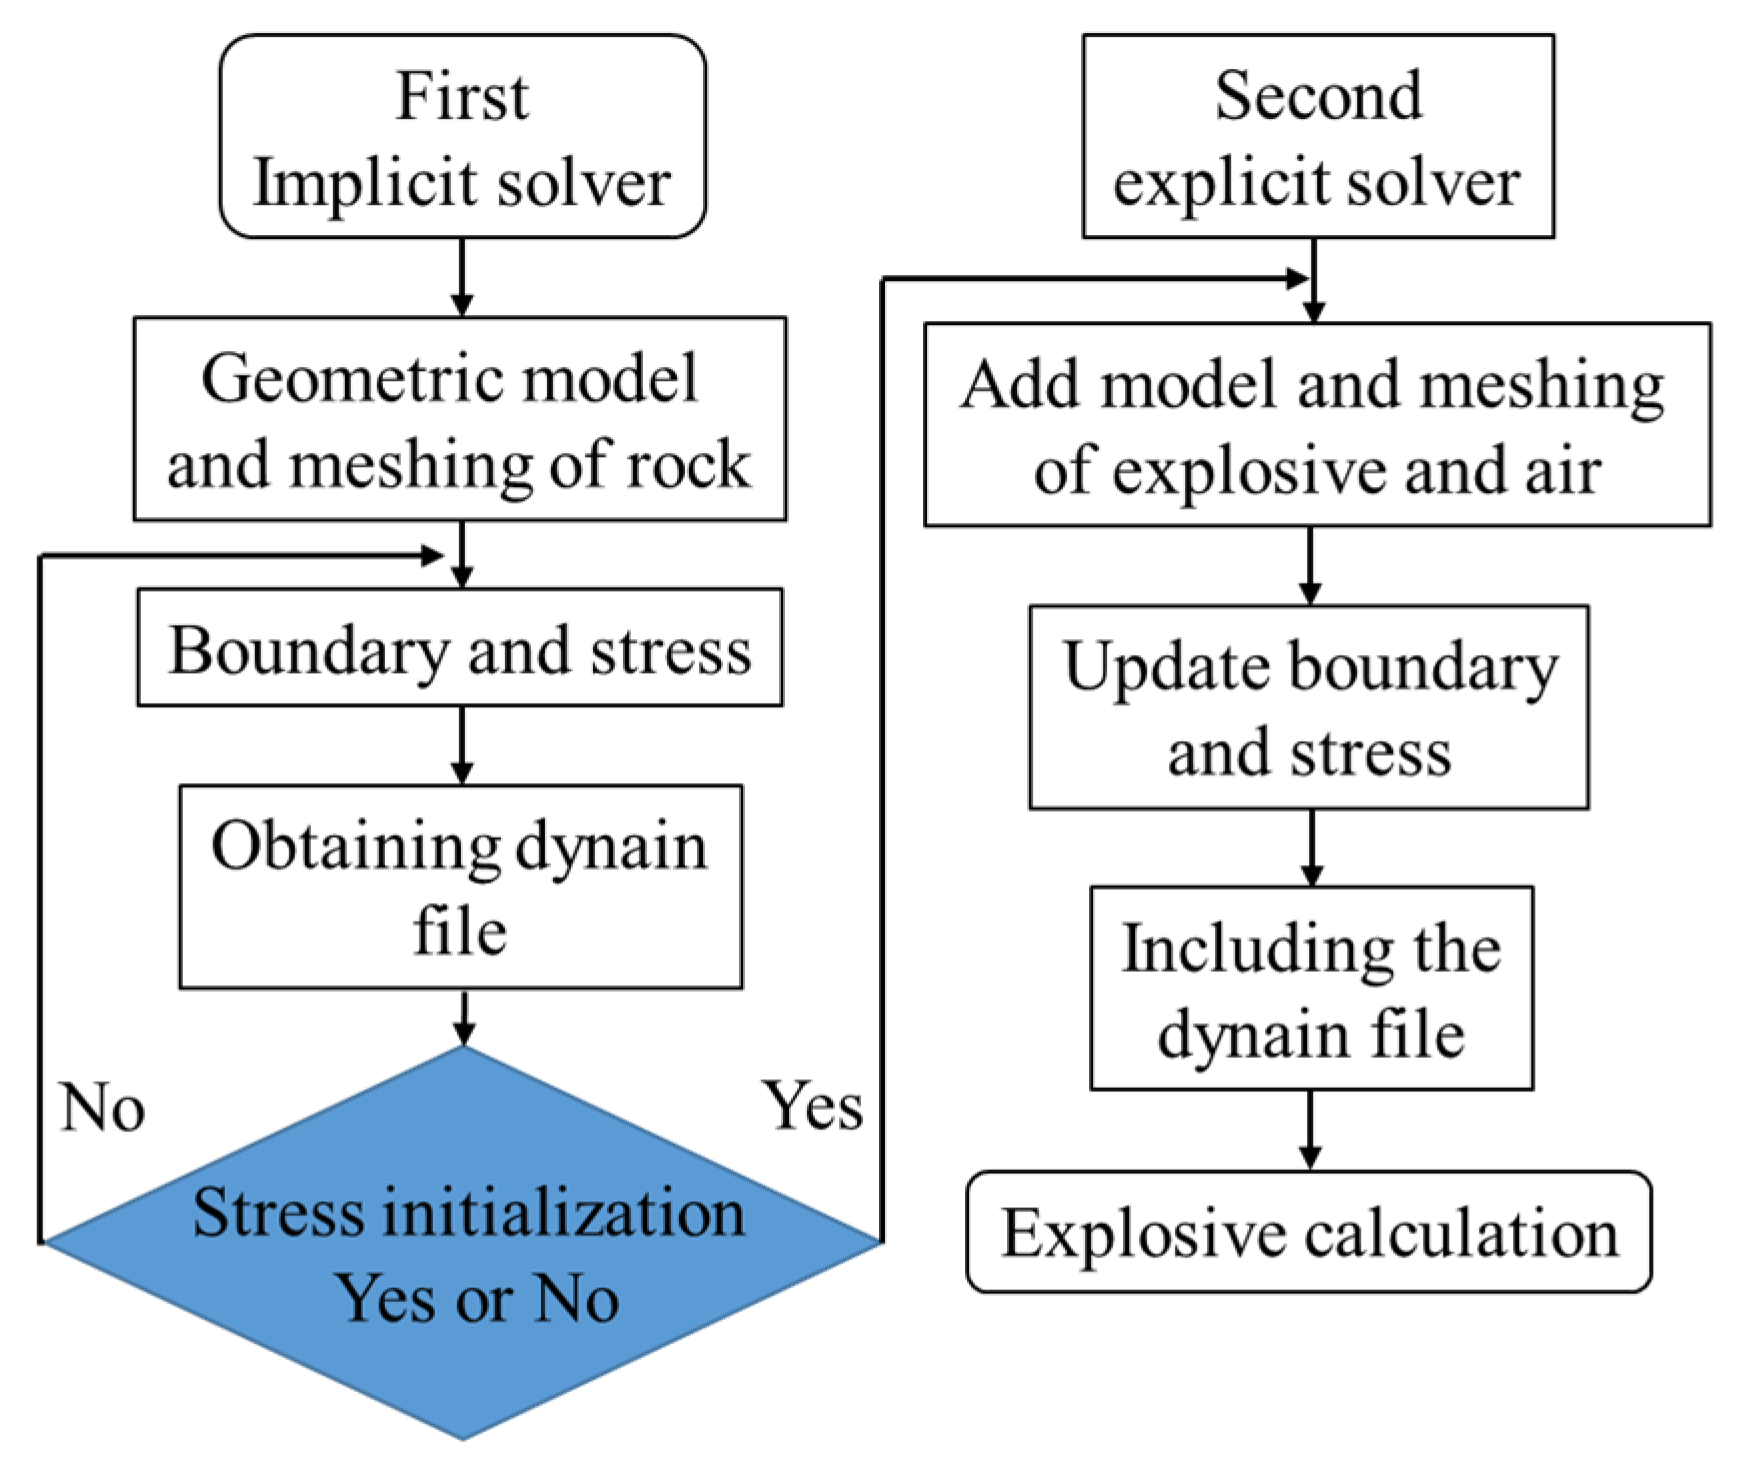
To replicate the initial stress state in rock masses, we preloaded the in situ stress field before simulating blasting. Balancing computational efficiency with accuracy in initial stress matching, we adopted the Dynain File Method [
48,
49]. This two-step approach first entailed in situ stress preloading: using *DEFINE_CURVE to define a load curve matching the in situ stress gradient, then applying *LOAD_SEGMENT_SET to distribute these stresses spatially. The stress was applied linearly over a duration of 10 ms, which is sufficiently long to avoid any inertial effects. The final stress distribution around the blasthole depends only on the prescribed boundary stress values and the elastic properties of the rock mass, not on the specific loading rate. Next, *INTERFACE_SPRINGBACK output the equilibrium stress state under confining pressure, generating a Dynain File with initial stress data. The second step involved blast dynamic response analysis, where *INCLUDE imported the Dynain File to introduce the preloaded stress field into the blasting simulation. This ensured accurate coupling between initial stresses and blast loading. The complete processes are illustrated in
Figure 5.
This study designed 8 comparative cases to investigate stress and crack propagation in rock masses under coupled dynamic–static loading at varying confining pressures, as shown in
Table 5. During the in situ stress preloading phase, we applied a linear loading method to gradually increase confining pressure to target values over 10 ms, simulating static equilibrium in deep rock masses. The subsequent blasting phase lasted 1 ms, during which the *INCLUDE initial stress field restoration function in LS-DYNA R12.0 maintained the predetermined confining pressure. This phased approach accurately replicated the combined dynamic–static loading effect while preserving initial stress field stability. The methodology provided realistic stress conditions for blasting response, which is a key technique for simulating blasting under in situ stress.
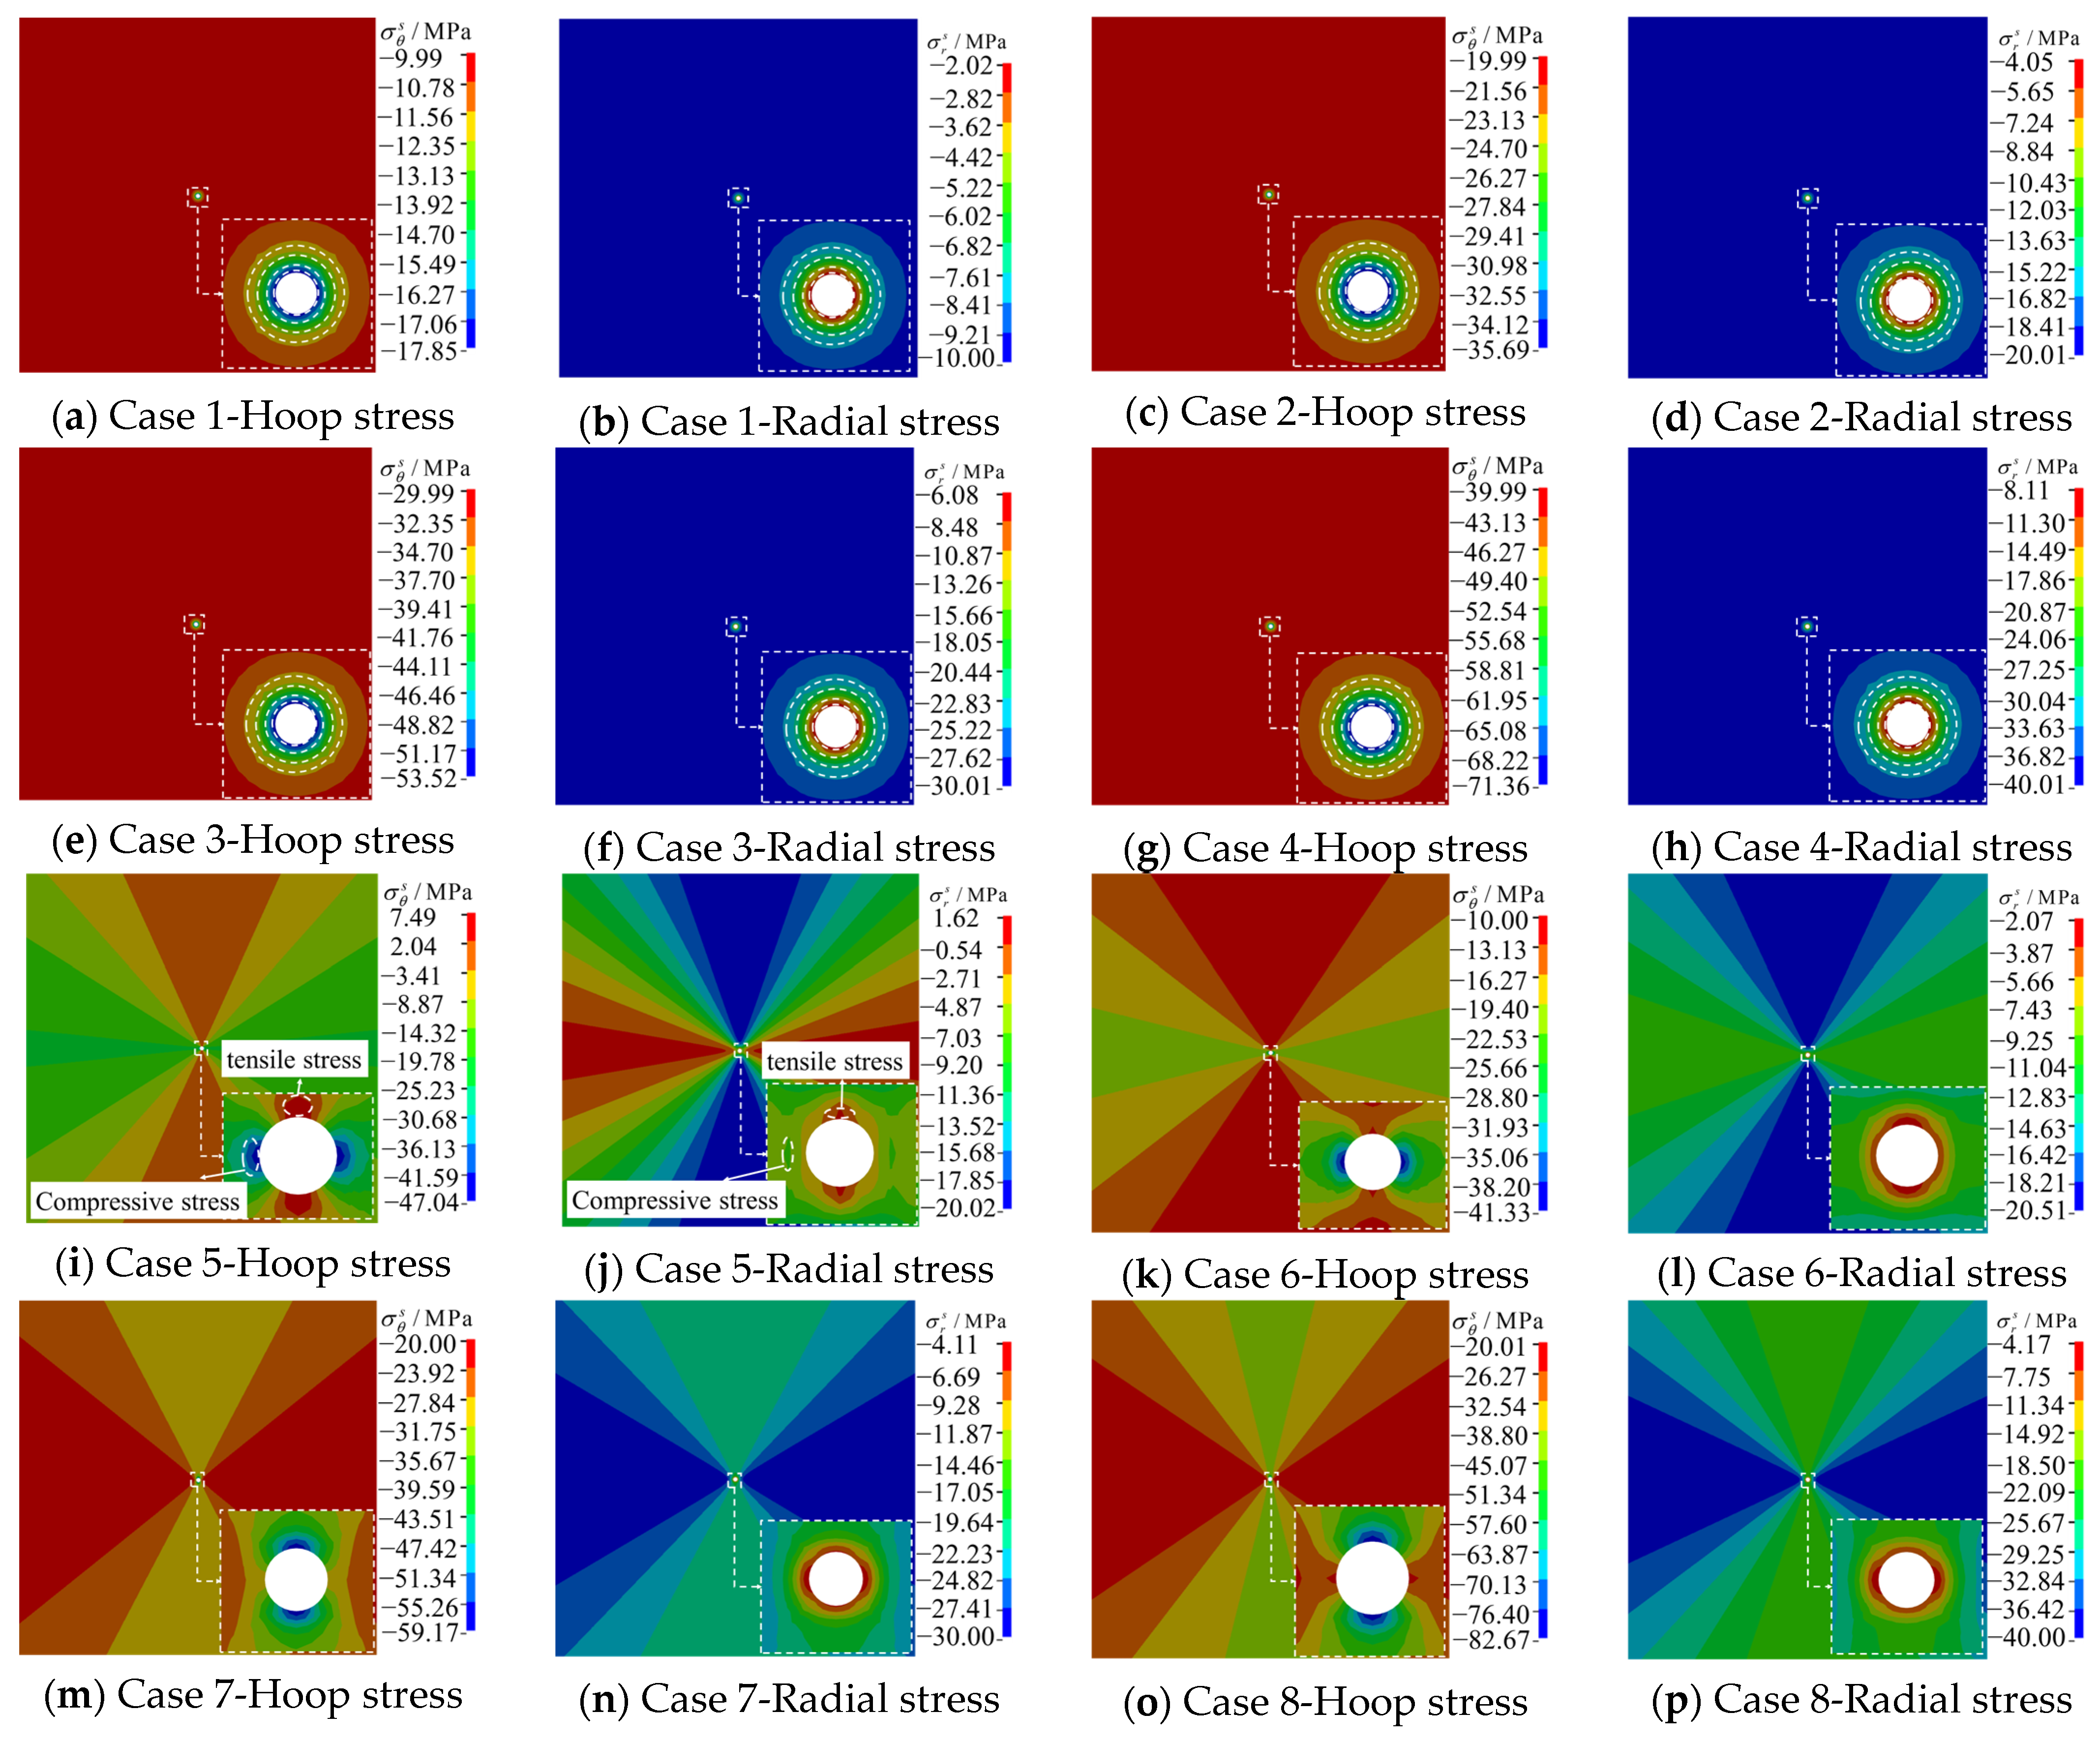
Following the completion of initial in situ stress preloading, LS-PREPOST was used to analyze the loading results. To accurately characterize the stress distribution around the blasthole, a local cylindrical coordinate system was established with the blasthole center as the origin. Stress contours of the rock mass under 8 cases were extracted, as shown in
Figure 6. Observations from
Figure 6a–h indicated that under hydrostatic pressure conditions (
K = 1), both hoop stress and radial stress around the blasthole exhibited symmetric distributions. All stress values were negative, indicating compressive stress conditions. Further analysis revealed that the peak compressive stress increased linearly with rising confining pressure. The magnitude and distribution patterns aligned with the theoretical calculations presented in
Section 2.2. This consistency validated the reliability of the numerical model for simulating isotropic in situ stress fields.
The stress distribution around the blasthole exhibited anisotropic characteristics when
K = 0, as demonstrated in
Figure 6i,j. Localized tensile stress concentration developed in both hoop and radial stresses along the vertical direction, while compressive stress concentration dominated horizontally. The concentration intensity of compressive hoop stress significantly exceeded that of radial stress. This response directly correlated with rock lower tensile strength compared to its compressive resistance. Due to insufficient horizontal confinement, the vertical direction more readily formed tensile stress concentration zones under initial stress conditions, thereby creating favorable conditions for crack propagation along this orientation. The concentration zone of compressive hoop stress around the blasthole shifted its dominant orientation from a horizontal to a vertical direction with increasing horizontal in situ stress, as can be observed in
Figure 6i–p. The local peak compressive stress demonstrated a continuous upward trend with rising
K. These observed patterns aligned with the stress distribution characteristics predicted by theoretical derivations in
Section 2.2. The agreement not only verified the theoretical model’s accuracy but also confirmed the rationality and precision of both the numerical parameters and in situ stress preloading methodology employed in this study.
4. Results
4.1. Stress Evolution
4.1.1. Stress Evolution Under Hydrostatic Conditions
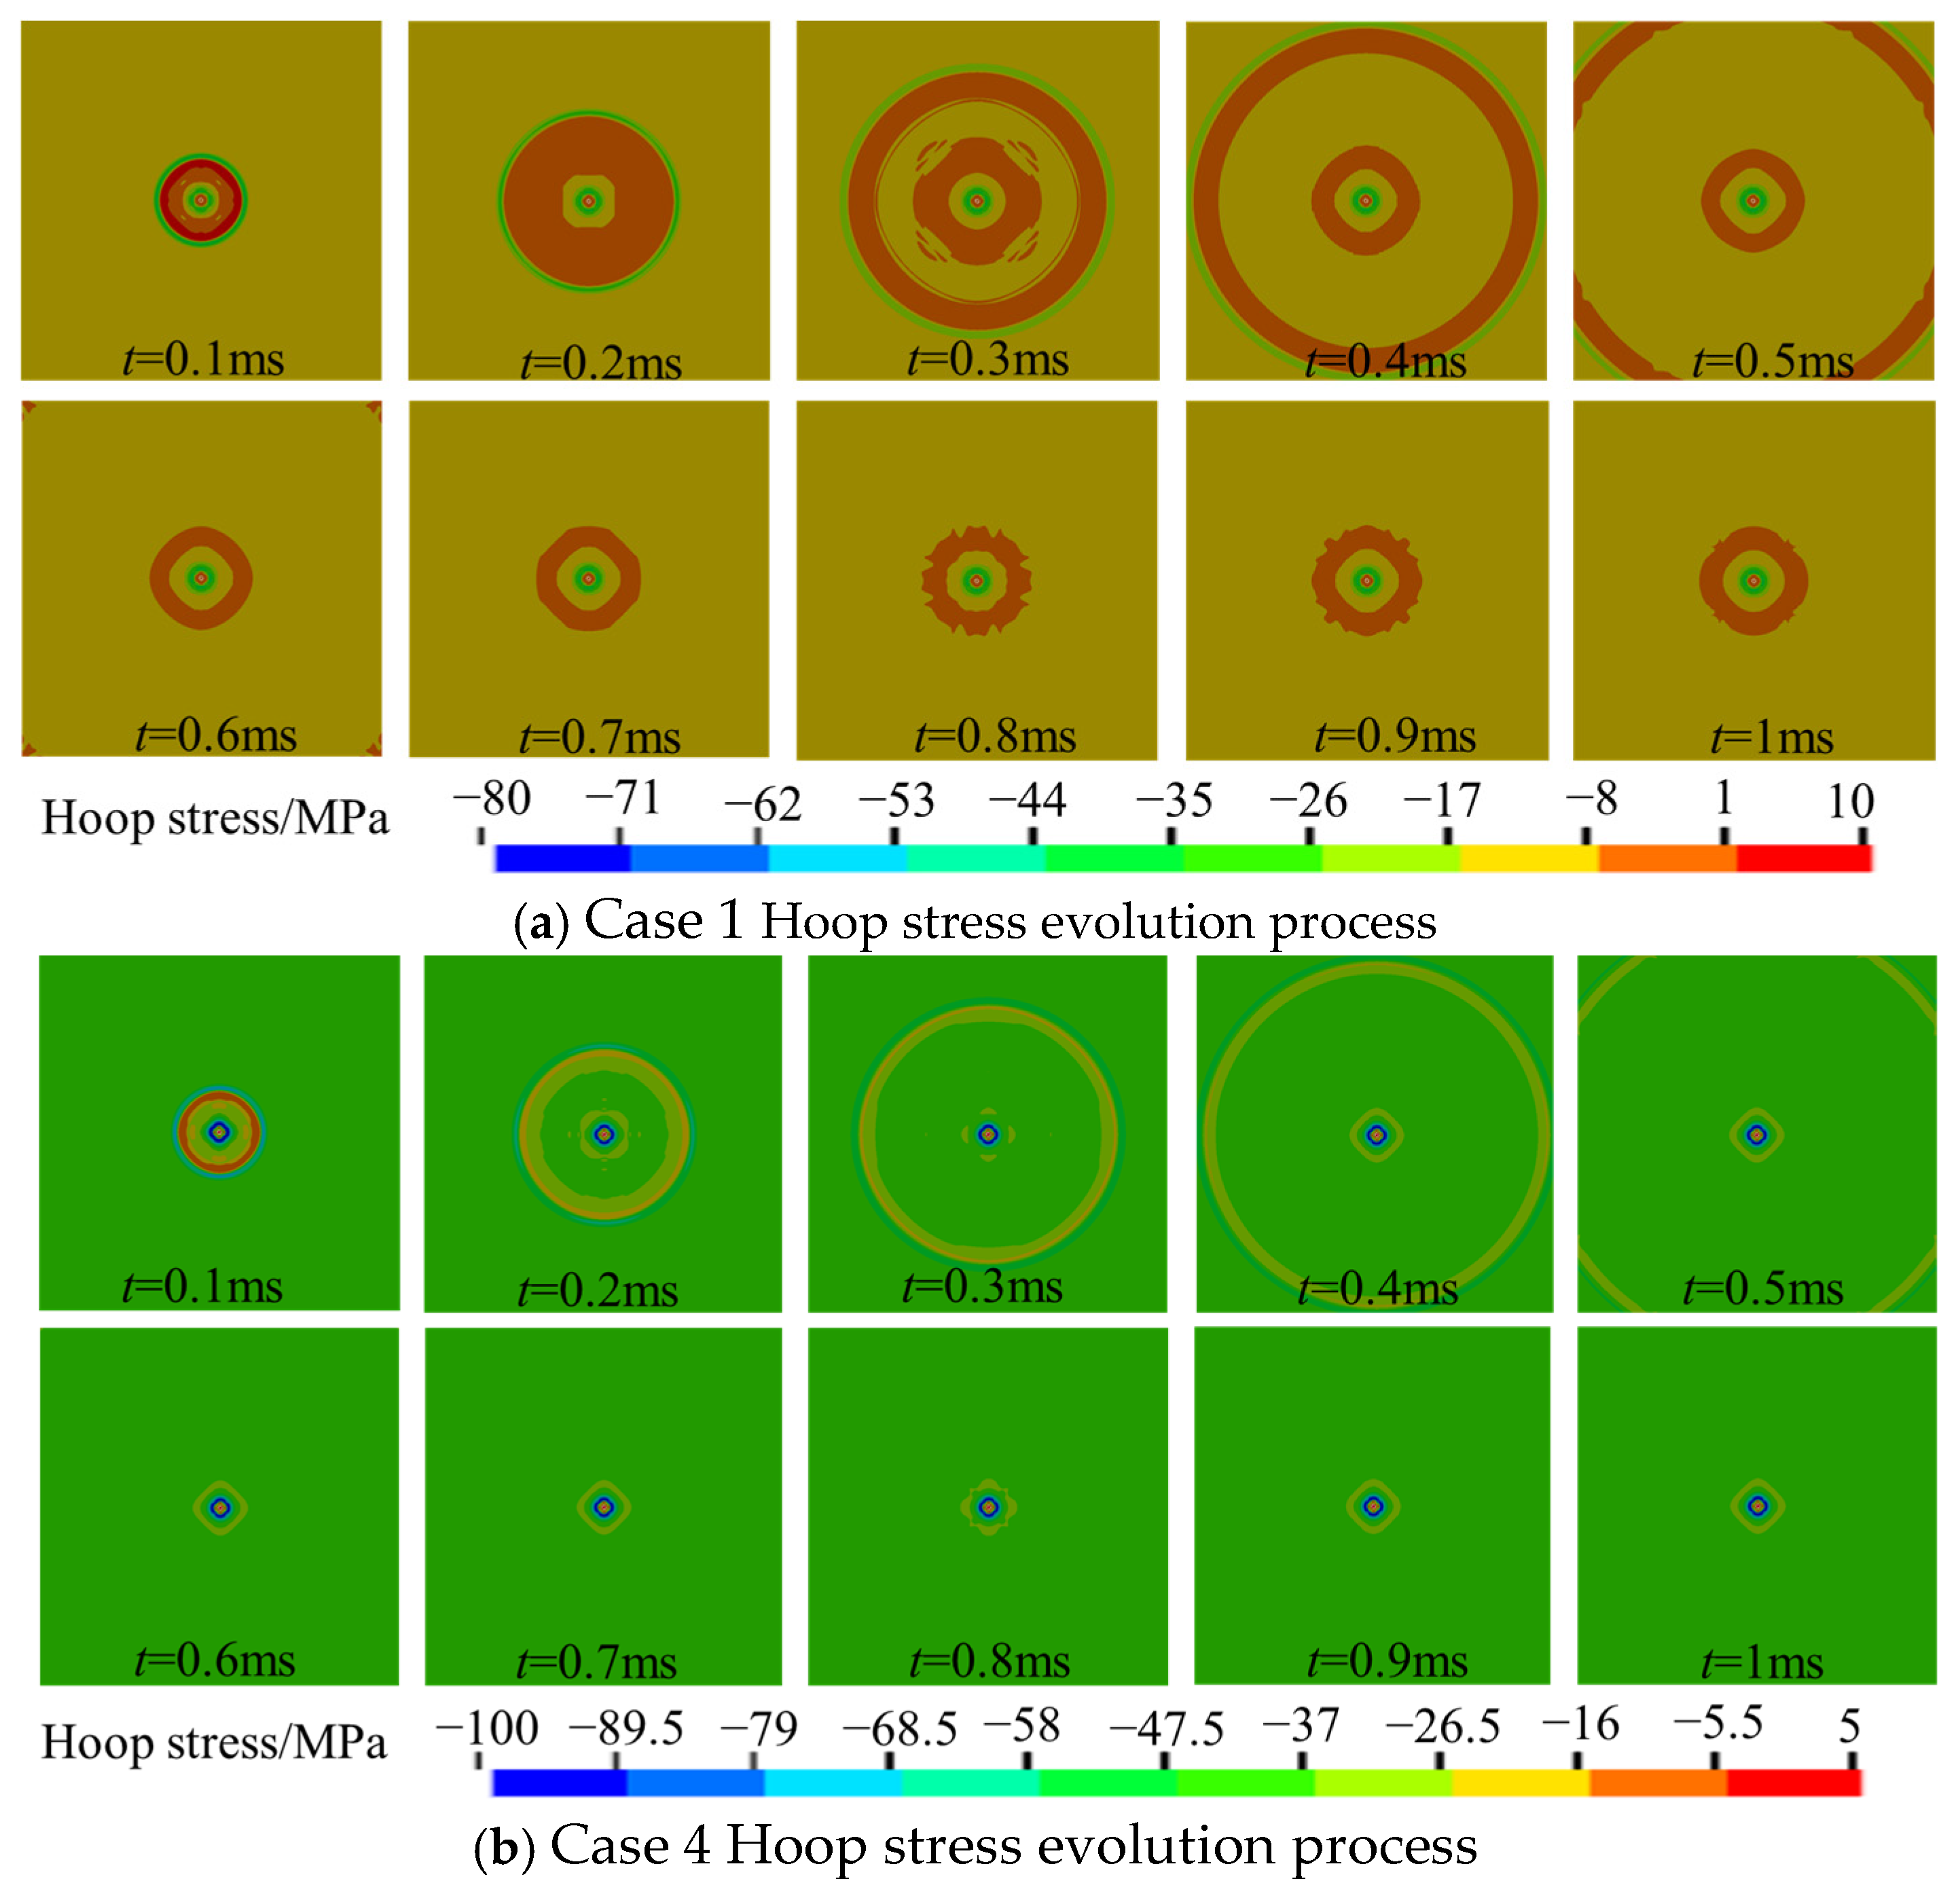
As analyzed previously, hoop stress serves as the primary factor controlling crack propagation in rock masses. To further investigate the variation mechanism of hoop stress under hydrostatic in situ stress conditions, this section compares the spatiotemporal distribution of hoop stress in Case 1 and Case 4, with results presented in
Figure 7.
Under low hydrostatic in situ stress (Case 1, 10 MPa), the initial detonation formed a high-stress concentration zone near the explosive source, demonstrating the compaction effect resulting from shock compression. Simultaneously, a tensile stress region emerged in the peripheral area, where stress intensity initially increased before gradually decaying over time. The peak compressive hoop stress near the blasthole reacheed approximately 102 MPa. As hoop stress propagated (t = 0.4–0.7 ms), the compressive stress progressively attenuated while the tensile zone contracted. When T ≥ 0.8 ms, the hoop stress returned to the initial 10 MPa hydrostatic state, characterized by decaying central compressive stress and complete dissipation of peripheral tensile stress.
Under high hydrostatic in situ stress conditions (Case 4, 40 MPa), the detonation initially created more intensive compressive stress concentration near the explosive source. The elevated initial pressure substantially raised the rock’s tensile strength threshold, delaying the appearance of the tensile zone until t = 0.2 ms while maintaining a consistently low amplitude throughout. The peak compressive hoop stress near the blasthole reached approximately 125 MPa. As compressive stress propagated (t =0.3–0.5 ms), the combined effect of initial compressive stress and dynamic shock loading enabled faster expansion and broader distribution of the compressive zone. The tensile region remained suppressed by high in situ stress, appearing only as localized fluctuations in the vicinity of the explosive source. During the subsequent attenuation phase, the hoop stress rapidly converged toward the initial compressive stress state. The distribution became increasingly uniform without significant residual tensile stress.
Comparative analysis of different hydrostatic pressure conditions revealed that in situ stress significantly influenced hoop stress evolution through “threshold regulation” and “superposition effects.” Under low hydrostatic pressure, the dynamic blast load readily exceeded the material’s tensile crack initiation threshold. The hoop stress demonstrated a “compression–tension–compression” dynamic transition, with tensile stress persisting for extended durations across widespread areas. The fracture mechanism was characterized as “dynamic-load dominated,” driven by tensile stress. Under high hydrostatic pressure, the superposition of initial compressive stress and dynamic blast loading intensified compressive stress concentration while substantially suppressing tensile stress development. The hoop stress maintained predominantly compressive characteristics throughout the process, transitioning the fracture mode to “compressive–shear composite” behavior.
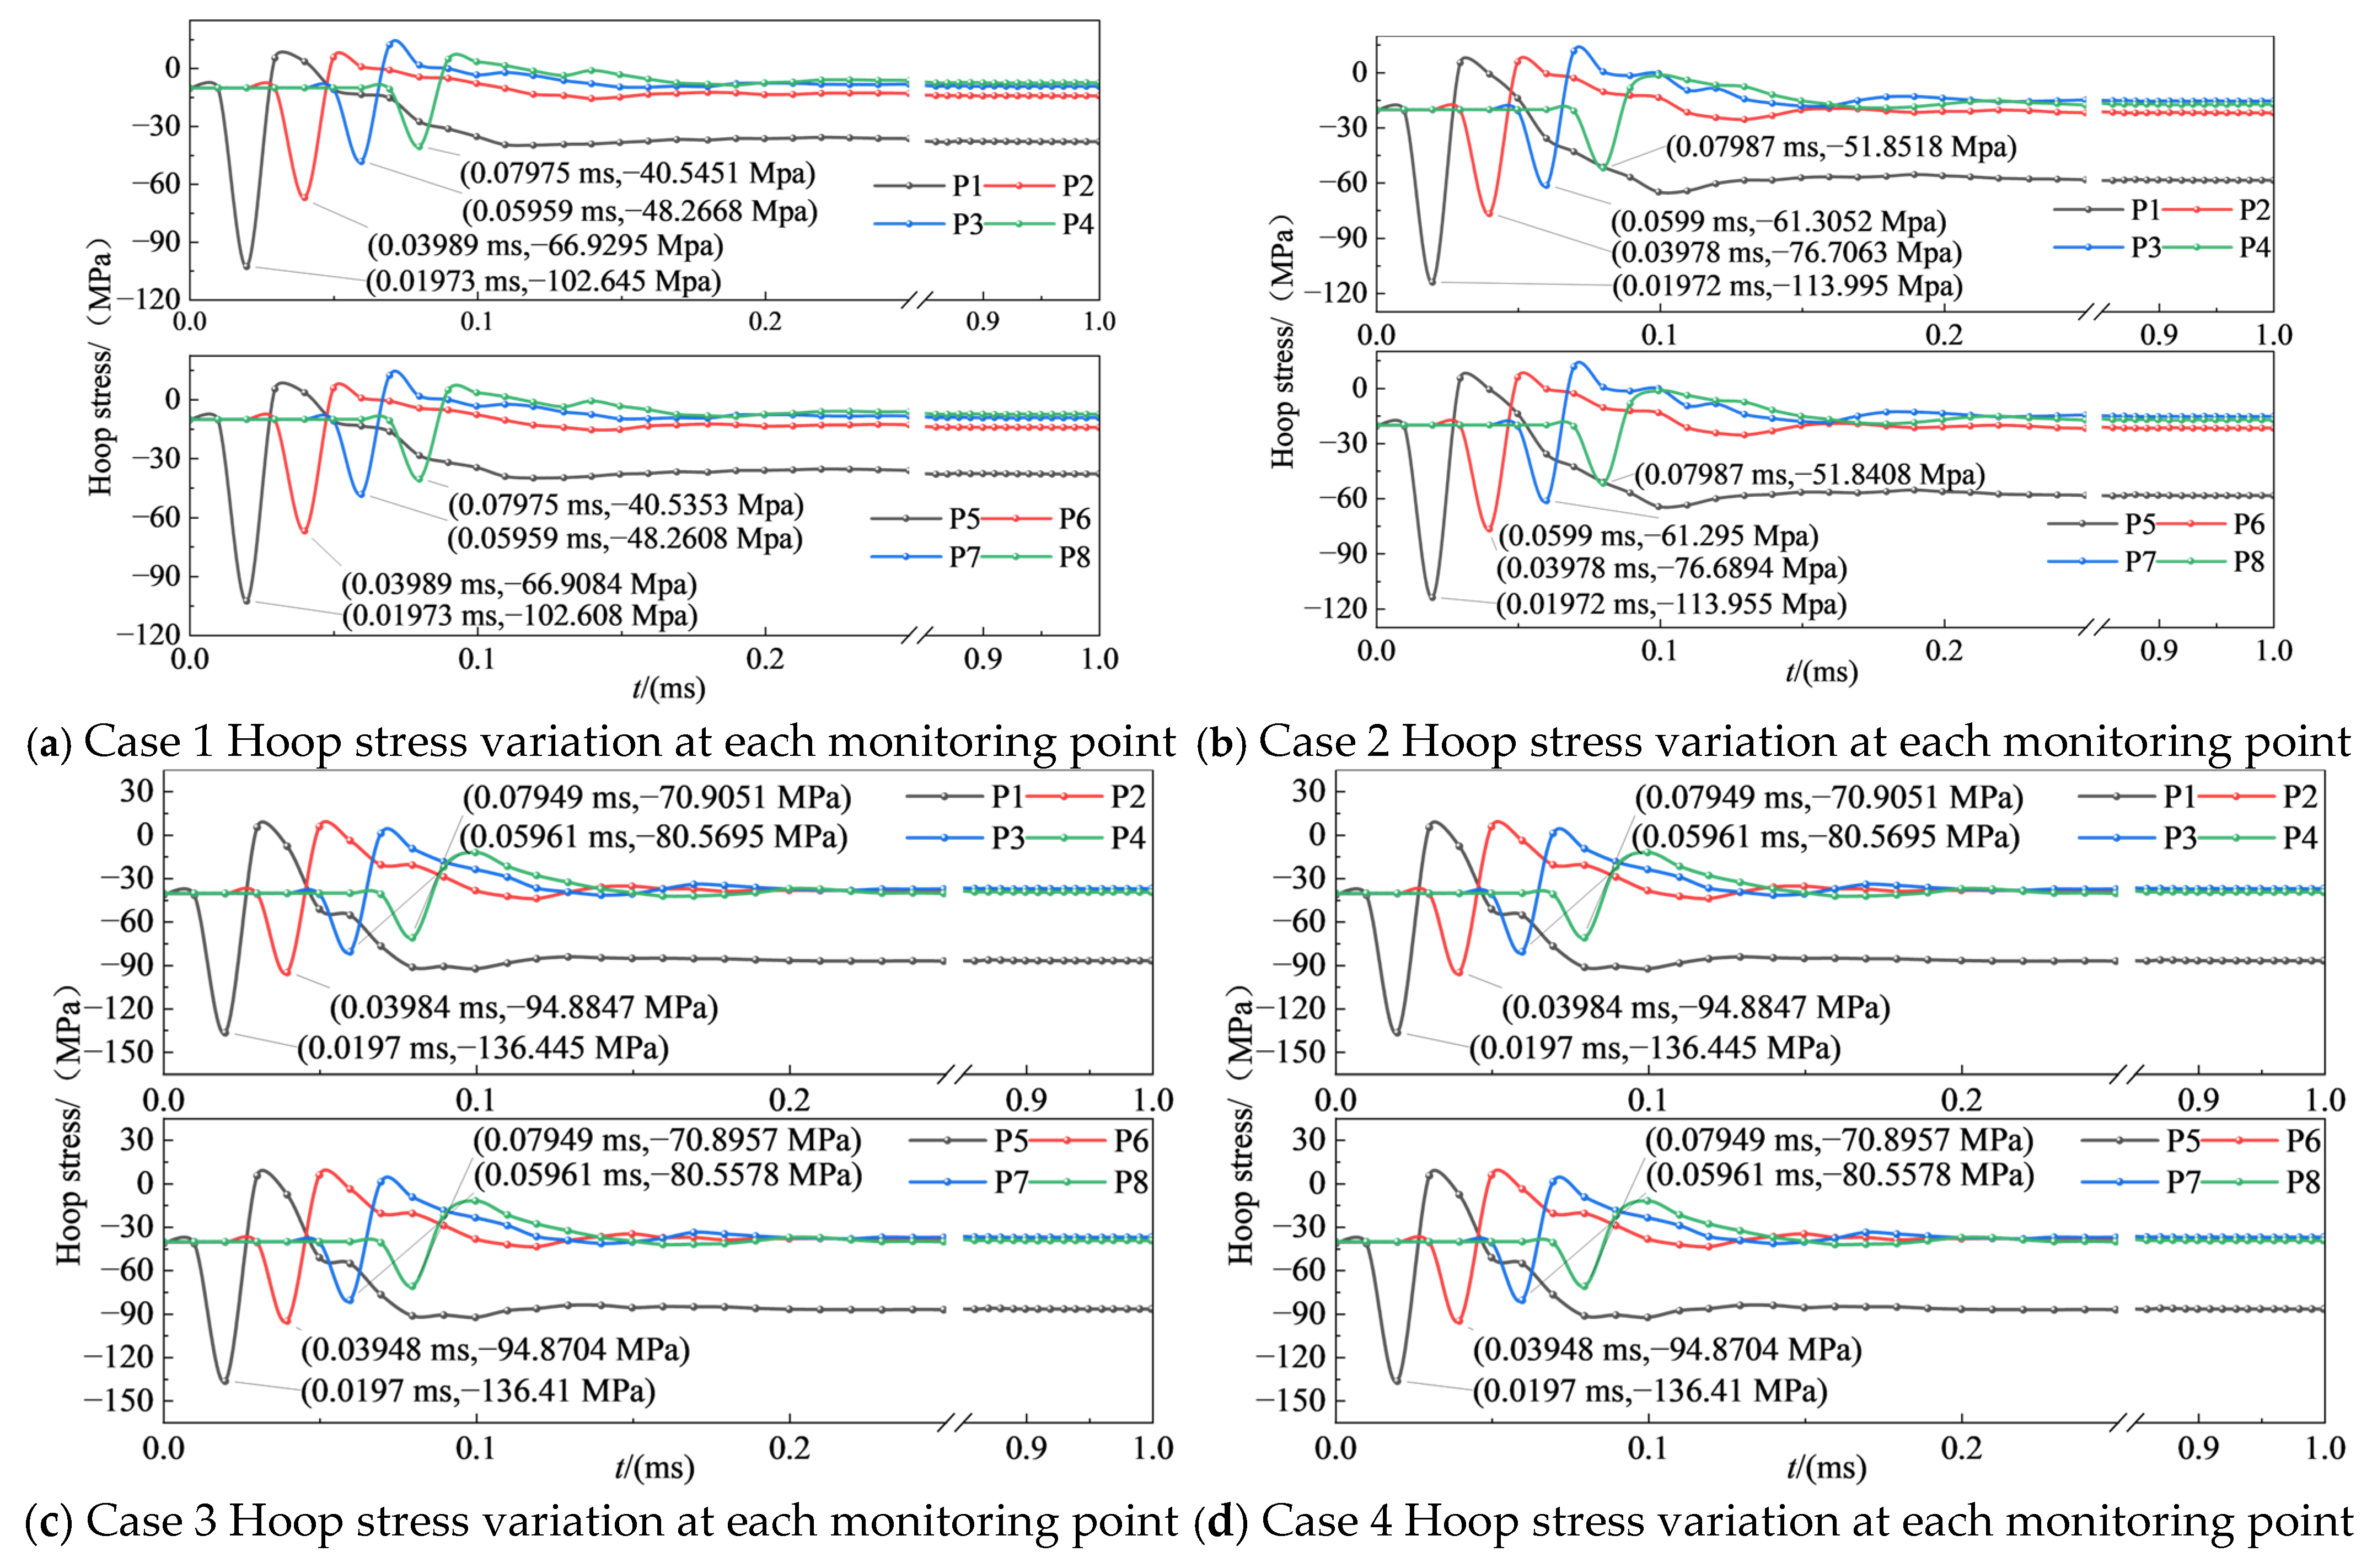
The temporal variation in hoop stress near the blasthole under hydrostatic in situ stress conditions is shown in
Figure 8. Within the same case, the hoop stresses in both horizontal and vertical directions demonstrated similar magnitudes and variation ranges. Upon detonation, the hoop stress near the blasthole rapidly reached its peak compressive value. Higher initial in situ stress produced greater absolute peak values with slightly delayed occurrence, indicating more pronounced compaction effects and compressive stress concentration from the blast load. Stress variations at different monitoring locations revealed that the rock mass initially experienced intense compressive stress causing compression deformation, followed by rapid stress decay and subsequent transition to tensile stress.
The above analysis clarifies the complete “compression–tension–compression” phase transition process of circumferential stress under different hydrostatic confining pressures, and identifies the critical stress threshold at which the tensile phase is fully suppressed. The quantitative characterization of this stress evolution provides an important mechanical basis for the unified scaling relationship proposed in
Section 5.
4.1.2. Stress Evolution Under Non-Hydrostatic Conditions
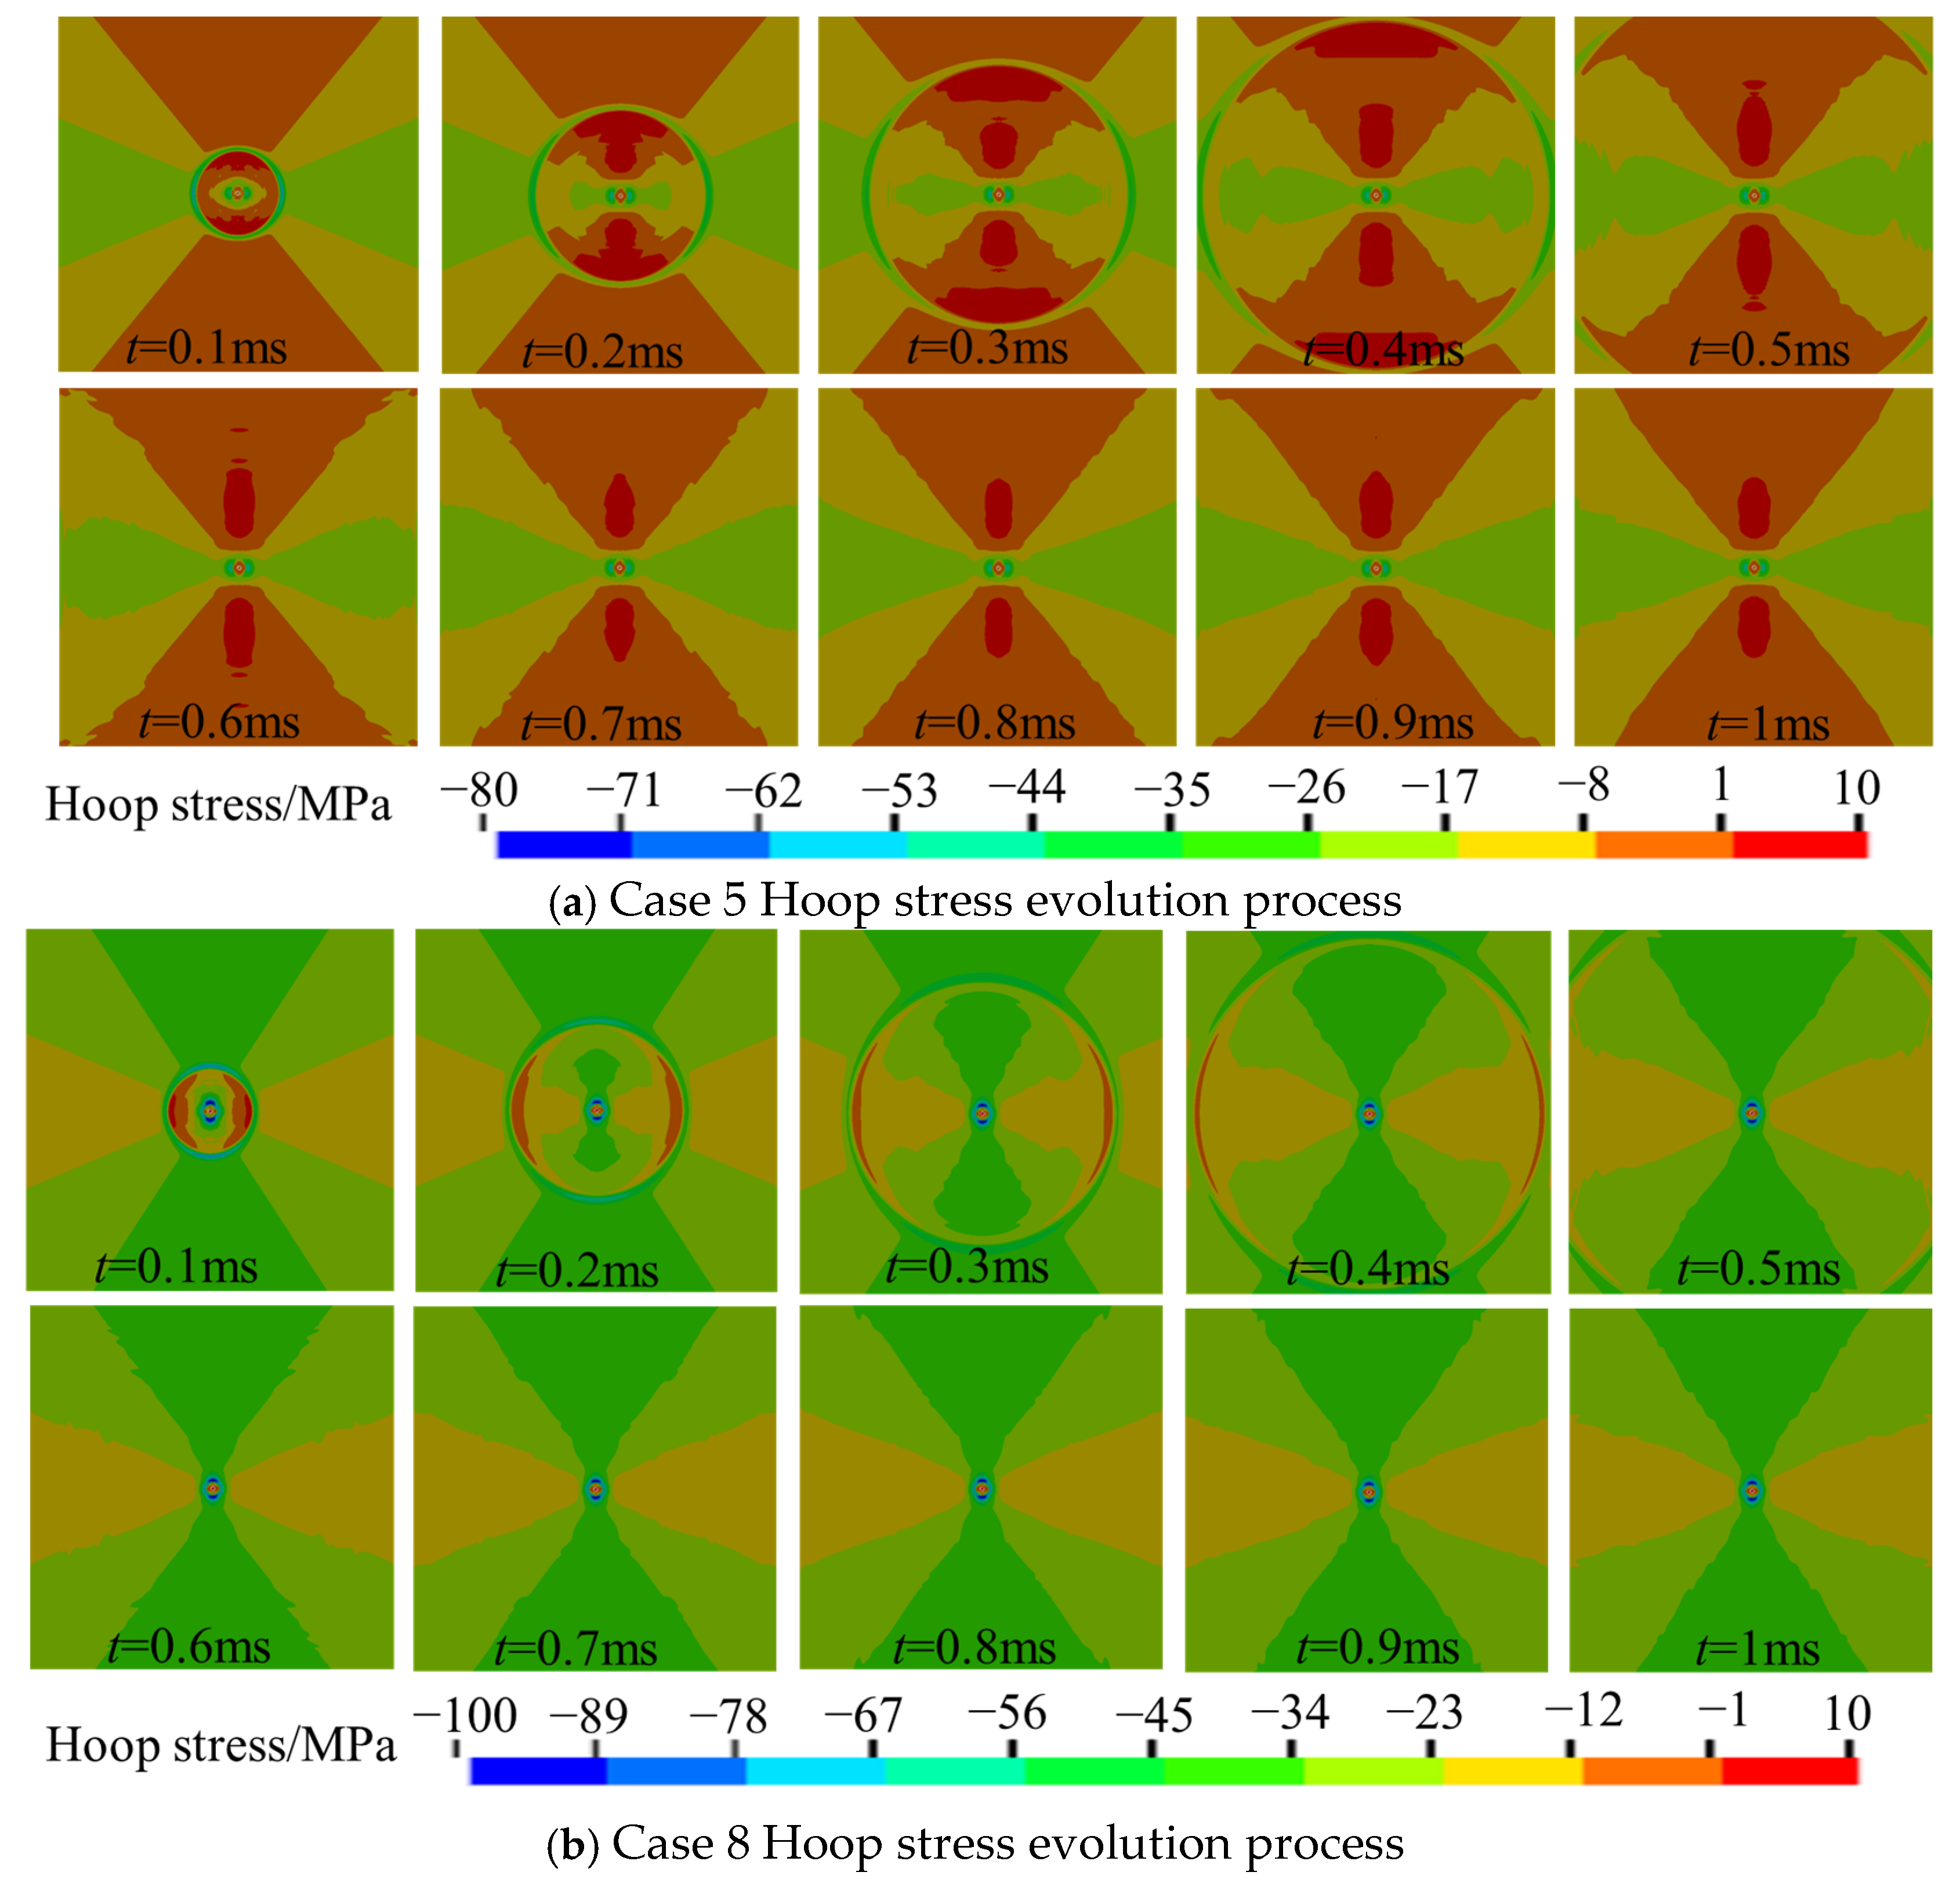
Under non-hydrostatic in situ stress conditions, the initial blasting phase formed a circumferential compressive stress concentration zone near the explosive source, as illustrated in
Figure 9a. The horizontal direction, with zero initial confinement, possessed the lower material confinement and consequently first reached the crack initiation threshold. This triggered a tensile stress zone outside the compressive region, exhibiting significantly faster propagation than the vertically constrained direction. During the 0.3–0.6 ms phase, the compressive zone expanded uniformly while tensile stress anisotropy intensified progressively. The horizontal direction dominated both the extent and magnitude of tensile stress development. Vertical tensile stress remained suppressed by initial confinement, demonstrating transitional “compressive–tensile” characteristics that ultimately formed an asymmetric pattern with horizontal tensile fracturing and vertical stress alternation. During subsequent attenuation, hoop stresses recovered toward initial in situ conditions. The horizontal direction exhibited prolonged stress relaxation due to the absence of initial confinement, while the vertical direction rapidly reverted to compressive dominance, clearly reflecting anisotropic stress decay in deviatoric stress fields.
The results obtained under high horizontal in situ stress are shown in
Figure 9b. In this case, the strong compressive confinement in the horizontal direction immediately caused differential responses between the two directions during initial detonation. The horizontal direction demonstrated more pronounced compressive stress concentration, with its propagation enhanced by in situ stress. Meanwhile, the vertical direction, with lower initial confinement, allowed earlier tensile stress development. As stress waves propagated (
t = 0.3–0.6 ms), these differences intensified. The high compressive stress in the horizontal direction effectively suppressed tensile stress development, forming a broader and higher-magnitude compressive zone. Simultaneously, the vertical tensile stress continued expanding, ultimately creating an asymmetric stress pattern characterized by “horizontal compression and vertical tension.” During the attenuation phase (
t = 0.6–1.0 ms), the hoop stress waves ceased significant outward expansion. Their energy propagation paths exhibited clear directionality, concentrating toward the maximum principal stress direction. This mechanism further amplified the mechanical behavior differences between the two orientations.
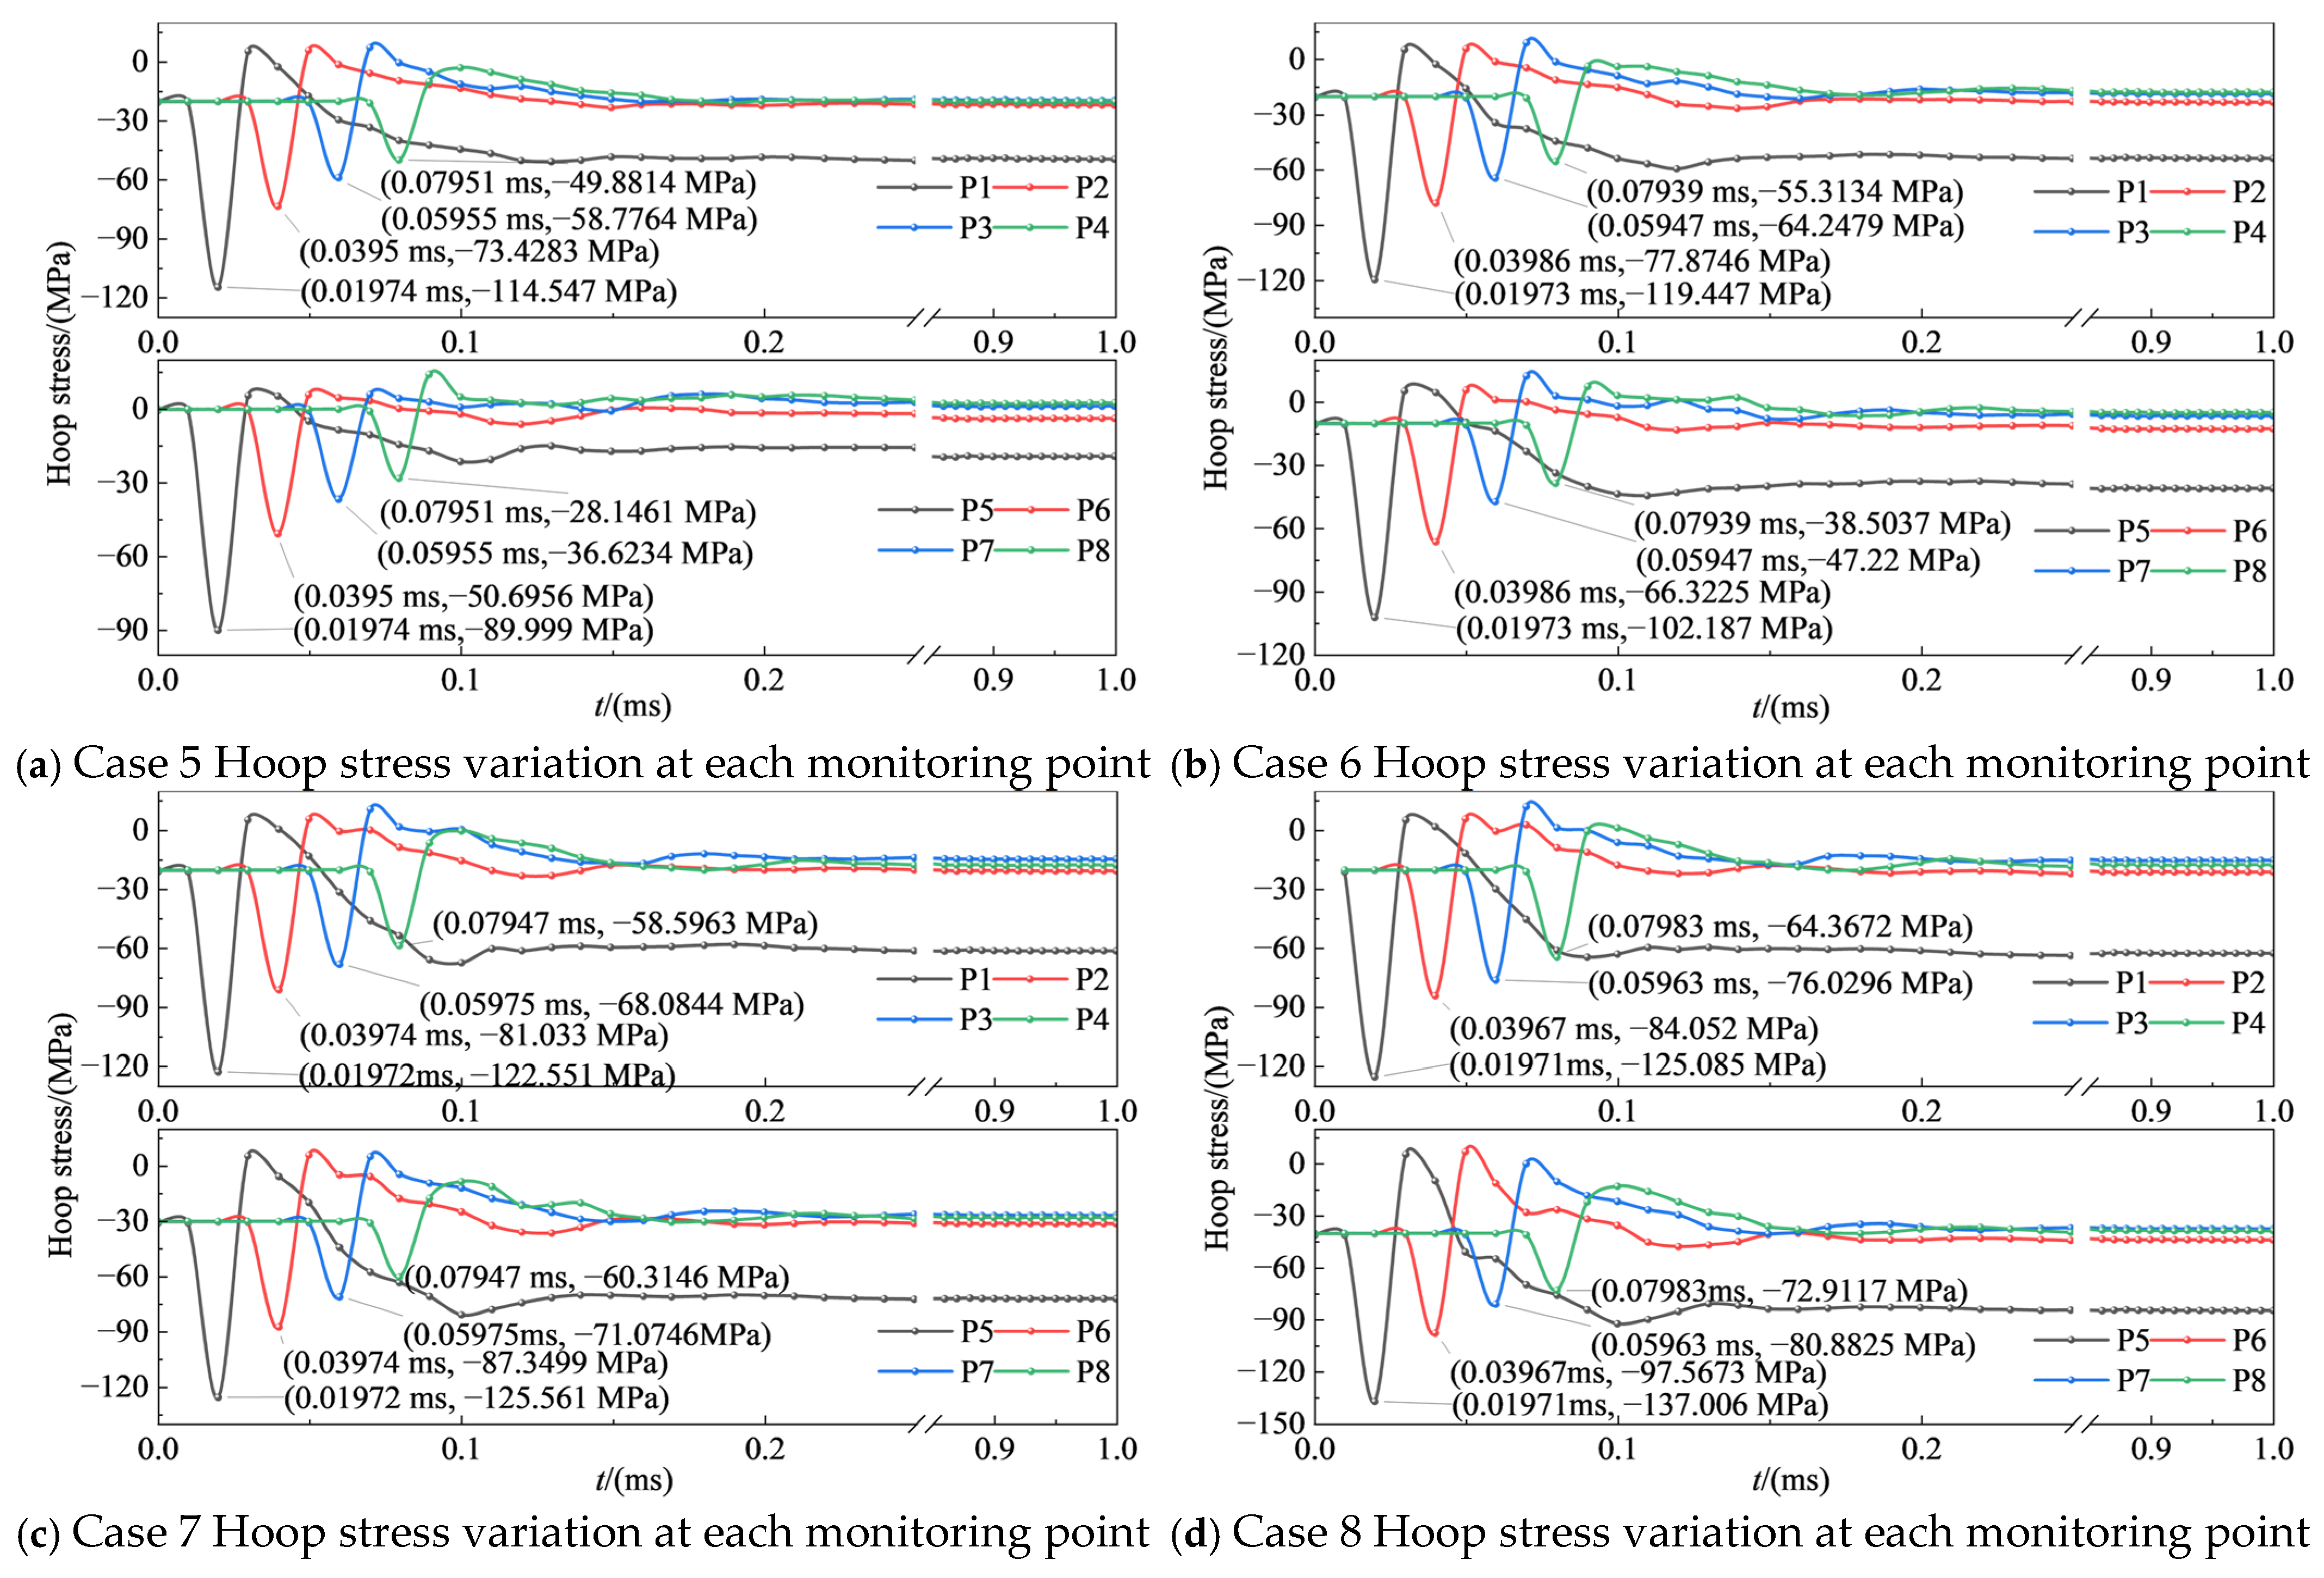
The temporal variation in hoop stress near the blasthole under non-hydrostatic in situ stress conditions is presented in
Figure 10. It revealed that the hoop stress around the blasthole demonstrated significant anisotropy under non-hydrostatic pressure, particularly in the difference between compressive stress peaks. When the horizontal initial stress remained low, its constraining effect on the dynamic blast load was relatively weak. This resulted in higher peak hoop stress in the horizontal direction than in the vertical direction, manifesting an “amplification effect” of dynamic pressure transmission under weak confinement conditions.
The vertical direction sustained higher compressive hoop stress, as K increased. All monitoring points recorded their peak stresses within 0.02–0.08 ms after detonation, reflecting the instantaneous nature of blast-induced stress wave propagation. During the late detonation phase, the attenuation rate of stress oscillation amplitude showed a close correlation with rock mass integrity. The more pronounced oscillations observed in Case 8 indicated delayed energy dissipation under high-stress conditions. Hoop stress distribution demonstrated significant anisotropy governed by K values: horizontal hoop stress increased steadily with K, while the vertical direction developed stress concentration under high lateral stress coefficients. Stress–time history curves revealed that dynamic loading dominated the initial peak stresses, with subsequent oscillations representing the self-adjustment process of the rock mass.
The above analysis elucidates the anisotropic evolution of circumferential stress under different lateral stress coefficients and identifies an “amplification effect” in dynamic stress transfer along the direction of the minimum principal stress under weak constraints. This quantitative characterization of anisotropic stress evolution provides an important mechanical foundation for the subsequently proposed logistic aspect ratio relationship (Equation (10)) and unified scale relationship (Equation (12)).
4.2. Crack Propagation
4.2.1. Crack Propagation Under Hydrostatic Conditions
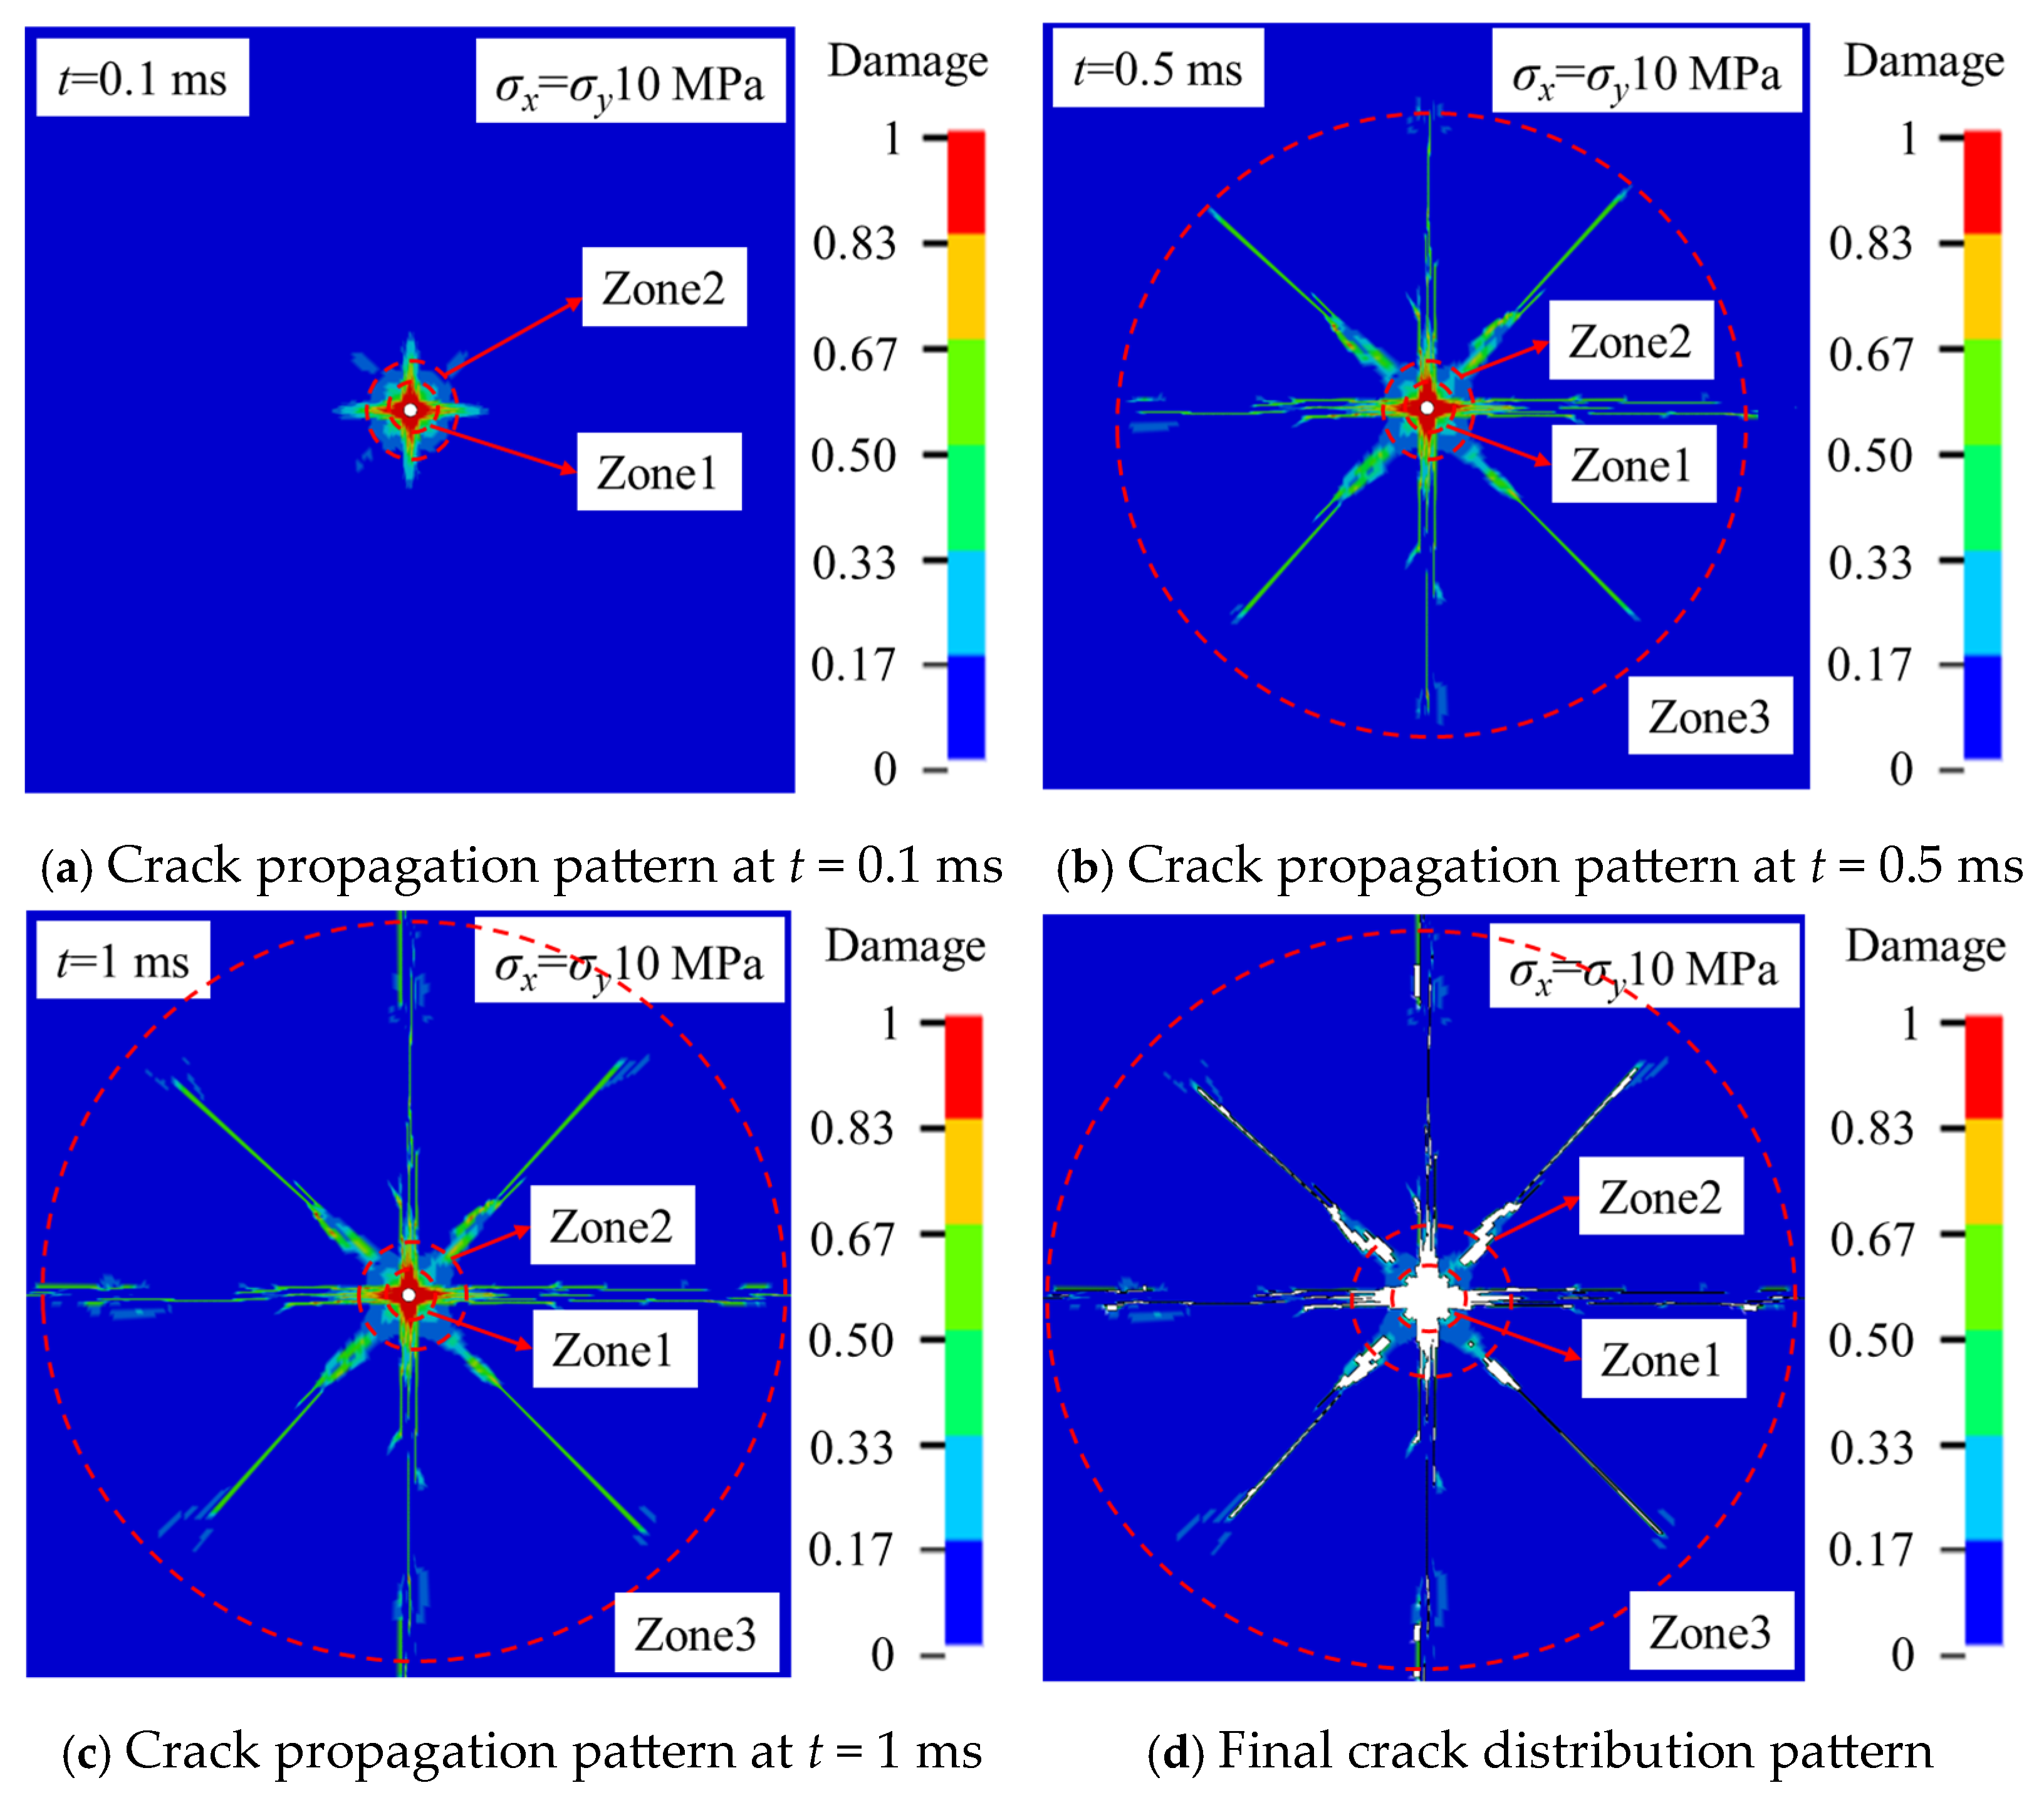
Under low in situ stress conditions, the crack propagation process during rock blasting was as shown in
Figure 11. The blast-induced stress wave generated immediately upon detonation significantly exceeded the dynamic compressive strength, forming a crushed zone (Zone I) around the blasthole, where the rock underwent complete fragmentation. As the stress wave propagated outward and gradually attenuated, the degree of rock fragmentation progressively decreased. The rock fragment size increased with the radial distance, characterizing the fractured zone (Zone II). When the stress wave reached the elastic zone (Zone III), its radial compressive component had diminished below the rock’s dynamic compressive strength, becoming insufficient to directly cause rock failure. However, since rock tensile strength is substantially lower than its compressive strength, the tensile stress component of the wave still induced crack propagation from the outer boundary of Zone II. When comparing the three zones formed after blasting, Zone III demonstrated the largest crack propagation scale and coverage area, possessing greater research significance.
Figure 11d retains elements with damage values below 0.4, clearly displaying the final morphology of blast-induced cracks.
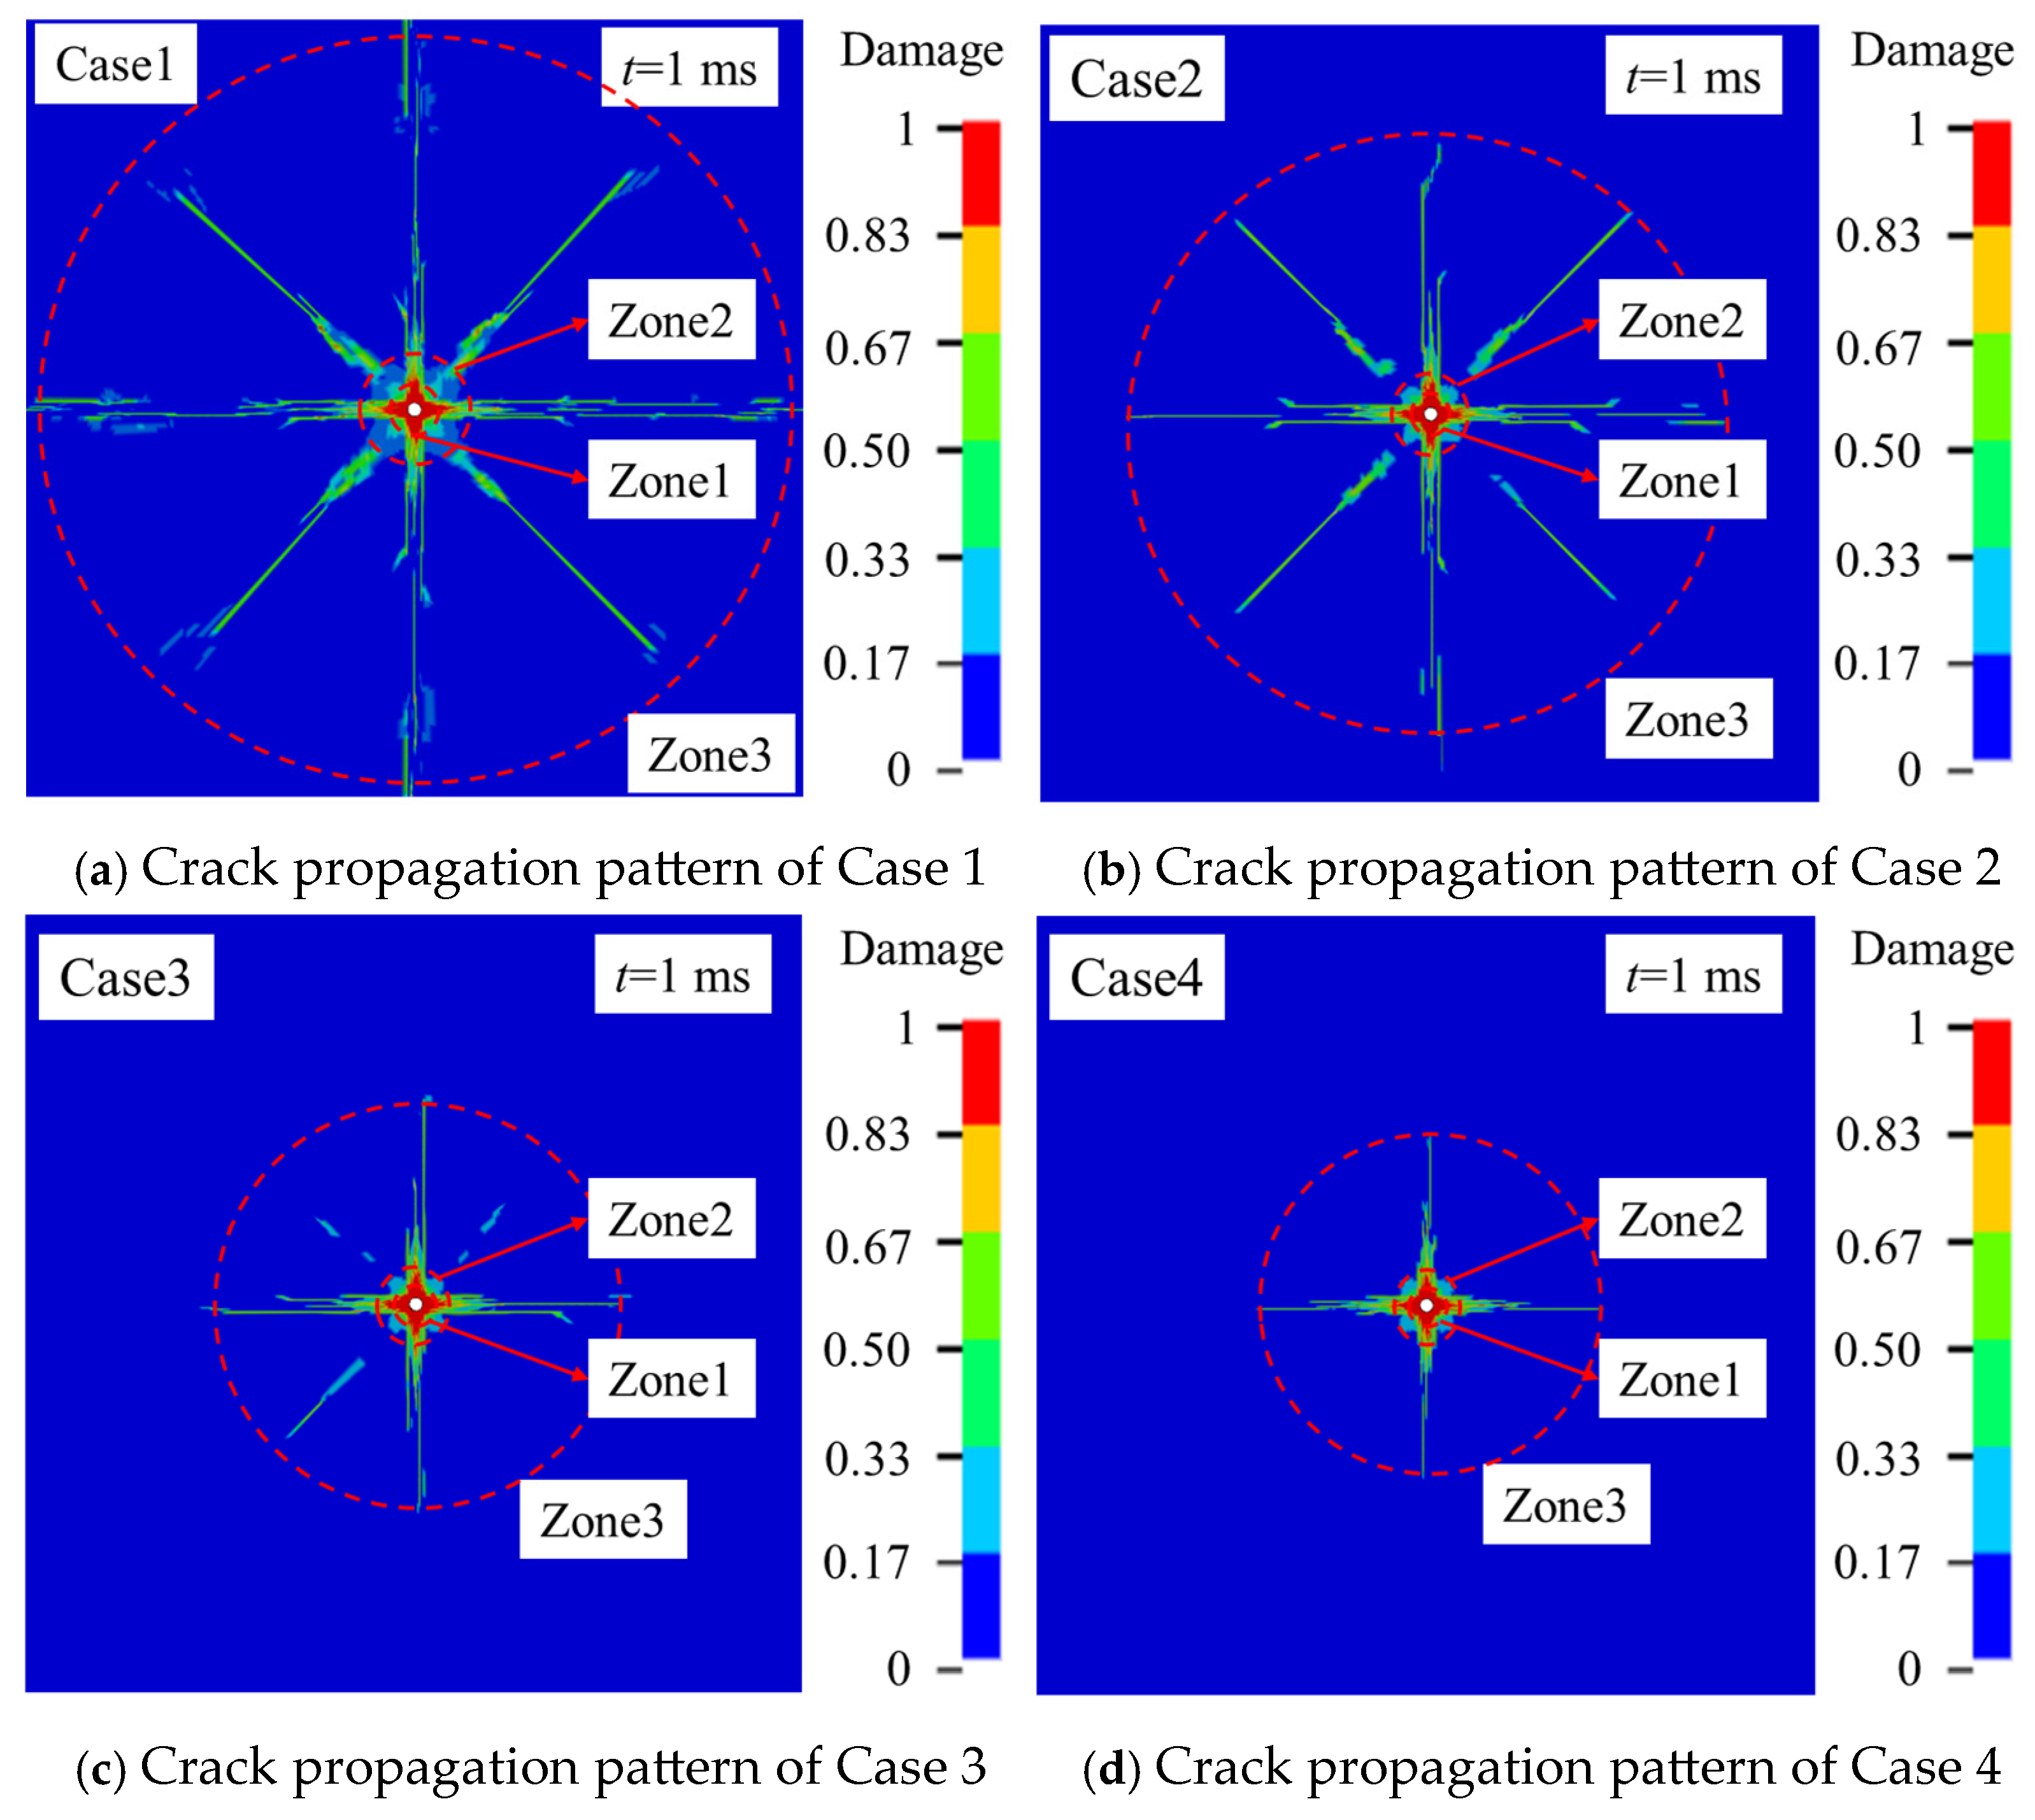
Under hydrostatic in situ stress conditions, the crack propagation patterns after rock blasting for different cases were as shown in
Figure 12. The radial blast-induced cracks exhibited an approximately symmetric distribution. At low in situ stress levels, radial cracks propagated outward from the edge of Zone II, extending to the model boundary with visible branching at crack tips. As the in situ stress increased, the blast-induced crack lengths decreased significantly. This reduction resulted from the inhibitory effect of high in situ stress, which substantially attenuated the tensile stress component in the blast-induced stress waves, thereby limiting radial crack propagation. Besides the restricted propagation length, the number of cracks in Zone III also decreased with increasing in situ stress. However, the extent of the near-blast region remained relatively consistent across different initial in situ stress conditions. This consistency occurred because the shock pressure generated by explosive detonation far exceeded the compressive strength, meaning the destruction scale in this region became less sensitive to variations in in situ stress.
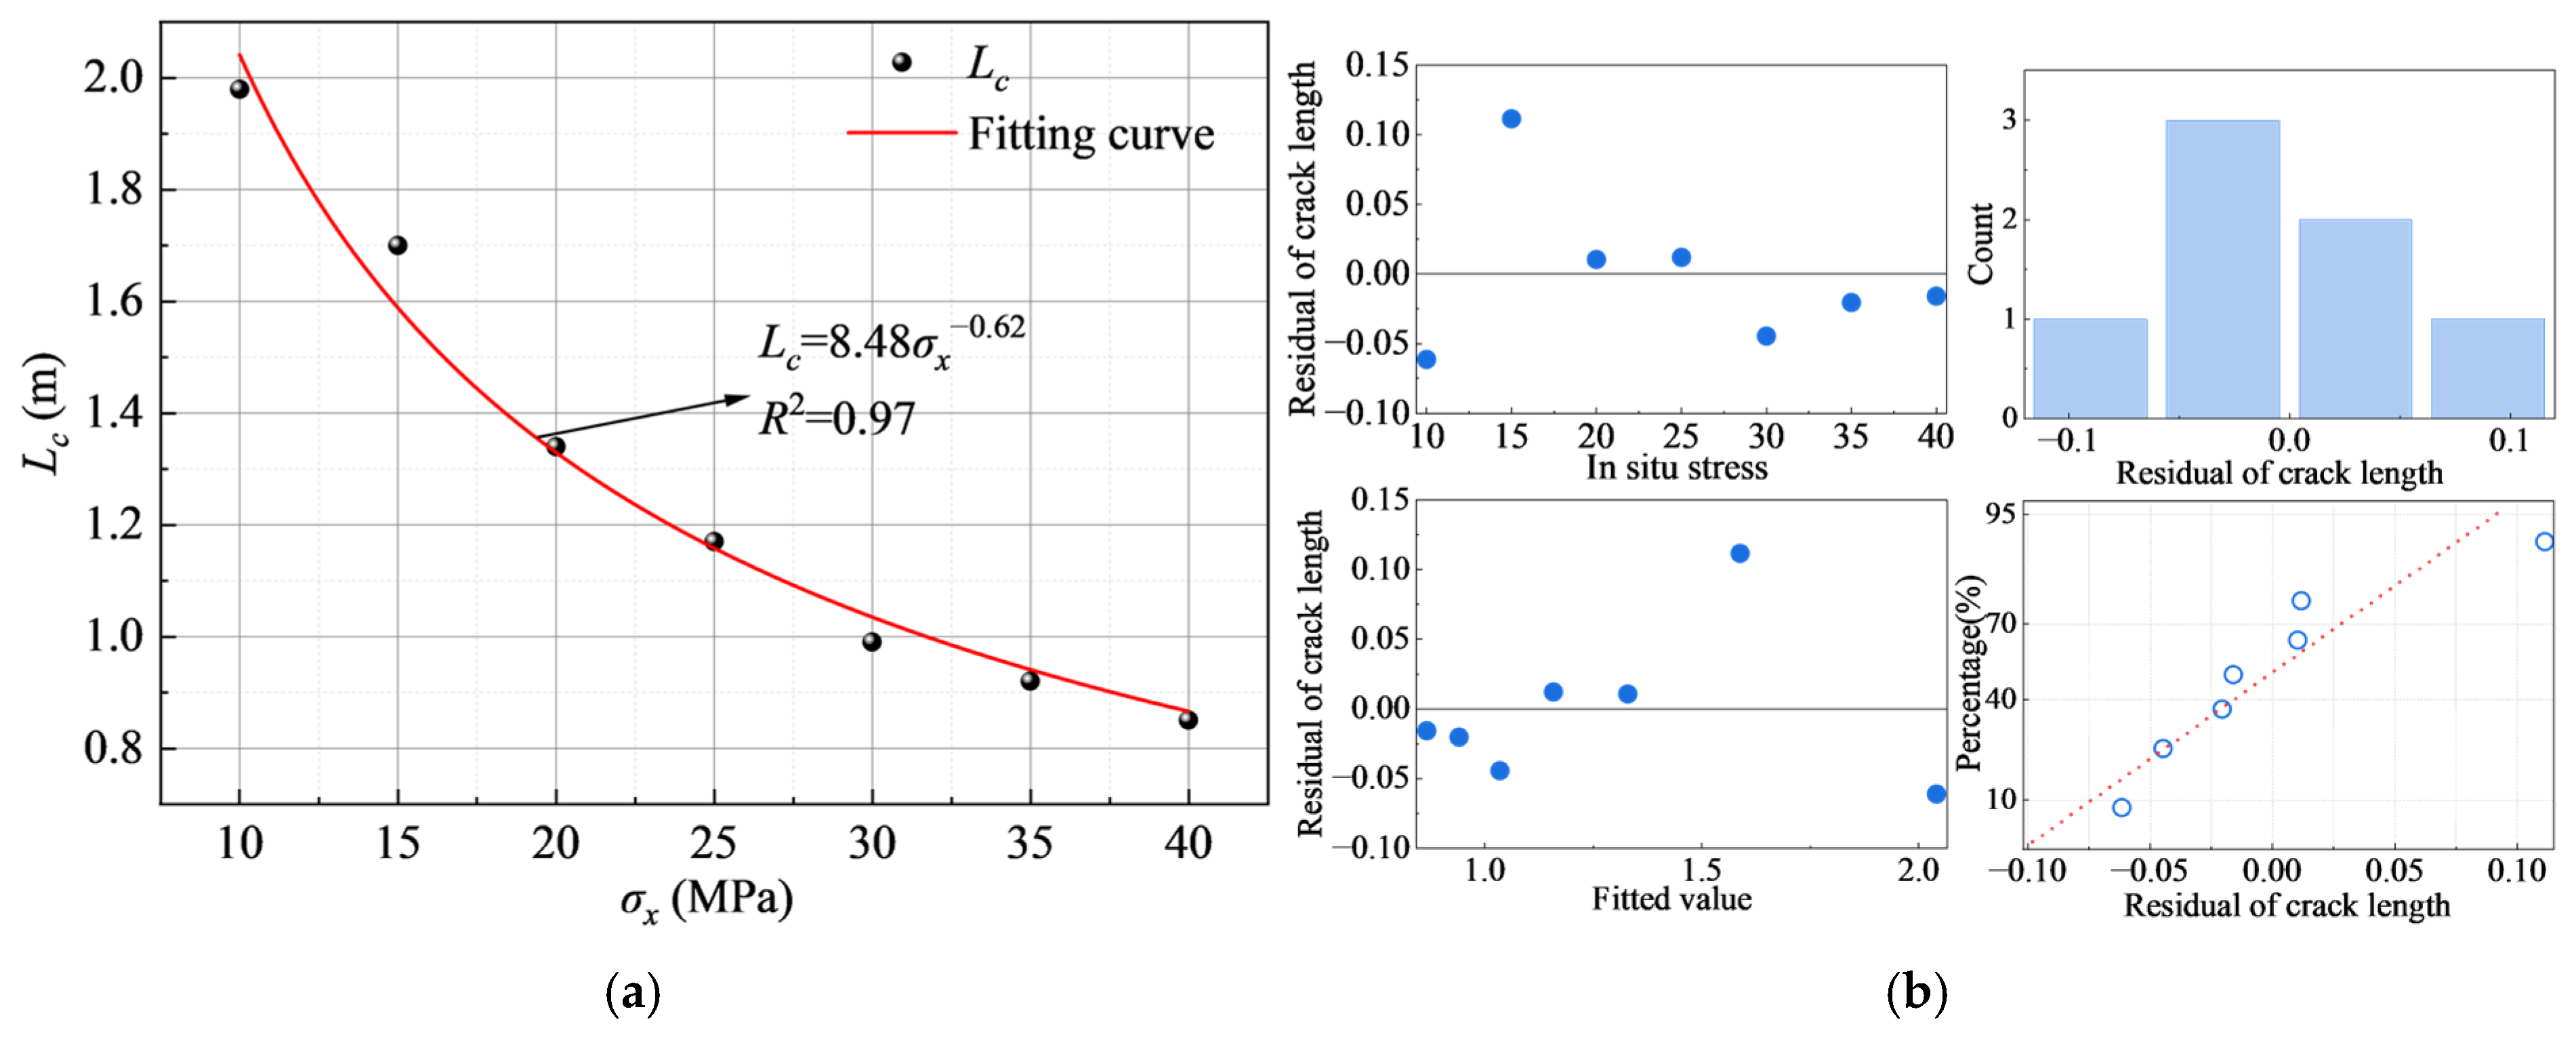
The simulation results demonstrated that high in situ stress significantly suppressed blast-induced crack propagation during rock blasting. The dynamic evolution of crack length under different in situ stress conditions is shown in
Figure 13. Curve fitting revealed that the blast-induced crack length decreased markedly with increasing in situ stress, demonstrating a negative correlation between these parameters. This relationship indicated that higher initial in situ stress produced greater compressive stress levels within the rock mass, making it more difficult for blast-induced stress waves to drive extensive crack propagation. The quantitative relationship between final crack length
Lc (m) and initial in situ stress
σx (MPa) is expressed by Equation (9),
It is important to note that Equation (9) was derived from single-hole numerical simulations under idealized conditions and thus represents a fundamental relationship that quantifies the suppression effect of in situ stress on crack propagation. In actual engineering practice, blasting operations typically employ multi-hole layouts with delay initiation, where the interaction of stress waves between adjacent blastholes, superposition of reflected waves, and free surface effects collectively influence the final crack network and fragmentation pattern. Consequently, the quantitative values predicted Equation (9) should not be directly applied to multi-hole blasting without careful consideration of these field conditions. The equation is best suited to estimating the crack length under controlled or simplified conditions.
As shown in
Figure 13b, the scatter plot of residuals against both independent variables and fitted values demonstrated randomly distributed points around zero. The residuals showed no systematic patterns or trends, indicating their independence from both predictors and fitted values, which confirmed the absence of systematic bias in the model. Furthermore, the residual histogram displayed essential symmetry, with values concentrated near zero. The residual probability plot revealed that data points generally followed the theoretical normal distribution reference line. These results collectively indicated that the residuals approximately followed a normal distribution, satisfying the model’s fundamental assumption regarding error distribution and further validating the accuracy of the derived relationship.
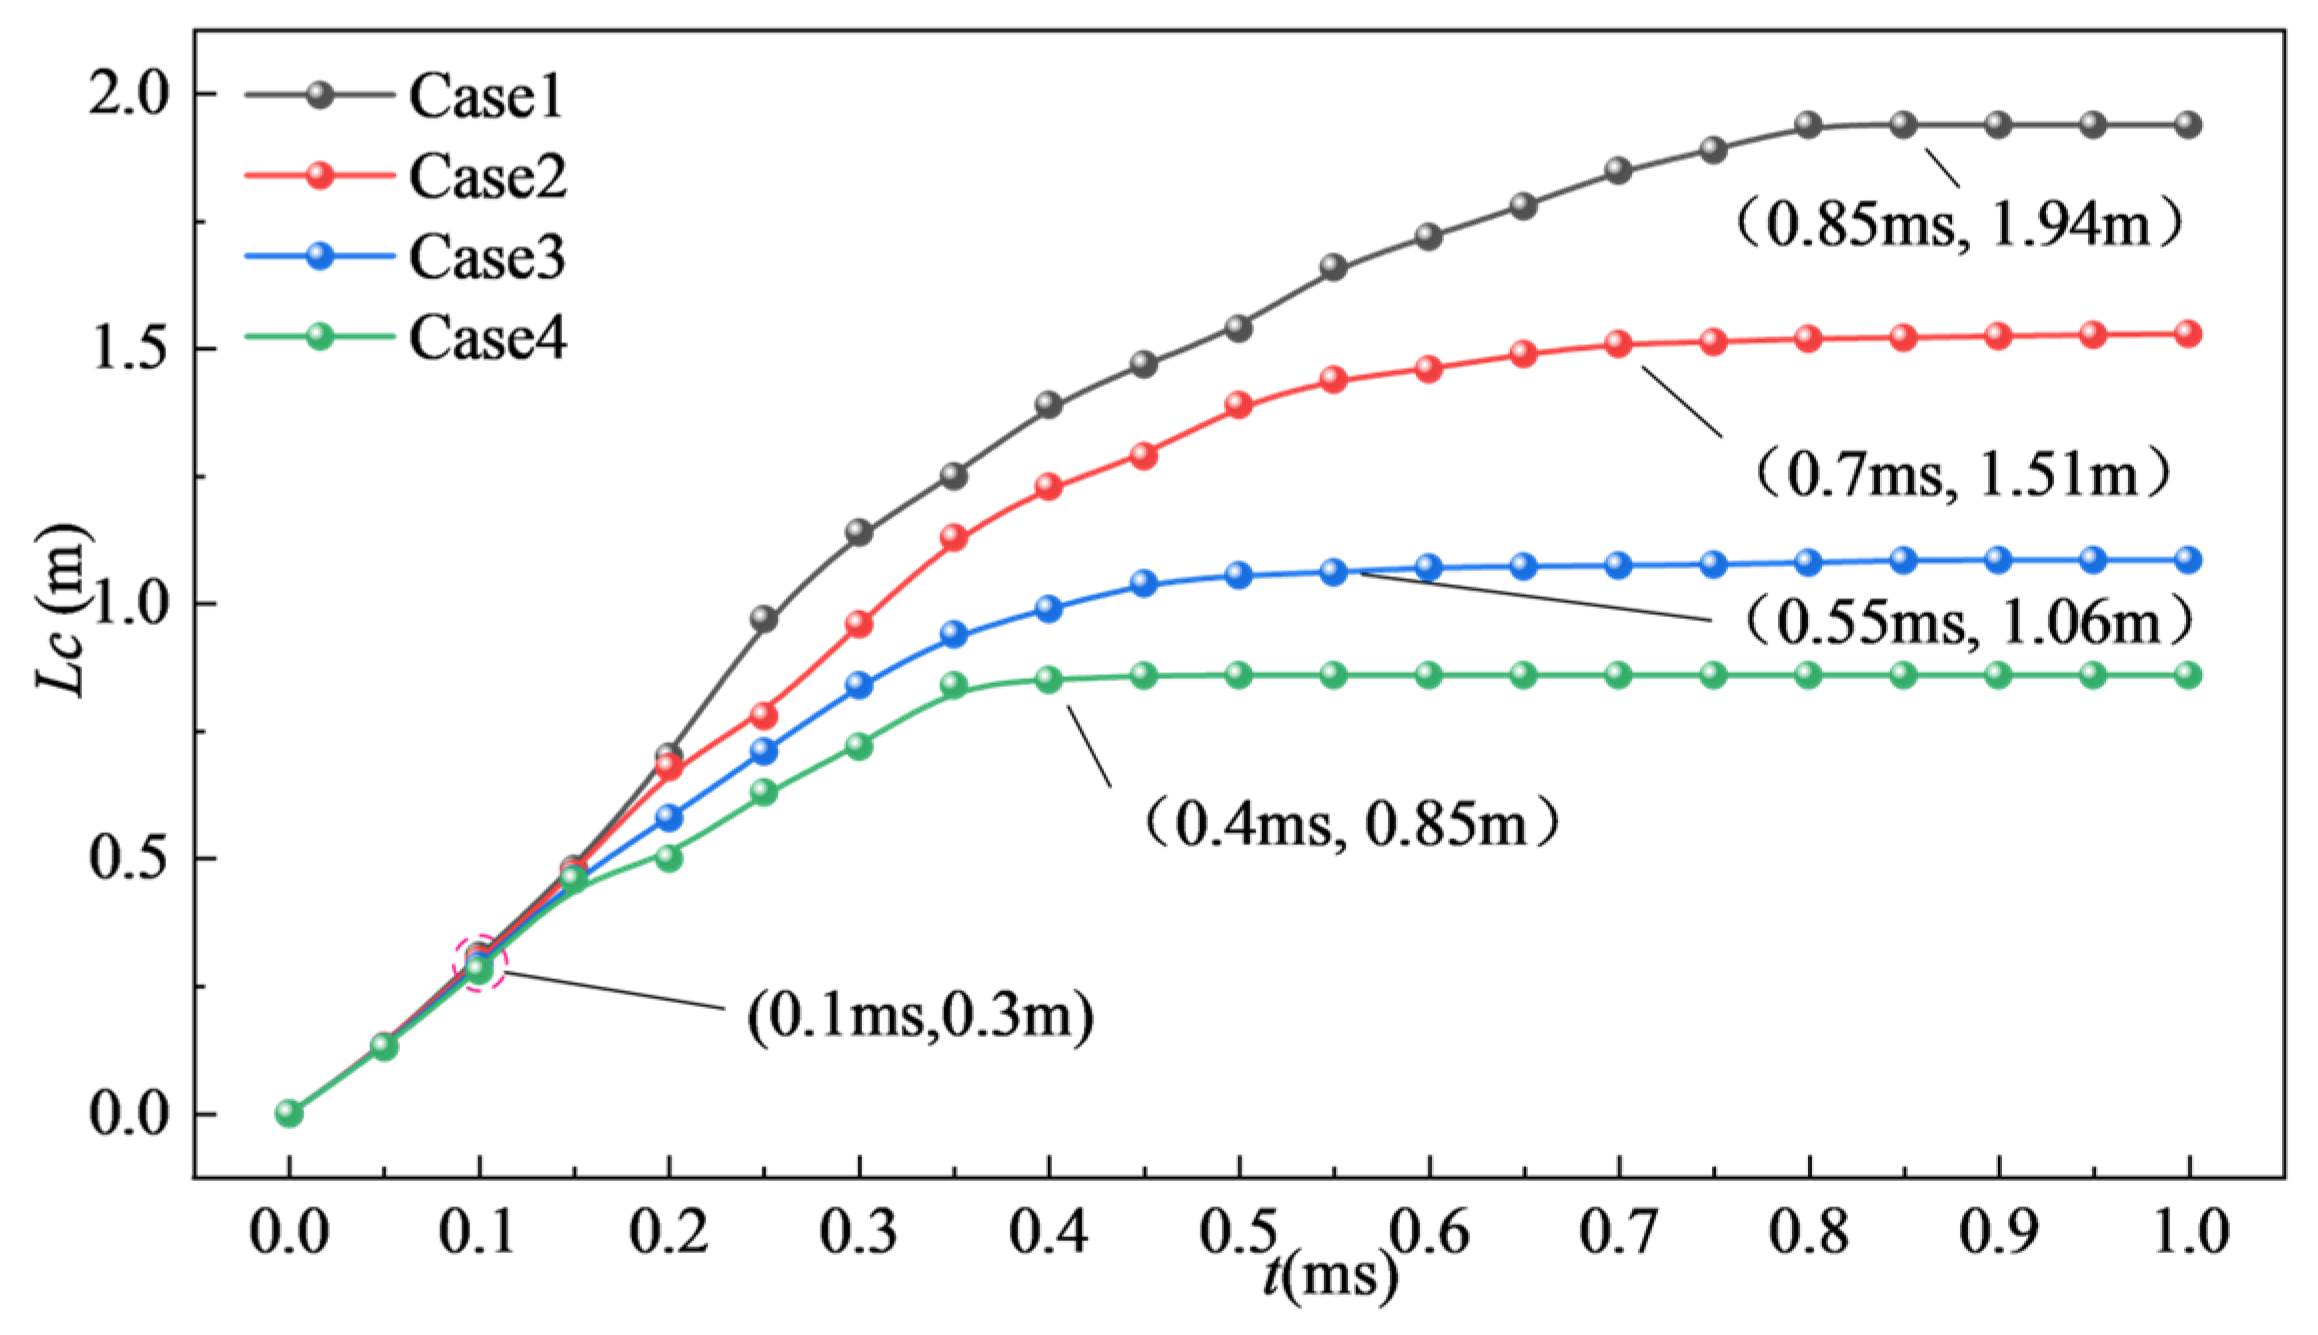
The time–length curves of radial crack propagation are shown in
Figure 14. Within 0.1 ms after the detonation, crack velocity and length showed no significant variation across different initial in situ stress levels. This is because the shock wave pressure generated by the explosive is in the order of GPa, far exceeding the initial in situ stress by orders of magnitude. As a result, the constraining effect of in situ stress is negligible during this initial phase, and crack propagation is dominated by the intense dynamic loading. Beyond 0.1 ms, both crack velocity and length increase markedly. After the shock wave decays to a lower stress level, the residual stress wave interacts with the pre-existing in situ stress field, and the suppression effect of in situ stress gradually emerges. The crack propagation rate progressively decreased with rising initial in situ stress. High in situ stress conditions significantly enhanced rock resistance to fragmentation. Therefore, deep rock mass blasting operations should adjust charge quantities according to actual in situ stress conditions or incorporate controlled blasting techniques such as presplit blasting to improve rock fragmentation efficiency.
4.2.2. Crack Propagation Under Non-Hydrostatic Conditions
During blasting in deep rock masses, initial in situ stresses typically vary in different directions due to geological structures and environmental factors. This results in cracks being subjected to anisotropic stress conditions during propagation, ultimately forming asymmetric crack patterns. As shown in
Figure 15, this section simulates the influence of different
K values on blast-induced crack propagation in rock. A constant initial pressure of 20 MPa is maintained in the Y-direction, while initial pressures of 0 MPa, 10 MPa, 30 MPa, and 40 MPa are applied in the X-direction respectively.
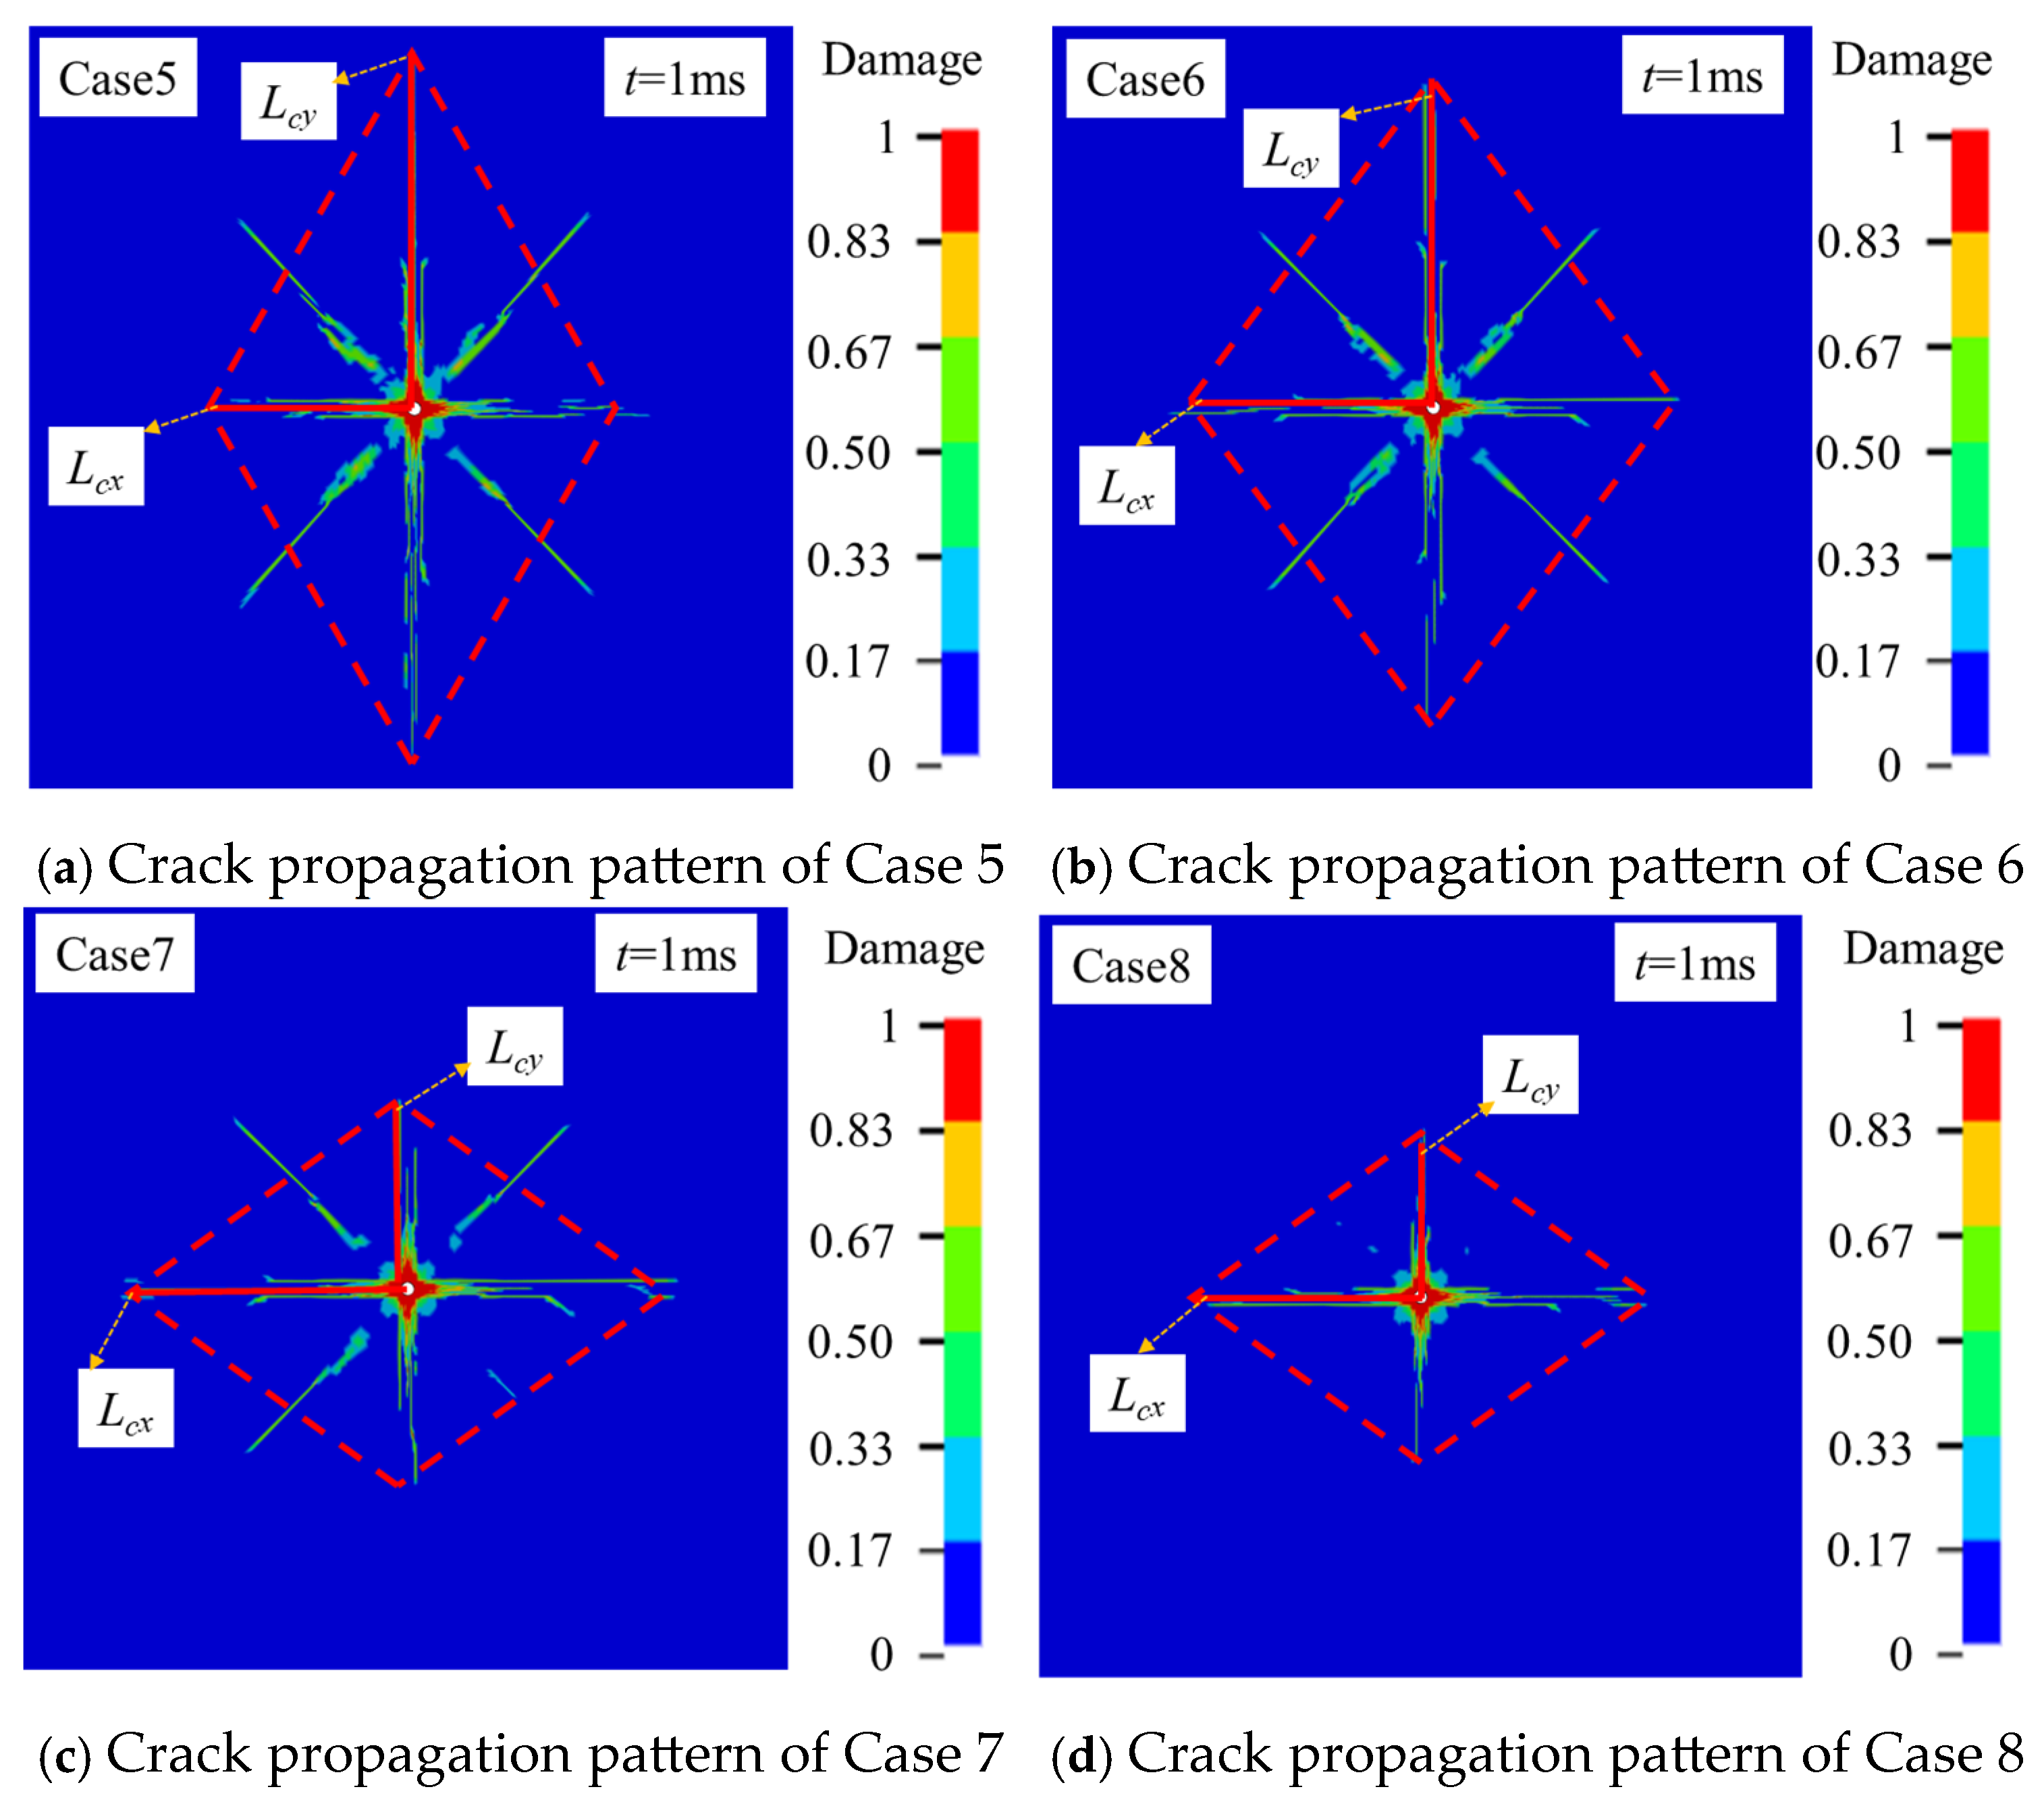
The blast-induced cracks developed a diamond-shaped profile, propagating symmetrically along the maximum principal stress direction, as shown in
Figure 15. We defined the crack lengths in the horizontal and vertical directions as
Lcx and
Lcy respectively, with their ratio designated as
Lcx/cy. Both
Lcx and
Lcy are measured from the blasthole center to the crack tip. Case 5 experienced no horizontal compressive confinement, allowing full crack development in both orientations, with numerous branches and extensive coverage. When
σx increased to 10 MPa, both the crack length and branch density in the horizontal direction decreased, accompanied by contraction of the damage zone. A further increase to 30 MPa produced stronger suppression of vertical crack propagation, substantially reducing
Lcy while indirectly limiting horizontal extension, concentrating cracks nearer the blast center. Under the high-stress conditions of Case 8, cracks became intensely confined to the blast vicinity, exhibiting the most compact morphology, with a minimal propagation length and branch count. This progressive confinement occurred because increasing horizontal initial compressive stress enhanced pre-compression effects, directly restraining horizontal crack extension while indirectly constraining vertical propagation through stress field interactions, consequently causing a continuous reduction in the overall crack domain.
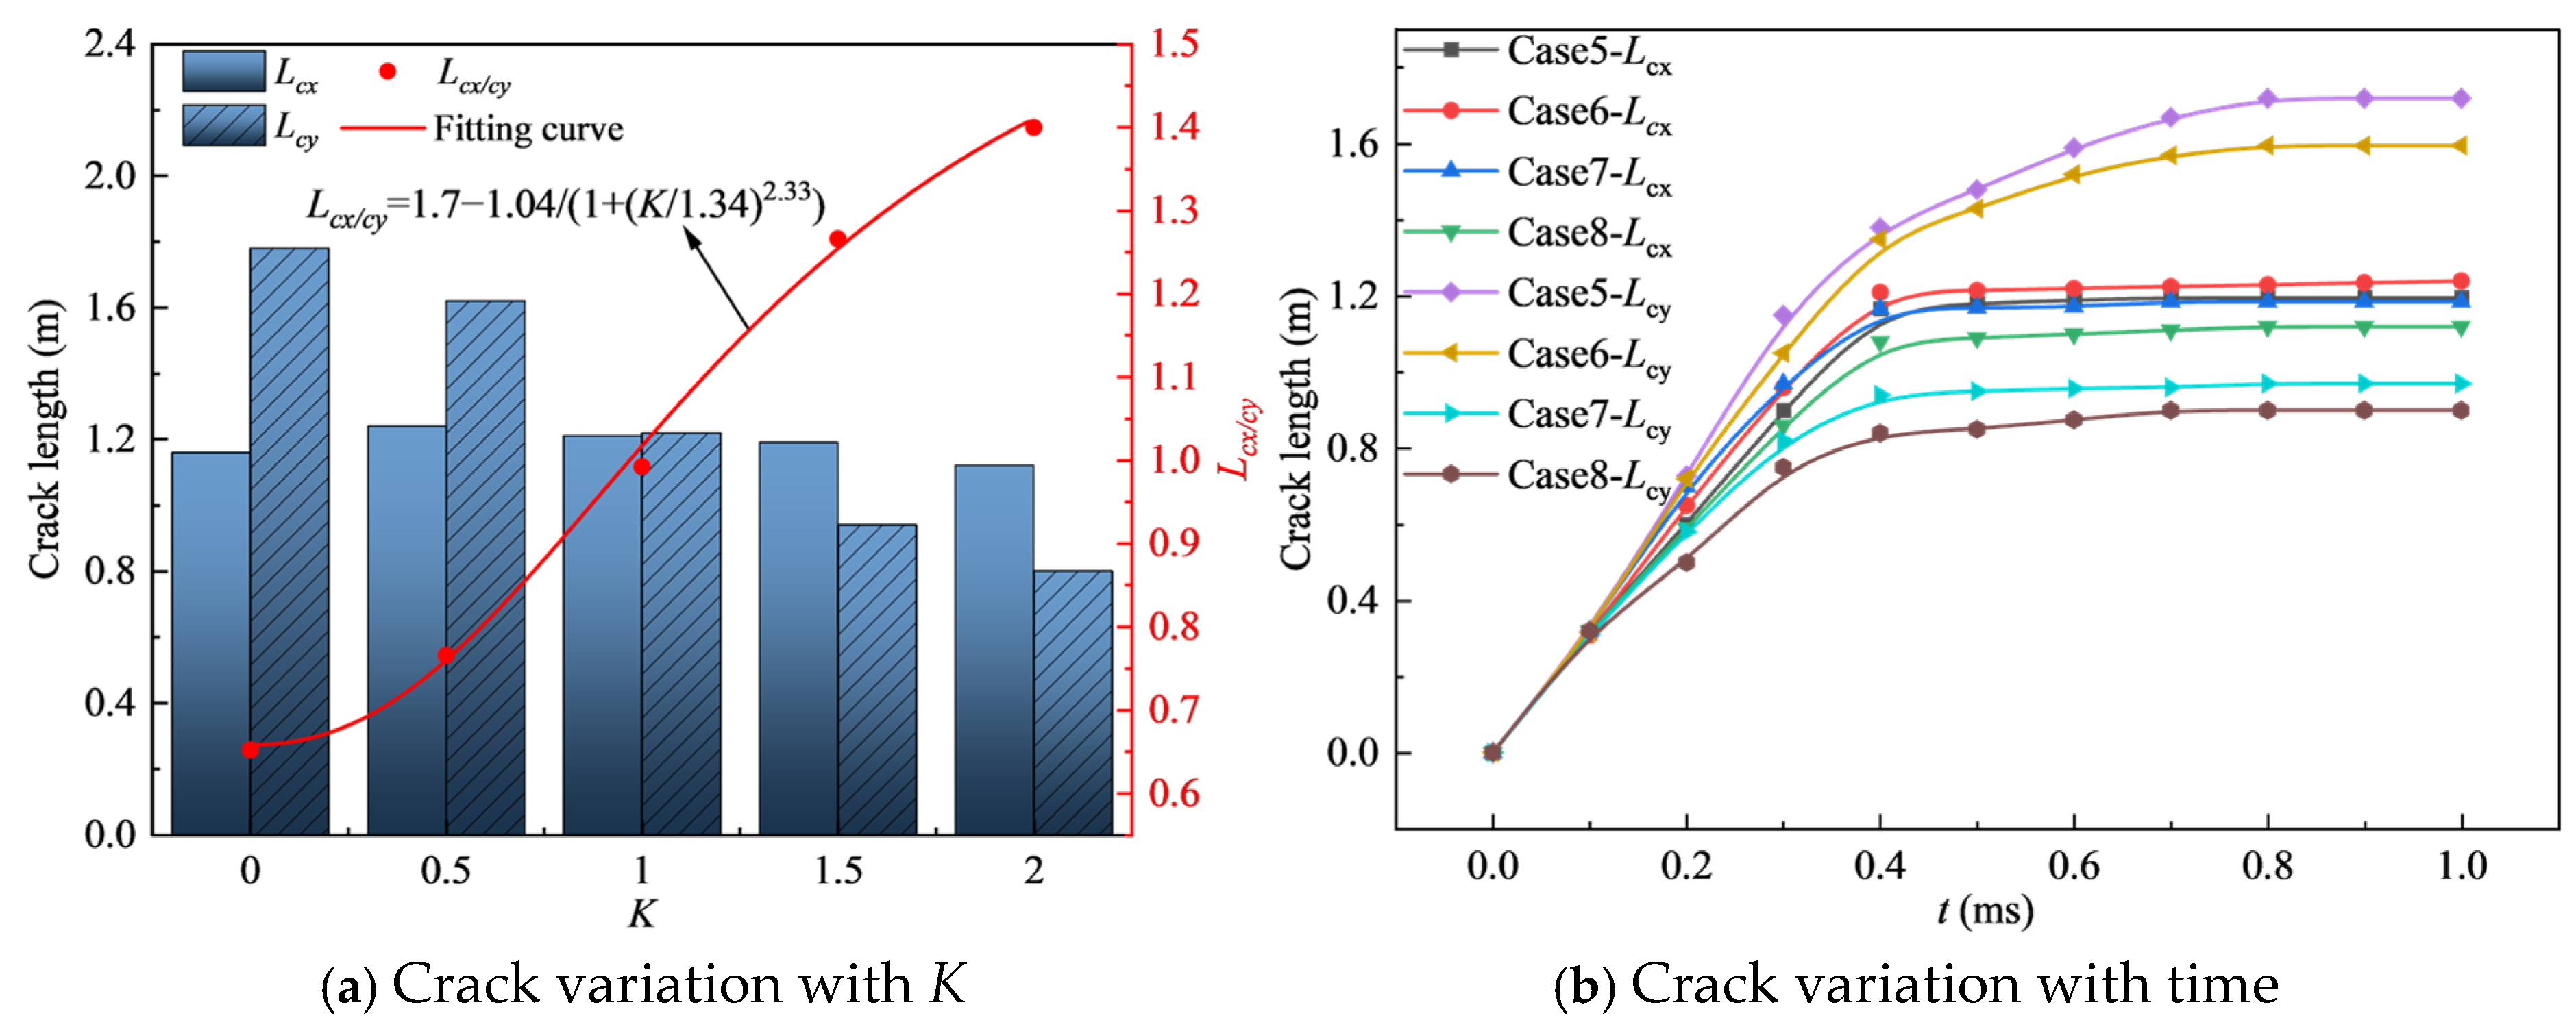
Under non-hydrostatic in situ stress, blast-induced crack lengths decreased with increasing
K, though at different rates in the horizontal and vertical directions (
Figure 16a). The
Lcx/cy ratio grew continuously with
K, following a fitted curve that rose rapidly before stabilizing. This reflected the increasing proportion of horizontal to vertical crack length. At a low
K, vertical stress promoted vertical propagation, making
Lcx substantially smaller than
Lcy and yielding a low
Lcx/cy ratio. As
K increased, horizontal stress exerted greater control over horizontal extension, raising the
Lcx/cy ratio. At high
K values, the relative influence of horizontal and vertical stresses stabilized, causing the
Lcx/cy growth to level off as it approached the fitted curve’s asymptote. Equation (10) describes the functional relationship between the axis length ratio
Lcx/cy of the diamond-shaped crack zone and
K.
Under varying initial horizontal stresses, crack lengths in all directions grew rapidly and then stabilized over time (as shown in
Figure 16b). With constant vertical stress, higher horizontal stress led to slower crack growth and shorter final lengths, demonstrating how horizontal stress strongly inhibited crack propagation. In Case 5, vertical cracks were longer than horizontal ones. As horizontal stress increased, this length relationship shifted progressively, reflecting horizontal stress’s differential constraint on various propagation directions. Regardless of the
K value, radial main cracks consistently developed along the maximum principal stress direction, indicating that initial stress both suppressed the propagation length and guided the crack orientation. For deep rock blasting, we therefore recommend aligning the blasthole with the maximum principal stress to improve efficiency.
5. A Unified Dimensionless Scaling Relationship for Blast-Induced Crack Length
The preceding sections have presented, respectively, an exponential decay relationship between crack length and confining pressure under hydrostatic in situ stress, and a logistic relationship between crack aspect ratio and lateral stress coefficient under non-hydrostatic in situ stress. However, these two relationships remain separate: the former applies only to isotropic stress fields, while the latter merely describes the anisotropy of crack morphology; neither unifies the mean stress and deviatoric stress within a single framework. To establish a scaling relationship that simultaneously describes crack length variation under both hydrostatic and non-hydrostatic in situ stress conditions, this section introduces a dimensionless confinement parameter, χ. The construction rationale is as follows. The influence of in situ stress on blast-induced crack propagation can be decomposed into two physically independent mechanisms. The first is the isotropic compression mechanism: the mean stress, σm = (σx + σy)/2, generates a hydrostatic compressive effect that increases the rock’s effective tensile strength and suppresses tensile cracks in all directions. The second is the anisotropic guidance mechanism: the deviatoric stress, Δσ = |σx − σy|, imposes a directional constraint that forces cracks to preferentially extend along the direction of the maximum principal stress, thereby influencing the final crack length in that direction. Consequently, an ideal dimensionless parameter must simultaneously quantify both contributions.
Through dimensional analysis, each term must be normalized by a reference quantity with the dimension of stress. The mean-stress term is normalized by the rock’s dynamic tensile strength,
σt* because the mean stress directly elevates the tensile threshold; when σ
m approaches or exceeds
σt*, tensile cracks become completely suppressed. The deviatoric-stress term is normalized by the uniaxial compressive strength,
σc because the directional effect of deviatoric stress originates from the inhomogeneity of the compressive stress field, and the rock’s response under compression is governed by its compressive strength. The linear combination of these two contributions is adopted based on the principle of elastic superposition, which provides a reasonable first-order approximation for the stress range considered in this study. Given that the linear form already achieves a high coefficient of determination (
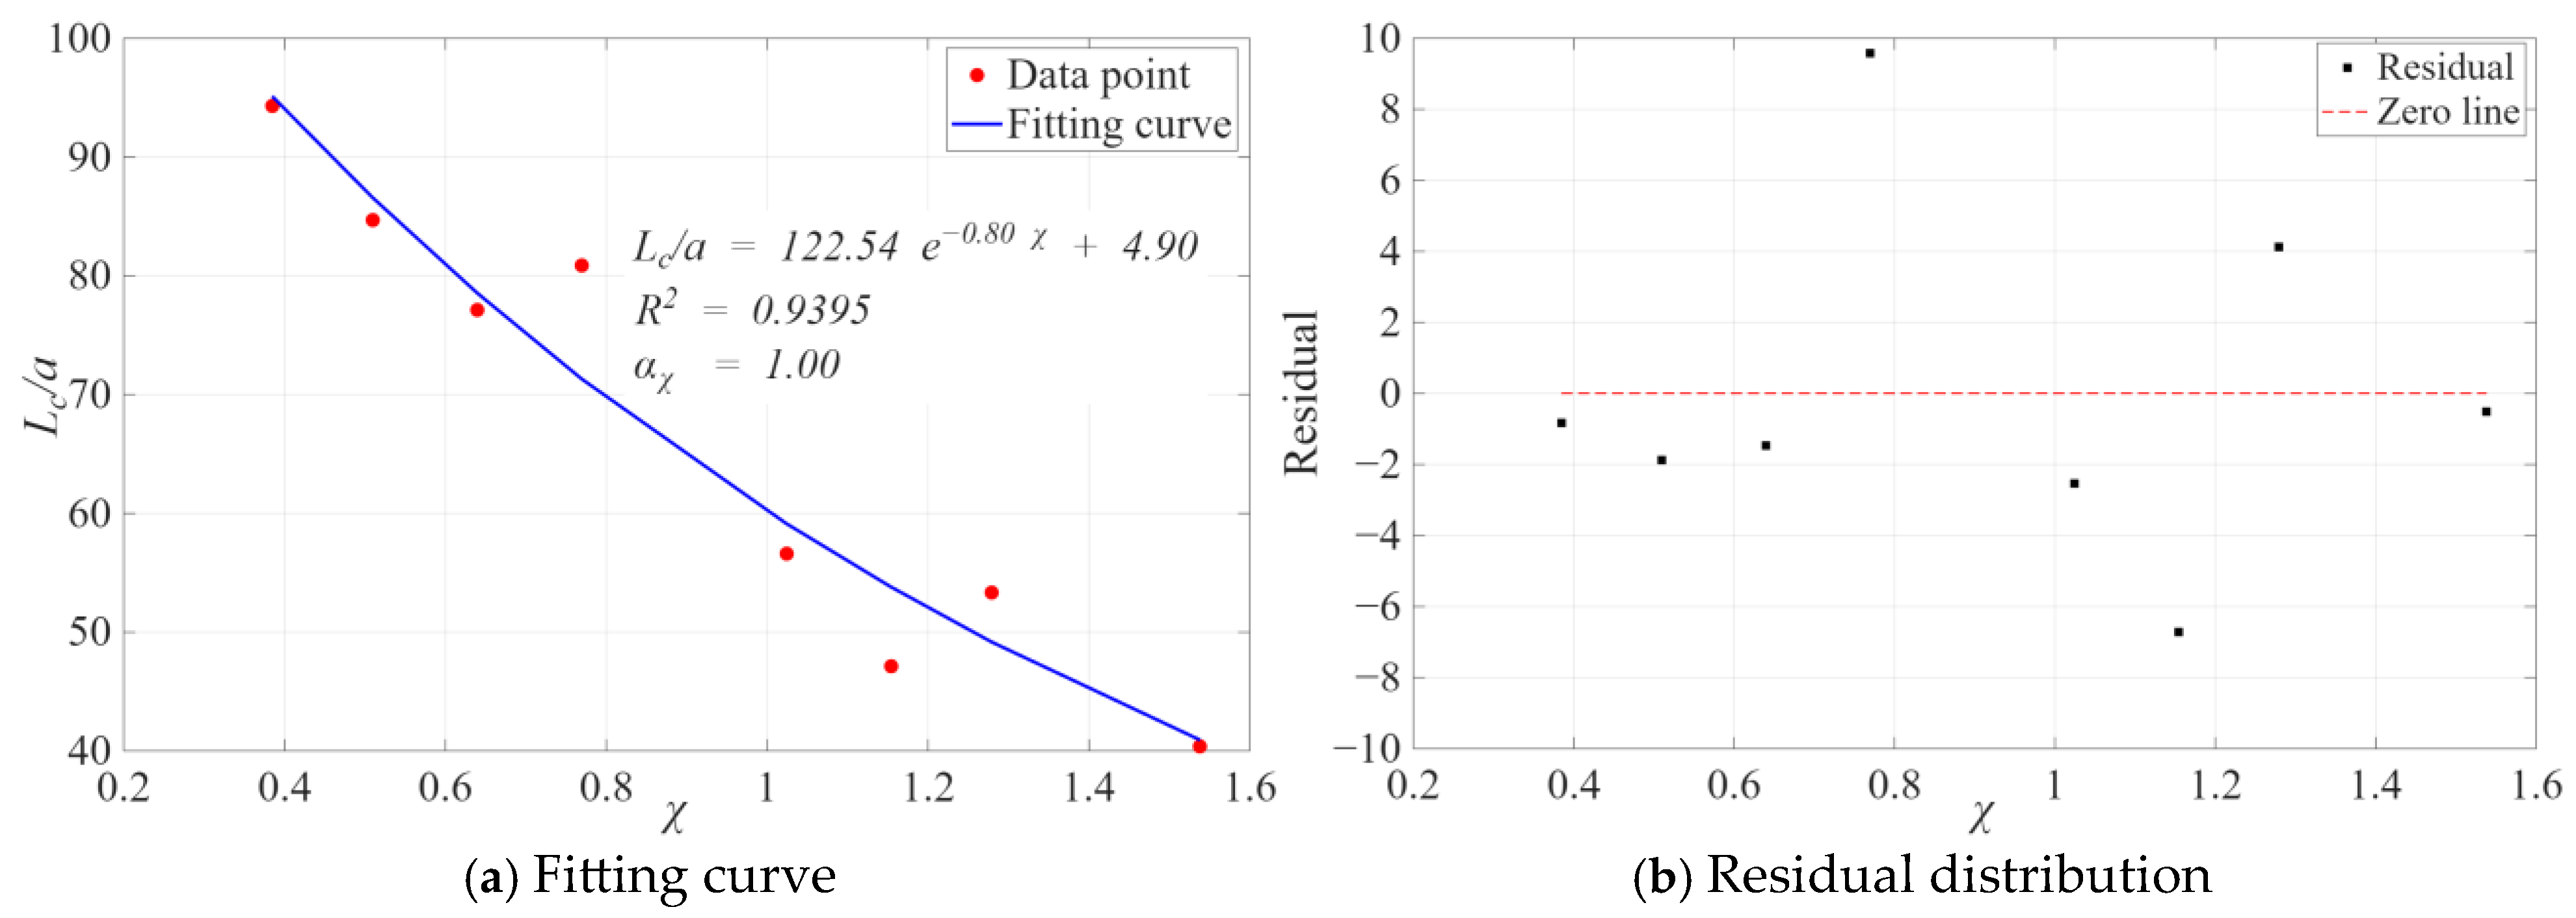
R2 = 0.94), it is considered sufficient and more parsimonious for describing the relationship within the investigated stress range. The dimensionless parameter is constructed as
where
σt* is taken as 26 MPa, the static tensile strength of the rock is approximately 1/20 to 1/10 [
50] of its static compressive strength, and the dynamic enhancement factor typically ranges between 2.0 and 3.0. The coefficient
αχ is an adjustable weight (0 ≤
αχ ≤ 1) that balances the contribution of deviatoric stress relative to mean stress.
αχ is determined through a data-driven approach:
σm, Δ
σ and the corresponding normalized maximum crack length
Lc/
a (where
Lc is taken as the crack length along the direction of the maximum principal stress, which dominates fragmentation efficiency) are collected for Cases 1~8, as summarized in
Table 6. Assume that the normalized crack length
Lc/
a follows an exponential decay relationship with
χ, i.e.,
Lc/
a =
A exp(−
Bχ) +
C, where the constant term
C represents the normalized radius of the crushed zone and is measured from post-processed numerical simulations as
C = 4.9. By scanning
αχ over the interval [0, 1] and performing a nonlinear least-squares fit for each
αχ, the optimal value is found to be
αχ = 1.0, which maximizes the coefficient of determination
R2. The resulting fitting equation is
Figure 17a presents the scatter points of
χ versus
Lc/
a along with the fitted exponential curve, showing that all data points are well distributed around the curve. Residual analysis (
Figure 17b) indicates that the residuals are randomly scattered around zero, with a mean of −0.03 and a standard deviation of 5.1, exhibiting no systematic bias, and thus validating the model. The physical meaning of the above scaling relationship is twofold: the exponential decay form originates from the exponential attenuation of blast-induced stress waves with distance, while the constant term
C = 4.9 corresponds to the limiting state where only the crushed zone remains under extremely high confining pressure. It should be noted, with caution, that the optimal weight coefficient
αχ = 1.0 lies at the boundary of the search interval [0, 1]; this outcome may be constrained by the limited stress range and the specific rock properties considered in this study. For higher in situ stress levels, different lithologies, or engineering conditions involving joints and fractures, the value of
αχ should be carefully recalibrated. Therefore, when applying the proposed scaling relationship in practice, it is advisable to validate or locally calibrate it against the specific geological conditions.
In summary, the novelty of this section lies in three aspects. First, a dimensionless confinement parameter χ is constructed, which unifies hydrostatic and non-hydrostatic stress fields within a single framework by combining the mean stress and deviatoric stress. Second, for the first time, the crack length data under both hydrostatic and non-hydrostatic stress conditions are collapsed onto a single exponential curve, yielding a unified scaling relationship. Third, the constant term C = 4.9 is identified as the normalized radius of the crushed zone, providing a clear physical interpretation of the limiting state under high confining pressure. This unified scaling relationship, together with the dimensionless parameter χ, provides a quantitative predictive tool for estimating fragmentation extents in deep rock blasting under various in situ stress conditions.
6. Discussion
Previous studies have extensively investigated the influence of in situ stress on blast-induced crack propagation, but most of these efforts have remained at a qualitative level, focusing on the description of observed phenomena without deriving predictive mathematical relationships. For instance, Yan et al. [
12] experimentally observed that biaxial static stress suppresses radial cracks and promotes circumferential damage, but they did not quantify the relationship between crack length and stress magnitude. Yi et al. [
29] numerically demonstrated that crack propagation is influenced by in situ stress anisotropy, yet their analysis remained descriptive, without providing a predictive equation. In contrast, the present study establishes a quantitative predictive relationship that directly links crack length to the stress state, offering a design-ready tool for deep rock blasting.
From a physical perspective, the exponential decay form of the proposed relationship originates from the intrinsic exponential attenuation of blast-induced stress waves in rock media: as the stress wave propagates outward from the blasthole wall, the peak tensile stress decreases exponentially with distance, and the final crack tip position corresponds to the point where the tensile stress drops below the rock’s dynamic tensile strength. The presence of in situ stress raises the effective tensile strength through hydrostatic compression and modulates the directional failure threshold via deviatoric stress, thereby shortening this critical distance. Furthermore, we find that the optimal weight coefficient αχ = 1.0, indicating that, within the stress range and rock type investigated, the contribution of deviatoric stress to crack suppression is comparable to that of mean stress. It should be noted, however, that αχ = 1.0 lies at the boundary of the search interval, suggesting that the deviatoric term is not discounted in the present dataset—a result that may reflect the high sensitivity of this brittle rock to deviatoric loading.
The above quantitative predictive model exhibits good statistical significance (R2 = 0.94) and physical consistency, offering a new approach for predicting fragmentation extents in deep blasting. Admittedly, no numerical model can fully replicate the full complexity of natural rock masses, and future studies may further incorporate additional geological features to extend the applicability of this empirical model. Subsequent work can validate the quantitative predictive model under a broader range of in situ stress levels and lateral stress coefficients, and perform parameter calibration for different rock types and blasthole diameters. Moreover, accurate determination of rock dynamic tensile strength through high-strain-rate dynamic tests will help further refine the construction of the dimensionless parameter χ. It is also promising to compare the quantitative predictive model with field blasting data (including explosive gas pressure, multi-hole interactions, and free surface effects), which will strongly promote its practical application in deep mining and tunneling. In summary, the exponential decay form and dimensionless parameter revealed in this study lay a quantitative theoretical foundation for understanding blast-induced fragmentation evolution under high deep in situ stress, and the above outlook points the way toward engineering dissemination of this quantitative predictive model.
7. Conclusions
It should be acknowledged that the present study is based on numerical simulations with a limited number of stress cases and assumes a homogeneous, isotropic rock mass without considering joints, bedding planes, or other discontinuities. The quantitative relationships derived here are therefore most directly applicable to relatively intact rock masses under similar stress condition.
(a) The phase transition mechanism of hoop stress and the corresponding shift in fragmentation mode are revealed. When the hydrostatic stress reaches approximately 30 MPa, the tensile phase of the hoop stress is completely suppressed, and the rock fragmentation mechanism transitions from tension-dominated to compression-shear-dominated. The identification of this critical stress threshold provides direct guidance for selecting blasting parameters under high in situ stress.
(b) The anisotropic crack propagation behavior in non-hydrostatic stress fields is quantified. The crack aspect ratio Lcx/cy follows a logistic growth curve with the lateral stress coefficient K, and gradually saturates at an asymptotic value of approximately 1.7 when K exceeds 1.5. This relationship can be used to optimize the blasthole orientation and improve directional fragmentation efficiency.
(c) A unified scaling relationship linking in situ stress to the blast-induced crack length is established. By constructing a dimensionless confinement parameter χ = σm/σt* + αχΔσ/σc (with σt* = 26 MPa and σc = 160 MPa), the crack length data under both hydrostatic and non-hydrostatic stress conditions are collapsed onto a single exponential curve for the first time: Lc/a = 122.54exp(−0.80χ) + 4.9(R2 = 0.94). This scaling relationship provides a theoretical tool for quantitatively predicting the fragmentation extent in deep blasting operations.
(d) The physical generality of the exponential decay form is validated. The optimal weight coefficient obtained from the fitting is αχ = 1.0, which lies at the boundary of the search interval, indicating that, within the stress range and rock type considered, the contribution of deviatoric stress to crack suppression is comparable to that of mean stress. Although this result is constrained by the limited data range, the exponential decay and linear superposition forms originate from the fundamental principles of stress wave attenuation and elastic superposition, and are therefore expected to be applicable more broadly.