


Abstract
We analyzed ascending and descending Sentinel-1 SAR imagery to map the coseismic displacement field resulting from the 24 September 2019 Mirpur earthquake in Pakistan. Though moderate in magnitude (Mw 5.8), this earthquake caused severe damage and significant devastation. InSAR-derived observations reveal that the seismic event occurred on a concealed southeast-striking fault. Peak line-of-sight (LOS) displacements, derived from the ascending and descending orbit datasets, were recorded at approximately 13 cm and 8.6 cm, respectively. The geodetic modeling indicates that the primary slip of 0.77 m occurred within the 6–10 km depth range on a fault plane characterized by a 274.37° strike and a 13.01° dip. The seismogenic fault dips to the southwest, which directly aligns with the geometry derived from our uniform slip model. Our InSAR-based inversion, utilizing a crustal rigidity of 30 GPa, estimates a seismic moment of 1.11 × 10¹⁸ N m (Mw 6.0). The results of the Coulomb stress change indicate that this seismic event promoted static Coulomb stress loading around the southern, eastern, and western margins of the rupture, which may signify an elevated seismic hazard for the surrounding regions.
1. Introduction
At 11:01 (UTC) on 24 September 2019, a destructive Mw 5.8 earthquake struck near Mirpur city (herein referred to as the Mirpur earthquake) in north-eastern Pakistan (Figure 1). Although moderate in magnitude, the event caused severe destruction, resulting in approximately 40 fatalities, over 850 injuries, and widespread infrastructure damage, compounded by extensive earthquake-induced liquefaction and lateral spreading. Structurally, the epicentral area is situated at the southern deformation front of the active, wide intracontinental collision zone between the Eurasian and Indian plates [1], representing a vital seismotectonic boundary. In the central and eastern Himalayas, this plate collision drives a major convergence rate of up to 18–20 mm/yr, which diminishes to about 12–14 mm/yr towards the western Himalaya and northern Pakistan [2,3]. This long-term tectonic contraction is primarily accommodated by a sequence of sub-parallel, northward-dipping intracontinental megathrusts, notably the Main Central Thrust (MCT), the Main Boundary Thrust (MBT), and the Main Frontal Thrust (MFT). At depth, these frontal imbricate thrusts slide down and merge into a single, low-angle basal detachment known as the Main Himalayan Thrust (MHT), which represents the primary interface between the underthrusting Indian plate and the overriding sedimentary wedge [4,5,6]. In the Kashmir Himalaya, the locked décollement zone of the MHT exhibits an exceptionally large width (>170 km) compared to the central segments. Westward, this frontal zone transitions into the active Salt Range–Potwar Plateau fold and thrust belt, a typical thin-skinned structural domain developed over a weak Precambrian salt detachment layer [7]. Historically, strong seismic events are rare within this thin-skinned salt detachment region because the viscous basal layers promote aseismic creep and inhibit high stress accumulation. Instead, major devastating earthquakes typically nucleate along the steeper, locked faults further north, such as the 1555 Kashmir event Mw ~8.0 and the 2005 Kashmir earthquake (Mw 7.6) [8], the latter of which caused roughly 87,000 fatalities.
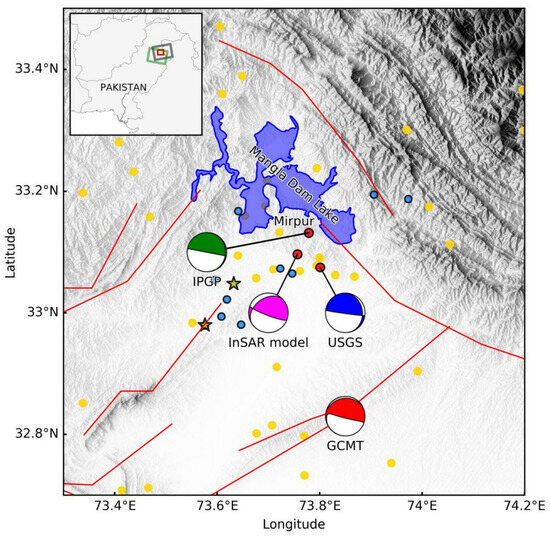
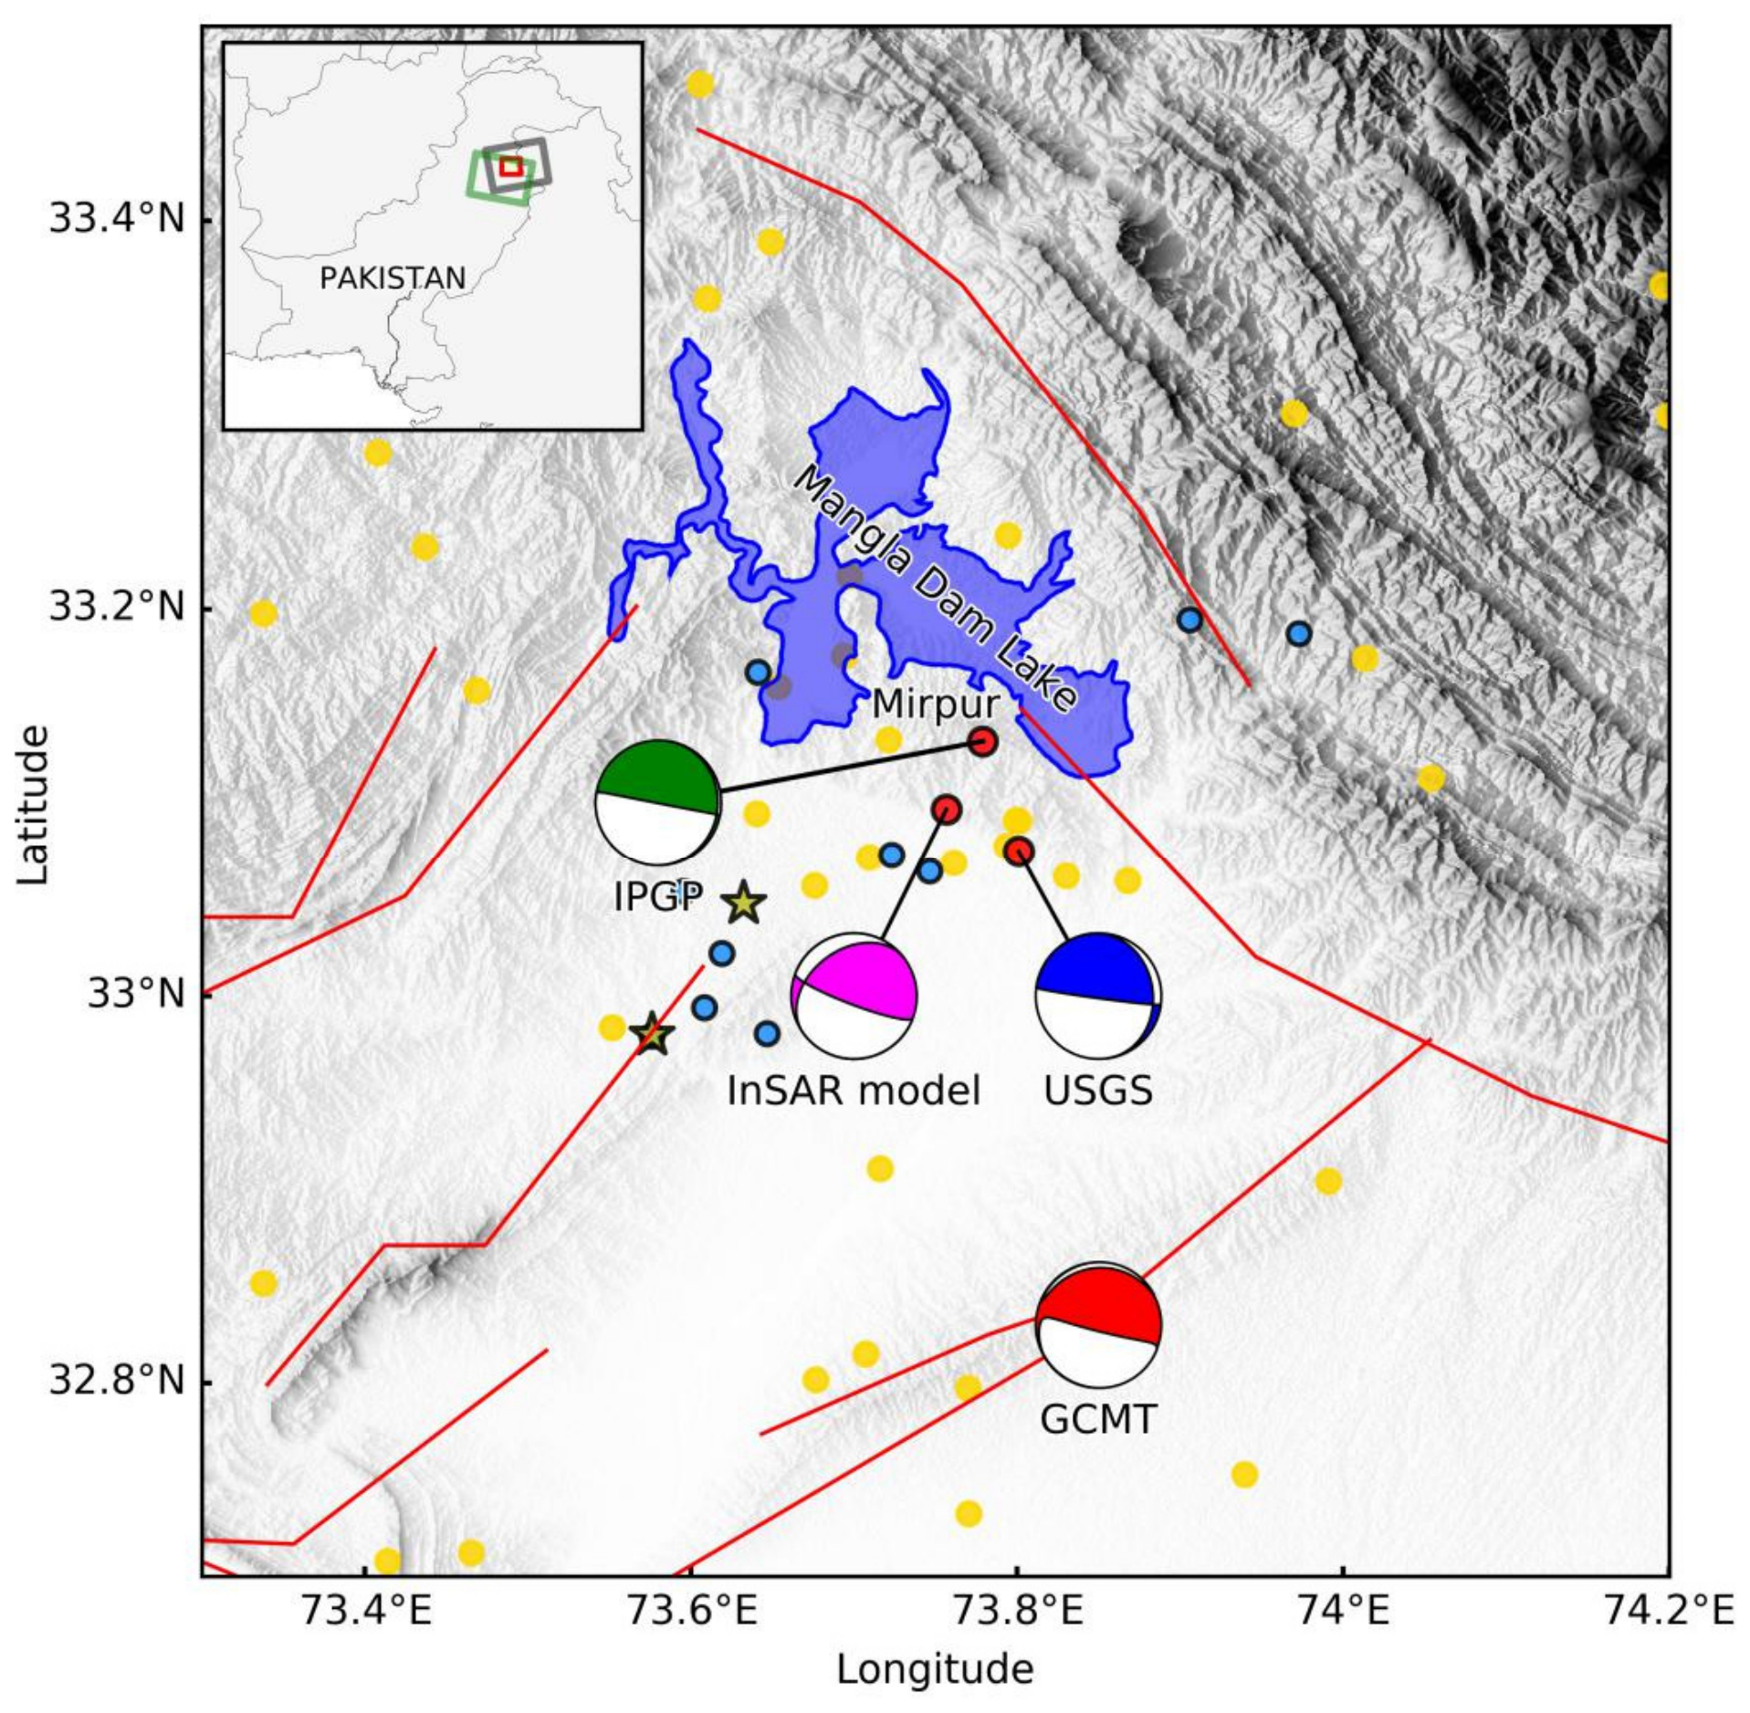
Figure 1.
Tectonic setting of the 2019 Mirpur earthquake. Major faults within the epicentral region are represented by red lines, as documented by the Global Active Faults project from the GEM Foundation. The yellow stars denote two large aftershocks from USGS. The colored beach balls represent focal mechanisms derived from different sources: the USGS (United States Geological Survey), the GCMT (Global Centroid Moment Tensor Project), the IPGP (Institut de Physique du Globe de Paris), and our InSAR-derived slip model. Yellow dots denote historical earthquakes from 1970 to 2019 (from the International Seismological Centre (ISC) catalog). Blue dots denote aftershocks from the ISC catalog following the Mirpur earthquake. The inset outlines Pakistan. The ascending and descending Sentinel-1A SAR image footprints are represented by the green and gray boxes, while the red box highlights the extent of the primary figure.
The GCMT moment tensor analysis presents two possible faulting scenarios: a shallow-dipping, right-lateral strike-slip fault with a SSE-NNS orientation, or a steep-dipping, WNW-ESE striking thrust fault. Although a shallow SE-NW striking thrust fault is consistent with the tectonics of the region, the clear deformation pattern derived from InSAR data indicates a very shallow thrust fault with a WNW-ESE strike. Active tectonic mapping of the epicentral zone reveals the presence of several thrust faults and anticline structures [9], although the current activity level of these features remains poorly understood. The 2019 Mirpur earthquake offers a valuable case study for characterizing the faulting mechanisms and tectonic activity of this region. To further explore the seismogenic fault of the Mirpur earthquake, we need additional observations, such as geodetic observations. The rapid response capabilities of the Sentinel-1 mission allow for the efficient acquisition of coseismic deformation fields using interferometric synthetic aperture radar (InSAR) technology.
To retrieve the coseismic deformation associated with the Mirpur earthquake, we first processed both ascending and descending Sentinel-1 SAR interferograms. Subsequently, we performed an investigation into the seismogenic fault’s geometry and source parameters. To further characterize the fault slip, we performed a distributed slip inversion based on the observed coseismic deformation. Finally, we evaluated the long-term seismic hazard for the region.
2. InSAR Data
The Sentinel-1 mission utilizes a pair of synthetic aperture radar satellites that operate within a narrow orbital tube, each providing a 12-day repeat cycle with a 6-day temporal offset. This configuration was designed to facilitate rapid earthquake response using InSAR technology [10]. We utilized two Sentinel-1 synthetic aperture radar image pairs acquired in interferometric wide (IW) TOPS mode, covering both ascending and descending orbital tracks. Although the descending pair had a shorter baseline temporal, it was affected by strong atmospheric artifacts. Therefore, we tested multiple pairs and visually selected the best one. The detailed information on the interferometric pairs used is listed in Table 1. SAR data in single-look complex format were processed using the GMTSAR (Version 6.2) software suite [11,12]. To mitigate along-track Doppler centroid variations inherent in TOPS mode [13], coregistration accuracy was maintained at or above 1/1000 of a pixel. Topographic contributions were subsequently removed via a 1-arc-second SRTM DEM [14]. Following this, the interferograms underwent spatial smoothing using a power spectrum filter [15] and phase unwrapping via the SNAPHU algorithm [16]. Finally, the results were geocoded to WGS84 coordinates. To account for residual orbital inaccuracies and topography-dependent atmospheric delays, a linear function—parameterized by location, elevation, and error phase—was computed and removed from the original phase. While the linear phase–elevation function mitigates long-wavelength topography-correlated delays, it may not completely resolve turbulent atmospheric delays or complex tropospheric stratification in this highly undulating region.
Table 1.
The Sentinel-1 synthetic aperture radar image pairs utilized in this investigation.
3. Geodetic Modeling for the 2019 Mirpur Earthquake
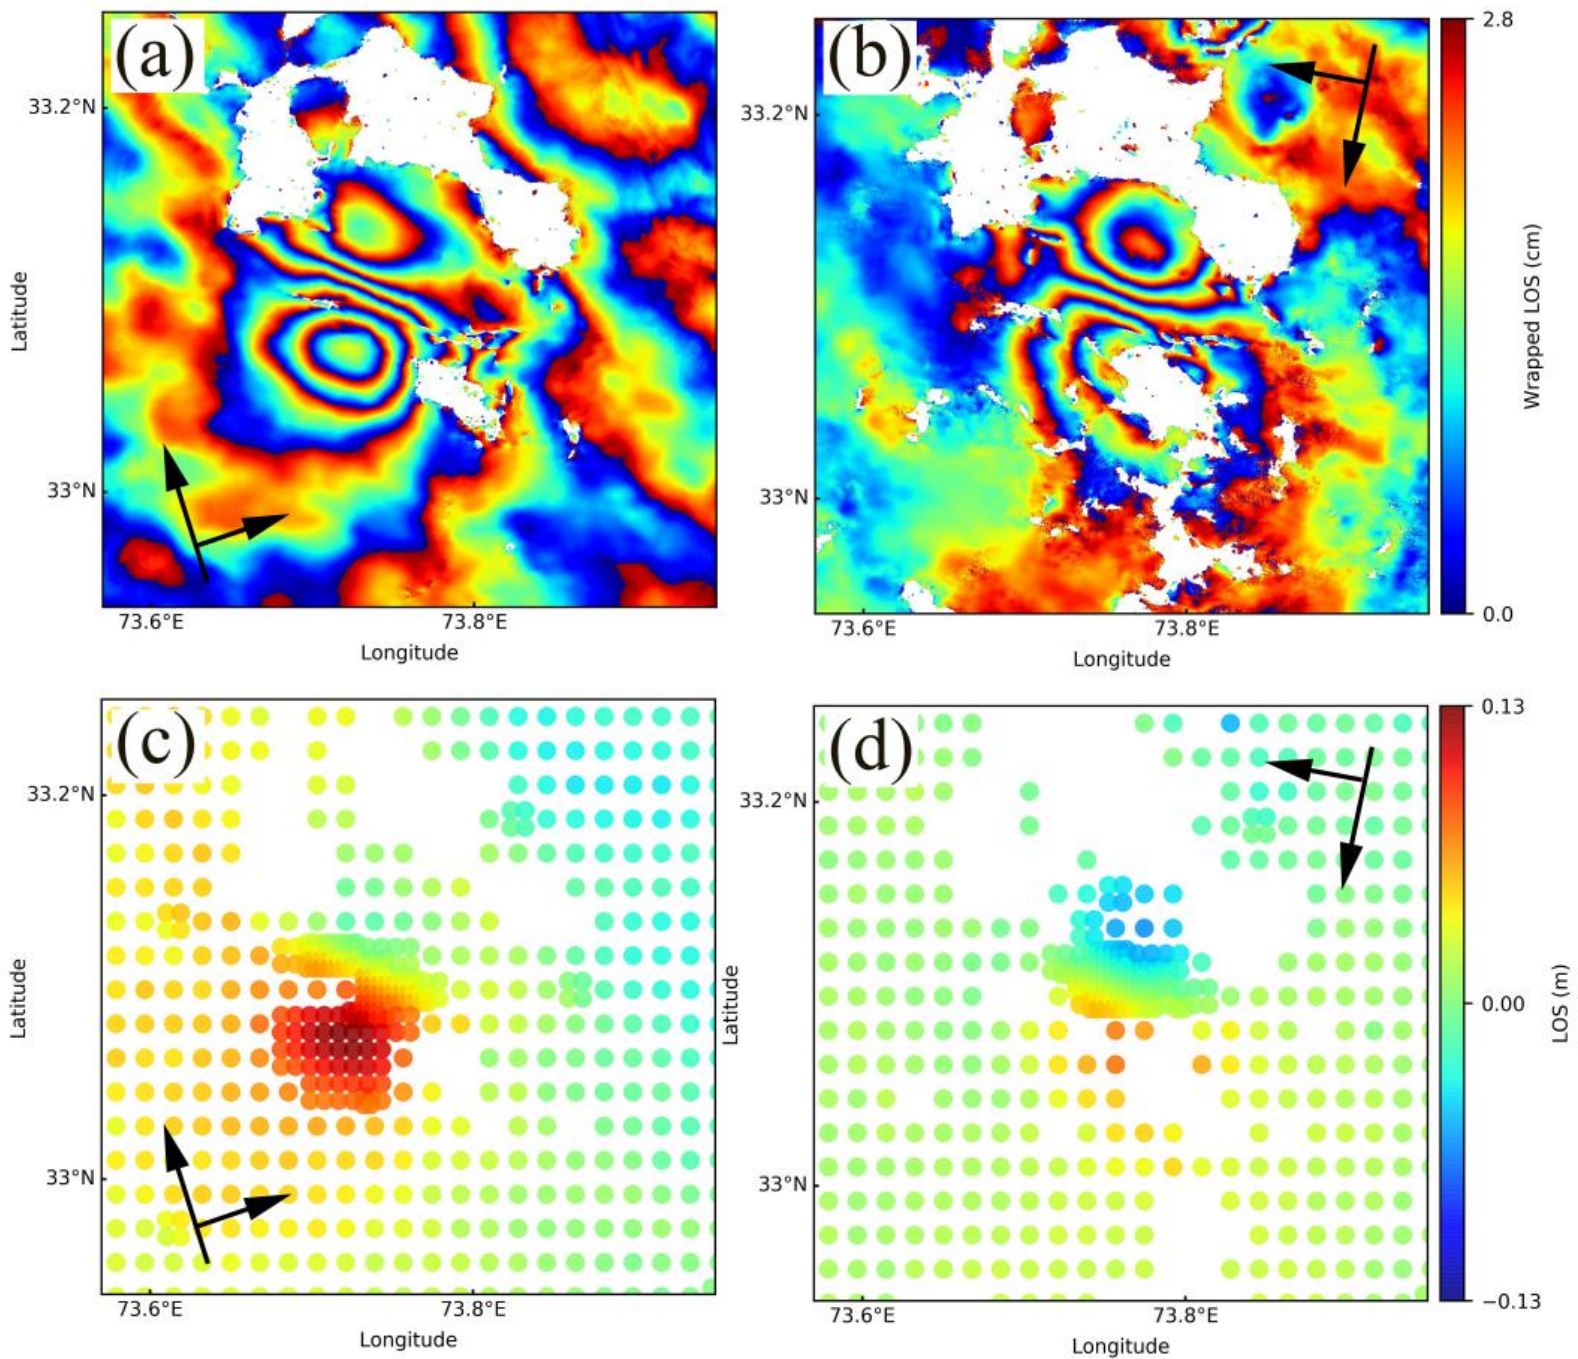
To optimize computational efficiency and ensure the numerical feasibility of the inversion, we down-sampled the original high-resolution InSAR observations. We adopted a Quadtree-based sampling algorithm [17], which adaptively increases the data density in areas with high-deformation gradients—such as the near-field rupture zone—while reducing the density in far-field regions where deformation is more uniform. This approach minimizes data redundancy while preserving the signal-to-noise characteristics essential for constraining the fault slip. Following this process, we obtained 498 and 425 data points from the ascending and descending tracks, respectively (Figure 2). We subsequently employed a two-stage inversion strategy to resolve the earthquake rupture parameters. In the first stage, we conducted a nonlinear inversion to constrain the primary fault geometry (location, strike, dip, and dimensions) based on a uniform slip model, which provides a robust global estimate of the fault orientation. Utilizing these optimized geometrical parameters, we proceeded to the second stage: a linear inversion designed to resolve the detailed, spatially heterogeneous slip distribution across the fault plane [18,19]. This sequential approach ensures that the slip distribution is inverted against a stable, physically consistent geometry, thereby mitigating the risk of parameter trade-offs that often arise during simultaneous inversions. The stability of the final slip distribution is further ensured by the regularization techniques described in the following sections.
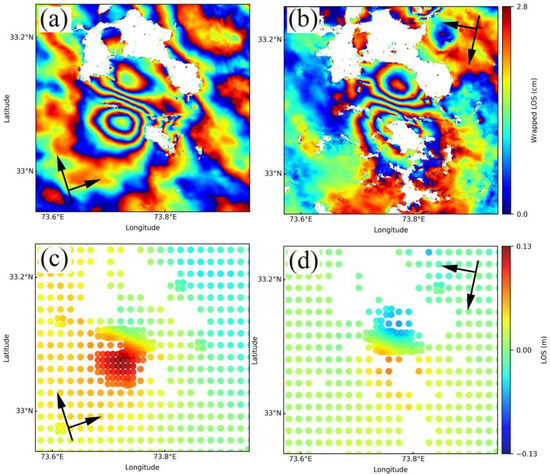
Figure 2.
Rewrapped synthetic aperture radar interferometry observed by the ascending orbit (a) and descending orbit (b), and the quadtree down-sampled results for the ascending interferogram (c) and descending interferogram (d). The nearly north-south black arrows denote the satellite flight direction, while the nearly east-west black arrows represent the satellite line-of-sight direction.
3.1. Uniform Slip Model
To invert the fault geometry, we utilized the Markov chain Monte Carlo (MCMC) and Metropolis–Hastings (MH) algorithms [20] as implemented within the Geodetic Bayesian Inversion Software (GBIS, Version 1.0) [21]. This Bayesian approach allowed us to explore the posterior probability distribution of the model parameters effectively, providing robust estimates of fault geometry and slip distribution.
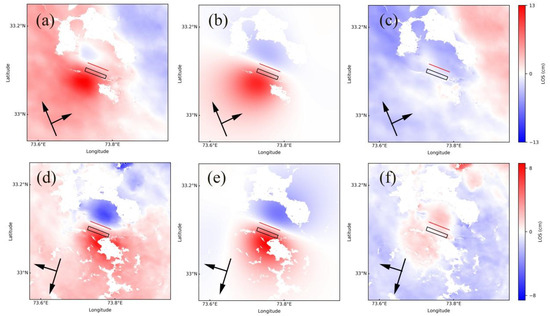
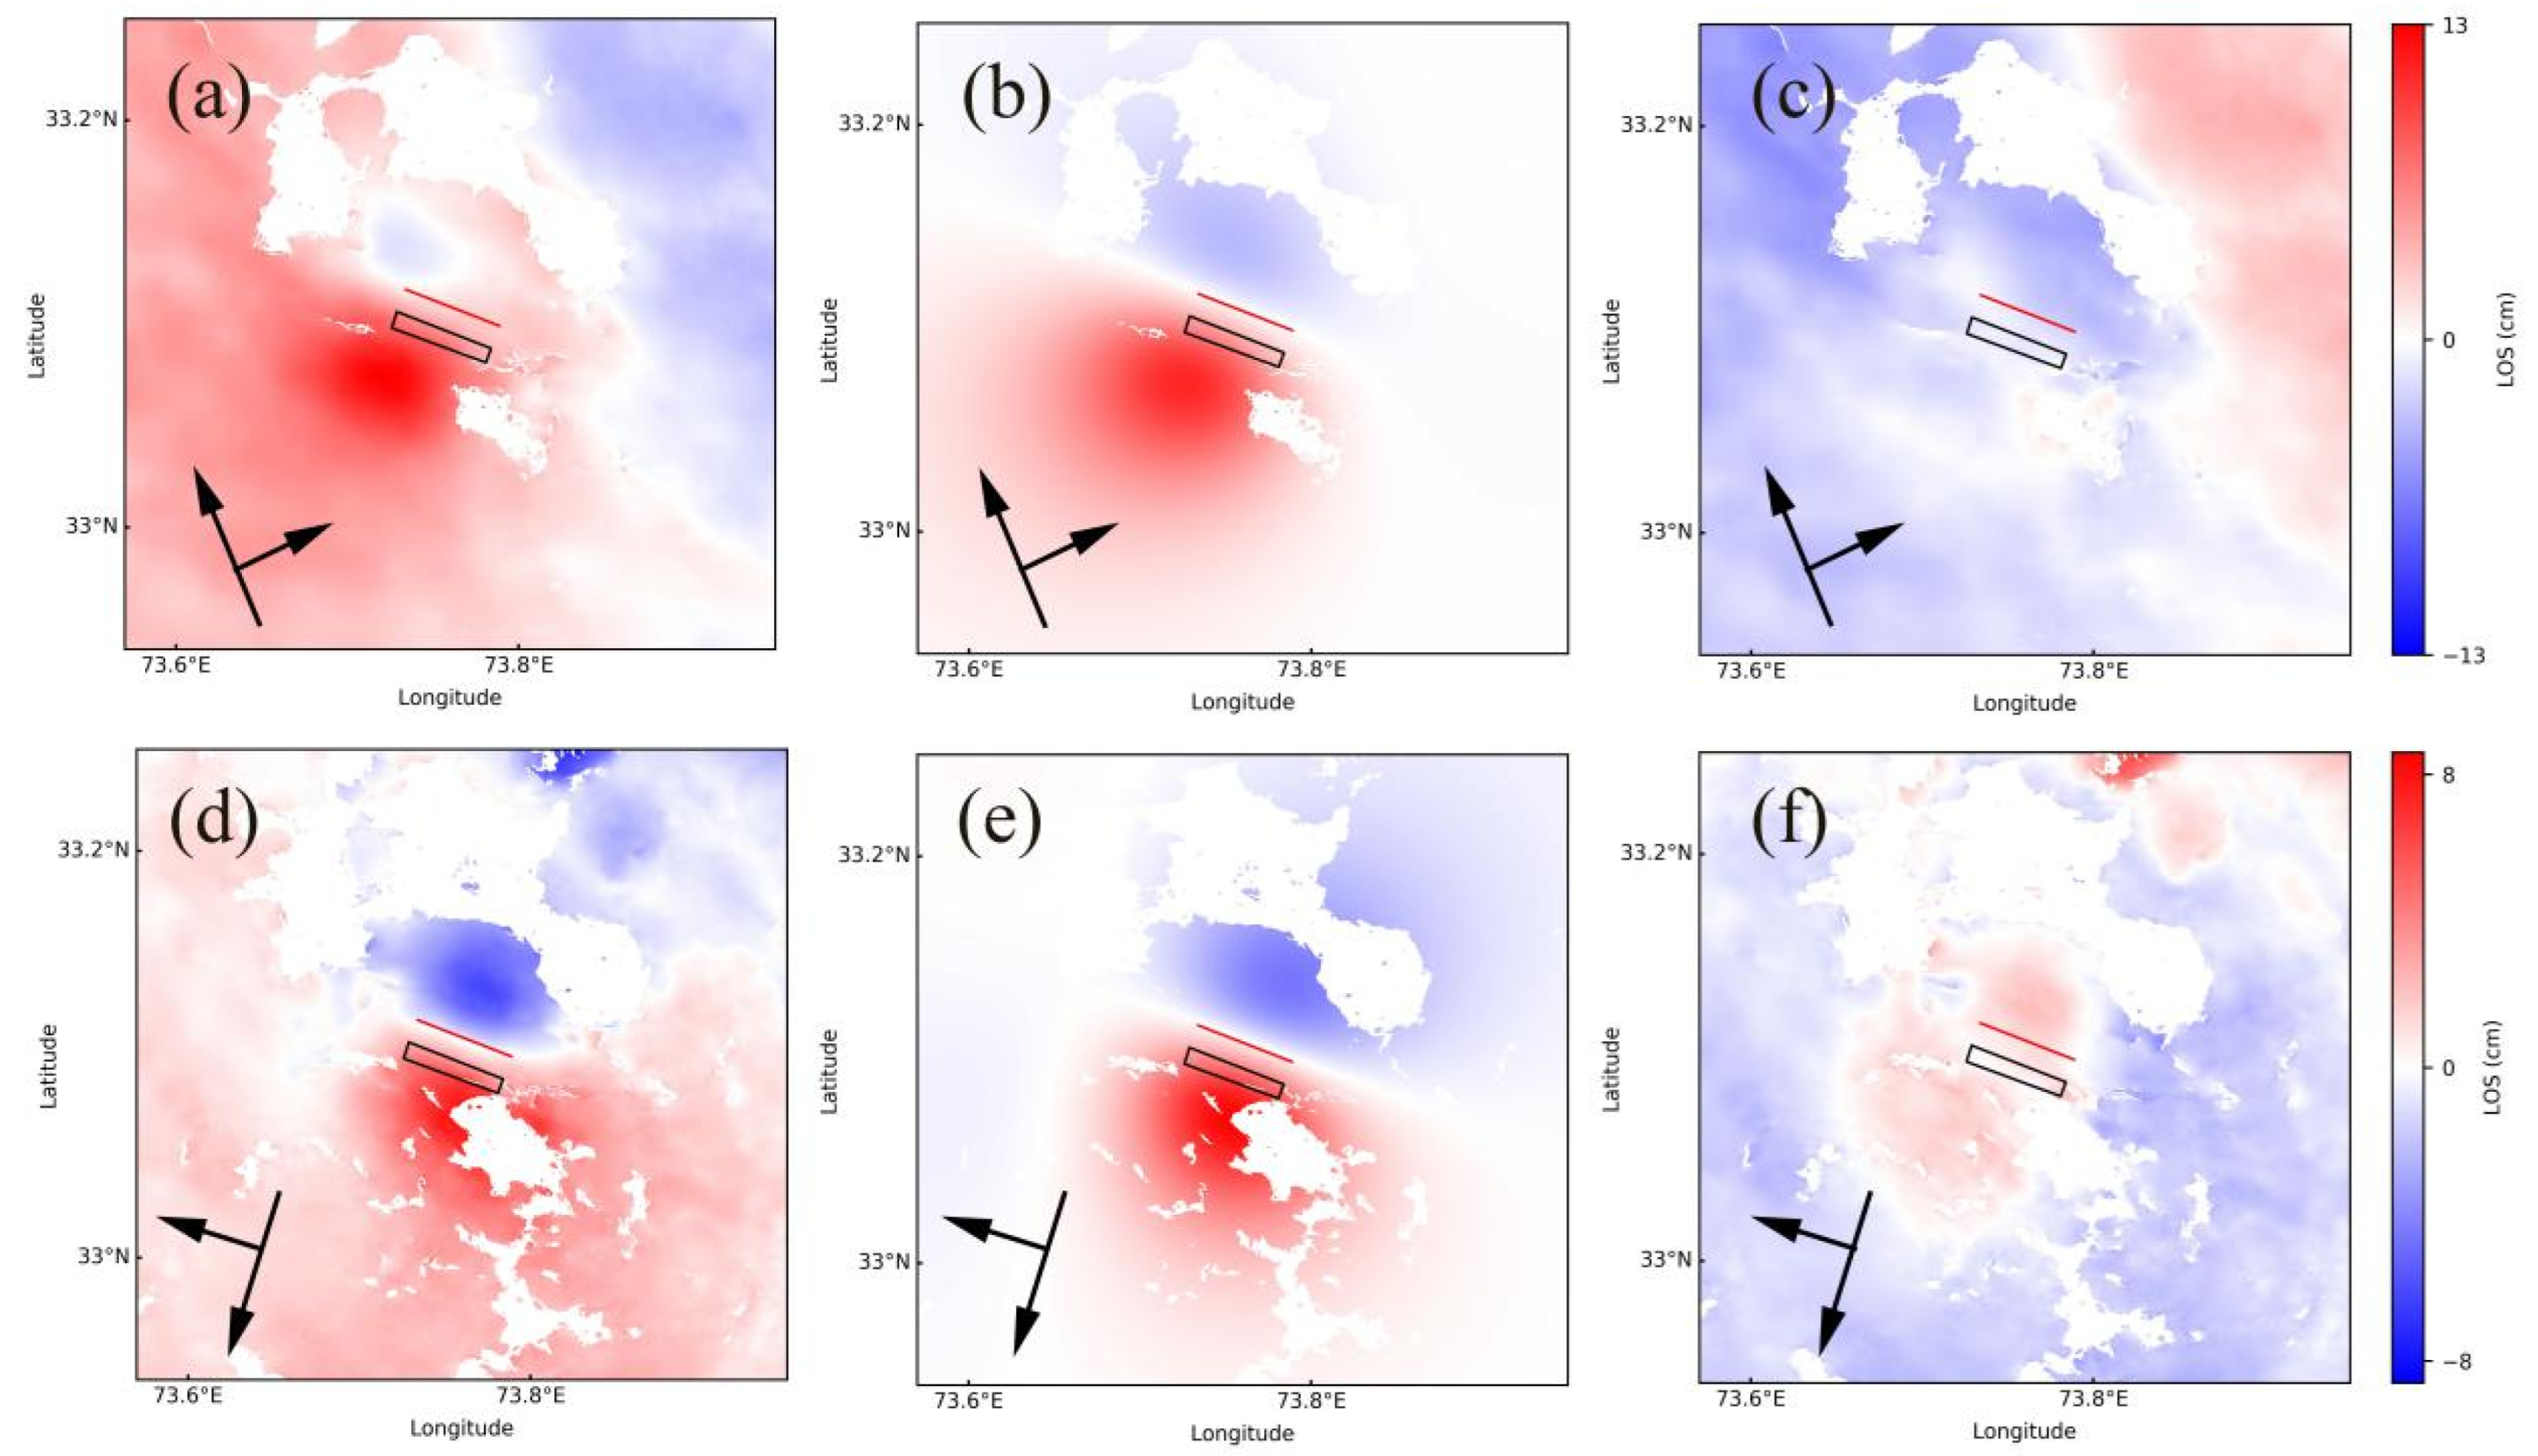
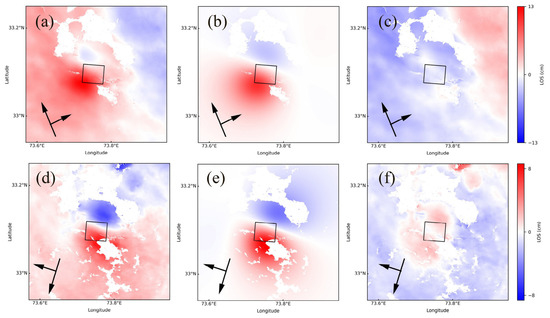
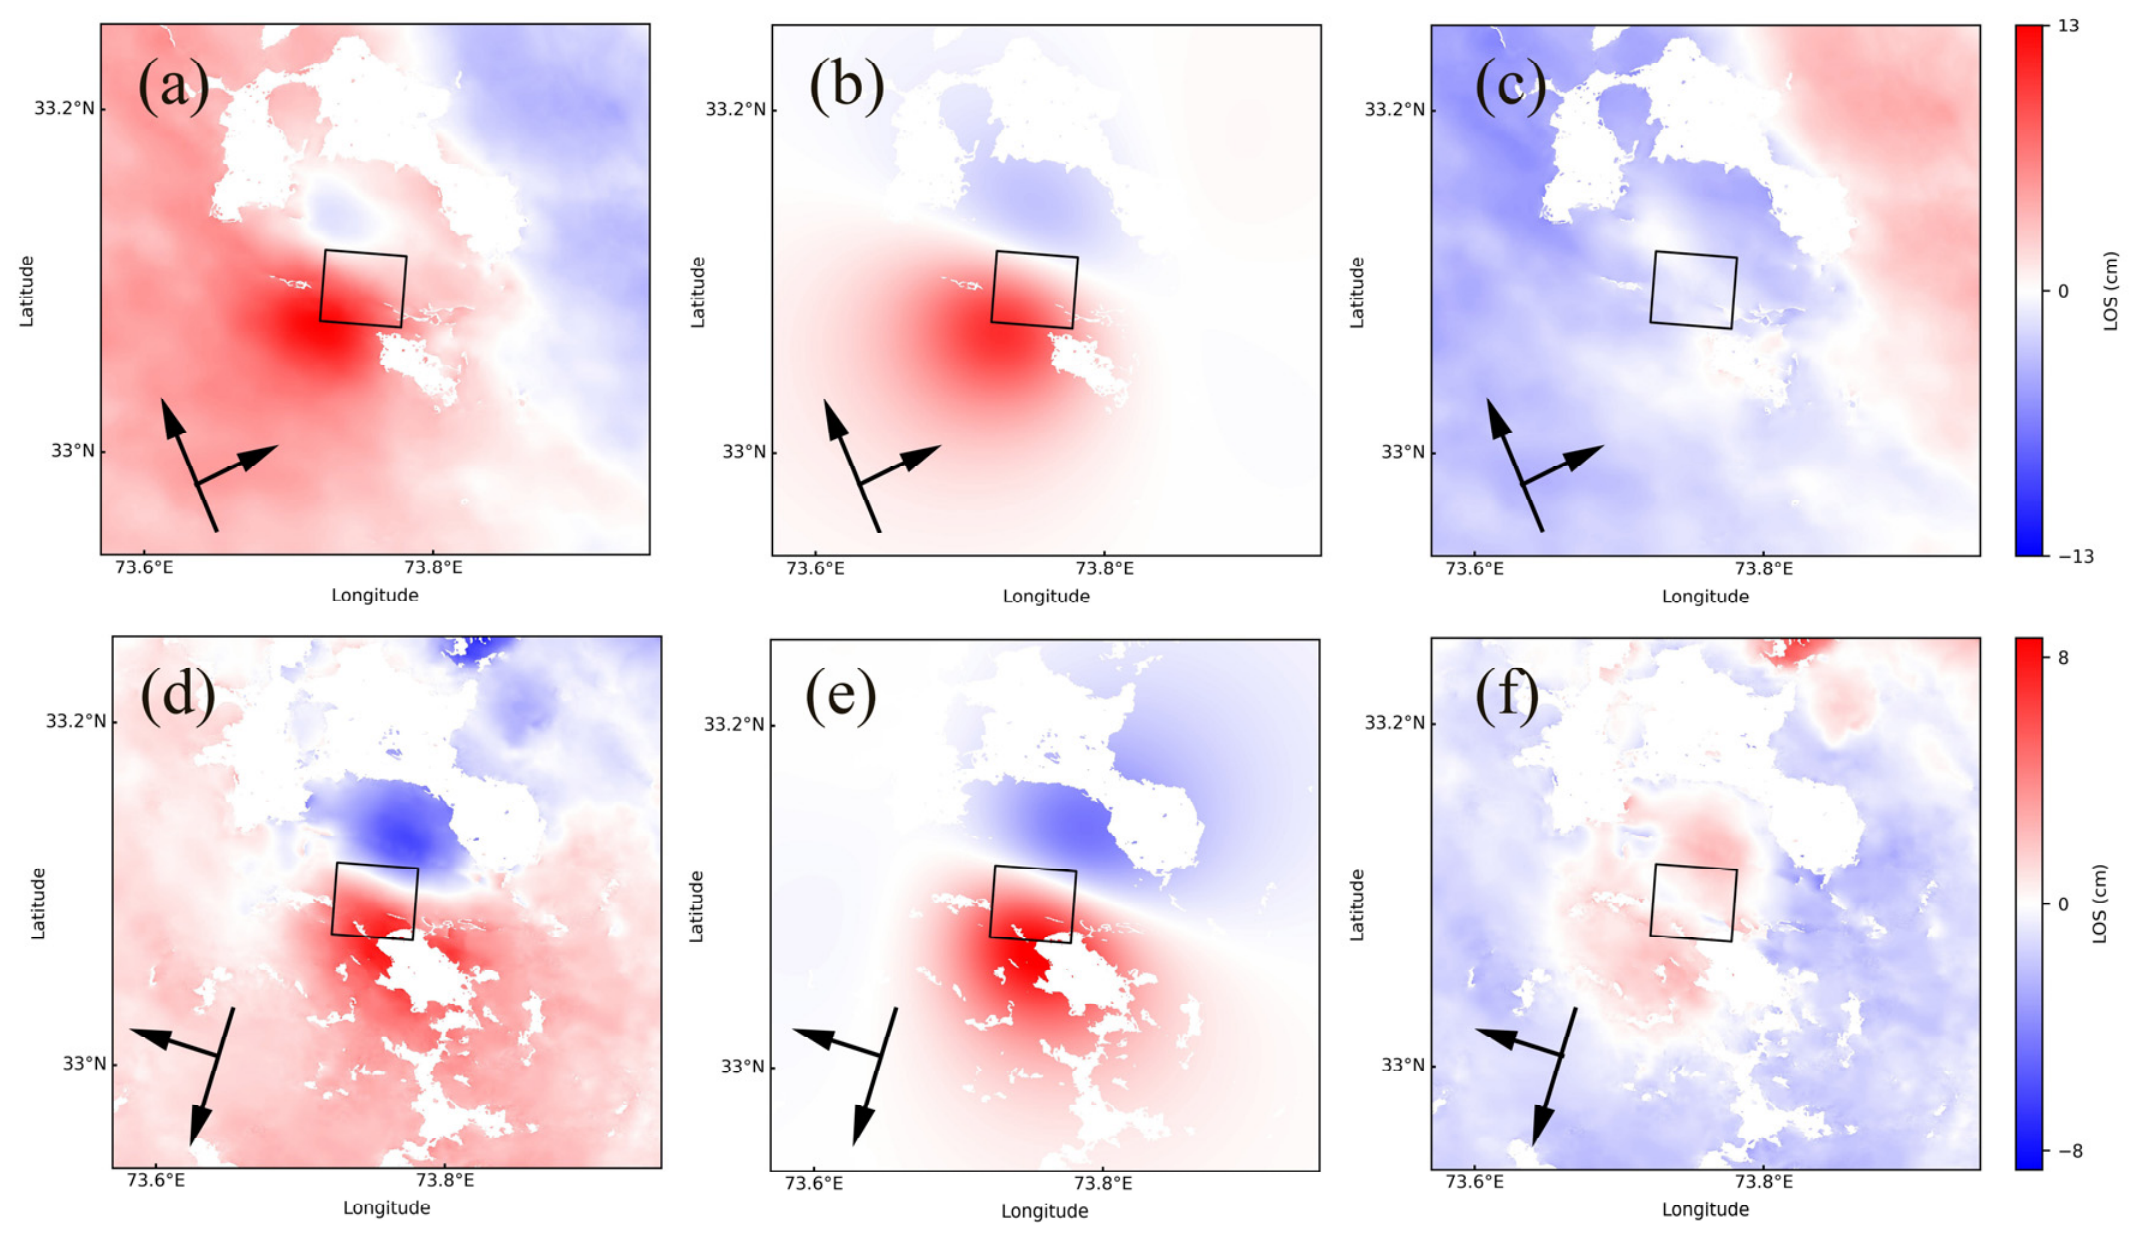
For the 2019 Mirpur earthquake, the GCMT solution yields two candidate nodal planes for the seismogenic fault of the earthquake: one corresponds to a thrust fault striking east–southeast, and the other to a thrust fault striking west–southwest. This earthquake originated from a blind thrust fault with a magnitude of approximately six. For seismic events of this type, discriminating the true seismogenic nodal plane from the two candidates solely via InSAR observations remains challenging. Accordingly, we constructed InSAR simulation models separately using the geometric parameters of each nodal plane, aiming to identify the actual ruptured fault plane by comparing the resultant modeling outputs. We performed the nonlinear inversion using both ascending and descending Sentinel-1 interferometric datasets for the first nodal plane. The surface deformation was modeled using Okada’s analytical solutions for a rectangular dislocation embedded within a homogeneous, isotropic, elastic half-space [22]. Initially, we conducted a fully nonlinear inversion where all nine fault parameters—latitude, longitude, depth, strike, dip, length, width, and two slip components (strike-slip and dip-slip)—were treated as free variables. However, the inversion failed to achieve convergence for the fault width, which we attribute to the limited sensitivity of the InSAR far-field signal to the bottom edge of the rupture. To resolve this trade-off, we adopted a constraint based on the empirical scaling laws relating earthquake magnitude to rupture dimensions [23]. By fixing the fault width at 4 km, we reduced the complexity of the parameter space, allowing the MCMC algorithm to converge toward a stable global minimum for the remaining eight parameters. Then, we performed InSAR data modeling for the second nodal plane following the identical approach described above. It is revealed that the prominent trade-off between fault length and fault width identified in the first nodal plane modeling was absent in the second case. Therefore, fault length and width were left unconstrained when constructing the model for the second nodal plane. The resulting optimal inversion parameters, including the refined fault geometry and slip vectors, are summarized in Table 2. Figure 3 and Figure 4 show the fitting results of two uniform slip models.
Table 2.
Fault parameters for the 2019 Mirpur earthquake from different studies.
Figure 3.
Inversion results of uniform-slip-model-1 in this study. InSAR observation (a,d); forward model of uniform slip model for ascending and descending Sentinel-1 track (b,e); and residual for ascending and descending Sentinel-1 track (c,f).
Figure 4.
Inversion results of uniform-slip-model-2 in this study. InSAR observation (a,d); forward model of uniform slip model for ascending and descending Sentinel-1 track (b,e); and residual for ascending and descending Sentinel-1 track (c,f).
3.2. Finite Fault Slip Model
Based on classical linear-elastic dislocation theory, surface displacements exhibit a linear relationship with slip on the rupture plane for a fixed fault geometry, which we express as:
where represents the DInSAR observations, m denotes the slip parameters, G denotes the Green function, which links the slip with surface displacements, is the smoothing Laplacian operator, and k is the smoothing factor.
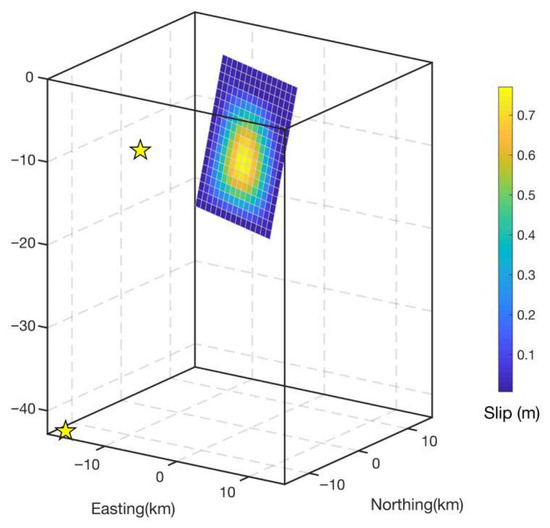
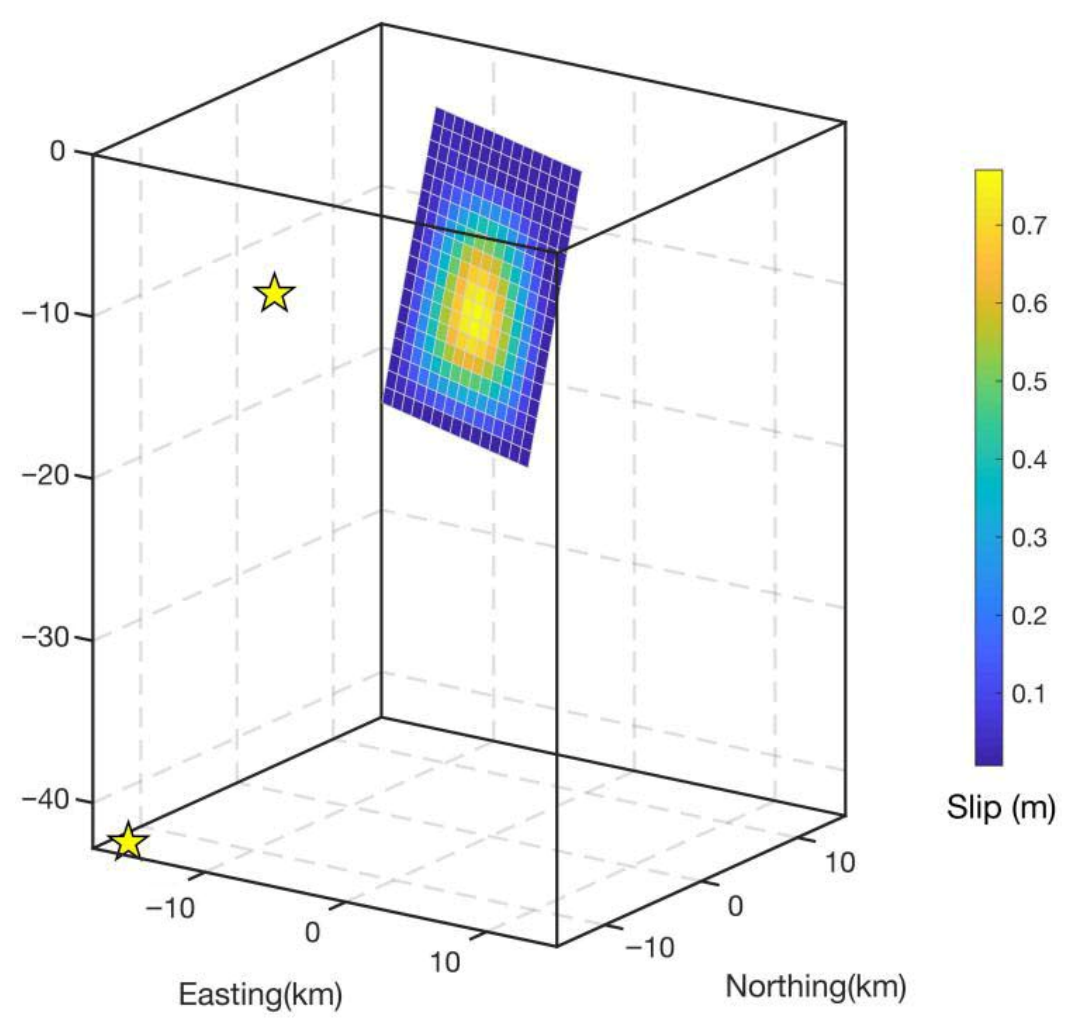
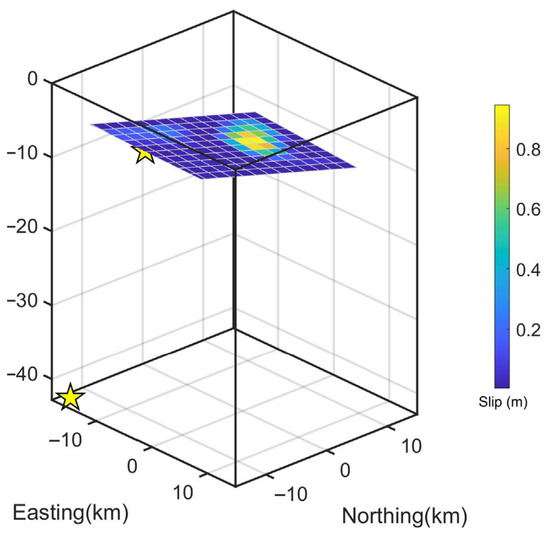
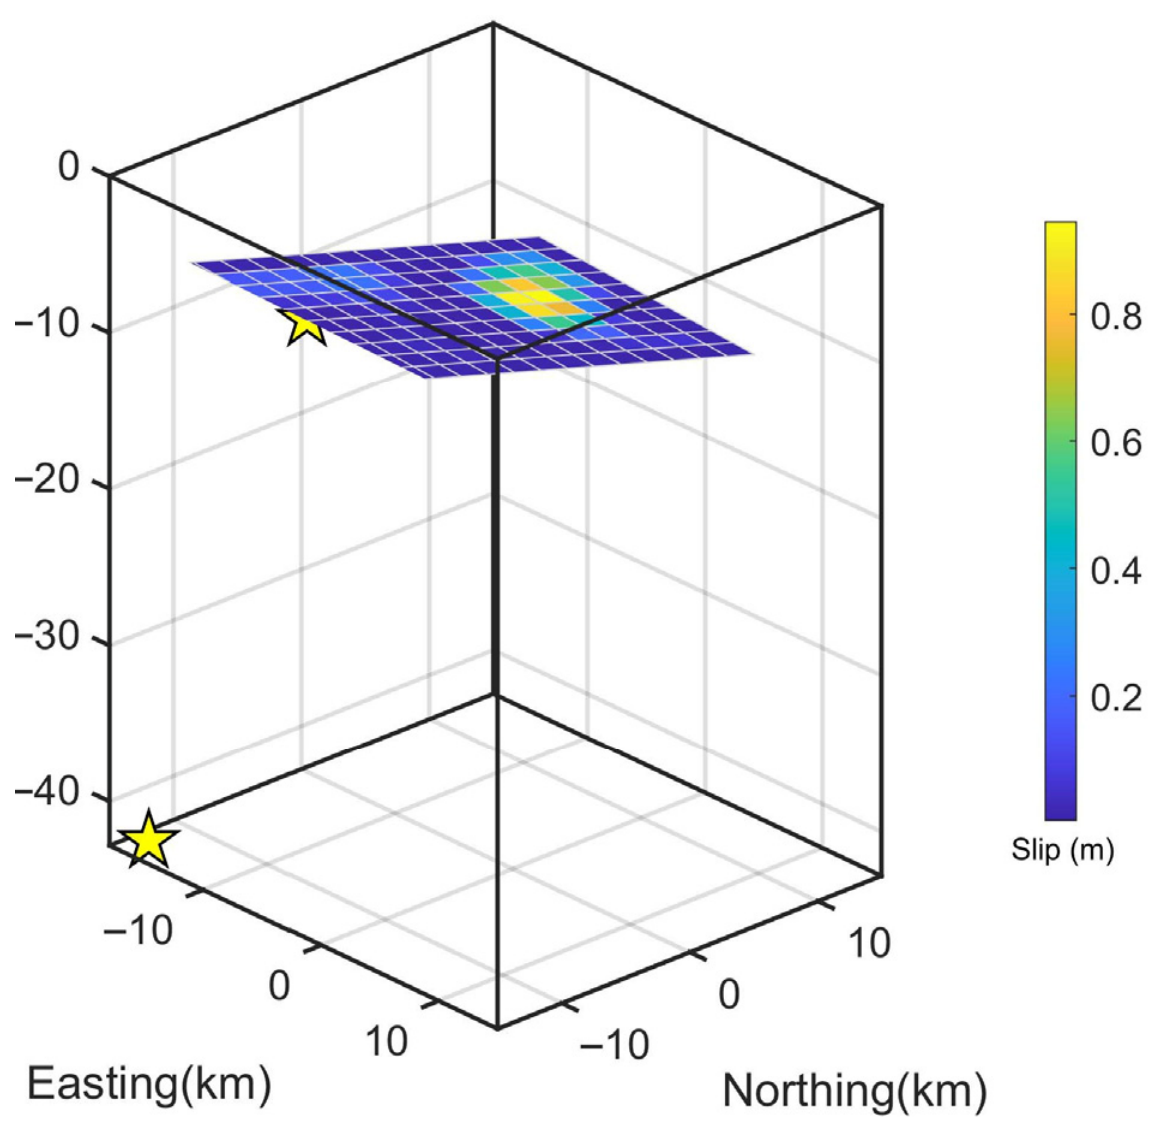
To determine the optimal slip distribution, we extended the fault plane to 15 km along-strike and 18 km down-dip. This plane was then discretized into 270 patches, each measuring 1 km × 1 km. Given the inherent ill-posedness and non-uniqueness of the slip inversion, we employed a constrained least-squares approach incorporating a Laplacian smoothing operator [27,28]. This regularization minimizes the roughness of the slip distribution, preventing unphysical, rapid oscillations in slip between adjacent patches. The cost function, defined as , was solved subject to non-negativity constraints to ensure physically plausible thrust-dominated motion. The optimal damping parameter, k, was selected through the analysis of the trade-off curve between the residual misfit and the model roughness (the L-curve criterion). The inversion results of the distributed fault slip model derived from the parameters of uniform-slip-model-1 and uniform-slip-model-2 are presented in Figure 5 and Figure 6, respectively.
Figure 5.
Inversion result of the distributed slip model of the Mirpur earthquake based on uniform-slip-model-1. The yellow stars denote two large aftershocks from USGS.
Figure 6.
Inversion result of the distributed slip model of the Mirpur earthquake based on uniform-slip-model-2. The yellow stars denote two large aftershocks from USGS.
4. Results and Analysis
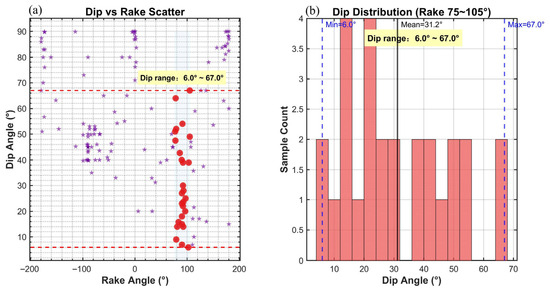
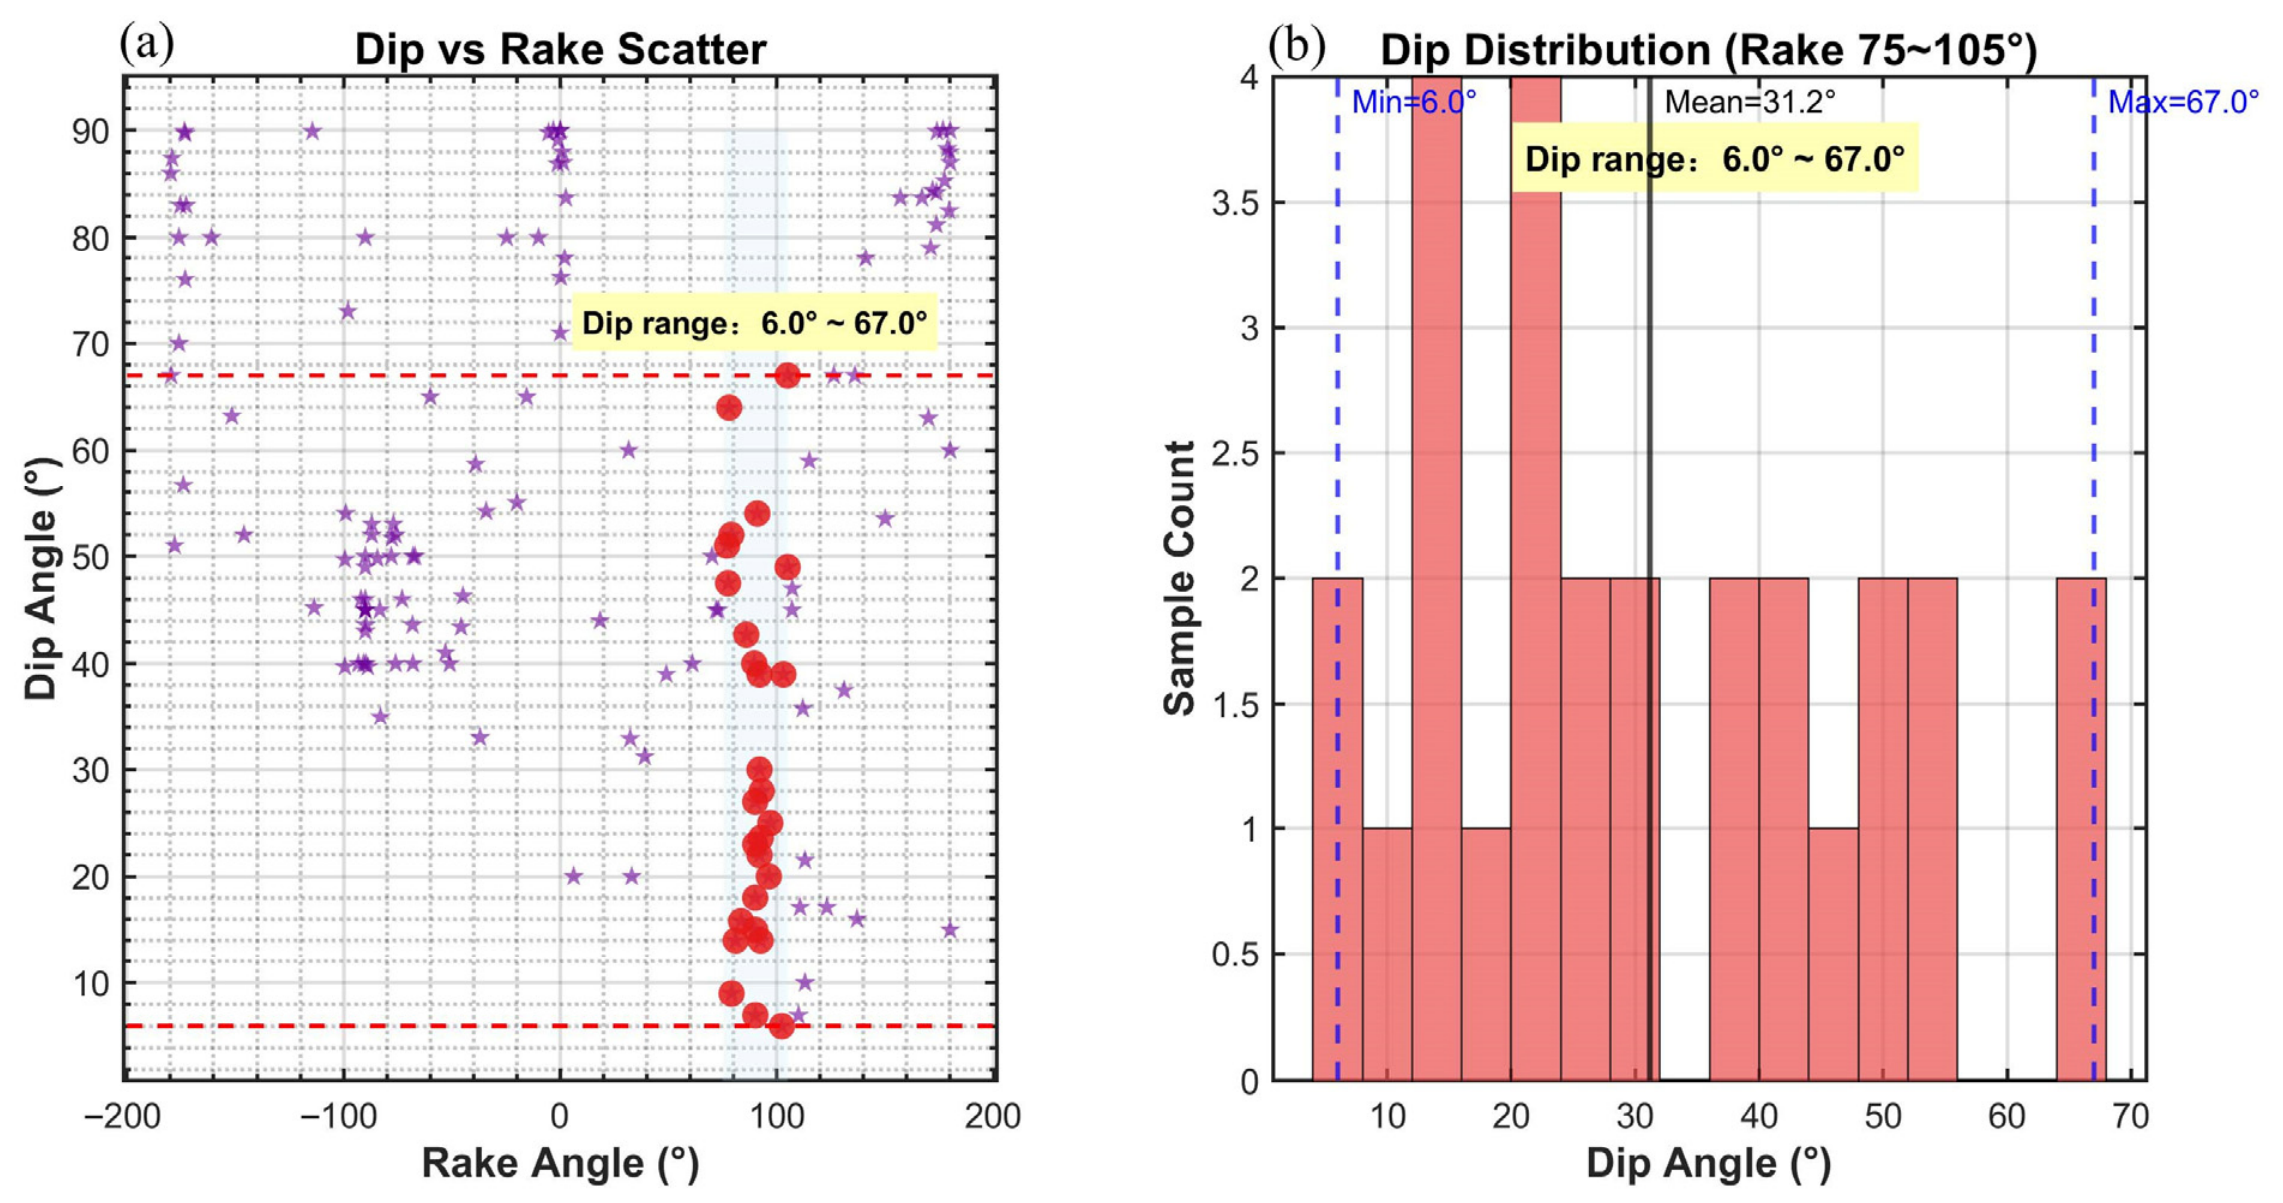
The first uniform slip model indicates that the co-seismic deformation field of the Mirpur earthquake can be well reproduced by a thrust fault striking east–southeast and dipping west–northwest (Figure 3 and Figure 5). Fault motion is dominated by thrust displacement with a minor right-lateral strike-slip component, yielding a root mean square (RMS) misfit of 1.9 cm; however, this model yields a steep fault dip angle of 77.61°. By contrast, the second uniform slip model also provides a satisfactory fit to the earthquake deformation using a low-angle thrust fault striking west–southwest and dipping east–northeast, with a dip angle of 13.01° (Figure 4 and Figure 6). Fault slip in this model is dominated by thrust motion accompanied by a small left-lateral strike-slip component, with an RMS misfit of 3.2 cm. Judging solely from the RMS misfit values, the first uniform slip model exhibits marginally superior fitting performance relative to the second model. Nevertheless, statistical analyses of published InSAR modeling results for thrust faults worldwide reveal that fault dip angles are universally less than 70°, and no thrust earthquake with a dip angle as steep as 77° has been documented. We compiled a dataset comprising 148 earthquakes [29] with well-constrained co-seismic deformation captured by InSAR, from which we extracted inverted fault dip and rake angles. Events with rake angles ranging from 75° to 105° were classified as thrust-faulting earthquakes. For these thrust events, inverted fault dip angles span 6° to 67°, with a mean value of 31.2°, and most values cluster between 10° and 30° (Figure 7). This statistical inventory demonstrates that no thrust fault modeled via InSAR observations has a dip angle exceeding 70°. Accordingly, we propose that the second uniform slip model represents the more plausible seismogenic fault model for the 2019 Mirpur earthquake.
Figure 7.
Distribution characteristics of InSAR-derived fault dip and rake angles for 148 earthquakes. (a) A scatter plot (purple pentagrams) of InSAR-derived dip versus rake angles for 148 earthquakes. The light blue shaded zone marks the rake range of 75−105°, and red circles represent target samples within this interval. Red dashed lines delineate the dip range of 6.0° to 67.0°. (b) Histogram of dip angles for target samples (events with rake angles ranging from 75° to 105°). The blue dashed lines denote the maximum and minimum dip angles of the target samples, while the black solid line represents their mean dip angle.
The preferred distributed slip model for the earthquake, obtained by inverting both ascending and descending Sentinel-1 data, is illustrated in Figure 5 and Figure 6. The fault rupture is characterized primarily by thrust motion with a minor strike-slip component, consistent with the findings of the uniform slip model. The distributed fault slip model further demonstrates that fault slip is predominantly concentrated at depth in an elliptical pattern, and this distributed slip distribution achieves an improved fit to the InSAR observations. We compiled magnitude estimates from multiple seismological agencies and published studies. It is found that magnitudes released by seismic agencies are generally lower than those derived from InSAR inversion. Specifically, the moment magnitude Mw 5.4 provided by the USGS is notably smaller than solutions from other agencies, which predominantly yield magnitudes around Mw 5.8. By contrast, moment magnitudes inverted from InSAR data range mainly from Mw 5.8 to Mw 6.0. Our InSAR-constrained geodetic moment magnitudes, derived from the uniform slip model (Mw 6.0) and distributed slip model (Mw 6.1), are consistent with the PMT solution (Mw 5.8) and the findings of previous InSAR-based studies (Table 2). We expect higher Mw estimates from our InSAR analysis compared to seismic catalogs, as the InSAR datasets incorporate early postseismic signals resulting from acquisitions 4 and 5 days after the mainshock for the ascending and descending tracks, respectively.
Coulomb stress changes indicate stress transfer to adjacent fault segments, potentially increasing seismic hazard [30,31]. Significantly, Coulomb stress change calculations have been integrated into earthquake-forecasting models designed to assess potential seismic hazards [32,33,34,35].
We applied the Coulomb failure hypothesis to determine the static Coulomb failure stress change, thereby assessing the stress state induced by the Mirpur earthquake.
where represents the shear stress change, denotes the normal stress change, and denotes the effective coefficient of friction on the receiver fault.
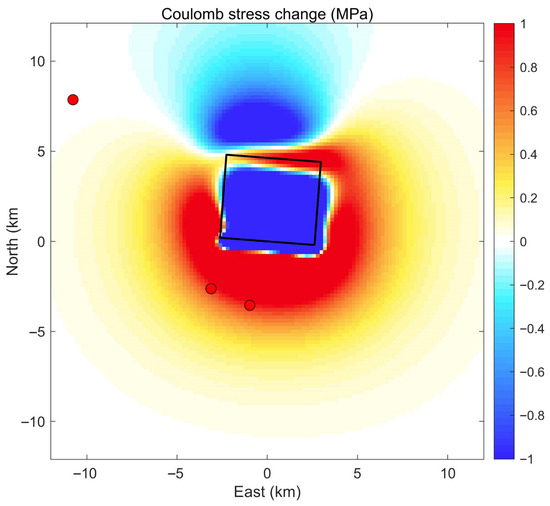
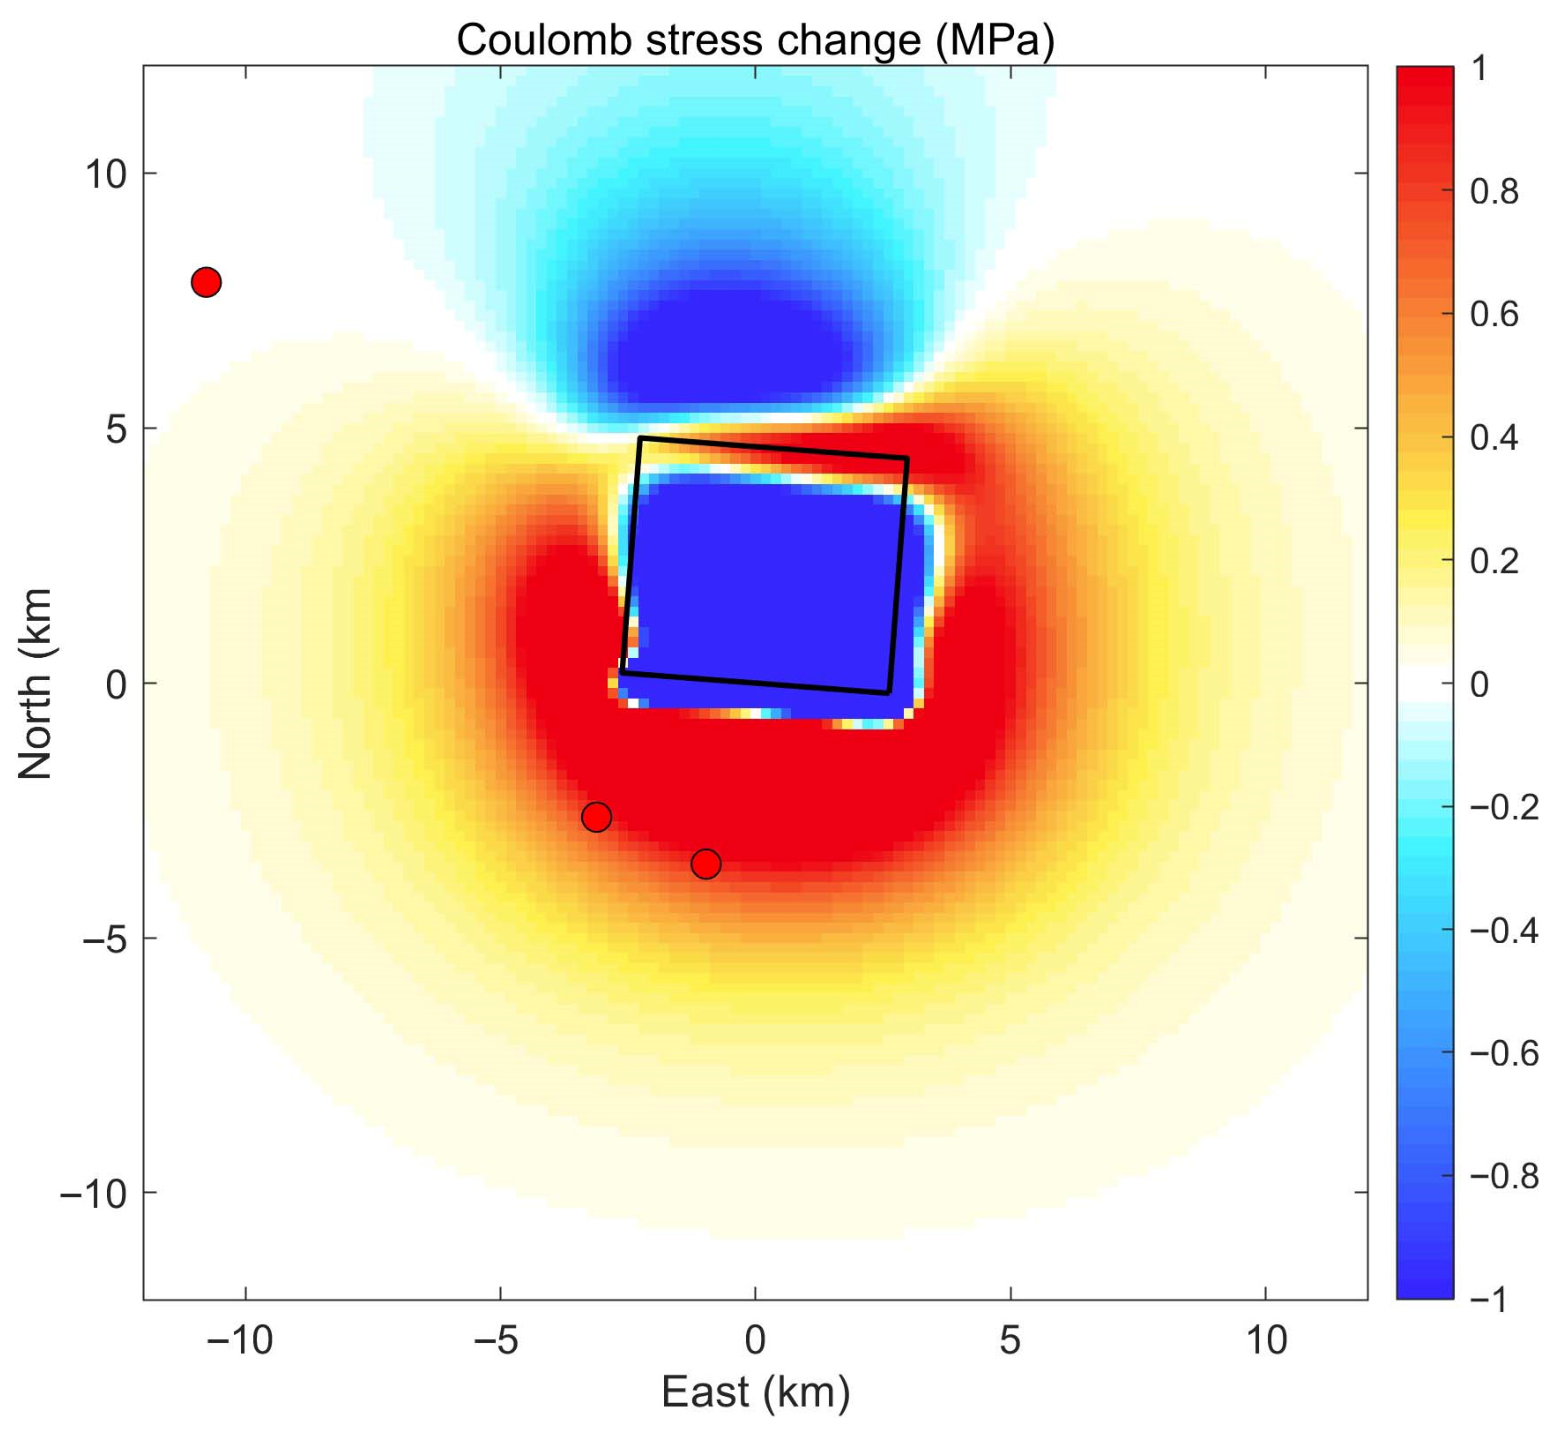
The calculated Coulomb stress increased on both ends of the surface projection of the fault. Our results indicate that a prominent stress shadow (blue region) is clearly visible directly over the fault plane and extending to the north, indicating a massive stress drop and release during the main shock (Figure 8). Conversely, substantial positive Coulomb stress changes (red to yellow lobes) are concentrated around the southern, eastern, and western margins of the fault, acting as distinct stress-loading zones. Notably, the two aftershocks located south of the fault align perfectly within the dominant positive Coulomb stress lobes. This strong spatial correlation indicates that the coseismic stress transfer from the main shock played a significant role in triggering these subsequent events at the fault extremities. However, an isolated aftershock to the far northwest lies in a region of negligible stress change. While the overall stress distribution provides valuable insights into the main shock’s mechanical influence on the surrounding crust, such discrepancies highlight current limitations. The lack of a high-precision relocated aftershock catalog and the assumptions of medium homogeneity in our elastic half-space model likely obscure the more complex, precise relationship between static stress transfer and the observed aftershock distribution.
Figure 8.
The distribution of Coulomb stress changes induced by the 2019 Mirpur earthquake. The seismogenic fault geometry is indicated by the black rectangle representing its surface projection. Red dots denote aftershocks following the Mirpur earthquake from the ISC catalog.
5. Discussion and Conclusions
When a catastrophic earthquake occurs, we can usually obtain the observations of surface deformation caused by earthquakes through geodetic techniques. In addition to surface deformation, understanding subsurface fault slip distribution is critical for earthquake rupture studies. Although the USGS National Earthquake Information Center (NEIC) regularly reports the fault slip distribution of M 7+ earthquakes with seismic data, the moderate earthquakes are ignored. Therefore, resolving a distributed slip model for this earthquake, particularly for a moderate magnitude event, is a very important supplement. Although InSAR provides critical constraints for slip inversion in moderate earthquakes, the utility of this technology is limited by the fact that many earthquakes lack surface displacements observable with current remote sensing capabilities.
Compared with previously published InSAR inversion results for the seismogenic fault geometry and slip distribution of the Mirpur earthquake, our estimates show overall consistency in fault location, strike, dip, rake, and geodetic moment magnitude, yet notable discrepancies exist in fault strike and dip angles across different studies. References [25,26] derived fault dip angles of 2.5° and 4° from InSAR observations, which are substantially lower than values reported in other publications. The dip angle of 13.01° obtained in this study falls within the range of published results and is smaller than the 22.5° proposed by reference [24]. Differences in fault strike among existing studies are approximately 10°. Despite the deviations in strike and dip parameters, all these models achieve satisfactory fits to the InSAR measurements. This indicates that InSAR data can constrain seismogenic fault parameters within a certain range, albeit with relatively large uncertainties in the inverted geometric parameters. In light of the foregoing statistical analysis of dip angles for thrust-faulting earthquakes, the dip angle of our preferred model lies within the dominant range of 10–30° observed for most documented thrust events. This implies that the seismogenic fault of the Mirpur earthquake shares similar geometric characteristics with the majority of thrust faults identified worldwide.
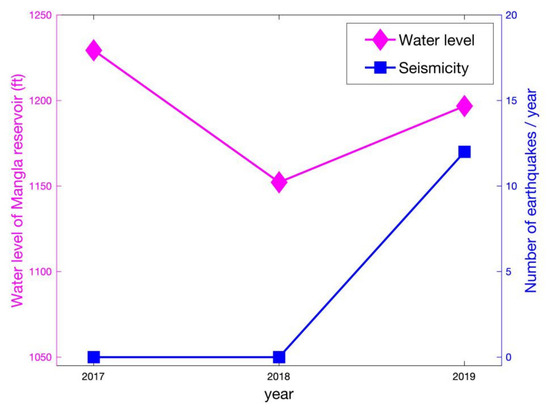
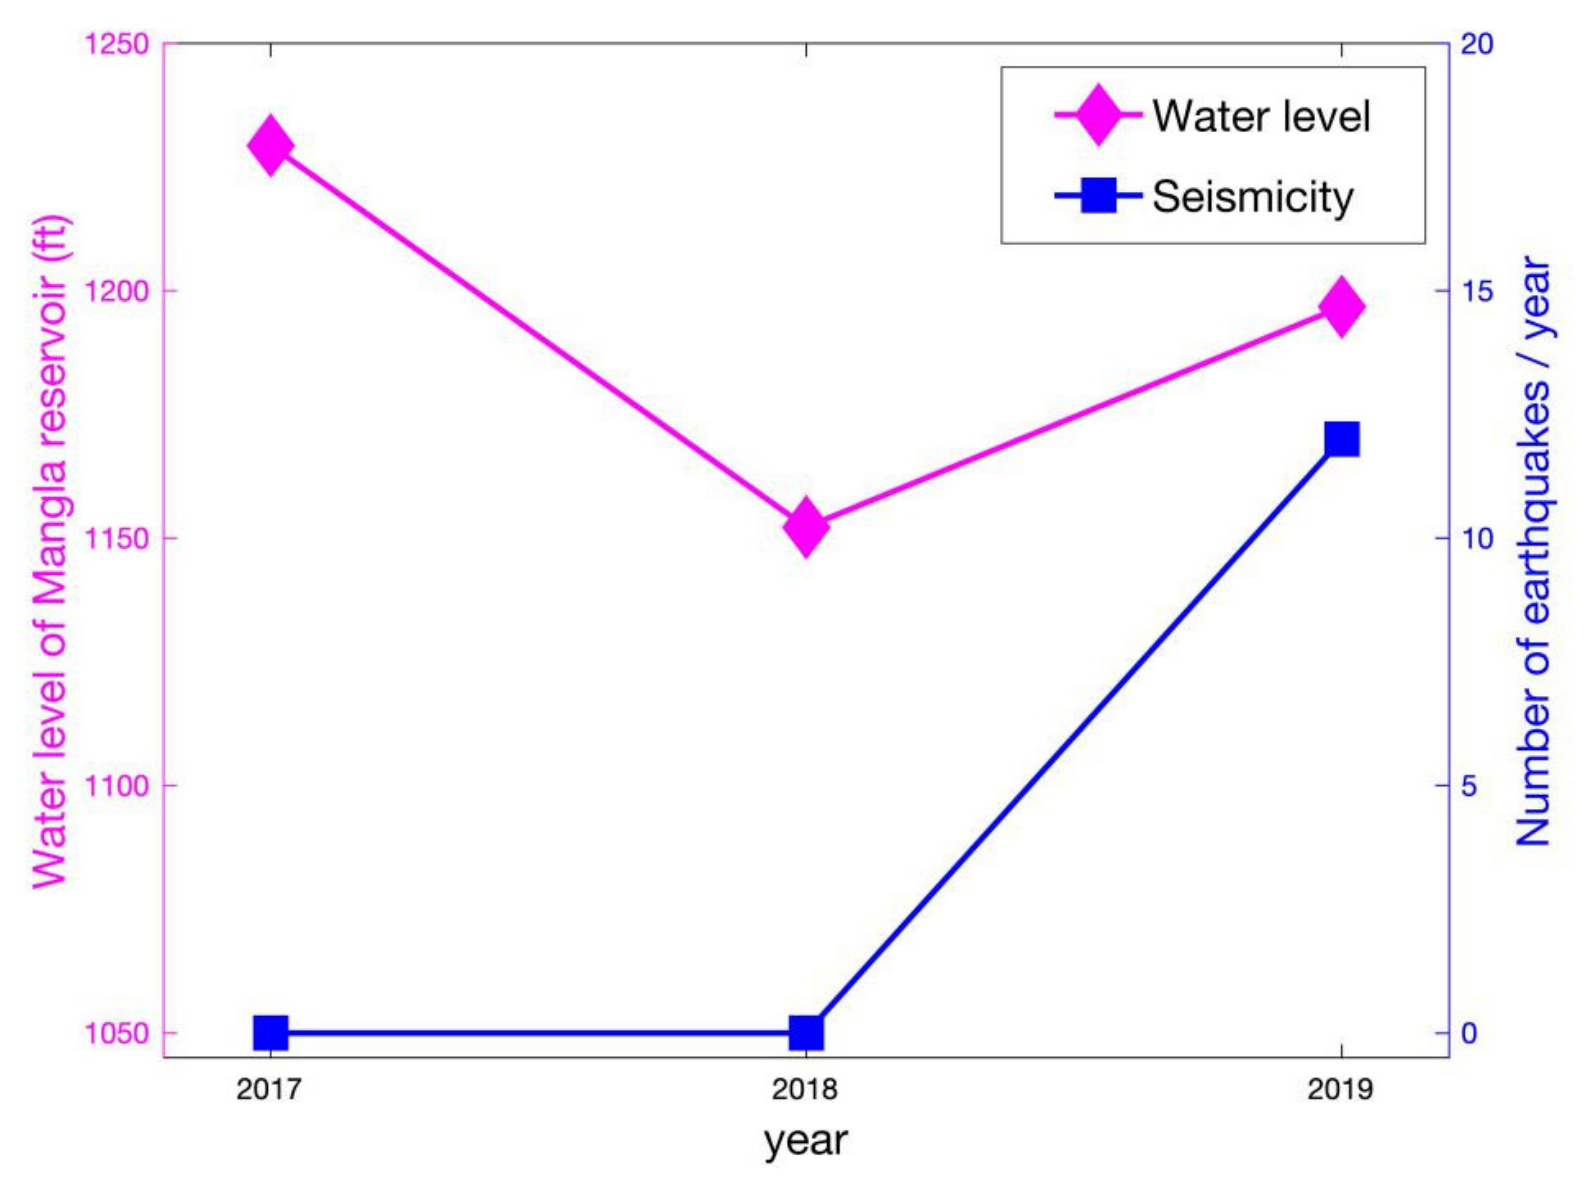
We also note that the Mirpur earthquake epicenter is located near the Mangla Reservoir, where water levels had been rising rapidly due to heavy rainfall, and the accelerated melting of snow in the upper Himalayan reaches of Jammu and Kashmir immediately preceding the event, as reservoir-induced seismicity is a well-documented phenomenon globally, primarily driven by direct elastic loading and delayed pore pressure diffusion [36]. We also tried to look for evidence of a connection between the rising water level of the Mangla Reservoir and the 2019 Mirpur earthquake, but unfortunately, we cannot find any substantial evidence. We also investigated the correlation between the water level history of the Mangla Reservoir and the seismicity history. From Figure 9, we can see that there is no obvious correlation between the water level of the Mangla Reservoir and the seismicity history. Although the water level in the Mangla Reservoir reached 1229.35 ft in 2017—a level exceeding that observed in 2019—no significant seismicity was recorded in the area during that period. The reservoir water level peaked in 2017 without triggering any seismicity, whereas the 2019 earthquake occurred at a comparatively lower water level. This detailed temporal comparison strongly reinforces our conclusion that a direct triggering mechanism cannot be confirmed with the available data. The current geodetic dataset is insufficient to establish any causal link between reservoir impoundment and the seismic event. The necessity for future studies to utilize longer-term InSAR time-series analysis and advanced hydro-mechanical models—such as poroelastic rebound and fluid diffusion modeling [37,38]—to rigorously test the reservoir-triggering hypothesis.
Figure 9.
Water level of the Mangla Reservoir versus the seismicity history (the data of water level of Mangla Reservoir from the Federal Flood Commission of Pakistan).
We utilized Sentinel-1 interferograms from both ascending and descending orbital tracks to quantify the surface displacements induced by the 2019 Mirpur earthquake. The resulting inversion model indicates that the seismic rupture occurred on a buried fault, characterized by a strike of 274.37° and a dip of 13.01°. The focal mechanism is dominated by thrust displacement, with a subordinate strike-slip component, suggesting a complex slip partitioning consistent with the regional tectonic framework of the Himalayan frontal thrust system. Our InSAR-based inversion, utilizing a crustal rigidity of 30 GPa, estimates a seismic moment of 1.11 × 10¹⁸ N m (Mw 6.0). The Coulomb stress change modeling reveals that the rupture effectively dissipated the majority of the strain accumulated within the primary coseismic slip zone. This suggests that the Mirpur earthquake acted as a significant strain-release event for this segment. However, the resulting stress perturbations at the periphery of the rupture plane indicate an increase in Coulomb failure stress (CFS) on adjacent fault strands, highlighting the potential for triggering subsequent seismic activity in the surrounding region.
Author Contributions
Conceptualization, Y.Z. and T.Z.; methodology, Y.Z.; software, T.Z.; validation, Y.Z. and T.Z.; writing—original draft preparation, Y.Z.; writing—review and editing, T.Z.; visualization, Y.Z.; supervision, T.Z.; project administration, T.Z.; funding acquisition, T.Z. All authors have read and agreed to the published version of the manuscript.
Funding
The study is funded by the National Natural Science Foundation of China (42204006, 42504008) and the Open Fund of State Key Laboratory of Precision Geodesy, Innovation Academy for Precision Measurement Science and Technology (Grant No. SKLPG2025-2-3).
Data Availability Statement
Data are available from the authors upon reasonable request.
Acknowledgments
Sentinel-1 data were provided by the European Space Agency (ESA). All graphical plots were created using Python’s Matplotlib. This work was supported by the National Natural Science Foundation of China (42204006, 42504008) and the Open Fund of State Key Laboratory of Precision Geodesy, Innovation Academy for Precision Measurement Science and Technology (Grant No. SKLPG2025-2-3).
Conflicts of Interest
The authors declare no conflicts of interest.
References
- Stevens, V.; Avouac, J.P. Coupling on the Main Himalayan Thrust. Geophys. Res. Lett. 2015, 42, 5828–5837. [Google Scholar] [CrossRef] [Scilit]
- Kundu, B.; Yadav, R.K.; Bali, B.S.; Chowdhury, S.; Gahalaut, V.K. Oblique convergence and slip partitioning in the NW Himalaya: Implications from GPS measurements. Tectonics 2014, 33, 2013–2024. [Google Scholar] [CrossRef] [Scilit]
- Schiffman, C.; Bali, B.S.; Szeliga, W.; Bilham, R. Seismic slip deficit in the Kashmir Himalaya from GPS observations. Geophys. Res. Lett. 2013, 40, 5642–5645. [Google Scholar] [CrossRef] [Scilit]
- Grandin, R.; Doin, M.-P.; Bollinger, L.; Pinel-Puyssegur, B.; Ducret, G.; Jolivet, R.; Sapkota, S.N. Long-term growth of the Himalaya inferred from interseismic InSAR measurement. Geology 2012, 40, 1059–1062. [Google Scholar] [CrossRef] [Scilit]
- Galetzka, J.; Melgar, D.; Genrich, J.F.; Geng, J.; Owen, S.; O Lindsey, E.; Xu, X.; Bock, Y.; Avouac, J.-P.; Adhikari, L.B.; et al. Slip pulse and resonance of the Kathmandu basin during the 2015 Gorkha earthquake, Nepal. Science 2015, 349, 1091–1095. [Google Scholar] [CrossRef] [Scilit] [PubMed]
- Croward, M.P.; Rutler, R.W.H. Thrust tectonics and the deep structure of the Pakistan Himalaya. Geology 1985, 13, 417–420. [Google Scholar] [CrossRef] [Scilit]
- Baker, D.M.; Lillie, R.J.; Yeats, R.S.; Johnson, G.D.; Yousuf, M.; Zamin, A.S.H. Development of the Himalayan frontal thrust zones: Salt Range, Pakistan. Geology 1988, 16, 3–7. [Google Scholar] [CrossRef] [Scilit]
- Avouac, J.-P.; Ayoub, F.; Leprince, S.; Konca, O.; Helmberger, D.V. The 2005, Mw 7.6 Kashmir earthquake: Sub-pixel correlation of ASTER images and seismic waveforms analysis. Earth Planet. Sci. Lett. 2006, 249, 514–528. [Google Scholar] [CrossRef] [Scilit]
- Turner, B.; Jenkins, J.; Turner, R.; Parker, A.L.; Sinclair, A.; Davies, S.; Hayes, G.P.; Villaseñor, A.; Dart, R.L.; Tarr, A.C. Seismicity of the Earth 1900–2010 Himalaya and Vicinity (ver.1.1, Jan. 28, 2014); U.S. Geological Survey Open-File Report 2010–1083-J, scale 1:9,000,000; U.S. Geological Survey: Reston, VA, USA, 2013. Available online: https://pubs.usgs.gov/of/2010/1083/j/ (accessed on 1 April 2026).
- Funning, G.J.; Garcia, A. A systematic study of earthquake detectability using Sentinel-1 Interferometric Wide-Swath data. Geophys. J. Int. 2019, 216, 332–349. [Google Scholar]
- Sandwell, D.; Mellors, R.; Tong, X.; Wei, M.; Wessel, P. Open radar interferometry software for mapping surface deformation. Eos Trans. AGU 2011, 92, 234. [Google Scholar] [CrossRef] [Scilit]
- Sandwell, D.; Mellors, R.; Tong, X.; Wei, M.; Wessel, P. GMTSAR: An InSAR Processing System Based on Generic Mapping Tools. UC San Diego: Scripps Institution of Oceanography. 2011. Available online: http://escholarship.org/uc/item/8zq2c02m (accessed on 1 July 2026).
- Zan, F.D.; Gurarnieri, A.M.M. TOPSAR, terrain observation by progressive scans. IEEE Trans. Geosci. Remote Sens. 2006, 44, 2352–2360. [Google Scholar] [CrossRef] [Scilit]
- Farr, T.G.; Rosen, P.A.; Caro, E.; Crippen, R.; Duren, R.; Hensley, S.; Kobrick, M.; Paller, M.; Rodriguez, E.; Roth, L.; et al. The shuttle radar topography mission. Rev. Geophys. 2007, 45, RG2004. [Google Scholar] [CrossRef] [Scilit]
- Goldstein, R.M.; Werner, C.L. Radar interferogram filtering for geophysical applications. Geophys. Res. Lett. 1998, 25, 4035–4038. [Google Scholar] [CrossRef] [Scilit]
- Chen, C.W.; Zebker, H.A. Network approaches to two-dimensional phase unwrapping: Intractability and two new algorithms. J. Opt. Soc. Am. A 2000, 17, 401–414. [Google Scholar] [CrossRef] [Scilit]
- Jónsson, S.; Zebker, H.; Segall, P.; Amelung, F. Fault slip distribution of the 1999 Mw 7.1 Hector Mine, California, earthquake, estimated from satellite radar and GPS measurements. Bull. Seismol. Soc. Amer. 2002, 92, 1377–1389. [Google Scholar] [CrossRef] [Scilit]
- Atzori, S.; Hunstad, I.; Chini, M.; Salvi, S.; Tolomei, C.; Bignami, C.; Stramondo, S.; Trasatti, E.; Antonioli, A.; Boschi, E. Finite fault inversion of DInSAR coseismic displacement of the 2009 L’Aquila earthquake (central Italy). Geophys. Res. Lett. 2009, 36, L15305. [Google Scholar] [CrossRef] [Scilit]
- Wen, Y.; Xu, C.; Liu, Y.; Jiang, G. Deformation and source parameters of the 2015 Mw 6.5 earthquake in Pishan, western China, from Sentinel-1A and ALOS-2 data. Remote Sens. 2016, 8, 134. [Google Scholar] [CrossRef] [Scilit]
- Hastings, W.K. Monte carlo sampling methods using Markov chains and their applications. Biometrika 1970, 57, 97–109. [Google Scholar] [CrossRef] [Scilit]
- Bagnardi, M.; Hooper, A. Inversion of surface deformation data for rapid estimates of source parameters and uncertainties: A Bayesian approach. Geochem. Geophys. Geosyst. 2018, 19, 2194–2211. [Google Scholar] [CrossRef] [Scilit]
- Okada, Y. Surface deformation due to shear and tensile faults in a half-space. Bull. Seismol. Soc. Amer. 1985, 75, 1135–1154. [Google Scholar] [CrossRef] [Scilit]
- Wells, D.L.; Coppersmith, K.J. New empirical relationships among magnitude, rupture length, rupture width, rupture area and surface displacement. Bull. Seismol. Soc. Am. 1994, 84, 974–1002. [Google Scholar] [CrossRef] [Scilit]
- Vaka, D.S.; Rao, Y.S.; Singh, T. Surface deformation of the 2019 Mirpur earthquake estimated from Sentinel-1 InSAR data. In Proceedings of the 2020 IEEE India Geoscience and Remote Sensing Symposium (InGARSS), Ahmedabad, India, 1–4 December 2020. [Google Scholar] [CrossRef] [Scilit]
- Sreejith, K.; Jasir, M.; Agrawal, R.; Rajawat, A. The 2019 September 24, Mw = 6, Mirpur earthquake, NW Himalaya: Geodetic evidence for shallow, near-horizontal décollement rupture of the Main Himalayan Thrust. Tectonophysics 2021, 816, 229013. [Google Scholar] [CrossRef] [Scilit]
- Tan, Y.; Dai, Z.; Liu, B.; Zha, X. Source parameters and slip distribution of the 2019 Mw 5.8 Mirpur (Pakistan) earthquake inferred from the corrected InSAR observations. Seismol. Res. Lett. 2022, 93, 1464–1478. [Google Scholar] [CrossRef] [Scilit]
- Feng, W.; Samsonov, S.; Almeida, R.; Yassaghi, A.; Li, J.; Qiu, Q.; Li, P.; Zheng, W. Geodetic constraints of the 2017 Mw7.3 Sarpol Zahab, Iran earthquake, and its implications on the structure and mechanics of the northwest Zagros thrust-fold belt. Geophys. Res. Lett. 2018, 45, 6853–6861. [Google Scholar] [CrossRef] [Scilit]
- Vajedian, S.; Motagh, M.; Mousavi, Z.; Motaghi, K.; Fielding, E.J.; Akbari, B.; Wetzel, H.-U.; Darabi, A. Coseismic deformation field of the Mw 7.3 12 November 2017 Sarpol-e Zahab (Iran) earthquake: A decoupling horizon in the Northern Zagros mountains inferred from InSAR observations. Remote Sens. 2018, 10, 1589. [Google Scholar] [CrossRef] [Scilit]
- Zhu, C.; Wang, C.; Zhang, B.; Qin, X.; Shan, X. Differential Interferometric Synthetic Aperture Radar data for more accurate earthquake catalogs. Remote Sens. Environ. 2021, 266, 112690. [Google Scholar] [CrossRef] [Scilit]
- Yun, J.; Gabriel, A.; May, D.A.; Fialko, Y. Controls of dynamic and static stress changes and aseismic slip on delayed earthquake triggering: Application to the 2019 Ridgecrest earthquake sequence. J. Geophys. Res. Solid Earth 2025, 130, e2025JB031271. [Google Scholar] [CrossRef] [Scilit]
- Stein, R.S. Earthquake conversations. Sci. Amer. 2003, 288, 72–79. [Google Scholar] [CrossRef] [Scilit] [PubMed]
- Famiglietti, N.A.; Cheloni, D.; Caputo, R.; Vicari, A. Geodetic model of the 2024 January 22 Mw 7.0 Wushi (northwestern China) earthquake and Mw 5.7 aftershock from inversion of InSAR data. Geophys. J. Int. 2025, 241, 941–953. [Google Scholar] [CrossRef] [Scilit]
- Lindsay, D.; Bürgmann, R.; Materna, K.; Fielding, E.J. Nine-year L-band InSAR time series of tectonic and non-tectonic surface deformation in Northern California. J. Geophys. Res. Solid Earth 2026, 131, e2025JB032718. [Google Scholar] [CrossRef] [Scilit]
- He, K.; Cai, J.; Wen, Y.; Xu, C. Bipartite rupture in the 2025 Dingri earthquake indicates normal conjugate faulting during orogenic collapse. Commun. Earth Environ. 2026, 7, 229. [Google Scholar] [CrossRef] [Scilit]
- He, L.; Salman, R.; Marfito, B.; Feng, G.; Jiang, H.; Wang, W.; Xiong, Z.; Sun, K.; Wang, Y.; Yun, S. Coulomb Pre-Stress Changes Modulate Coseismic Rupture Kinematics of the 2025 Mw7.7 Myanmar Earthquake Revealed by Space Geodesy. Geophys. Res. Lett. 2026, 53, E2025gl120587. [Google Scholar] [CrossRef] [Scilit]
- Tong, G.; Zhu, X.; Qin, W.; Zhou, L. Induced seismicity by impoundment or hydraulic fracturing operation? A case study in the Xiannvshan Fault area of the Three Gorges Reservoir region. Front. Earth Sci. 2025, 13, 1583819. [Google Scholar] [CrossRef] [Scilit]
- Peng, X.; Zhao, R.; Deng, K. A Comprehensive Numerical Model for Reservoir-Induced Earthquake Risk Assessment. Entropy 2023, 25, 1383. [Google Scholar] [CrossRef] [Scilit] [PubMed]
- Li, J.; Zhu, A.; Li, Y.; Cui, G.; Jiang, C. The poroelastic stress and pore pressure effects on delayed seismicity based on fully coupled fluid-solid simulations and rate-and-state friction laws. Geophys. J. Int. 2026, 244, ggaf536. [Google Scholar] [CrossRef] [Scilit]

Disclaimer/Publisher’s Note: The statements, opinions and data contained in all publications are solely those of the individual author(s) and contributor(s) and not of MDPI and/or the editor(s). MDPI and/or the editor(s) disclaim responsibility for any injury to people or property resulting from any ideas, methods, instructions or products referred to in the content. |
© 2026 by the authors. Licensee MDPI, Basel, Switzerland. This article is an open access article distributed under the terms and conditions of the Creative Commons Attribution (CC BY) license.