Article

Transitional Oil Sands Tailings’ Filterability and Consolidation Behavior

1
Department of Civil and Environmental Engineering, University of Alberta, Edmonton, AB T6G 1H9, Canada
2
Centre for Oil Sands Sustainability, Northern Alberta Institute of Technology (NAIT), Edmonton, AB T5G 0Y2, Canada
*
Author to whom correspondence should be addressed.
Geosciences 2026, 16(7), 271; https://doi.org/10.3390/geosciences16070271
Submission received: 14 February 2026 / Revised: 22 May 2026 / Accepted: 25 May 2026 / Published: 5 July 2026

Abstract

Over the past few decades, the oil sands mining industry has taken steps to find ways to speed up the filterability and consolidation of their tailings deposits, which would otherwise take decades to settle and reach the required strength. The initiative has led to deposits that are combinations of sands and fines (<44 µm) in proportions whose geotechnical behaviors have not yet been determined by the existing body of knowledge. The purpose of this study is to examine how the quantity of fines and their index characteristics affect the filterability and consolidation of particular deposits. Findings from this research show that these deposits exhibit characteristics of low-plasticity soils. The hydraulic conductivity of these materials is strongly influenced by the fines content. The deposits behave more like sand below a threshold point of about 35 percent fines content, and they exhibit low hydraulic conductivity above this point. Furthermore, the hydraulic conductivity of these deposits is influenced by other factors, including clay properties, sodium adsorption ratio, and effective stress. The results of finite-strain consolidation modeling show that mixtures of sand and fluid tailings with fines within the threshold range exhibit significantly improved consolidation performance. In particular, compared to the performance of traditional fluid tailings deposits, settlement time and depth are reduced by more than 50%, and the time needed for complete pore pressure dissipation is reduced by more than 80%. Findings from this study provide an insight to the industry on the optimal fines–sand blending proportions for best performing deposits. Since these findings are solely laboratory-based, it should be noted that the determined threshold fines content and consolidation behavior may alter in field-scale deposition.

1. Introduction

With about 167 billion barrels of oil that can be economically recovered under current economic and technological conditions, Canada is the fourth-largest oil producer in the world. Ninety-seven percent of Canada’s proven oil reserves are found in oil sands [1]. Using trucks and shovels, about 20% of Alberta’s oil sands deposits can be extracted and transported to facilities where steam is used to separate and recover bitumen from sand [1,2].
Oil sands tailings are mixtures of water, residual bitumen, silts, clay, trace metals, salts, and other hydrocarbons that are produced during the bitumen recovery process from oil sands. For each barrel of bitumen produced during the recovery process, roughly 0.25 m3 of fine tailings and 1 m3 of sand are produced [3]. Sand separates and deposits to form beaches next to dykes during the tailings deposition process, while the remaining slurry is deposited in the pond’s center as fluid fine tailings (FFTs). Fluid fine tailings are defined by Directive 85 as any fluid waste from bitumen extraction facilities that has an undrained shear strength of less than 5 kPa and more than 5 percent suspended solids by mass [2]. They contain fines dominated by clay minerals, primarily illite and kaolinite, as well as illite–smectite mixed layers [4]. Fluid fine tailings are highly dispersive and require an extensive period to dewater and consolidate; in the absence of mediators, it may take decades for them to settle and acquire the necessary strength. The total volume of FFT in the Athabasca oil sands region has increased as a result, reaching 1392 Mm3 by the year 2022 [2]. In order to comply with closure and regulatory requirements, these deposits must be managed.
According to a number of studies on different sand–fines mixtures, the proportions of sand and fines in these mixtures have a significant impact on forecasting their geotechnical behavior [5,6,7,8,9,10]. The general conclusion has been that the maximum density of the mass increases as the fines/clay fraction rises, up to the point where voids begin to become overfilled with fines. After this, the granular structure begins to expand, and the susceptibility of the fines–water system determines the geotechnical properties.
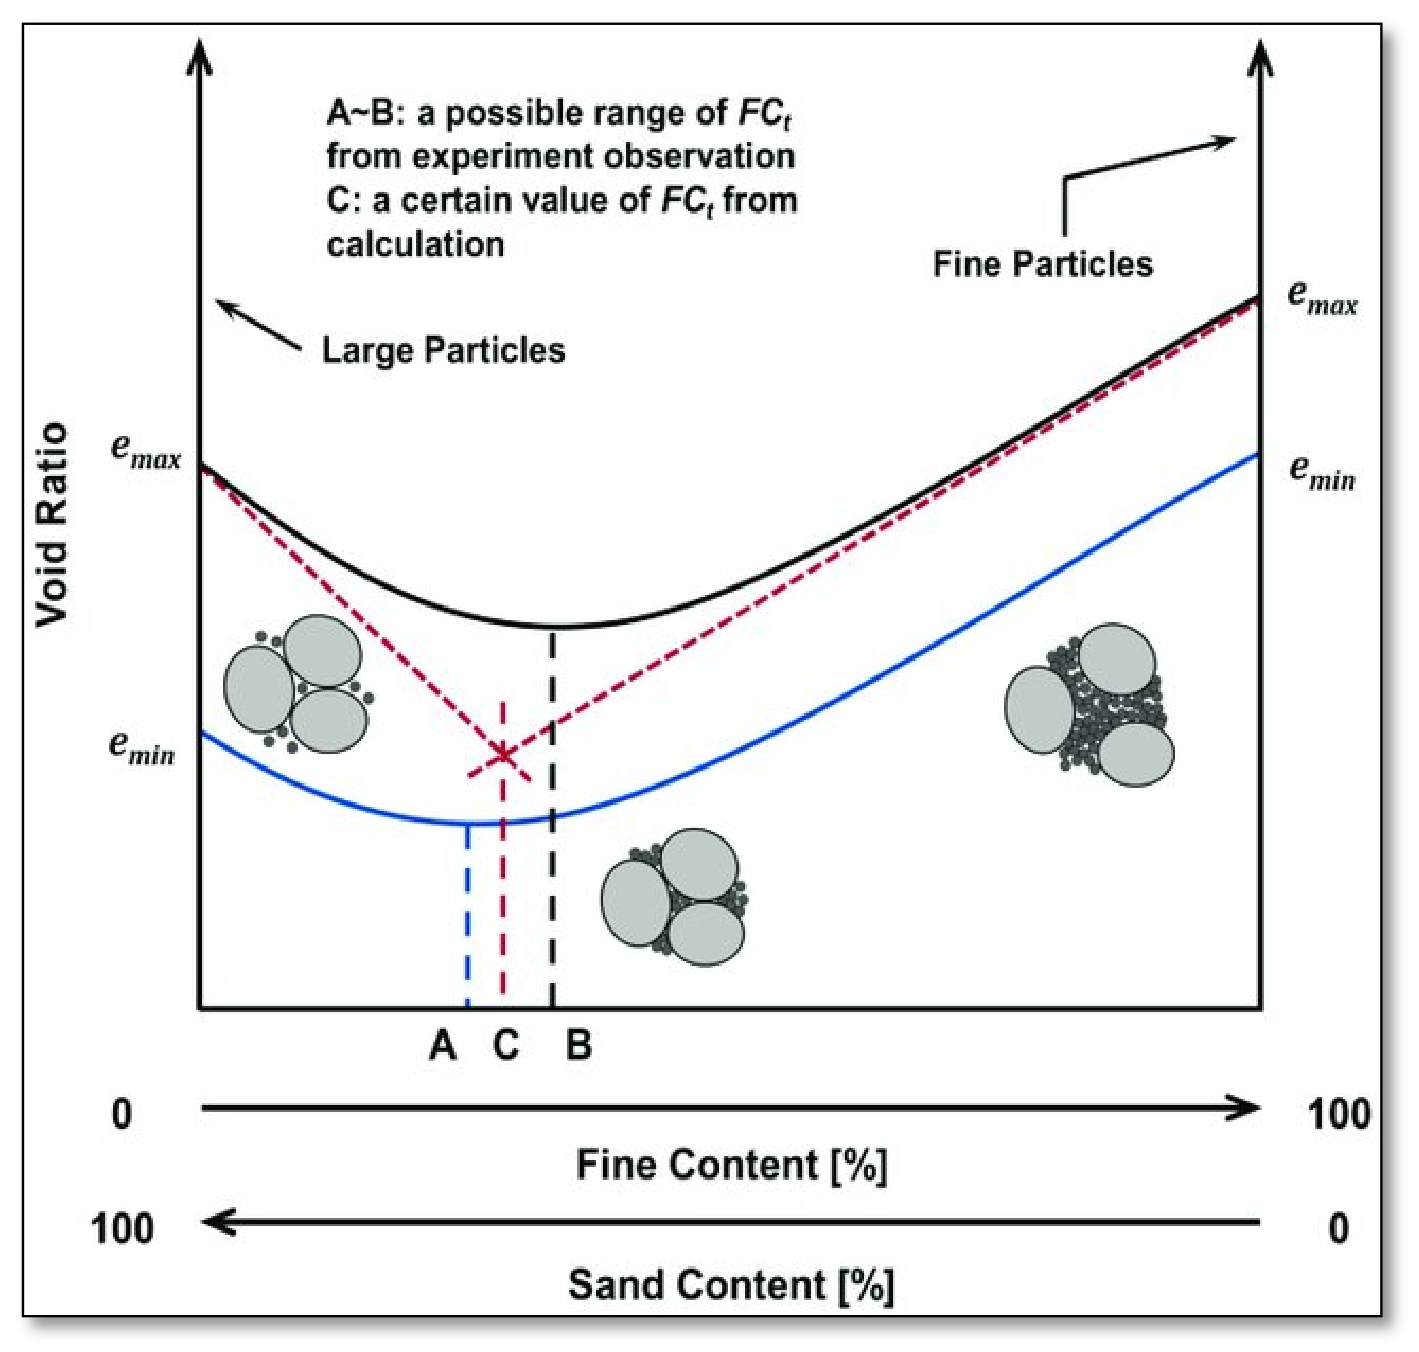
According to these studies, mixtures of sand and fines would behave like sand at low fines contents and like fines at high fines content. Transitional or threshold fines contents are the global fines contents at which the minimum and maximum global void ratios of the mixture shows a trough, as shown in Figure 1. It is the limit at which behavior shifts from sand-like to fines-like. Depending on the measured engineering properties, such as compressibility, cohesion, frictional angle, etc., the threshold fines content for the same sand–fines mixture may vary [11].
The behavior of the soil and the point at which it changes from sand-like to fines-like can also be influenced by other variables like the kind of clay mineral that is present, the distribution of particle sizes, and the organic content of the soil. Therefore, when determining this limit, it is crucial to take into account the particular experimental properties being measured as well as the properties of the soil in question. The determination of this limit for specific deposits is essential to predict their engineering behavior. Oil sands tailings deposits are divided into four main categories by the Unified Oil Sands Tailings Classification System: sand, sandy fines, transition, and fines zones [12]. Fines are defined as solid particles smaller than 44 µm in size. The sand–fines ratio (SFR) and fines content defining tailing deposits in the transition zone range from 1 to 3 and 25% to 50%, respectively.
The transition zone includes some of the tailings deposits found in oil sands mine sites today, such as some thickened tailings (TTs) [13,14], composite tailings (CTs) and non-segregating tailings (NSTs) that result from co-deposition of sand and FTs to prevent segregation and speed up consolidation [13,15]. There is currently little research on transitional oil sands tailings deposits, making it challenging to forecast their consolidation and filterability behavior. Depending on the quantity and characteristics of the fines present, they might be too fine to behave as cohesionless and incompressible soils or too sandy to behave as cohesive and compressible soils.
The fines fraction is one of the determining factors, according to earlier research on the consolidation behavior of sand–fines mixtures. After examining the compressibility of crystalline powders with various particle sizes, Huffine and Bonilla [16] came to the conclusion that fine particles experience a larger volume change than large particles. Additionally, an experimental study on the compressibility of sand–fines mixtures by Lade et al. [5] showed that compressibility increased as fines increased from 0% to 100%. Fan et al. [17] conducted an experimental study on sand–silt tailings mixtures with fines ranging from 0 to 100 percent and demonstrated a significant drop in hydraulic conductivity with an increase in fines up to 50 percent, which then stayed constant with fines above 50 percent. A similar study by Fan et al. [17] demonstrated that compressibility increased with fines throughout the range, albeit with varying responses, which is comparable to the pattern noted by Watabe et al. [18] on clay–sand blends. Watabe et al. [18] came to the conclusion that any increase in sand content would decrease compressibility without affecting hydraulic conductivity for sand–clay mixtures with high fines content. On the other hand, an increase in fines will significantly reduce hydraulic conductivity for mixtures with low fines content, resulting in sand skeletal structure, while compressibility is essentially unaffected According to a study by Bandini and Sathiskumar [19] on sand–silt mixtures containing 0 to 25 percent, the coefficient of consolidation and hydraulic conductivity decreased as fines increased up to 25 percent. Similarly, studies on sand and non-plastic silts mixtures by Thevanayagam [20] and Sathees [21] showed that the coefficient of consolidation and hydraulic conductivity decreased as fines increased up to 15%, but the coefficient of compressibility was not significantly affected by silts. Jeeravipoolvarn et al. [22] used fine tailings–sand mixtures with 18% and 52% fines content in a 10 m standpipe test and concluded that the internal surcharge effect of the added sand causes fine tailings mixed with sand to undergo faster self-weight consolidation than fine tailings alone.
Few studies have examined the effects of clay mineral activity on the compressibility and hydraulic conductivity of sandy fines soils, aside from the influence of the quantity of fines included. Swelling clays like montmorillonite, a 2:1 clay mineral, have demonstrated low hydraulic conductivity and high swelling potential due to their large specific surface area, while kaolinite, a 1:1 clay mineral, has demonstrated less compressibility and higher hydraulic conductivity [23,24].
Although it is generally expected that the permeability and filterability of transitional oil sand tailings will decrease with an increase in fines content until a threshold point is reached, beyond which they would remain nearly constant, it is still crucial to understand how these mixtures’ clay mineral properties affect their permeability. Similarly, clay mineral properties are crucial for deposit compressibility prediction, even though previous research has indicated that an increase in fines below the threshold limit does not appear to have a significant effect on compressibility due to the existence of sand skeletal structure, while an increase in fines above the threshold value will result in increased compressibility.
The impact of fines fraction and clay mineral activity on the consolidation behavior of transitional oil sands tailings is not well understood based on current research. In order to properly predict the performance of these tailings, this study aims to examine the impact of fines and their index properties on the filterability and consolidation behavior of these tailings.

2. Materials and Methods

The experiment design and methodology in this section are based on the main author’s PhD research work [25], from which this paper originates.

2.1. Materials

Mature fine tailings (MFT) and sand (SD) were combined to create test samples with fines contents that fell within the oil sands tailings transition zone, with a sand–fines ratio (SFR) between 1 and 3 according to the Unified Oil Sands Tailings Classification System [13]. In this study, SFR is defined as the mass of mineral solids with particles larger than 44 µm divided by the mass of mineral solids with particles smaller than 44 µm, as used in the oil sands industry [15]. The two types of materials used in this study are characterized and uncharacterized. In the uncharacterized group, two types of MFT (MFT 97.1/1.0 and MFT 89.6/1.3) and two types of sand (SD 74.1/132.5 and SD 109.9/252.9) were combined to create mixtures with fines contents ranging from 25 percent to 50 percent at intervals of 2 percent. The prefixes MFT and SD are followed by numerical characters in the form XX.X/YY.Y in the naming of these base samples. Regarding MFT, XX.X and YY.Y stand for the percentage of fines and bitumen content, respectively. While for SD, XX.X represents D10 and YY.Y represents D50 values in µm, as shown in Table 1 where MBI stands for Methylene Blue Index.
The selected fines content range (25% to 50%) and corresponding SFR values (3 to 1) were chosen to represent the transition zone as defined by the Unified Oil Sands Tailings Classification System, ensuring that the experimental program captures the most critical range of behavioral change.
A characterized group of mixtures was created with particular fines contents, and their index properties were then examined. The prefix SM in their names denotes mixtures of sand and MFT, while SMK denotes a sample of sand, MFT, and kaolinite (Speswhite China clay). Following the prefix, numeric characters follow the format XX-Y.Y, where XX represents the percentage of fines and Y.Y represents each mixture’s Methylene Blue Index (MBI) value.

2.2. Methods

2.2.1. Sample Preparation

In order to create mixture samples with fine contents that fall under the category of transitional oil sands tailings, sample preparations involved mixing fluid tailings and sand in predefined proportions. Before a necessary quantity was scooped, weighed, and transferred to a mixing container, fluid tailings were homogenized in their original pails using a drill mixer. Before weighing the necessary amount of sand and adding it to the mixing container with fluid tailings, any debris was checked and removed. A drill mixer was used for ten minutes to homogenize the mixture. Every time a sample from the prepared mixture was required, it was ensured that initial homogenization occurred. In order to prevent any segregation during the test, all mixtures were made with solids contents below their respective segregation thresholds. If the resulting fluid tailings–sand mixtures showed higher water contents above segregation lines, excess water was filtered out using a particular resistance to filtration press setup, and the remaining mixture was re-homogenized in preparation for further testing. Deionized water was added to a sample SMK 43–1.6 with kaolinite addition in order to attain the desired sixty percent solids content.

2.2.2. Particle Size Distribution (PSD)

To establish mixing ratios that would result in mixtures with predetermined SFRs, the particle size distribution (PSD) of received CST and FT was characterized. For solids with particle sizes larger than 44 µm, PSD was determined using the sieve analysis method [26], while particles smaller than 44 µm were analyzed using laser diffraction [27]. The cumulative percentage of particles < 44 µm from the sieve measurements, as defined in the oil sand tailings industry, was considered as the fines content from PSD. Clay contents (<2 µm) were determined from the laser diffraction PSD, where the cumulative percentage of particles < 8 µm was taken as an average value corresponding to <2 µm particle size in sieve analysis. This accounts for the effect of the platy shape of particles in laser diffraction analysis, as per the study by Konert and Vandenberghe [28].

2.2.3. Atterberg Limits

The samples’ plasticity was assessed using Atterberg limits tests. Tests were conducted in accordance with ASTM D4318–17 [29]. Instead of using an oven-drying method, which could cause bitumen cementation and an irreversible change in the samples’ behavior, samples were prepared by slowly drying them down at room temperature. For reliability, tests were conducted on each sample in triplicate, and results from the same sample were found to be repeatable. Table 2 summarizes the Atterberg limits for each sample exploited in this study.

2.2.4. Methylene Blue Index (MBI)

This indicates the amount of Methylene Blue dye that clay can adsorb, which is a measure of the clay’s surface area and cation exchange capacity. A test for measuring MBI for oil sands tailings was created by Sethi [30] and is based on an ASTM modification. Other researchers have conducted additional studies on the application of the method, including [31,32,33]. The same method, consisting of dispersing the sample to ensure homogeneity and acidifying the sample to eliminate the influence of iron oxide hydroxides on the methylene blue titration, was used to titrate the sample and to determine the end point, which is shown by the blue halo. MBI is quantified as milliequivalents of MB required to adsorb 100 g of sample, given the amount of milliliters of Methylene Blue used to adsorb the sample with known mass.
Despite the lack of quantitative mineralogical characterization methods like X-ray diffraction (XRD) in this investigation, the Methylene Blue Index (MBI), which measures specific surface area and cation exchange capacity, provides an indirect but functionally relevant indicator of clay activity. Since these parameters are directly related to the interparticle physicochemical interactions that control consolidation behavior and hydraulic conductivity, MBI is a functionally relevant indicator for this investigation.

2.2.5. Bitumen Content

The Dean–Stark extraction method, which entails refluxing toluene through the sample to dissolve bitumen and then heating the sample and solvent containing the dissolved bitumen to cause the solvent and water to rise as vapor and be trapped by the condenser while leaving solids in the thimble, was used to measure the bitumen content.

2.2.6. Specific Gravity

The specific gravity of each sample was determined using a Water Pycnometer in accordance with ASTM D854–14 [34]. All measured values were repeated five times to obtain accurate average values.

2.2.7. Capillary Suction Time

Since its development in 1967 by Baskerville and Gale at the Water Pollution Research Laboratory in England [35,36], the capillary suction time (CST) apparatus has been used to test the dewaterability of materials in a variety of fields, including the oil sands tailings industry [37,38,39,40]. Knowing the dewaterability of tailings is crucial because it establishes the anticipated volume change in deposits, emphasizing both the environmental impact of tailings and the cost of disposing of these materials. It is crucial for the planning and construction of dewatering facilities.
Two distinct groups of MFT and sand mixtures were created in order to achieve the first goal of figuring out the threshold fines content value for hydraulic conductivity of transitional oil sands tailings. Each group was intended to have samples with varying fines content from 25% to 50% at intervals of 2%.
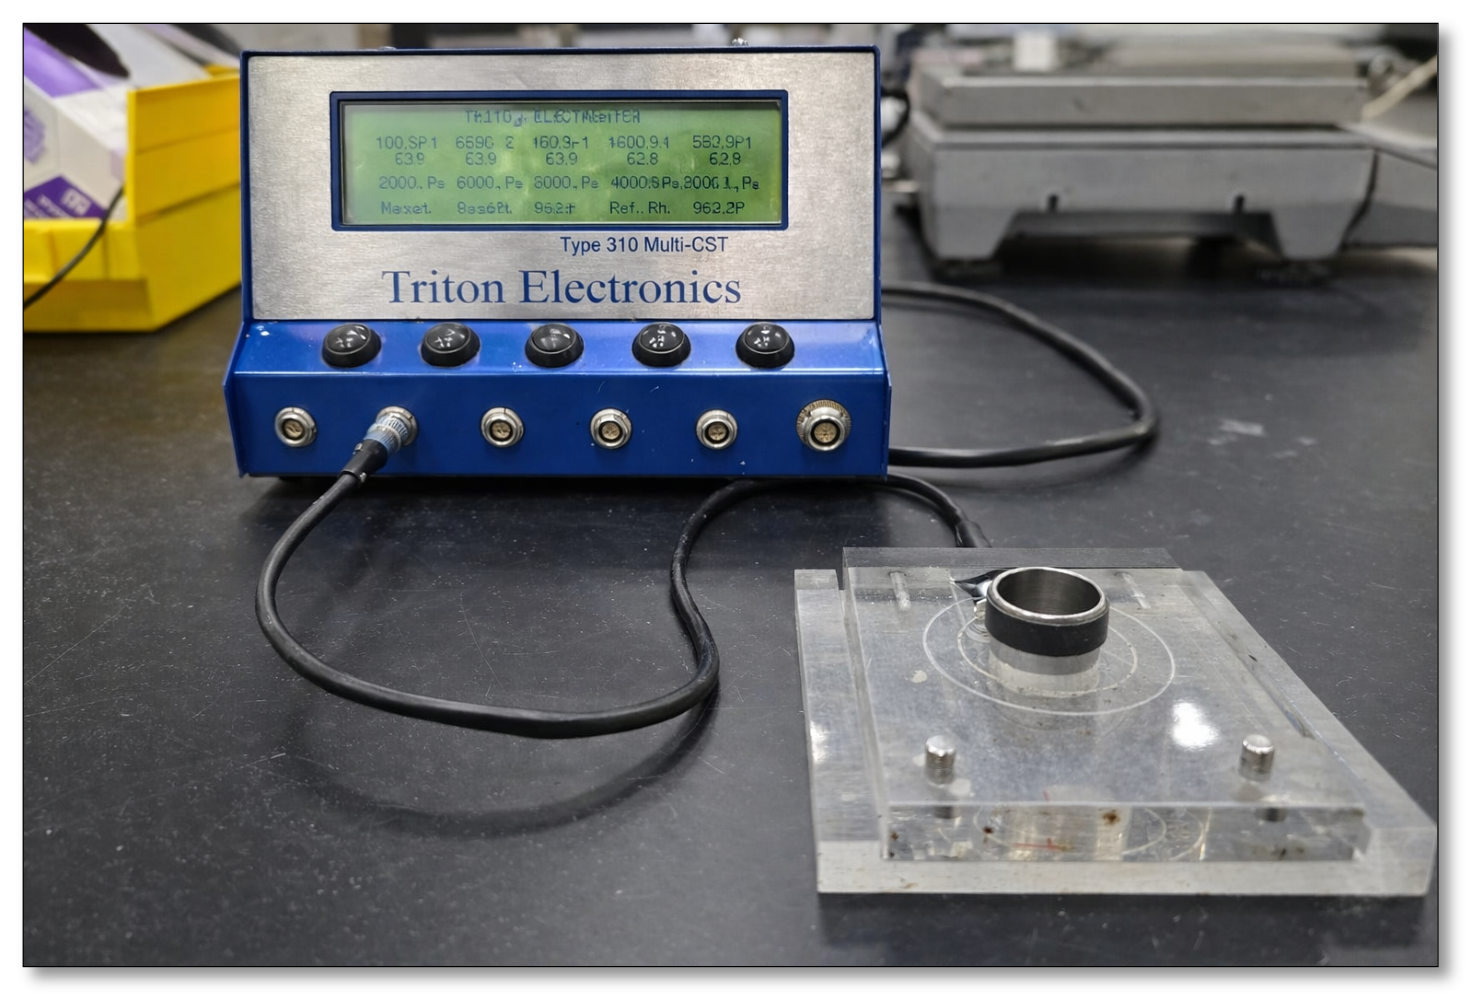
Each sample underwent a capillary suction test (CST) using a Triton Electronics’ Type 319 Multi-purpose CST apparatus (Triton Electronics Ltd., Dunmow, UK), as illustrated in Figure 2. A stainless-steel collar, lower and upper Perspex blocks, an electrical timer, three electrical contacts installed inside the upper Perspex block, and filter paper make up capillary suction time. The stainless-steel collar is inserted into a hole in the Perspex plastic block, while the filter paper is positioned between the two Perspex blocks. The stainless-steel collar is filled with the slurry to be tested, and the water that drains from the slurry passes through the filter paper, covering the collar in a circle. The first two electrical contacts are struck after 0.8 cm of flow past the collar edge, starting the timer. The flow then continues for 0.7 cm before hitting the third electrical contact, which ends the timer [41]. Slurries that release water slowly will have a higher CST than those that release water quickly. The timer measures and reports the amount of time it takes for water to blot between the two points.

2.2.8. Specific Resistance to Filtration/Filterability Test

The technique is used to gauge the resistance of the formed oil sands tailings cake to the water flow during filtration. Specific resistance to filtration (SRF), also known as Filtration Resistance, is a measure of suspension filterability based on the hydrodynamic concept as derived from Darcy’s law [42]. Laboratory SRF and large strain consolidation (LSC) tests by Ahmed et al. [43] yielded the hydraulic conductivity results that revealed a similar trend of values from the two tests on oil sand tailing samples with different levels of plasticity, although SRF values were roughly one order of magnitude lower than LSC test values. SRF is helpful in evaluating filterability and can be used to estimate the hydraulic conductivity of oil sand tailings deposits due to its speed when compared to the LSC test. The device measures the mass or volume of water released from tailings under applied pressure P (kPa) in a specific amount of time t.
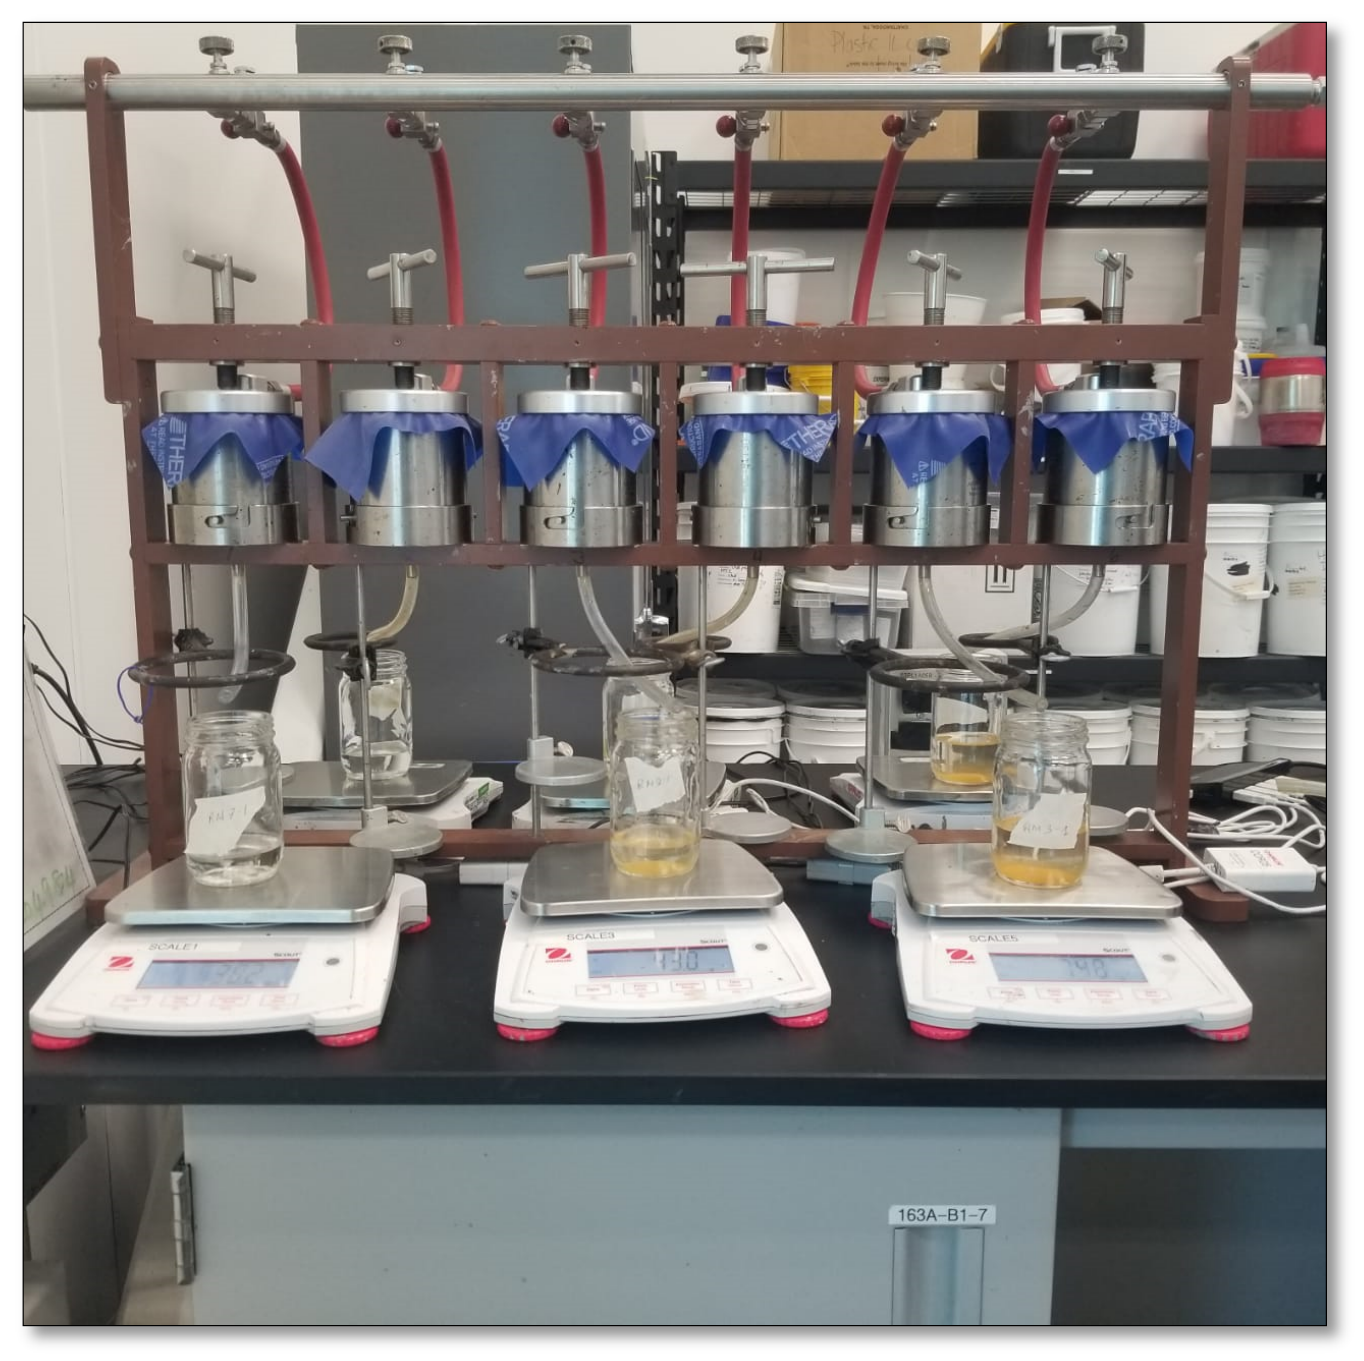
Filter press testing was conducted using an OFITE-modified filter press unit, which consists of a stainless-steel sample cup, Whatman Grade 50 filter paper, a 2.7 µm particle size filtration screen, and a compressed nitrogen supply. Before the sample is fed, filter paper and screen are placed in the bottom of the cup, and then a Teflon piston cylinder is added to prevent cracking. Prior to the lid being cramped and compressed air being supplied to the system, a rubber membrane is placed on top of the cup. Water begins to drain from the bottom of the cup due to compressed air, and every minute, a top-loading scale records the total mass of released water. The configuration for a particular resistance to filtration test is depicted in Figure 3.

2.2.9. Multi-Step Loading (Large Strain Consolidation)

The change in soil volume following the dissipation of excessive pore pressure, which is influenced by the material’s hydraulic conductivity and pore pressure gradient, is known as consolidation. During consolidation, soil matrix re-adjustment occurs in response to shifting equilibrium conditions. This re-adjustment is impacted by soil compressibility ( d e d σ ), where e and σ′ stand for void ratio and effective stress, respectively. The traditional one-dimension infinite small consolidation theory, which was created by Terzaghi in 1923, makes the assumption that soils undergo minor deformations and have constant compressibility and consolidation coefficients. Equation (1), which is as follows, is a mathematical representation of this:
u t = C V 2 u d z 2
where C V is the coefficient of consolidation and u, t, and z stand for excess pore pressure, time, and one-dimensional vertical coordinate, respectively. Only primary consolidation, the drop in void ratio as water escapes these voids, is explained by this expression; secondary consolidation, which results from soil fabric rearrangement, occurs after pore pressure has completely subsided [44].
The assumptions of Terzaghi’s infinite small theory are broken for materials that undergo considerable strain during the consolidation process, such as slurries, because of their non-linear hydraulic conductivity and compressibility relationship [45]. Gibson et al. [46] developed a non-linear finite consolidation theory, as in Equation (2). Laboratory experiments and the use of material coordinates to capture significant deformations were used to establish the following nonlinearity relationship:
γ s γ w 1 d d e k 1 + e e z + z k γ w 1 + e d σ d e e z + e t = 0
Koppula [47] developed Equation (3) by rearranging flow and continuity, which Somogyi [48] later revised to Equation (4) relating to effective stress that varies with time.
z + k γ w 1 + e u z + d e d σ σ t = 0
σ t = ( G S 1 ) γ f d ( Δ z ) d t u t
Equation (5), a governing equation for pore pressure, is obtained by combining Equations (3) and (4) as follows:
z k γ w 1 + e u z + d e d σ ( G S 1 ) γ f d ( Δ z ) d t u t = 0
where z stands for vertical coordinate, t for elapsed time, G S for specific gravity, and γs and γw for unit weight of solids and water, respectively.
Tailings will experience significant deformations during consolidation because of the high initial void ratio and water content. The standard odometer is designed for small-strain consolidating materials and employs small-strain (Terzaghi’s infinitesimal) consolidation theory. Therefore, the consolidation test of oil sands tailings is not suitable for the oedometer test.
A large strain consolidation (LSC) test, also known as a slurry consolidation test, has been helpful in overcoming that. This makes it possible to measure hydraulic conductivity during consolidation; the test is a step-loading test similar to the standard oedometer test, which makes it possible to measure the void ratio and effective stress in between each loading step.
The large strain consolidation equation is solved and test results are presented using hydraulic conductivity and compressibility constitutive relationships. Azam et al. [49] as well Berilgen et al. [50] have demonstrated that these two constitutive relationships are described by the following Power Law functions (Equations (6) and (7)), which have converged well in the majority of numerical modeling programs:
e = A σ B
where both B (Unitless) and A(Pa) are power curve-fits derived from field measurements from consolidating deposits or laboratory consolidation tests and
k = C e D
where D (unitless) and C (in m/s) are power curve-fit constants that are also derived from field measurements from consolidating deposits or laboratory consolidation tests.
With the exception of being intended for soils experiencing significant deformations, multi-step-loading large strain consolidation functions similarly to the oedometer test ASTM D2435/D2435M−11 [51]. For this investigation, large strain consolidation cells measuring 20 cm in height and 14 cm in internal diameter were employed. In order to reduce wall friction, cells were initially filled with samples to a height that produced a diameter-to-height ratio of at least 2:1. The sample was loaded after it was set up until consolidation was finished and there were no more changes in volume or pore pressure. At this stage, the sample’s height was noted and utilized to calculate the void ratio associated with this stress. According to ASTM D2434-22 [52], constant head permeability tests were used to measure hydraulic conductivity under the same stress. A new load that was roughly twice the previous one was applied after the compressibility and permeability tests under each load were finished: this process continued until the final load was roughly 500 kPa.

3. Results and Discussion

The following are the findings from the lab and modeling work initially completed in the main author’s PhD research work [25].

3.1. Particle Size Distribution (PSD)

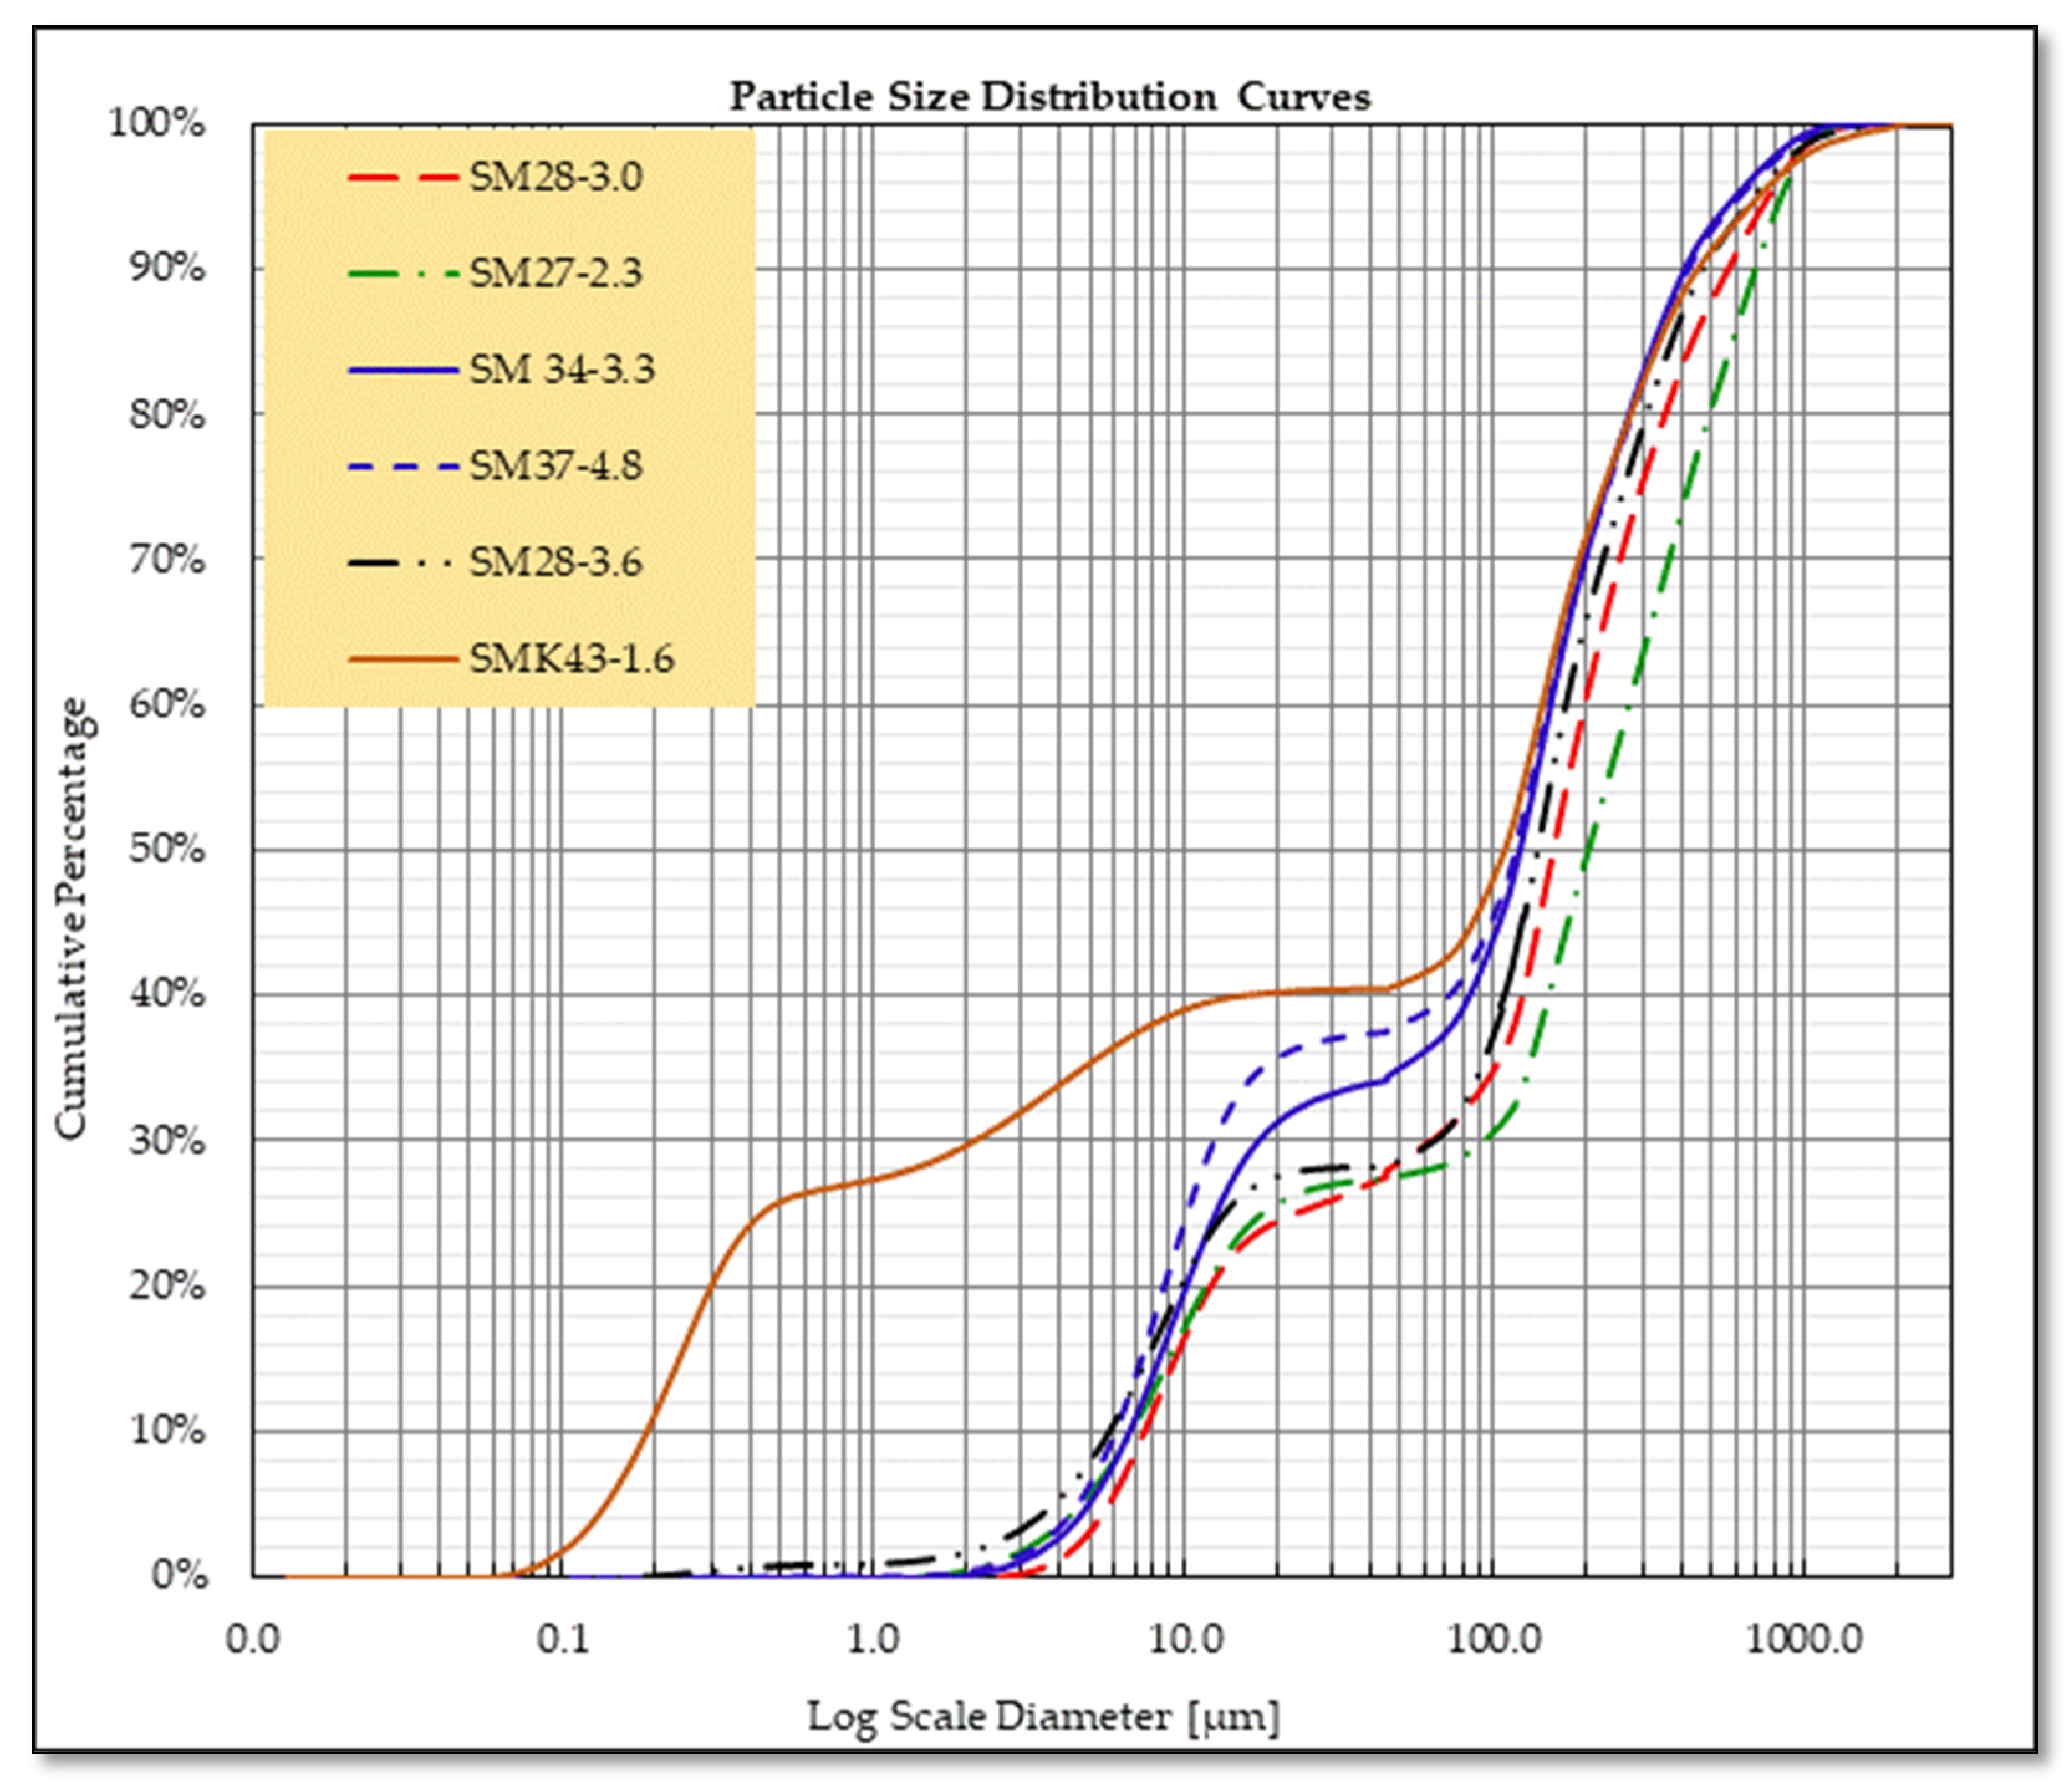
The particle size distribution of the five samples used in this investigation was determined, and the resulting curves are shown in Figure 4. Samples with SFRs between 2.6 and 1.3 and fines contents between 27.5 percent and 43 percent were designed. Table 2 displays various percentiles of particle size for the tested samples.

3.2. Atterberg Limits

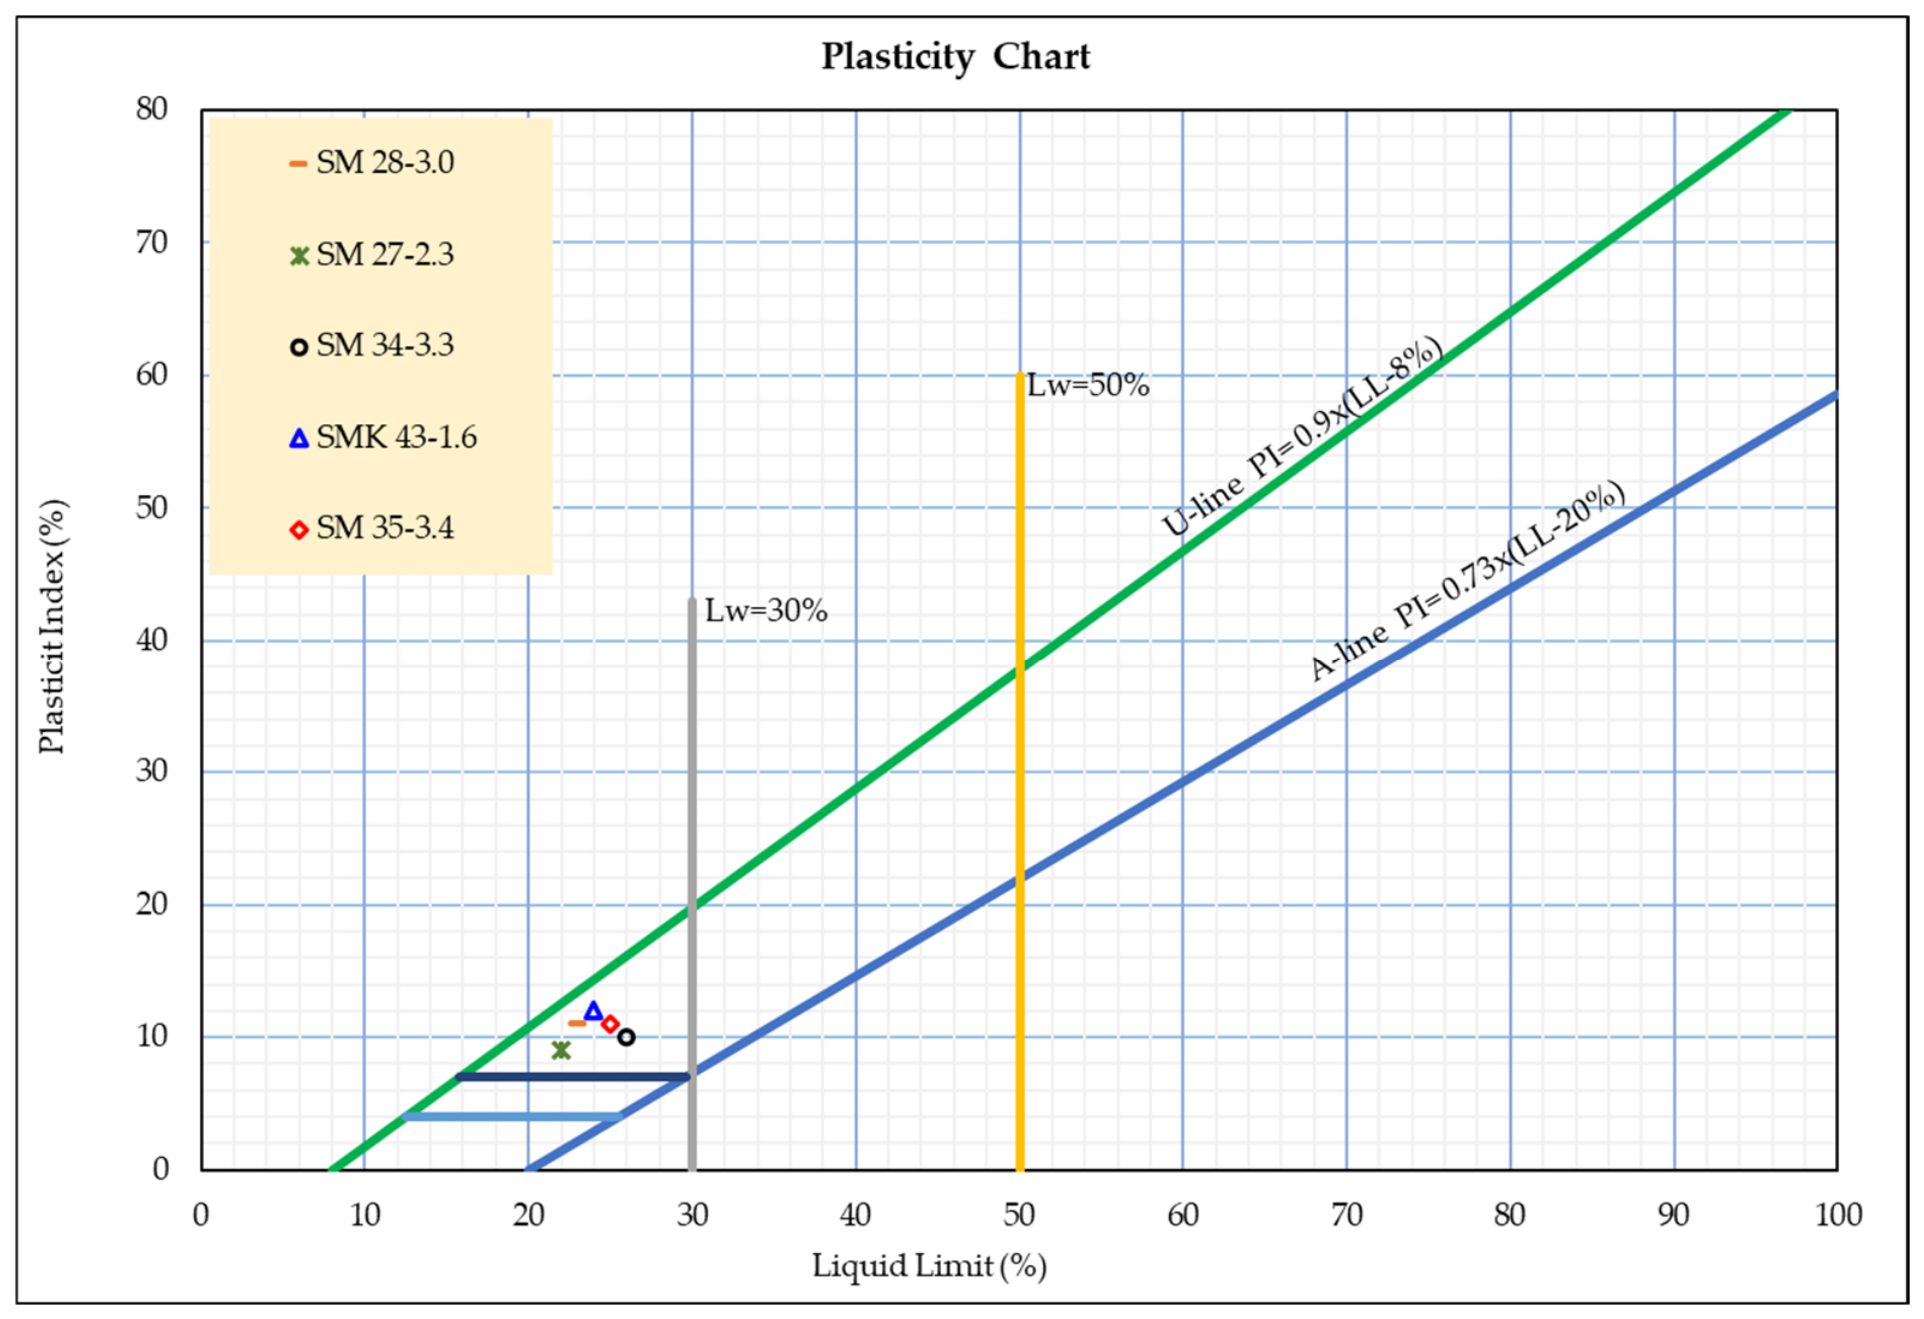
Additionally, samples were evaluated for their Atterberg limits, which are compiled in Table 2. As seen on the plasticity chart presented in Figure 5, all samples did plot above the A-line, which distinguishes between clays and silts; soils above and below the line are classified as clay and silts, respectively. Additionally, they plotted in a zone before a vertical line that represents a 50% liquid limit (LL) that divides low-plasticity (LL < 50%) and high-plasticity (LL > 50%) soils with fine grains. As a result, these samples are classified as low-plasticity soils/samples.

3.3. Fines and Influence on Filterability

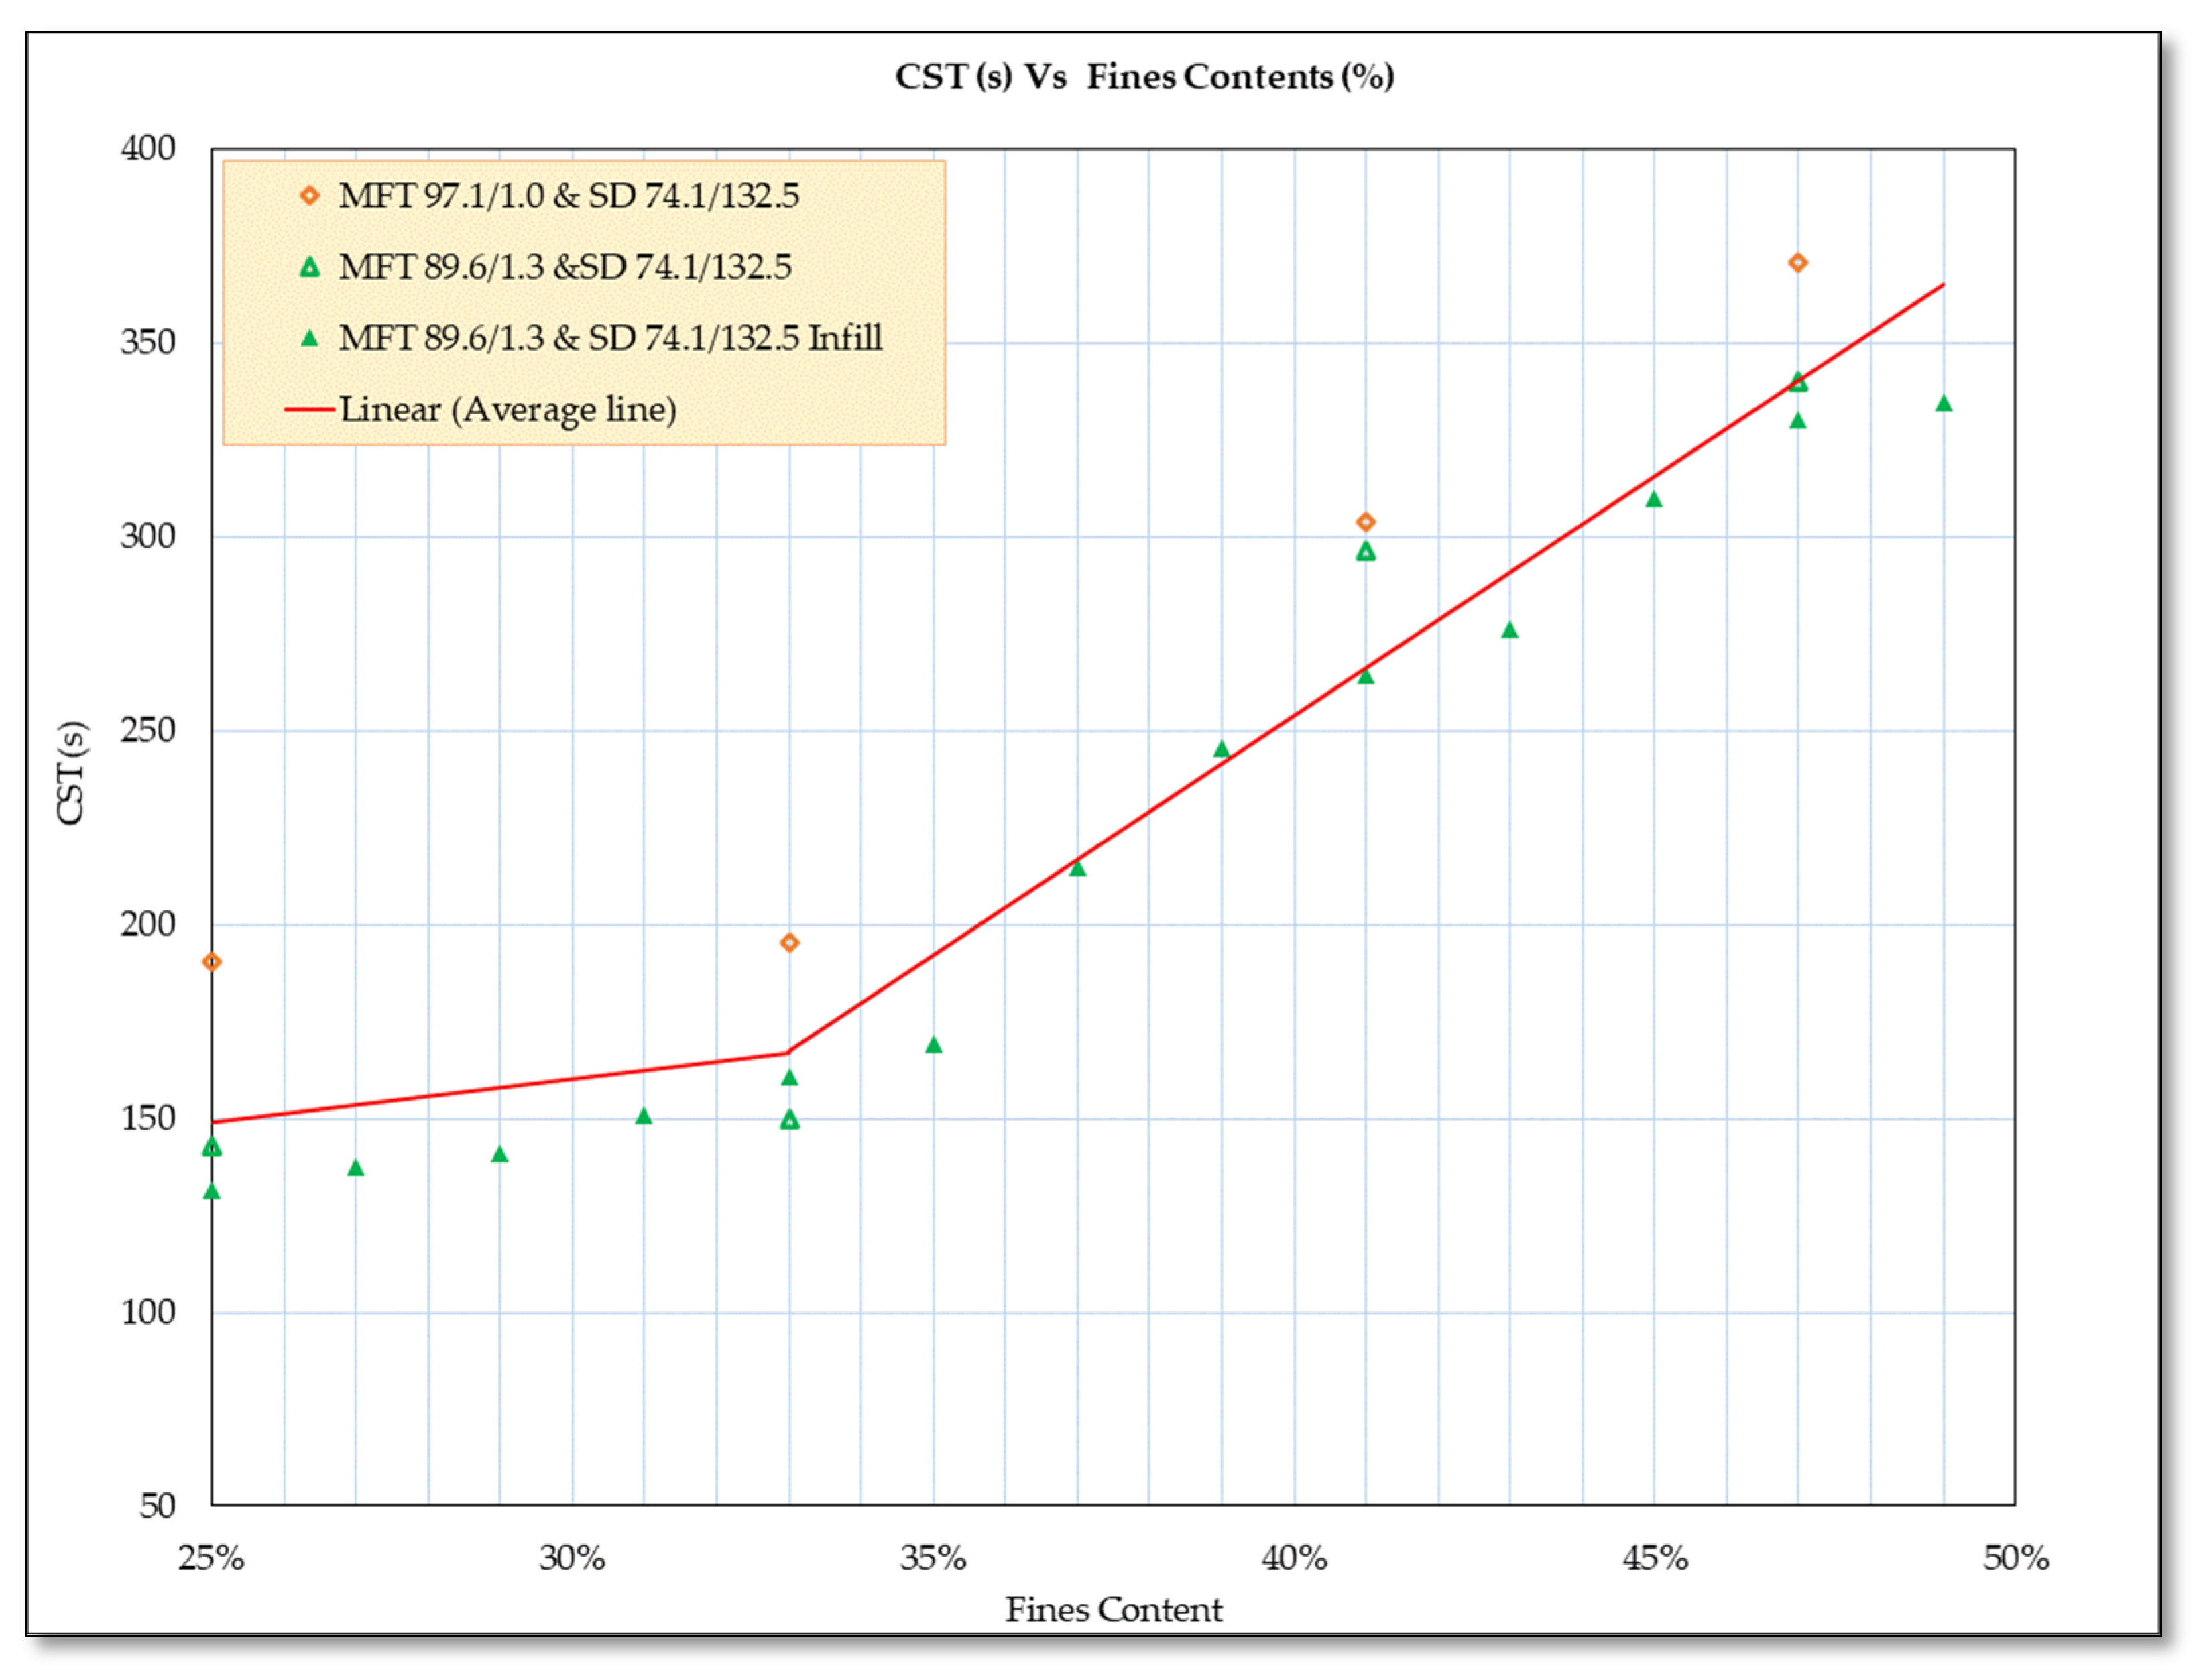
In order to identify the inflection point in dewaterability plots, which can be regarded as threshold fines contents for hydraulic conductivity and consolidation of transitional oil sands tailings, capillary suction time (CST) and filterability tests were performed on samples with closer fines content intervals. The capillary suction time for sand–MFT mixtures with varying fines contents is displayed in Figure 6. Both MFT 97.1/1.0 and SD 74.1/132.5 mixtures and MFT 89.6/1.3 and SD 74.1/132.5 mixtures exhibit a small increase in CST between samples with 25 percent and 33 percent fines, but samples with fines contents greater than 33 percent exhibit a significant increase in CST. These two samples’ trends indicate that the inflection point lies between 33% and 41% of fines. A second round of testing was conducted for MFT 89.6/1.3 and SD 74.1/132.5 mixtures at a lower fines content interval between samples (two percent fines interval) due to the large interval between data points at 33 percent and 41 percent. The results are also displayed in Figure 6, with data series named MFT 89.6/1.3 and SD 74.1/132.5 infill. This time, the trend between this mixture and the MFT 89.6/1.3 and SD 74.1/132.5 mixture aligned fairly well, narrowing the choice for the inflection point to be between 35 and 37 percent fines content.
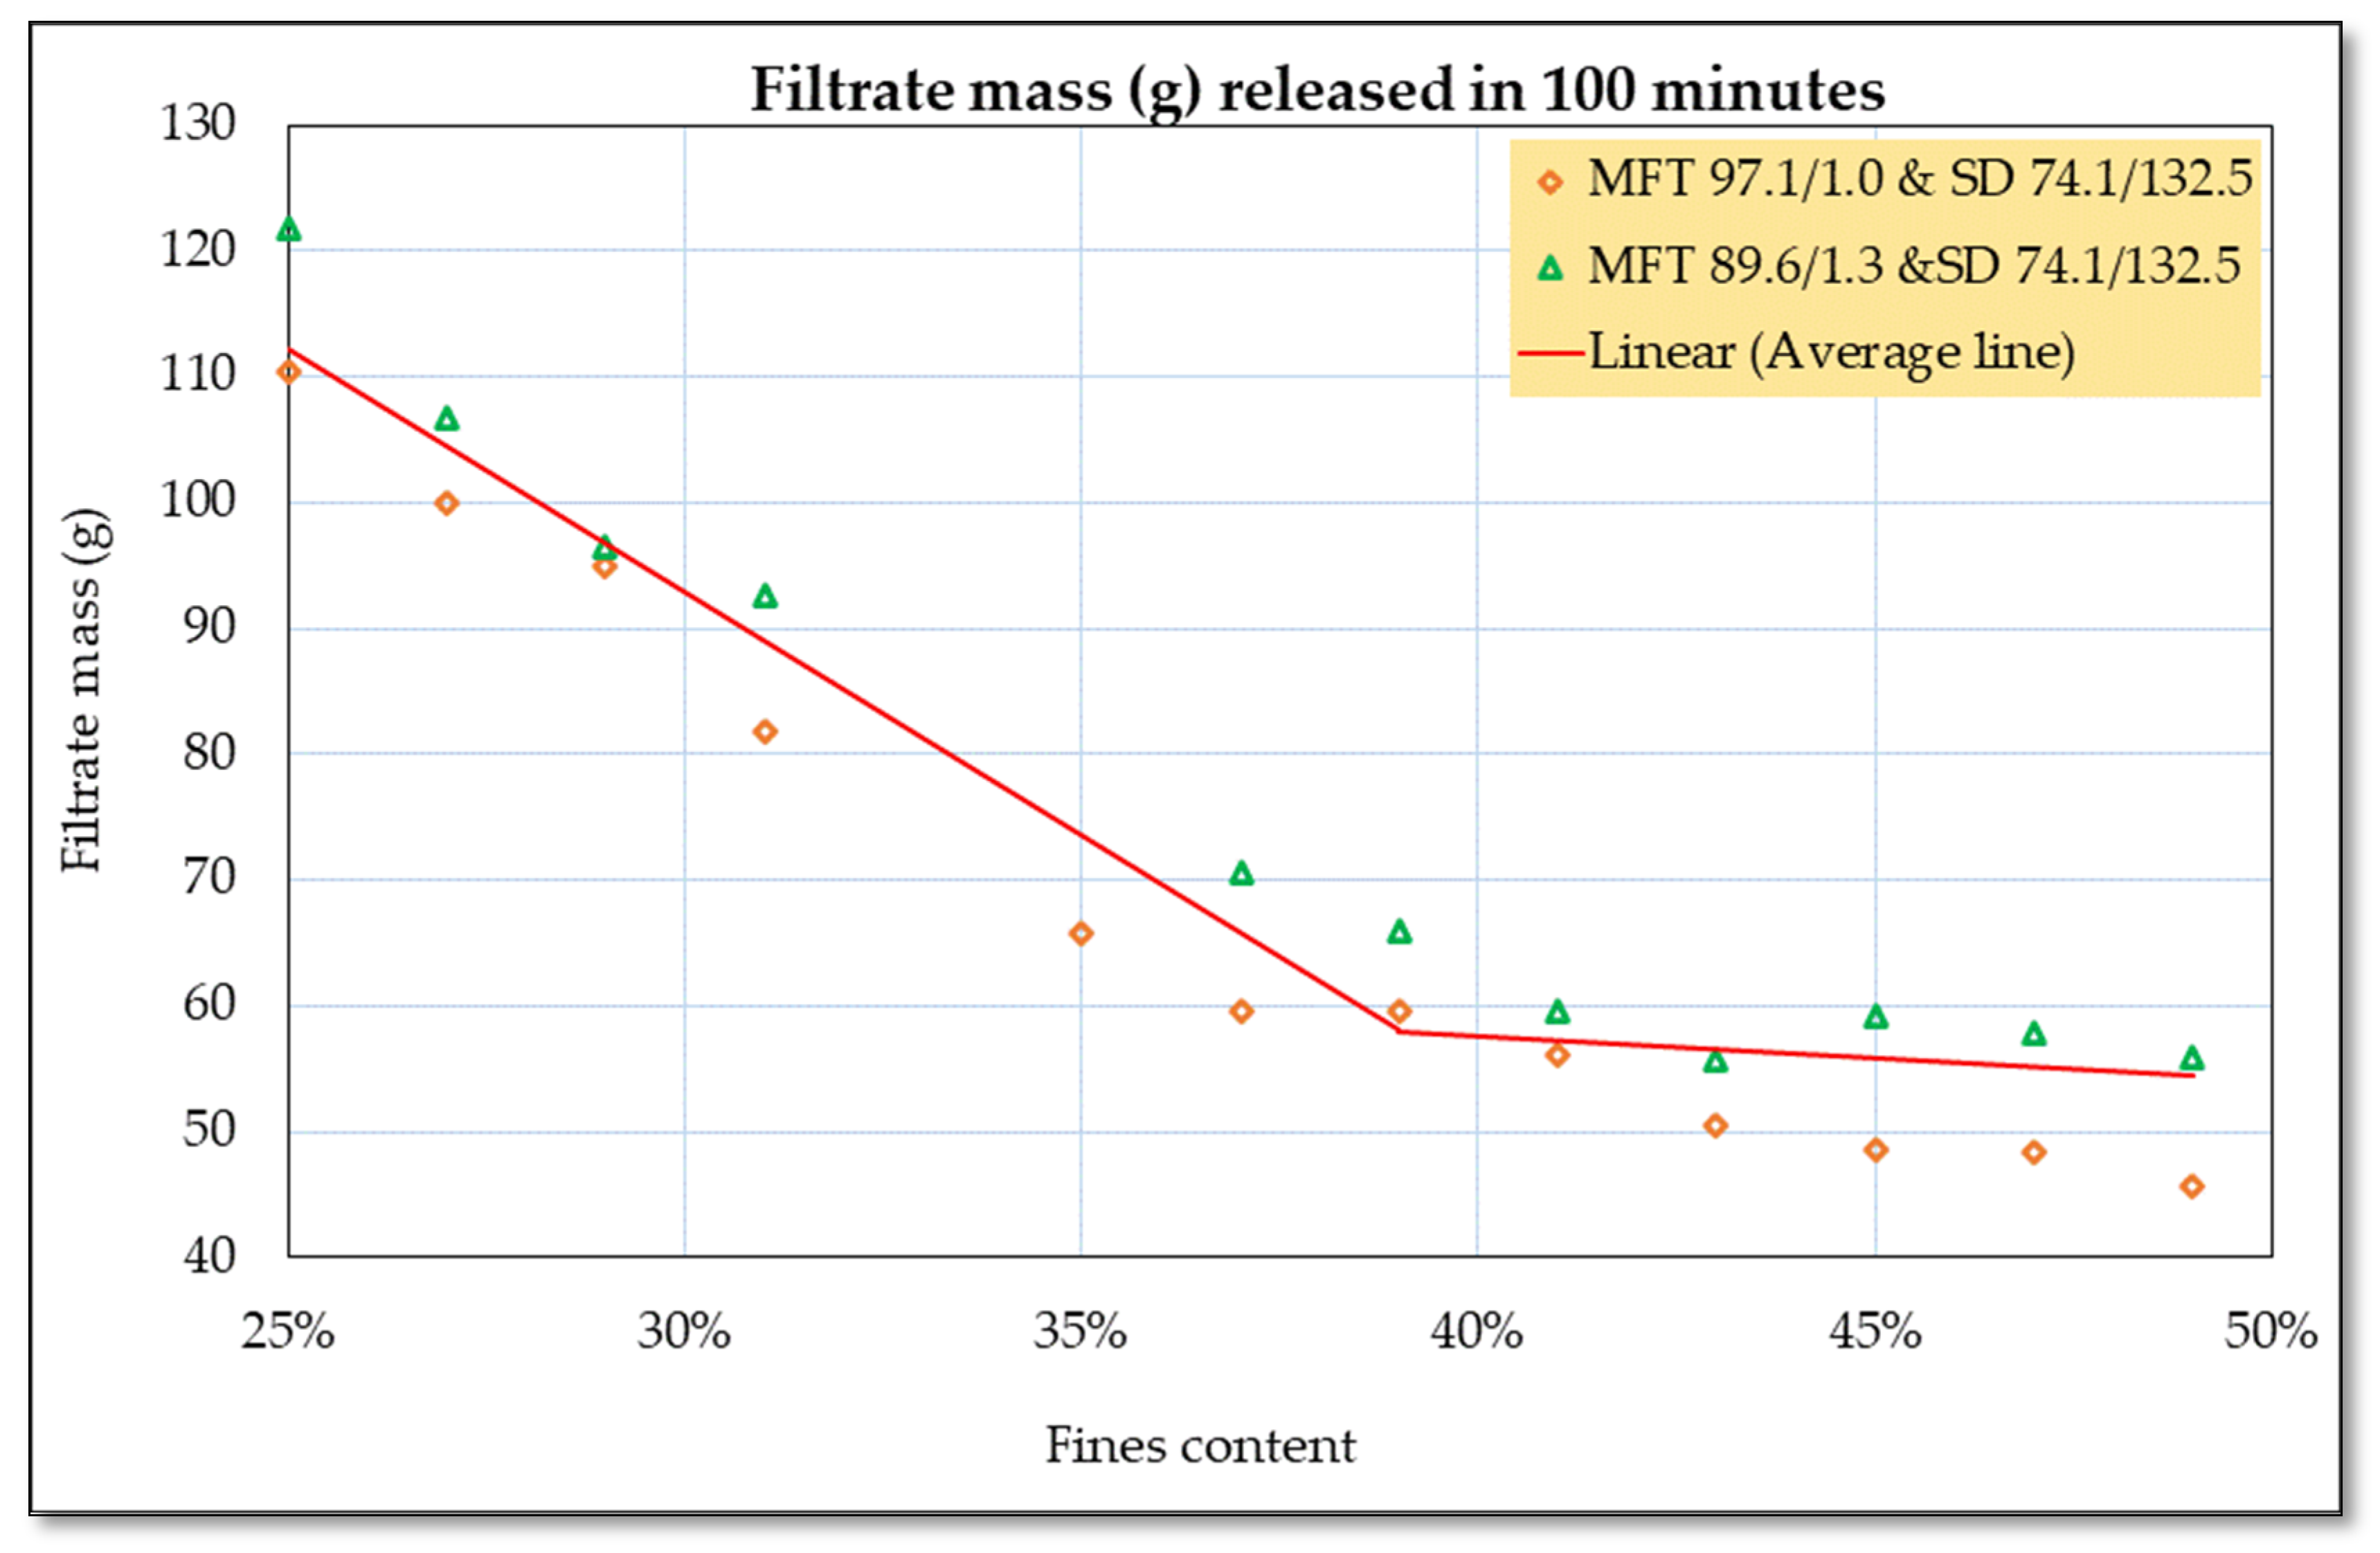
The amount of water released from samples with varying fines contents during a 100 min SRF test using a 300 g sample under 80 Psi compressed nitrogen gas is displayed in Figure 7. As the fines content rises, the amount of water released in 100 min decreases. The amount of water released in 100 min decreases as fines content increases, and the rate of water release decrease is higher when samples contain more than 39 percent fines; moreover, there is a noticeable decrease in the rate of water release between 39 and 41 percent fines and it continues to decrease until almost no more water release occurs.
It is vital to note that the determined threshold values should be interpreted as functional indicators rather than absolute field parameters because they are derived from small lab-scale samples that were tested under controlled laboratory conditions.

3.4. Hydraulic Conductivity and Compressibility

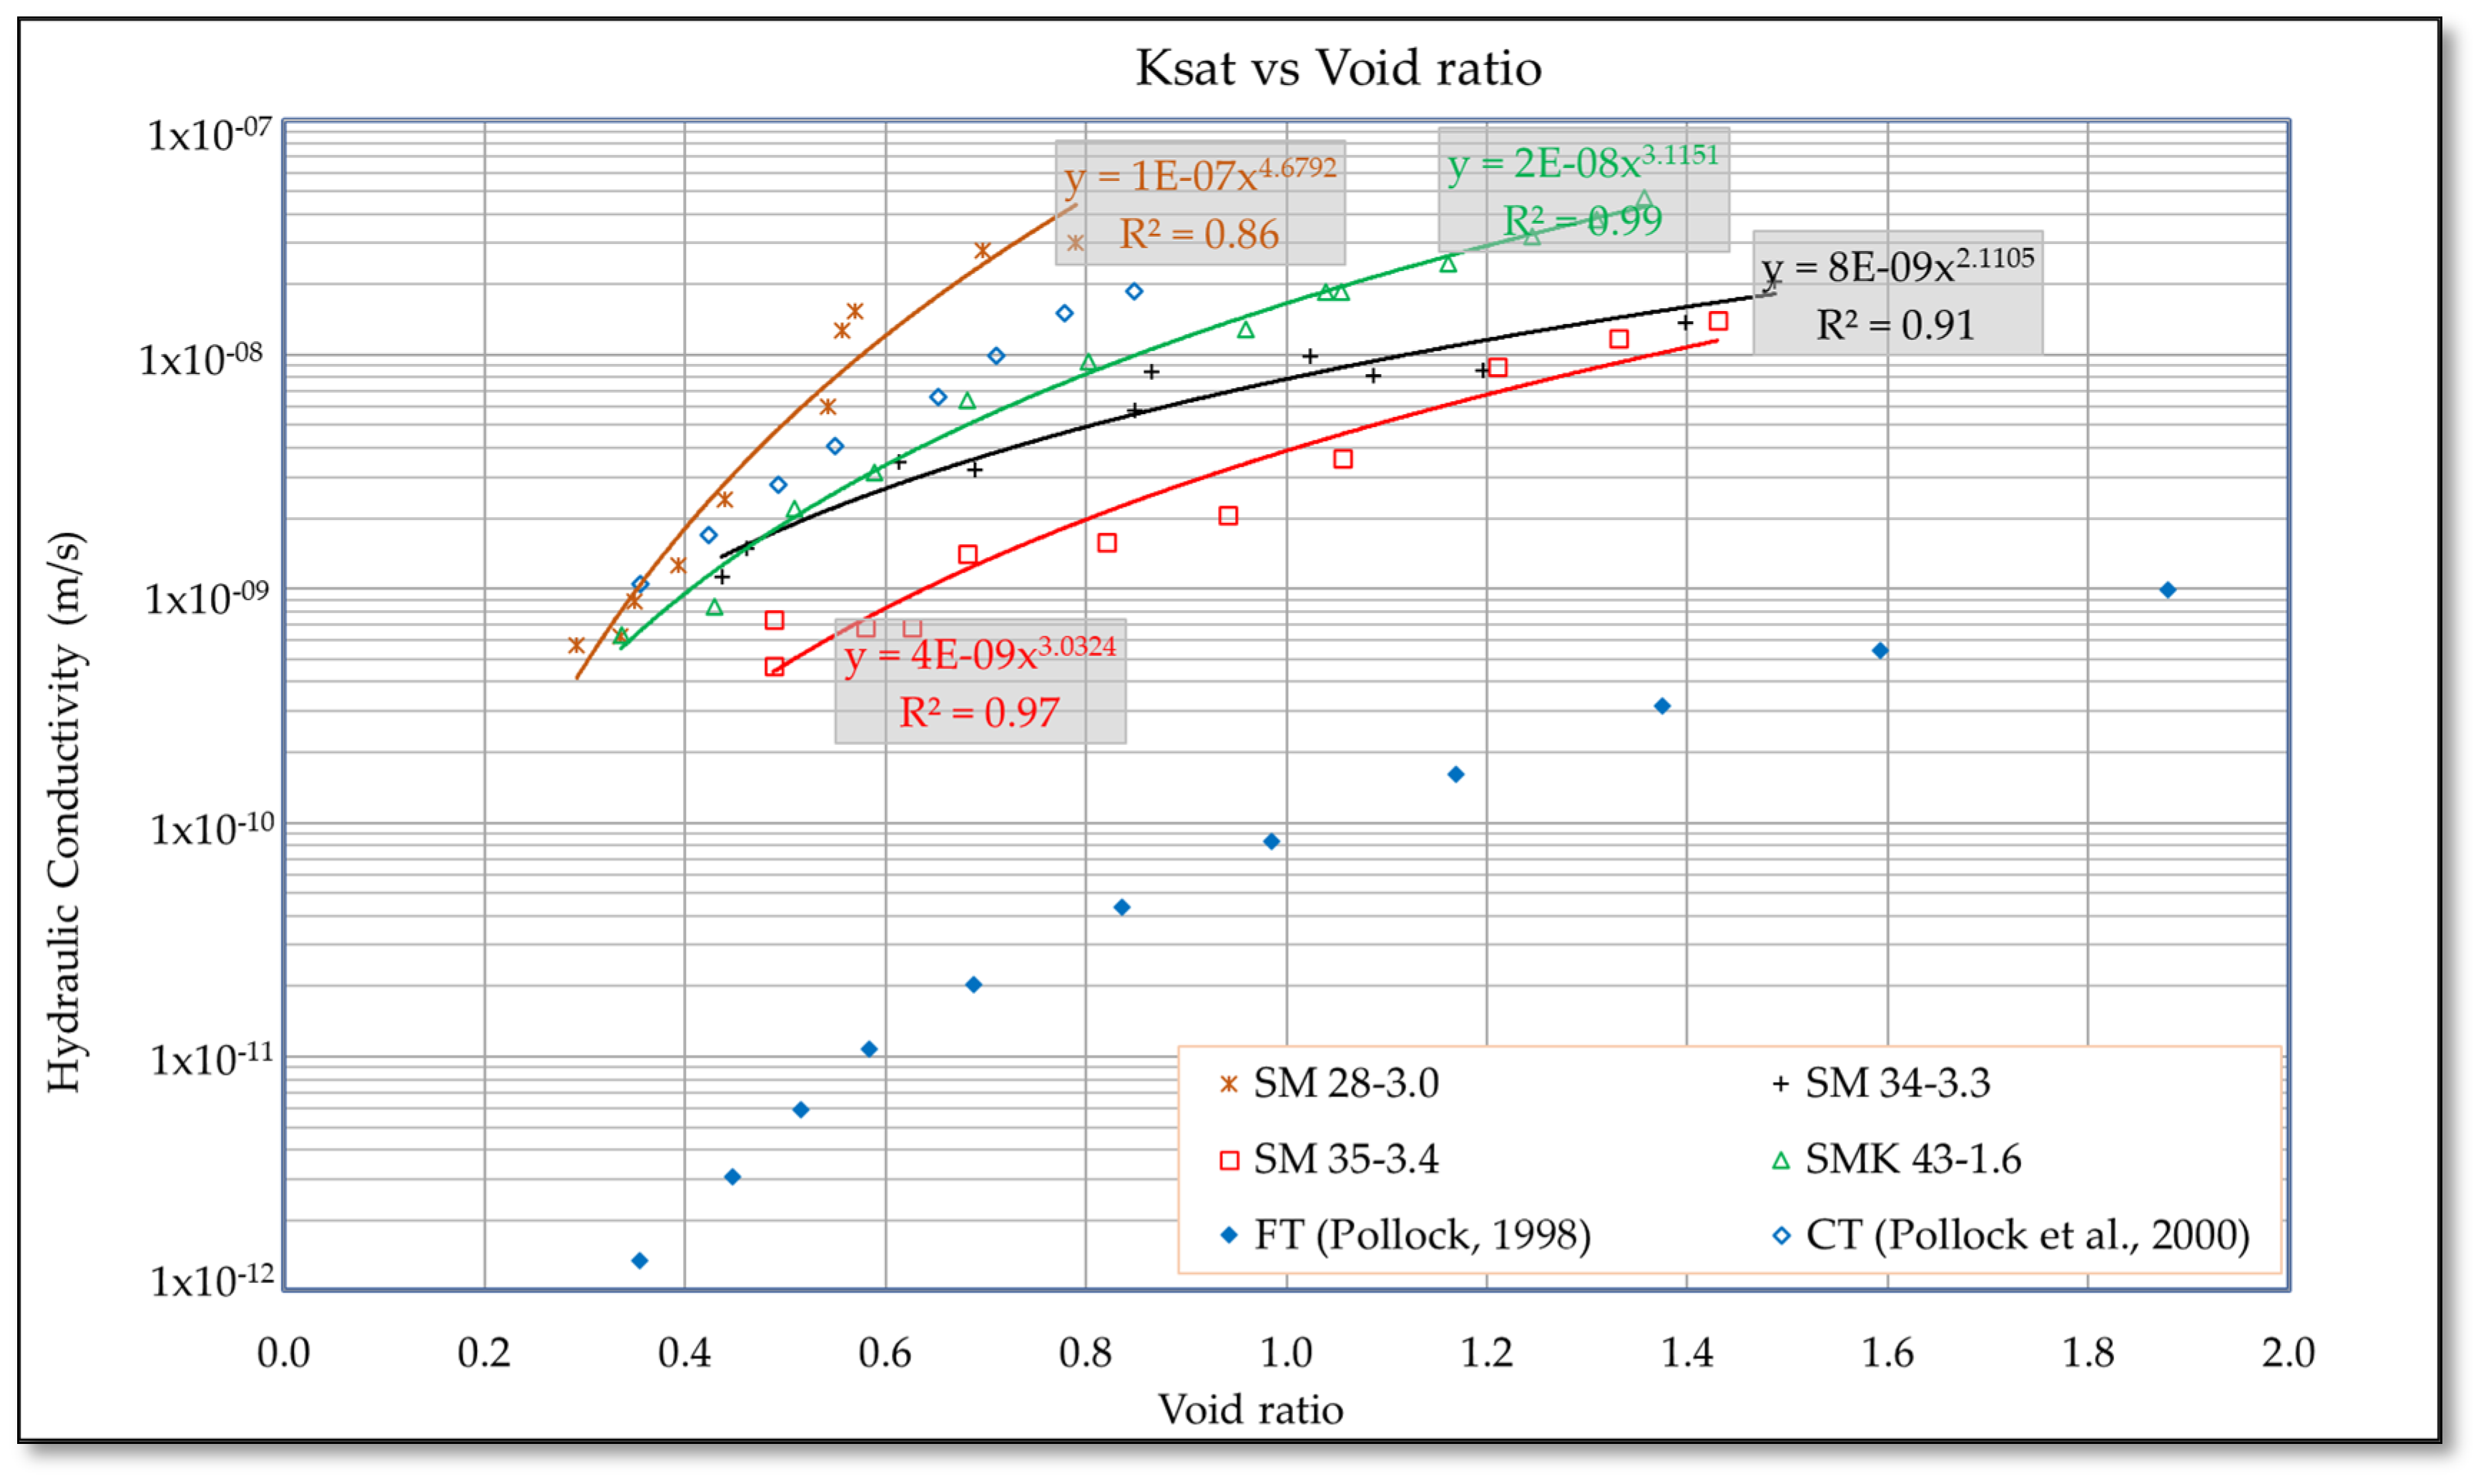
The hydraulic conductivity versus void ratio plots for the examined samples are displayed in Figure 8. Multi-step loading and an increase in effective stresses were attributed to the decline in void ratios. This led to compaction and a decrease in the void spaces between soil particles. Figure 8 shows the results of Falling Head tests used to measure hydraulic conductivity corresponding to the void ratio at the end of each loading. The sample SM28-3.0 exhibits the highest hydraulic conductivity when compared to the other samples at the same void ratio. This sample has enough voids to behave like sand with high hydraulic conductivity because 28 percent of the fines are less than the threshold values, according to the findings in the threshold values of fines required to feel voids of these materials, as described in Section 3.3 of this study. In contrast, samples SM34-3.3, SM35-3.4, and SMK 43-1.6 exhibit lower hydraulic conductivity because their fines contents fall within the threshold value range. Despite having a much higher fines content, sample SMK 43-1.6 exhibits higher hydraulic conductivity than samples SM34-3.3 and SM35-3.4. This may be associated with its low activity and lowest water-holding capacity. Similarly, the lower hydraulic conductivity observed in sample SM35-3.4 relative to SM34-3.3 may be associated with its higher sodium adsorption ratio (SAR), although the effects of SAR cannot be completely separated from fines content and clay activity within this experimental framework. It is likely that higher SAR promoted greater particle dispersion and reduced pore connectivity. Since XRD and SEM analyses were not conducted, these interpretations should be considered inferential and based on observed behavior together with established theoretical understanding reported in the literature. The initial void ratio does not seem to be a determining factor of hydraulic conductivity for these materials at various stresses according to the hydraulic conductivity–void ratio plot. Rather, as effective stress increases, hydraulic conductivity decreases, which can be explained by each sample’s micropore structure. Effective stress causes the soil particles to become tightly packed and rearranged, which narrows the interconnected pore channels that allow water to pass through. Figure 8 illustrates that there is no relationship between the samples’ initial void ratio differences and the rate at which hydraulic conductivity decreases from high void ratio (low stress) to low void ratio (high effective stress).
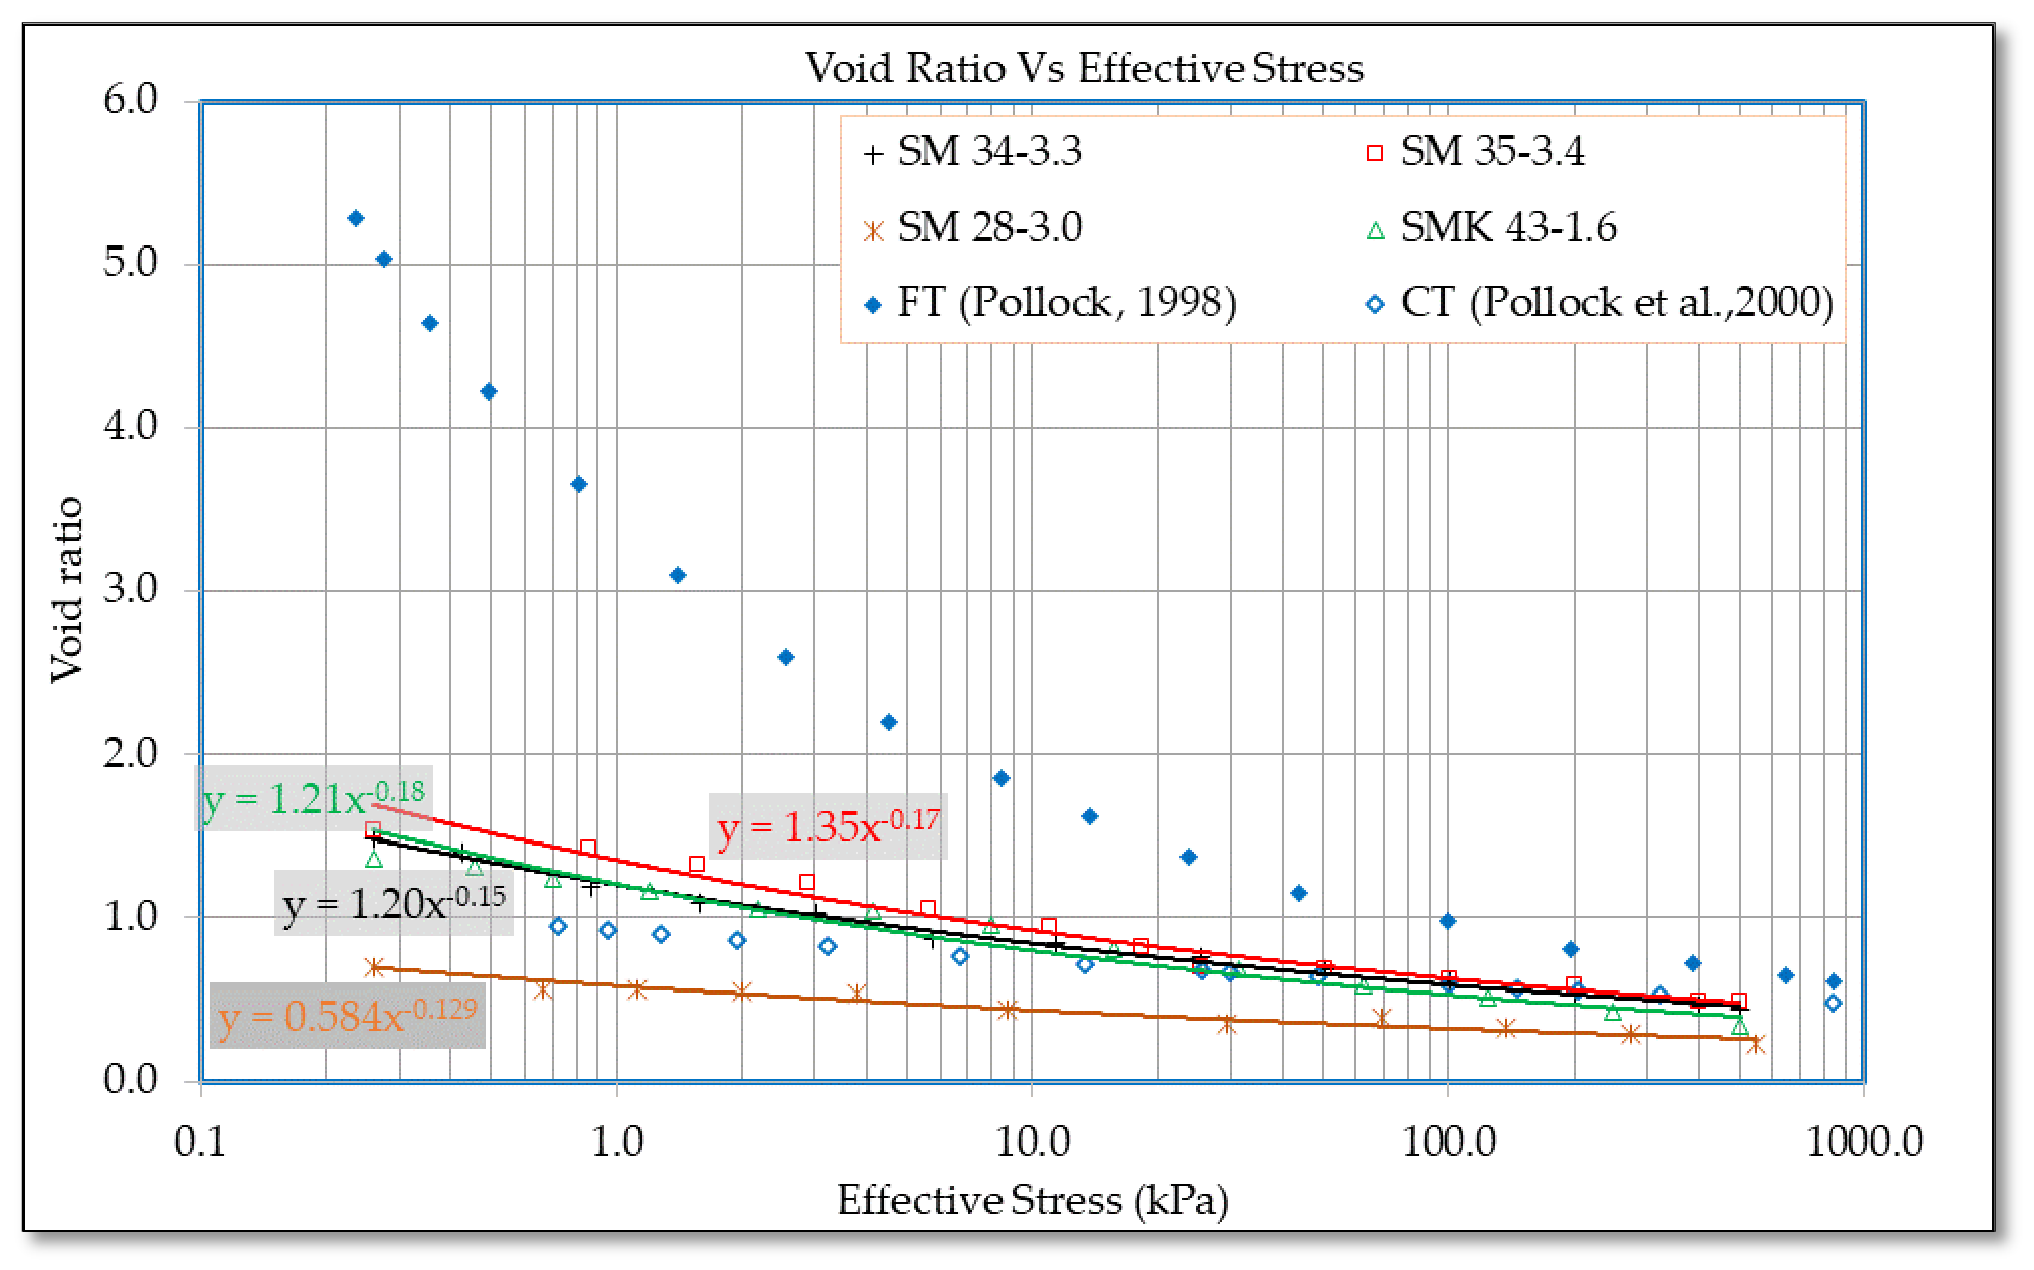
Figure 9 shows the void ratio–effective stress relationships for the oil sands tailings in the transition zone. Similar results to those found in the compressibility of fine tailings [55,56] show that the compressibility of these materials is dependent on the initial void ratio. Different samples start at different void ratios at low effective stress, but as stresses rise, their void ratios continue to decrease and converge. Transitional oil sands tailings in this study have shown uniform void ratio change with stress, in contrast to other earlier findings in the compressibility of fine tails that demonstrated pre-consolidation behavior and increased void ratio changes in stress levels of less than 10 kPa and delayed void ratio changes beyond that point. This can be explained by the fact that consolidation of these mixtures started at lower void ratios and higher solids contents; as demonstrated by Suthaker’s [56], Jeeravipoolvarn et al.’s [22] and Jeeravipoolvarn’s [55] studies on fine tailings (30 percent solids) and cyclone overflow (33 percent solids), respectively. At this point, a card-house structure has already been built, necessitating high effective stress to reduce friction and particle bonding for compressibility. According to Watabe et al.’s [18] experimental research on the compressibility of sand–clay mixtures, the sand fraction has a greater influence on compressibility than the fines fraction. In comparison to samples SM 34-3.3, SM 35-3.4, and SMK 43-1.6, which demonstrated higher and nearly uniform compressibility changes with stress increases, sample SM 28-3.0 demonstrated the lowest compression rate with effective stress increase. This phenomenon can be explained by the fact that SM 28-3.0 has the lowest amount of fines (28 percent fines), which is below the threshold value and permits the least compressible sand skeletal structure. In contrast, the other samples have fines that are close to or above the threshold value, which results in higher compressibility because there is no interaction between the sand particles.

3.5. Finite-Strain Consolidation Modeling

The transitional oil sands tailings’ coefficients of permeability and compressibility from large strain consolidation tests were used to run one-dimensional finite-strain consolidation models. Since these deposits may be deposited under a variety of boundary conditions, filling rates, and pond dimensions, the goal is to compare the consolidation and strength gain behavior as well as the impact of index properties for these deposits rather than to determine how long it might actually take them to reach final settlements.
The boundary conditions for this hypothetical pond-type analysis are an impermeable bottom and a constant water cap with a thickness of 0.5 m. A pond with consistent dimensions of 40 m in height and 4 square kilometers in area was the subject of 500 years of modeling. The analysis is predicated on a daily filling rate of 80 mega kilograms, zero filling rate after maximum height, and the absence of a single surcharge episode.
The input data for modeling the consolidation behavior of transitional oil sands tailings is derived from the hydraulic conductivity and compressibility constitutive relationships found in the large strain consolidation test data shown in Figure 8 and Figure 9, which are used to provide input data to model the consolidation behavior of transitional oil sands tailings. The performance of these transitional deposits was compared to other deposits in the fines and sandy categories using previous experimental data from Pollock [53] and Pollock et al. [54] on fine tailings with 92 percent fines and composite tailings with 20 percent fines, respectively. The FSConsol one-dimension consolidation software, which was created based on Gibson et al.’s [46] finite-strain consolidation theory, was used to model these samples. The study’s simulations did not take into account environmental factors like evaporation and freeze–thaw cycles, as well as time-dependent effects like creep and aging, which could also have an impact on how these deposits behave.
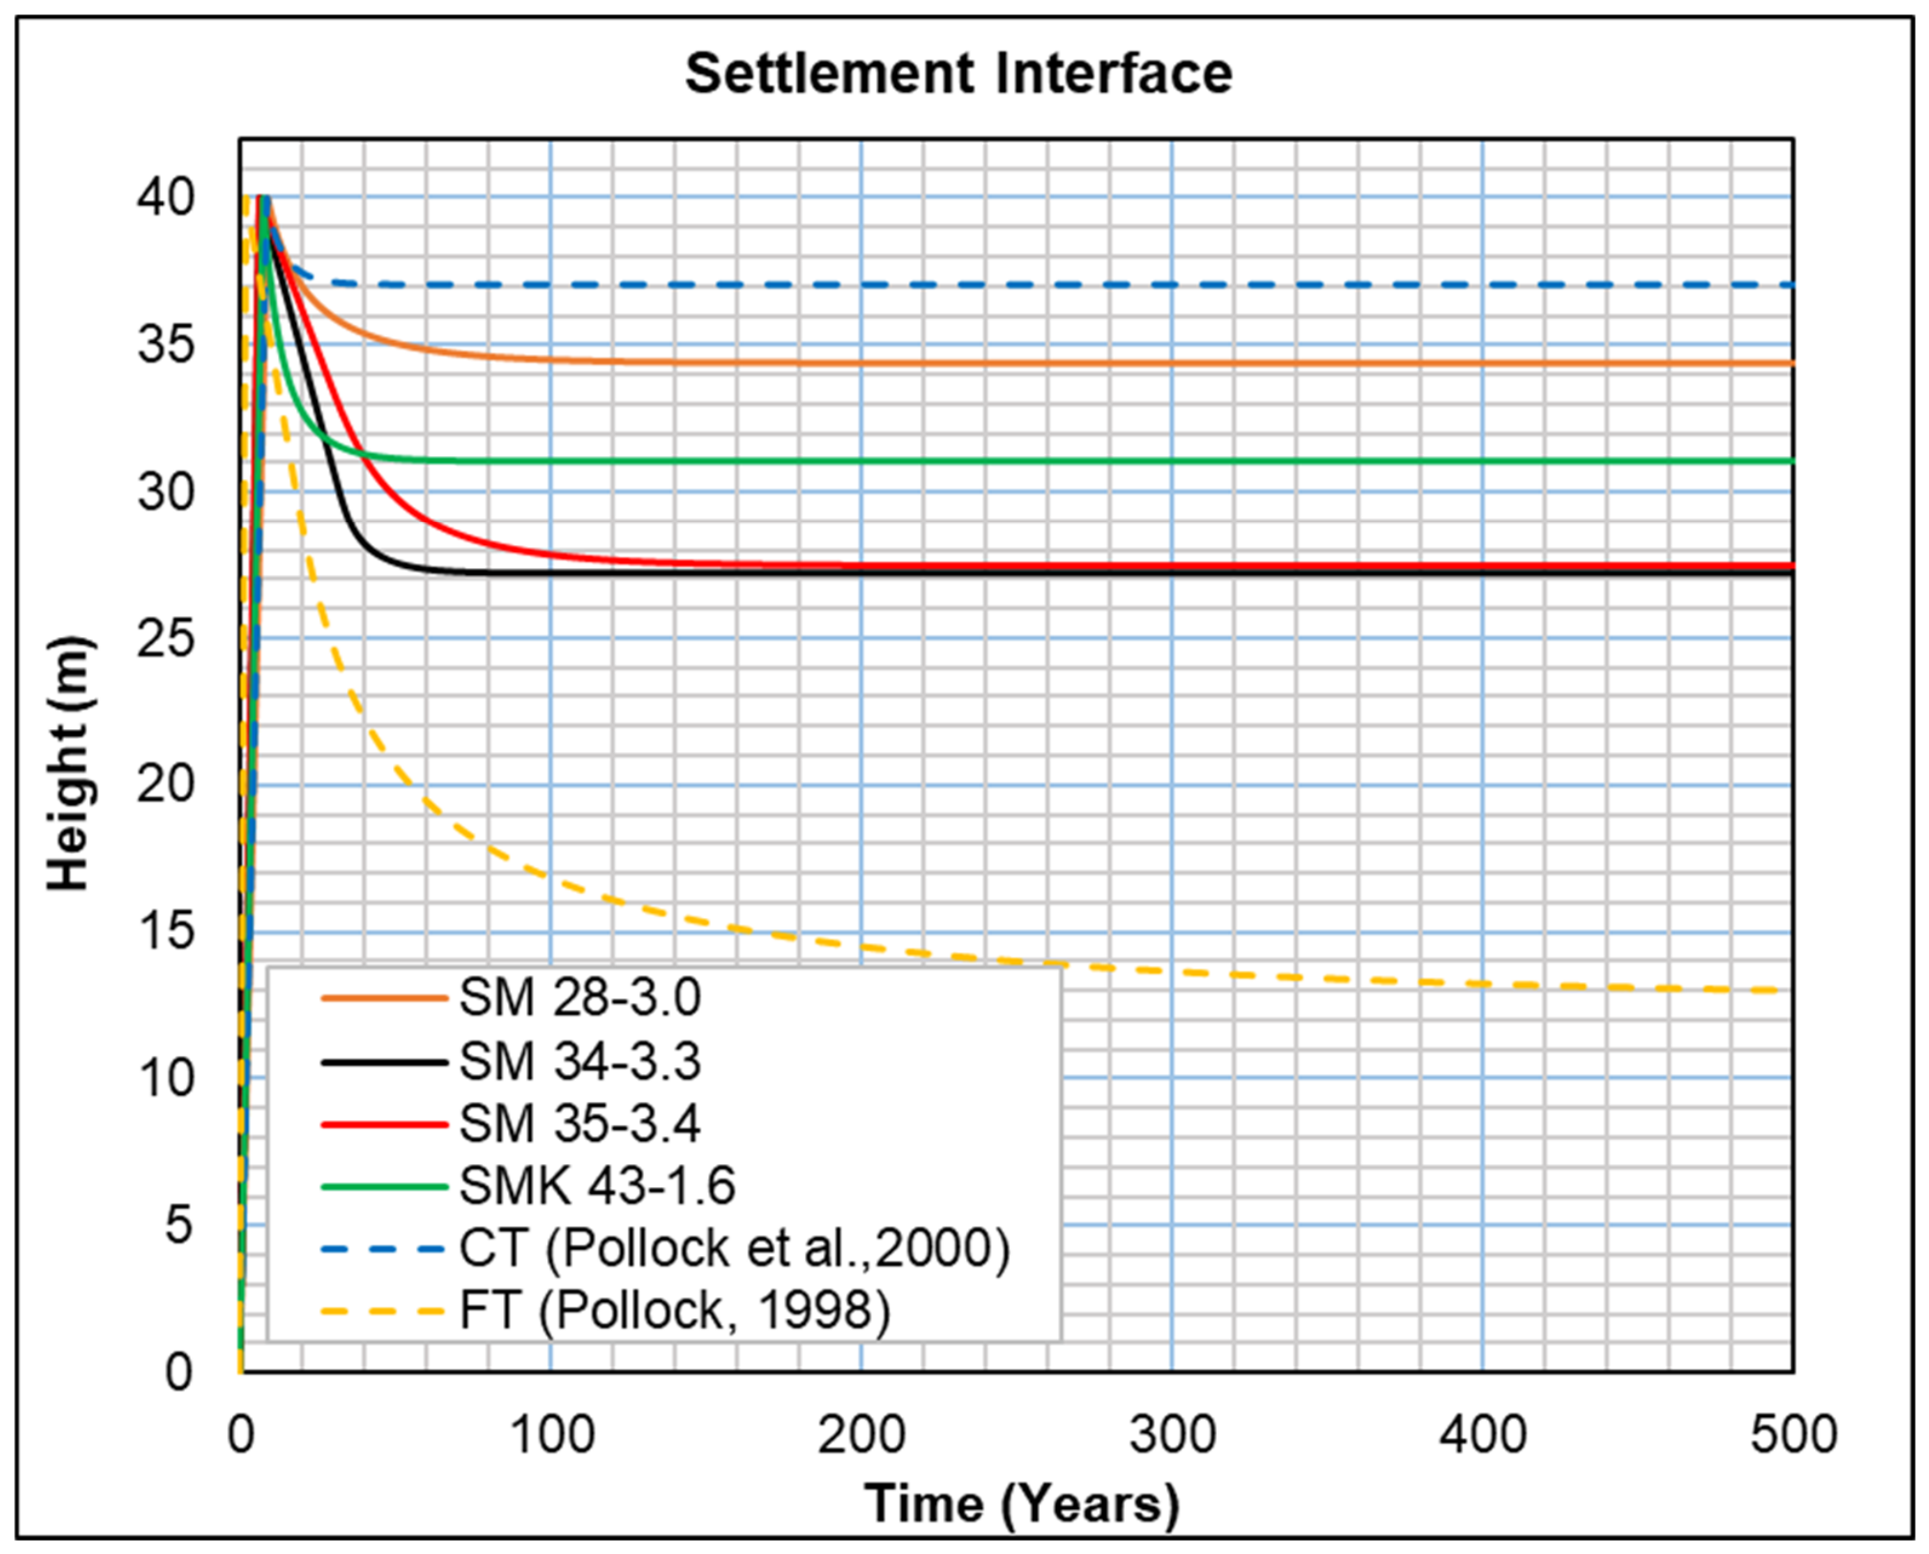
With the exception of sample SMK 43-1.6, which appears to settle less than samples SM 34-3.33 and SM 35-3.4 despite containing more fines, the settlement interface of all samples increases with the amount of fines contained, which is depicted in Figure 10. The phenomenon can be explained by the fact that kaolinite is less active than illite, an average clay in fluid tailings used in other samples. Because of its layered structures and weaker bonding between layers, illite is typically expected to be more compressible than kaolinite, resulting in significant rearrangement and compression under load. This is in contrast to the behavior of more stable, densely packed kaolinite structures, which have lower compressibility and can sustain applied loads.
By adding sodium chloride (NaCl) to sample SM 34-3.3, sample SM 35-3.4 was created, changing the sodium adsorption ratio from 4.6 to 21.5 while maintaining the same other characteristics. In comparison to sample SM 35-3.4, sample SM 34-3.3 exhibits a marginally higher maximum settlement that is reached in a marginally shorter amount of time, as seen in Figure 10. Increased SAR indicates that sodium dominates the soil more than calcium and magnesium, which makes the soil more dispersive because sodium is less able to collapse the diffuse double layer than calcium and magnesium. Due to its dispersive nature and convoluted flow path, hydraulic conductivity decreases.
Diffuse double layer (DDL) theory explains how the sodium adsorption ratio (SAR) affects the hydraulic behavior of the mixtures. A higher concentration of sodium encourages the diffuse double layer that surrounds clay particles to expand, strengthening repulsive forces and causing particle dispersion. Hydraulic conductivity is lowered as a result of this dispersed structure’s decreased pore connectivity. Lower SAR conditions, on the other hand, encourage flocculation, which improves drainage properties. Since SAR effects are intrinsically linked to clay activity and fines content in this study, it was not possible to fully isolate their independent contributions. Although direct mineralogical and microstructural verification was outside the scope of this study, these interpretations are based on established clay behavior theories and observed experimental trends. It is important to note that mixing fine tailings with coarse sand improves deposit settlement. Operators would want to achieve minimal settlement for easier capping and reclamation of the facilities. While fluid tailings settle by 64% of the pond’s initial height, fines–sand mixtures settle only by 15% to 33% of the initial height. Samples SM 34-3.3 and SM 35-3.4, which contain fines amounts within a range that noted threshold points from the filterability study conducted in this research, show a significant improvement for oil sands tailings deposits: settlement is reduced by more than half (50%) of fluid tailing. Additionally, consolidation modeling of the same samples (SM 34-3.3 and SM 35-3.4) reduces settlement completion times by over 50% compared to the time required for fluid tailings to settle.
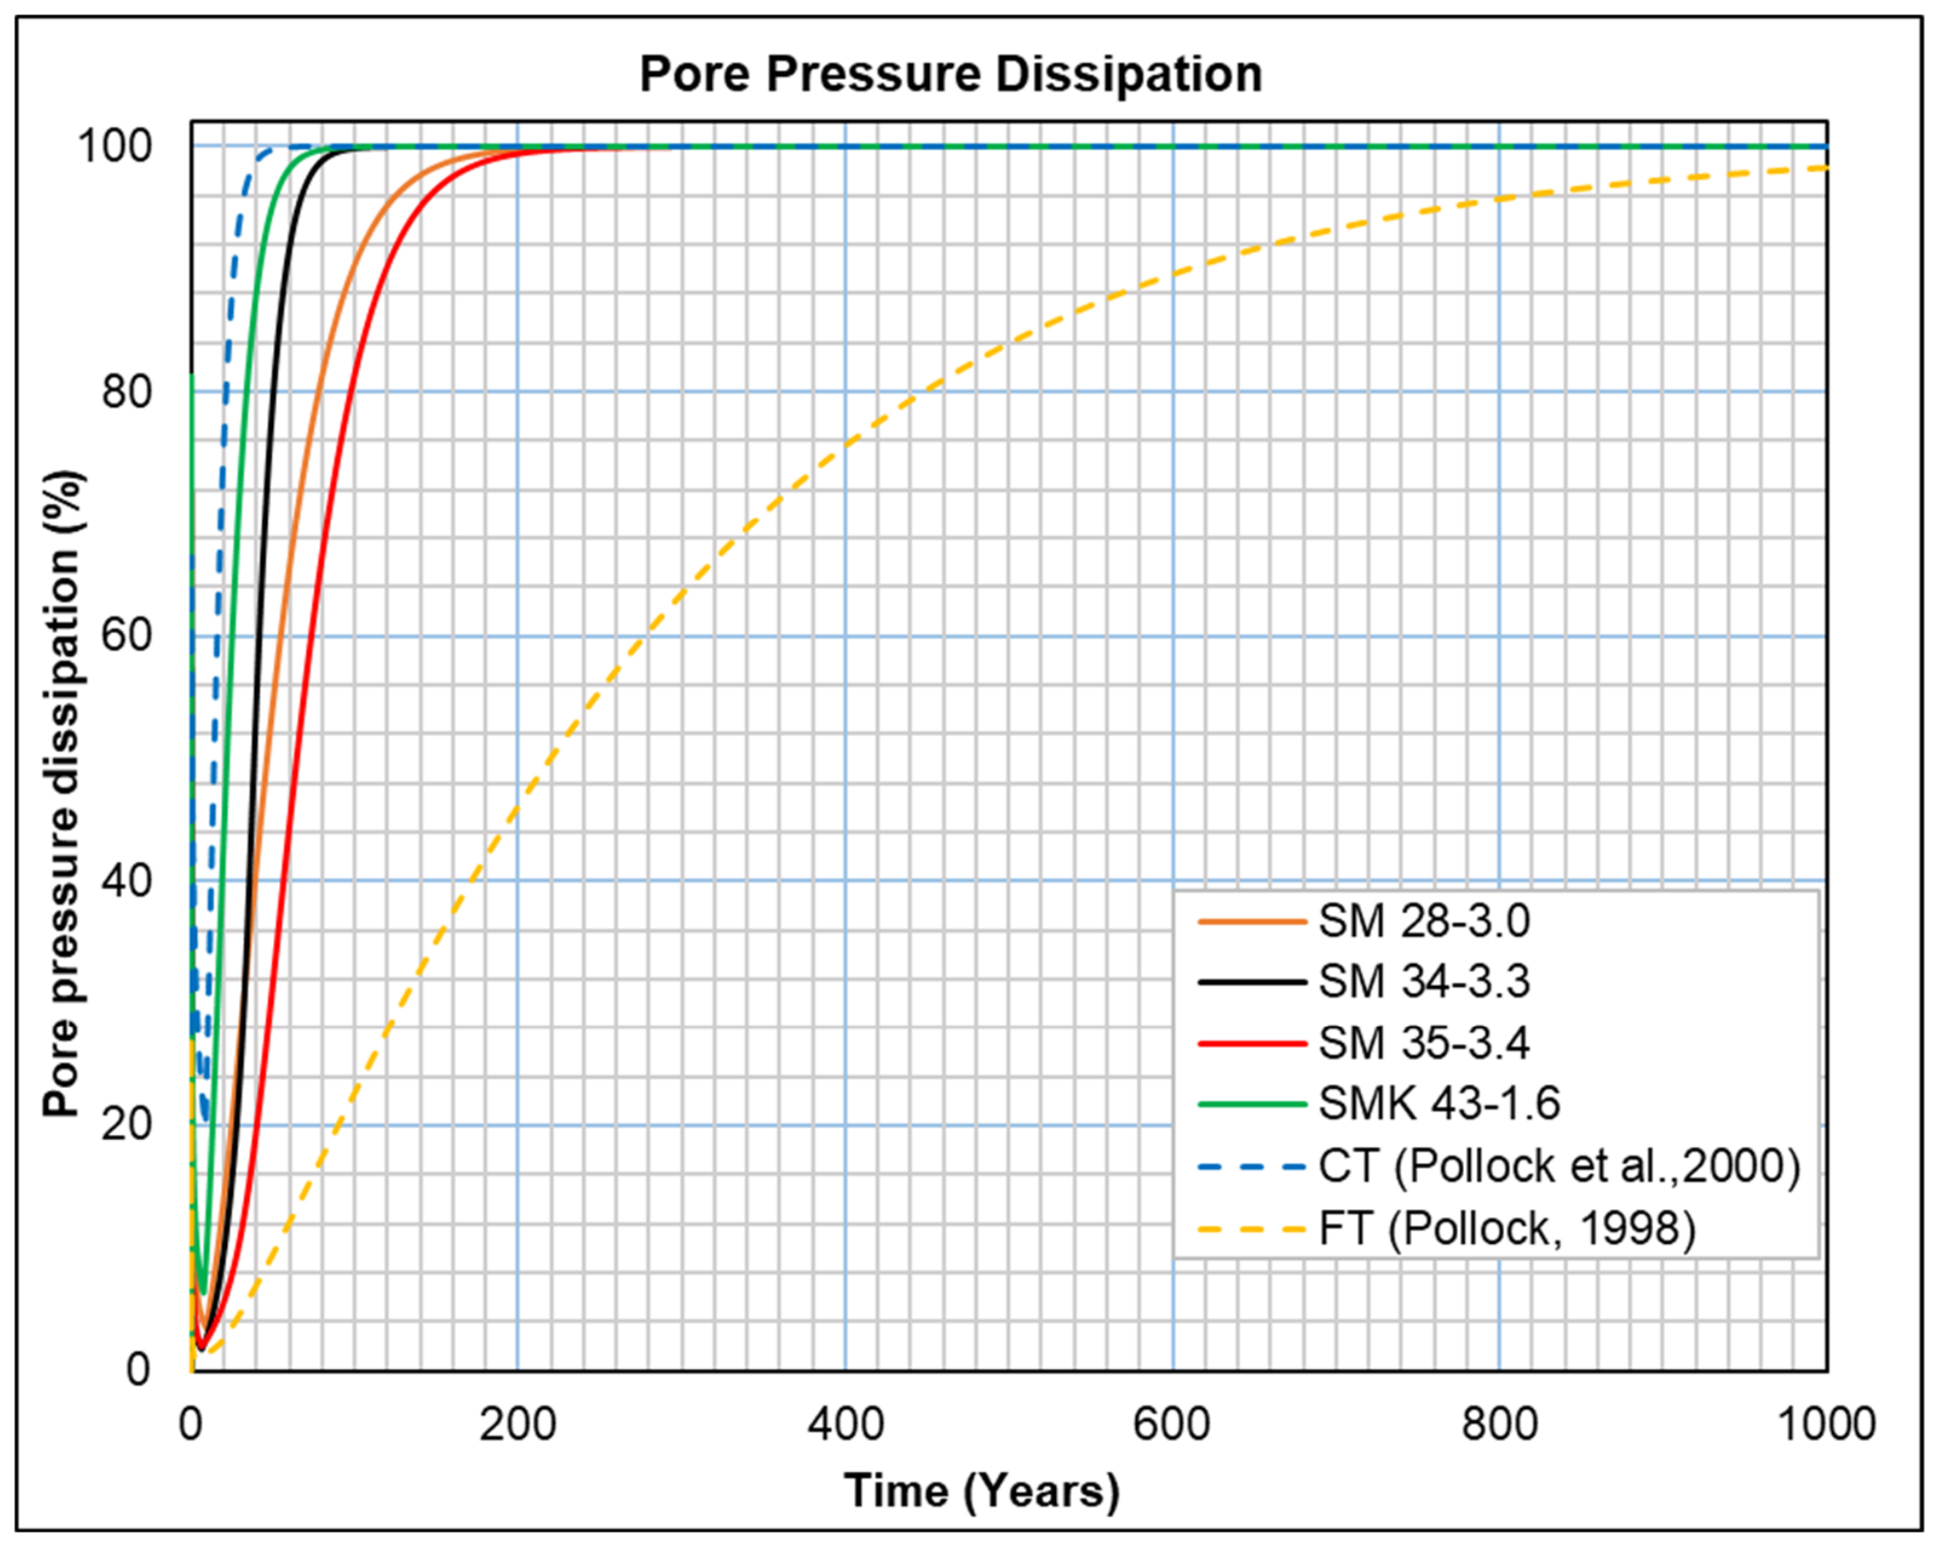
Figure 11 shows the rate of pore pressure dissipation. Full pore pressure dissipation denotes the point at which the material will have reached its maximum strength and consolidation. It has been demonstrated that transitional tailings samples SM 28-3.0, SM34-3.3, SM 35-3.4, and SMK 43-1.6 can achieve 90 percent pore pressure dissipation in 40 to 120 years, which is less time than fluid tailings (more than 640 years) but longer than composite tailings in the sandy category (roughly 30 years). The sample SMK 43-1.6 has been shown to dissipate pore pressure the fastest, despite having more fines than other samples. This can be explained by the fact that this sample has the highest hydraulic conductivity due to having the lowest activity and water-retaining capacity. Once more, taking into account samples SM 34-3.3 and SM 35-3.4, a sand–fines mixed oil sands tailings deposit containing approximately the threshold fines amount would reach 90% pore pressure dissipation in less than one-sixth the time required for a conventional fluid tailings deposit.
It is noteworthy that the finite-strain consolidation modeling approach used in this study assumes homogeneous material conditions, one-dimensional deformation, and idealized drainage boundaries. Furthermore, it is based on controlled laboratory-derived constitutive relationships. Because the governing parameters are derived from experimental measurements, the model is still physically representative even though these assumptions simplify the complex behavior of tailings in the field. Therefore, rather than making direct field-scale predictions, the modeling results are meant to offer comparative insights into the impact of fines content on consolidation performance.

4. Conclusions

This study investigates how the amount of included fines, their characteristics (clay activity), and the water chemistry (sodium absorption ratio (SAR)) affect the filterability and consolidation behaviors of transitional oil sands tailings. Understanding these characteristics is essential for the sustainable management of similar deposits because they determine settlement and strength gain over time, which in turn define reclamation plans, as well as the amount and timing of recovering supernatant water released from these deposits for reuse. The study has identified transitional oil sands tailings with properties similar to samples used in this study to be those of low-plasticity materials. It can be argued that these mixtures are best at a threshold fines content of 35 ± 2 percent, or roughly 1.9 ± 0.3 SFR. Below this point, the voids in the mixtures are unfilled, allowing water to flow through them more quickly; above that point, the voids begin to fill, followed by sand particles floating in the fines matrix, which hinders water flow. For the best deposit performance, the industry must take this into account when determining the blending ratios at the mixture deposition point.
The results suggest that clay activity, sodium adsorption ratio (SAR), and effective stress collectively influence the hydraulic conductivity behavior of transitional oil sands tailings in addition to fines content. The observed trends are consistent with established theories describing physicochemical interactions in clay–water systems. However, because mineralogical characterization and controlled isolation of SAR effects were beyond the scope of this study, these mechanisms should be interpreted as inferred rather than directly verified. Water flow is slowed by the layered structure of active and expansive clays, which are characterized by small particle sizes and a large negatively charged surface area that has a strong affinity for water molecules. Monovalent cations (Na+) are more prevalent than divalent cations (Ca2+ and Mg2+) when the SAR value is high. As a result, clay particles disperse and cause pore space collapse and clogging, which slows down the rate of water flow through convoluted flow paths. These materials’ compressibility is found to depend on their initial void ratios; this behavior is comparable to that of fine tailings.
It has been demonstrated that improved hydraulic conductivity improves the performance of transitional oil sands tailings. In comparison to traditional fluid tailings deposits, mixtures containing approximately threshold fines will reduce settlement time and depth by more than 50% and the waiting time for full pore pressure dissipation by more than 80%. This will ultimately lead to tailings management that is more cost-effective, ecologically conscious, and compliant with regulations.
This study has a number of limitations. Field monitoring data has not been used to validate the threshold fines content and consolidation behavior, which was established based on laboratory-scale testing. Clay mineralogy was not quantitatively characterized using techniques such as X-ray diffraction (XRD), and microstructural observations using techniques like Scanning Electron Microscopy (SEM) were not carried out to provide direct evidence for the suggested mechanisms. Furthermore, controlled testing did not isolate the effects of SAR. Notwithstanding these drawbacks, the research offers insightful information about the coupled hydro-mechanical behavior of tailings from transitional oil sands deposits.
Further investigation into the materials to address the limitations will enhance the understanding of these deposits.


Author Contributions

Conceptualization, P.K.; methodology, P.K.; software, P.K.; validation, P.K., G.W.W. and H.K.; formal analysis, P.K.; investigation, P.K.; resources, G.W.W.; data curation, P.K.; writing—original draft preparation, P.K.; writing—review and editing, H.K.; visualization, P.K.; supervision, G.W.W. and H.K.; project administration, G.W.W.; funding acquisition, G.W.W. All authors have read and agreed to the published version of the manuscript.

Funding

This research was funded by the Natural Sciences and Engineering Research Council of Canada and Canada’s Oil Sands Innovation Alliance (NSERC/COSIA) Industrial Research Chair in Oil Sands Tailings Geotechnique: RES0046210 (COSIA) and RES0043995 (NSERC).

Data Availability Statement

The entirety of the data used in this study is documented within this paper.

Acknowledgments

The authors would like to acknowledge research and financial support from the Natural Sciences and Engineering Research Council of Canada and Canada’s Oil Sands Innovation Alliance (NSERC/COSIA) Industrial Research Chair in Oil Sands Tailings Geotechnique. They also acknowledge the support offered by the Industrial Research Chair for Colleges in Oil Sands Tailings Management in sample characterising tests. This article is based on Chapter 4 of the main author’s PhD thesis, written under the supervision of the co-authors [25].

Conflicts of Interest

The author declares no conflicts of interest. The funder had no role in the design of the study; in the collection, analysis, or interpretation of data; or in the writing of the manuscript.

References

  1. Natural Resources Canada. Energy Fact Book 2024–2025; Natural Resources Canada: Edmonton, AB, Canada, 2025.
  2. Alberta Energy Regulator. State of Fluid Tailings Management for Mineable Oil Sands-2022; Alberta Energy Regulator: Calgary, AB, Canada, 2023.
  3. Beier, N.A.; Kabwe, L.K.; Don, S.J.; Pham, N.H.; Wilson, G.W. Modeling the Effect of Flocculation and Desiccation on Oil Sands Tailings; Geo: Chicago, IL, USA, 2016. [Google Scholar]
  4. Chalaturnyk, R.J.; Don Scott, J.; Özüm, B. Management of oil sands tailings. Pet. Sci. Technol. 2002, 20, 1025–1046. [Google Scholar] [CrossRef]
  5. Lade, P.; Liggio, C., Jr.; Yamamuro, J. Effects of Non-Plastic Fines on Minimum and Maximum Void Ratios of Sand. Geotech. Test. J. 1998, 21, 336–347. [Google Scholar] [CrossRef]
  6. Phan, V.T.-A.; Hsiao, D.-H.; Nguyen, P.T.-L. Effects of Fines Contents on Engineering Properties of Sand-Fines Mixtures. Procedia Eng. 2016, 142, 213–220. [Google Scholar] [CrossRef]
  7. Sridharan, A. Strength and volume change behaviour of a sand–bentonite mixture: Discussion. Can. Geotech. J. 1990, 27, 404. [Google Scholar] [CrossRef]
  8. Yin, K.; Fauchille, A.-L.; Di Filippo, E.; Kotronis, P.; Sciarra, G. A Review of Sand–Clay Mixture and Soil–Structure Interface Direct Shear Test. Geotechnics 2021, 1, 260–306. [Google Scholar] [CrossRef]
  9. Zuo, L.; Baudet, B.A. Determination of the transitional fines content of sand-non plastic fines mixtures. Soils Found. 2015, 55, 213–219. [Google Scholar] [CrossRef]
  10. Suits, L.; Sheahan, T.C.; Yang, S.; Lacasse, S.; Sandven, R. Determination of the Transitional Fines Content of Mixtures of Sand and Non-plastic Fines. Geotech. Test. 2006, 29, 102–107. [Google Scholar] [CrossRef]
  11. Simpson, D.C.; Evans, T.M. Behavioral Thresholds in Mixtures of Sand and Kaolinite Clay. J. Geotech. Geoenviron. Eng. 2016, 142, 04015073. [Google Scholar] [CrossRef]
  12. COSIA Deposit Characterization Committee. Measuring Undrained Shear Strength of Oil Sands Tailings Deposits; COSIA: Calgary, AB, Canada, 2014. [Google Scholar]
  13. OSTC/COSIA. Technical Guide for Fluid Fine Tailings Management; Oil Sands Tailings Consortium: Calgary, AB, Canada, 2012. [Google Scholar]
  14. Imperial Oil Resources Limited. Mine Plan Amendment and Tailings Management Plan Integrated Application; Alberta Energy Regulator: Calgary, AB, Canada, 2022. [Google Scholar]
  15. CNRL. Canadian Natural Jackpine Mine Fluid Tailings Management Report; Alberta Energy Regulator: Calgary, AB, Canada, 2020. [Google Scholar]
  16. Huffine, C.L.; Bonilla, C.F. Particle-size effects in the compression of powders. AIChE J. 1962, 8, 490–493. [Google Scholar] [CrossRef]
  17. Fan, J.; Rowe, R.K.; Brachman, R.W.I. Compressibility and permeability of sand–silt tailings mixtures. Can. Geotech. J. 2022, 59, 1348–1357. [Google Scholar] [CrossRef]
  18. Watabe, Y.; Yamada, K.; Saitoh, K. Hydraulic conductivity and compressibility of mixtures of Nagoya clay with sand or bentonite. Géotechnique 2011, 61, 211–219. [Google Scholar] [CrossRef]
  19. Bandini, P.; Sathiskumar, S. Effects of Silt Content and Void Ratio on the Saturated Hydraulic Conductivity and Compressibility of Sand-Silt Mixtures. J. Geotech. Geoenviron. Eng. 2009, 135, 1976–1980. [Google Scholar] [CrossRef]
  20. Thevanayagam, S. Liquefaction of silty soils—Considerations for screening and retrofit strategies. In Proceedings of International Workshop on Mitigation of Seismic Effects on Transportation Structures; National Center for Research on Earthquake Engineering: Taipei, China, 2000. [Google Scholar]
  21. Sathees, T. Saturated Hydraulic Conductivity of Poorly Graded Sands with Non Plastic Silt Using a Flexible Wall Permeameter. Ph.D. Thesis, New Mexico State University, Las Cruces, NM, USA, 2006. [Google Scholar]
  22. Jeeravipoolvarn, S.; Scott, J.D.; Chalaturnyk, R.J. 10 m standpipe tests on oil sands tailings: Long-term experimental results and prediction. Can. Geotech. J. 2009, 46, 875–888. [Google Scholar] [CrossRef]
  23. Kohno, M.; Nara, Y.; Kato, M.; Nishimura, T. Effects of clay-mineral type and content on the hydraulic conductivity of bentonite–sand mixtures made of Kunigel bentonite from Japan. Clay Miner. 2018, 53, 721–732. [Google Scholar] [CrossRef]
  24. Kohno, M. Swelling-Pressure and Hydraulic Conductivity of Compacted Clays Focusing on the Clay-Mineral Type. Mater. Trans. 2021, 62, 1203–1209. [Google Scholar] [CrossRef]
  25. Kaheshi, P.; Wilson, G.W.; Kaminsky, H. Geotechnical Characterization of Transitional Oil Sands Tailings. Ph.D. Thesis, University of Alberta Canada, Edmonton, AB, Canada, 2025. [Google Scholar]
  26. ASTM C136/C136M-19; Standard Test Method for Sieve Analysis of Fine and Coarse Aggregates. ASTM: West Conshohocken, PA, USA, 2019. [CrossRef]
  27. ASTM E3340-22; Standard Guide for Development of Laser Diffraction Particle Size Analysis Methods for Powder Materials. ASTM: West Conshohocken, PA, USA, 2022. [CrossRef]
  28. Konert, M.; Vandenberghe, J. Comparison of laser grain size analysis with pipette and sieve analysis: A solution for the underestimation of the clay fraction. Sedimentology 1997, 44, 523–535. [Google Scholar] [CrossRef]
  29. ASTM D4318-17; Standard Test Methods for Liquid Limit, Plastic Limit, and Plasticity Index of Soils. ASTM: West Conshohocken, PA, USA, 2017. [CrossRef]
  30. Sethi, A. Methylene Blue Test for Clay Activity Determination in Fine Tails. MRRT Proced. 1995, 23. [Google Scholar] [CrossRef]
  31. Kaminsky, H. Demystifying the methylene blue index. In Proceedings of the Oil Sands Tailings 2014, Lake Louise, AB, Canada, 8–10 December 2014. [Google Scholar]
  32. Wells, P.; Kaminsky, H. Slurry to soil clay behaviour model–using methylene blue to cross the process/geotechnical engineering divide. In Proceedings of the Tailings and Mine Waste 2015, Vancouver, BC, Canada, 26–28 October 2015. [Google Scholar]
  33. Omotoso, O.; Morin, M. Methylene Blue Procedure: Dean Stark Solids; CanmetENERGY: Devon, UK, 2008. [Google Scholar]
  34. ASTM D854-14; Standard Test Methods for Specific Gravity of Soil Solids by Water Pycnometer. ASTM: West Conshohocken, PA, USA, 2014.
  35. Gale, R.; Baskerville, R. Capillary suction method for determination of filtration properties of a solid/liquid suspension. Chem. Ind. 1967, 9, 355–356. [Google Scholar]
  36. Baskerville, R. A simple automatic instrument for determining the filterability of sewage sludge. Water Pollut. Control 1968, 67, 233–241. [Google Scholar]
  37. Sawalha, O.; Scholz, M. Assessment of Capillary Suction Time (CST) Test Methodologies. Environ. Technol. 2007, 28, 1377–1386. [Google Scholar] [CrossRef] [PubMed]
  38. Rostami Najafabadi, Z.; Soares, J.B.P. Flocculation and dewatering of oil sands tailings with a novel functionalized polyolefin flocculant. Sep. Purif. Technol. 2021, 274, 119018. [Google Scholar] [CrossRef]
  39. Hethnawi, A.; Karaki, T.; Keteklahijani, Y.Z.; Chehelamirani, M.; Hassan, A.; Nassar, N.N. Enhanced Settling and Dewatering of Oil Sands Mature Fine Tailings with Titanomagnetite Nanoparticles Grafted with Polyacrylamide and Lauryl Sulfate. ACS Appl. Nano Mater. 2022, 5, 7679–7695. [Google Scholar] [CrossRef]
  40. Abdulnabi, A.; Amoako, K.; Moran, D.; Vanadara, K.; Aldaeef, A.A.; Esmaeilzadeh, A.; Beier, N.; Soares, J.; Simms, P. Evaluation of candidate polymers to maximize geotechnical performance of oil sands tailings. Can. Geotech. J. 2022, 59, 359–371. [Google Scholar] [CrossRef]
  41. Vesilind, P.A. Capillary Suction Time as a Fundamental Measure of Sludge Dewaterability. J. (Water Pollut. Control Fed.) 1988, 60, 215–220. [Google Scholar]
  42. Richardson, J.F.; Harker, J.H.; Backhurst, J.R.; Coulson, J.M. Coulson and Richardson’s chemical engineering. In Particle Technology and Separation Processes; Elsevier: Amsterdam, The Netherlands, 2002; Volume 2. [Google Scholar]
  43. Ahmed, M.; Beier, N.A.; Kaminsky, H. Assessing compressibility and hydraulic conductivity relationships of oil sands tailings derived from a combined constant-pressure filtration and incremental cake compression test. Can. Geotech. J. 2025, 62, 1–24. [Google Scholar] [CrossRef]
  44. Mitchell, J.K.; Soga, K. Fundamentals of Soil Behavior; John Wiley & Sons: New York, NY, USA, 2005; Volume 3. [Google Scholar]
  45. Carrier, W.D.; Bromwell, L.G.; Somogyi, F. Design Capacity of Slurried Mineral Waste Ponds. J. Geotech. Eng. 1983, 109, 699–716. [Google Scholar] [CrossRef]
  46. Gibson, R.E.; England, G.L.; Hussey, M.J.L. The Theory of One-Dimensional Consolidation of Saturated Clays. Géotechnique 1967, 17, 261–273. [Google Scholar] [CrossRef]
  47. Koppula, S.D. The Consolidation of Soil in Two Dimensions and with Moving Boundaries. Ph.D. Thesis, University of Alberta, Edmonton, AB, Canada, 1970. [Google Scholar] [CrossRef]
  48. Somogyi, F. Large Strain Consolidation of Fine Grained Slurries. In Proceedings of the Canadian Society for Civil Engineering, Winnipeg, MB, Canada, 29–30 May 1980. [Google Scholar]
  49. Azam, S.; Jeeravipoolvarn, S.; Scott, J.D. Numerical Modeling of Tailings Thickening for Improved Mine Waste Management. J. Environ. Inform. 2015, 13, 111–118. [Google Scholar]
  50. Berilgen, S.A.; Berilgen, M.M.; Ozaydin, İ.K. Compression and permeability relationships in high water content clays. Appl. Clay Sci. 2006, 31, 249–261. [Google Scholar] [CrossRef]
  51. ASTM D2435/D2435M; Standard Test Methods for One-Dimensional Consolidation Properties of Soils Using Incremental Loading. ASTM: West Conshohocken, PA, USA, 2020.
  52. ASTM D2434-22; Standard Test Methods for Measurement of Hydraulic Conductivity of Coarse-Grained Soils. ASTM: West Conshohocken, PA, USA, 2022. [CrossRef]
  53. Pollock, G.W. Large Strain Consolidation of Oil Sand Tailings Sludge. Master’s Thesis, University of Alberta, Edmonton, AB, USA, 1988. [Google Scholar]
  54. Pollock, G.; McRoberts, E.; Livingstone, G.; McKenna, G.; Matthews, J. Consolidation behaviour and modelling of oil sands composite tailings in the Syncrude CT prototype. In Tailings and Mine Waste 2000; CRC Press: Boca Raton, FL, USA, 2000; pp. 121–130. [Google Scholar]
  55. Jeeravipoolvarn, S. Geotechnical Behavior of In-Line Thickened Oil Sands Tailings. Ph.D. Thesis, University of Alberta, Edmonton, AB, USA, 2010. [Google Scholar]
  56. Suthaker, N.N. Geotechnics of Oil Sand Fine Tailings. Ph.D. Thesis, University of Alberta, Edmonton, AB, USA, 1997. [Google Scholar]
Figure 1. Microstructure and void ratio changes in the sand–clay mixtures as a function of fine and sand contents [8]. Licensed under CC BY 4.0.
Geosciences 16 00271 g001
Figure 2. Triton Electronics’ Type 319 Multi-purpose capillary suction time test equipment used to measure the filterability of slurries.
Geosciences 16 00271 g002
Figure 3. Modified specific resistance to filtration set-up used to measure filterability of materials.
Geosciences 16 00271 g003
Figure 4. Particle size distribution curves for the six samples used in this study.
Geosciences 16 00271 g004
Figure 5. Plasticity chart showing Atterberg limits and activity for five samples used in this study.
Geosciences 16 00271 g005
Figure 6. Plot showing the fines content influence on capillary suction time for three different groups of mixtures, each created at varying fines content with 2% fines interval.
Geosciences 16 00271 g006
Figure 7. Fines content influence on filterability for two different mixtures created at varying fines contents.
Geosciences 16 00271 g007
Figure 8. Experimental hydraulic conductivity plots obtained from large strain consolidation tests [53,54].
Geosciences 16 00271 g008
Figure 9. Experimental effective stress plots obtained from large strain consolidation tests [53,54].
Geosciences 16 00271 g009
Figure 10. Interface settlement from one-dimensional consolidation modeling [53,54].
Geosciences 16 00271 g010
Figure 11. Pore pressure dissipation from one-dimensional consolidation modeling [53,54].
Geosciences 16 00271 g011
Table 1. Index properties for baseline samples used to make uncharacterized mixtures for capillary suction time (CST) and specific resistance to filtration (SRF) tests: (a) MFT and (b) sand samples.
(a)MFT
MFT IDFines (%)MBIBitumen (%)Water Content (%)
MFT 97.1/1.097.112.71.074.4
MFT 89.6/1.389.67.81.375.9
(b)Sand
Sand IDD10 (µm)D50 (µm)Fines (%)Bitumen (%)Water Content (%)
SD 74.1/132.574.1132.55%0.3%3.1%
SD 109.9/252.9109.9252.95%0.4%3.2%
Table 2. Summary table for index properties of samples used in this study.
Sample IDPlastic Limit %Liquid Limit %PI (%)MBIFines (<44 µm)Bitumen (%)D10 (µm)D50 (µm)D90 (µm)SARSG
SM 28-3.010.5%23.3%13%3.028%1.27.5130.0503.63.52.51
SM 27-2.39.1%22.0%13%2.327%1.26.8202.1760.64.02.63
SM 34-3.310.2%25.7%16%3.332%0.76.7115.8426.94.62.71
SM 35-3.410.6%24.5%14%3.435%0.76.2120.6443.621.52.71
SMK 43-1.612.0%23.50%11%1.640%0.20.2107.5465.220.42.68
Disclaimer/Publisher’s Note: The statements, opinions and data contained in all publications are solely those of the individual author(s) and contributor(s) and not of MDPI and/or the editor(s). MDPI and/or the editor(s) disclaim responsibility for any injury to people or property resulting from any ideas, methods, instructions or products referred to in the content.