


Abstract
The High Agri Valley (HAV, Southern Italy) comprises the largest onshore oil field in Europe and has both significant geothermal extraction potential and one of the highest seismic hazards in Italy, as demonstrated by the 1857 Mw 7.0 Basilicata earthquake. However, seismic imaging and geological mapping have so far produced insufficient evidence regarding the location of fluid reservoirs and human-induced migration pathways within the HAV’s tectonic structures. Here, a 3D scattering and absorption tomography, proxy for heterogeneities and fluid content, respectively, detects hydrocarbons and potential geothermal resources within the Apulian Platform. Seismic scattering differentiates the low-scattering Irpinia tectonic mélange, which deepens in the center of the valley, from the fractured high-scattering carbonates of the Apulian Platform. Seismic absorption identifies regions of fluid reinjection, as demonstrated by the Costa Molina 2 case study, and reveals the preferred pathways for fluids that induce seismicity due to seasonal variations in the water level of the Pertusillo artificial lake. The integration of scattering and absorption imaging with direct well information, geochemical and hydrological models, could provide a powerful tool for both seismic hazard assessment and the exploration of sustainable energy resources.
1. Introduction
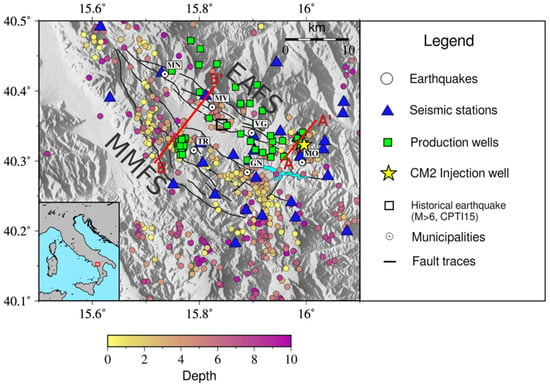
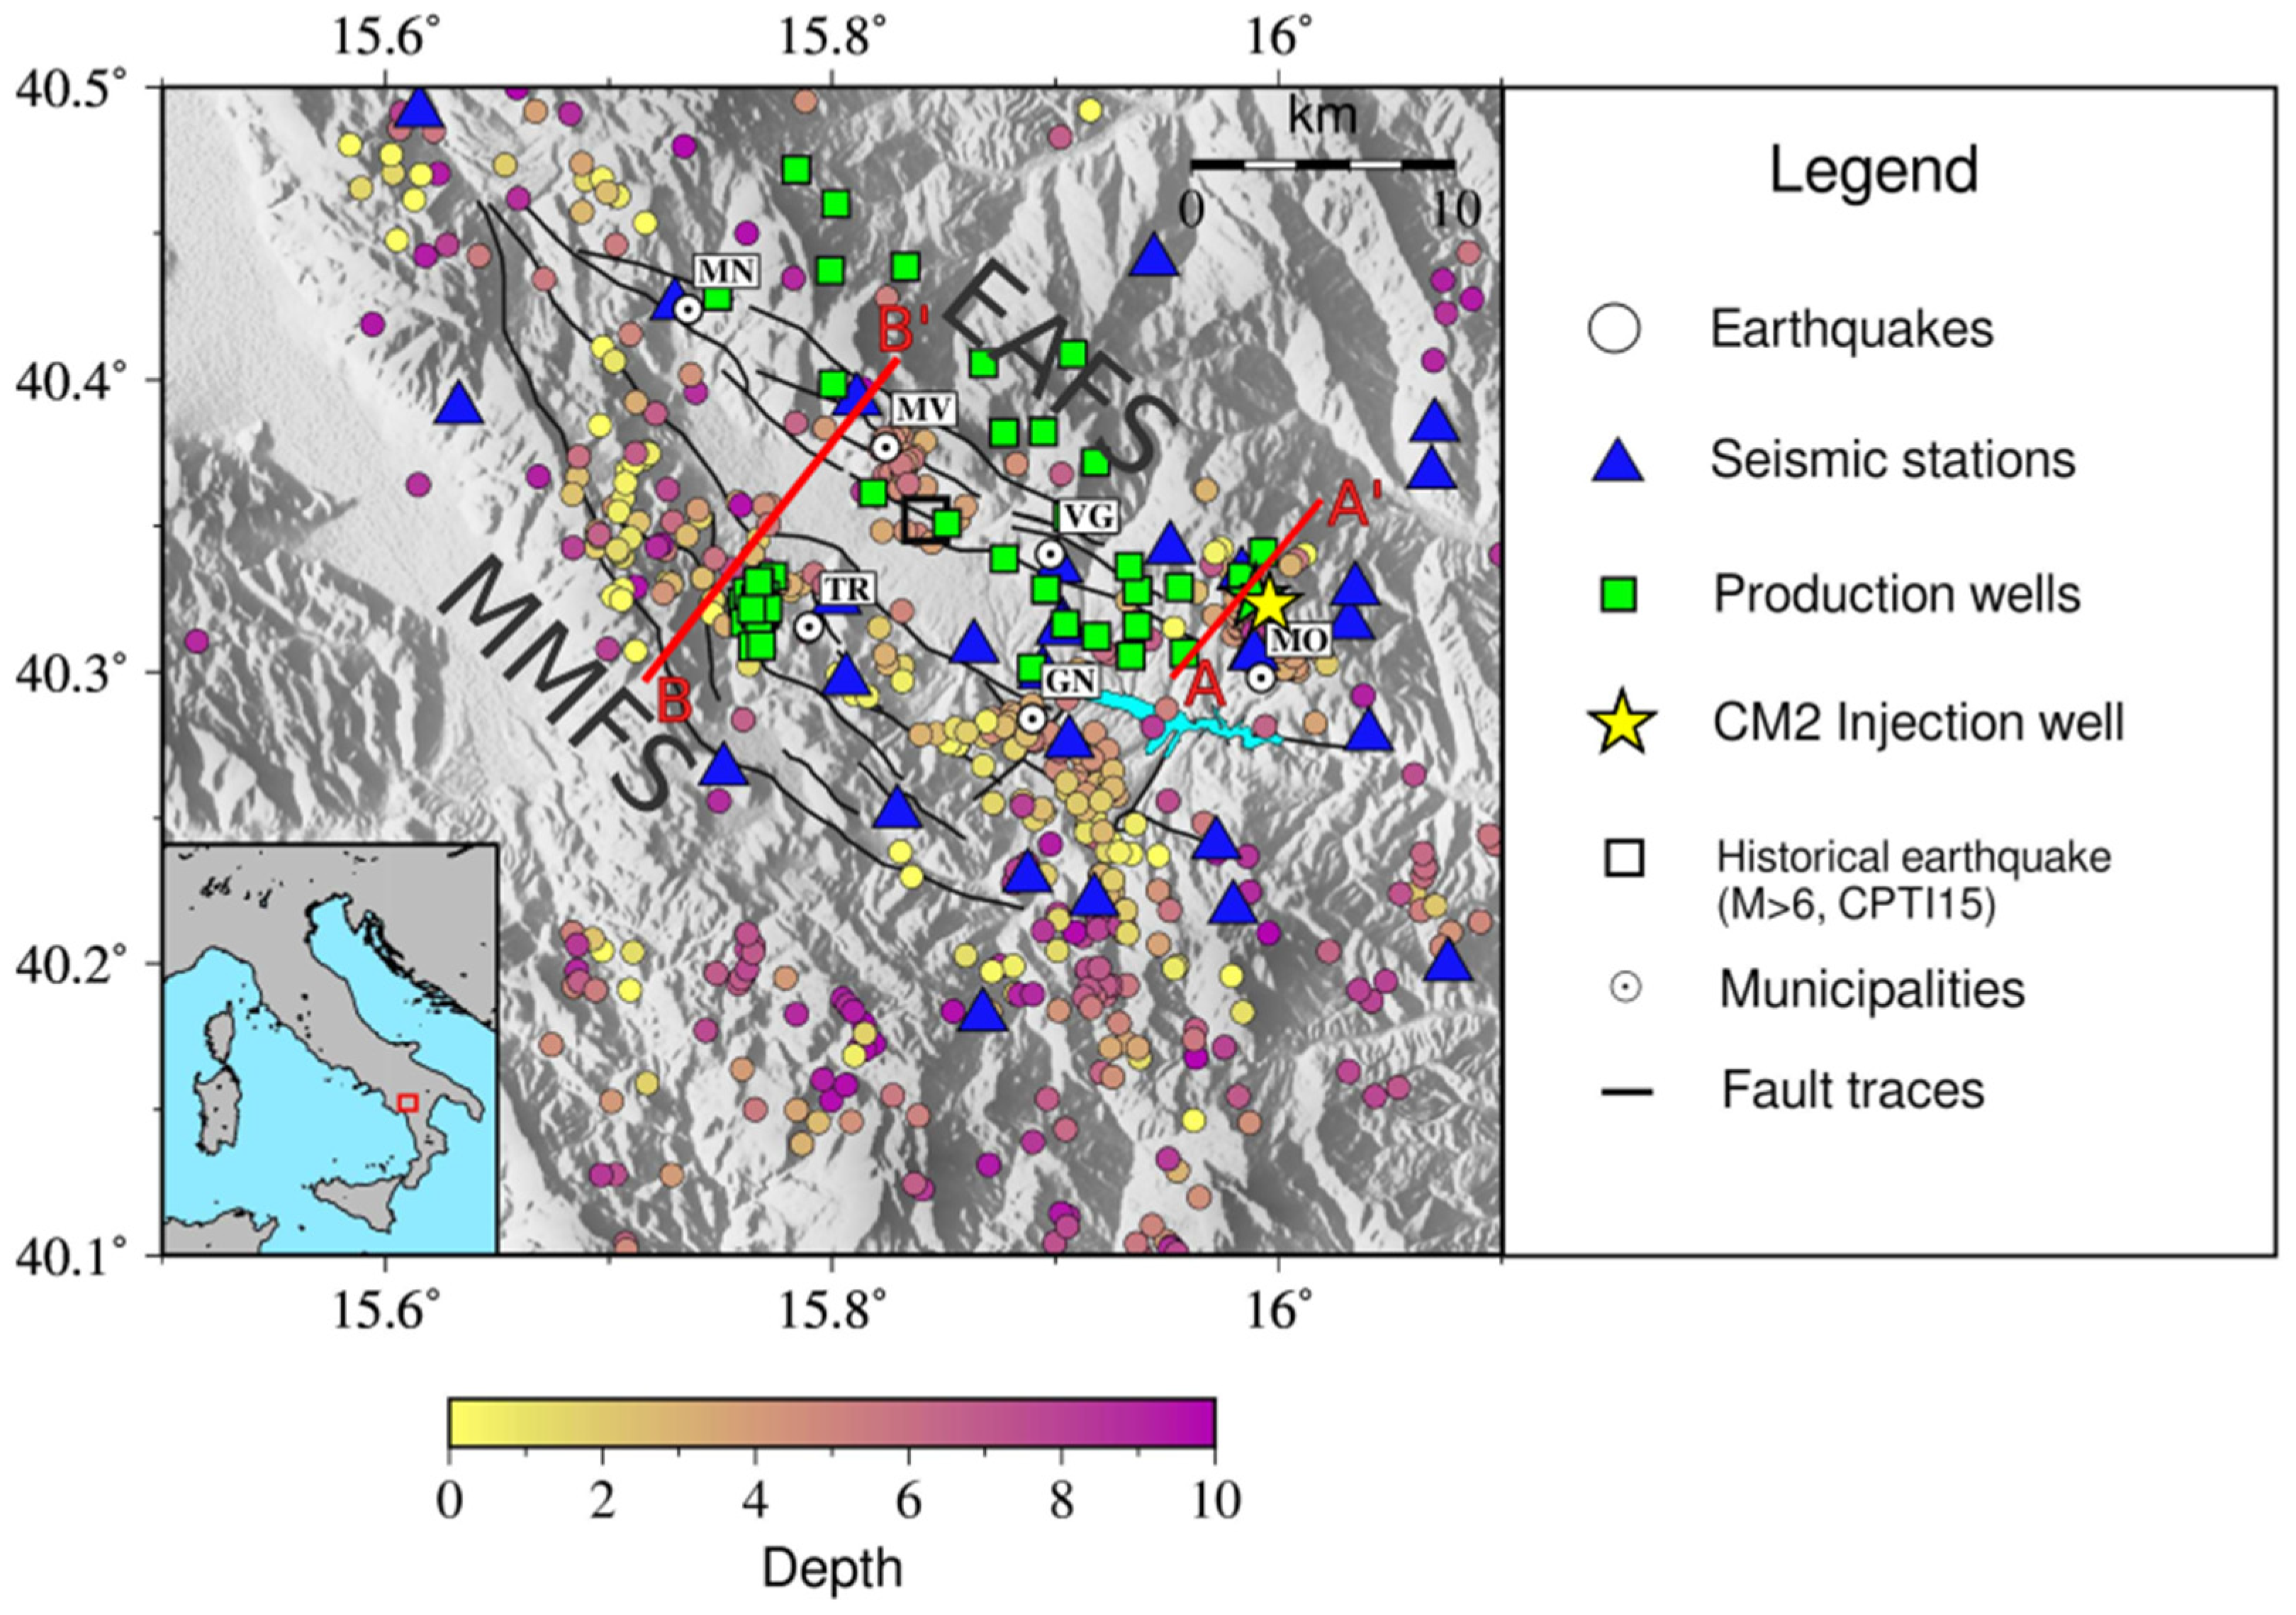
The High Agri Valley (HAV) in Southern Italy is a region of geophysical interest due to its complex geological structure, seismic activity, and potential for extracting hydrocarbons and geothermal resources. Located within the Southern Apennine fold-thrust belt, its geology results from a polyphasic tectonic history: (1) an extensional phase from the Mesozoic to early Cenozoic, with shallow and deep-water carbonate sediment deposition; (2) a Miocene-to-Pliocene shortening phase, transitioning from thin-skinned to thick-skinned tectonics; (3) a Pliocene–Pleistocene transtensional phase accommodated by high- and low-angle normal faults [1,2]. This latter phase shaped the present geomorphology, forming a Quaternary sedimentary basin bounded by the transtensional Eastern Agri Fault System (EAFS) and the Monti della Maddalena Fault System (MMFS) (Figure 1) [3]. HAV hosts Western Europe’s largest onshore oil reservoir, and it is seismically active, as demonstrated by the 1857 Mw 7.0 Basilicata earthquake [4].
Figure 1.
The High Agri Valley. Color-coded circles represent the earthquakes used in this study as a function of depth. Major municipalities are depicted as white circles: MN—Marsico Nuovo, MV—Marsico Vetere, VG—Viggiano, MO—Montemurro, TR—Tramutola, GN—Grumento Nova. Main fault system: MMFS—Monti della Maddalena Fault System, EAFS—Eastern Agri Fault System. The black square is the location of the 1857 Mw 7.0 earthquake (CPTI15, [4]). Pertusillo Lake is shaded in light blue. The lower-left panel displays the HAV location (red square) within the Italian Peninsula. The AA′ and BB′ red segments represent the traces of the cross sections analyzed later in the text.
In addition to natural low-magnitude seismicity (M < 4.0), the area currently experiences two types of anthropogenic seismicity: (1) reservoir-induced seismicity (RIS) caused by seasonal water level fluctuations in the Pertusillo artificial lake [5,6,7]; (2) fluid-induced microseismic swarms in Montemurro (MO, Figure 1) (injection-induced seismicity—IIS hereinafter), caused by saline water injection at the Costa Molina 2 well (CM2, Figure 1) [8,9,10].
The HAV has been designated by the Italian Ministry of the Environment and Energy Security as a region of interest for geothermal resource exploitation, based on subsurface temperature gradients, geological formations, and existing geothermal manifestations. The area is in a low heat flux zone (20–60 mW/m2, [11,12]), with low-to-medium enthalpy geothermal resources found at depths ranging from 500 m to several kilometers. The ascent of deep fluids (water, gas, and hydrocarbons) is well documented. Several works propose that the true potential of geothermal resources in the low-flux areas in Italy, comprising the HAV, could be underestimated due to the mixing of deep, hotter fluids with shallow, colder ones, particularly near a significant aquifer within the carbonates of the Apennine Platform [11,13].
The coexistence of the large onshore oilfield, the high seismic hazard, and anthropogenic seismicity have made the area a key target for multidisciplinary research, resulting in the availability of an extensive and diverse scientific dataset. Recent studies, integrating geo-structural data, local-scale subsurface models, surface gas geochemistry, and geochemical analyses of groundwater and hydrocarbons, have shed light on the complex interplay between fluid migration, fault systems, reservoir compartmentation, hydrocarbon seals, and natural and induced seismicity [14,15,16]. The elastic crustal properties of the HAV have been analyzed through seismic tomography [9,17,18], magnetotelluric images (MT, [19]), and deep electrical resistivity tomography (DERT, [20]). Valoroso et al. [17] provided the first velocity model, mapping the top of the Apulian Platform and key seismogenic structures. The subsequent, higher-resolution models [9,19] confirmed these findings and identified two high Vp/Vs anomalies (>1.9) near CM2 and Pertusillo Lake, supporting the role of fluids in triggering these seismic events. Comparing these velocity models with attenuation proxies allows us to verify whether highly fractured, fluid-saturated volumes correspond to distinct seismic velocity decreases, further constraining the physical state of the medium. The integration of MT and velocity tomography further identified asperities and barriers controlling seismicity [19].
Our study aims to enhance the extensive geological and geophysical dataset available for the region by providing independent insights from seismic wave attenuation analyses. Seismic wave attenuation is primarily controlled by seismic scattering, which is sensitive to the density of faults and fractures encountered during ray propagation, and absorption, which is sensitive to fluid permeation, storage, and possibly temperature [21]. These mechanisms can be studied and mapped separately. Forward scattering caused by small-scale velocity heterogeneities can be quantified using the peak-delay time (), which represents the lag between the arrival time of the direct P- or S-wave and the maximum amplitude of the seismogram envelope after accounting for path propagation effects [22]. The inverse coda quality factor () quantifies the decay of coda-wave energy with lapse time, measured from the earthquake’s origin time. It serves as an indicator of seismic absorption in the medium (Qc ≈ Qi, where Qi is the absorption quality factor) when the diffusion regime is established within the coda [23,24,25]. This regime is achieved late in the seismogram in the absence of leakage into the mantle or contamination by coherent phases [26].
Peak-delay and Q-coda methodologies are integrated into the open-access code MuRAT 3.0 [27], which models 3D variations in total attenuation, scattering, and absorption. In volcanic systems, high absorption has been shown to be sensitive to thermal gradients and fluid reservoirs. At Deception Island (Antarctica), these techniques identified intrusions responsible for the eruptions [28]. In the Natron Rift (Northern Tanzania), scattering revealed fluid-filled faults feeding Ol Doinyo Lengai eruptions. High-absorption anomalies have mapped sills, dikes, and fluid reservoirs sustaining this carbonatite volcano [29]. In Iceland, high-absorption anomalies were mapped in harnessed and non-harnessed high-enthalpy geothermal reservoirs [30]. Absorption mapping across the high-enthalpy Aluto reservoir distinguishes high-temperature fluids feeding productive wells from those in low-temperature reservoirs that do not generate sufficient thermal gradients for energy production [21]. In a colder tectonic setting, such as the Mt. Pollino region, a seismic gap located about 50 km south of HAV, high-absorption anomalies indicated overpressurized fluids in fractured media, mapping fault zones during seismic sequences [31]. Furthermore, at a larger lithospheric scale, 3D attenuation tomography across the Indo-Burma continental subduction zone mapped high-attenuation anomalies linked to fluid-rich sediments scraped off the subducting plate and hot asthenosphere upwelling beneath the volcanic arc [32]. In a different, highly strained context in northeastern Italy, the joint use of scattering and absorption models at the Collalto underground gas storage site successfully discriminated shallow gas-saturated volumes from localized tectonic strain and fluid-driven seismicity near fault tips [33]. These global applications demonstrate the versatility of 3D attenuation imaging across diverse structural scales and geotechnical settings, proving effective in different environments, including active volcanic rifts and deeply buried fold-and-thrust carbonate belts.
Here, we present the first three-dimensional scattering and absorption model of this structurally complex region. The model, derived at three central frequencies (1.5, 3, and 6 Hz), is based on the waveforms of 650 earthquakes recorded between 2016 and 2019 by 35 seismic stations located in the High Agri Valley and surrounding areas. We first describe the resulting models and then integrate them with existing structural interpretations and independent geophysical datasets to provide new insights into the anelastic properties of the crust. Our findings demonstrate the potential of attenuation imaging to discriminate between the Apulian Platform and the Irpinia Tectonic Mélange and to reveal anomalies associated with both anthropogenic seismicity and fluid reservoirs that could serve as valuable geothermal resources [34,35,36].
2. Materials and Methods
We used 650 earthquakes selected from a seismogenic volume measuring 44 km × 51 km × 10 km, centered on the HAV (lat: 40.1° N–40.5° N; lon: 15.5° E–16.1° E, Figure 1). The events were located using a local 3D velocity model [18,19] specifically produced for this area. The manually picked seismograms were recorded between 2016 and 2019 by 35 seismic stations, which are part of: (i) the Rete Sismica Nazionale seismic network (FDSN code: IV), operated by the Istituto Nazionale di Geofisica e Vulcanologia [37]; (ii) the Val d’Agri network (FDSN code: VA), operated by the ENI [38]; and (iii) the INSIEME seismic network (FDSN code: 3F), operated by the Consiglio Nazionale delle Ricerche (CNR-IMAA) [39]. The earthquakes have depths ranging from 0 to 10 km and local magnitude lower than 4. The dataset comprises 5445 waveforms for the two horizontal components (NS, EW—totaling 10,890 waveforms).
The seismograms were filtered with a band-pass Butterworth filter (fourth order) in three frequency bands (1–2 Hz, 2–4 Hz, and 4–8 Hz—centered at a frequency (fc) equal to 1.5, 3, and 6 Hz) applied bi-directionally and computed signal envelopes via the Hilbert transform, smoothed with a sliding window of 8/fc. The low central frequency enhances sensitivity to larger structures within the seismogenic volume while preserving sufficient waveforms for inversion when computing absorption. The preprocessed waveforms have been used as inputs for the peak-delay and Q-coda computation.
The peak-delay time () was calculated as the lag-time occurring between the P-wave onset and maximum S-wave amplitude for each source–receiver ray. The peak-delay values increase with hypocentral distance, due to the natural increase in heterogeneities along longer ray paths (Figure S1). We computed the linear fit in the log-log plot of peak delay as a function of the hypocentral distance and quantified the variations of the peak delay computed for the ith source–receiver ray from the linear fit ():
Positive deviations from the fit serve as indicators of high scattering, while negative ones relate to solid, compact, and locked volumes [40,41]. Logarithmic deviations of P-wave peak-delay time were mapped using weighted regionalization on a 3 km × 3 km × 1 km grid, assigning averaged values to blocks [31,40,42]. The reliability of the peak-delay results was evaluated with a hit count map (Figure S2), interpreting only blocks crossed by a minimum of 20 seismic rays, a threshold already successfully applied in a similar context and to a comparable dataset [31].
For each waveform, we also calculated the coda quality factor () using the linearized form of the coda energy (E(t,f)) equation [23]:
where S(f) represents the source term, t is the lapse time (i.e., the time between the origin of the earthquake and the coda-wave time), and the constant α, associated with geometric spreading, is fixed at 3/2 based on a multiple scattering interpretation [42]. We used 15 s long coda windows selected at a fixed lapse time—the time range between the origin time of the event and the beginning of the coda window—of 30 s (thus t = 30 s) to ensure energy equipartition of the three components, a condition necessary for reaching the diffusion regime and interpreting the coda quality factor () as the absorption quality factor () [42]. Figure S3 shows that measurements in the selected coda window are constant and independent within the chosen ray length range, ensuring minimal coherent information is preserved within the coda. Absorption images, mapped on the same grid as the peak delay, were obtained using the inversion scheme proposed by De Siena et al. [43], which employs 3D diffusive sensitivity kernels [44,45] based on Paasschen’s equations [46] and is independent of the 3D velocity model. Well-resolved areas were selected by performing checkerboard and spike tests (Figures S4 and S5).
3. Results
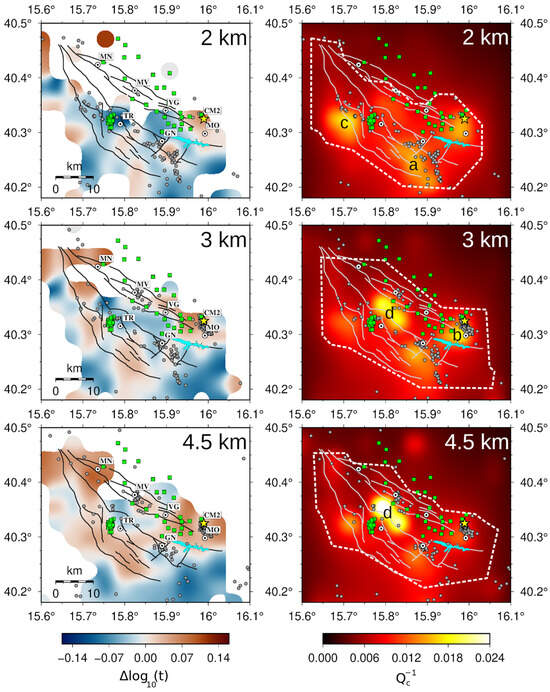
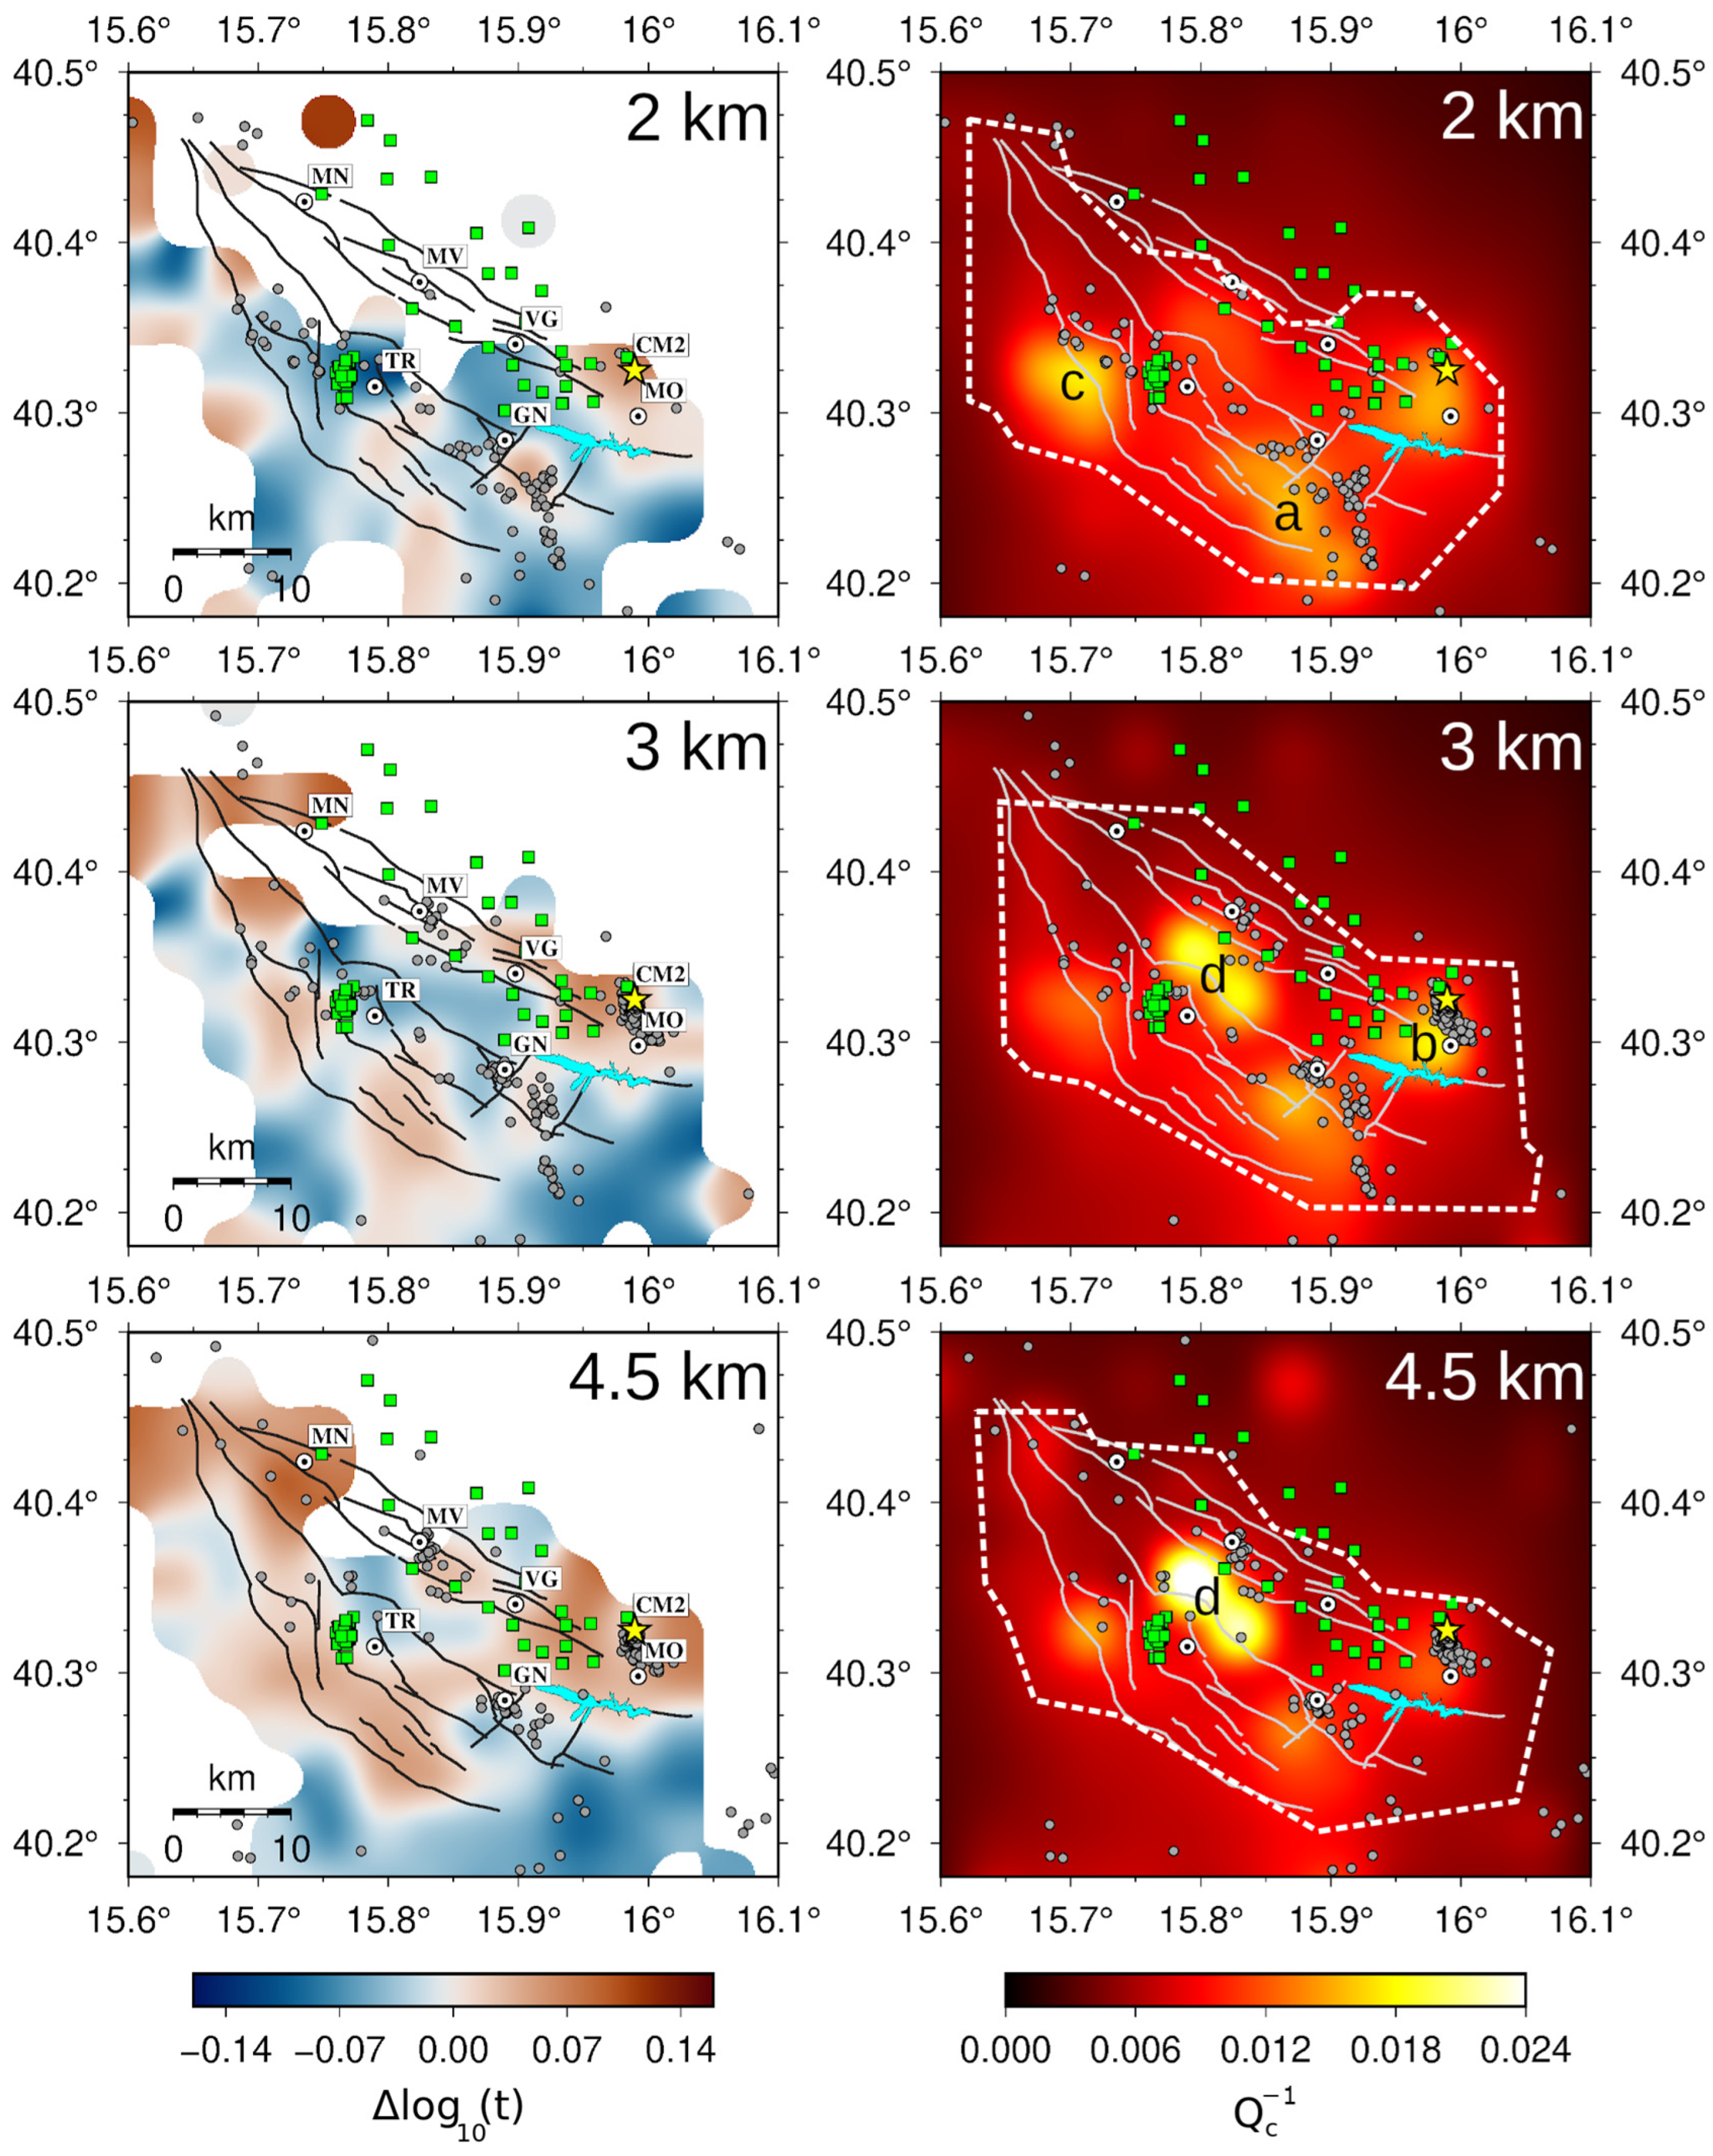
Figure 2 shows three horizontal depth slices (depths labeled on the top right corner in km below sea level) of the 3D peak-delay (scattering proxy) and (absorption proxy) model of the HAV at 1.5 Hz. Scattering maps (left panels in Figure 2) display positive (red) and negative (blue) anomalies relative to the average peak-delay value at a specific hypocentral distance, with areas crossed by fewer than 20 rays appearing white. This ray threshold is quite high, allowing a more restrictive interpretation of certain areas. Absorption maps (, right panels in Figure 2) use brighter colors to indicate higher values. Each map includes earthquakes within ±1 km of the respective depth slice. The grid spacing for regionalization (peak delay) and inversion () enables interpretation of anomalies that are 3 km wide horizontally and 1 km deep vertically. Unfortunately, the northern part of the scattering maps (left panels in Figure 2), particularly the area covering the EAFS fault traces north of VG, is insufficiently sampled by seismic rays down to a depth of 2 km. Beyond this depth, the area is better resolved. This limitation, which will be discussed in the following sections, is certainly caused by the uneven distribution of earthquake and seismic stations in the area. Stations are denser in the zone characterized by induced seismicity caused by the CM2 reinjection well and the pressure exerted by seasonal variations in the Pertusillo artificial lake. This implies that the southern part of the map is well resolved at all depths. Checkerboard and spike tests allow us to interpret all the main high-absorption anomalies, labeled from a to d in the absorption maps (right panels in Figure 2).
Figure 2.
Horizontal slices at three depths, shown in the upper right corner, of peak-delay (left panels, scattering proxy) and (right panels, absorption proxy) maps at the central frequency of 1.5 Hz. Peak-delay variations are only shown in all those blocks crossed by at least 20 rays, while well-resolved areas by the checkerboard tests in the maps are outlined by a white dashed contour. Gray circles are the locations of earthquakes within 1 km of the slice depth. Dark gray (scattering map) and white (absorption map) thin lines mark the fault traces available in the study area. Green squares represent the production wells; the yellow star indicates the location of the CM2 well. The a, b, c, d letters in the absorption maps represent the anomalies, which are discussed later in the manuscript. Pertusillo Lake is shaded in light blue. Major municipalities are the black and white circles. For any further details, please refer to Figure 1.
These analyses have also been carried out at 3 and 6 Hz. Figures S6 and S7 display the complete set of slices at depths ranging from 1 to 6 km, at frequencies centered at 1.5 Hz, 3 Hz, and 6 Hz. It has already been established in previous works (e.g., [31,40]) that higher central frequencies highlight the larger contribution of smaller structures. A multi-frequency analysis, thus, has been performed to enhance the interpretation of scattering and absorption maps, marking the possible contribution of structures characterized by different sizes. In Figure S6, we kept the same color scale for the scattering maps at different frequencies, with peak-delay variation ranging from −0.15 to 0.15, while adjusting the color scale to enable a clearer visualization of high-absorption anomalies (Figure S7).
At a central frequency of 1.5 Hz, low scattering dominates in the first two km depth, except for the CM2 well volume and the area between the Pertusillo lake and GN (Figure 2). High scattering follows the main fault traces (MMFS and EAFS) at a depth of 3 km, while remaining low in the central part of the valley down to 4.5 km. At greater depths, high scattering dominates the entire HAV map (left panels in Figure S6). The scattering maps at higher frequencies (3 and 6 Hz, central and right panels in Figure S6) show a strong similarity. At these frequencies, the maps show widespread high scattering at nearly all depths along the MMFS, whereas low scattering characterizes the CM2 well area at all depths, expanding from the area around Pertusillo Lake (at 3 km depth), and comprising the central part of the valley (between TR, MV, and VG) at depths between 4.5 and 6 km. These anomalies are only partially detected at 1.5 Hz, where low scattering marks volumes between depths of 1 and 3 km and focuses on the middle of the valley down to a depth of 4.5 km. The CM2 reinjection well area is characterized by high scattering at all depths at 1.5 Hz, contrary to the patterns observed in the maps at higher frequencies.
The high-absorption anomalies appear stable across all analyzed frequencies. Specifically, we identify a widespread, high-absorption, and aseismic anomaly (labeled c in Figure 2), west of TR and between 2 and 3 km depth, and a deeper anomaly (at 4.5 km, labeled d in Figure 2), situated more centrally on the map, between TR and MV, which is visible at all frequencies (Figure 2 and Figure S7). Between 2 and 3 km depth, we also identify a high attenuation anomaly associated with the CM2 reinjection well (labeled b in Figure 2) at all frequencies. A second anomaly at a depth of 3 km (labeled a in Figure 2) is located exactly below the city of GN. This anomaly is evident only at 6 Hz and becomes weaker and more diffuse at 3 Hz and 1.5 Hz, respectively (Figure 2 and Figure S7). The scattering and absorption maps will be discussed and interpreted in detail in the following section.
4. Discussion
4.1. Apulian Platform and Tectonic Mélange
The scattering maps at the lowest central frequency (1.5 Hz, left panels in Figure 2 and Figure S6) highlight large-scale characteristics peculiar to the structures involved in the area. At this frequency, diffuse low scattering dominates the HAV between the surface and a depth of 3 km. However, the crustal volumes near the CM2 reinjection well and those southwest of Lake Pertusillo two regions show high-scattering characteristics at all depths. These areas are predominantly characterized by the two types of induced seismicity presented in the introduction, which are the injection-induced seismicity (IIS) near the CM2 well and the reservoir-induced seismicity (RIS) south of GN, respectively. They will be investigated in Section 4.2. At depths greater than 3 km, high scattering becomes predominant.
The widespread shallow low-scattering anomaly at 1.5 Hz is interpreted as an effect of the plastic, fluid-rich, thick clayed formations (i.e., tectonic mélange) on the seismic wavefield [47]. This mélange acts as a decollement layer, separating shallow sedimentary and metamorphic rocks (allochthonous units) from the fractured Inner Apulian Platform. Originating from the complex multi-phase tectonic accretion and detachment of basin-derived Lagonegro units during the Apennine orogeny, this chaotic assembly exhibits a predominantly ductile behavior under regional stress. Comprising over pressured mudstone and siltstone [9,15,48], its low permeability (k < 10−7 mD) [49,50] prevents deep fluid migration, and its thickness can reach 2 km [51]. From a physical standpoint, such high clay content and fluid overpressure result in a low-velocity, highly attenuating medium that lacks the mechanical competence to accumulate significant elastic strain, thereby inhibiting spontaneous seismogenesis within its volume [50]. At a depth of 3 km, a persistent low-scattering anomaly at the HAV center confirms models indicating a thickened mélange [49].
The general distribution of high-scattering anomalies between depths of 4.5 and 6 km (left panels in Figure 2 and Figure S6) can be understood by considering the geometry and physical properties of the Apulian carbonate thrust-and-fold system. Tectonically, the Inner Apulian Platform represents the deeply buried, rigid foreland basement of the region, which undergoes thrusting beneath the allochthonous wedge and the tectonic mélange [49]. Apulian carbonates comprise diffuse networks of cracks and fractures, saturated with formation water (and hydrocarbons in the upper part of the oil field, see [50]). This diffuse, highly fractured structure, inherited from Mesozoic–Cenozoic extensional and contractional tectonic phases, is responsible for the high-fracture permeability that marks the Jurassic–Miocene Apulian limestones. In contrast to the overlying ductile mélange, this deep carbonate reservoir behaves as a brittle, highly competent structural domain. Consequently, it acts as the primary seismogenic layer of the region, capable of generating both deep regional tectonic earthquakes and fluid-triggered events [17]. Pliocene thrust faults and Quaternary normal faults play a secondary role in crustal fracturing, enhancing permeability near fault zones [50]. This setting increases scattering along the main fault systems of the MMFS and the EAFS, as clearly visible when using a low central frequency (1.5 Hz) at a depth of 4.5 km (Figure 2, left panels). Note that the area crossed by the northern surface traces of the EAFS is poorly resolved due to poor ray sampling across the shallowest 3–4 km (Figure S2). We emphasize that our statements are always limited to well-resolved EAFS structures, which are the most southern ones. This behavior agrees with comparable anomalies in the close Pollino region, where the fractured Apulian carbonates have been marked by widespread high-scattering anomalies at similar frequencies [31]. This interpretation is also in line with the NW-SE trend of high-scattering regions defined at depths of 3–4.5 km, which follows the structural trends and culminations of the Apulian thrust-related anticlines, as reported in the geo-structural literature [15]. At a depth of 6 km, the model exhibits a broad region of high scattering, as the crust in this area comprises only Apulian carbonates [52], resulting in high scattering that extends along the entire HAV.
Multi-frequency scattering maps reveal a complex array of structures at various scales along the MMFS, characterized at 3 and 6 Hz by high scattering at all depths (Figure S6, central and right panels). The EAFS at higher frequencies is characterized by high scattering between depths of 1 and 3 km, while lower complexity appears at greater depths (low scattering). This is probably linked to a predominant contribution from large-scale structures and/or to different fault maturity, especially when compared with the MMFS, which has registered more recent seismicity than the EAFS [9,14]. It is also worth mentioning a scattering contrast, visible at central frequencies of 3 and 6 Hz and at a depth of 6 km, extending in a WSW–ENE direction just NW of the towns of TR and MV. This contrast is particularly interesting because structural geology and geochemistry studies [14,16] propose a buried strike-slip structure in this very position and with the same strike angle, which would play a decisive role in the circulation of fluids (hydrocarbons and gas) in the HAV. Unfortunately, the limited coverage of seismic rays and consequent resolution at shallower depths only allows us to highlight this contrast at a depth of 6 km. Despite the good agreement with this inferred structure, we cannot provide details on its shallowest attenuation signatures.
4.2. Fluid Signature in Injection and Reservoir Areas
High-resolution absorption maps identify four high-absorption anomalies, consistently located at the same position and depth across all frequency bands (right panels in Figure 2 and all panels in Figure S7). Anomalies a and b are especially located in areas characterized by induced seismicity. Here, we discuss these anomalies, leaving the interpretation of anomalies c and d for the following section.
Anomaly a, south of GN, varies with increasing frequency (Figure 2 and Figure S7). At 1.5 Hz, the anomaly displays an elongated north–south shape at depths of approximately 1 to 2 km. At 3 and 6 Hz, the anomaly takes on a spherical shape and remains confined between depths of 2 and 3 km (Figure S7). Its northern and eastern borders are defined by seismic clusters that outline its trace. We note that we did not invert for the hypocenters of these events, and the surface fault traces originate from independent studies [50,51,53].
Examination of the 1.5 Hz absorption images reveals that the northernmost part of the anomaly a intersects one of two NE–SW-oriented structures, which, along with the MMFS, create a quasi-square fracture network between Pertusillo Lake and GN. Previous studies have identified high Vp/Vs anomalies (Vp/Vs > 2.0) at the same depths and comparable spatial scales [9,17,18]. Likewise, a high-scattering anomaly marks this crustal volume within the first 3 km of depth at each frequency band. Considering the high-absorption location, the earthquake distribution, and the positive anomaly observed in the scattering map (at each frequency band), we suggest that the northern NE–SW branch acts as a hydraulic connection. This pathway likely facilitates the activation of the southern termination of the MMFS (south of GN) through pore-pressure diffusion, a mechanism previously proposed for this seismicity [5,6]. This volume consistently shows high scattering at different frequencies, indicating the involvement of faults and fractures of various sizes in the process. For the first time, an attenuation tomographic study highlights this structure as a plausible hydraulic connection, providing an explanation for variations in seismicity rates in response to seasonal water level fluctuations in the Pertusillo artificial lake.
Finally, at the same location but at depths greater than 4 km, low scattering and low absorption are observed. These features are consistent with both high Vp and low Vp/Vs anomalies [9,19] and high-resistivity anomalies [19]. An integrated interpretation of these observations suggests that the region consists of competent, dry, and relatively unfractured rock with limited permeability and no significant fluid pathways, thus preventing pore-pressure diffusion and explaining the absence of seismicity.
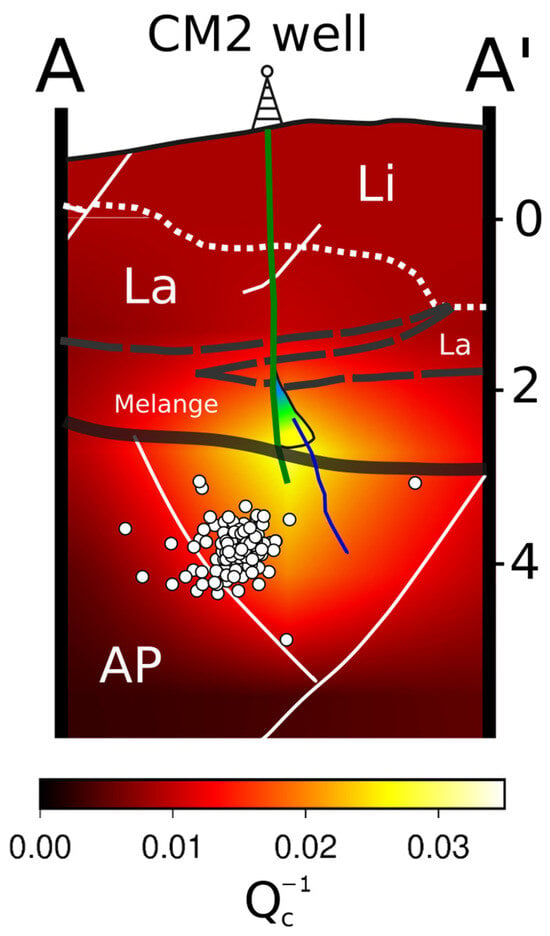
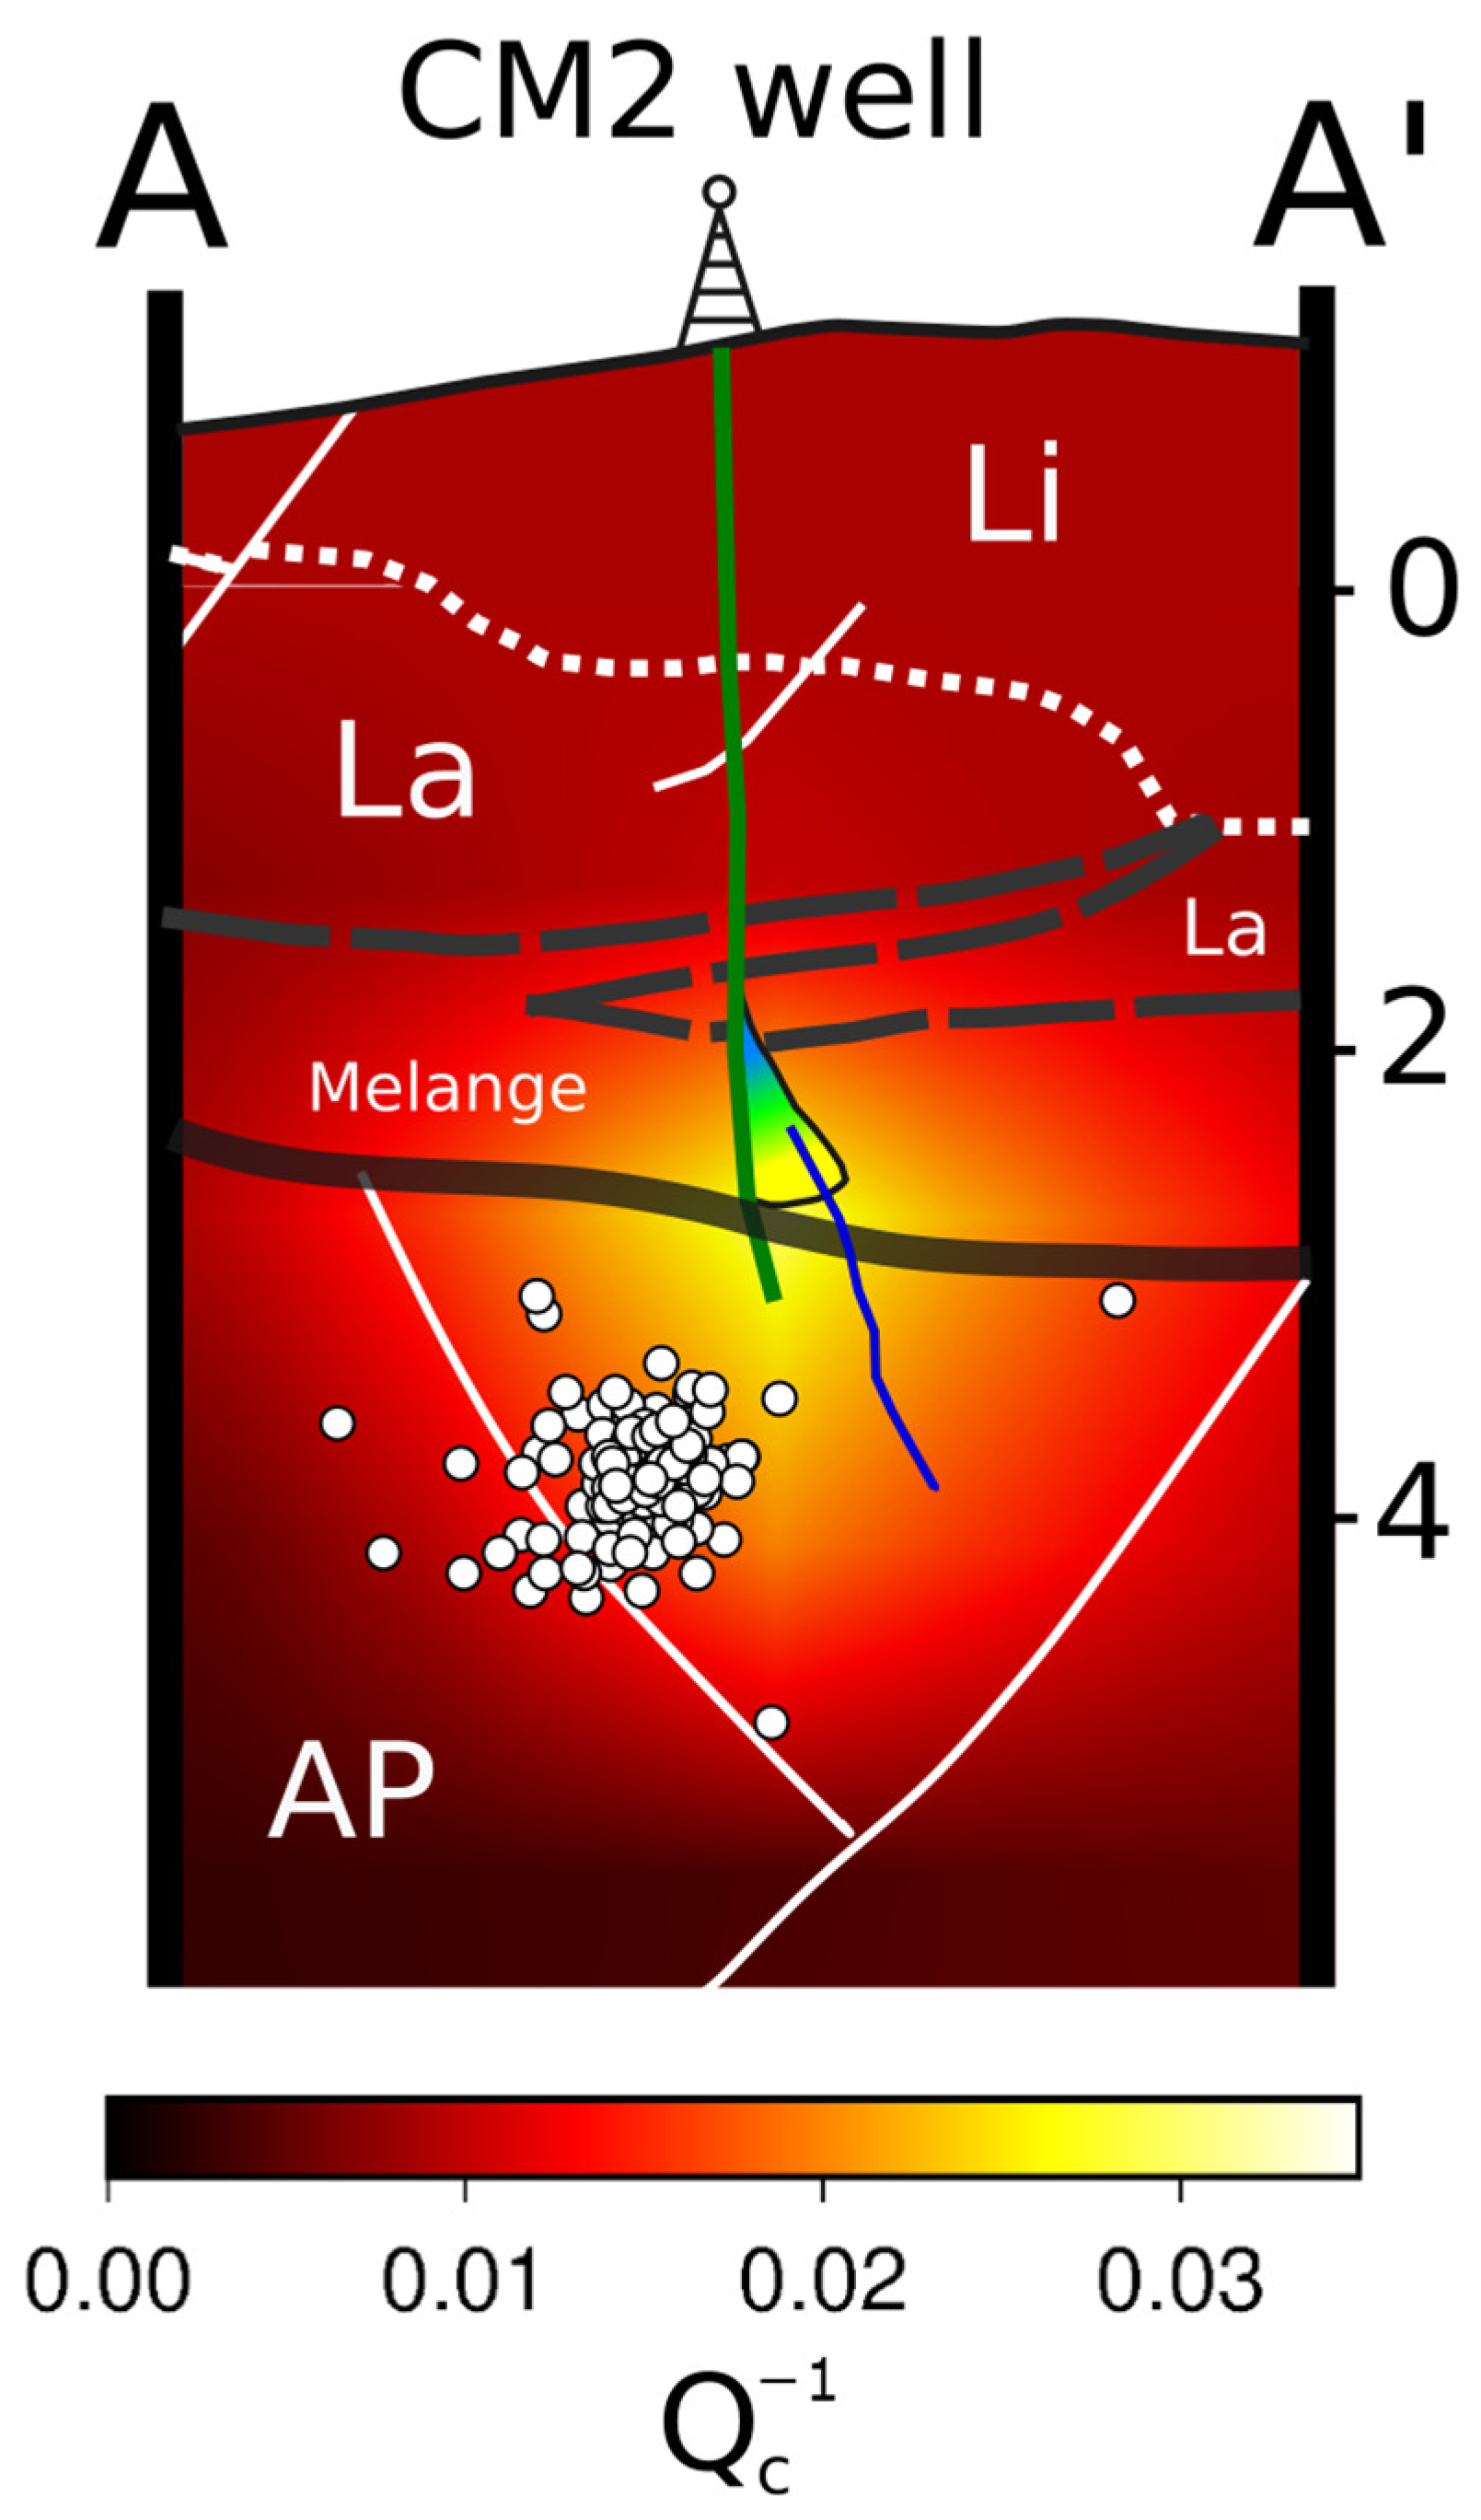
The high-absorption volume labeled b in the SE part of the target area aligns with the exact location of the CM2 reinjection well. This volume is positioned at depths of around 2 and 3 km near the opening of the well and remains consistent across all frequencies (Figure S7). Since June 2006, the wastewater (saline formation water) produced during hydrocarbon extraction has been disposed of in the same reservoir through injection via the CM2 well [54]. The well penetrates the marginal zone of the hydrocarbon reservoir, with open intervals between 2890 m and 3096 m in Upper Cretaceous–Upper Miocene fractured limestone (Figure 3). Direct data from well logs [50] indicate overpressure in the Irpinia Tectonic Mélange between 2 and 3 km depth, precisely matching the high-absorption anomaly. This anomaly is also consistent with the presence of a sub-vertical transverse fault intersecting both the reservoir and the mélange layer near the CM2 injection well, as shown by 2D/3D seismic profiles [55]. Furthermore, previous seismic tomography studies [9,17,18,19] support our findings by identifying the same anomaly as having a high Vp/Vs ratio between depths of 2 and 3 km. The high-absorption anomaly at CM2 offers conclusive evidence that is highly responsive to fluid presence, temperature, and overpressure, aligning with observations from volcanic, tectonic, and geothermal contexts [28,29,30,31,40]. This anomaly likely indicates the volume influenced by wastewater injection and reflects the role of fluid overpressure within the Irpinia tectonic mélange. The 1 km depth resolution limit in the tomographic data constrains our ability to distinguish between the two phenomena, but additional data and more detailed analyses may help clarify their relative contributions.
Figure 3.
Vertical cross-section AA′ (see Figure 1 for section orientation) of the absorption model produced in this study. High-absorption values are displayed in brighter colors. Earthquakes within approximately 1 km of the section are projected onto it and are represented by white circles, with the well profile shown as a green line. The geological scheme was adapted from Hager et al. [50] with the thick dark gray nearly horizontal line dividing the deeper Apulian Platform (AP) from the shallower allochthonous units (Li: Liguridi unit, La: Lagonegresi unit, Melange: Irpinia tectonic mélange). The dashed gray line indicates the upper boundary of the Mélange, and the white dotted lines separate the “Li” and “La” units. White thin solid lines denote faults. The colored wedge symbol near the well delineates the overpressure volume identified by Hager et al. [50] from well logs, while the blue line signifies a fault inferred by Buttinelli et al. [54].
At the same depths, high-scattering anomalies are detected exclusively at 1.5 Hz, highlighting a stronger contribution from large structures, likely part of the EAFS, to scattering within this volume (Figure 2). The major contribution of large structures, including their damage zones, rather than widespread fractures, is supported by previously published works focused on the seismicity within this volume [8,9]. By performing double-difference locations of the events induced by the first injection of wastewater through the CM2 well on 2 June 2006, the authors imaged a single 3 km deep, NE-dipping fault plane, rather than sparse or diffuse seismicity, which would have increased scattering at higher frequencies. For the sake of completeness, our scattering analysis lies at the limit of the well-resolved area based on hit count (Figure S2), due to the earthquake-station distribution and the high threshold of rays required to perform regionalization in each block. Future analyses, including seismic rays extending on the eastern side of the CM2 well, may further validate our interpretation.
4.3. Detection of Fluid Reservoirs and Implications for Seismic Hazard
Here, we discuss the c and d high-absorption anomalies identified in our HAV model (Figure 2). Unlike the areas linked with anomalies a and b, these anomalies are not directly associated with human-induced seismic activity. This is evidenced not only by the relatively sparse and scattered natural seismicity but also by the limited coverage of seismic stations, which results in a less detailed image of the region, as shown, for example, by the scattering maps (Figure S6). Although the scientific literature on this part of HAV remains sparse, recent geological, geochemical, and structural studies provide enough constraints for a confident discussion of these anomalies.
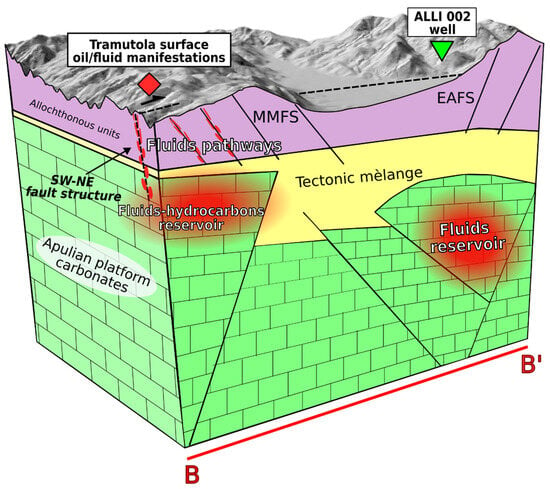
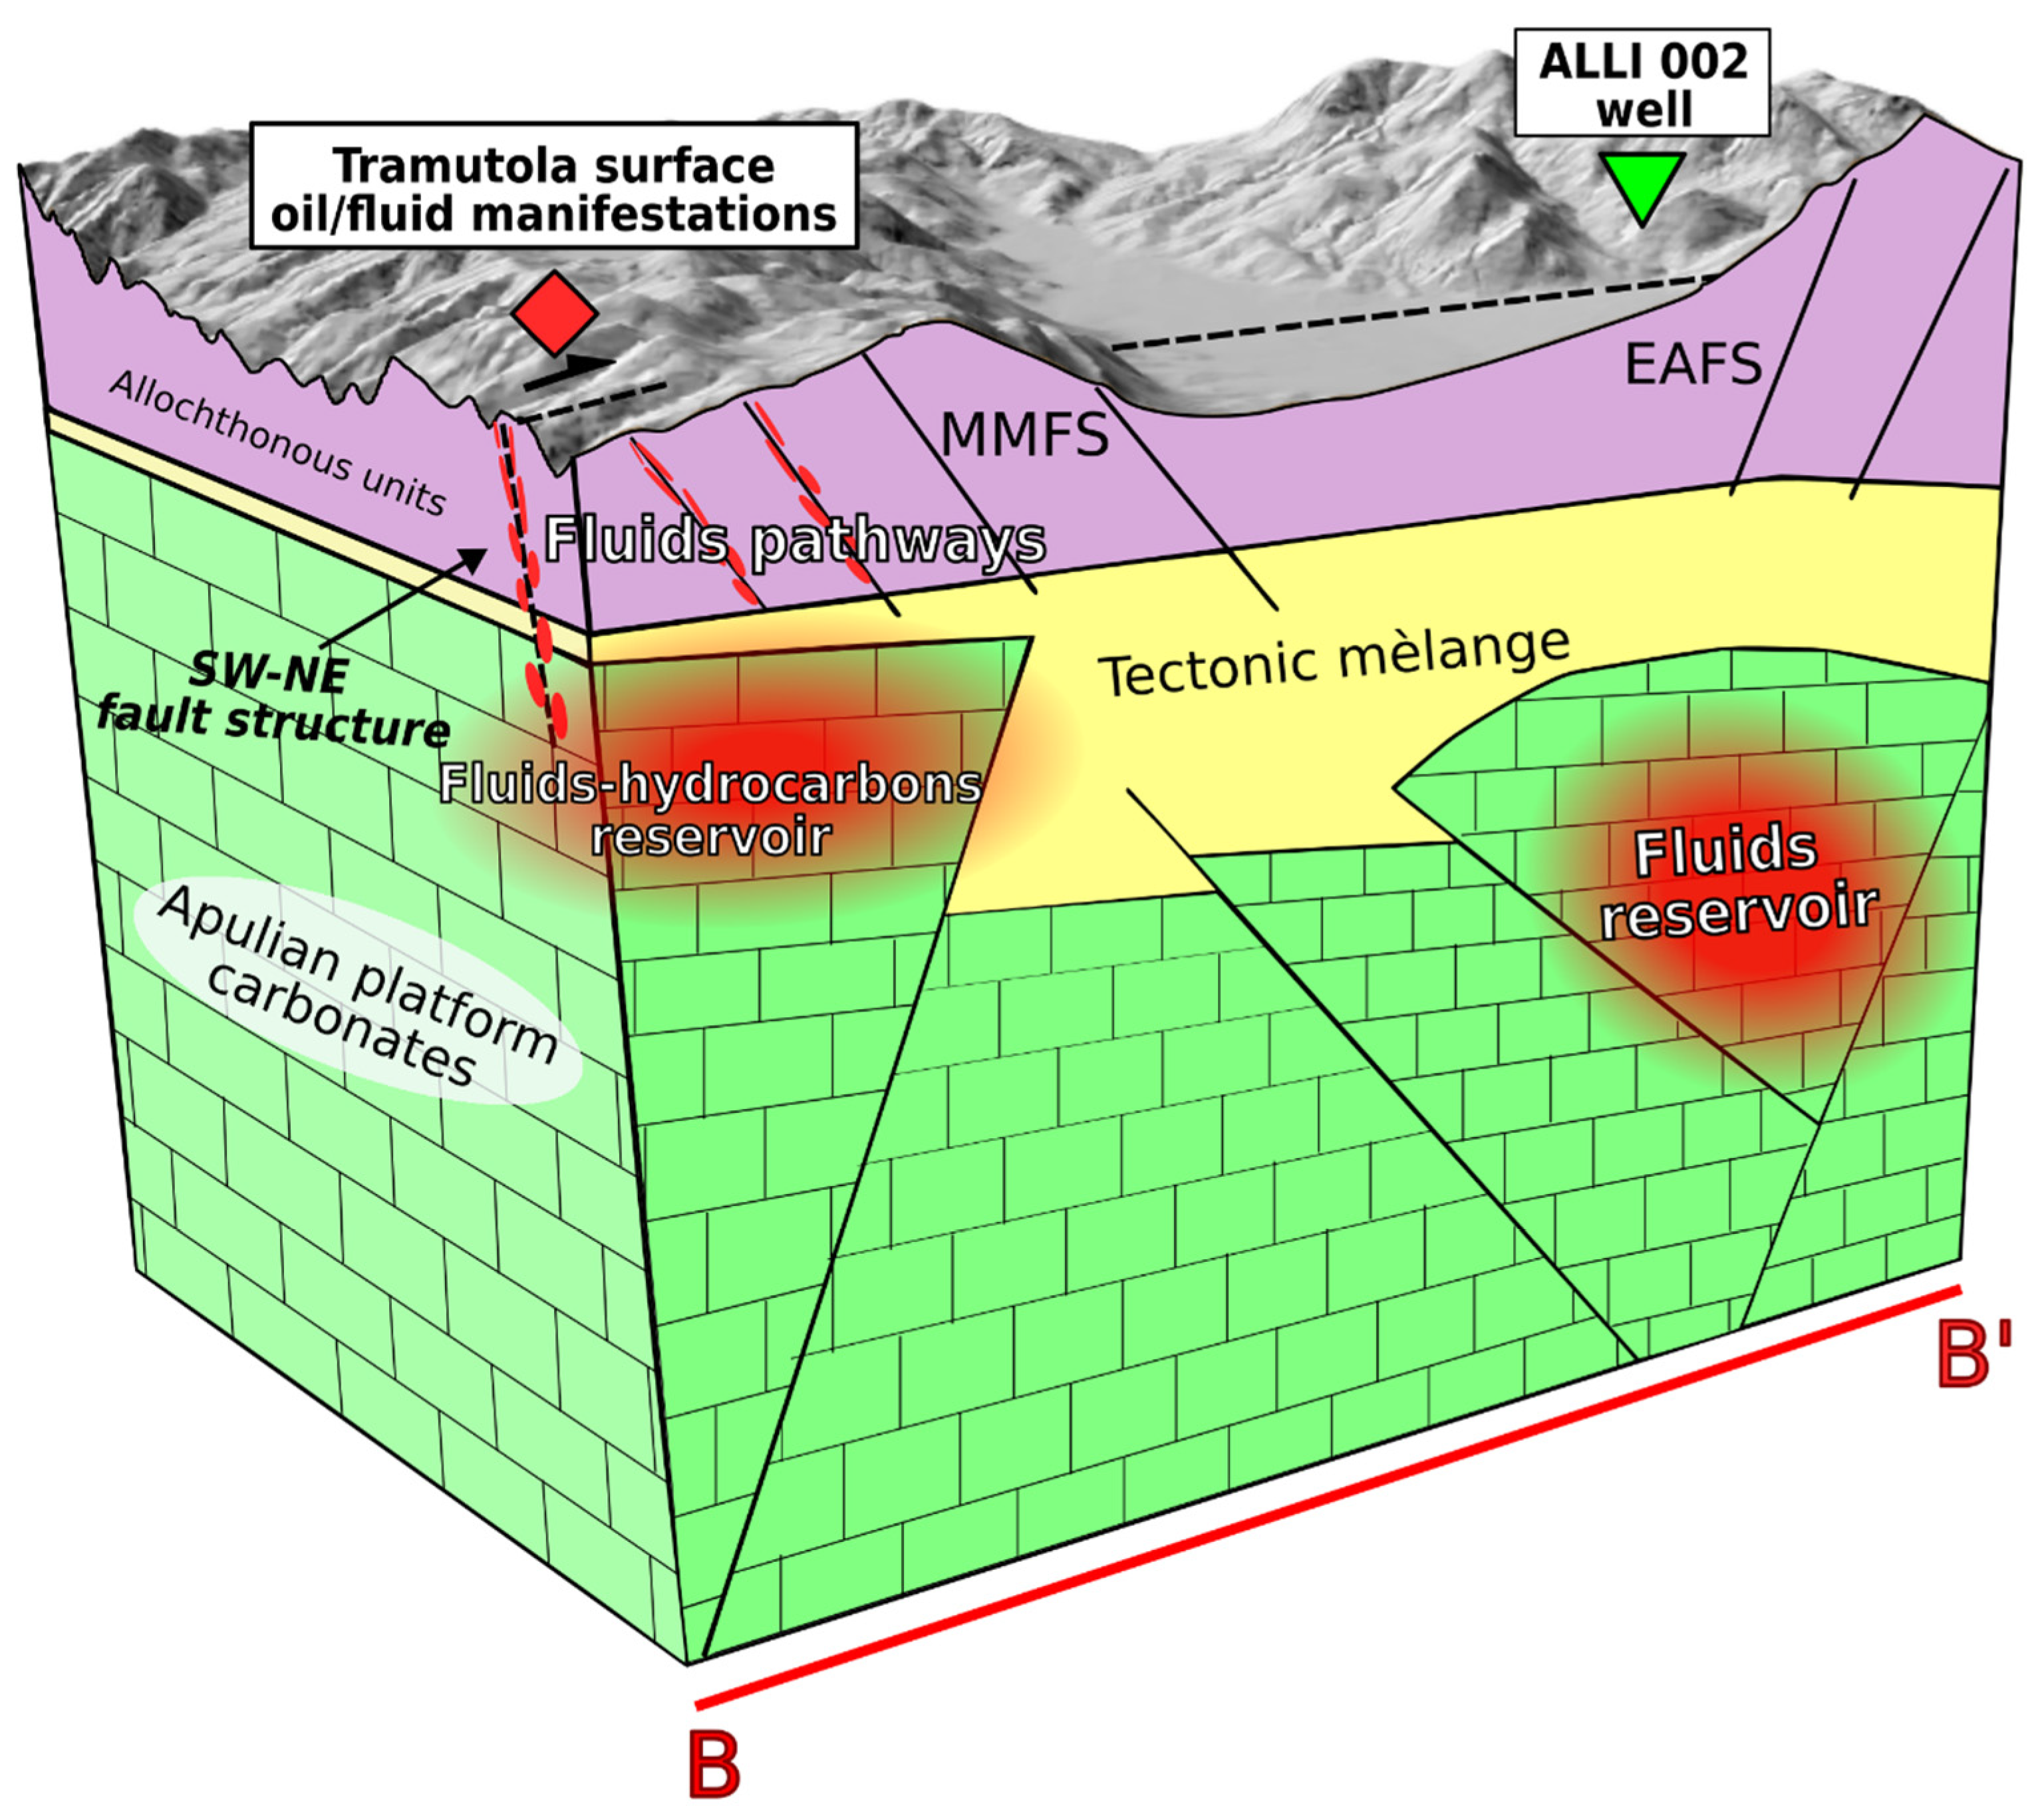
The high-absorption anomaly west of TR (label c in Figure 2) is clearly visible across all analyzed frequencies, indicating a stable and well-resolved feature, as also supported by checkerboard and spike tests (Figures S4 and S5). The anomaly is located at depths of 1–3 km, where the volume also exhibits strong scattering, particularly in the 3 and 6 Hz maps. At a lower frequency (1.5 Hz), the behavior shifts, with low scattering at around 1–2 km depth and high scattering beneath 3 km. The coincidence of high absorption and high scattering suggests the presence of a potential fluid reservoir at the distal portion of the Apulian Platform. This interpretation aligns with magnetotelluric (MT) measurements [52], which identified a shallow low-resistivity layer (<1 km depth) corresponding to the Lagonegro units and a resistive boundary at approximately 2 km depth representing the Apulian carbonates. High-resistivity anomalies in the area have been linked to structural features affecting the Apennine nappe pile, potentially facilitating hydrothermal circulation and early hydrocarbon migration. The relatively low temperatures recorded for these fluids (~28 °C) may relate to aquifers within the buried Lagonegro units [56], possibly leading to an underestimation of the true geothermal potential. In this context, the high-absorption anomaly could denote an important reservoir (Figure 4).
Figure 4.
Conceptual model of the main findings of this study related to the red cross-section BB′ depicted in Figure 1. The yellow volume represents the tectonic mélange, separating the shallower allochthonous units (violet color) from the deeper brittle carbonates of the Apulian platform (green color). The two high-absorption volumes (c and d anomalies) are illustrated as red ellipses. Black lines indicate major fault structures. The SW–NE suggested faults [14,16,56] and the normal MMFS, which serve as preferred pathways for fluids and oil to reach the surface, are highlighted in red. The area with surface manifestations is labeled by a red marker, whilst a green triangle represents the ALLI 002 production well.
Historical evidence supports this interpretation: natural oil seeps in the TR area prompted exploration as early as 1936, leading to the drilling of 48 wells (Figure 1). However, the limited hydrocarbon yields resulted in the abandonment of the TR permit in 1959. More recent studies of fluid circulation and geochemistry [14,16] associate these seeps and deep fluid emissions near Tramutola with a major blind SW–NE transverse fault that cuts across the HAV Quaternary basin, east of the study area. Another recent study, integrating field geology, reinterpretation of old wells, and a deep ERT survey [56], suggested that a polyphase tectonic evolution produced fault intersections, with the Fossatello fault as the most important E–W-striking structure, which favored the circulation and upward migration of deep hypothermal fluids and, possibly, hydrocarbons near the 48 wells. Although our methodology does not allow us to track the exact pathways of deep fluids to the surface, it does provide constraints on their possible localization within a highly fractured medium (Figure 4). This interpretation is consistent with similar high-absorption anomalies observed in nearby tectonic settings, such as the Pollino region [31] and the Central Apennines [40].
Our findings aim to complement existing and recent geological, geophysical, and geochemical data, contributing to a more integrated understanding of an exploitable fluid reservoir in the area. In particular, the evidence of shallow and intense geo-resources suggests that this anomaly may play a key role in assessing the geothermal potential of the village of Tramutola, already recognized as a “city of energy” for its commitment to renewable sources and Renewable Energy Communities (CER).
The last high-absorption anomaly, labeled d, is situated at a depth of 4.5 km across all frequency bands (right panels in Figure 2 and Figure S7), although it already appears at 3 km depth at 1.5 Hz (left panels in Figure S7). This anomaly is located within the core of the HAV, in the northern section of the hydrocarbon reservoir, and seems to be well resolved, as shown by the checkerboard and spike tests (Figures S4 and S5). Additionally, the anomaly appears to end to the NW where it intersects with the blind SW–NE transverse fault that cuts across the HAV Quaternary basin a few kilometers NW of the towns of TR and MV [9,14]. Scattering maps at 3 and 6 Hz (Figure S6) reveal a SW–NE oriented contrast at 6 km depth, likely related to variations in rheology caused by this tectonic structure. However, the limited resolution at shallower depths does not allow further confirmation of this inference at the surface. The depth of the high-absorption anomaly coincides with the depth of the Inner Apulian Platform [9,15]. Notably, it appears to be partly associated with a low Vp/Vs ratio identified by Improta et al. [9], which they interpret as the Triassic evaporitic bodies within the IAP succession. Beaubien et al. [14] also highlight significant gas anomalies in the same volume. These anomalies, believed to originate from deep thermogenic sources, align along the buried SW–NE trending transverse fault and along segments of the MMFS. Our high-absorption anomaly could be relate to these gas anomalies, which trend along the MMFS at each frequency band and terminate at the intersection with the buried transverse fault.
5. Conclusions
This study presents the first multi-frequency scattering and absorption imaging of the HAV, a seismically active region influenced by natural and anthropogenic factors, including hydrocarbon extraction, wastewater reinjection (CM2 well), and reservoir-induced events from seasonal water level fluctuations in the Pertusillo Lake. These techniques are non-invasive, cost-effective, and independent of traditional velocity-based tomography, with which they nevertheless share certain limitations, such as structural resolution and dependence on the spatial distribution of local seismicity. While absorption shows a high sensitivity to fluids and thermal anomalies, seismic scattering provides information about degrees of fracturing and key seismogenic structures involved. The integration of these proxies with the extensive literature on the area allows for a robust reconstruction of the structural anatomy of the basin.
Low-frequency scattering maps highlight major faults (MMFS, EAFS) below 3 km, aligning with the Inner Apulian Platform, while shallower low-scattering anomalies correspond to the tectonic mélange, thickest at the valley center. A high-absorption anomaly directly correlates with wastewater injection at CM2 (3 km depth), co-located with a high-scattering anomaly 1.5 Hz that decreases at higher frequencies. Supported by recent literature on induced seismicity, this frequency dependence suggests that larger fault structures, rather than widespread small fractures, dominate the seismogenic volume.
South of GN, another high-absorption anomaly at depths of 1–3 km marks a NE–SW structure across all frequencies, likely acting as a hydraulic connection that facilitates pore-pressure diffusion from the Pertusillo reservoir to the MMFS West of TR, high absorption at ~2 km depth coincides with a known hydrocarbon reservoir, where fluids reach the surface via high-scattering, smaller-scale strike-slip and normal faults in allochthonous units. Furthermore, a deeper high-absorption zone at 4.5 km beneath the center of the HAV, well correlated with low Vp/Vs and gas anomalies, indicates fluid confinement controlled by intersecting seismogenic structures, the overlying mélange, and the hydrocarbon reservoir.
In conclusion, these results provide new insights into the elastic and inelastic properties of the crust, reinforcing the sensitivity of coda-wave proxies to fluid saturation, temperature, and overpressure. While passive imaging cannot map exact fluid migration pathways, it successfully detects footprints associated with potential reservoirs. Access to currently confidential borehole logs from local wells remains essential to validate these remaining anomalies and firmly establish absorption mapping as a proven footprint for low-to-medium-enthalpy geothermal exploration.
Supplementary Materials
The following supporting information can be downloaded at: https://www.mdpi.com/article/10.3390/geosciences16070263/s1. Figure S1: Log-log plot of peak delay computed on each source–receiver ray as a function of the P-wave travel time at a central frequency of 1.5 Hz. Peak-delay values (red circles) within two standard deviations from the linear fit (blue line) are retained. Figure S2: Hit count at different depths (upper right corner of each slice) showing the well-resolved areas for peak-delay maps. Blocks crossed by at least 20 rays are shown in black color, whereas blocks crossed by fewer rays are shown in lighter shades of gray (with lighter shades corresponding to decreasing numbers of rays). Areas not crossed by any rays are blank. Figure S3: Qc-1 measurements obtained for each waveform (red circles) as a function of the ray length within a central frequency of 1.5 Hz. Figure S4: Checkerboard tests (input on the left side and output on the right side) for the Qc-1 anomaly at depths of 1,2,3,4.5,6, and 7.5 km, where the main absorption anomalies are detected. Figure S5: Map view of the input (left column) and output (right column) spike tests performed for the four high-absorption anomalies at the depth they appear. For each spike, the depth (left panels, top right corner) and the name of the anomaly used in the main text (labels from a to d) are shown. Figure S6: Horizontal slices of peak delay variations (scattering proxy) at 5 different depths (labeled in the upper right corner) at central frequencies of 1.5 Hz (left panels), 3 Hz (central panels) and 6 Hz (right panels). Peak-delay variations are only shown in all those blocks crossed by at least 20 rays. Gray circles are the locations of earthquakes within 1 km from the slice depth. Dark gray thin lines are the fault traces available in the study area. Green squares are the production wells; the yellow star indicates the location of the CM2 well. Major municipalities are represented by black-and-white circles. For further details, please refer to Figure 1. Figure S7: Horizontal slices of Qc-1 variations (absorption proxy) at 5 different depths (labeled in the upper right corner) at central frequencies of 1.5 Hz (left panels), 3 Hz (central panels) and 6 Hz (right panels). Gray circles indicate the locations of earthquakes within 1 km of the slice depth. Gray thin lines mark the fault traces available for the area. Green squares indicate the production wells, and the yellow star indicates the location of the CM2 well. Major municipalities are represented with black and white circles. For further details, please refer to Figure 1.
Author Contributions
F.N., O.A. and T.A.S. conceptualized the research idea. T.A.S. and V.S. performed waveform preprocessing. F.N. and L.D.S. ran the software. All authors contributed to model analysis and interpretation of the results. F.N. and O.A. provided the figures in the main text and Supplementary Material online. F.N. wrote the original draft. All authors reviewed the manuscript. O.A. and P.C. acquired funding for this work. All authors have read and agreed to the published version of the manuscript.
Funding
This work was funded by the project TOGETHER—Sustainable geothermal energy for two Southern Italy regions: geophysical resource evaluation and public awareness financed by European Union—NextGenerationEU Piano Nazionale di Ripresa (PNRR) e Resilienza Missione 4 “Istruzione e Ricerca”—Componente C2, Investimento 1.1, “Fondo per il Programma Nazionale di Ricerca e Progetti di Rilevante Interesse Nazionale (PRIN)” CUP: D53D23022850001, project code: P2022JF5JE.
Data Availability Statement
Earthquake catalogue and station information are available at Zenodo repository: https://zenodo.org/records/15038522 (DOI:10.5281/zenodo.15038522), last access 18 May 2026. Seismic waveforms are available from the following seismic networks: Rete Sismica Nazionale (FDSN code: IV), operated by the Istituto Nazionale di Geofisica e Vulcanologia (2005); Val d’Agri network (FDSN code: VA), operated by the ENI company (2001); INSIEME seismic network (FDSN code: 3F), operated by the Consiglio Nazionale delle Ricerche, CNR-IMAA (Stabile et al. [39]). The open access code MuRAT (version 3.0), used to perform analyses, is available in the Zenodo repository: https://zenodo.org/records/15038583 (DOI:10.5281/zenodo.15038583), last access 18 June 2026.
Acknowledgments
This work was supported by the project TOGETHER—Sustainable geothermal energy for two Southern Italy regions: geophysical resource evaluation and public awareness financed by European Union—NextGenerationEU Piano Nazionale di Ripresa (PNRR) e Resilienza Missione 4 “Istruzione e Ricerca”—Componente C2, Investimento 1.1, “Fondo per il Programma Nazionale di Ricerca e Progetti di Rilevante Interesse Nazionale (PRIN)” CUP: D53D23022850001, project code: P2022JF5JE and ITINERIS—Italian Integrated environmental research infrastructures system financed by European Union—Next Generation EU Piano Nazionale di Ripresa (PNRR), M4C2 inv.3.1, CUPB53C2200215000.
Conflicts of Interest
Author Ferdinando Napolitano was employed by the company PHY4 S.r.l.s., Fisciano, Italy. The remaining authors declare that the research was conducted in the absence of any commercial or financial relationships that could be construed as a potential conflict of interest.
References
- Ferranti, L.; Oldow, J.S. History and tectonic implications of low angle detachment faults and orogen parallel extension, Picentini Mountains, Southern Apennines fold and thrust belt, Italy. Tectonics 1999, 18, 498–526. [Google Scholar] [CrossRef] [Scilit]
- Vittori, E.; Maschio, L.; Ferreli, L.; Michetti, A.M.; Serva, L. Carta e base di dati delle faglie capaci per l’Italia centro-meridionale: Presentazione e stato di avanzamento del progetto ITHACA. Il Quat. 1997, 10, 305–312. [Google Scholar]
- Servizio Geologico d’Italia—ISPRA. Carta Geologica d’Italia Alla Scala 1:50.000, Foglio 505 “Moliterno”; Progetto CARG; Servizio Geologico d’Italia—ISPRA: Roma, Italy, 2014. [Google Scholar]
- Rovida, A.; Locati, M.; Camassi, R.; Lolli, B.; Gasperini, P. The Italian earthquake catalogue CPTI15. Bull. Earthq. Eng. 2020, 18, 2953–2984. [Google Scholar] [CrossRef] [Scilit]
- Valoroso, L.; Improta, L.; Chiaraluce, L.; Di Stefano, R.; Ferranti, L.; Govoni, A.; Chiarabba, C. Active faults and induced seismicity in the Val d’Agri area (southern Apennines, Italy). Geophys. J. Int. 2009, 178, 488–502. [Google Scholar] [CrossRef] [Scilit]
- Stabile, T.A.; Giocoli, A.; Lapenna, V.; Perrone, A.; Piscitelli, S.; Telesca, L. Evidence of low-magnitude continued reservoir-induced seismicity associated with the Pertusillo artificial lake (southern Italy). Bull. Seismol. Soc. Am. 2014, 104, 1820–1828. [Google Scholar]
- Stabile, T.A.; Giocoli, A.; Perrone, A.; Piscitelli, S.; Telesca, L.; Lapenna, V. Relationship between seismicity and water level of the Pertusillo reservoir (southern Italy). Boll. Geofis. Teor. Appl. 2015, 56, 505–517. [Google Scholar]
- Stabile, T.A.; Giocoli, A.; Perrone, A.; Piscitelli, S.; Lapenna, V. Fluid injection induced seismicity reveals a NE dipping fault in the southeastern sector of the High Agri Valley (southern Italy). Geophys. Res. Lett. 2014, 41, 5847–5854. [Google Scholar] [CrossRef] [Scilit]
- Improta, L.; Bagh, S.; De Gori, P.; Valoroso, L.; Pastori, M.; Piccinini, D.; Chiarabba, C.; Anselmi, M.; Buttinelli, M. Reservoir structure and wastewater-induced seismicity at the Val d’Agri oilfield (Italy) shown by three-dimensional Vp and Vp/Vs local earthquake tomography. J. Geophys. Res. Solid Earth 2017, 122, 9050–9082. [Google Scholar]
- Stabile, T.A.; Vlček, J.; Wcisło, M.; Serlenga, V. Analysis of the 2016–2018 fluid-injection induced seismicity in the High Agri Valley (southern Italy) from improved detections using template matching. Sci. Rep. 2021, 11, 20630. [Google Scholar] [CrossRef] [Scilit] [PubMed]
- Vannoli, P.; Martinelli, G.; Valensise, G. The seismotectonic significance of geofluids in Italy. Front. Earth Sci. 2021, 9, 579390. [Google Scholar] [CrossRef] [Scilit]
- Della Vedova, B.; Bellani, S.; Pellis, G.; Squarci, P.; Vai, G.B.; Martini, I.P. Deep temperatures and surface heat flow distribution. In Anatomy of an Orogen: The Apennines and Adjacent Mediterranean Basins; Springer: Dordrecht, The Netherlands, 2001; pp. 65–76. [Google Scholar]
- Gori, F.; Paternoster, M.; Barbieri, M.; Buttitta, D.; Caracausi, A.; Parente, F.; Sulli, A.; Petitta, M. Hydrogeochemical multi-component approach to assess fluids upwelling and mixing in shallow carbonate-evaporitic aquifers (Contursi area, southern Apennines, Italy). J. Hydrol. 2023, 618, 129258. [Google Scholar]
- Beaubien, S.E.; Schirripa Spagnolo, G.; Ridolfi, R.M.; Aldega, L.; Antoncecchi, I.; Bigi, S.; Billi, A.; Carminati, E. Structural control of gas migration pathways in the hydrocarbon-rich Val d’Agri basin (Southern Apennines, Italy). Mar. Pet. Geol. 2023, 154, 106339. [Google Scholar] [CrossRef] [Scilit]
- Schirripa Spagnolo, G.; Agosta, F.; Aldega, L.; Prosser, G.; Smeraglia, L.; Tavani, S.; Looser, N.; Guillong, M.; Bernasconi, S.; Billi, A.; et al. Structural architecture and maturity of Val d’Agri faults, Italy: Inferences from natural and induced seismicity. J. Struct. Geol. 2024, 180, 105084. [Google Scholar] [CrossRef] [Scilit]
- Schirripa Spagnolo, G.; Gori, F.; Barberio, M.D.; Boschetti, T.; Marchesini, B.; Ruggieri, G.; Caracausi, A.; Sciarra, A.; Paternoster, M.; Novella, D.; et al. Seismically induced fault leakage from the Val d’Agri hydrocarbon reservoir (Southern Italy). Sci. Total Environ. 2025, 975, 179193. [Google Scholar] [PubMed]
- Valoroso, L.; Improta, L.; De Gori, P.; Chiarabba, C. Upper crustal structure, seismicity and pore pressure variations in an extensional seismic belt through 3-D and 4-D Vp and Vp/Vs models: The example of the Val d’Agri area (southern Italy). J. Geophys. Res. 2011, 116, B07303. [Google Scholar]
- Serlenga, V.; Stabile, T.A. How do local earthquake tomography and inverted dataset affect earthquake locations? The case study of High Agri Valley (southern Italy). Geomat. Nat. Hazards Risk 2019, 10, 49–78. [Google Scholar]
- Balasco, M.; Cavalcante, F.; Romano, G.; Serlenga, V.; Siniscalchi, A.; Stabile, T.A.; Lapenna, V. New insights into the High Agri Valley deep structure revealed by magnetotelluric imaging and seismic tomography (southern Apennines, Italy). Tectonophysics 2021, 808, 228817. [Google Scholar] [CrossRef] [Scilit]
- Rizzo, E.; Giampaolo, V. New deep electrical resistivity tomography in the High Agri Valley basin (Basilicata, Southern Italy). Geomat. Nat. Hazards Risk 2019, 10, 197–218. [Google Scholar]
- Yemane, T.; Kendall, J.M.; Gabrielli, S.; De Siena, L. Mapping geothermal fluids using seismic absorption and scattering: A case study from Aluto volcano. Geophys. Res. Lett. 2025, 52, e2025GL115364. [Google Scholar] [CrossRef] [Scilit]
- Takahashi, T.; Sato, H.; Nishimura, T.; Obara, K. Strong inhomogeneity beneath Quaternary volcanoes revealed from the peak delay analysis of S-wave seismograms of microearthquakes in northeastern Japan. Geophys. J. Int. 2007, 168, 90–99. [Google Scholar]
- Aki, K.; Chouet, B. Origin of coda waves: Source, attenuation, and scattering effects. J. Geophys. Res. 1975, 80, 3322–3342. [Google Scholar] [CrossRef] [Scilit]
- Shapiro, N.M.; Campillo, M.; Margerin, L.; Singh, S.K.; Kostoglodov, V.; Pacheco, J. The energy partitioning and the diffusive character of the seismic coda. Bull. Seismol. Soc. Am. 2000, 90, 655–665. [Google Scholar] [CrossRef] [Scilit]
- Calvet, M.; Margerin, L. Lapse-time dependence of coda Q: Anisotropic multiple-scattering models and application to the Pyrenees. Bull. Seismol. Soc. Am. 2013, 103, 1993–2010. [Google Scholar]
- Margerin, L. Breakdown of equipartition in diffuse fields caused by energy leakage. Eur. Phys. J. Spéc. Top. 2017, 226, 1353–1370. [Google Scholar] [CrossRef] [Scilit]
- De Siena, L.; Thomas, C.; Aster, R. Multi-scale reasonable attenuation tomography analysis (MuRAT): An imaging algorithm designed for volcanic regions. J. Volcanol. Geotherm. Res. 2014, 277, 22–35. [Google Scholar]
- Guardo, R.; De Siena, L.; Prudencio, J.; Ventura, G. Imaging the absorbing feeding and eruptive pathways of Deception Island, Antarctica. Geophys. Res. Lett. 2022, 49, e2022GL099540. [Google Scholar] [CrossRef] [Scilit]
- Reiss, M.C.; De Siena, L.; Muirhead, J.D. The interconnected magmatic plumbing system of the Natron Rift. Geophys. Res. Lett. 2022, 49, e2022GL098922. [Google Scholar] [CrossRef] [Scilit]
- Napolitano, F.; De Siena, L.; Amoroso, O.; Ágústsdóttir, T.; Benediktsdóttir, Á.; Palo, M.; Hjörleifsdóttir, V.; Capuano, P. Scattering and absorption imaging of the Hengill high-temperature geothermal area, southwest Iceland. J. Geophys. Res. Solid Earth 2025, 130, e2024JB030731. [Google Scholar]
- Napolitano, F.; Gabrielli, S.; De Siena, L.; Amoroso, O.; Capuano, P. Imaging overpressurised fracture networks and geological barriers hindering fluid migrations across a slow-deformation seismic gap. Sci. Rep. 2023, 13, 19680. [Google Scholar] [CrossRef] [Scilit] [PubMed]
- Feng, Y.; Ai, Y.; De Siena, L.; He, Y.; Jiang, M.; Mon, C.T.; Zhao, L.; Bai, Y.; Hou, G.; Ling, Y.; et al. Seismic attenuation tomography in Central Myanmar and its implications on continental subduction and arc magmatism. J. Geophys Res. Solid Earth 2026, 131, e2025JB032147. [Google Scholar] [CrossRef] [Scilit]
- Talone, D.; Romano, M.A.; De Siena, L.; Guidarelli, M.; Santulin, M.; Peruzza, L.; Lavecchia, G.; de Nardis, R. Underground Gas Storage as benchmark for seismic attenuation tomography in a tectonically complex region (north-eastern Italy). Geophys. Res. Lett. 2025, 52, e2025GL117956. [Google Scholar]
- Boden, D.R. Geologic Fundamentals of Geothermal Energy; CRC Press: Boca Raton, FL, USA, 2016. [Google Scholar]
- Huenges, E.; Ledru, P. (Eds.) Geothermal Energy Systems: Exploration, Development, and Utilization; John Wiley & Sons: Hoboken, NJ, USA, 2011. [Google Scholar]
- Eppelbaum, L.; Kutasov, I.; Pilchin, A. Applied Geothermics; Springer: Berlin/Heidelberg, Germany, 2014; Volume 751. [Google Scholar]
- INGV. Rete Sismica Nazionale (RSN) [Data set], International Federation of Digital Seismograph Networks (code IV). 2005. Available online: https://eida.ingv.it/it/getdata (accessed on 8 May 2026).
- Eni SpA. Val d’Agri Network [Data set]. International Federation of Digital Seismograph Networks (code VA). 2001. Available online: https://www.fdsn.org/networks/detail/VA/ (accessed on 1 May 2026).
- Stabile, T.A.; Serlenga, V.; Satriano, C.; Romanelli, M.; Gueguen, E.; Gallipoli, M.R.; Ripepi, E.; Saurel, J.-M.; Panebianco, S.; Bellanova, J.; et al. The INSIEME seismic network: A research infrastructure for studying induced seismicity in the High Agri Valley (southern Italy). Earth Syst. Sci. Data 2020, 12, 519–538. [Google Scholar] [CrossRef] [Scilit]
- Gabrielli, S.; Akinci, A.; De Siena, L.; Del Pezzo, E.; Buttinelli, M.; Maesano, F.E.; Maffucci, R. Scattering attenuation images of the control of thrusts and fluid overpressure on the 2016–2017 Central Italy seismic sequence. Geophys. Res. Lett. 2023, 50, e2023GL103132. [Google Scholar] [CrossRef] [Scilit]
- King, T.; De Siena, L.; Benson, P.; Vinciguerra, S. Mapping faults in the laboratory with seismic scattering 1: The laboratory perspective. Geophys. J. Int. 2023, 232, 1590–1599. [Google Scholar]
- Calvet, M.; Sylvander, M.; Margerin, L.; Villaseñor, A. Spatial variations of seismic attenuation and heterogeneity in the Pyrenees: Coda Q and peak delay time analysis. Tectonophysics 2013, 608, 428–439. [Google Scholar] [CrossRef] [Scilit]
- De Siena, L.; Chiodini, G.; Vilardo, G.; Del Pezzo, E.; Castellano, M.; Colombelli, S.; Tisato, N.; Ventura, G. Source and dynamics of a volcanic caldera unrest: Campi Flegrei, 1983–84. Sci. Rep. 2017, 7, 8099. [Google Scholar] [CrossRef] [Scilit] [PubMed]
- Del Pezzo, E.; De La Torre, A.; Bianco, F.; Ibañez, J.; Gabrielli, S.; De Siena, L. Numerically calculated 3D space-weighting functions to image crustal volcanic structures using diffuse coda waves. Geosciences 2018, 8, 175. [Google Scholar] [CrossRef] [Scilit]
- Del Pezzo, E.; Ibáñez, J.M. Seismic coda-waves imaging based on sensitivity kernels calculated using an heuristic approach. Geosciences 2020, 10, 304. [Google Scholar] [CrossRef] [Scilit]
- Paasschens, J.C.J. Solution of the time-dependent Boltzmann equation. Phys. Rev. E 1997, 56, 1135. [Google Scholar] [CrossRef] [Scilit]
- Patacca, E.; Scandone, P. Geology of Southern Apennines. Boll. Soc. Geol. Ital. 2007, 7, 75–119. [Google Scholar]
- Butler, R.W.H.; Mazzoli, S.; Corrado, S.; De Donatis, M.; Di Bucci, D.; Gambini, R.; Naso, G.; Nicolai, C.; Scrocca, D.; Shiner, P.; et al. Applying thick-skinned tectonic models to the Apennine thrust belt of Italy—Limitations and implications. In Thrust Tectonics and Hydrocarbon Systems; McClay, K.R., Ed.; AAPG: Tulsa, OK, USA, 2004; Volume 82, pp. 647–667. [Google Scholar]
- Mazzoli, S.; Barkham, S.; Cello, G.; Gambini, R.; Mattioni, L.; Shiner, P.; Tondi, E. Reconstruction of continental margin architecture deformed by the contraction of Lagonegro Basin, southern Apennines, Italy. J. Geol. Soc. Lond. 2001, 158, 309–319. [Google Scholar] [CrossRef] [Scilit]
- Hager, B.; Dietrerich, J.; Frohlich, C.; Juanes, R.; Mantica, S.; Shaw, J.H.; Bottazzi, F.; Caresani, F.; Castineira, D.; Cominelli, A.; et al. A process-based approach to understanding and managing triggered seismicity. Nature 2021, 595, 684–689. [Google Scholar] [CrossRef] [Scilit] [PubMed]
- Giocoli, A.; Stabile, T.A.; Adurno, I.; Perrone, A.; Gallipoli, M.R.; Gueguen, E.; Norelli, E.; Piscitelli, S. Geological and geophysical characterization of the southeastern side of the High Agri Valley (southern Apennines, Italy). Nat. Haz. Earth Syst. Sci. 2015, 15, 315–323. [Google Scholar] [CrossRef] [Scilit]
- Balasco, M.; Giocoli, A.; Piscitelli, S.; Romano, G.; Siniscalchi, A.; Stabile, T.A.; Tripaldi, S. Magnetotelluric investigation in the High Agri Valley (southern Apennines, Italy). Nat. Hazards Earth Syst. Sci. 2015, 15, 843–852. [Google Scholar] [CrossRef] [Scilit]
- Bello, S.; Lavecchia, G.; Andrenacci, C.; Ercoli, M.; Cirillo, D.; Carboni, F.; Barchi, M.R.; Brozzetti, F. Complex trans-ridge normal faults controlling large earthquakes. Sci. Rep. 2022, 12, 10676. [Google Scholar] [CrossRef] [Scilit] [PubMed]
- Stabile, T.A.; Telesca, L. The statistical fingerprint of fluid-injection operations on microseismic activity at the Val d’Agri oil field (southern Italy). Energies 2023, 16, 5877. [Google Scholar]
- Buttinelli, M.; Improta, L.; Bagh, S.; Chiarabba, C. Inversion of inherited thrusts by wastewater injection induced seismicity at the Val d’Agri oilfield (Italy). Sci. Rep. 2016, 6, 37165. [Google Scholar] [CrossRef] [Scilit] [PubMed]
- Olita, F.; Giampaolo, V.; Rizzo, E.; Palladino, G.; Capozzoli, L.; De Martino, G.; Prosser, G. Investigation of the geological structure of the Tramutola Area (Agri Valley): Inferences for the presence of geofluids at shallow crustal levels. Geosciences 2023, 13, 83. [Google Scholar] [CrossRef] [Scilit]
Disclaimer/Publisher’s Note: The statements, opinions and data contained in all publications are solely those of the individual author(s) and contributor(s) and not of MDPI and/or the editor(s). MDPI and/or the editor(s) disclaim responsibility for any injury to people or property resulting from any ideas, methods, instructions or products referred to in the content. |
© 2026 by the authors. Licensee MDPI, Basel, Switzerland. This article is an open access article distributed under the terms and conditions of the Creative Commons Attribution (CC BY) license.