


Abstract
Real-time lithology identification while drilling is widely applied in oil and gas exploration, development drilling, geo-steering, unconventional resource extraction, well logging, and environmental monitoring, enhancing efficiency and accuracy in subsurface operations. This study investigates the frequency characteristics of rock-drilling sounds generated during drilling operations and explores their potential for real-time lithology identification. Experiments were conducted using 8 mm and 14 mm drill bits at both high and low rotational speeds on four types of rock samples: sandstone, limestone, granite, and shaly sandstone. Sound signals were recorded both within the rock and in air using high-fidelity sensors. The results reveal distinct frequency patterns for each rock type, with sandstone exhibiting dominant low-frequency energy, limestone and granite showing broader frequency bands with strong high-frequency components, and shaly sandstone displaying a mix of low- and high-frequency energy. Quadratic polynomial regression models between the Vp or Vs and the peak frequencies of the four distinct rock samples are built, and the corresponding coefficients of determination are 0.9878 and 0.9799. The study also demonstrates that drilling parameters, such as drill bit diameter and revolutions per minute (RPM), significantly influence the frequency distribution of rock-drilling sounds, with larger drill bits and higher RPMs producing broader frequency bands and stronger high-frequency energy. Comparisons between in-rock and in-air recordings show that the latter captures richer high-frequency information, though the overall trends remain consistent. These findings provide an experimental foundation for using rock-breaking sounds as a potential tool for lithology identification during drilling operations. The study highlights the importance of considering rock heterogeneity and drilling conditions when interpreting acoustic data and suggests future work to validate the method in field conditions and integrate advanced data processing techniques.
1. Introduction
Real-time measurements during drilling operations are considered a critical factor for operational success. They enable continuous monitoring of downhole conditions, providing high-resolution data that enhances situational awareness. This real-time data acquisition supports timely and informed decision-making, improves operational efficiency, and reduces the risk of drilling-related complications [1,2,3]. Downhole lithology identification is also a key success factor in overcoming multiple drilling-related problems; therefore, it has become a central focus for both academic research and industry. By providing immediate and accurate information about the geological formations being drilled, this technology significantly enhances decision-making processes, optimizes drilling operations, and reduces associated risks and costs [4,5]. Existing lithology identification methods primarily include well logging, core analysis, cuttings analysis, and seismic interpretation, which provide valuable insights into subsurface formations but often face challenges such as time delays, high costs, and limited resolution. Additionally, these methods may struggle with real-time application, accuracy in complex geological settings, and integration of multi-source data, limiting their effectiveness in dynamic drilling environments [6]. In addition, drill-bit seismic while drilling (SWD) serves as an effective real-time monitoring technique that can detect geological structures ahead of the drill bit. However, obtaining information about formation lithology requires complex processing and detailed interpretation of the measured data [7,8]. While drill-bit SWD can be used for predicting formation interfaces and velocities ahead of the bit, its application for direct lithology identification is limited by its indirect measurement nature, insufficient resolution for thin beds, strong dependence on drilling parameters, etc. Consequently, SWD-derived velocities often require calibration with surface drilling data or downhole logs to reduce ambiguity and enable reliable lithological interpretation.
Numerous laboratory-based studies have investigated the acoustic signals generated during drilling under controlled conditions. Nakken et al. (1990) attached a triaxial accelerometer directly to rock samples and demonstrated that roller cone-induced noise could serve as a downhole acoustic source for sonic logging [9]. Gradl et al. (2008) employed a standard microphone pointed at the drill bit to record bit-rock interaction noise, revealing that different drill bit designs emit distinct frequency characteristics [10]. Vardhan et al. (2009) conducted controlled experiments to estimate rock properties such as compressive strength and abrasivity using sound levels produced during drilling [11]. Li and Itakura (2012) proposed an analytical drilling model to evaluate unconfined compressive strength from drilling data [12]. Kumar et al. (2013) developed multiple regression and neural network models to predict intact rock properties from sound levels recorded during laboratory rock-drilling experiments [13]. Esmaeili et al. (2013) used a laboratory drilling rig equipped with a vibration sensor sub to investigate the effect of formation compressive strength on drill string vibrations [14]. Vununu et al. (2018) examined a deep feature learning method for drill bit monitoring using spectral analysis of acoustic signals [15]. Auriol et al. (2019) established a sensing and computational framework to estimate seismic velocities of rocks interacting with the drill bit during drilling operations [16]. Wang et al. (2020) presented an online ground acoustic sensor method for characteristic measurements of rock breaking in drilling using Fourier transform schemes [17]. Khoshouei and Bagherpour (2021) developed a method for predicting geomechanical properties of hard rocks by integrating sound pressure level, first dominant frequency, and vibration level [18]. These laboratory investigations have established foundational relationships between drilling acoustics and rock properties under controlled conditions.
In addition, field-based studies have explored the application of drilling acoustics and vibrations in operational environments. Myers et al. (2002) compared low-frequency drill string acceleration with wireline logs and core data, finding correlations between formation properties and drilling parameters [19]. Kumar et al. (2010) conducted field rock-drilling experiments to estimate rock properties using sound levels [20]. Al-Shuker et al. (2011) discussed the potential of using real time downhole drilling dynamics signatures as early indicators of formation bulk density or porosity changes [21]. Haecker et al. (2017) proposed a novel technique for measuring Young’s modulus, Poisson’s ratio, and fractures downhole by employing high-resolution near-bit drilling-induced vibration data [22]. Romanenkova et al. (2019) presented a data-driven procedure utilizing measurement-while-drilling data for rapid detection of rock type changes [23]. Millan et al. (2019) developed a technique for detecting and characterizing drill string vibrations in real-time using surface measurements and machine learning [24]. Wang et al. (2023) proposed a rock formation identification method based on high-frequency measurement sensors and neural network modeling using vibration signals [25]. These field studies demonstrate the practical potential of acoustic and vibration-based methods for real-time formation evaluation while drilling.
Although drilling sound is considered harmful interference in conventional acoustic logging and seismic exploration, through previous studies, it is not difficult to find that we can turn waste into treasure, and use it in many fields such as lithology identification while drilling, formation parameter detection, drilling condition diagnosis, etc. In recent years, some scholars even have attempted to use AI algorithms for intelligent lithology identification tests and have achieved certain progress [26,27,28,29,30]. However, existing research still has significant limitations: first, there is a lack of systematic investigation into the intrinsic relationship between drilling sound and lithological information; and second, the differences between the drilling sounds recorded in air and in rock have not been thoroughly examined. These unresolved issues hinder the further application of drilling sound as an easily accessible and cost-effective source of critical information.
Against this background, this study aims to investigate the generation mechanisms of drilling sound and its correlation with lithological information, with a particular focus on the frequency characteristics of rock-breaking sounds. Through systematically designed experiments using 8 mm and 14 mm drill bits at both high and low rotational speeds on four distinct rock types (sandstone, limestone, granite, and shaly sandstone), we seek to establish quantitative relationships between rock properties and acoustic signatures. By combining experimental observations with theoretical analysis, we propose a conceptual model to reveal the underlying patterns of drilling sound generation and its potential application in real-time lithology identification. The preliminary results demonstrate distinct frequency patterns for each rock type, with sandstone exhibiting dominant low-frequency energy, limestone and granite showing broader frequency bands with strong high-frequency components, and shaly sandstone displaying mixed characteristics. Furthermore, quadratic polynomial regression models between compressional/shear wave velocities and the peak frequencies of the four rock samples yield coefficients of determination of 0.9878 and 0.9799, respectively, indicating strong predictive potential. The findings of this study not only provide theoretical support for the effective utilization of drilling sound as a real-time monitoring tool but also open new research directions for the development of intelligent lithology identification technology in drilling operations.
The structure of this paper is as follows. Section 2 describes the main experimental equipment, including the drilling setup, acoustic sensors, and rock samples used in this study, while also presenting the methods for data acquisition and analysis, including signal processing techniques for both in-rock and in-air recordings. Section 3 analyzes the experimental data recorded in rock and air separately, examining the effects of drilling parameters such as drill bit diameter and rotational speed on frequency distribution. Section 4 discusses the experimental results, comparing the acoustic signatures across different lithologies and drilling conditions, and exploring the implications for field applications. Finally, Section 5 summarizes the conclusions of this paper and outlines directions for future work, including validation under field conditions and integration with advanced data processing techniques.
2. Materials and Methods
2.1. Experimental Platform
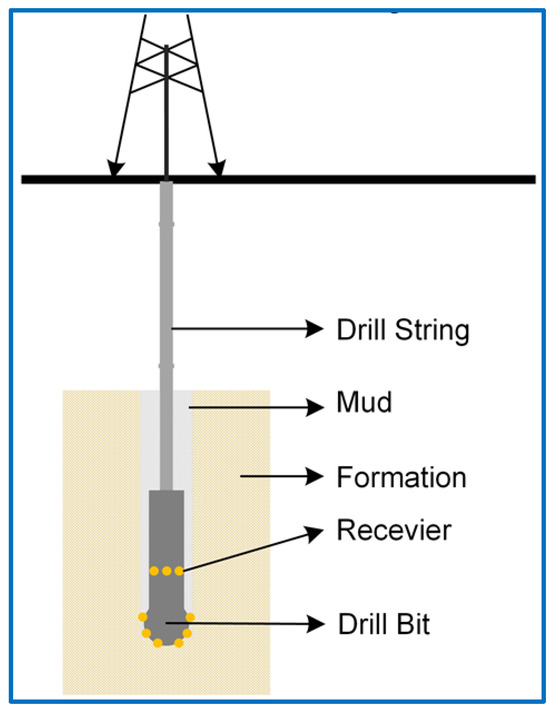
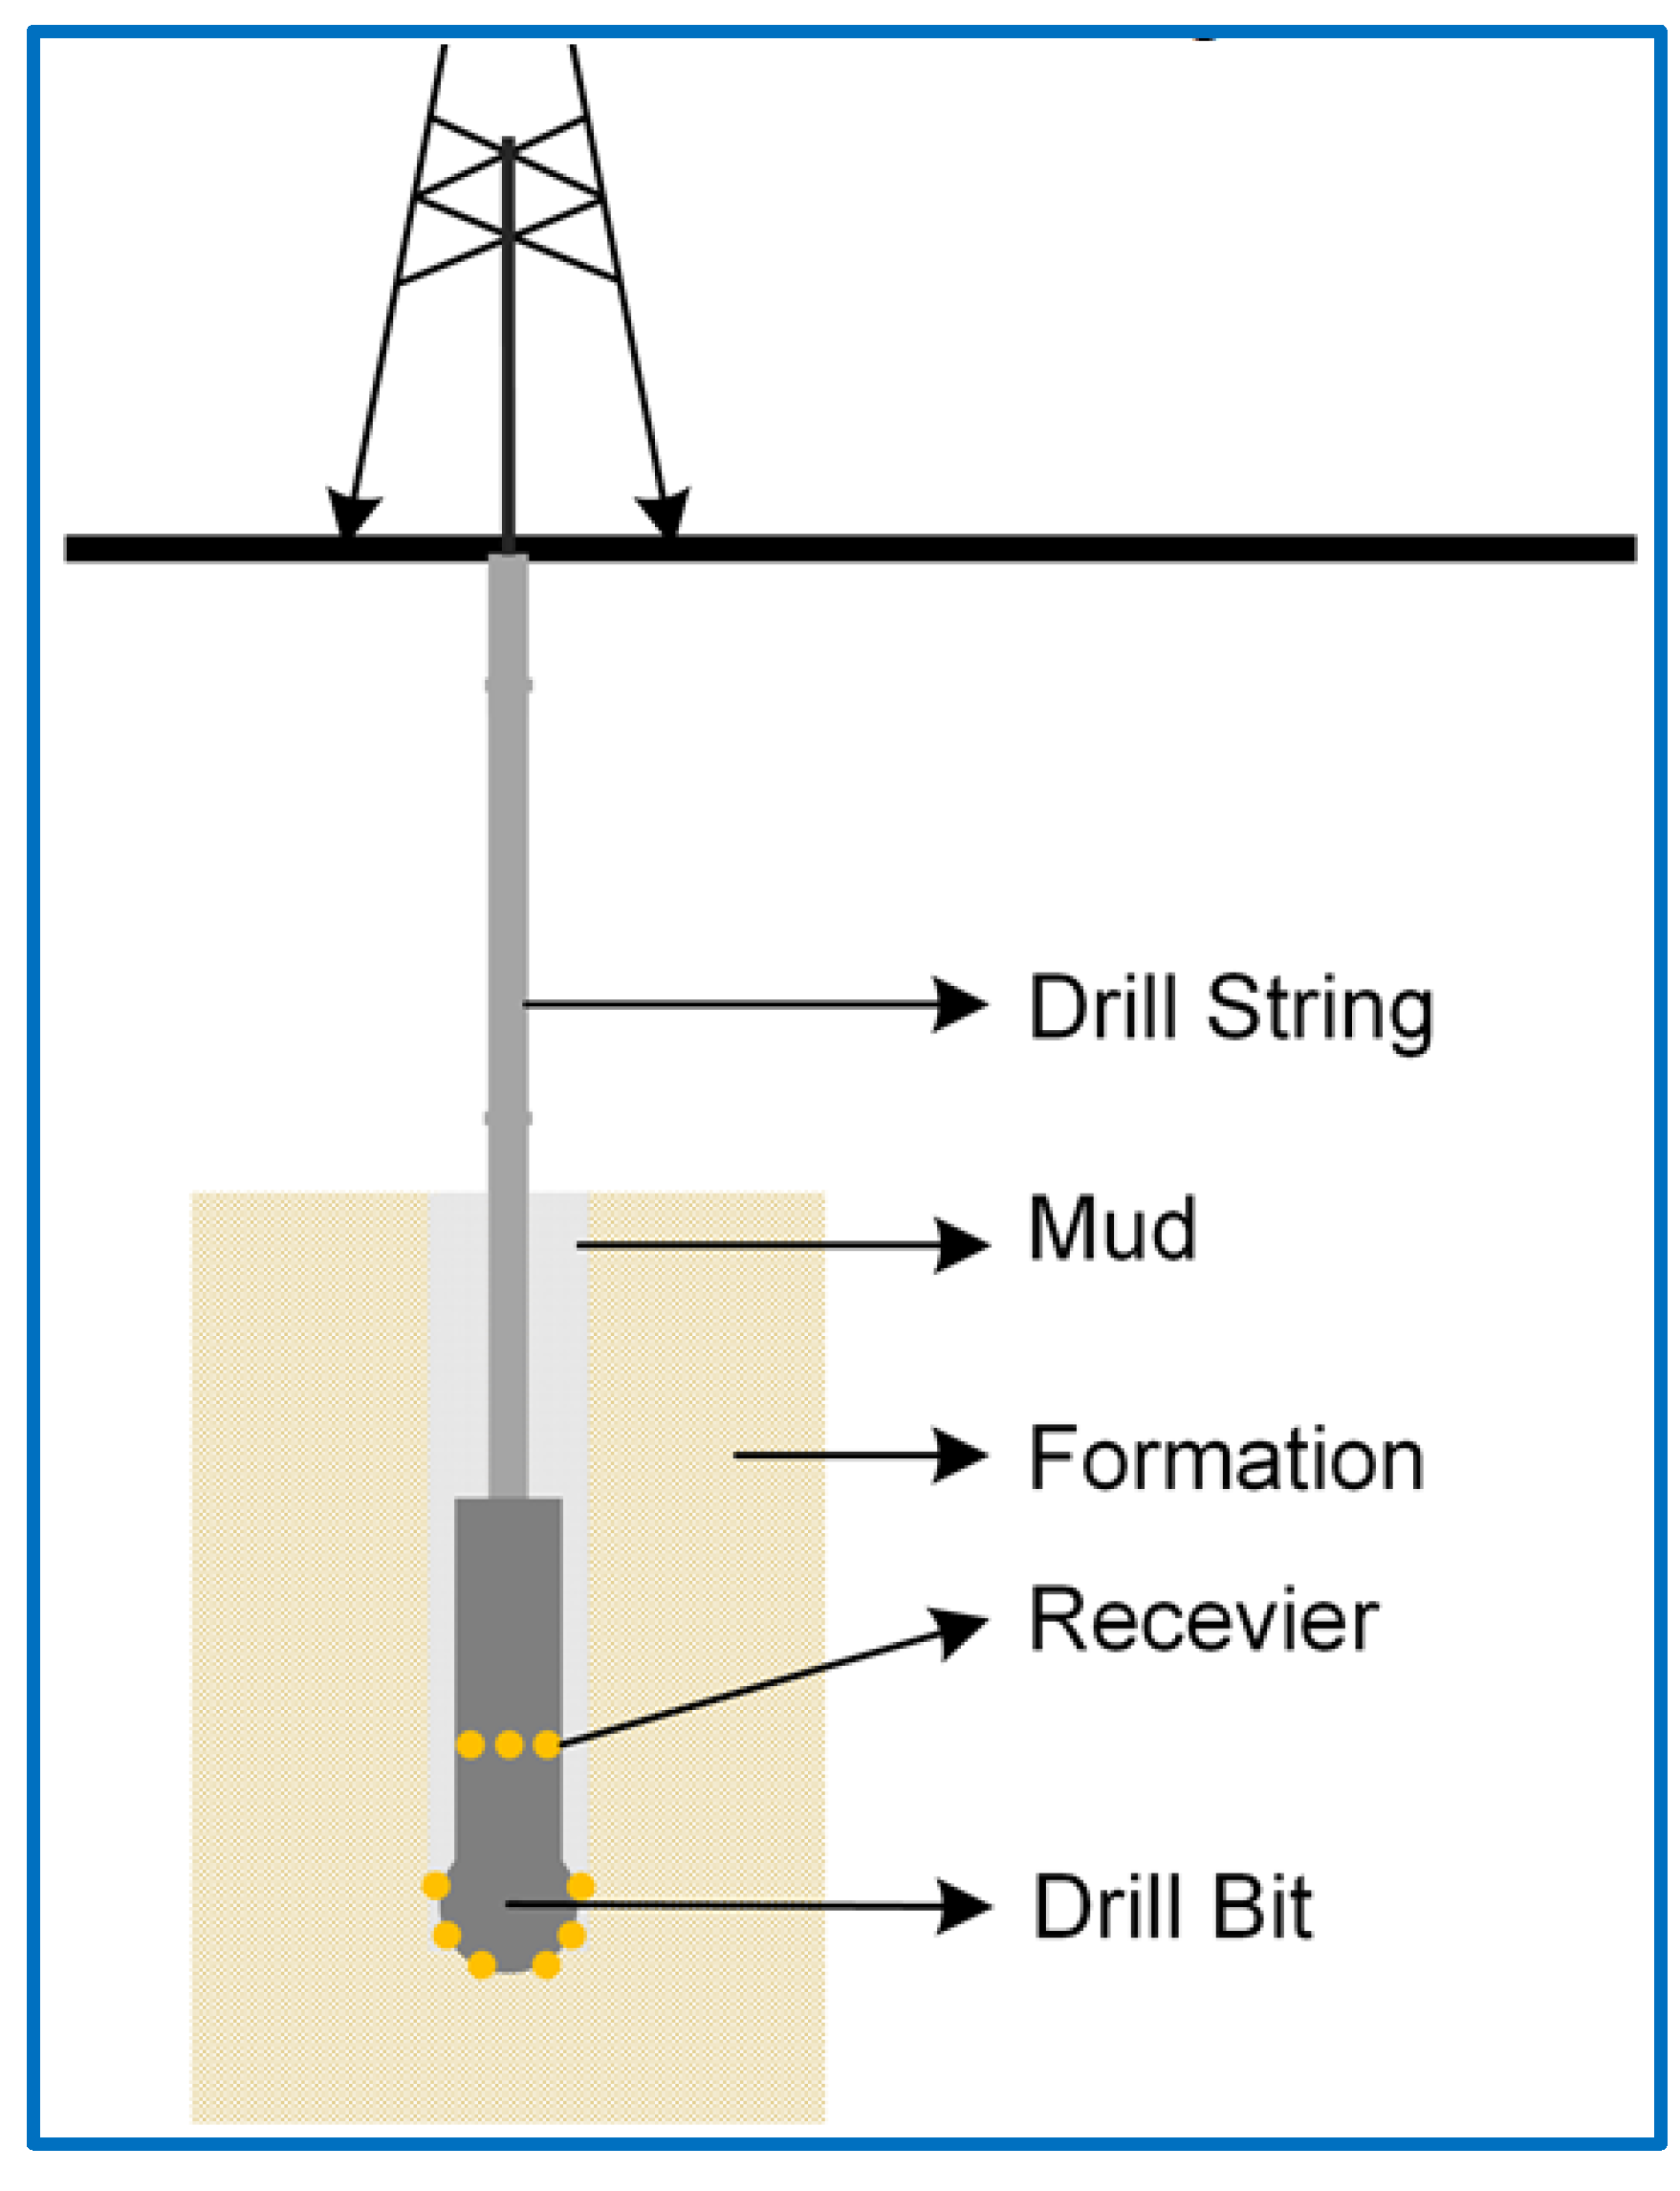
Logging while drilling (LWD) technology enables real-time acquisition of geophysical information near the drill bit during drilling operations, facilitating formation evaluation such as lithology identification and hydrocarbon detection. Drilling sound analysis while drilling (DSA-WD) involves acquiring acoustic signals generated by the drill bit during rock crushing using sensors placed near the bit on the drill string. Real-time processing and analysis of these signals enable the identification of formation lithology and other downhole properties, as shown schematically in Figure 1, which depicts the envisioned application scenario.
Figure 1.
Schematic diagram of DSA-WD. Acoustic signals generated by the drill bit during drilling operations are acquired by sensors/receivers mounted on the drill string near the bit. Real-time processing and analysis of the acoustic signals enable the identification of formation lithology and other downhole properties.
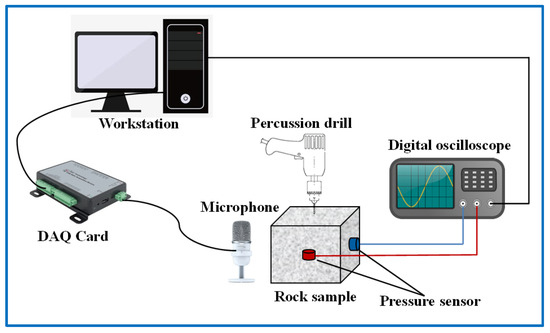
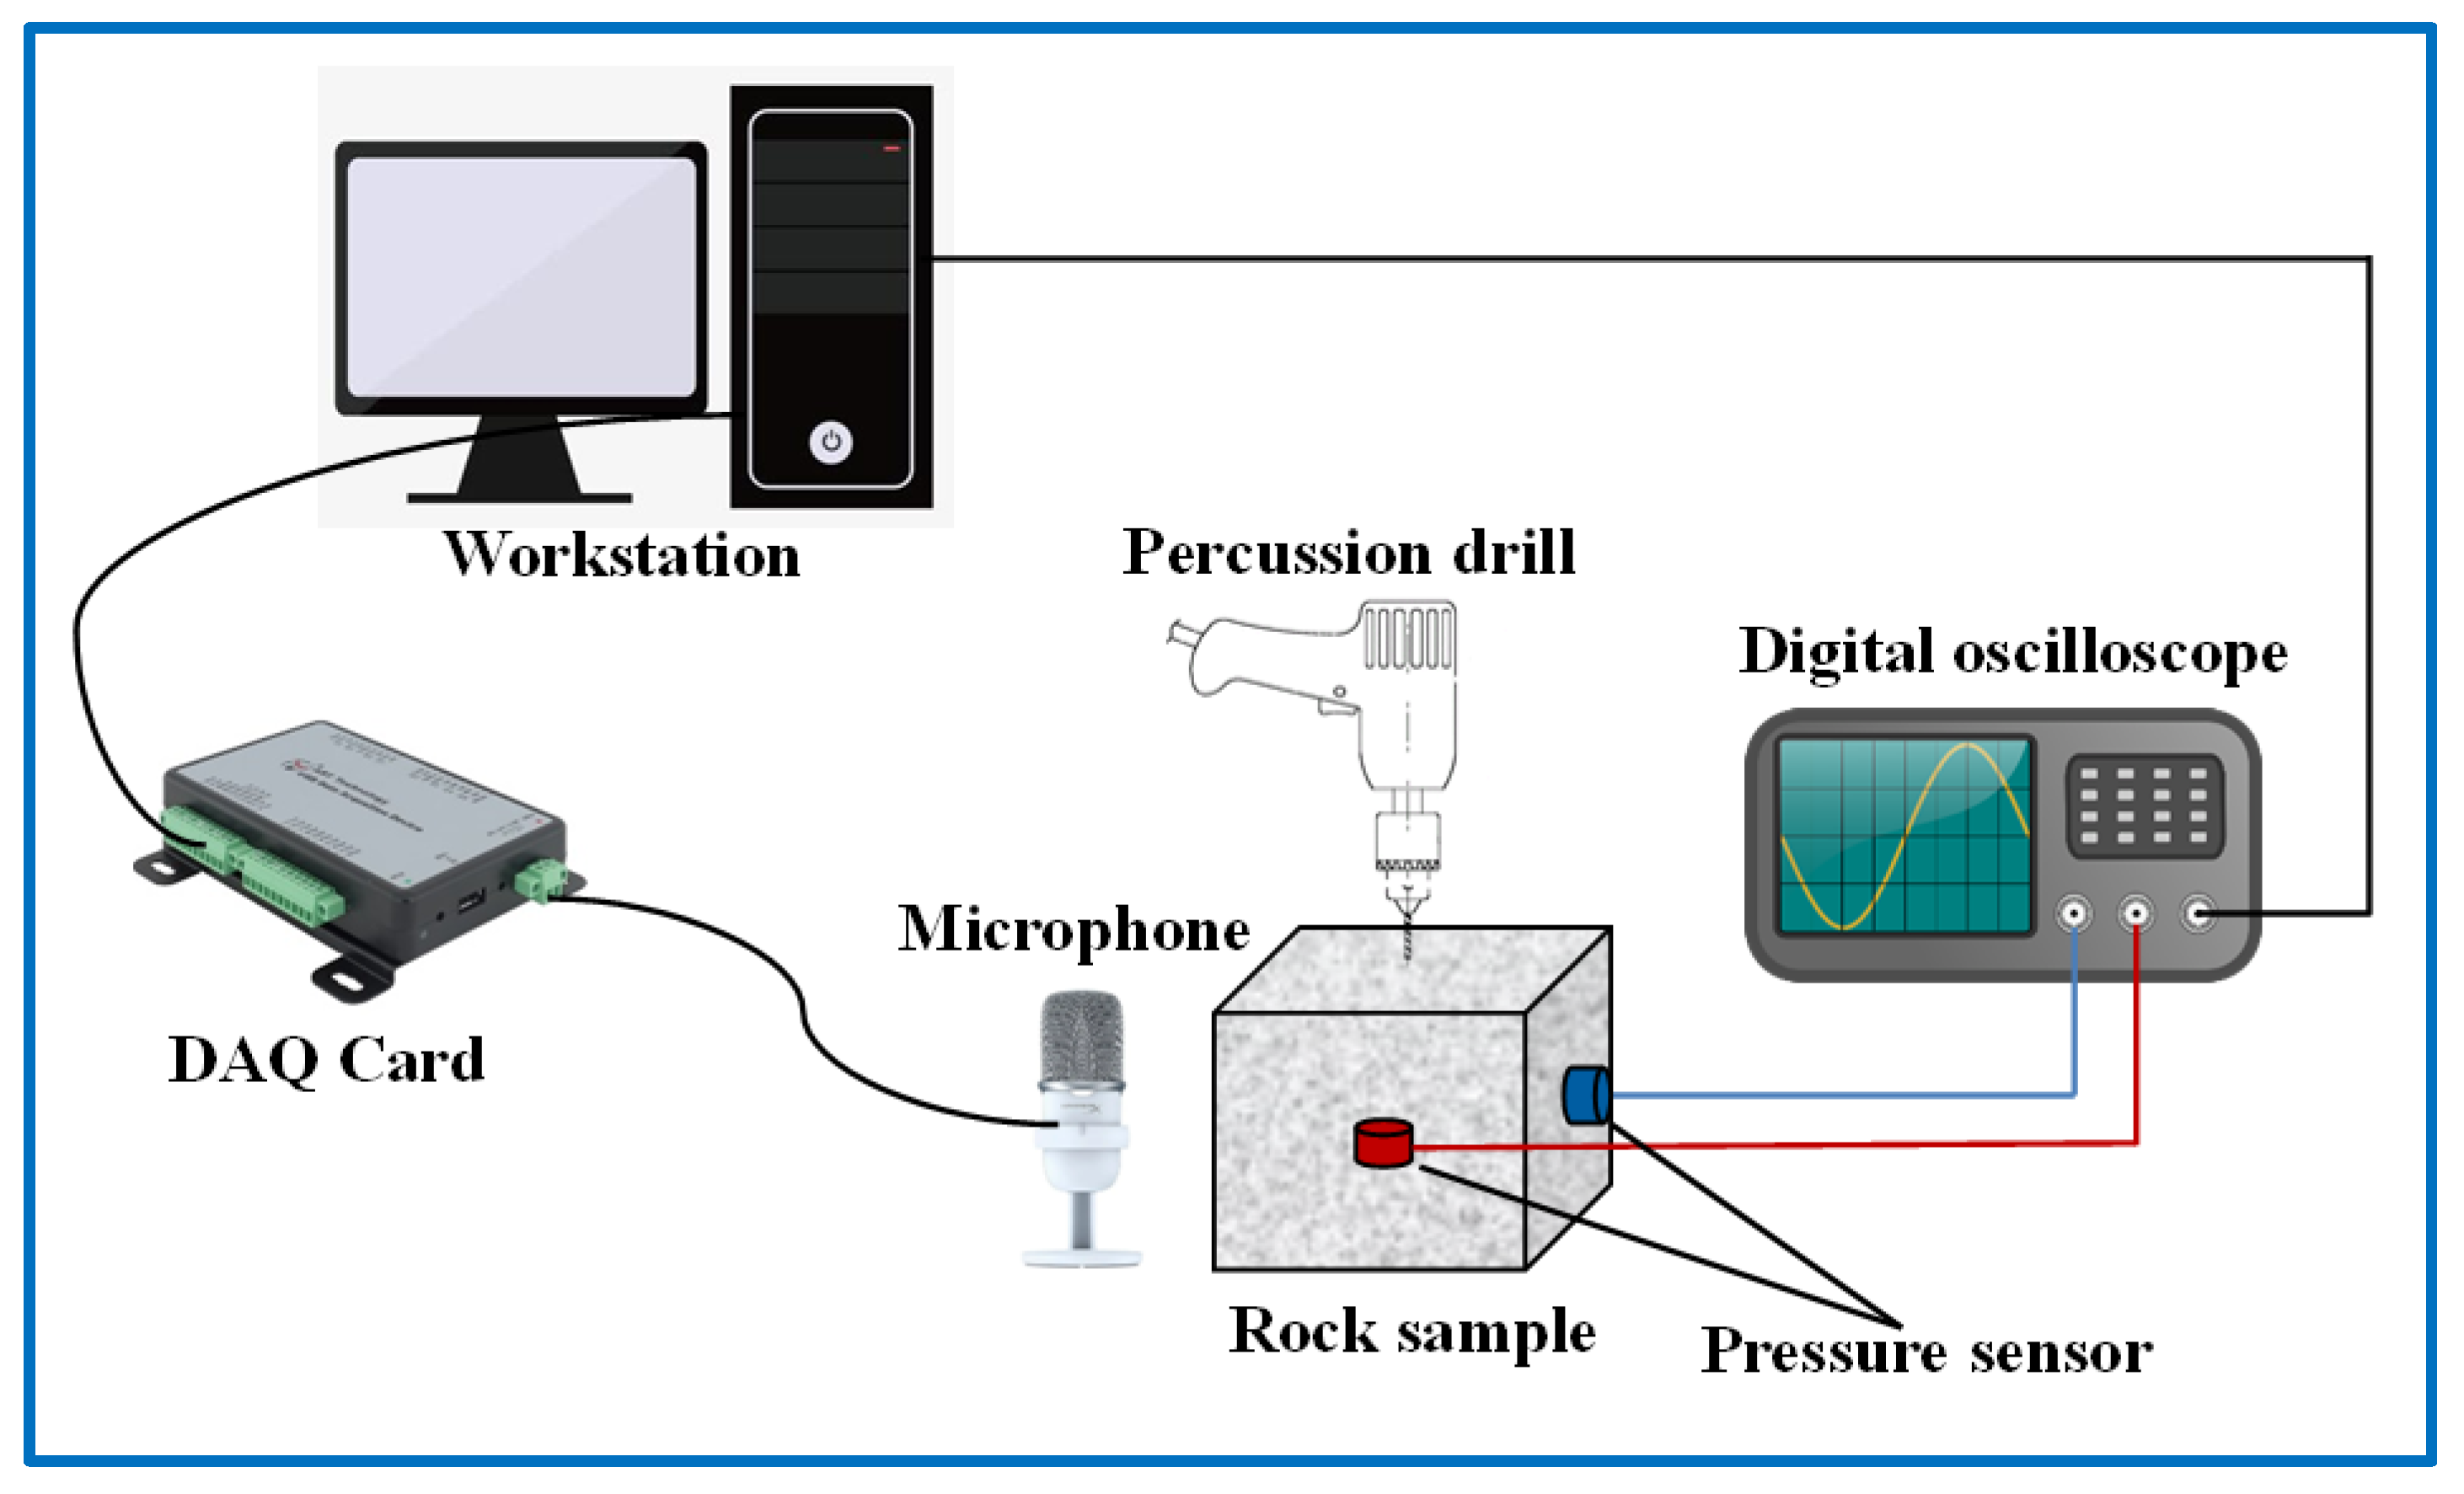
A simplified experimental platform is designed to simulate drilling conditions in a controlled laboratory environment, enabling the study of rock-breaking mechanisms and acoustic signal analysis as shown in Figure 2. The setup includes the following key components:
Figure 2.
Diagram of the experimental platform. Acoustic signals generated by a handheld percussion drill operating at variable speeds are captured by a microphone and embedded PZT sensors. The data is recorded via a data acquisition card, monitored on an oscilloscope, and processed on a workstation.
- (1)
- Small handheld percussion drill. The drill used for the experiment was a portable low-noise percussion drill made by Zhejiang Boda Industrial Co., Ltd. (Yongkang, China), and the drill bits used for the studies with diameters of 8 mm and 14 mm. In addition, two speeds of high revolutions per minute (RPM) and low RPM were employed to compare the drilling data. The RPM for the low-speed and high-speed modes is approximately 500 and 1000, respectively.
- (2)
- Acoustic sensors. A high-sensitivity microphone made by HP Inc. (Shenzhen, China) is positioned near the rock sample to capture airborne acoustic emissions generated during the rock-drilling process. The strip-shaped, contact-based PZT sound pressure sensors made by Qingzhou Yongxin Electronic Co., Ltd. (Qingzhou, China) are embedded into small boreholes drilled at the center of each of the four lateral sides of the rock sample. This configuration is used to measure vibrations and structure-borne acoustic signals, with Vaseline serving as the coupling agent to ensure effective acoustic transmission.
- (3)
- Data acquisition card (DAC). A high-speed data acquisition system made by National Instruments Corp. (Austin, TX, USA) is used to record the acoustic signals from the sensors in real time. It supports high sampling rates (e.g., up to 20 kHz or higher) to ensure accurate capture of the full frequency spectrum of the drilling sounds.
- (4)
- High-performance digital oscilloscope. A digital oscilloscope made by RIGOL Technologies, Inc. (Suzhou, China) is used to monitor and display the acoustic signals in real time, providing immediate feedback on the quality and characteristics of the data being collected.
- (5)
- Workstation. A computer workstation equipped with specialized software for data processing, analysis, and visualization. The software synchronizes the acoustic data with drilling parameters, enabling detailed post-experiment analysis.
The handheld percussion drill is employed to penetrate the rock sample while the acoustic sensors capture the sound signals generated during the process. The DAC records the signals, which are simultaneously displayed on the digital oscilloscope for real-time monitoring. The workstation processes and analyzes the data to study the relationship between drilling parameters, rock properties, and acoustic emissions. This simplified platform provides a cost-effective and versatile solution for simulating drilling operations and investigating the acoustic characteristics of rock-breaking processes in a laboratory setting.
A comprehensive list of the data acquisition parameters and experimental methods used in the simulated drilling experiment is shown in Table 1. To investigate the differences in sound characteristics of rock breaking across various media, experiments were conducted using a drill bit of the same specifications (14 mm diameter) and rotational speed (high-speed mode) in both rock and air. The data recorded by the microphone in air will be used to compare and analyze the differences in drilling sound under varying drill bit diameters and rotational speeds. In addition, the sampling rates of the PZT sensor and microphone are 100 kHz and 44.1 kHz, respectively. To capture rich rock-breaking sound signals, the recording duration for each experiment was no less than 5 ms. Due to the complexity of drilling-induced rock-breaking sounds, which are influenced by multiple factors and exhibit time-varying characteristics, more than 20 repeated experiments were conducted for each type of rock listed in Table 2. From these, 20 valid data samples were randomly selected for the data analysis.
Table 1.
Design of the control experiments.
Table 2.
Rock sample size and elastic parameters.
2.2. Rock Samples
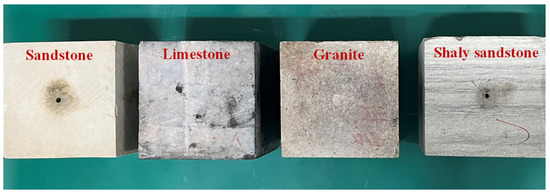
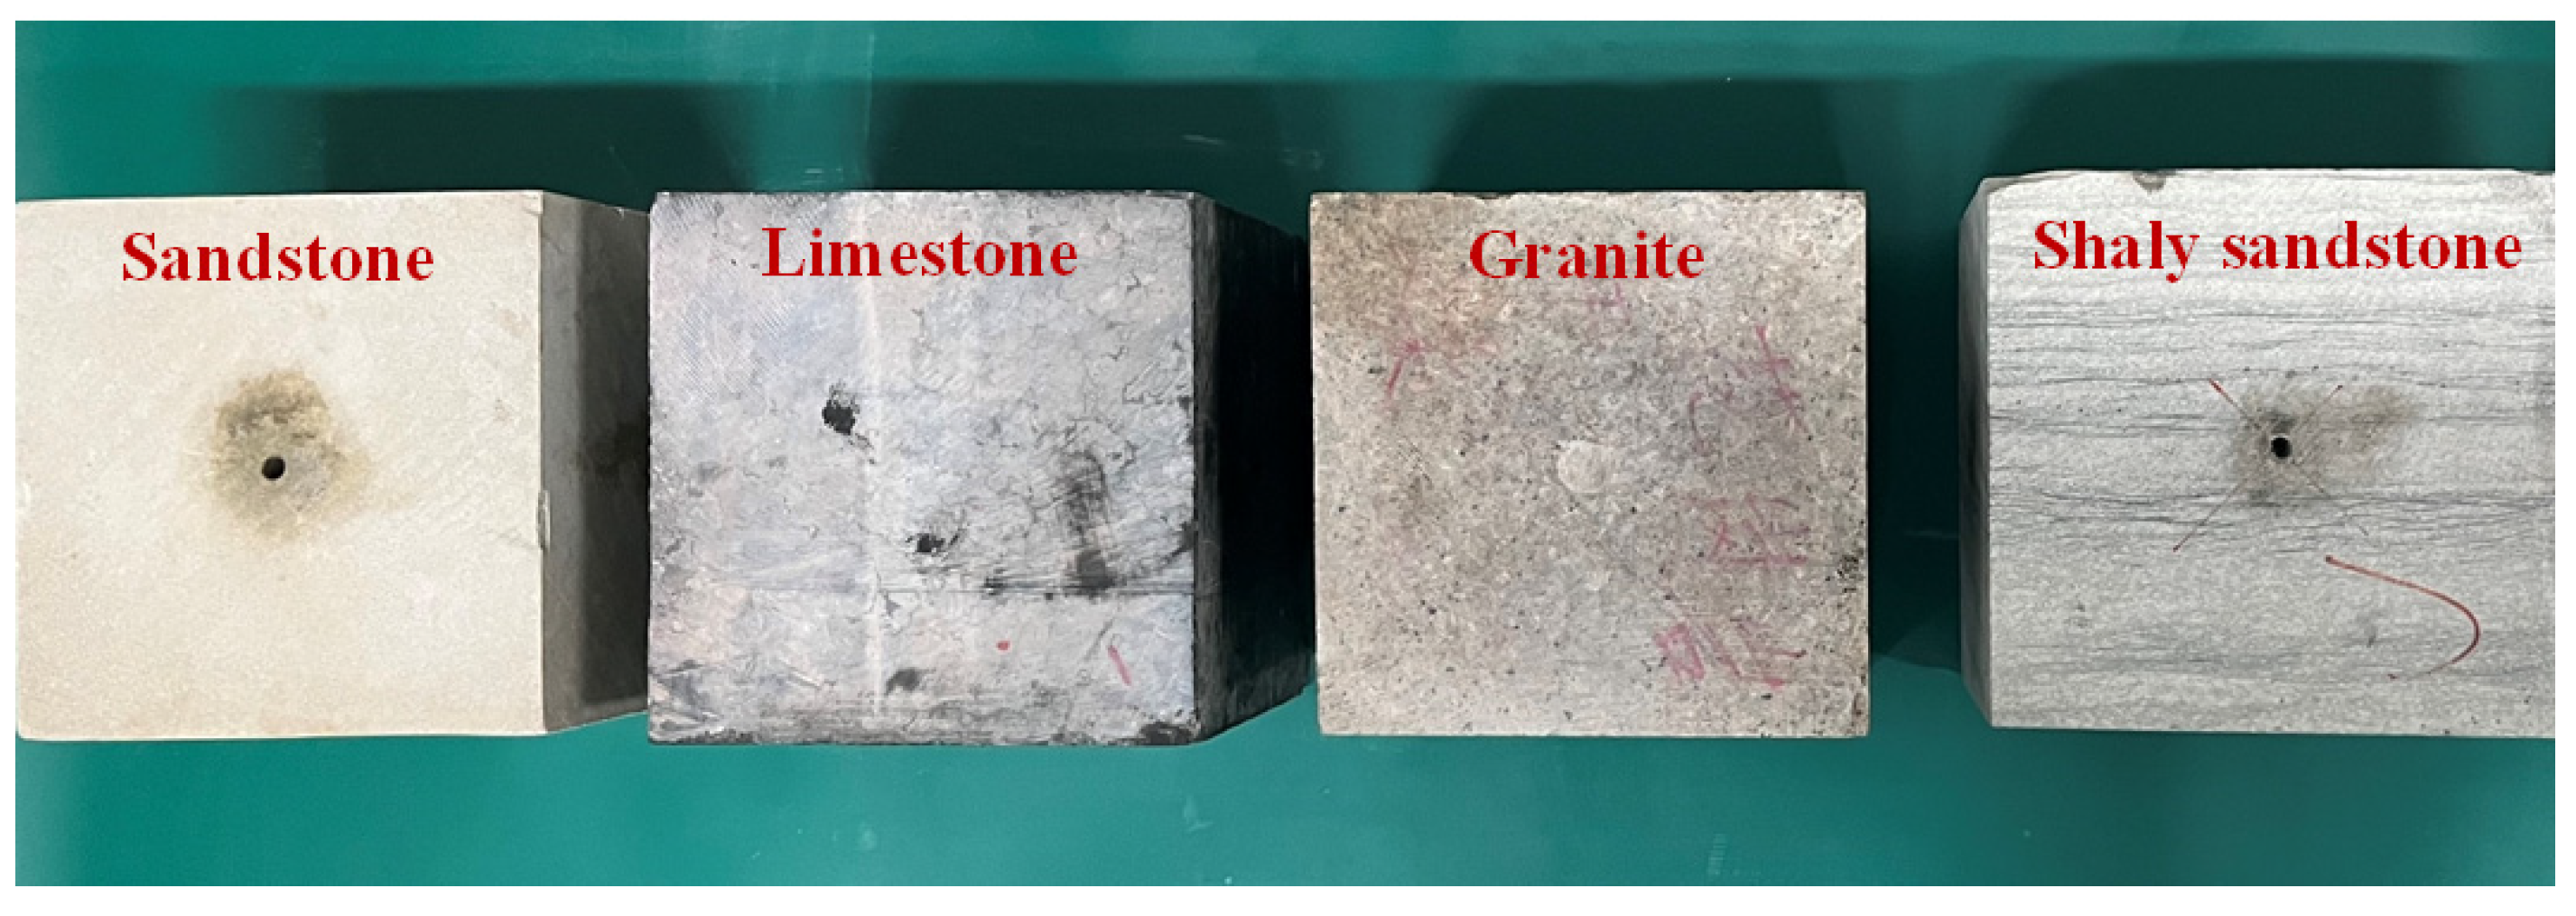
To investigate the properties of the drilling sound of rocks, four different block rock samples were prepared for the drilling experiments as shown in Figure 3. The rock samples used in this experiment were carefully selected to represent a range of geological formations commonly encountered in drilling operations. The four kinds of rock samples include:
Figure 3.
Picture of the rock samples. From left to right: sandstone, limestone, granite, and shaly sandstone. The samples are approximately regular cubes with a side length of 30 cm.
- (1)
- Sandstone. A sedimentary rock consisting of sand-sized mineral particles or rock fragments. Sandstone is typically less hard than granite but can vary in porosity and cementation, affecting its drill ability.
- (2)
- Limestone. A sedimentary rock composed mainly of calcium carbonate. Limestone is generally softer than granite and sandstone but can exhibit significant variations in hardness and density depending on its composition and structure.
- (3)
- Granite. A coarse-grained igneous rock composed primarily of quartz, feldspar, and mica. Granite is known for its high hardness and abrasiveness, making it a challenging material for drilling.
- (4)
- Shaly Sandstone. A laminated sedimentary rock composed of sand-sized quartz and feldspar particles interbedded with clay and silt, exhibiting moderate strength, variable hardness, and anisotropic properties due to its mixed composition and layered structure.
To have a better understanding of the experimental samples, the elastic characteristics and physical properties of the rock samples were analyzed in the laboratory. The size and elastic parameters of the four rock samples are listed in Table 2 in which we show the main physical properties of rocks that would influence the drilling sounds, i.e., P-wave velocity (Vp), S-wave velocity (Vs), density (ρ) and porosity (ϕ). It can be seen from the data in Table 2 that the P- and S-wave velocities of limestone are the largest, while those of the shaly sandstone are the smallest. Sandstone has the largest porosity and limestone the smallest. To reduce the influence of rock sample boundary reflection waves and sample size on the experimental results, large square rock samples with a side length of 300 mm were employed in this experiment.
2.3. Data Analysis Schemes
The analysis of drilling-induced rock-breaking sound characteristics is a critical aspect of this study, aiming to elucidate the differences in acoustic signatures between rock and air media. This section outlines the methodologies employed to process and compare the recorded sound signals, focusing on waveform analysis, Fast Fourier Transform (FFT) amplitude spectra, average FFT amplitude spectra, and average power spectra. The four feature parameters—waveforms, FFT amplitude spectra, average FFT amplitude spectra, and average power spectra—were selected because they collectively capture time-domain characteristics, frequency-domain energy distribution, and overall spectral trends of drilling-induced acoustic signals, enabling comprehensive lithological discrimination based on both transient and steady-state vibrational patterns.
2.3.1. Waveform Analysis
The time-domain waveforms of the recorded sounds were analyzed to identify the temporal characteristics of the drilling sound in both rock and air. The waveforms were examined for features such as amplitude variations, transient events, and periodic patterns associated with the drill bit’s rotation and impact. Key steps in the waveform analysis included:
- (1)
- Signal preprocessing. The raw signals were filtered to remove high-frequency noise and low-frequency drifts using a band-pass filter (e.g., 3 kHz to 15 kHz). This ensured that the analysis focused on the relevant frequency range of the drilling sound.
- (2)
- Peak detection. Local maxima and minima in the waveforms were identified to characterize the amplitude variations and transient events during drilling.
- (3)
- Time-alignment. The waveforms from the rock and air tests were time-aligned to facilitate direct comparison of their temporal features.
The waveform analysis revealed that the rock-breaking sounds exhibited higher amplitudes and more complex transient events compared to the air-based sounds, which were dominated by the mechanical noise of the drill.
2.3.2. FFT Amplitude Spectra
The frequency content of the drilling sound was analyzed using FFT to transform the time-domain signals into the frequency domain. This allowed for the identification of dominant frequencies and their corresponding amplitudes. The FFT analysis was performed as follows:
- (1)
- FFT calculation. The FFT was computed for each recorded signal using a Hanning window to minimize spectral leakage. The frequency resolution was determined by the sampling rate and the length of the signal.
- (2)
- Dominant frequency identification. The frequencies with the highest amplitudes were identified as the dominant frequencies, which are indicative of the primary sources of the drilling sound.
- (3)
- Comparison of spectra. The FFT amplitude spectra from the rock and air tests were compared to highlight the differences in frequency content. The rock-breaking sounds typically exhibited lower-frequency components due to the interaction between the drill bit and the rock, while the air-based sounds contained higher-frequency components associated with the drill’s mechanical operation, as illustrated in Figures 7a and 12.
2.3.3. Average FFT Spectra
To account for the variability in the recorded signals, the average amplitude spectra were computed for each set of experiments. This involved:
- (1)
- Averaging FFT spectra. The FFT amplitude spectra from multiple trials (e.g., 20 valid samples) were averaged to obtain a representative spectrum for each experimental condition. The formula of average FFT spectra is as follows:
- (2)
- Statistical analysis. The standard deviation of the amplitude spectra was calculated to assess the consistency of the frequency content across trials.
The average amplitude spectra provided a clearer picture of the characteristic frequencies of the drilling sound and their variability, enabling a more robust comparison between rock and air media.
2.3.4. Average Power Spectral Density (PSD) Spectra
The power spectra of the drilling sound were analyzed to evaluate the energy distribution across different frequencies. The PSD spectra were computed using the following steps:
- (1)
- PSD calculation. The PSD was estimated using Welch’s method, which involves dividing the signal into overlapping segments, computing the FFT for each segment, and averaging the results. This approach reduces the variance in the power spectrum estimates. The formula of PSD spectra is as follows:
- (2)
- Energy distribution analysis. The energy distribution across frequency bands was analyzed to identify the frequency ranges that contribute most significantly to the overall sound. To characterize the frequency energy distribution of rock-breaking sounds, this study will perform a comparative analysis by calculating the average power spectrum. This approach allows for a detailed examination of how energy is distributed across different frequency bands during the rock-breaking process. The formula of average PSD spectra is as follows:
- (3)
- Comparison of power spectra. The average power spectra from the rock and air tests were compared to assess the differences in energy distribution. A comparison between Figures 7b and 13 highlights the distinct spectral signatures of the two signal types. The rock-breaking sounds recording in the rock exhibit significantly higher energy in the lower-frequency range, whereas the sounds acquired in the air demonstrate a more uniform energy distribution that extends into higher frequencies.
3. Results
3.1. Data Recording in the Rock
To analyze the sound characteristics of rock breaking by the drill bit, a simulated drilling experiment was first conducted using a small handheld percussion drill equipped with a 14 mm diameter drill bit. Sound signals were collected using a PZT pressure sensor embedded at the center of the rock sample’s surface. This data acquisition scheme can, to some extent, mimic an observation approach that collects acoustic signals from four azimuths along the borehole wall, providing a practical reference value. In the drilling experiments, a total of four typical rock samples were used, i.e., sandstone, limestone, granite, and shaly sandstone. Considering the randomness and numerous influencing factors in the drilling process, the experiment was repeated 20 times for each rock sample, and the corresponding rock-breaking sound data were recorded with the digital oscilloscope.
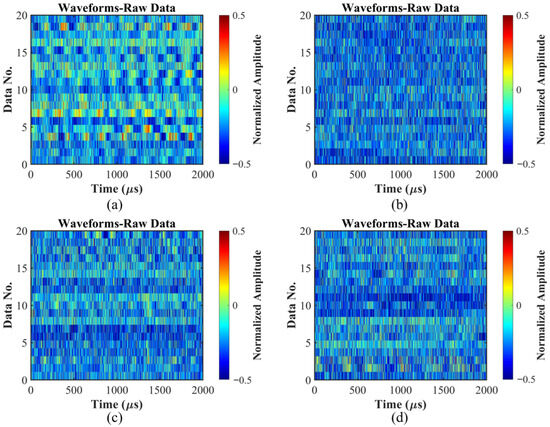
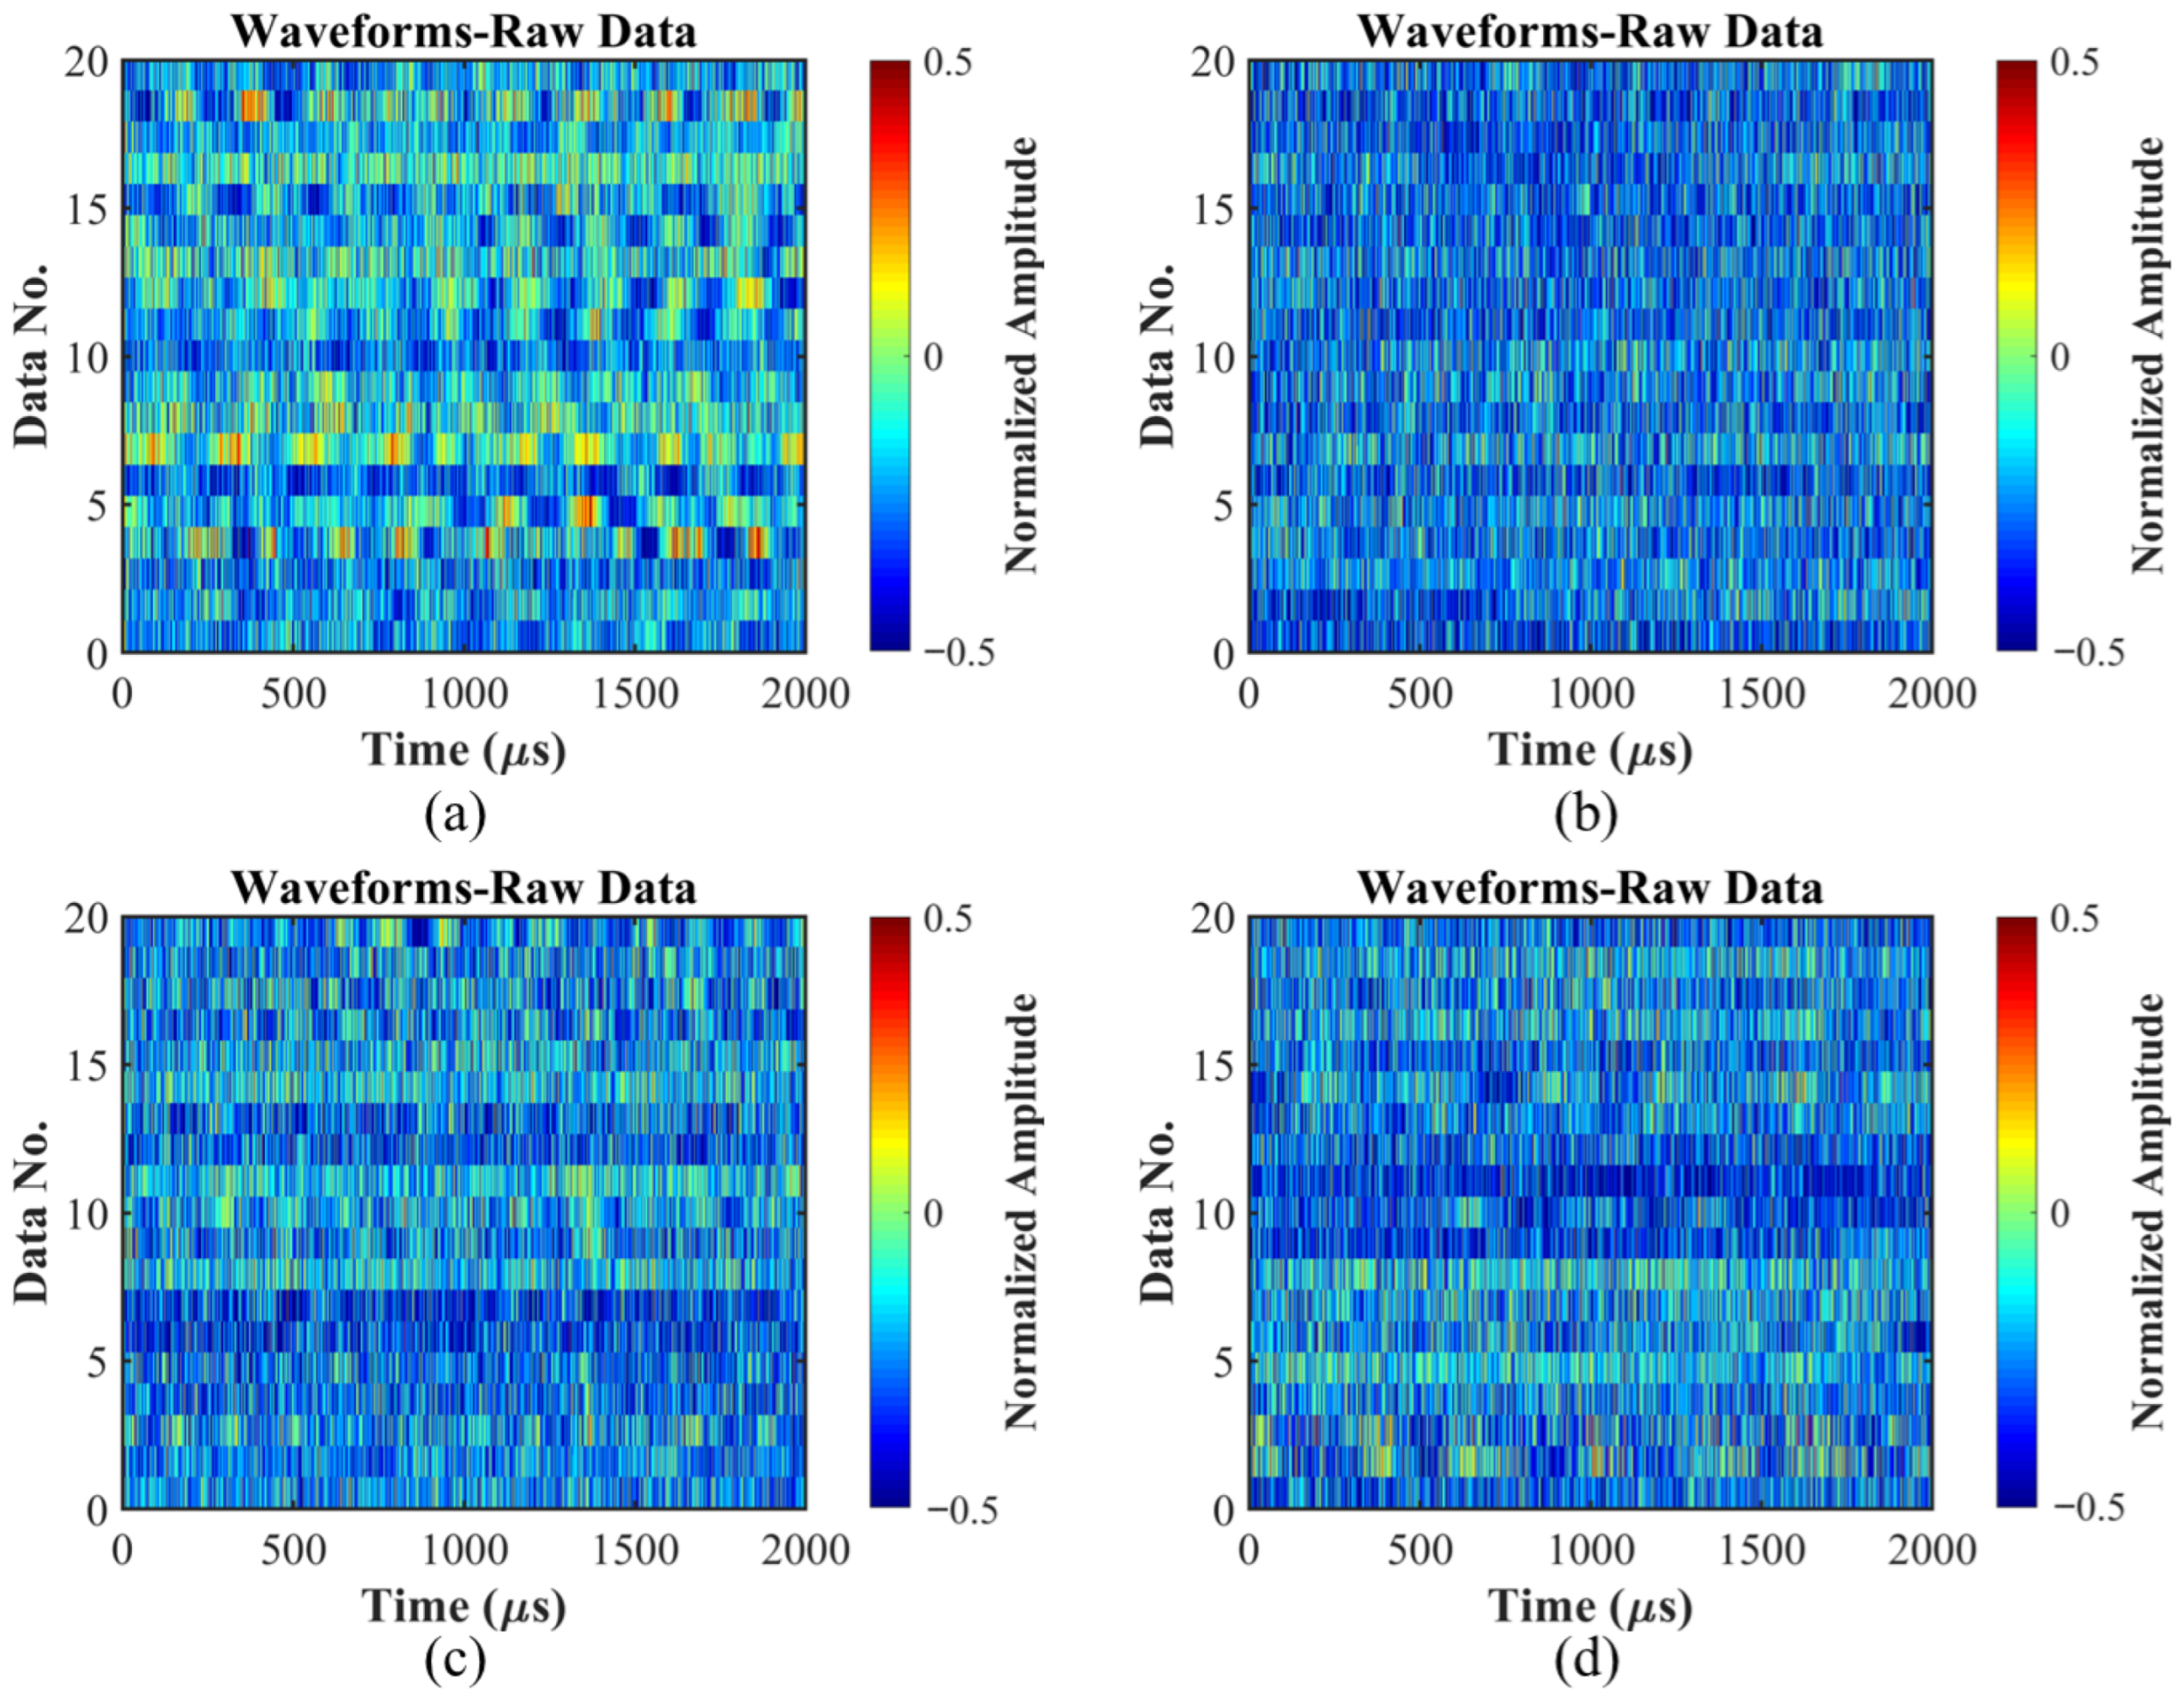
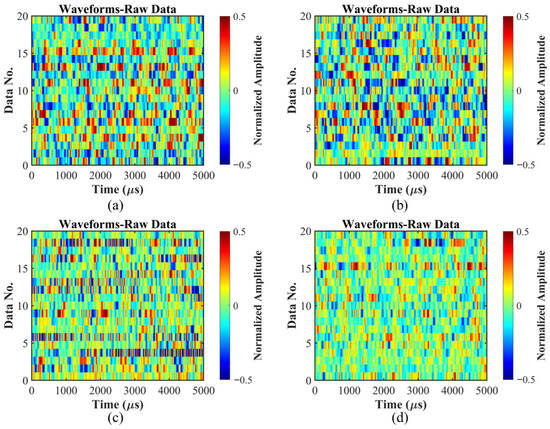
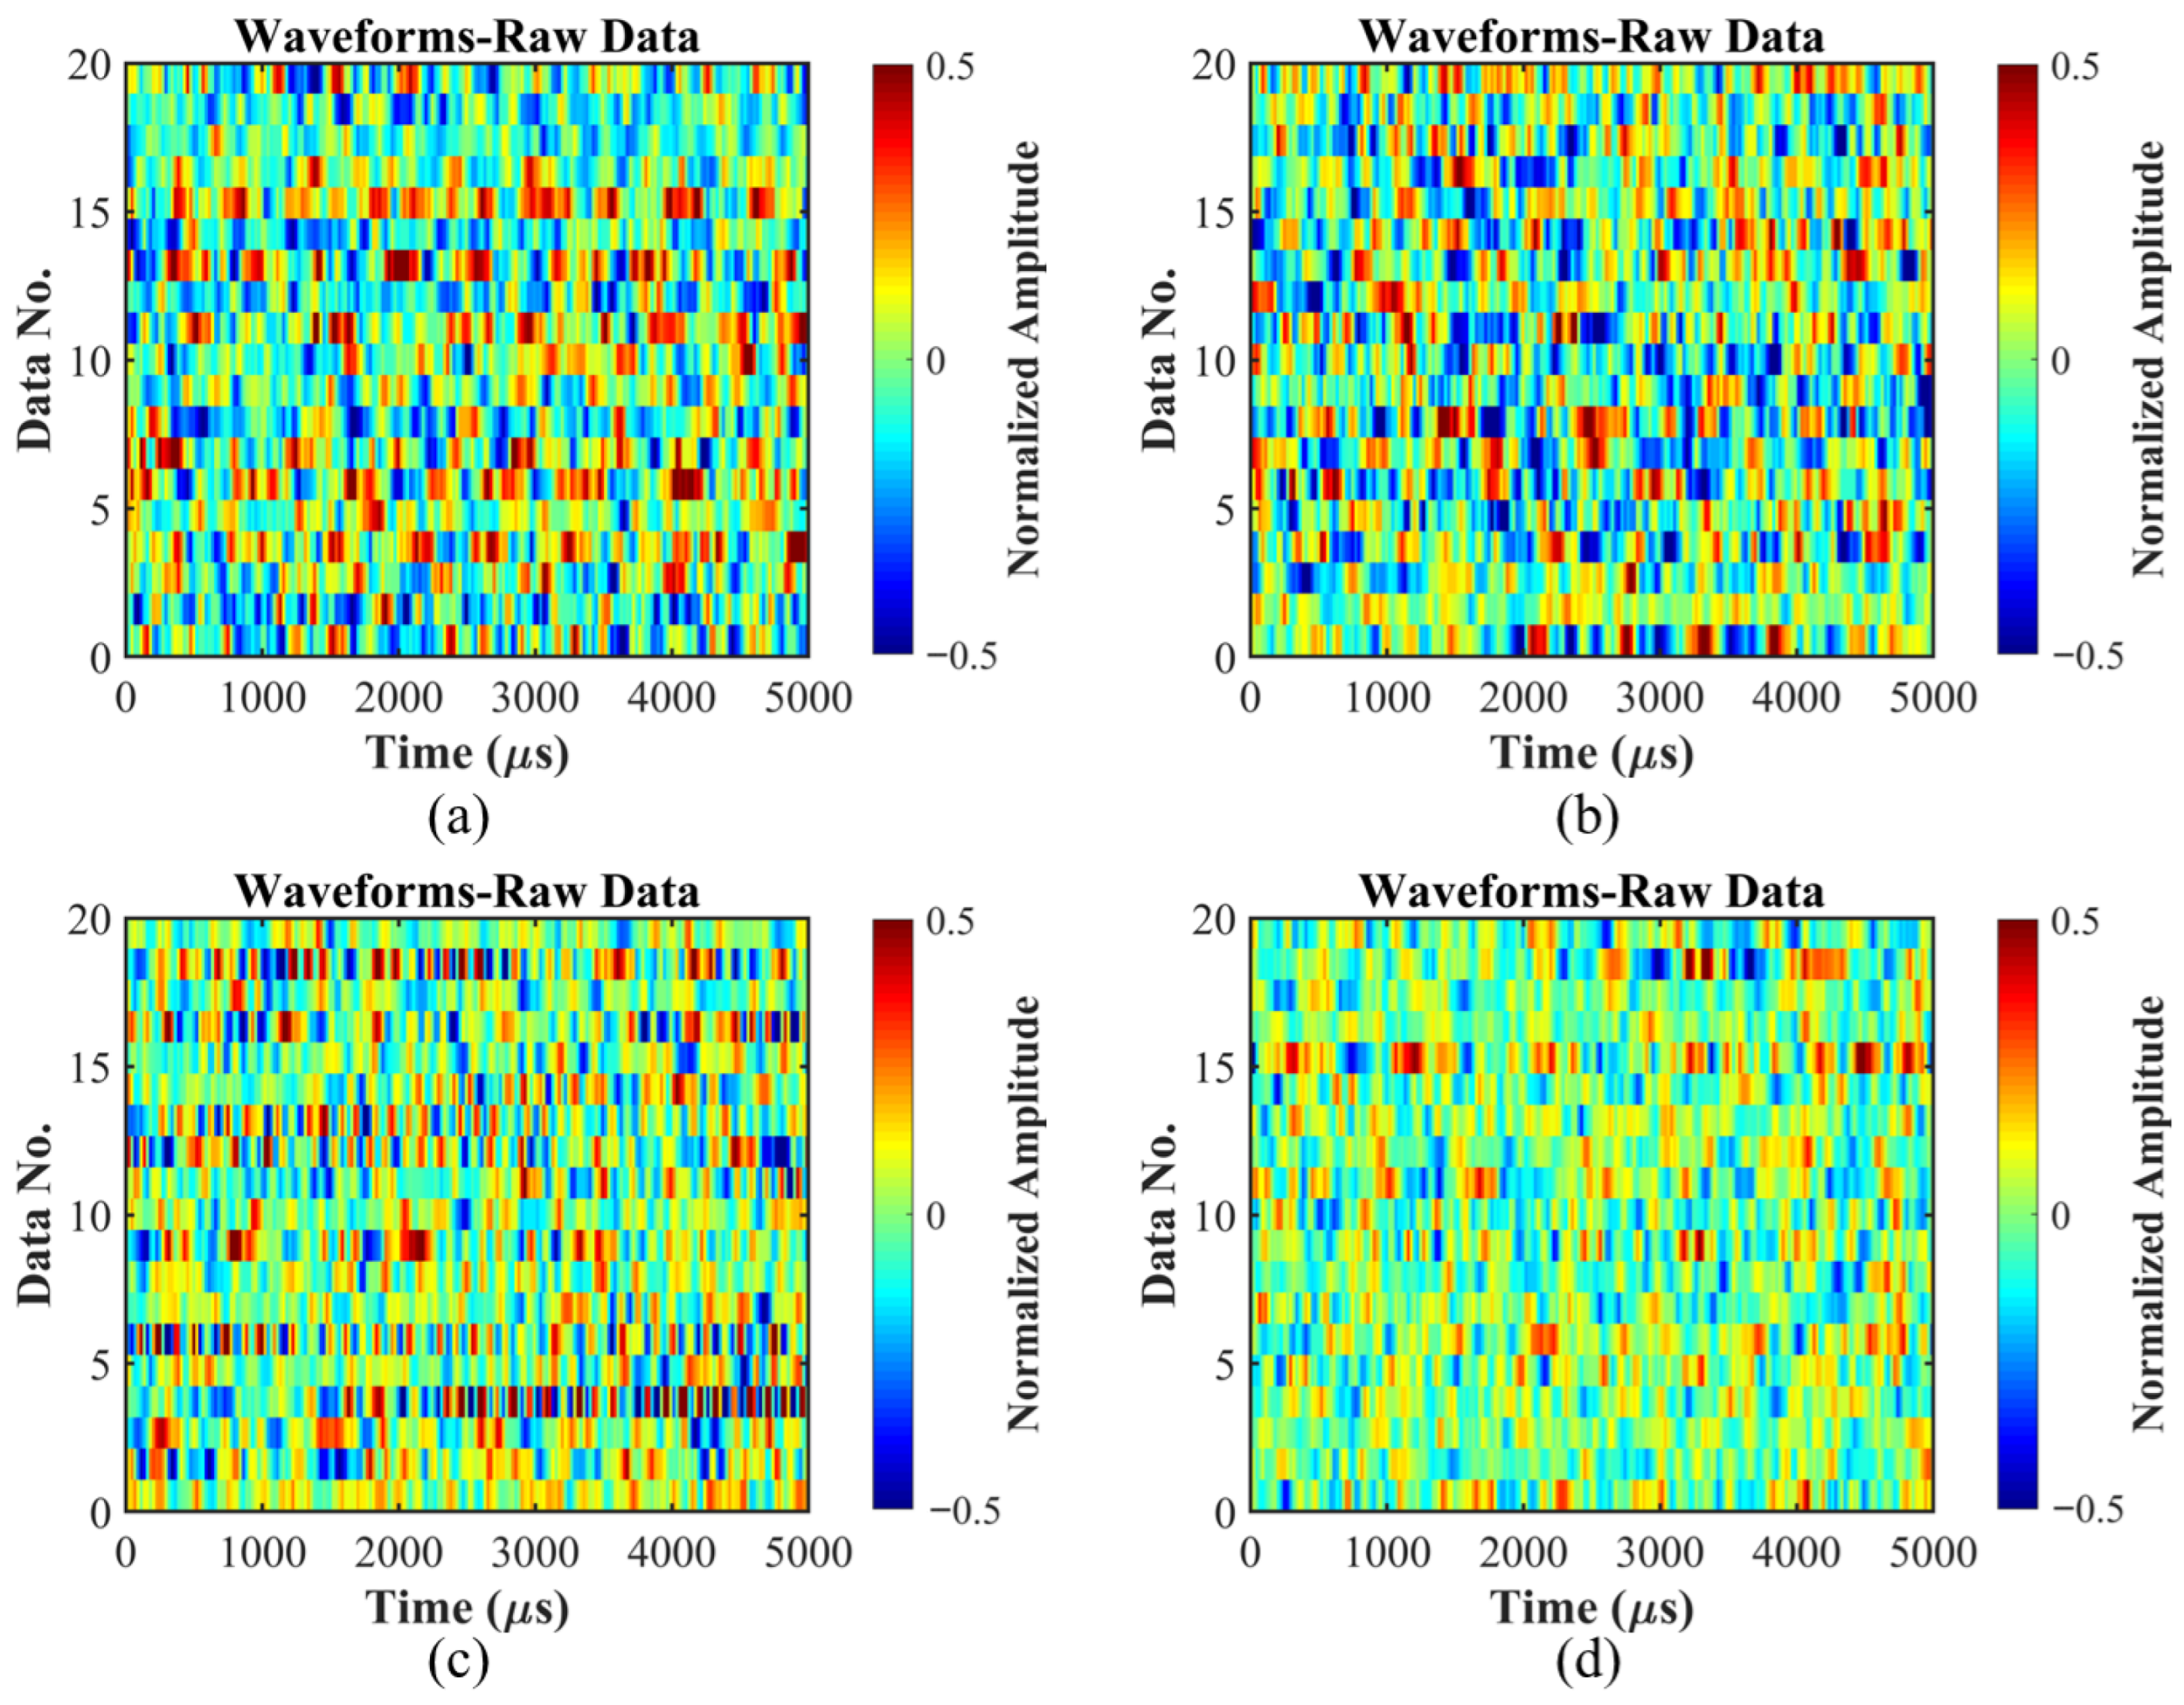
Figure 4 shows the raw waveforms of the drilling sounds recorded within the rocks and each row represents the waveform data recorded in one experiment. The four subfigures of Figure 4 corresponding to the test results of sandstone, limestone, granite, and shaly sandstone, respectively. From the figure, it can be observed that the waveform frequency of the rock-drilling sound for sandstone is relatively low, while the sound frequencies for limestone and granite are relatively high. This aligns with prior knowledge such as the measured elastic parameters or hardness of the rocks. Additionally, in the 20 repeated experiments shown in each subplot, there is a certain degree of similarity as well as some variability. For example, in Figure 4a, some sound signals with larger amplitudes can be seen. Such occurrences could be attributed to drilling into harder mineral particles or an increase in drilling pressure.
Figure 4.
Raw waveforms of the drilling sounds recorded within rocks and each row represents the waveform data recorded in one experiment. (a) Sandstone, (b) limestone, (c) granite, (d) shaly sandstone.
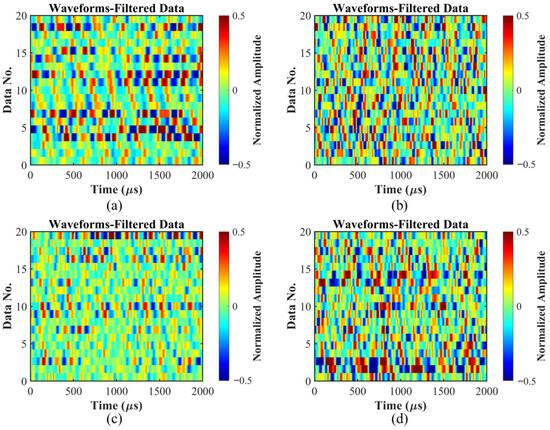
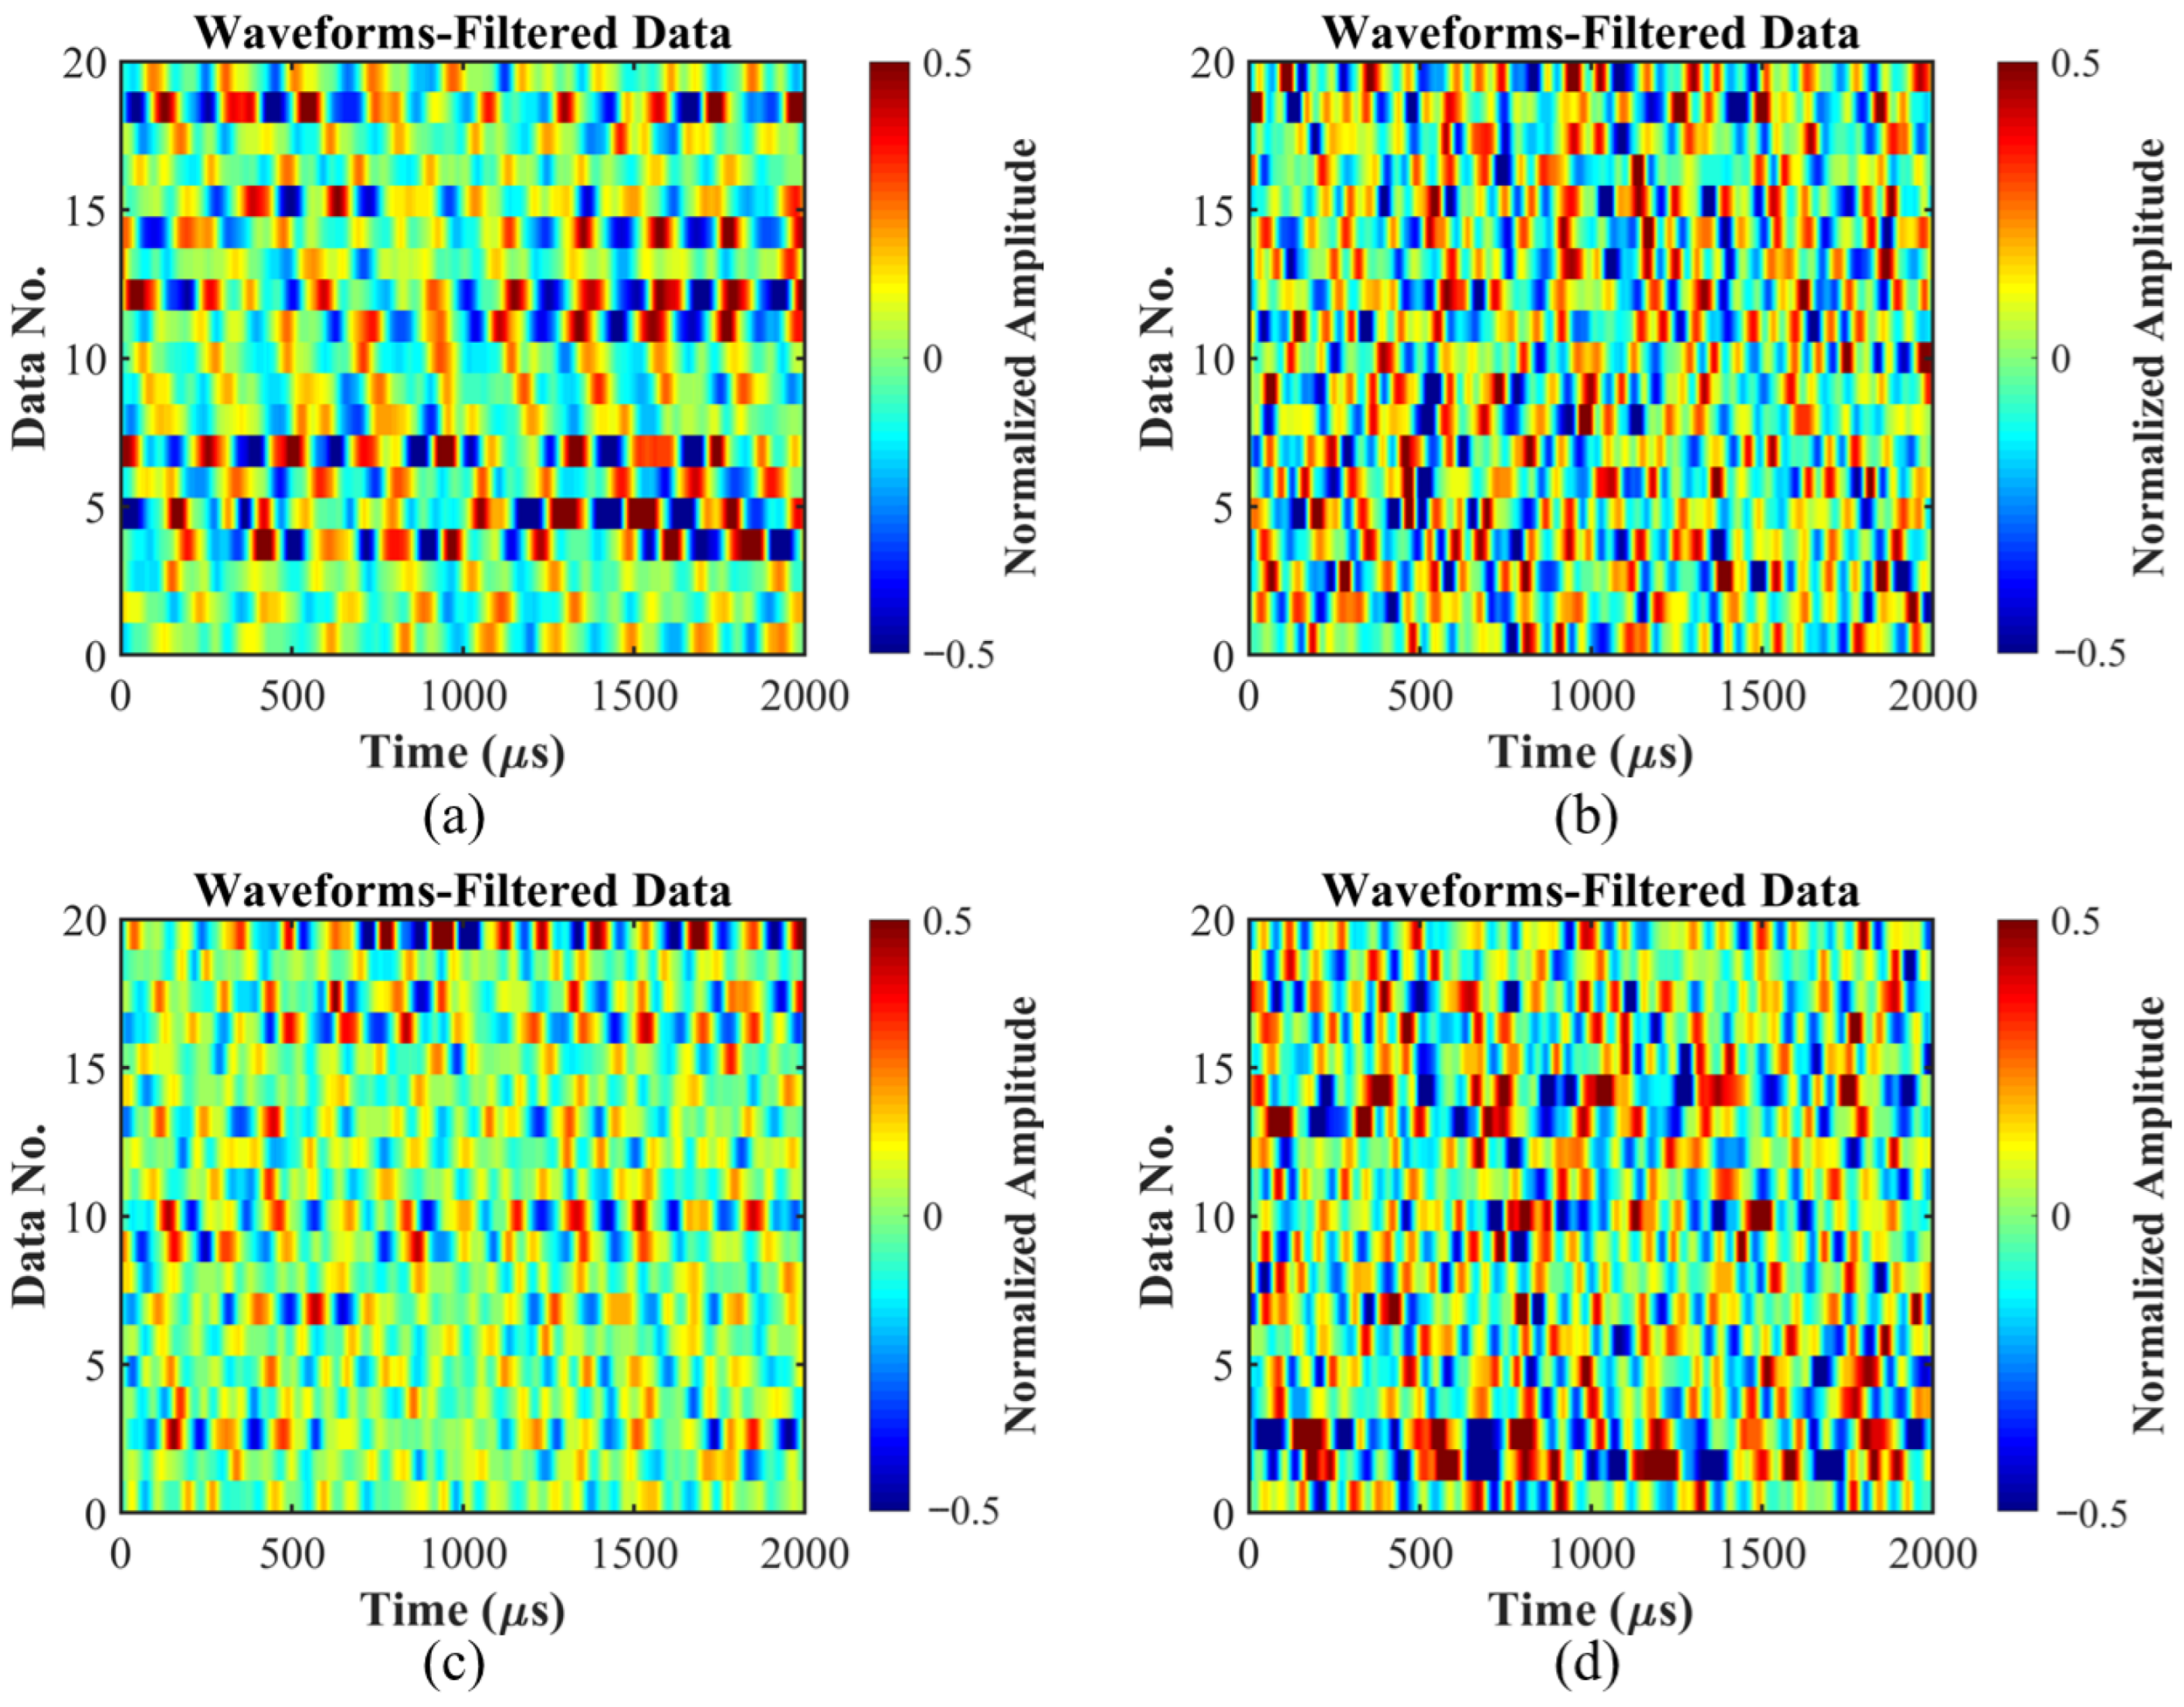
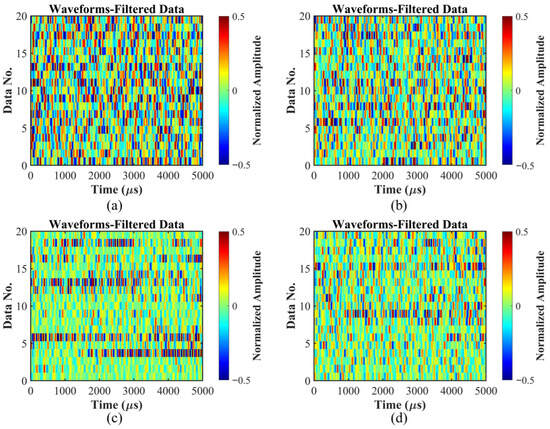
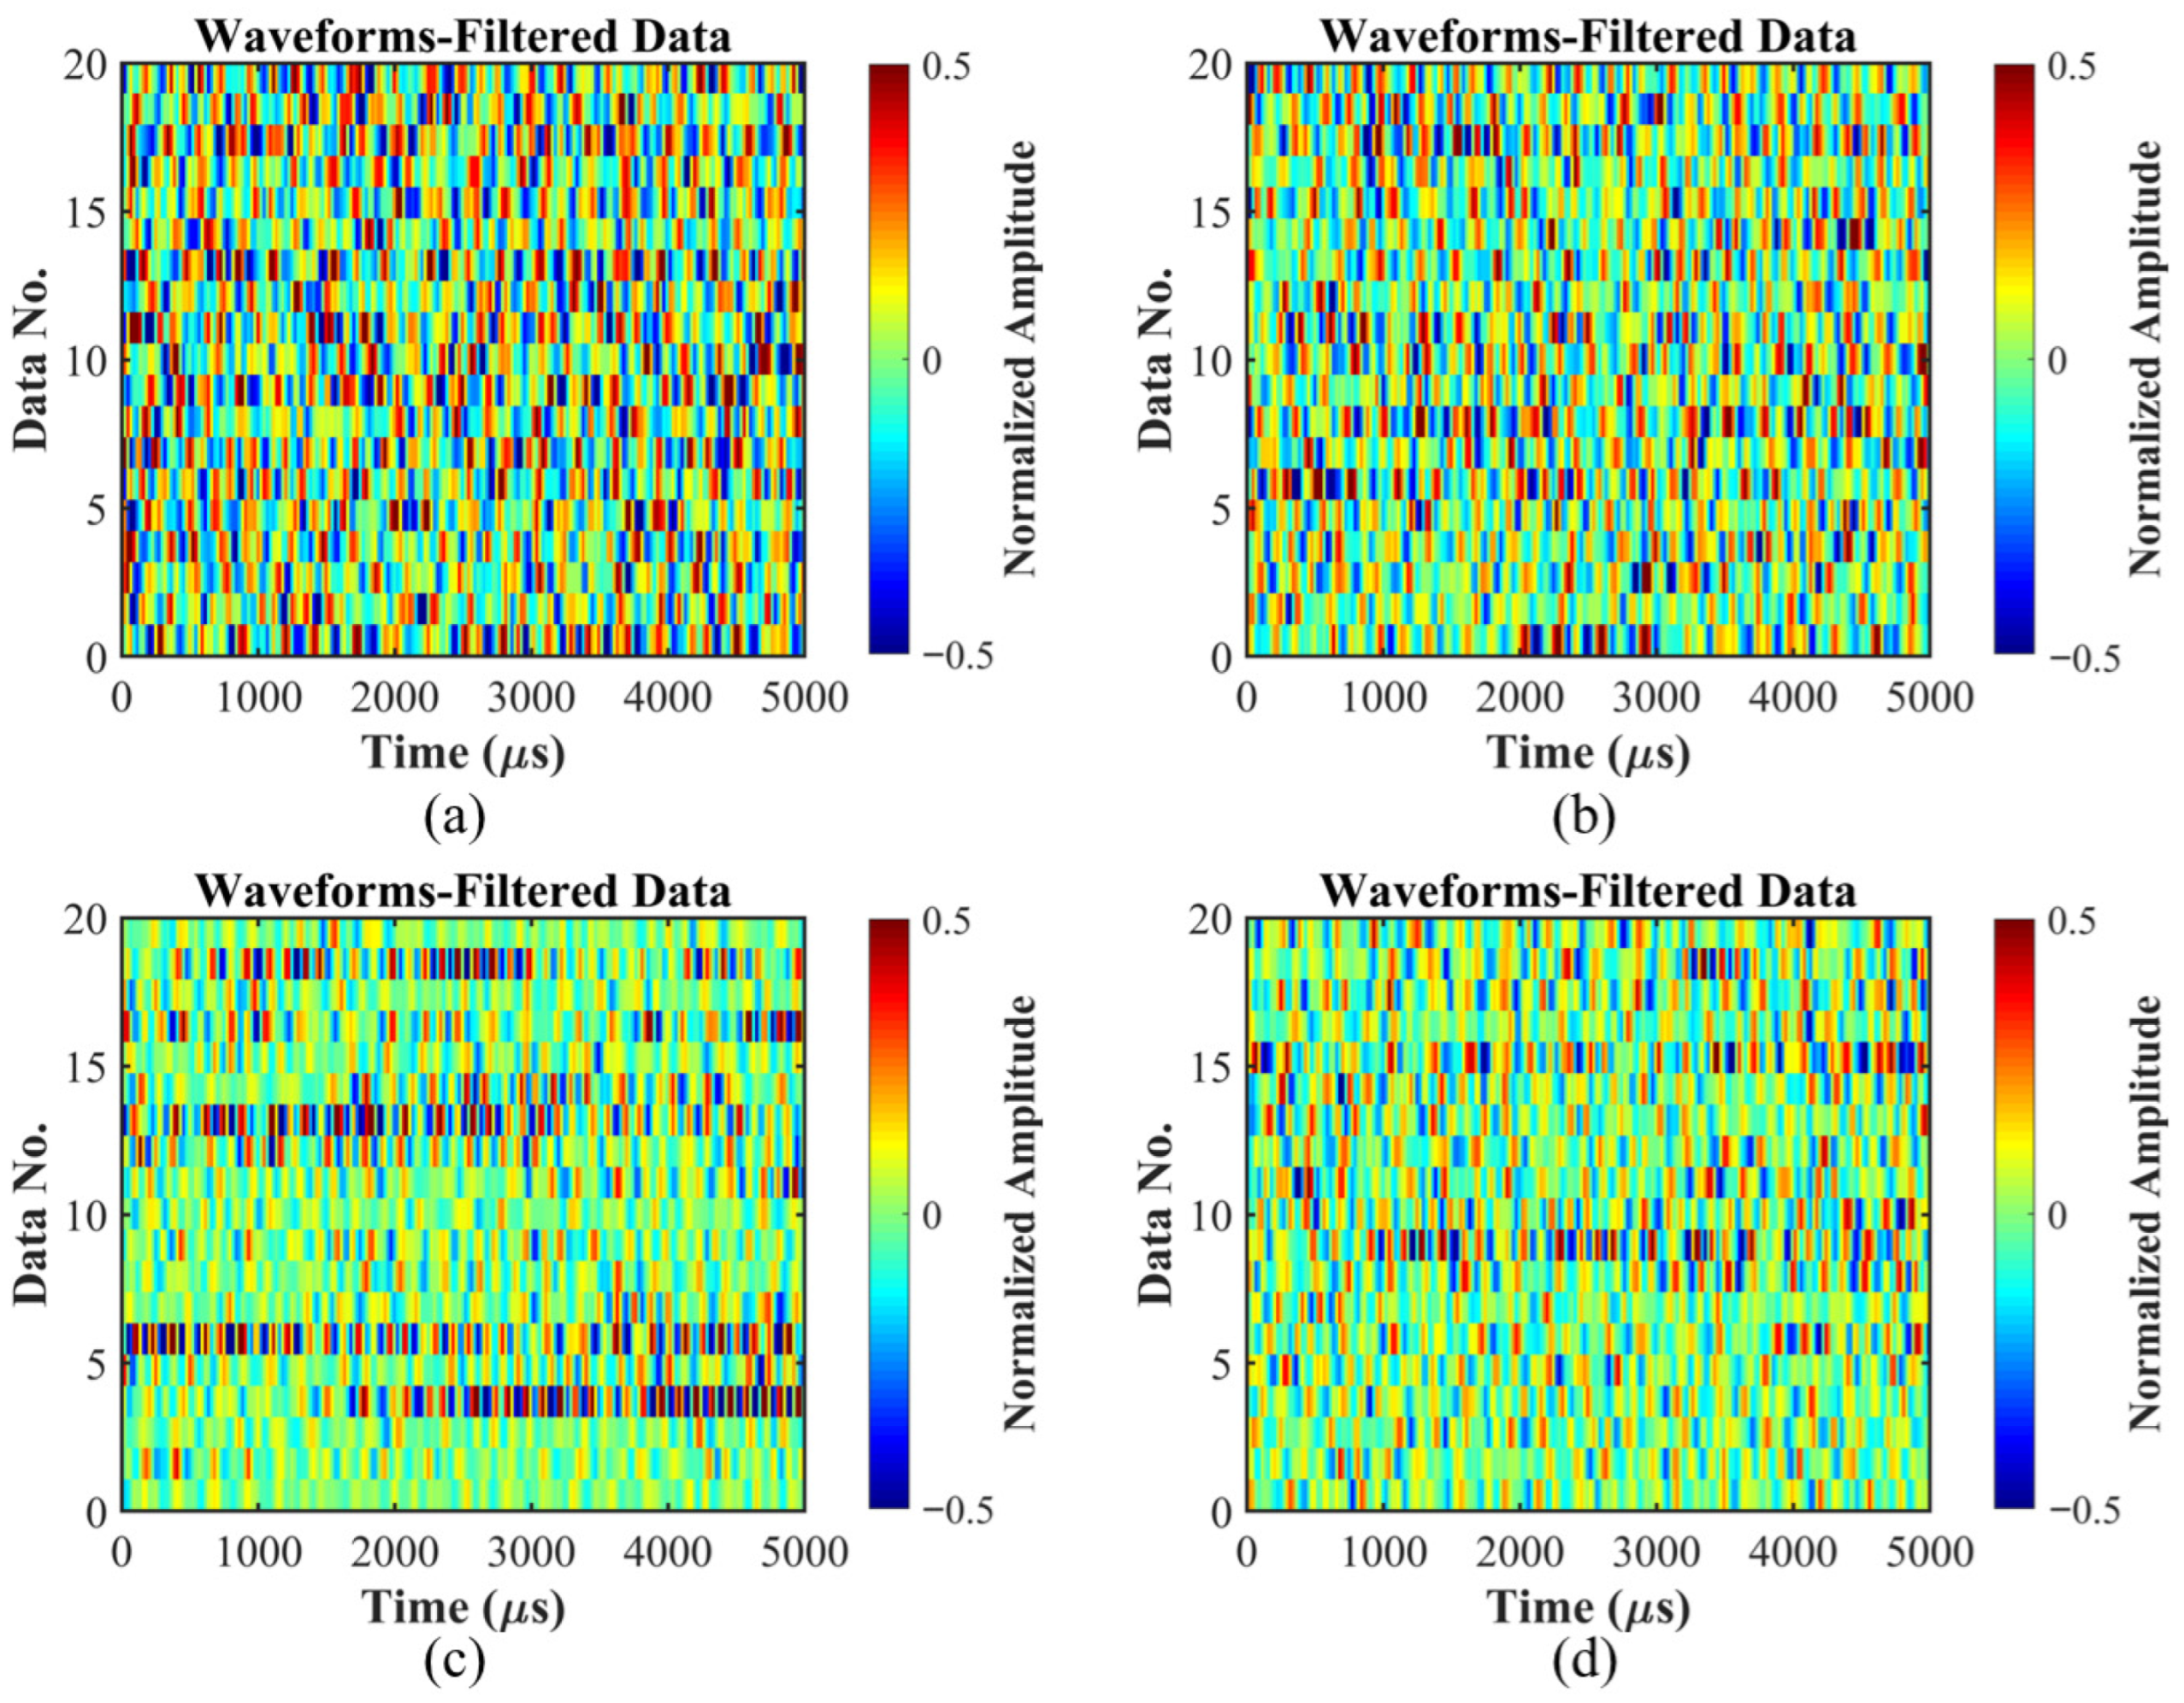
Previous studies have shown that the low-frequency energy of drilling sound is useful for monitoring drilling conditions (e.g., bit wear and abnormal tool vibration), whereas the high-frequency energy is strongly correlated with formation properties such as lithology [25,29,31]. In our experiments, we observed distinct differences in the frequency characteristics of rock-breaking sounds among samples of different lithologies, particularly in the 3–15 kHz range. To emphasize these differences, we applied a 3–15 kHz band-pass filter to the raw waveform data. Accordingly, this work focuses on the analysis of high-frequency components and their characteristics in rock-breaking sound. Figure 5 shows the filtered waveforms of the data in Figure 4 by a 3–15 kHz band-pass filter. The four subfigures of Figure 5 correspond to the filtered waveforms of sandstone, limestone, granite, and shaly sandstone, respectively. From the filtered waveforms, it is evident that the mid-to-low-frequency energy is relatively strong in the waveforms of sandstone and shaly sandstone, while the waveforms of limestone exhibit richer high-frequency energy. It is particularly noteworthy that, compared to sandstone, the rock-breaking sound of shaly sandstone also contains a certain distribution of high-frequency components. This phenomenon may be attributed to the increased density of the sandstone after being filled with argillaceous components, which could lead to the emergence of a certain proportion of high-frequency signals.
Figure 5.
Filtered waveforms of the drilling sounds recorded within rocks and each row represents the waveform data recorded in one experiment. (a) Sandstone, (b) limestone, (c) granite, (d) shaly sandstone.
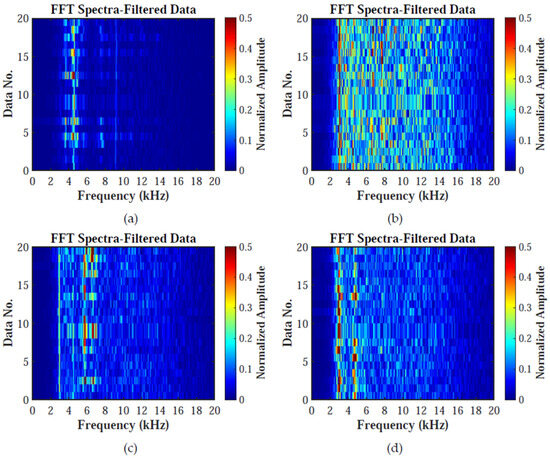
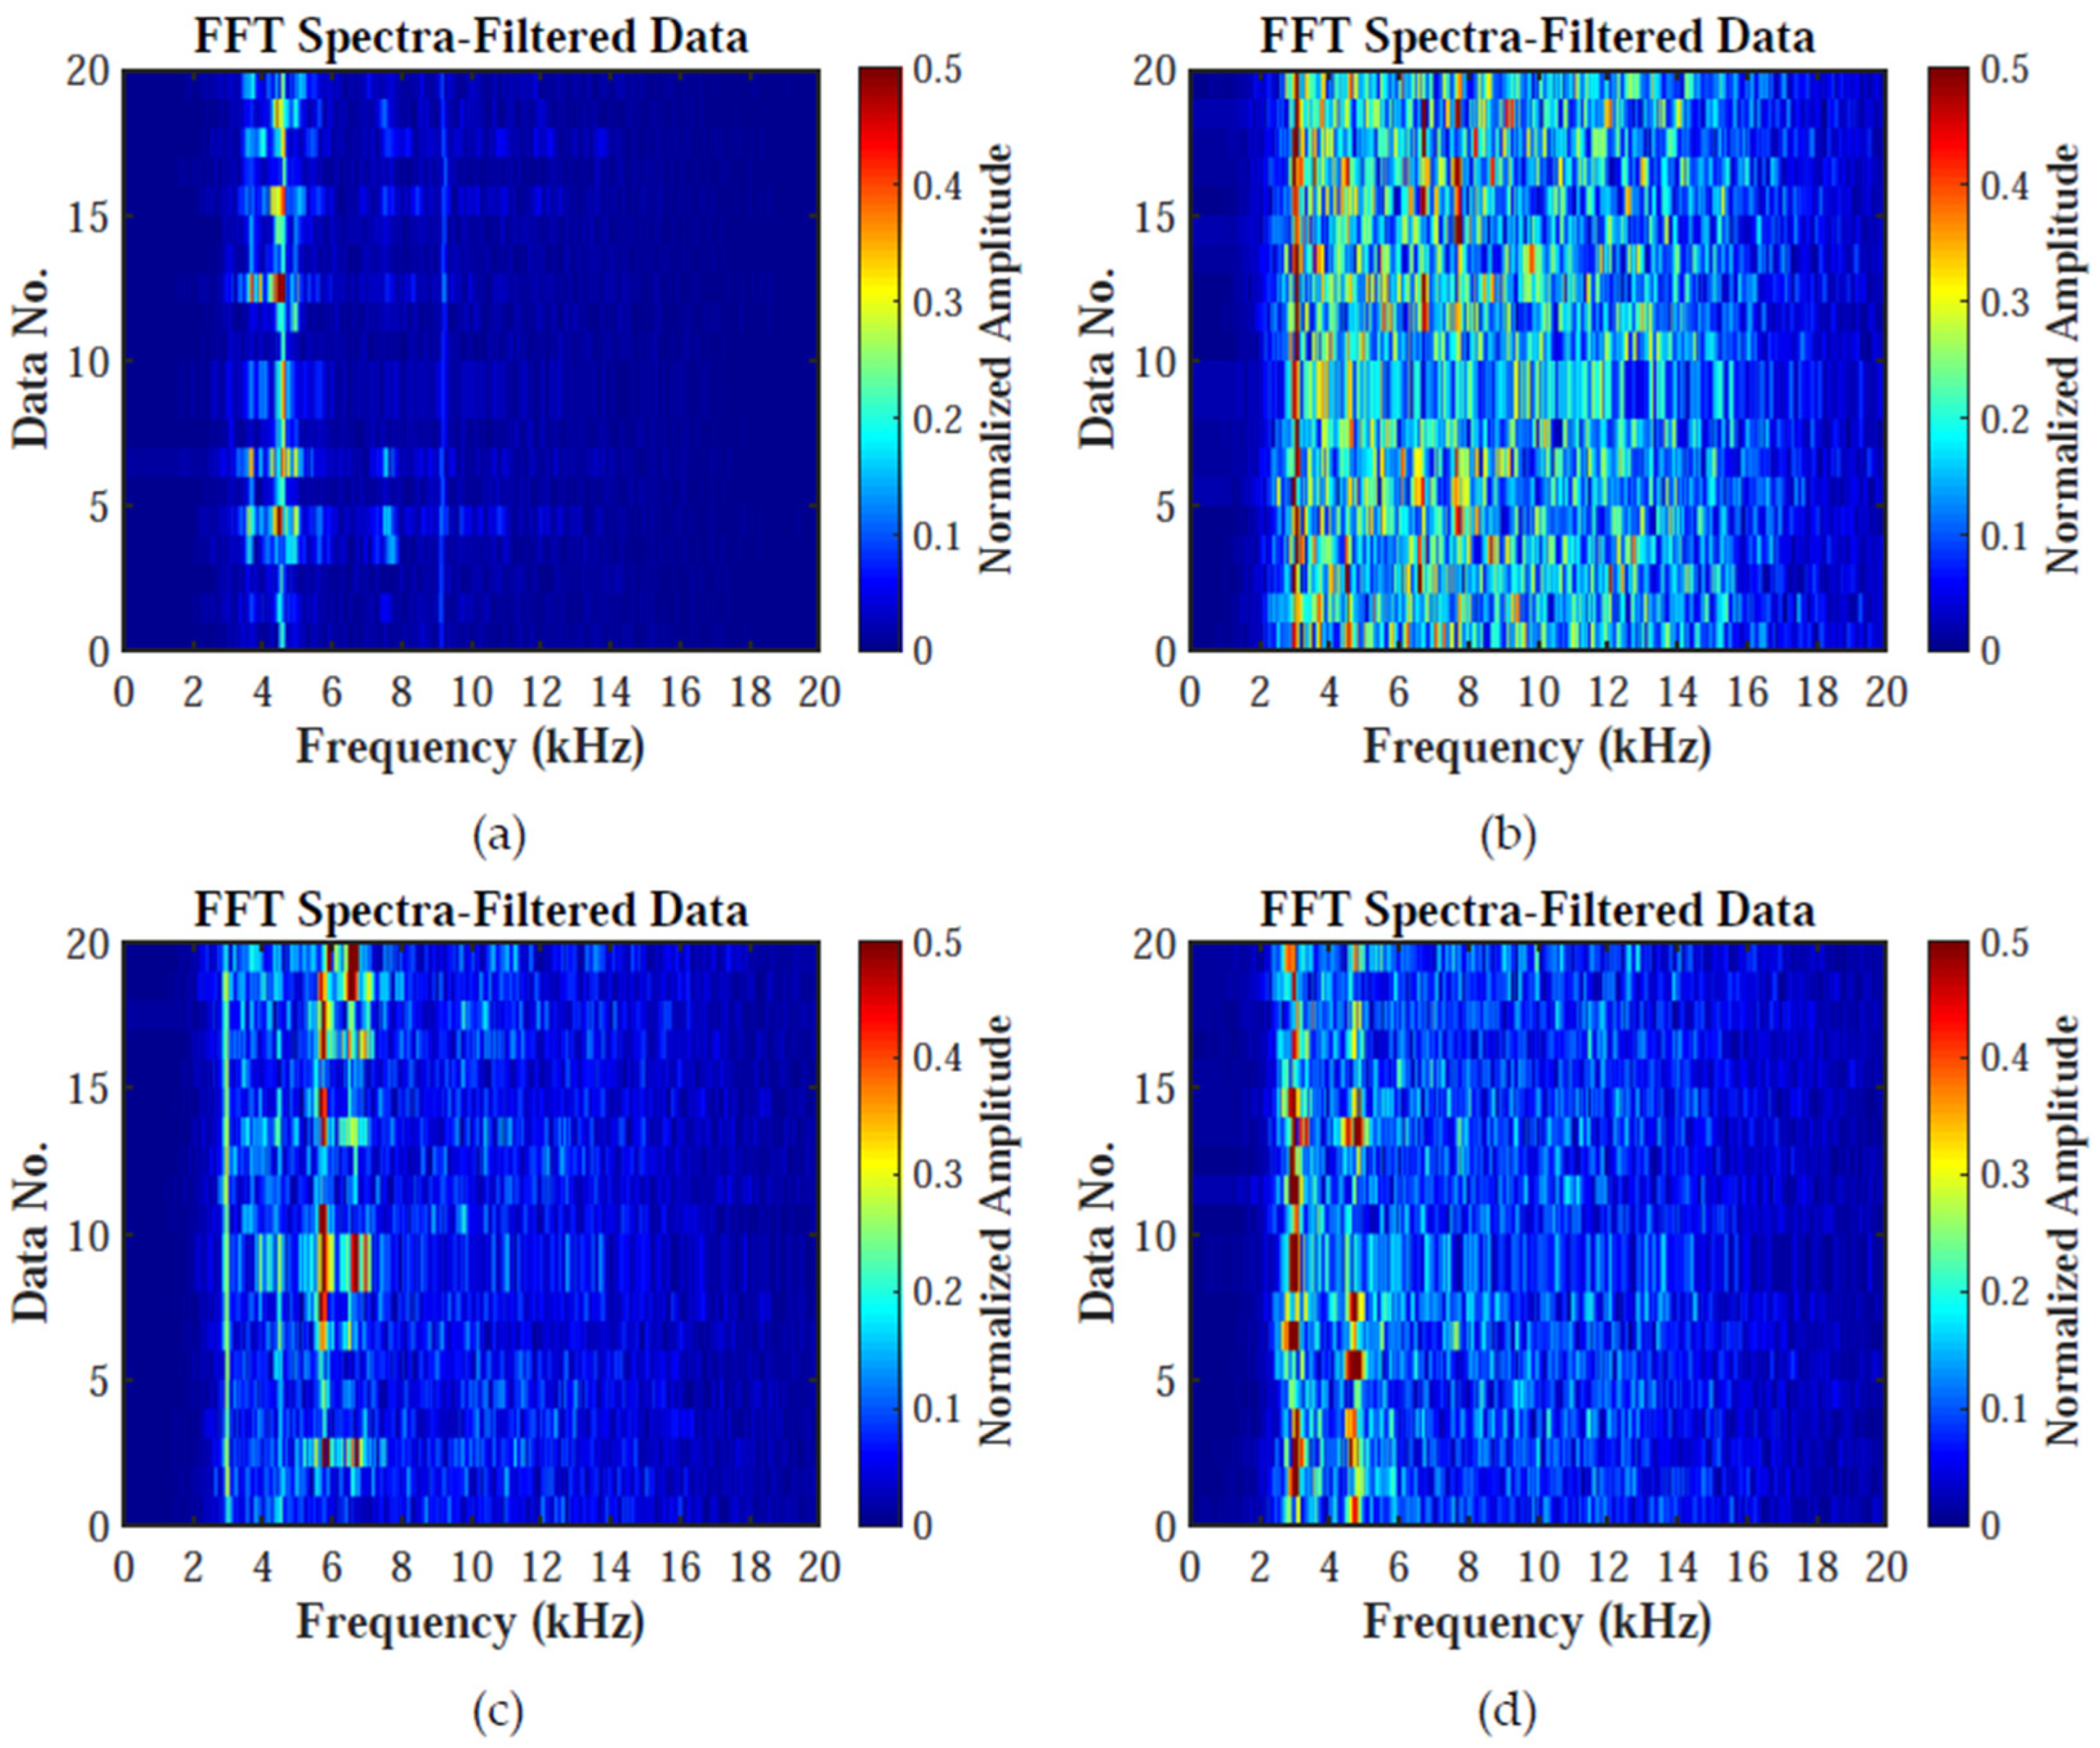
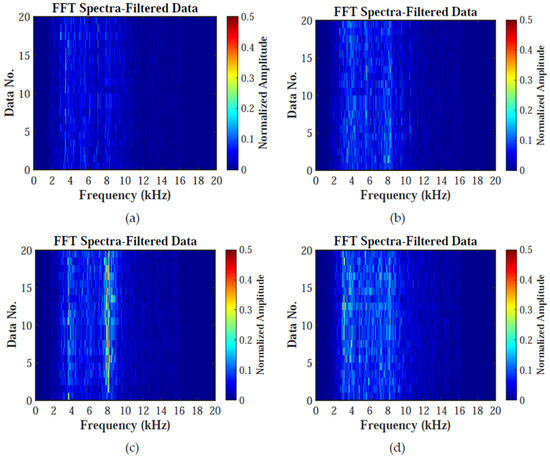
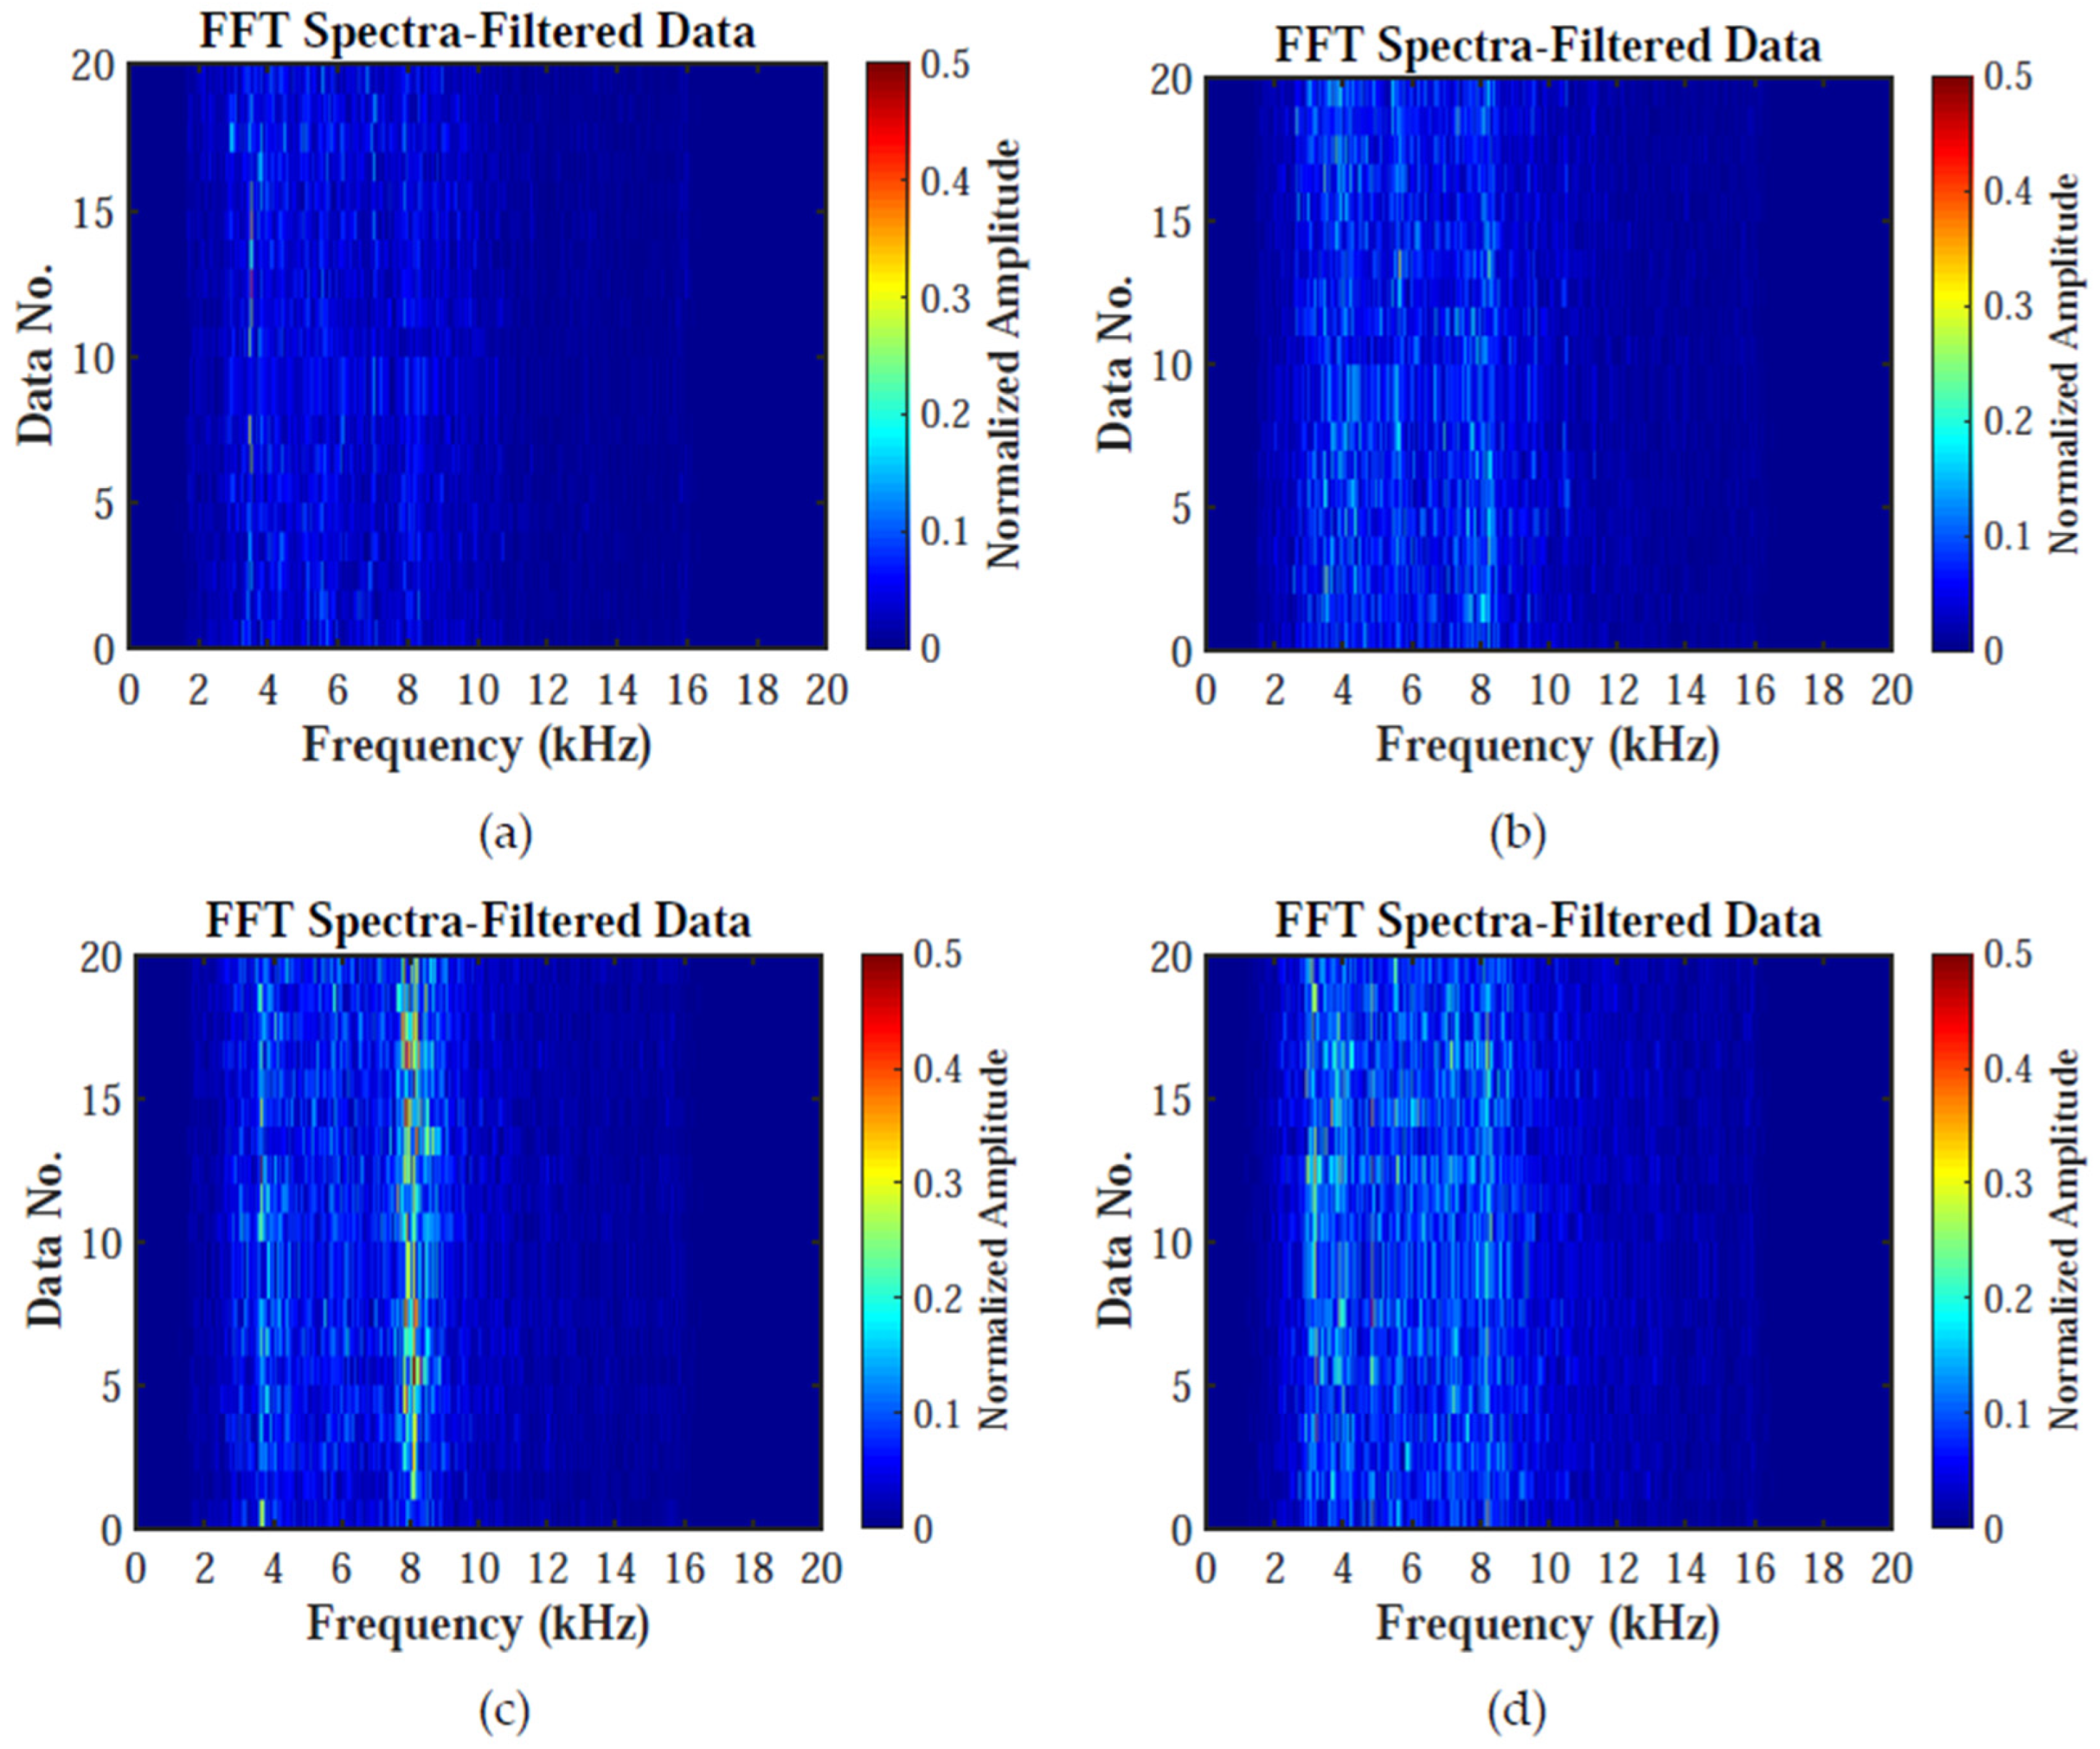
Based on the filtered waveform data, the amplitude spectra of the filtered waveforms were obtained using FFT, as shown in Figure 6. Similarly, the four subplots correspond to the calculation results for sandstone, limestone, granite, and shaly sandstone, respectively. From Figure 6, it can be observed that the energy of sandstone and shaly sandstone is primarily concentrated in the mid-to-low-frequency range, while limestone and granite exhibit a significant proportion of high-frequency components. Additionally, the frequency consistency across the 20 repeated experiments is relatively high for limestone and shaly sandstone, whereas it is somewhat lower for sandstone and granite. This discrepancy may be attributed to the larger particle sizes and stronger heterogeneity in the latter (sandstone and granite), which could introduce greater randomness in the repeated experiments. Anyway, from these amplitude spectra, information related to the inherent characteristics of the rocks can be extracted, such as rock hardness, mineral composition, and distribution patterns. This lays the foundation for utilizing rock-breaking sounds to identify lithology.
Figure 6.
FFT spectra of the filtered drilling sounds recorded within rocks and each row represents the FFT spectrum of the waveform data recorded in one experiment. (a) Sandstone, (b) limestone, (c) granite, (d) shaly sandstone.
Using the amplitude FFT spectra data shown in Figure 6, the average FFT spectra and average PSD spectra of the 20 repeated experiments for the four types of rocks were further calculated, as illustrated in Figure 7. Specifically, Figure 7a displays the average FFT spectra of the drilling sound for the four rock types, while Figure 7b shows the corresponding average PSD spectra. In each subplot, the red, blue, green, and pink lines represent the calculation results for sandstone, limestone, granite, and shaly sandstone, respectively. From Figure 7a, the frequency distribution characteristics of the rock-breaking sounds for each rock type can be intuitively observed. Specifically, the main energy of sandstone is distributed between 3 and 5 kHz, the major energy of shaly sandstone is distributed between 2 and 5 kHz, with some high-frequency energy also present, while limestone and granite exhibit a broader frequency range (from approximately 3 kHz to 8 kHz) and possess richer high-frequency energy peaks. By calculating the average energy spectrum, we can observe more focused spectral peaks. From Figure 7b, it is evident that the energy spectra of sandstone and shaly sandstone have fewer peaks (less than 3), which are mostly distributed in the low-frequency range. In contrast, the energy spectra of limestone and granite exhibit more peaks (≥4), with a wider distribution range. Therefore, we can conclude that, in the controlled laboratory environment of this study—without the influence of variable bit designs, weight on bit (WOB), or drilling fluid—the frequency characteristics of rock-breaking sounds demonstrate distinct patterns that correlate with different lithological formations. If we can extract and analyze these features of drilling sound, it will help us determine the current formation information in real time.
Since the first three peak frequencies contain the majority of energy of the drilling acoustic signal, we analyzed the top three peak frequencies from each amplitude spectrum. Table 3 compared the first three peak frequencies of PSD for the four rock samples as shown in Figure 7b. To establish a mapping relationship model between peak frequencies and the P- and S-wave velocities of rocks, a quadratic polynomial regression model was developed employing the least squares method based on the data provided in Table 3. The quadratic polynomial regression of the Vp and Vs with the average peak frequencies of PSD spectra are as follows:
where and are the predicted velocities of Vp and Vs, respectively. is average of the first three peak frequencies of the PSD spectra, i.e., . , , and , , are the coefficients of the above regression models for Vp and Vs, respectively.
Table 3.
The first three peak frequencies of PSD for the four rock samples (kHz).
Figure 7.
Comparison of (a) the average FFT spectra, and (b) the average PSD spectra of the filtered drilling sounds recorded within rocks. In each subfigure, the red, blue, green, and pink lines represent the calculated results for sandstone, limestone, granite, and shaly sandstone, respectively.
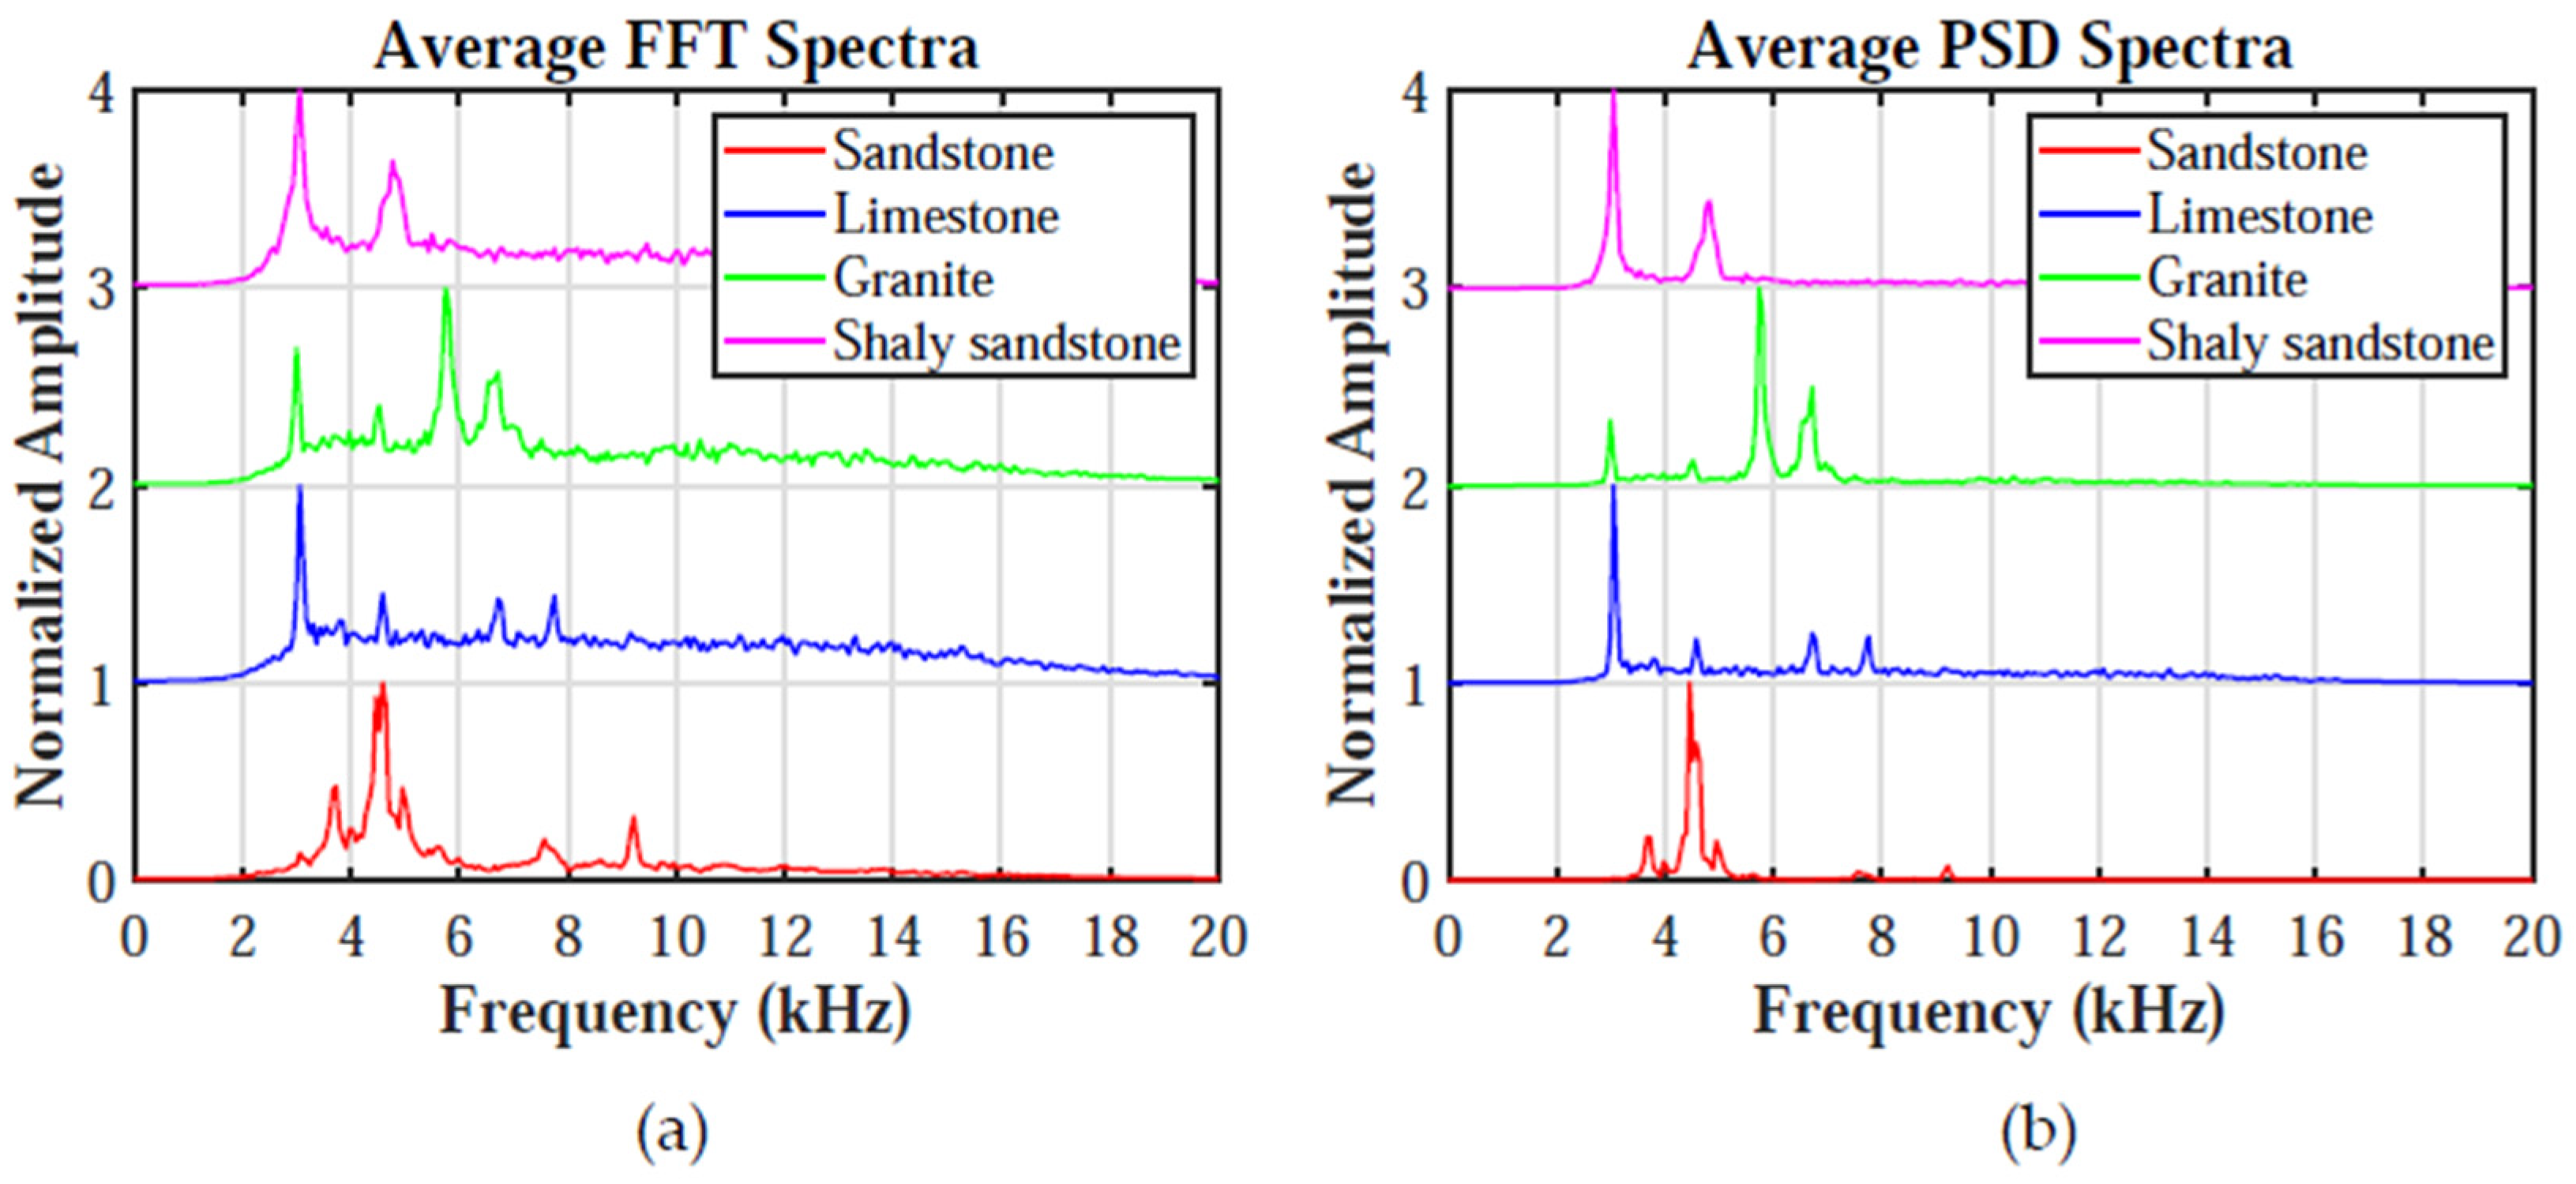
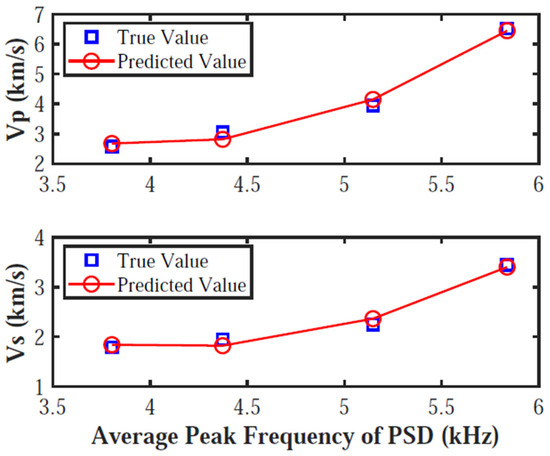
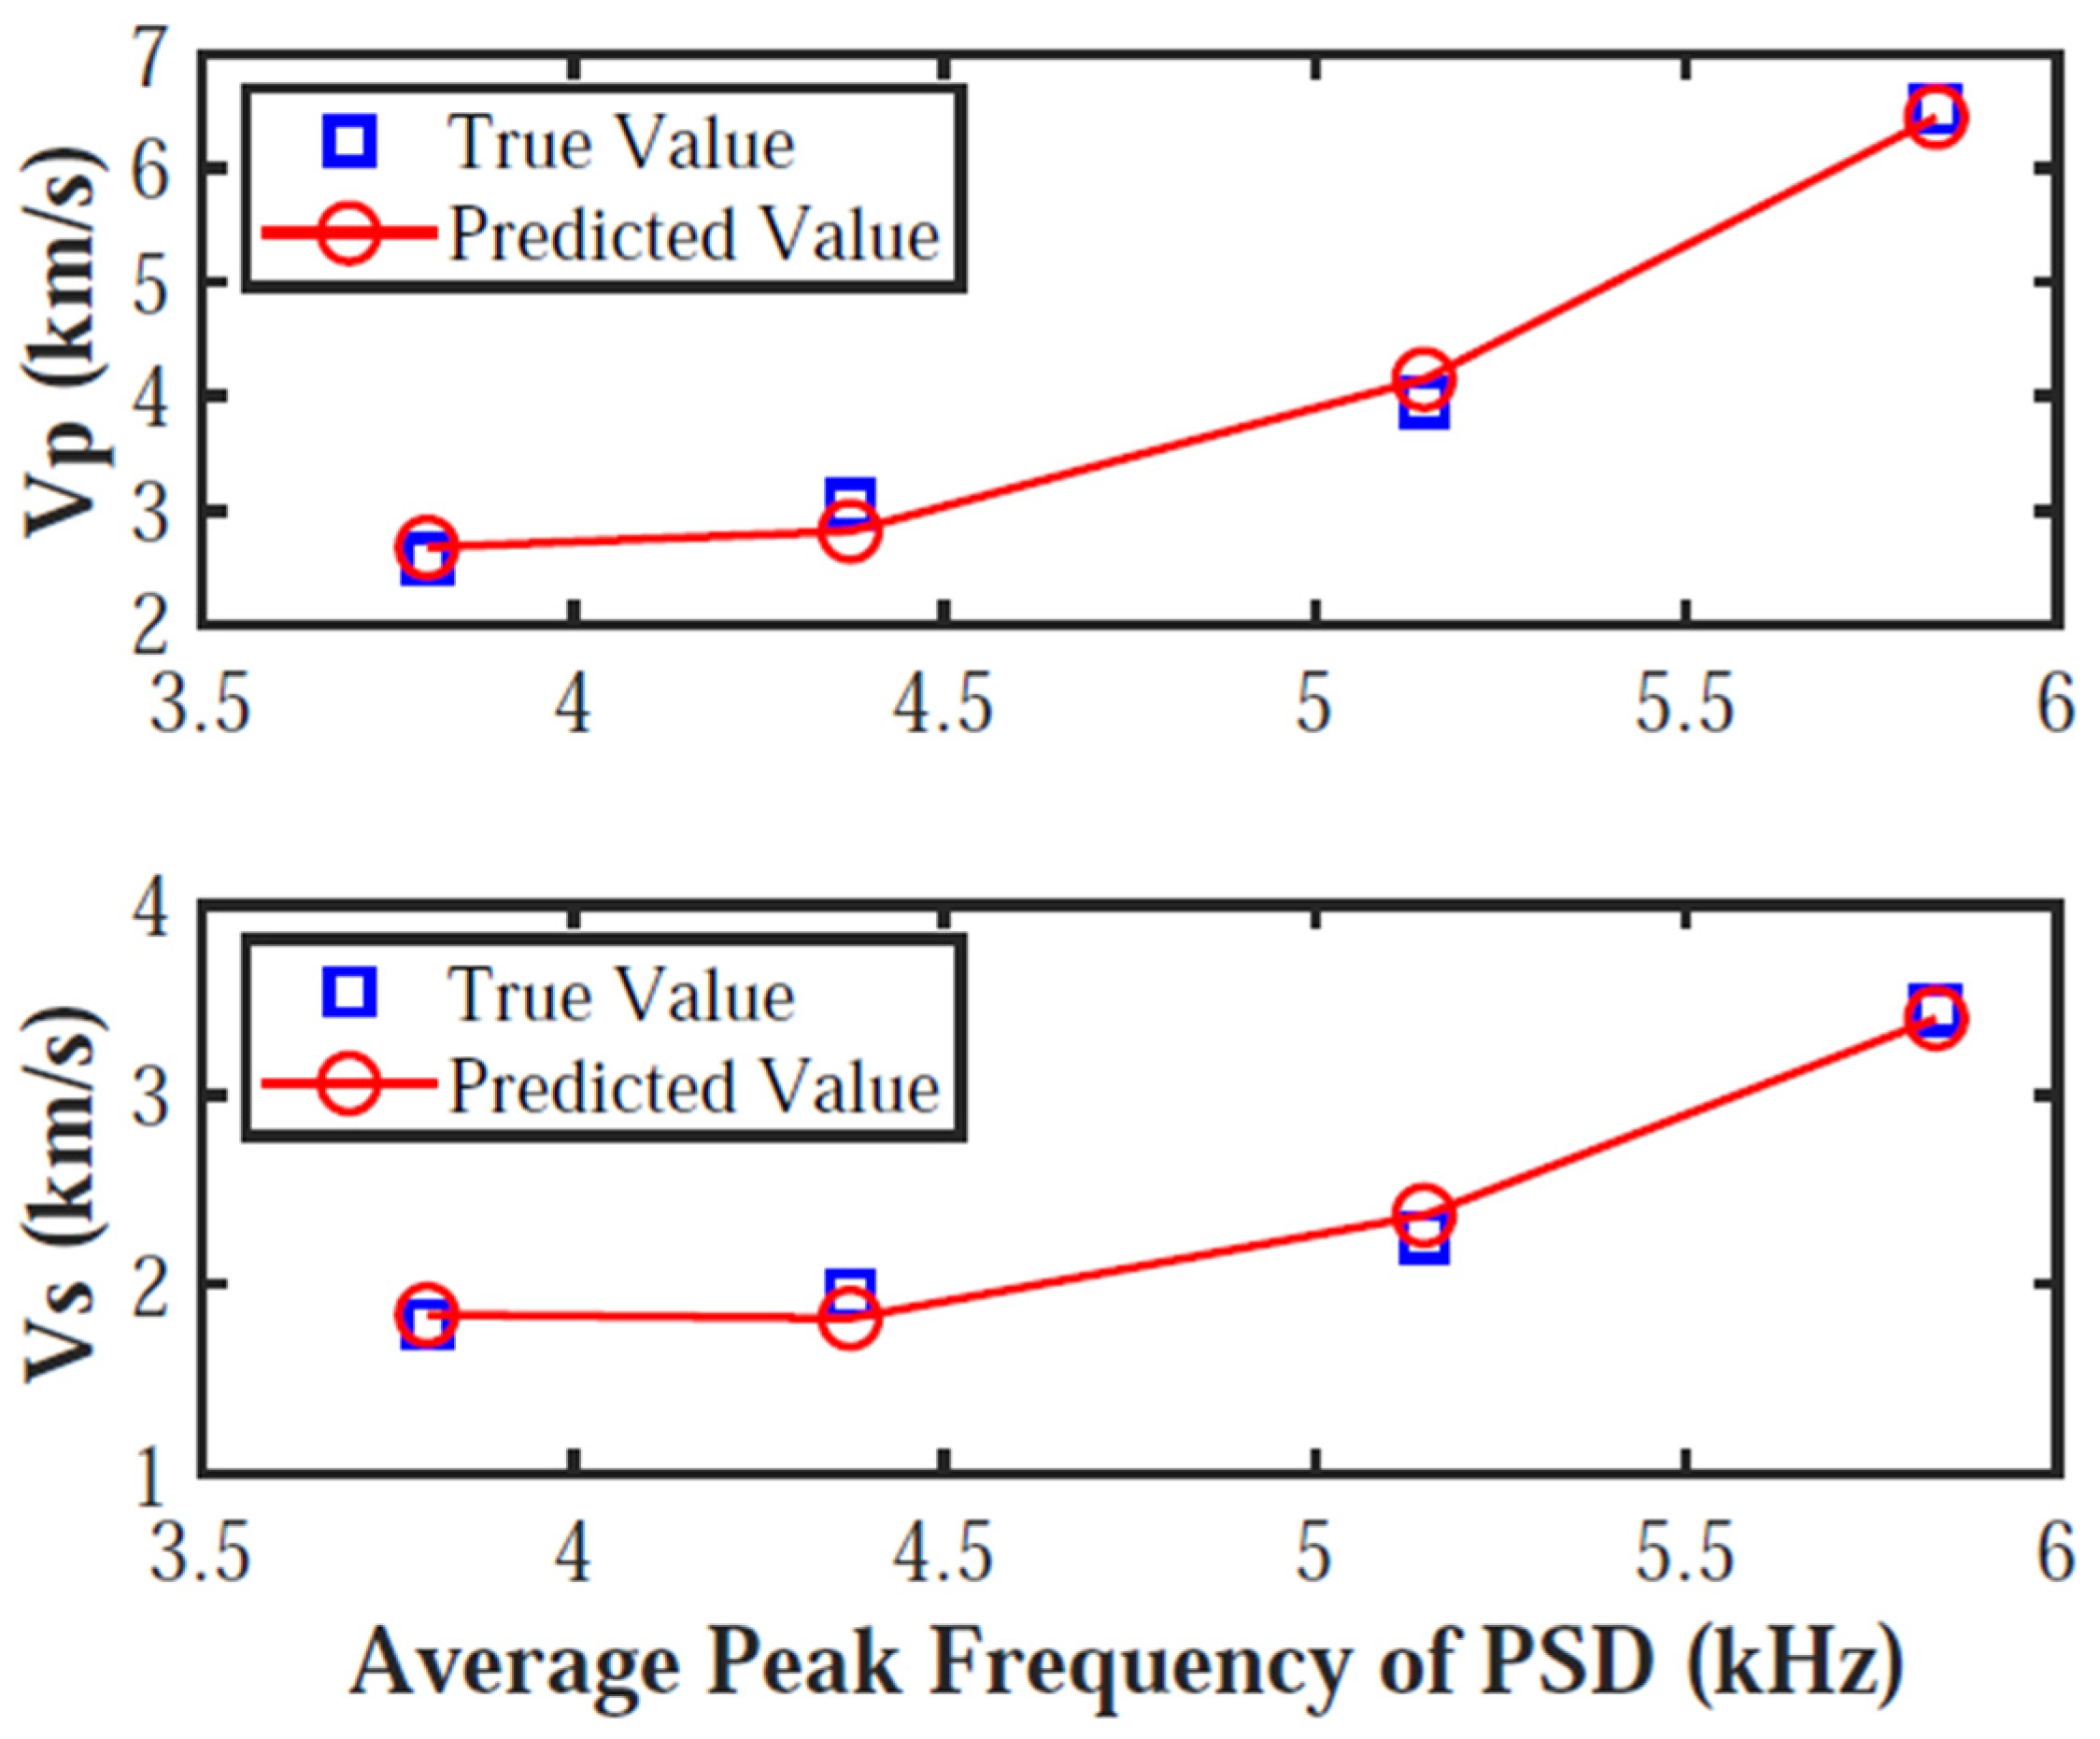
Figure 8 shows a comparison between the model-predicted results, using the aforementioned mapping model with the input of average peak frequencies, and the true P-wave and S-wave velocities of the rock sample used in the experiments. It is evident that the agreement between the two is highly consistent, with coefficients of determination R2 for the P-wave and S-wave reaching 0.9878 and 0.9799, respectively. Based on the mapping models shown in Equations (4) and (5), when we obtain the average peak frequencies of PSD of the drilling sound, the velocities of P- and S-wave of rock can be obtained in the first time, and then the corresponding lithology information can be retrieved.
Figure 8.
Quadratic polynomial regression of the Vp and Vs with the peak frequencies of the four distinct rock samples. In each subfigure, the blue squares represent the measured true Vp or Vs of the four rock samples obtained from laboratory tests, while the red circles denote the corresponding Vp or Vs calculated using Equations (4) and (5).
3.2. Data Recording in the Air
Considering that the characteristics of rock-drilling sound are influenced by the transmission path and medium, this section introduces the rock-drilling sound signals recorded in air using a broadband microphone. The experimental parameters are listed in Table 1. In the experiment, drill bits with diameters of 8 mm and 14 mm were used for the drilling tests, and both low- and high-RPM settings were designed for comparison. To obtain high-fidelity sound signals, the microphone was positioned close to the center of the side surface of the rock sample for data collection. Each recording captured a relatively long duration of sound signals (e.g., 3 min) to facilitate subsequent frame-based processing and analysis. In the subsequent data analysis, the experimental results from 20 sets of repeated experiments extracted from each control group are primarily presented and discussed.
Without loss of generality, and to facilitate comparison with the rock-drilling sounds recorded within the rock, this section focuses on analyzing the measurement data obtained from the 14 mm drill bit operating at high speed. Figure 9 shows the raw waveforms of the drilling sounds recorded in the air and each row represents the waveform data recorded in one experiment with a 14 mm drill bit and high RPM setting. The four subfigures of Figure 9 correspond to the test results of sandstone, limestone, granite, and shaly sandstone, respectively. From Figure 9, it can be observed that the raw waveforms of the rock-drilling sounds for the four types of rocks are relatively complex, making direct comparison and analysis challenging. One noticeable phenomenon is that the waveform frequency of sandstone is relatively lower, while the rock-drilling sound frequencies of the other three rock types are comparatively higher. Additionally, the 20 groups of repeated experiments for each rock type exhibit both randomness and a good degree of consistency.
Figure 9.
Raw waveforms of the drilling sounds recorded in the air with 14 mm bit and high RPM and each row represents the waveform data recorded in one experiment. (a) Sandstone, (b) limestone, (c) granite, (d) shaly sandstone.
Figure 10 shows the filtered waveforms of the data in Figure 9 by a 3–15 kHz band-pass filter. The four subfigures of Figure 9 correspond to the filtered waveforms of sandstone, limestone, granite, and shaly sandstone, respectively. It can be observed that after filtering, the waveforms of the four types of rocks have their high-frequency energy effectively highlighted, making the differences in the amplitude spectra of the sounds more distinguishable. Similarly, for sandstone, the mid-to-low-frequency energy distribution is relatively abundant, while limestone exhibits stronger high-frequency signal energy. The amplitude and repeatability of the four subgraphs of Figure 9 have their own unique distribution characteristics. By comparing the waveforms of Figure 9 with the four sets of waveforms in Figure 5, it is evident that the sound signals collected in air contain richer high-frequency information. The reasons for this difference may be influenced by the sensitivity variations between the two types of sound signal receivers, as well as the sound propagation path and mechanism.
Figure 10.
Filtered waveforms of the drilling sounds recorded in the air with 14 mm bit and high RPM and each row represents the waveform data recorded in one experiment. (a) Sandstone, (b) limestone, (c) granite, (d) shaly sandstone.
To more intuitively compare the frequency characteristics of the rock-drilling sounds among the four types of rocks, the FFT amplitude spectra corresponding to the four sets of waveform data in Figure 10 were calculated, as shown in Figure 11. In which, the four subplots correspond to the calculation results for sandstone, limestone, granite, and shaly sandstone, respectively. By examining the four sets of amplitude spectra in Figure 11, the differences in the frequency characteristics of the sounds produced by the four types of rocks can be clearly observed. Among them, sandstone exhibits a distinct low-frequency peak, granite shows a prominent high-frequency peak, while limestone and shaly sandstone both display a broad frequency distribution, with limestone having stronger energy in the high-frequency range. This phenomenon is largely consistent with the characteristics of the sounds from the four types of rocks collected within the rock, as shown in Figure 6. However, the energy distribution of the signals recorded in air is more balanced. Such experimental results provide an experimental foundation for utilizing rock-drilling sounds to identify lithology during drilling.
Figure 11.
FFT spectra of the filtered drilling sounds recorded in the air with 14 mm bit and high RPM and each row represents the FFT spectrum of the waveform data recorded in one experiment. (a) Sandstone, (b) limestone, (c) granite, (d) shaly sandstone.
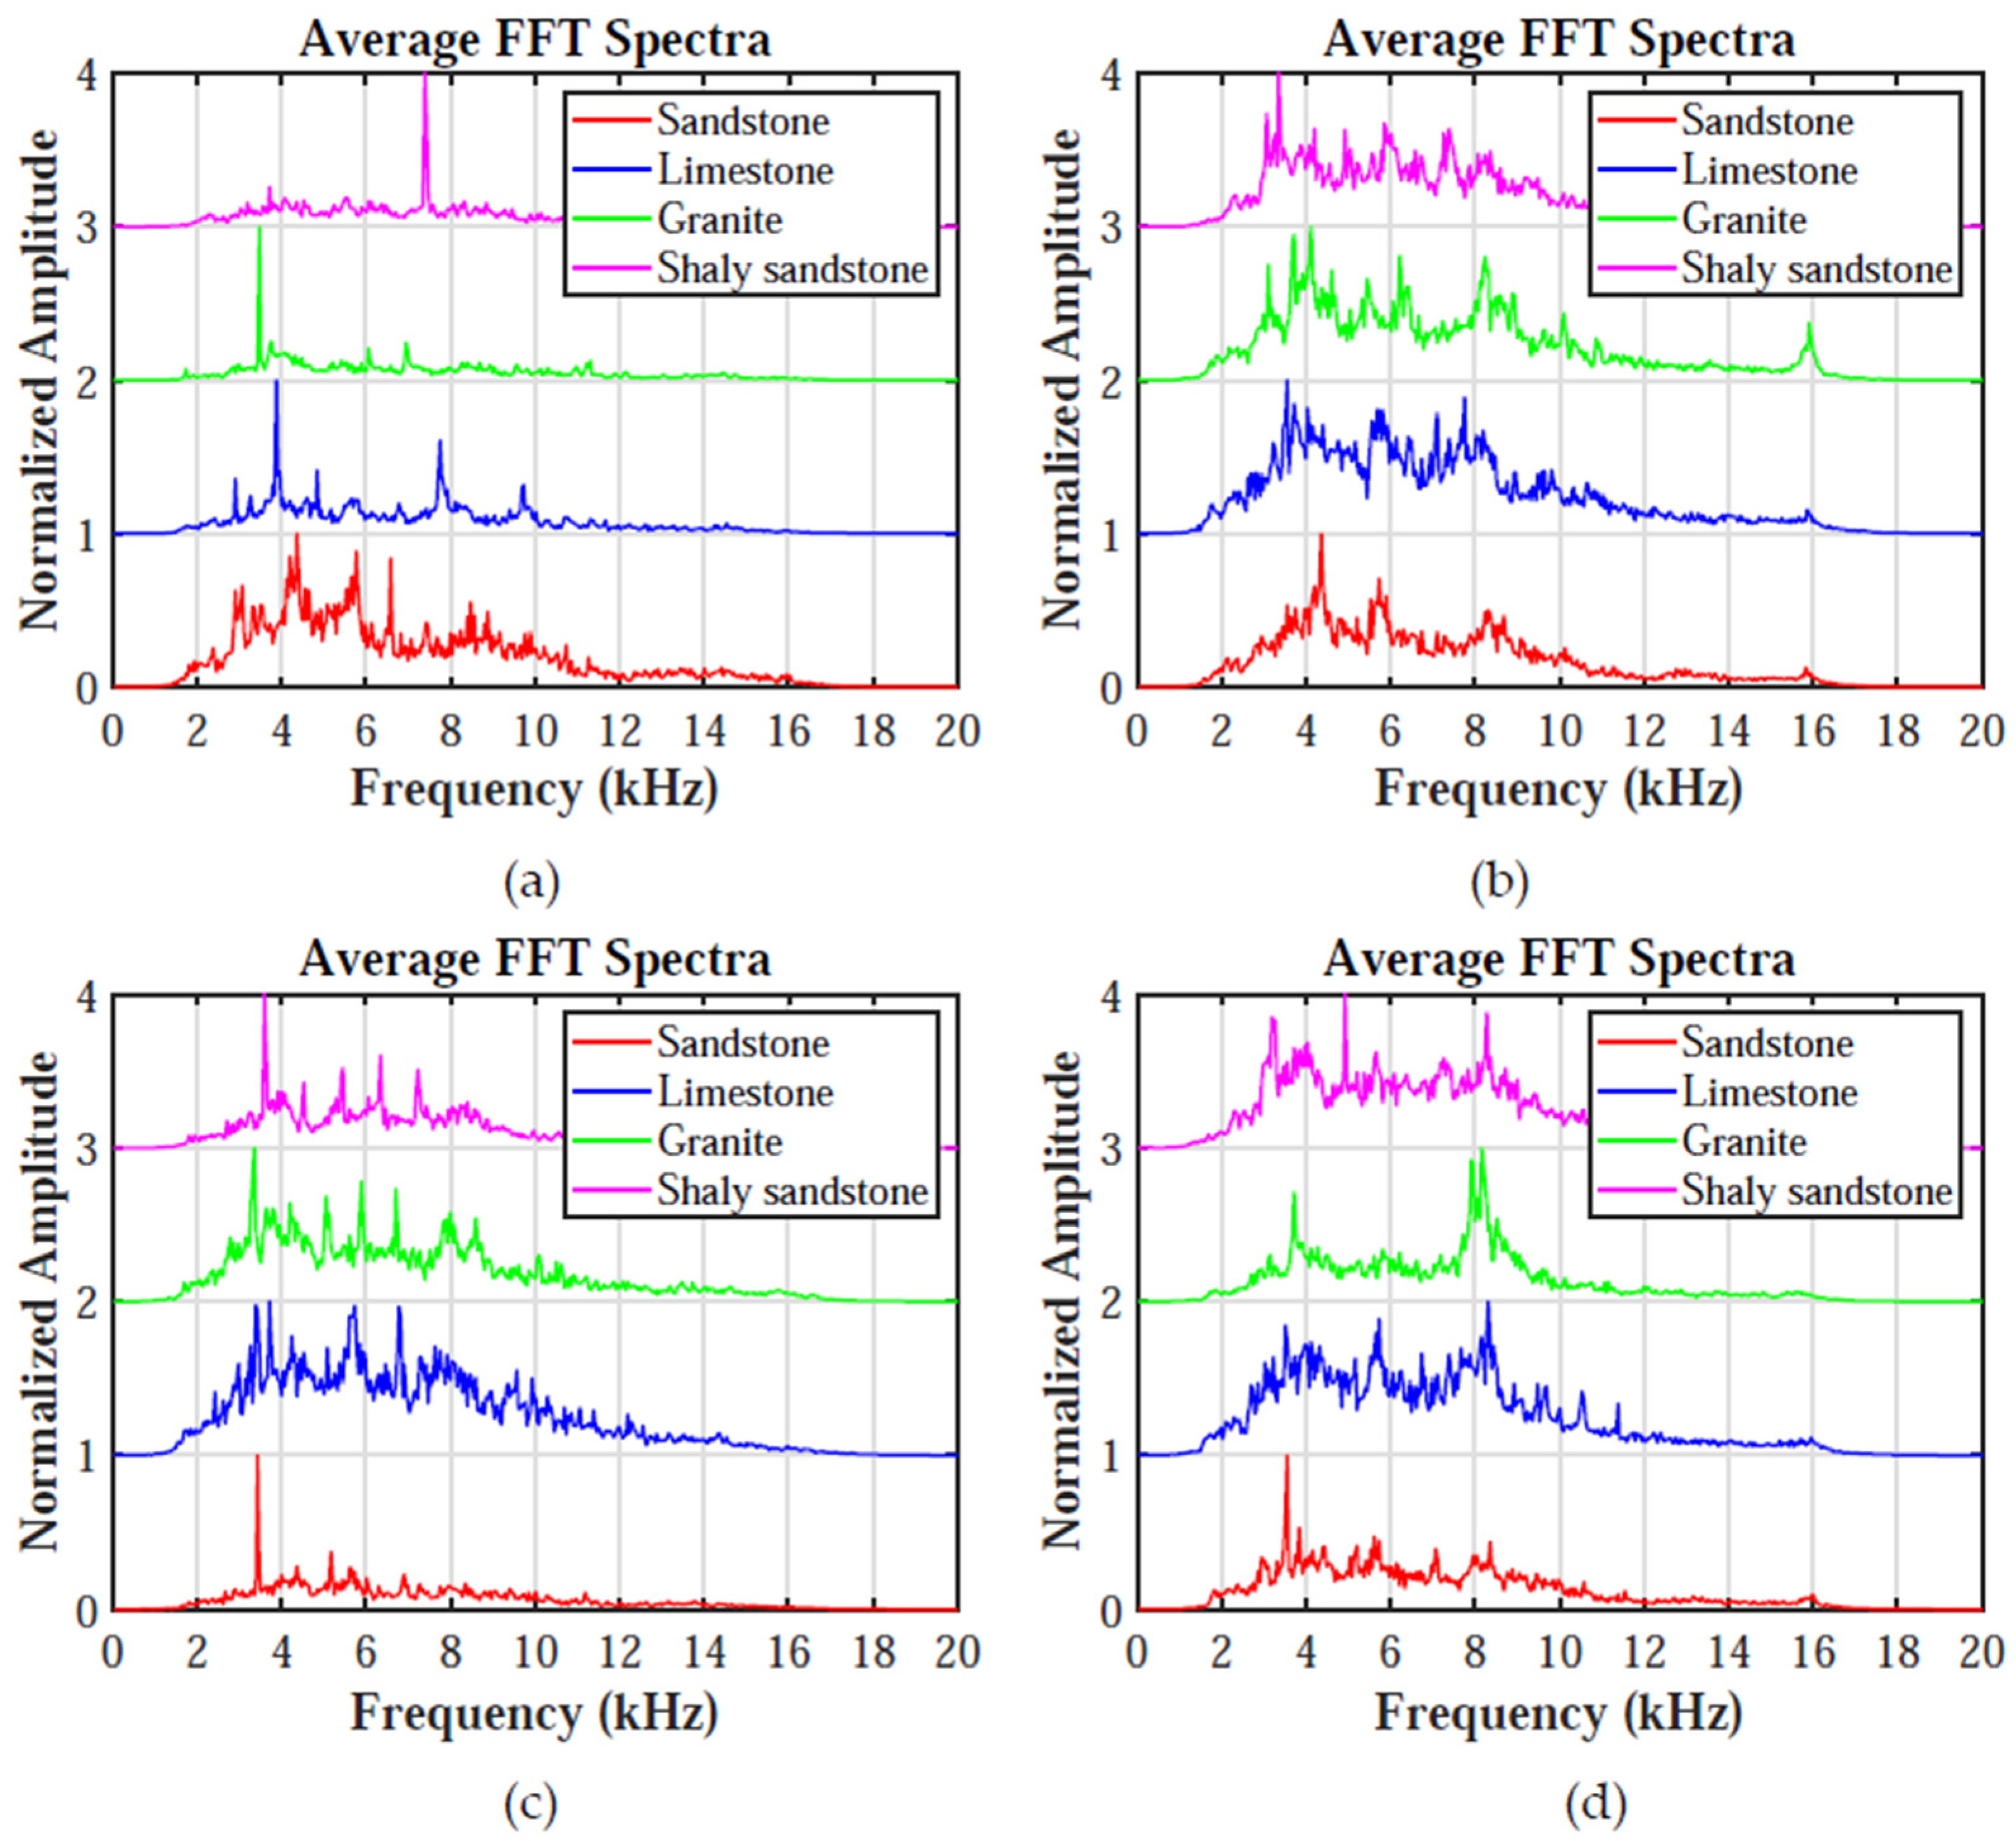
Using the method described in Equation (1), the average FFT amplitude spectra for the sounds of the four types of rocks in this group were calculated. Similarly, the average FFT amplitude spectra for the other three groups of control experiment data were also obtained, as detailed in Figure 12. The four subplots correspond to (a) 8 mm bit and low RPM, (b) 8 mm bit and high RPM, (c) 14 mm bit and low RPM, and (d) 14 mm bit and high RPM, respectively. By analyzing the four sets of curves in Figure 12, the following preliminary conclusions can be drawn: (1) The major energy of the rock-drilling sound is distributed within the range of 3–12 kHz, but the frequency distribution characteristics vary among different lithological samples. (2) Under the same drill bit diameter and RPM settings, the rock-drilling sounds of different rocks exhibit noticeable differences. (3) With the same drill bit diameter, higher RPM results in a broader frequency band and stronger high-frequency energy in the rock-drilling sounds. (4) Under the same RPM settings, a larger drill bit diameter generally broadens the frequency band of the rock-drilling sounds. (5) The characteristics of the rock-drilling sound are closely related to the properties of the rocks.
Since the FFT amplitude spectra display numerous frequency peaks, we further calculated the average PSD spectra for the four sets of data in Figure 11 using Equation (3), as shown in Figure 13. From Figure 13, it can be observed that the PSD spectra, compared to the FFT spectra, provide more focused energy, making the peak frequencies easier to identify. By comparing and analyzing the four sets of curves in Figure 13, conclusions similar to those from Figure 12 can be drawn. If we compare the characteristics of the sound signals collected in air with those collected within the rock, we find that the frequency response characteristics of different rocks are generally similar. However, the sound signals recorded in air exhibit richer frequency components, broader frequency bands overall, and a greater number of spectral peaks.
Figure 12.
Comparison of the average FFT spectra of the filtered drilling sounds recorded in the air. (a) 8 mm bit, low RPM, (b) 8 mm bit, high RPM, (c) 14 mm bit, low RPM, (d) 14 mm bit, high RPM. In each subfigure, the red, blue, green, and pink lines represent the calculated results for sandstone, limestone, granite, and shaly sandstone, respectively.
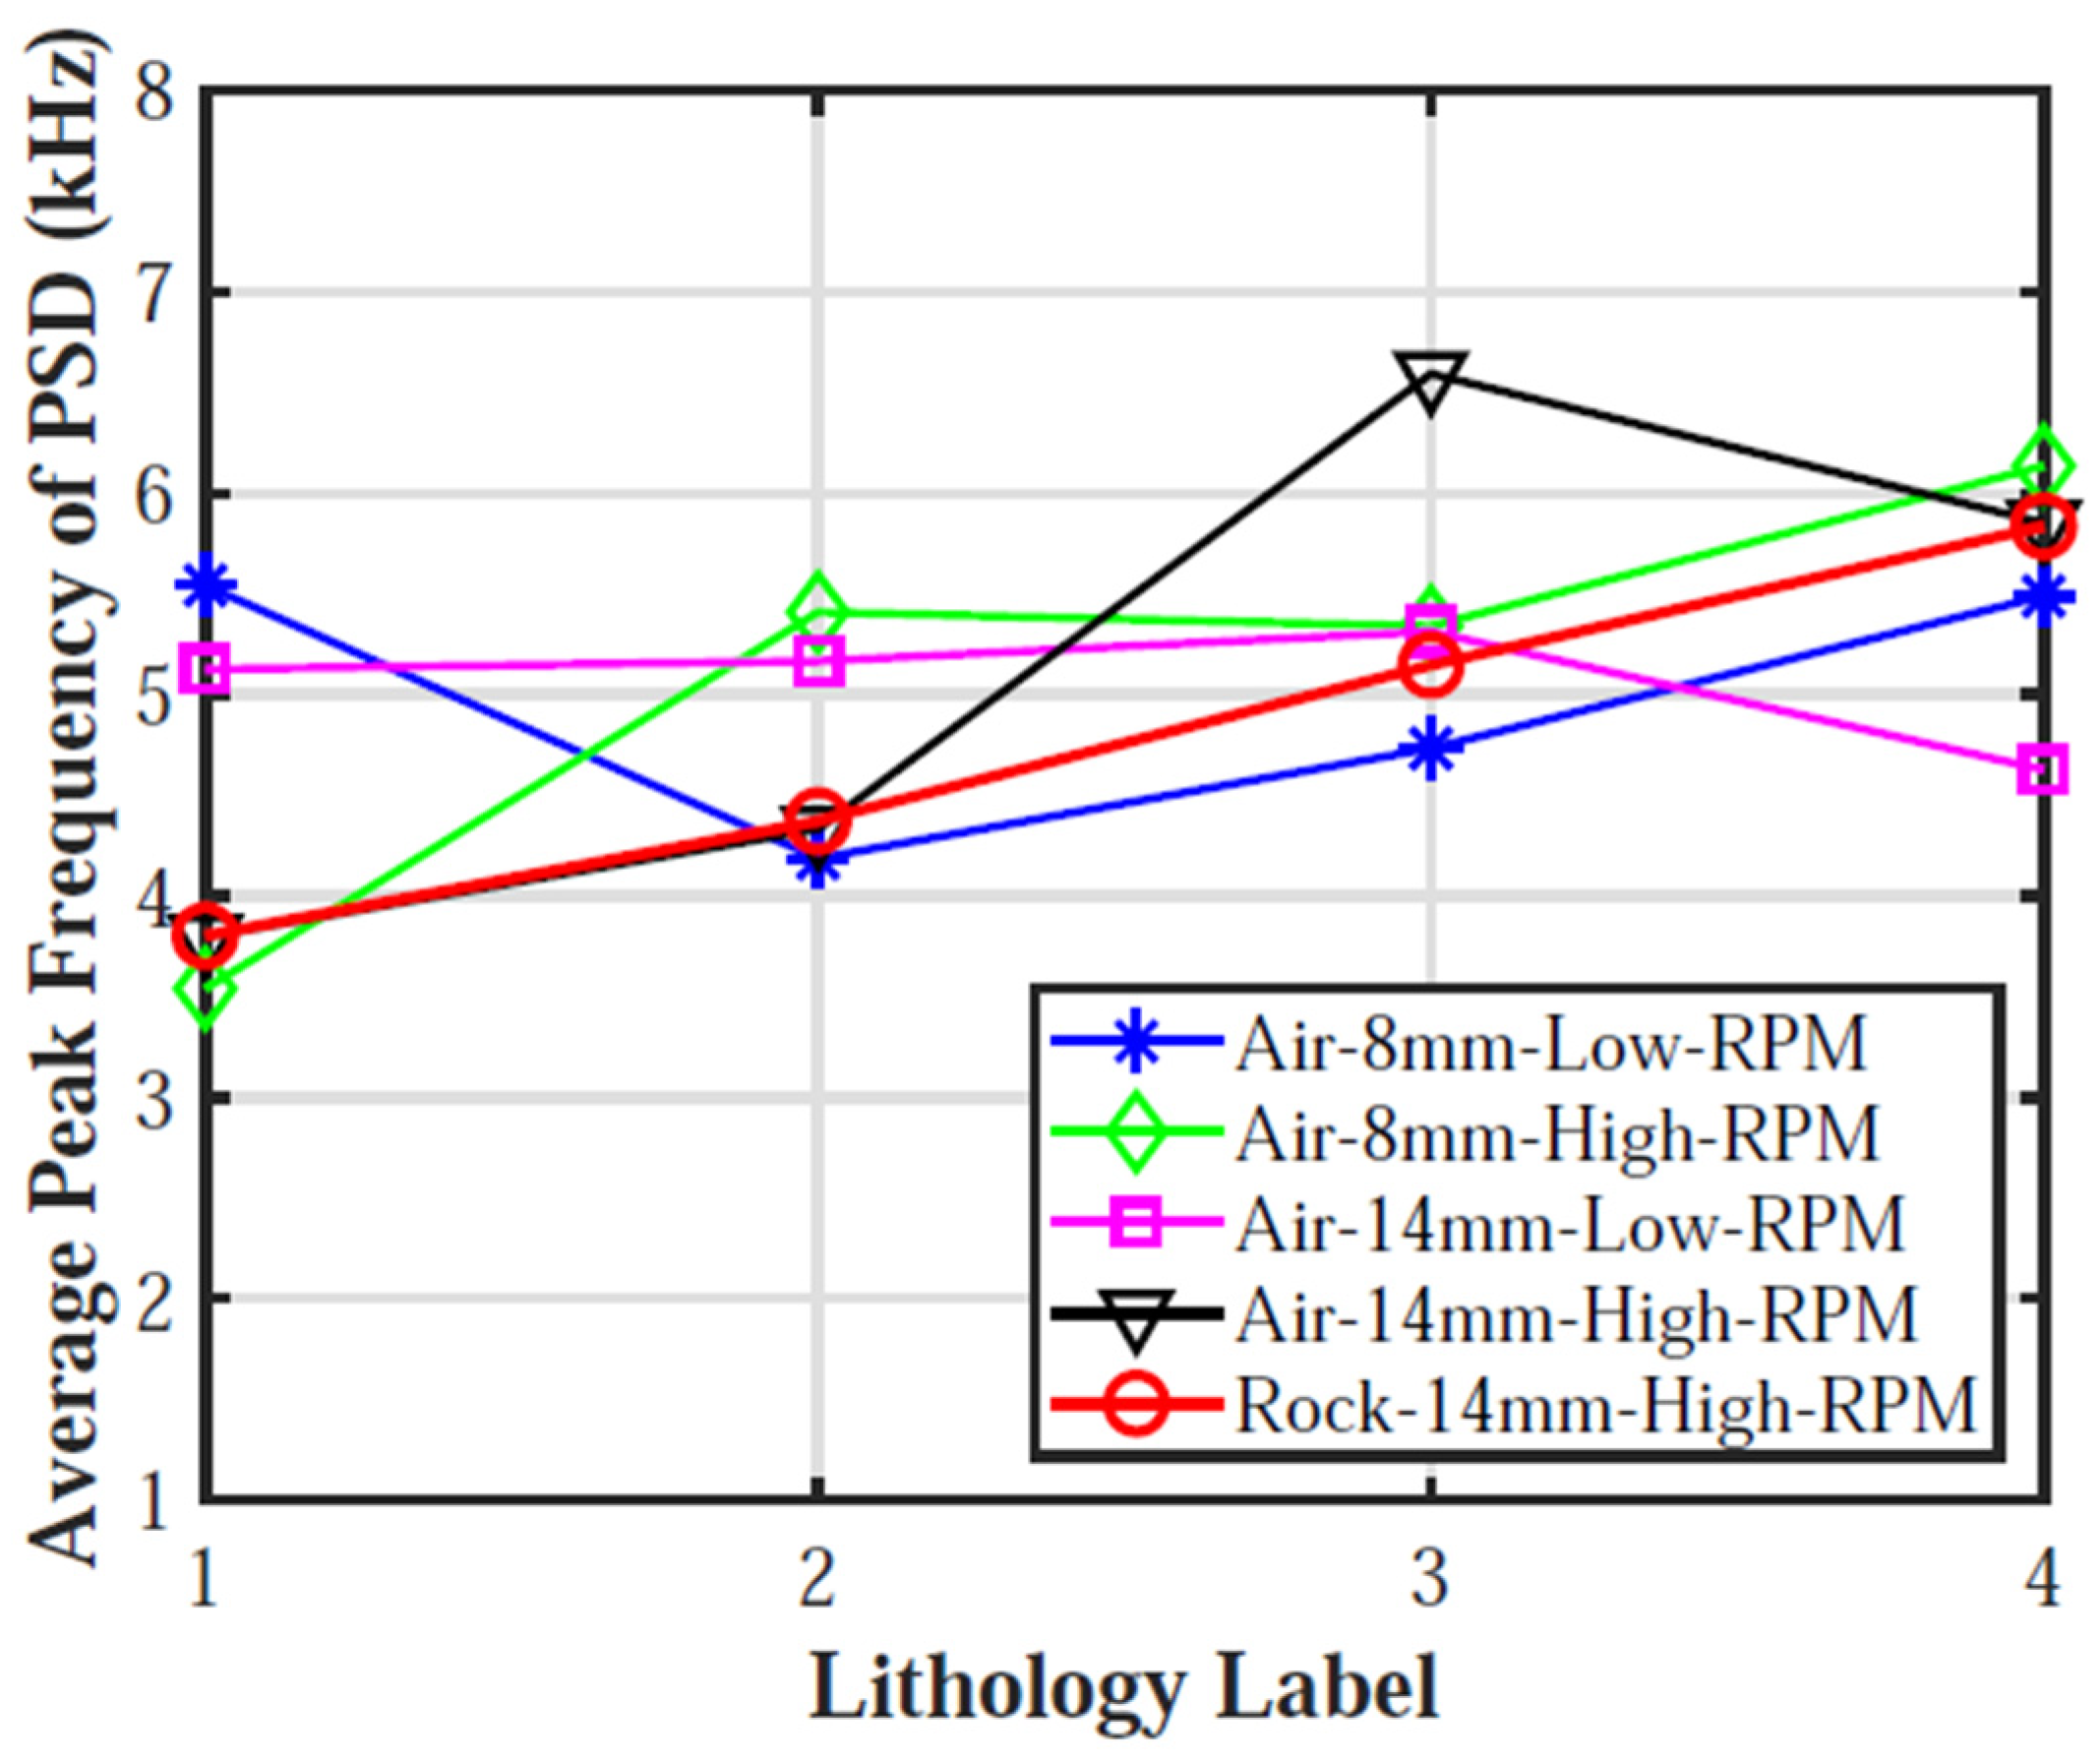
To more intuitively compare the frequency characteristics of data collected in rock and in air, we extracted the top three peak frequencies from each PSD spectrum in Figure 13, calculated their average values, and used a similar method to compute the average peak frequencies for the data collected in rock, as listed in Table 3. These results are plotted together in Figure 14, providing a comprehensive comparison of the five sets of control experiment data described in Table 1. The four lithology labels are represented by numbers 1 to 4 on the horizontal axis. From Figure 14, it can be observed that the average peak frequencies of the rock-breaking sounds for the four rock samples generally increase from shaly sandstone to limestone, which aligns with the trend of the P-wave and S-wave velocities of the four rock types. Additionally, the trend of the data collected in air is almost consistent with that of the peak frequencies recorded in rock. Specifically, the average peak frequencies from the experiments using a 14 mm drill bit and high RPM in air and rock show good agreement. Furthermore, for the four sets of control experiments conducted in air, the trend does not strictly increase with the velocity values, and there are some anomalous fluctuations in the data points. For example, the experiment with a 14 mm drill bit and high RPM on granite exhibits unusually high-frequency behavior. Such anomalies may be related to the complex influencing factors during drilling experiments, the complex composite of the granite, as well as changes in the operators during the experiments. However, the authors believe that these results do not undermine the overall conclusions of the study.
Figure 13.
Comparison of the average PSD spectra of the filtered drilling sounds recorded in the air: (a) 8 mm bit, low RPM, (b) 8 mm bit, high RPM, (c) 14 mm bit, low RPM, (d) 14 mm bit, high RPM. In each subfigure, the red, blue, green, and pink lines represent the calculated results for sandstone, limestone, granite, and shaly sandstone, respectively.
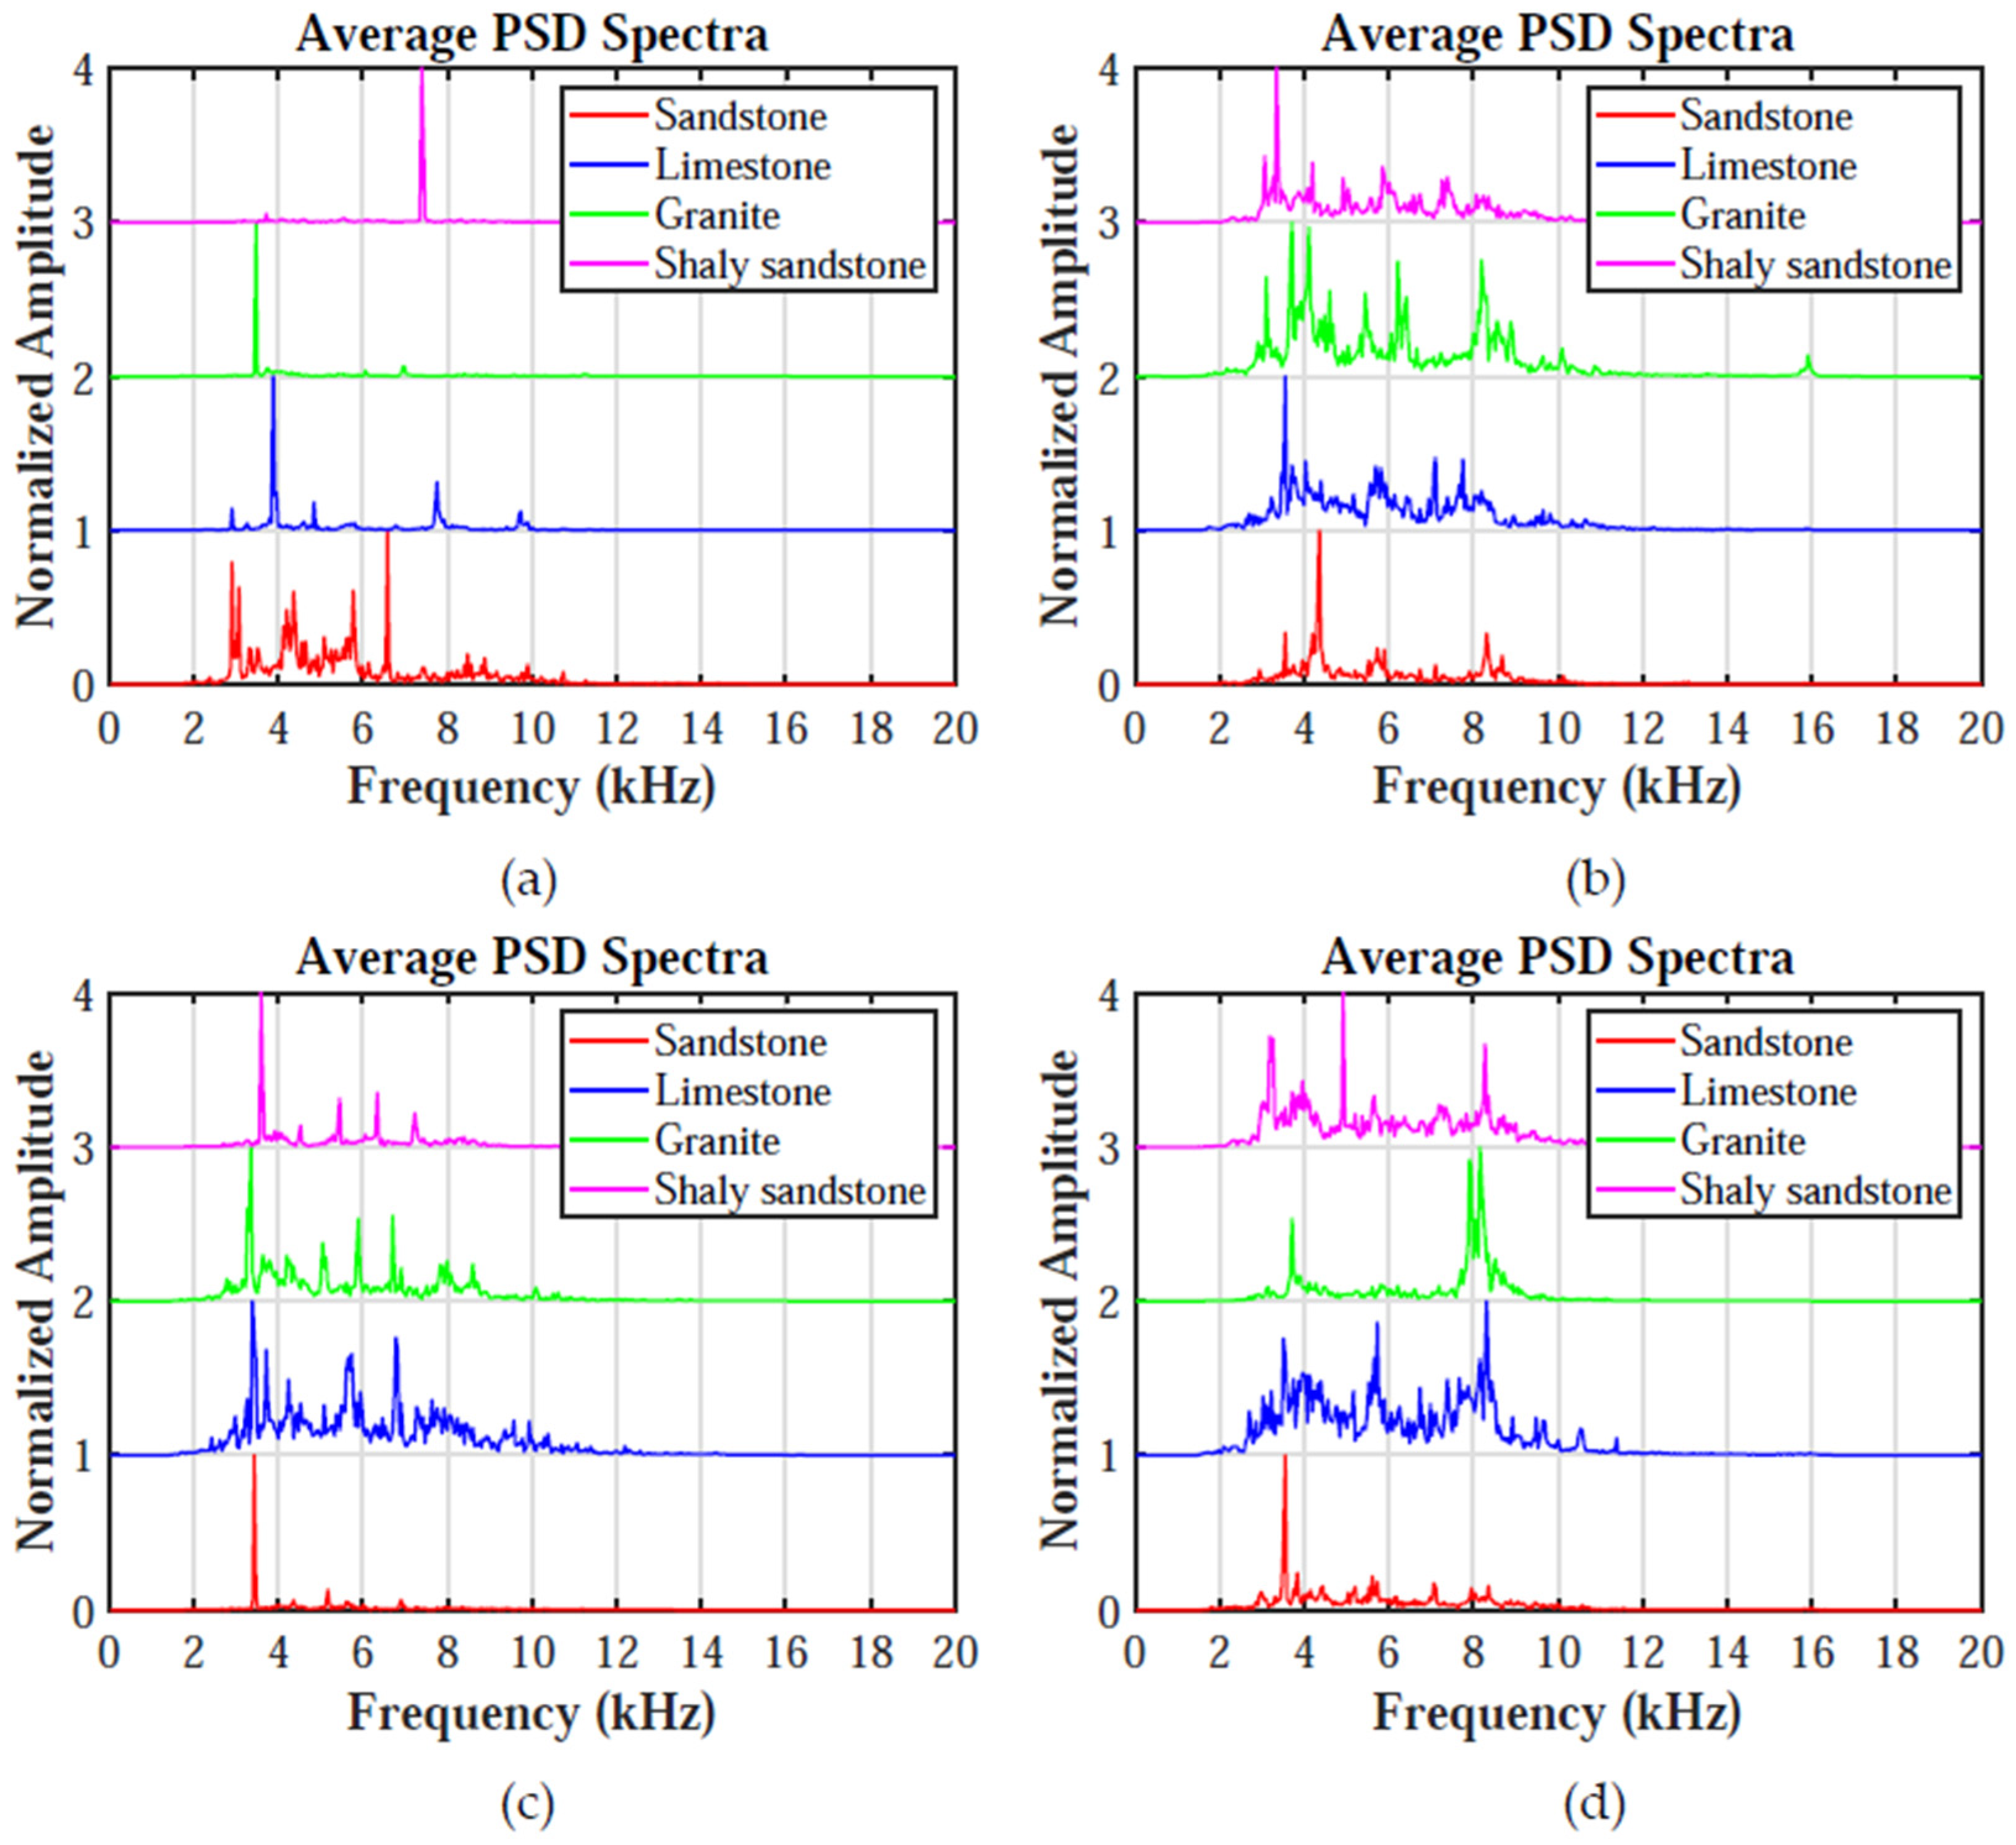
Figure 14.
Comparison of the average peak frequencies of the PSD spectra of the filtered drilling sounds recorded in the air and rock for the four distinct rock samples. Lithology Label: 1—Shaly Sandstone, 2—Sandstone, 3—Granite, 4—Limestone. In the figure, the blue asterisks, green diamonds, pink squares, black triangles, and red circles represent the results calculated from four datasets collected in the air under four different experimental conditions and the dataset acquired during high-speed drilling in rock using a 14 mm drill bit, respectively.
4. Discussions
The experimental results presented in this study provide valuable insights into the frequency characteristics of rock-breaking sounds under different drilling conditions and their potential application for real-time lithology identification during drilling operations. The analysis of both in-rock and in-air recorded sound signals reveals distinct frequency patterns associated with different rock types, which are influenced by factors such as drill bit diameter, RPM, and the inherent properties of the rocks. Below, we discuss the key findings and their implications in detail.
The frequency distribution of rock-breaking sounds varies significantly among the four rock types tested: sandstone, limestone, granite, and shaly sandstone. Sandstone exhibits a dominant low-frequency energy distribution, while limestone and granite show broader frequency bands with stronger high-frequency components. Shaly sandstone, although similar to sandstone in some aspects, also displays a noticeable presence of high-frequency energy, likely due to the increased density caused by the presence of argillaceous components. These observations align with the known elastic properties and hardness of the rocks, as well as their mineral composition and structural heterogeneity. The comparison between in-rock and in-air recorded sound signals reveals that the latter captures richer high-frequency information. This difference can be attributed to the sensitivity of the recording equipment and the propagation mechanisms of sound waves in different media. While in-rock recordings are influenced by the transmission path and the rock’s internal structure, in-air recordings are less constrained and thus provide a more comprehensive representation of the high-frequency components. Despite these differences, the overall trends in frequency characteristics remain consistent between the two recording methods, validating the reliability of using rock-breaking sounds for lithology identification.
The experimental results demonstrate that drilling parameters, such as drill bit diameter and RPM, significantly affect the frequency characteristics of rock-breaking sounds. Larger drill bits and higher RPMs generally result in broader frequency bands and stronger high-frequency energy. For instance, the 14 mm drill bit operating at high RPM produces sound signals with a wider frequency range compared to the 8 mm drill bit at low RPM. This is consistent with the expectation that higher energy input during drilling generates more complex and higher-frequency vibrations. Moreover, the experiments reveal that the variability in frequency characteristics is more pronounced in heterogeneous rocks like sandstone and granite, where larger mineral particles and structural irregularities introduce greater randomness in the sound signals. In contrast, more homogeneous rocks like limestone and shaly sandstone exhibit higher consistency in their frequency patterns across repeated experiments. This highlights the importance of considering rock heterogeneity when interpreting rock-drilling sound data.
The distinct frequency patterns observed in the rock-breaking sounds of different rock types provide a strong experimental foundation for real-time lithology identification during drilling operations. By analyzing the amplitude and power spectra of the sound signals, it is possible to extract features such as dominant frequency peaks, energy distribution, and bandwidth, which can serve as indicators of rock type. For example, the presence of strong low-frequency peaks may suggest sandstone, while a broad frequency band with multiple high-frequency peaks could indicate limestone or granite. The consistency between in-rock and in-air recordings further supports the feasibility of using surface-based acoustic sensors for lithology identification, eliminating the need for complex downhole instrumentation. However, the observed anomalies in some experiments, such as unusually high-frequency signals in granite under high RPM conditions, underscore the need for robust data processing techniques to account for variability caused by operational factors and rock heterogeneity.
While the experimental results presented above demonstrate the promising potential of using rock-breaking sounds for lithology identification, it is important to acknowledge the limitations of this study. First, the experiments were conducted under controlled laboratory conditions that do not fully replicate the complexities of real-world drilling environments. Several key operational parameters were not systematically varied or controlled, including the WOB, which was applied manually without precise force control. Additionally, the experiments were performed under dry conditions without drilling fluid or mud circulation, meaning that the effects of fluid pressure, mud weight, and hydraulic interactions on acoustic signatures were not considered. The study also employed only a single type of drill bit (fixed design), leaving open questions about how bit geometry, material, and wear state might influence the frequency characteristics of drilling sounds. Furthermore, in situ stress conditions, which are known to affect rock behavior and failure mechanisms, were not incorporated into our experimental setup. These limitations suggest that our findings, while robust under the specific laboratory conditions tested, should be interpreted with caution when extrapolating to field applications.
Given the inherent differences between laboratory setups and operational drilling environments, pilot-scale field trials are essential to validate the transferability of our findings. Future work should prioritize collaborative efforts with industry partners to access instrumented drilling rigs or pilot-scale test facilities where systematic data acquisition can be conducted under realistic downhole conditions. These field trials should account for variables that were absent or controlled in our laboratory experiments, including but not limited to: mud weight and circulation dynamics, rate of penetration (ROP), bit wear progression, formation pressure variations, and the presence of background drilling noise from surface and downhole equipment. Moreover, advanced machine learning algorithms could be employed to automate the analysis of rock-breaking sound data and enhance the reliability of lithology predictions. Only through such comprehensive field testing can we determine whether the distinct frequency patterns observed in our laboratory study remain detectable and diagnostically useful under the complex, noisy conditions of actual drilling operations.
The roadmap for field validation is as follows: (1) collaboration with industry partners to access instrumented drilling rigs or pilot-scale test facilities; (2) systematic data acquisition under varying downhole conditions, including differential pressure, mud circulation, and bit wear states; and (3) comparative analysis between laboratory-derived acoustic signatures and field-measured responses to evaluate the transferability of our findings.
5. Conclusions
This study systematically analyzes the frequency characteristics of rock-drilling sounds and their relationship with rock properties and drilling parameters. The experimental results demonstrate that different rock types exhibit unique frequency patterns, which can be used to distinguish lithology in real time. Sandstone is characterized by dominant low-frequency energy, while limestone and granite display broader frequency bands with strong high-frequency components. Shaly sandstone, although similar to sandstone, also exhibits noticeable high-frequency energy due to its increased density. Quadratic polynomial regression models established between P-wave/S-wave velocities and peak frequencies yield high coefficients of determination (0.9878 and 0.9799), confirming the strong correlation between acoustic characteristics and rock properties.
Drilling parameters, such as drill bit diameter and RPM, significantly influence the frequency distribution of rock-breaking sounds, with larger drill bits and higher RPMs producing broader frequency bands and stronger high-frequency energy. This effect is consistent with the higher energy input during aggressive drilling conditions generating more complex and higher-frequency vibrations. Moreover, rock heterogeneity substantially impacts signal variability, with heterogeneous rocks like sandstone and granite exhibiting greater randomness in frequency patterns due to larger mineral particles and structural irregularities, while more homogeneous rocks like limestone demonstrate higher consistency across repeated experiments.
The comparison between in-rock and in-air recordings reveals that the latter captures richer high-frequency information, though the overall trends remain consistent. This suggests that surface-based acoustic sensors can be effectively used for lithology identification, reducing the need for complex downhole instrumentation. However, the observed anomalies in some experiments, such as unusually high-frequency signals in granite under high RPM conditions, highlight the need for robust data processing techniques to account for variability caused by operational factors and rock heterogeneity.
In conclusion, this study provides a comprehensive experimental foundation for DSA-WD, establishing drilling sound as a cost-effective tool for real-time lithology identification. The distinct frequency patterns observed across rock types, combined with the systematic understanding of how drilling parameters and rock properties influence acoustic signatures, enable the development of interpretative frameworks for field applications. Future work should focus on validating the method under real-world drilling conditions, investigating the influence of external factors such as drilling fluid and equipment noise, and integrating advanced machine learning algorithms to automate analysis and enhance prediction accuracy. These advancements could significantly improve the efficiency, safety, and decision-making capabilities in various geological settings, including oil and gas exploration, geo-steering, and geotechnical monitoring.
Author Contributions
Conceptualization, A.B. and M.X.; formal analysis, X.F., P.F. and C.Z.; methodology, A.B. and M.X.; software, M.X., X.Z. and A.B.; validation, A.B., X.F. and C.Z.; project administration, X.F., M.X. and C.Z.; supervision, X.F. and M.X.; writing—original draft, M.X., A.B. and P.F.; writing—review and editing, X.F., C.Z. and X.Z. All authors have read and agreed to the published version of the manuscript.
Funding
This work was financially funded by the National Natural Science Foundation of China (42204132), the Logging Innovation Foundation of CNLC (FW20230600178), Science and Technology Project of CNLC (25ZYCJSG009) and the Fundamental Research Funds for the Central Universities of China (2-9-2024-063).
Data Availability Statement
The datasets generated during and/or analyzed during the current study are available from the corresponding author on reasonable request.
Conflicts of Interest
Authors A.B., X.Z. and P.F. were employed by Logging Technology Research Institute, China National Logging Corporation. All other authors declare no conflicts of interest.
Abbreviations
The following abbreviations are used in this manuscript:
| AI | Artificial Intelligence |
| RPM | Revolutions Per Minute |
| SWD | Seismic While Drilling |
| LWD | Logging While Drilling |
| DSA-WD | Drilling Sound Analysis While Drilling |
| DAC | Data Acquisition Card |
| FFT | Fast Fourier Transform |
| PSD | Power Spectral Density |
| WOB | Weight on Bit |
References
- Gul, S.; van Oort, E.; Mullin, C.; Ladendorf, D. Automated surface measurements of drilling fluid properties: Field application in the Permian basin. SPE Drill. Complet. 2020, 35, 525–534. [Google Scholar] [CrossRef] [Scilit]
- Khoshouei, M.; Bagherpour, R.; Yari, M. A smart look at monitoring while drilling (MWD) and optimizing using acoustic emission technique (AET). Sci. Rep. 2024, 14, 19766. [Google Scholar] [CrossRef] [Scilit] [PubMed]
- Elmgerbi, A.; Thonhauser, G. Assessing the potential of advanced sensor technologies and IoT in predicting downhole drilling issues. In Presented at the GOTECH, Dubai, United Arab Emirates, 21–23 April 2025; SPE-201094-PA; SPE: Richardson, TX, USA, 2025; pp. 1–17. [Google Scholar]
- Yang, Y.L.; Li, W.; Almalki, F.A.; Almarhoon, M.I. A tool for derivation of real time lithological information from drill bit sound. In Proceedings of the SPE Middle East Oil & Gas Show and Conference, Manama, Bahrain, 28 November–December 1 2021; SPE-204895-MS. SPE: Richardson, TX, USA, 2021; pp. 1–8. [Google Scholar]
- Kawai, W.A.; Yang, Y.L.; Almarhoon, M.I. Identifying Formation Layer Tops While Drilling a Wellbore. U.S. Patent 11,920,460, 5 March 2024. [Google Scholar]
- Zhou, H.; Hatherly, P.; Ramos, F.; Nettleton, E. An adaptive data driven model for characterizing rock properties from drilling data. In Proceedings of the 2011 IEEE International Conference on Robotics and Automation, Shanghai, China, 9–13 May 2011; pp. 1909–1915. [Google Scholar]
- Poletto, F.B.; Miranda, F. Seismic While Drilling: Fundamentals of Drill-Bit Seismic for Exploration; Elsevier: Amsterdam, The Netherlands, 2004. [Google Scholar]
- Poletto, F.; Miranda, F.; Farina, B.; Schleifer, A. Seismic-while-drilling drill-bit source by ground force: Concept and application. Geophysics 2020, 85, MR167–MR178. [Google Scholar] [CrossRef] [Scilit]
- Nakken, E.I.; Baltzersen, O.; Kristensen, A. Characteristics of drill bit generated noise. In SPWLA Annual Logging Symposium; SPWLA-1990-X; SPWLA: Houston, TX, USA, 1990. [Google Scholar]
- Gradl, C.; Eustes, A.W.; Thonhauser, G. An analysis of noise characteristics of drill bits. In Proceedings of the SPE Annual Technical Conference and Exhibition, Denver, CO, USA, 21–24 September 2008; SPE-115987-MS. SPE: Richardson, TX, USA, 2008. [Google Scholar]
- Vardhan, H.; Adhikari, G.R.; Raj, M.G. Estimating rock properties using sound levels produced during drilling. Int. J. Rock Mech. Min Sci. 2009, 46, 604–612. [Google Scholar] [CrossRef] [Scilit]
- Li, Z.; Itakura, K. An analytical drilling model of drag bits for evaluation of rock strength. Soils Found. 2012, 52, 216–227. [Google Scholar] [CrossRef] [Scilit]
- Kumar, B.R.; Vardhan, H.; Govindaraj, M.; Vijay, G.S. Regression analysis and ANN models to predict rock properties from sound levels produced during drilling. Int. J. Rock Mech. Min. Sci. 2013, 58, 61–72. [Google Scholar] [CrossRef] [Scilit]
- Esmaeili, A.; Elahifar, B.; Fruhwirth, R.K.; Thonhauser, G. Effect of formations compressive strength on drill string vibrations. In Proceedings of the IPTC 2013: International Petroleum Technology Conference, Beijing, China, 26–28 March 2013; European Association of Geoscientists & Engineer: Bunnik, The Netherlands, 2013; p. cp-350-00419. [Google Scholar]
- Vununu, C.; Moon, K.S.; Lee, S.H.; Kwon, K.R. A deep feature learning method for drill bits monitoring using the spectral analysis of the acoustic signals. Sensors 2018, 18, 2634. [Google Scholar] [CrossRef] [Scilit] [PubMed]
- Auriol, J.; Kazemi, N.; Shor, R.J.; Innanen, K.A.; Gates, I.D. A sensing and computational framework for estimating the seismic velocities of rocks interacting with the drill bit. IEEE Trans. Geosci. Remote Sens. 2019, 58, 3178–3189. [Google Scholar] [CrossRef] [Scilit]
- Wang, K.; Hu, Y.; Yang, K.; Qin, M.; Li, Y.; Liu, G.; Wang, G. Experimental evaluation of rock disintegration detection in drilling by a new acoustic sensor method. J. Pet. Sci. Eng. 2020, 195, 107853. [Google Scholar] [CrossRef] [Scilit]
- Khoshouei, M.; Bagherpour, R. Predicting the geomechanical properties of hard rocks using analysis of the acoustic and vibration signals during the drilling operation. Geotech. Geol. Eng. 2021, 39, 2087–2099. [Google Scholar] [CrossRef] [Scilit]
- Myers, G.; Goldberg, D.; Rector, J. Drillstring vibration: A proxy for identifying lithologic boundaries while drilling. Proc. Ocean Drill. Program Sci. Result 2002, 179, 1–17. [Google Scholar]
- Kumar, B.R.; Vardhan, H.; Govindaraj, M. Estimating rock properties using sound level during drilling: Field investigation. Int. J. Min. Miner. Eng. 2010, 2, 169–184. [Google Scholar] [CrossRef] [Scilit]
- Al-Shuker, N.; Kirby, C.; Brinsdon, M. The application of real time downhole drilling dynamic signatures as a possible early indicator of lithology changes. In Proceedings of the SPE/DGS Saudi Arabia Section Technical Symposium and Exhibition, Al-Khobar, Saudi Arabia, 15–18 May 2011; SPE-149056-MS. SPE: Richardson, TX, USA, 2011. [Google Scholar]
- Haecker, A.; Lakings, J.; Marshall, E.; Ulla, J. A novel technique for measuring (not calculating) Young’s modulus, Poisson’s ratio and fractures downhole: A Bakken case study. In SPWLA Annual Logging Symposium; D033S002R00; SPWLA: Houston, TX, USA, 2017. [Google Scholar]
- Romanenkova, E.; Zaytsev, A.; Klyuchnikov, N.; Gruzdev, A.; Antipova, K.; Ismailova, L.; Burnaev, E.; Semenikhin, A.; Koryabkin, V.; Simon, I.; et al. Real-time data-driven detection of the rock-type alteration during a directional drilling. IEEE Geosci. Remote Sens. Lett. 2019, 17, 1861–1865. [Google Scholar] [CrossRef] [Scilit]
- Millan, E.; Ringer, M.; Boualleg, R.; Li, D. Real-Time drillstring vibration characterization using machine learning. In Proceedings of the SPE/IADC International Drilling Conference and Exhibition, The Hague, The Netherlands, 5–7 March 2019; D031S016R004. SPE: Richardson, TX, USA, 2019. [Google Scholar]
- Wang, C.; Xue, Q.; He, Y.; Wang, J.; Li, Y.; Qu, J. Lithological identification based on high-frequency vibration signal analysis. Measurement 2023, 221, 113534. [Google Scholar] [CrossRef] [Scilit]
- Ding, Z.W.; Li, X.F.; Huang, X.; Wang, M.B.; Tang, Q.B.; Jia, J.D. Feature extraction, recognition, and classification of acoustic emission waveform signal of coal rock sample under uniaxial compression. Int. J. Rock Mech. Min. Sci. 2022, 160, 105262. [Google Scholar] [CrossRef] [Scilit]
- Li, Q.F.; Chi, P.; Fu, J.H.; Zhang, X.M.; Su, Y.; Zhang, C.X.; Wu, P.C.; Fu, C.L.; Pu, Y.Z. A comprehensive machine learning model for lithology identification while drilling. Geoenergy Sci. Eng. 2023, 231, 212333. [Google Scholar] [CrossRef] [Scilit]
- Burak, T.; Sharma, A.; Hoel, E.; Kristiansen, T.G.; Welmer, M.; Nygaard, R. Real-time lithology prediction at the bit using machine learning. Geosciences 2024, 14, 250. [Google Scholar] [CrossRef] [Scilit]
- Kalhori, H.; Bagherpour, R.; Tudeshki, H. Monitoring of drill bit wear using sound and vibration signals analysis recorded during rock drilling operations. Model. Earth Syst. Environ. 2024, 10, 2611–2659. [Google Scholar] [CrossRef] [Scilit]
- Senjoba, L.; Ikeda, H.; Toriya, H.; Adachi, T.; Kawamura, Y. Deep learning-based rock type identification using drill vibration frequency spectrum images. Int. J. Min. Reclamation Environ. 2025, 39, 40–55. [Google Scholar] [CrossRef] [Scilit]
- Karakus, M.; Perez, S. Acoustic emission analysis for rock-bit interactions in impregnated diamond core drilling. Int. J. Rock Mech. Min. Sci. 2014, 68, 36–43. [Google Scholar] [CrossRef] [Scilit]

Disclaimer/Publisher’s Note: The statements, opinions and data contained in all publications are solely those of the individual author(s) and contributor(s) and not of MDPI and/or the editor(s). MDPI and/or the editor(s) disclaim responsibility for any injury to people or property resulting from any ideas, methods, instructions or products referred to in the content. |
© 2026 by the authors. Licensee MDPI, Basel, Switzerland. This article is an open access article distributed under the terms and conditions of the Creative Commons Attribution (CC BY) license.