


Abstract
Land subsidence constitutes a critical hazard to coastal megacities globally, amplifying flood risks and damaging infrastructure. Taking Tianjin—a major port city underlain by compressible sediments and affected by groundwater over-exploitation—as a case study, we address two key research gaps: the absence of a quantitative framework coupling groundwater extraction with construction land expansion, and the inadequate separation of seasonal and long-term subsidence drivers. We developed an integrated remote-sensing-based approach: high-resolution subsidence time series (2016–2023) were derived via Small BAseline Subset Interferometric Synthetic Aperture Radar (SBAS-InSAR) using Sentinel-1 Synthetic Aperture Radar (SAR) imagery, validated against leveling measurements (R > 0.885, error < 20 mm). This subsidence dataset was fused with groundwater level records and annual construction land maps. Seasonal-Trend Decomposition using Loess (STL) isolated trend, seasonal, and residual components, which were input into a Random Forest (RF) model to quantify the relative contributions of subsidence drivers. Dynamic Time Warping (DTW) and Cross-Wavelet Transform (CWT) were further employed to characterize temporal patterns and lag effects between subsidence and its drivers. Our results reveal a distinct shifting subsidence pattern: “areal expansion but intensity weakening.” Groundwater control policies mitigated five historical subsidence funnels, reducing areas with severe subsidence from 72.36% to <5%, while the total subsiding area expanded by 1024.74 km2, with new zones emerging (e.g., northern Dongli District). The RF model identified the long-term groundwater level trend as the dominant driver (59.5% contribution), followed by residual (23.3%) and seasonal (17.2%) components. Cross-spectral analysis confirmed high coherence between subsidence and long-term groundwater trends; the seasonal component exhibited a dominant resonance period of 12 months and a consistent subsidence response lag of 3–4 months. Construction impacts were conceptualized as a “load accumulation-soil compression-time lag” mechanism, with high-intensity engineering projects inducing significant local subsidence. This study provides a robust quantitative framework for disentangling the complex interactions between subsidence, groundwater, and urban expansion, offering critical insights for evidence-based hazard mitigation and sustainable urban planning in vulnerable coastal environments worldwide.
1. Introduction
Land subsidence (LS), a pervasive global geological hazard, manifests as the gradual settlement of the ground surface due to the compaction of subsurface strata under changing effective stress conditions [1,2,3]. The drivers of LS are broadly classified into natural processes—such as sediment self-weight consolidation, peat oxidation, tectonic activity, and karst dissolution—and anthropogenic activities, predominantly groundwater over-extraction, hydrocarbon exploitation, geothermal energy production, and urban engineering loads [4,5,6,7,8,9,10,11]. Critically, human-induced subsidence rates often exceed natural rates by one to two orders of magnitude [8,10], highlighting the profound impact of human agency.
The consequences of land subsidence are multifaceted and severe. It compromises the structural integrity of critical infrastructure, including buildings, transportation networks, and underground utilities, through differential settlement [2,3]. Furthermore, LS alters hydrological regimes, aggravating flood hazards and coastal erosion. This threat is particularly acute for coastal cities, where the synergy between subsidence and global sea-level rise dramatically amplifies exposure to natural disasters [12,13,14,15]. Alarming studies indicate that subsidence rates in numerous coastal cities already outpace the current rate of sea-level rise [14]. Should this trend persist, the population vulnerable to severe flooding could triple by 2070 [16,17,18]. Against the backdrop of accelerating global urbanization and escalating resource demands, land subsidence has evolved into a complex and pressing geological challenge, especially for nations like the United States, China, and India [19]. UNESCO projections suggest that by 2040, 19% of the world’s population could be directly impacted by LS [20], underscoring the imperative for advanced research into its mechanisms and mitigation.
China ranks among the countries most severely afflicted by land subsidence. Since its initial documentation in Shanghai and Tianjin cities in the 1920s [21,22,23,24,25], over 50 major cities have reported varying degrees of subsidence [11,26]. The Beijing–Tianjin–Hebei (BTH) Plain, China’s most extensive subsidence area, exhibits a strong correlation between subsidence patterns and rapid urbanization [20]. With China’s permanent urbanization rate reaching 67% in 2024, accommodating 940 million urban residents [27], the consequent surge in groundwater demand and construction activity has significantly intensified subsidence risks. Annual direct economic losses attributable to LS in China are estimated to surpass 7.5 billion yuan [28]. Long-term forecasts suggest that by 2120, 22–26% of China’s coastal land area, supporting 9–11% of its coastal population, may fall below sea level due to the combined effects of subsidence and sea-level rise [28].
Tianjin, a pivotal port city within the BTH region, presents a compelling case for subsidence research due to three distinctive attributes: (1) Its location within the Bohai Bay Basin, characterized by exceptionally thick (3000–8000 m) Quaternary unconsolidated sediments and complex aquifer systems, provides a foundational geological predisposition for subsidence [29]. (2) A century-long history of groundwater extraction, peaking from the 1950s to 1980s, has resulted in cumulative subsidence exceeding 2 m, establishing Tianjin as a global archetype for subsidence in unconsolidated sedimentary environments [30]. (3) Recent analyses in Geophysical Research Letters identify parts of Tianjin as continuing to exhibit among the highest subsidence rates worldwide [15]. By 2007, cumulative direct economic losses had amounted to 135.6 billion yuan (approximately 18.03 billion USD), affecting urban development, water conservancy projects, and ecological systems [31]. While prior research has established robust exponential correlations between Tianjin’s subsidence and both groundwater extraction (R2 = 0.950) and groundwater level decline (R2 = 0.888) [32], the superimposed influence of construction land expansion has emerged as a critical, yet poorly quantified, factor in recent years, necessitating an investigation into multi-factor coupling mechanisms.
Accurately characterizing the spatiotemporal dynamics of land subsidence is fundamental to deciphering its underlying mechanisms. Contemporary monitoring techniques encompass traditional ground-based methods (e.g., leveling, borehole extensometers) and spaceborne remote sensing (e.g., GNSS, InSAR) [33,34,35]. While ground-based techniques offer millimeter-scale accuracy, their high cost and sparse spatial coverage render them inadequate for regional-scale analysis [34]. The advent of Interferometric Synthetic Aperture Radar (InSAR) technology has revolutionized this field, enabling all-weather, large-scale land subsidence monitoring [35,36,37,38,39]. To overcome limitations of early Differential InSAR (D-InSAR), such as atmospheric artifacts and temporal decorrelation, Multi-Temporal InSAR (MT-InSAR) techniques were developed [40,41,42]. Notably, the Small Baseline Subset (SBAS-InSAR) approach, which utilizes interferograms with short spatiotemporal baselines and applies Singular Value Decomposition (SVD) to solve the system, achieves centimeter- to millimeter-level precision in time-series land subsidence retrieval [43,44]. Recent applications of SBAS-InSAR with Sentinel-1 data have successfully mapped subsidence in cities like Beijing [45], Tianjin [46], and Shanghai [47] and across mainland China [11], demonstrating high consistency with leveling data.
Notwithstanding these advancements, critical knowledge gaps persist in the study of Tianjin’s subsidence: (1) Existing research predominantly isolates single driving factors and lacks a quantitative assessment of their effects. (2) Temporal analyses are largely confined to interannual scales, failing to adequately disentangle seasonal fluctuations from long-term trends. (3) A unified analytical framework for integrating multi-source data—including InSAR-derived land subsidence, groundwater levels, and land use information—remains elusive. To bridge these gaps, this study employs SBAS-InSAR processing of Sentinel-1 SAR imagery (2015–2022) to retrieve high-resolution time-series surface land subsidence in Tianjin. Integrated with groundwater level records and construction land dynamics, we deploy a suite of analytical methods (e.g., STL decomposition, Random Forest regression, cross-wavelet transform) to elucidate the response mechanisms of land subsidence to groundwater dynamics and urban expansion. The principal innovations of this work are threefold: (1) We establish an integrated “groundwater-land use-land subsidence” coupling framework. (2) We decompose subsidence time series to separately analyze seasonal and trend components. (3) We quantify the relative contribution weights of different driving factors. Our findings are anticipated to provide a scientific foundation for targeted subsidence mitigation and sustainable urban planning in Tianjin and analogous regions globally.
The remainder of this paper is organized as follows: Section 2 details the study area, datasets, and methodologies. Section 3 presents the spatiotemporal patterns of land subsidence and the results of the driving factor analysis. Section 4 summarizes the principal conclusions and outlines their implications for policy and management.
2. Study Area, Datasets, and Methodology
2.1. Study Area
Tianjin Municipality, a major direct-controlled municipality in China, is situated in the northeastern part of the North China Plain and the lower reaches of the Haihe River Basin. It spans latitudes 38°34′ N to 40°15′ N and longitudes 116°43′ E to 118°04′ E (Figure 1). Bordered by the Bohai Sea to the east and the Yanshan Mountains to the north, it adjoins Beijing to the west and Hebei Province to the south, serving as a critical hydrographic nexus for the Haihe River system and a pivotal hub within the Beijing–Tianjin–Hebei urban agglomeration. The total administrative area covers 11,966.45 km2 [48], comprising 16 districts, including Binhai New Area and Heping District [49]. As of the end of 2024, Tianjin had a permanent population of 13.64 million, with an urbanization rate of 86.01%, characterizing it as a highly urbanized megacity in northern China [50].
Figure 1.
Topographic map and administrative division boundaries of Tianjin.
Tianjin experiences a warm, temperate, semi-humid continental monsoon climate, with modest maritime influence from the Bohai Sea, resulting in distinct seasons. The multi-year average air temperature (1981–2020) ranges from 11 to 12 °C. Precipitation exhibits significant spatial heterogeneity, increasing from 520 to 550 mm in the central urban and southern plains to approximately 800 mm in the northern foothills of the Yanshan Mountains. Temporally, precipitation is highly concentrated, with the summer months (June–August) accounting for 70–75% of the annual total, while winter contributes only 2–3%. The mean annual potential evaporation is approximately 1350 mm. This pronounced seasonality in precipitation leads to concentrated surface runoff during the rainy season and creates significant reliance on groundwater extraction to meet water demands during the extended dry season, thereby increasing aquifer stress.
Topographically, Tianjin lies within the transition zone from the Yanshan Mountains to the coastal plain. The terrain slopes from the northwest to the southeast, with plains constituting over 95% of the area. Low mountains and hills are confined to the Jizhou District in the north, while tidal flats and marshes dominate the coastline. Based on elevation, the area can be divided into three geomorphological units: the northern hilly region (peak elevation 1078.5 m at Jiuding Mountain), the alluvial–pluvial piedmont plain (5–50 m above sea level), and the southern coastal plain (0–5 m, averaging 3.5 m along Bohai Bay, representing the lowest point of the North China Plain). The low-lying, flat terrain impedes natural surface drainage. Coupled with the region’s thick sequences of unconsolidated Quaternary sediments, this geomorphological setting provides the fundamental preconditions for widespread land subsidence.
The geology and hydrogeology of Tianjin directly control its subsidence susceptibility. Tianjin is located in the northern part of the Meso-Cenozoic Bohai Bay Basin [29]. The basement consists of Archean metamorphic rocks, overlain by Tertiary and Quaternary terrestrial sediments. The sediment thickness exhibits a “thin-rim, thick-center” pattern, ranging from less than 1000 m on peripheral structural highs to 3000–8000 m in the eastern and southeastern depressions [30]. The Tertiary sediments are buried at depths of 600–1100 m, while the overlying Quaternary sequence (0–500 m) comprises unconsolidated, irregular interbeds of silt, clay, and sand layers, which constitute the primary compressible layers responsible for land subsidence [51,52]. The regional hydrogeological framework is divided into a shallow aquifer system (Quaternary, 0–500 m) and a deep aquifer system (Tertiary, 500–1100 m), which exhibit weak hydraulic connectivity [52]. The Quaternary aquifer system is subdivided into five aquifer groups: Aquifer I is an unconfined aquifer, while Aquifers II–V are confined. Aquifers II–IV have been the primary source for municipal and industrial water supply [30]. Critically, the absence of continuous aquitards between these aquifer groups allows for significant vertical leakage. This hydrogeological configuration enables groundwater extraction-induced head declines to propagate rapidly throughout the Quaternary system, exacerbating multi-layered aquifer compaction and land subsidence [53].
From a regional development perspective, Tianjin is a core node of the China–Mongolia–Russia Economic Corridor and a key hub for the Belt and Road Initiative. The Tianjin Port, with a container throughput of 23.29 million twenty-foot equivalent units (TEUs) in 2024, serves as a vital gateway for northern inland regions [53]. This rapid economic development and urban expansion, particularly the surge in construction land within the Binhai New Area and central urban districts since 2010, has intensified anthropogenic pressure on the geological environment, primarily through increased groundwater demand and construction loading, making the region a critical case for studying human-induced subsidence.
2.2. Dataset and Methodology
2.2.1. Data Sources
Sentinel-1A Synthetic Aperture Radar Data
The Sentinel-1A satellite, a C-band Synthetic Aperture Radar (SAR) satellite, was launched by the European Space Agency (ESA) in Kourou, French Guiana, in April 2014. It operates at an orbital altitude of 693 km with a revisit cycle of 12 days, supporting multiple polarizations (e.g., VV, VH) and various operation modes (e.g., Interferometric Wide swath mode, IW). This study utilized two ascending orbit datasets covering Tianjin: relative orbit number 69-frame 124 and relative orbit number 69-frame 129. Both datasets feature VV+VH polarization, are of Single Look Complex (SLC) level, and possess a ground resolution of 5 m (range) × 20 m (azimuth). Covering the entire study area required the mosaicking of two scenes per orbit. The data time series spanned from January 2016 to December 2023. After quality screening, which involved removing images with severe decorrelation, 352 scenes were retained (176 scenes per track). Using the InSAR Scientific Computing Environment (ISCE) software platform, the Small Baseline Subset Interferometric SAR (SBAS-InSAR) technique was employed to invert the time series of land surface subsidence [46]. This process ultimately yielded the cumulative subsidence and time-series characteristics for each pixel in the study area.
Groundwater Level Monitoring Data
Groundwater level data were sourced from the China Geological Environment Monitoring Groundwater Level Yearbook for the period 2018–2022. Data from four continuous monitoring wells within the second aquifer group in the study area were selected. The selection rationale is as follows: extensive extraction from the second aquifer group in Tianjin occurred prior to 1983, followed by water level recovery due to subsequent extraction restrictions. The first aquifer group, being in close proximity to the second, is significantly influenced by its water level fluctuations. A sharp decline in the water level of the second aquifer group has been observed to coincide with a rapid increase in the land subsidence rate, forming a subsidence funnel centered on the urban area [54]. Selecting data from the same aquifer group helps minimize bias in water level fluctuations caused by differences in burial depth while simultaneously ensuring data continuity and comparability.
Land Use Data
The 30 m annual land cover product for China (2015–2022), developed by the research team at Wuhan University, was utilized. This dataset was validated using 5463 visual interpretation samples, achieving an overall accuracy of 80% [55]. With reference to the Current Land Use Classification (GB/T 21010-2007), the data were reclassified into six categories: cropland, forestland, grassland, water body, construction land, and unused land. By overlaying the annual data from 2015 to 2022, patches that transitioned from other categories to construction land were extracted, generating an annual dataset of newly added construction land.
2.2.2. Methodology
This study was based on multi-source data: Sentinel-1A SAR data (2016–2023) (https://dataspace.copernicus.eu/), land use data (2015–2022), the Tianjin Water Resources Bulletin (2015–2022), groundwater level data (2018–2022), and in situ measurement data from October 2016 to 2022 provided by project partners. Through data extraction, quantitative calculation, and correlation analysis, data on land surface subsidence in Tianjin, the Human Activity Intensity (HAI) index, and the 40 m groundwater depth contour data were acquired to reveal the impact mechanism of construction land evolution on surface subsidence. Concurrently, time-series signal decomposition was employed to analyze the trend, seasonal, and residual components of both land subsidence and groundwater levels. The Random Forest model was used to assess the relative importance of each component to land subsidence. The Dynamic Time Warping (DTW) algorithm was applied to analyze the similarity of the trend components. Cross-wavelet transform was utilized to identify the dominant period and lag relationship of the seasonal variations. Based on the Copula function, a joint distribution model for the residual components was constructed. Ultimately, this integrated approach elucidated the refined response mechanism of land subsidence to groundwater extraction.
SBAS-InSAR Technique
A total of N + 1 SAR images covering the study area were processed. One image was selected as the super master, while the remaining slave images were precisely co-registered (co-registration accuracy ≤ 0.1 pixel) with the master and subjected to differential interferometric processing, generating M differential interferograms. The number M must satisfy [56]
(N + 1)/2 ≤ M ≤ N(N + 1)/2
For the i-th interferogram generated from two SAR images acquired at times ta and tb (tb > ta), the flat-earth and topographic phases were removed. The differential interferometric phase at a pixel with azimuth coordinate x and range coordinate r can be expressed by Equation (2):
where λ is the radar center wavelength; d(tb, x, r) and d(ta, x, r) are the cumulative land subsidence in the radar line-of-sight (LOS) direction at times tb and ta, respectively, relative to a reference time t0; and φ(tb, x, r) and φ(ta, x, r) are the phase changes induced by the land subsidence d(tb, x, r) and d(ta, x, r), respectively.
Δφi(x, r) = φ(tb, x, r) − φ(ta, x, r) = (4π/λ)[d(tb, x, r) − d(ta, x, r)]
The interferometric phase is expressed as the product of the average phase velocity over the acquisition period and the duration of that period, i.e., the following equation:
The interferometric phase is represented as the product of the average land subsidence rate and the time interval, i.e., the following equation:
where v is the subsidence rate. δφ denotes a matrix composed of the phases from M differential interferograms. By constructing an M×N coefficient matrix A and an M-dimensional phase vector δφ, the system can be solved. When M ≥ N, the rank of coefficient matrix A is N, and the land subsidence rates are solved using the least-squares algorithm. When M < N, the system of equations has innumerable solutions, and the singular value decomposition (SVD) method is employed to find the minimum norm solution, which is subsequently integrated to obtain the cumulative land subsidence for each time period [36].
Seasonal-Trend Decomposition (STL)
The monthly time series of land subsidence and groundwater level data from January 2018 to December 2022 were constructed. The Seasonal-Trend Decomposition procedure using the Loess (STL) method was applied to decompose each series into trend, seasonal, and residual components:
where Yt is the original series; Tt is the trend component, reflecting the long-term tendency; St is the seasonal component, reflecting seasonal effects; and Rt is the residual component, reflecting random fluctuations [57].
Random Forest Importance Analysis
The Random Forest algorithm has been successfully applied to problems involving small samples and high-dimensional feature spaces [58]. As an ensemble learning algorithm based on decision trees, Random Forest can measure the importance of each variable to the target variable [59]. Therefore, this study used the Random Forest model to determine the relative importance of the various groundwater level components to land subsidence based on their contribution to the model’s performance.
The Gini impurity is an indicator measuring the purity of a dataset, used to assess the heterogeneity of classes within a dataset. A smaller Gini index value indicates higher purity of the dataset. In Random Forest, the splitting criterion for each node is used to minimize the Gini impurity. By comparing the Gini impurity before and after a split, the importance of a feature can be evaluated [60].
where K is the number of feature classes and pk is the probability of a sample point belonging to class k.
DTW Algorithm
The Dynamic Time Warping algorithm finds the optimal match between two time series by gradually stretching or compressing elements within the sequences. It calculates a cumulative distance and ultimately produces a cumulative distance matrix, where the minimum value indicates the similarity between the two time series, yielding the globally optimal path [61,62,63].
Let U(G,H) be the total distance of a path starting from (1,1) and ending at (t,m). The DTW algorithm aims to find the path with the minimum total distance, as represented in Equation (8):
Cross-Wavelet Transform Analysis
Cross-wavelet transform analysis combines wavelet transforms with cross-spectrum analysis to study the correlation between two time series in the time-frequency domain across multiple time scales. After performing a continuous wavelet transform on the time series data Xn and Yn, resulting in WnX(S) and WnY(S), the cross-wavelet spectrum is defined as [64,65]:
where WX(s) and WY*(s) are the continuous wavelet transforms of the time series signals xn and yn, respectively, and * denotes the complex conjugate. WXY(s) represents the cross-wavelet power. The phase angle Φj(S) represents the phase delay between the two time series signals. The time delay Δt between them can be derived from their resonance period T and the phase difference:
Copula Function
Based on the residual components of land subsidence and groundwater level, which reflect random characteristics, the Copula function was used to calculate the corresponding univariate distribution functions and the multivariate joint distribution function to assess their correlation. Common univariate distribution functions were tested, such as Weibull, Gamma, Normal, Exponential, and Lognormal. Parameters were estimated using the maximum likelihood method [66,67].
For the multivariate joint distribution function, the Archimedean family of copulas, widely used in water resources assessment, was adopted, primarily including Frank, Clayton, and Gumbel Copulas. A two-dimensional joint distribution function for land subsidence and groundwater level was constructed to determine the optimal fitting function and computing probabilities. The Akaike Information Criterion (AIC) and Bayesian Information Criterion (BIC) were used to select the optimal marginal distribution functions and to validate the multivariate joint distribution function model. Lower AIC and BIC values indicate a better fit [68,69].
Human Activity Intensity (HAI) Index
The Human Activity Intensity (HAI) index was used to quantify the spatiotemporal characteristics of human activities in Tianjin from 2016 to 2022. It is defined as the degree of intervention of human behaviors on the natural environment [70]. Referring to the average values from the Lohani checklist method, Leopold matrix method, and Delphi method as the intensity coefficients, the HAI was calculated using the formula [71]:
where TA is the total area of the study region; Pi is the area of the i-th land use type; Ai is the corresponding human activity intensity coefficient; and N is the number of land use types (6 categories). Based on the HAI value, the intensity was classified into 5 levels: low (0 < HAI ≤ 0.2), relatively low (0.2 < HAI ≤ 0.4), medium (0.4 < HAI ≤ 0.6), relatively high (0.6 < HAI ≤ 0.8), and high (0.8 < HAI ≤ 1).
3. Results and Discussion
3.1. Validation and Analysis of Land Subsidence Inversion Results in Tianjin
Using 2016 as the temporal reference, we validated the accuracy of land subsidence data over Tianjin derived from Small Baseline Subset Interferometric Synthetic Aperture Radar (SBAS-InSAR) technology. The validation was performed using leveling measurement data collected across Tianjin. To ensure a one-to-one correspondence between each leveling point and an InSAR observation point, SBAS-InSAR points within a 0.05° radius of each leveling point were identified, and the nearest one was selected as the corresponding validation point. The correlation coefficient (R) and p-value were calculated by comparing the subsidence measurements from the leveling points and their matched InSAR points. This analysis allowed for an assessment of the error distribution characteristics and the degree of trend fitting, thereby completing the accuracy validation of the inversion results. A total of five leveling point groups were selected for this accuracy comparison (Figure 2). The results demonstrate that the mean subsidence error for all validation groups was less than 20 mm. The correlation coefficients (R) were all greater than 0.885, with the exception of one value at 0.755, and all statistical p-values were less than 0.05. These quantitative results indicate that the time-series SBAS-InSAR inversion results are highly reliable for monitoring land subsidence in Tianjin and satisfy the accuracy requirements for regional subsidence monitoring.
Figure 2.
Accuracy verification of land subsidence amounts in Tianjin derived from SBAS-InSAR versus measured leveling data. The coordinates of the leveling points in Figures (a–e) are as follows: (117°05′48.12″ E, 39°11′38.40″ N), (117°20′58.56″ E, 39°32′33.36″ N), (117°35′26.52″ E, 39°22′51.60″ N), (117°07′07.32″ E, 38°46′50.88″ N), and (117°52′08.40″ E, 39°11′55.68″ N). Note: The red and blue line plots in the figure correspond to SBAS-InSAR data and leveling data, respectively.
3.2. Analysis of SBAS-InSAR Results
3.2.1. Spatiotemporal Evolution Characteristics and Driving Mechanisms of Land Subsidence
Based on the land subsidence data of Tianjin obtained through Small Baseline Subset Interferometric Synthetic Aperture Radar (SBAS-InSAR) technology, the magnitude of subsidence was categorized into three classes: severe (>200 mm), moderate (100–199.99 mm), and mild (0.01–99.99 mm).
The spatial distribution of land subsidence in Tianjin displays notable agglomeration characteristics. Severe subsidence areas are primarily concentrated in the four suburban districts (Dongli, Xiqing, Jinnan, and Beichen), Binhai New Area, Ninghe District, Wuqing District, and Jinghai District (Figure 3a). Five major subsidence funnels were identified: (a) the junction of Wuqing, Beichen, and Jinghai districts; (b) central Jinghai District; (c) the junction of Jinghai, Xiqing, Jinnan districts and Binhai New Area; (d) northeastern Binhai New Area; and (e) central Dongli District (Figure 3b). These funnels exhibited an average annual subsidence rate exceeding 50 mm/a and cumulative subsidence surpassing 200 mm, representing the principal subsidence centers in the study area.
Figure 3.
(a) Annual average and (b) cumulative land subsidence amounts in Tianjin from 2016 to 2023, derived from SBAS-InSAR.
Temporally, the subsidence area in Tianjin showed a fluctuating “decrease-then-increase” trend from 2016 to 2023. The total subsidence area increased by a net 1024.74 km2 over this period, although subsidence intensity was markedly restrained (Figure 4a–h). In 2016, the total subsidence area was 3786.15 km2, comprising 1970.25 km2 of severe, 769.17 km2 of moderate, and 1046.94 km2 of mild subsidence, with an area ratio of 52.04%: 20.32%: 27.65% (Figure 4a). From 2016 to 2020, the subsidence area decreased annually, reaching 2924.71 km2—a reduction of 22.75% (Figure 4a–e). From 2020 to 2023, it rebounded to 4810.89 km2, an increase of 64.49% (Figure 4e–h). Notably, the structure of subsidence severity shifted fundamentally by 2023: severe subsidence accounted for only 5.07 km2, moderate for 152.84 km2, and mild for 4653.20 km2, with proportional contributions of 0.10%, 3.18%, and 96.72%, respectively (Figure 4h). The combined proportion of severe and moderate subsidence was below 5%, indicating effective control of high-intensity subsidence.
Figure 4.
Annual land subsidence amounts in Tianjin from 2016 to 2023, derived from SBAS-InSAR.
Regarding spatial evolution, the five subsidence funnels generally exhibited a mitigating trend from 2016 to 2023, despite localized variations: (a) For the funnel in central Dongli, the maximum cumulative subsidence fell below 200 mm beginning in 2017; after 2022, areas with cumulative subsidence ≤100 mm expanded south–north. (b) The funnel in the Wuqing–Beichen–Jinghai junction experienced a pronounced reduction during 2020–2021, with the original subsidence area in Wuqing nearly disappearing. However, new subsidence areas emerged in its northern and southern parts from 2022 onward. By 2023, areas with cumulative subsidence ≤100 km extended into central Wuqing, leading to a rebound in the funnel’s extent. (c) For the funnel in the multi-district junction, the maximum cumulative subsidence dropped below 200 mm by 2021, and the funnel had largely dissipated by 2023. (d) A new subsidence area emerged in southwestern Ninghe District in 2022, which was substantially alleviated in severity by 2023 (Figure 4a–h). Overall, traditional subsidence zones such as the four suburban districts improved, whereas new mild subsidence areas appeared in northern Dongli and northeastern Wuqing, forming a spatial pattern characterized by “mitigation in former subsidence areas and emergence of new ones.”
The spatiotemporal evolution of land subsidence in Tianjin is closely linked to regional groundwater management policies, hydrogeological conditions, and urbanization. The underlying mechanisms are summarized as follows: (1) Policy-driven mitigation: A series of control measures implemented since 2014 have been central to reducing subsidence intensity. Key policies include the Measures for the Management of Ground Subsidence Control in Tianjin and the Groundwater Exploitation Reduction Plan for Tianjin, complemented by water supply from the South-to-North Water Diversion Project. These have alleviated regional water supply–demand imbalances, facilitating groundwater withdrawal reduction. In 2016, the implementation of a ternary control system integrating “subsidence rate–groundwater level–groundwater extraction volume,” along with zoned management, incorporated subsidence control into governmental performance assessments, substantially strengthening groundwater management. Post-implementation, groundwater levels generally rose. For instance, in subsidence funnel c, the maximum depth of the third confined aquifer decreased from >90 m in 2016 to >80 m in 2019 and further to >70 m in 2021 [72]. Reduced aquifer compression directly contributed to the dissipation of subsidence funnels and slower subsidence rates, consistent with existing findings that attribute land subsidence in the North China Plain primarily to groundwater over-exploitation [73]. (2) Emergence of new subsidence areas: Despite the control of traditional high-intensity subsidence, new mild subsidence areas in northern Dongli and northeastern Wuqing reflect the complexity of regional driving factors. On one hand, infrastructure construction (e.g., roads, industrial parks) during urbanization may increase surface loading, compressing shallow soils. On the other hand, despite overall reductions in groundwater extraction, local agricultural and industrial water use may still exceed aquifer recharge capacity, causing localized water level declines and new subsidence centers. Additionally, short-term “emergence–mitigation” fluctuations in Ninghe District may relate to seasonal groundwater use and optimized water resource allocation; long-term evolution requires continued monitoring.
In summary, land subsidence in Tianjin during 2016–2023 exhibited “areal expansion but weakened intensity.” Policy-driven reductions in groundwater extraction are the core mechanism for subsidence mitigation, while localized anthropogenic activities and resource use changes have led to new subsidence areas. These characteristics reflect both the general trend in North China Plain cities following subsidence control policies and Tianjin’s regional specificity [74], characterized by “multi-district linkage and policy intensification.” Therefore, systematic analysis of the response relationship between land subsidence and groundwater dynamics can offer scientific support for accurate subsidence prediction and the optimization of regional control strategies, with important theoretical and practical implications.
3.2.2. Decomposition of Time-Series Signals for Land Subsidence and Groundwater Level
The dynamics of water cycle processes are complex and driven by multiple factors. Variations in groundwater depth result from the coupling of natural and anthropogenic influences, exhibiting superimposed characteristics of periodic fluctuations and random disturbances [75,76]. To investigate the variation characteristics of groundwater depth in Tianjin and the response mechanisms of land subsidence to these variations, this study analyzed monthly monitoring data from four typical groundwater observation wells (Figure 3b). The data were obtained from the Yearbook of Groundwater Levels for China’s Geo-Environmental Monitoring (2018–2022). All selected wells tap into Tianjin’s second aquifer group and provide continuous, complete records. This consistency eliminates biases in water level fluctuations due to differences in aquifer depth, thereby ensuring comparability across the dataset [77]. The four wells are located in the central, southwestern, northern, and eastern parts of Tianjin, respectively; two are situated near subsidence funnels, while the other two are farther away, offering both spatial representativeness and comparability. We applied the Seasonal-Trend Decomposition using Loess (STL) method to decompose the monthly time-series data (2018–2022) of land subsidence and groundwater depth, obtaining trend, seasonal, and residual components (Figure 5 shows the decomposition results from July 2018 to June 2022).
Figure 5.
Temporal data signal decomposition of SBAS-InSAR-derived land subsidence and groundwater level observation points in Tianjin.
Overall, the decomposed components of land subsidence and groundwater depth exhibited strong consistency (Figure 5). Since 2017, land subsidence in Tianjin has slowed, reflecting the notable effectiveness of control measures [73]; accordingly, the extracted trend components are relatively stable. Influenced by the temperate monsoon climate and seasonal agricultural irrigation, the seasonal components of both land subsidence and groundwater level at all four wells displayed a dominant annual cycle. Moreover, land subsidence showed a discernible lag relative to groundwater level changes. The residual components, which capture stochastic variability in both variables, also demonstrated clear synchronization, indicating a high likelihood of concurrent random fluctuations.
The second aquifer group in Tianjin consists mainly of silt and silty sand, with a hydraulic conductivity of 2–5 m/d [73], classifying it as a medium-permeability aquifer with strong regional connectivity. This hydrogeological setting provides a foundation for the consistent response patterns of land subsidence to groundwater depth variations across different well locations. To quantitatively evaluate the feature importance of each groundwater depth component (i.e., trend, seasonal, and residual) in influencing land subsidence, we used the Gini coefficient from a random forest model (Table 1). The model achieved coefficients of determination (R2) greater than 0.8 at all four wells, indicating that the groundwater level components collectively offer strong explanatory power for land subsidence. In addition, the root mean square error (RMSE) and mean squared error (MSE) of the analysis results were below 0.0454 and 0.0006, respectively, confirming the reliability of the contribution estimates obtained from the selected model. Although minor differences existed in the importance of groundwater level components across the four wells, the relative importance proportions were generally consistent, specifically 0.595 for the trend component, 0.172 for the seasonal component, and 0.233 for the residual component.
Table 1.
Importance characteristics of each component of groundwater level in Tianjin for land subsidence.
The differential contributions of groundwater depth components to land subsidence are closely linked to local hydrogeological conditions and human activity patterns. The trend component exhibited the highest feature importance (0.595), reflecting the cumulative impact of long-term groundwater extraction on land subsidence. The synchronous behavior of the trend components of both variables from 2018 to 2022 (Figure 5) confirms that soil compression due to prolonged water release from the second aquifer group is a key driver of subsidence. This aligns with the long-term “groundwater overexploitation–land subsidence” relationship observed in other parts of the North China Plain [78,79]. However, by quantitatively decomposing the time series, this study further reveals that the slope of the trend component decreased following the implementation of subsidence control policies—an outcome that underscores the effectiveness of these measures in mitigating long-term subsidence. The residual component ranked second in importance (0.233); its fluctuations are largely associated with short-term anthropogenic activities. No major geological disasters or extreme climate events were reported in Tianjin between 2018 and 2022, suggesting that random variations in the residuals can be attributed primarily to abrupt anthropogenic factors, such as unregulated local groundwater pumping or temporary water conservancy projects. The relatively high hydraulic conductivity of the medium-permeability aquifer enables such short-term disturbances to be rapidly transmitted to land subsidence signals. The seasonal component had the lowest importance (0.172). Both groundwater level and land subsidence showed recoverable seasonal patterns of decline and rebound, which likely explains their comparatively lower integrated influence on subsidence.
3.3. Response of Land Subsidence to Time-Series Components of Groundwater Depth
3.3.1. Study on Similarity Between Trend Components of Land Subsidence and Groundwater Depth
The long-term trend component captures the overarching directional evolution of land subsidence and groundwater depth. As illustrated in Figure 5, the trends of these two variables in Tianjin are broadly aligned but exhibit a discernible time lag. To quantitatively assess the similarity between their trends, we employed the DTW algorithm. This technique dynamically identifies an optimal alignment path between two temporal sequences, with a smaller resultant DTW distance denoting a higher degree of similarity. Final results show that the DTW distances for the four typical sites are all below 20, with calculated values of 1.16, 18.18, 6.43, and 16.58, respectively, and the comprehensive DTW distance is 10.59. These results demonstrate a striking similarity in the trend components across all study regions. Furthermore, the regional composite DTW distance of 10.59 provides robust quantitative evidence for the significant consistency between the long-term trends of land subsidence and groundwater depth in the Tianjin area. This quantitative finding not only corroborates the visual interpretation from Figure 5 but also strengthens the conclusion that the long-term trend in groundwater depth is a principal driver of land subsidence, an insight that aligns with the prior component contribution analysis.
3.3.2. Analysis of Time-Lag Effect Between Seasonal Components of Land Subsidence and Groundwater Depth
The seasonal component captures the principal periodic oscillations in both land subsidence and groundwater depth. To elucidate the resonance characteristics and time-lag between them, we employed Cross-Wavelet Transform (CWT) analysis. The phase relationship was interpreted from the power spectrum arrows: right-pointing arrows denote an in-phase relationship, left-pointing arrows indicate anti-phase, downward-pointing arrows signify that land subsidence lags groundwater depth by a quarter cycle (approximately 3 months), and upward-pointing arrows represent the opposite scenario (Figure 6).
Figure 6.
Cross-wavelet transform power spectrum between SBAS-InSAR-derived land subsidence and groundwater levels in Tianjin.
Results demonstrate that the seasonal components of groundwater depth and land subsidence at all four sites exhibit a significant primary resonance cycle of 12 months (passing the 95% red noise test; Table 2). This reveals that both variables are synchronously influenced by annual-scale driving factors, such as monsoonal precipitation and agricultural irrigation. The quantified time-lag shows that the response of land subsidence to groundwater depth changes ranges from 93 to 132 days (approximately 3 to 4 months; Table 2). Given the hydrogeological conditions of the study area, where the second aquifer group is primarily composed of silt and silty sand, this observed lag is consistent with the hydraulic conduction time required for precipitation and surface water to percolate through the vadose zone (with an average thickness of 20–30 m) to recharge the deep groundwater [80].
Table 2.
Statistical analysis of Cross-Wavelet Transform for annual periodic seasonal signals of land subsidence and groundwater level at four groundwater observation wells in Tianjin.
3.3.3. Joint Distribution Characteristics of Residual Components of Land Subsidence and Groundwater Depth
The residual components, which reflect non-trend and non-periodic stochastic signals, are primarily associated with short-term anthropogenic activities, such as unregulated groundwater extraction. To quantify the correlation between their random variations, we conducted the following analysis: (1) normalization and non-negative shifting of the residual components; and (2) construction of a joint distribution model using Copula functions. In this process, univariate distribution functions (Weibull, Gamma, Normal, Exponential, and Lognormal) were tested, with parameters estimated via the maximum likelihood method. The optimal marginal distributions and the two-dimensional Copula models were selected based on the minimum AIC and BIC values [80].
The results of the univariate marginal distribution fitting indicate that the Normal Copula provided the best fit for the residuals of both groundwater depth and land subsidence at most sites, with the exception of site W2, where the Weibull Copula was optimal for the groundwater depth residual (Table A1). For the two-dimensional joint distribution (GW-SBAS), the Frank Copula [81] emerged as the optimal model across all four sites (Table 3). The reliability of this fitting is further demonstrated by the uniform distribution of empirical and theoretical frequencies along the 45° diagonal (Figure S1).
Table 3.
Parameter values and goodness-of-fit test results for copula functions.
The joint distribution contour map (Figure S2) reveals that when the degree of groundwater depth change was fixed at 0.8, the degree of land subsidence increased markedly with the joint distribution probability, C(u,v). The joint probabilities for (GW = 0.8, SBAS = 0.8) at the four sites were 0.75, 0.87, 0.86, and 0.82, respectively (Table 4), confirming a strong correlation between the residual components. These findings suggest that unregulated anthropogenic groundwater extraction—characterized by irregular pumping cycles and volumes—serves as the dominant driver of stochastic land subsidence. Its non-linear disturbances are rapidly transmitted to the land surface through medium-permeability aquifers, resulting in synchronous fluctuations in the residual components.
Table 4.
Probability calculation results for the two-dimensional joint probability distribution of GW and SBAS across multiple sites.
3.4. Impact of Construction Land Evolution on Land Subsidence
Land subsidence formation is closely linked to anthropogenic activities, particularly construction land expansion during urbanization [11,82,83]. In the Tianjin plain area, regions with aquifer groundwater depths exceeding 40 m exhibit a high spatial coincidence with the five major subsidence funnels (Figure 3b and Figure 7), indicating groundwater extraction as the fundamental driver of regional land subsidence. To isolate the specific impact of construction land evolution, this study employed a “single-variable control method.” We selected four typical zones (A, B, C, D) with newly added construction land in areas characterized by groundwater depths < 40 m and stable water levels (Figure 7). Drawing on national monitoring data from the Yearbook of Groundwater Levels for China’s Geo-Environmental Monitoring [84], we verified regional water level stability to exclude interference from non-seasonal water level fluctuations on land subsidence.
Figure 7.
Annual distribution of newly added construction land in Tianjin from 2016 to 2022.
First, two proximate groundwater monitoring points were selected within or near each zone (totaling eight points; Figure 7), and stability was analyzed using monthly data from 2018 to 2021. Influenced by the temperate monsoon climate, groundwater levels at these points exhibited natural seasonal fluctuations: dry-season declines from insufficient recharge increased effective aquifer stress, inducing elastic subsidence, while wet-season rises were accompanied by surface rebound [85,86]. To remove seasonal influences, we applied a first-order difference method to the water level time-series data and used an Augmented Dickey–Fuller (ADF) stationarity test to assess non-seasonal trends (Table 5). After differencing, the ADF test p-values for all eight points were <0.01, confirming stationarity (Figure S3). This indicates that non-seasonal water level changes negligibly influenced subsidence in the study area, satisfying the “single-variable control” premise and allowing us to focus on the independent impact of construction land evolution.
Table 5.
ADF Test Results of Groundwater Levels at Key Monitoring Sites.
Analysis reveals that newly added construction land in Tianjin expanded continuously from 2016 to 2022, with the total area increasing from 58.07 km2 to 84.33 km2—a 45.22% growth over six years (Figure 7). The study area was divided using a 1 km × 1 km grid, and a human activity intensity index was constructed to analyze the spatiotemporal pattern of construction land evolution. A representative grid E (with no significant changes in other land use types) was selected for sensitivity analysis. The newly added construction land area from 2020 to 2022 was 0.0018 km2, 0.0081 km2, and 0.0009 km2, respectively, while the human activity intensity index gradually increased from 0.3712 in 2019 to 0.3792 in 2022. A quantitative relationship—for every 0.1 km2 increase in construction land, the human activity intensity index increases by 0.077—was derived, providing a benchmark for subsequent impact analysis.
Comprehensive analysis of construction land expansion and land subsidence data reveals a significant time-lagged correlation between the two. In 2016, new construction land patches were located in Zone A and northwestern Zone C; patches added in 2017 were also primarily distributed around these areas (Figure 7). Accordingly, the human activity intensity indices at Points ①–④ in Zones A and C increased from 0.77, 0.79, 0.38, and 0.54 in 2016 to 0.80, 0.82, 0.41, and 0.67 in 2017. High-intensity construction activities directly triggered land subsidence: Points ③ and ④ exhibited clear subsidence in 2017, with maximum values of 134.37 mm and 23.72 mm, respectively, whereas Points ① and ② showed a one-year lag effect, with maximum subsidence appearing in 2018 (70.82 mm and 36.05 mm, respectively; Figure 8). In contrast, the area of newly added construction land in 2018 was small and mainly distributed around the 2017 patches. In 2019, new patches focused on the center of Zone B (Figure 6), and the human activity intensity index at Point ⑤ rose from 0.73 in 2018 to 0.82 in 2019. As construction land continued to expand from 2020 to 2021, the subsidence trend at Point ⑤ gradually intensified. The maximum subsidence value of SBAS points near Point ⑤ reached 36.20 mm in 2022, slowing significantly in 2023 as construction activities stabilized (Figure 8).
Figure 8.
Distribution of human activity intensity and land subsidence amounts in key evolving construction land areas of Tianjin from 2016 to 2023.
In 2020, new construction land patches were concentrated in Zone D (Figure 7), with a relatively singular time range, primarily added in 2020. Concurrently, the human activity intensity indices at Points ⑥–⑧ jumped from 0.55, 0.74, and 0.74 in 2019 to 0.81, 0.88, and 0.94 in 2020. Influenced by the spatial distribution, slight subsidence first appeared in southwestern Zone D in 2020, followed by subsidence in the northwestern part in 2021. The maximum subsidence values at Points ⑥–⑧ in 2021 were 49.22 mm, 109.26 mm, and 125.61 mm, respectively (Figure 8). The limited newly added construction land in 2021 had a negligible impact on subsidence and was thus excluded from analysis. In 2022, new patches were concentrated in central Zone A and southern Zone C; the human activity intensity indices at Points ⑨–⑩ in these zones increased from 0.59 and 0.84 in 2021 to 0.62 and 0.94 in 2022. This increased human activity intensity induced land subsidence around Points ⑨–⑩ in 2023, with maximum values of 125.77 mm and 12.30 mm (Figure 8).
Owing to the long time span (2016–2022) and wide spatial coverage (full-region diffusion) of newly added construction land in Zone A, continuous land subsidence occurred from 2017 to 2023, and nearly the entire zone became a subsidence area. Similarly, Zone C experienced phased construction land additions in its southeastern part in 2020 and 2022, corresponding to two distinct subsidence peaks in 2021 and 2023 (Figure 8). In contrast, Zone B (low-rise industrial workshops), parts of Zone C, and Zone D (non-building construction) did not develop large-scale continuous subsidence due to low construction intensity and scattered spatiotemporal distribution, maintaining good regional stability.
Based on the above analysis, combined with point-specific construction characteristics and remote sensing image interpretation (Figure S4), we classified land subsidence driving mechanisms into three types with distinct impact mechanisms: 1. Building construction type (Points ①, ②, ⑤, ⑨): This category includes high-rise residential areas and industrial workshops. Foundation excavation and pipeline laying alter groundwater distribution, while building loads intensify soil consolidation. These dual effects trigger land subsidence. Among them, high-rise residential areas induce significantly greater subsidence intensity (maximum 125.77 mm) than low-rise industrial workshops (maximum 36.20 mm), due to higher loads and longer construction periods. 2. Surface morphology modification type (Points ③, ④): This type is dominated by hardened ground and piled earth platforms without buildings. Hardened ground reduces surface evaporation and soil infiltration, leading to soil shrinkage; the fill material (soil-rock mixture) of piled earth platforms exerts additional pressure, compacting shallow soil. These factors jointly cause local subsidence (maximum 134.37 mm). 3. Pit filling and land creation type (Points ⑥, ⑦, ⑧, ⑩): The self-weight pressure of fill materials (mainly construction waste and silty clay) alters the original foundation bearing conditions. Insufficient compaction of the fill body makes it prone to post-construction consolidation subsidence. Peak subsidence for this type can reach 125.61 mm, comparable to high-rise residential areas.
In summary, construction land evolution influences land subsidence through a three-stage mechanism: “load accumulation–soil response–time lag.” During load accumulation, static loads (e.g., building self-weight, fill material pressure) and dynamic disturbances (e.g., construction excavation, vehicle transport) jointly form external stress sources on the soil. High-intensity construction (e.g., high-rise buildings, pit filling) exhibits a significantly faster load accumulation rate than low-intensity construction, directly determining subsidence intensity differences. Soil response to external stress varies: the surface soil in the study area is primarily silt and silty clay, classified as having medium to high compressibility. Under load, the soil undergoes elastic subsidence (short-term response) and consolidation subsidence (long-term accumulation), which are the main sources of continuous subsidence. Consequently, land subsidence exhibits time-lag characteristics, originating from both the time required for load transmission and the indirect impact of groundwater fluctuations—both of which are temporally lagged. The lag times quantified in this study provide a measurable reference for subsequent research.
Furthermore, the spatiotemporal continuity of construction land is key to determining the spatial extent of land subsidence. For instance, Zone A experienced long-term continuous construction from 2016 to 2022, leading to sustained load accumulation and ongoing soil consolidation, resulting in large-scale, continuous land subsidence. In contrast, Zone D underwent phased, non-continuous construction; after load accumulation ceased, soil consolidation gradually stabilized, and the subsidence trend slowed following the lag effect (approximately one year).
4. Conclusions
This study employed the Small Baseline Subset Interferometric Synthetic Aperture Radar (SBAS-InSAR) technique to derive the land subsidence data in Tianjin for the period 2016–2023. Integrated with in situ leveling data, time series of groundwater depth, and information on construction land evolution, this study systematically investigated the spatiotemporal patterns, driving mechanisms, and response relationships of the land subsidence. The main conclusions are as follows:
- The SBAS-InSAR-derived results were validated against in situ leveling data, showing strong agreement with correlation coefficients exceeding 0.885, statistically significant p-values below 0.05, and mean errors within 20 mm. These findings demonstrate the high reliability of the SBAS-InSAR technique for monitoring land subsidence in Tianjin and its capability to meet the accuracy requirements for regional-scale monitoring. Between 2016 and 2023, land subsidence in Tianjin was characterized by overall “areal expansion yet intensity mitigation”: the total subsidence area experienced a net increase of 1024.74 km2, whereas the proportion of severe and moderate subsidence areas decreased markedly from 72.36% to below 5%. The five primary subsidence funnels generally exhibited a mitigating trend, whereas new subsidence areas emerged in regions including northern Dongli District, collectively shaping a distinct spatial pattern of “mitigation in pre-existing areas and emergence in new zones”.
- Policy regulation was identified as the leading factor in curbing subsidence intensity. A series of policies aimed at reducing groundwater exploitation, coupled with water resource scheduling projects, facilitated the recovery of groundwater levels, which constituted the primary driver for the mitigation observed in traditional high-intensity subsidence zones. In contrast, infrastructure construction associated with localized urbanization and anthropogenic changes in groundwater usage were the main drivers for the emergence of new subsidence areas. Decomposition analysis using the Seasonal-Trend Decomposition procedure based on Loess (STL) and the random forest model revealed that the trend component of groundwater depth made the greatest contribution to land subsidence (0.595), followed by the residual (0.233) and seasonal (0.172) components. This finding confirms the differential impacts arising from long-term groundwater exploitation (cumulative effect), short-term anthropogenic disturbances, and periodic natural factors.
- Analysis based on the DTW algorithm, CWT, and Copula functions elucidated the response mechanisms between land subsidence and the individual components of groundwater depth: the two variables had high similarity in long-term trends; the seasonal components exhibited a 12-month primary resonance cycle; the response of land subsidence to groundwater depth changes lagged by 3–4 months; and the residual components showed strong correlation. Medium-permeability aquifers provided the hydrogeological basis for this response relationship. Construction land evolution influenced land subsidence via a three-phase mechanism: “load accumulation → soil response → time lag effect”. High-intensity construction activities (e.g., high-rise residential buildings and pit-filling/land-creation projects) induced significantly greater subsidence intensity. The lag time and spatiotemporal continuity of construction activities collectively governed the spatial extent and temporal duration of the resultant subsidence.
This study quantified the coupling relationships among land subsidence, groundwater dynamics, and construction land evolution in Tianjin. It clarified the effectiveness of policy regulation in subsidence control and elucidated the mechanisms of various driving factors. It provides scientific support for the precise prevention and control of regional land subsidence, optimization of groundwater management, and urban planning layout. The findings not only enrich the case base of urban land subsidence studies in the North China Plain but also offer a reference for subsidence mitigation in regions undergoing similar hydrogeological and urbanization processes. Future work could extend the monitoring period and integrate multi-source data to deepen the understanding of the coupling mechanisms among different driving factors, thereby enhancing the accuracy of subsidence trend prediction.
Supplementary Materials
The following supporting information can be downloaded at https://www.mdpi.com/article/10.3390/geosciences16020057/s1. Figure S1: Empirical and theoretical frequencies of the joint distribution of residual components from groundwater level and land subsidence data in Tianjin; Figure S2: Probability contour map of the two-dimensional joint distribution of land subsidence and groundwater level changes in Tianjin; Figure S3: First-order difference trend of groundwater levels at key points in Tianjin from 2018 to 2021; Figure S4: Image comparison of key points in priority areas of the study region.
Author Contributions
Conceptualization, J.X. and J.L.; methodology, J.X.; software, J.X.; validation, J.X., J.L. and W.Y.; formal analysis, J.X.; investigation, J.X.; resources, J.H.; data curation, J.X.; writing—original draft preparation, J.X.; writing—review and editing, J.X., Y.C., J.L., J.H., W.Y., C.Y. and G.J.; visualization, J.X.; supervision, J.H., Y.C.; project administration, J.H., Y.C.; funding acquisition, Y.C. All authors have read and agreed to the published version of the manuscript.
Funding
This research was funded by the National Natural Science Foundation of China (NSFC), grant numbers 52379021 and 52579016.
Data Availability Statement
The Sentinel-1A Synthetic Aperture Radar (SAR) data utilized in this study are openly accessible via the Copernicus Data Space Ecosystem (CDSE; https://dataspace.copernicus.eu/), a comprehensive Earth observation data platform maintained under the European Union’s Copernicus program. These satellite data are provided with free and open access, ensuring full traceability and integrity through CDSE’s dedicated data verification services. Groundwater level monitoring data covering the period 2018–2022 were obtained from the China Geological Environment Monitoring Groundwater Level Yearbook, which is available through the GeoCloud platform (https://geocloud.cgs.gov.cn/)—a national geological information service system managed by the China Geological Survey. This dataset is curated to support geological research and environmental monitoring applications with standardized data collection protocols. Land use data utilized in this study were generated by the research team at Wuhan University, corresponding to the China Land Cover Dataset (CLCD) Version 1.0.3—a 30 m resolution annual land cover product spanning 1985–2023 [55]. The dataset is openly accessible free of charge via the Zenodo repository (https://zenodo.org/records/12779975 (accessed on 8 August 2025); DOI: 10.5281/zenodo.12779975) under the Creative Commons Attribution 4.0 International (CC BY 4.0) license.
Acknowledgments
We thank Ningyue Zhang and Yuhe Tian for their assistance during the course of this research.
Conflicts of Interest
Author Wei Yan was employed by the company Tianjin Institute of Surveying and Mapping Co., Ltd. The remaining authors declare that the research was conducted in the absence of any commercial or financial relationships that could be construed as a potential conflict of interest.
Abbreviations
The following abbreviations are used in this manuscript:
| ADF | Augmented Dickey–Fuller |
| AIC | Akaike Information Criterion |
| BIC | Bayesian Information Criterion |
| BTH | Beijing–Tianjin–Hebei |
| CWT | Cross-Wavelet Transform |
| D-InSAR | Differential InSAR |
| DTW | Dynamic Time Warping |
| ESA | European Space Agency |
| HAI | Human Activity Intensity |
| ISCE | InSAR Scientific Computing Environment |
| LS | Land Subsidence |
| MSE | Mean Squared Error |
| MT-InSAR | Multi-Temporal InSAR |
| RF | Random Forest |
| RMSE | Root Mean Square Error |
| SAR | Sentinel-1 Synthetic Aperture Radar |
| SBAS-InSAR | Small BAseline Subset Interferometric Synthetic Aperture Radar |
| SVD | Singular Value Decomposition |
| STL | Seasonal-Trend Decomposition using Loess |
| TEUs | Twenty-Foot Equivalent Units |
Appendix A
Table A1.
Fitting test of parameter estimation for univariate marginal distributions.
References
- Poland, J.F. (Ed.) Guidebook to Studies of Land Subsidence Due to Groundwater Withdrawal. In Studies and Reports in Hydrology; UNESCO: Paris, France, 1984; Volume 40, ISBN 978-92-3-102213-8. Available online: https://wwwrcamnl.wr.usgs.gov/rgws/Unesco/ (accessed on 8 August 2025).
- Galloway, D.L.; Burbey, T.J. Regional Land Subsidence Accompanying Groundwater Extraction. Hydrogeol. J. 2011, 19, 1459–1486. [Google Scholar] [CrossRef] [Scilit]
- Ma, T.; Du, Y.; Ma, R.; Xiao, C.; Liu, Y. Water–rock Interactions and Related Eco-Environmental Effects in Typical Land Subsidence Zones of China. Hydrogeol. J. 2018, 26, 1339–1349. [Google Scholar] [CrossRef] [Scilit]
- Poland, J.F.; Davis, G.H. Land Subsidence Due to Withdrawal of Fluids. In Reviews in Engineering Geology; Varnes, D.J., Kiersch, G., Eds.; Geological Society of America (GSA): Boulder, CO, USA, 1969; Volume 2, ISBN 978-0-8137-5802-2. [Google Scholar] [CrossRef] [Scilit]
- Glopper, R.D.; Ritzema, H. Land Subsidence. In Drainage Principles and Applications; International Institute for Land Reclamation and Improvement (ILRI): Wageningen, The Netherlands, 1994; pp. 477–488. [Google Scholar]
- Huang, Y.; Jiang, X. Field-Observed Phenomena of Seismic Liquefaction and Subsidence During the 2008 Wenchuan Earthquake in China. Nat. Hazards 2010, 54, 839–850. [Google Scholar] [CrossRef] [Scilit]
- Margat, J.; Van der Gun, J. Groundwater Around the World: A Geographic Synopsis; CRC Press: Boca Raton, FL, USA, 2013. [Google Scholar] [CrossRef] [Scilit]
- Higgins, S.A.; Overeem, I.; Steckler, M.S.; Syvitski, J.P.; Seeber, L.; Akhter, S.H. InSAR Measurements of Compaction and Subsidence in the Ganges-Brahmaputra Delta, Bangladesh. J. Geophys. Res. Earth Surf. 2014, 119, 1768–1781. [Google Scholar] [CrossRef] [Scilit]
- Minderhoud, P.; Erkens, G.; Pham, V.; Vuong, B.; Stouthamer, E. Assessing the Potential of the Multi-Aquifer Subsurface of the Mekong Delta (Vietnam) for Land Subsidence Due to Groundwater Extraction. Proc. Int. Assoc. Hydrol. Sci. 2015, 372, 73–76. [Google Scholar] [CrossRef] [Scilit]
- Galloway, D.L.; Burbey, T.J. Land Subsidence in the United States; United States Geological Survey: Reston, VA, USA, 2011; Volume 1182, pp. 1–43. [Google Scholar]
- Ao, Z.; Hu, X.; Tao, S.; Hu, X.; Wang, G.; Li, M.; Wang, F.; Hu, L.; Liang, X.; Xiao, J. A National-Scale Assessment of Land Subsidence in China’s Major Cities. Science 2024, 384, 301–306. [Google Scholar] [CrossRef] [Scilit]
- Cao, A.; Esteban, M.; Valenzuela, V.P.B.; Onuki, M.; Takagi, H.; Thao, N.D.; Tsuchiya, N. Future of Asian Deltaic Megacities Under Sea Level Rise and Land Subsidence: Current Adaptation Pathways for Tokyo, Jakarta, Manila, and Ho Chi Minh City. Curr. Opin. Environ. Sustain. 2021, 50, 87–97. [Google Scholar] [CrossRef] [Scilit]
- Erkens, G.; Bucx, T.; Dam, R.; De Lange, G.; Lambert, J. Sinking Coastal Cities. Proc. Int. Assoc. Hydrol. Sci. 2015, 372, 189–198. [Google Scholar] [CrossRef] [Scilit]
- Nicholls, R.J.; Lincke, D.; Hinkel, J.; Brown, S.; Vafeidis, A.T.; Meyssignac, B.; Hanson, S.E.; Merkens, J.-L.; Fang, J. A Global Analysis of Subsidence, Relative Sea-Level Change and Coastal Flood Exposure. Nat. Clim. Change 2021, 11, 338–342. [Google Scholar] [CrossRef] [Scilit]
- Wu, P.C.; Wei, M.; D’Hondt, S. Subsidence in Coastal Cities Throughout the World Observed by InSAR. Geophys. Res. Lett. 2022, 49, e2022GL098477. [Google Scholar] [CrossRef] [Scilit]
- Hanson, S.; Nicholls, R.; Ranger, N.; Hallegatte, S.; Corfee-Morlot, J.; Herweijer, C.; Chateau, J. A Global Ranking of port cities with high exposure to climate extremes. Clim. Change 2011, 104, 89–111. [Google Scholar] [CrossRef] [Scilit]
- Kulp, S.A.; Strauss, B.H. New Elevation Data Triple Estimates of Global Vulnerability to Sea-Level Rise and Coastal Flooding. Nat. Commun. 2019, 10, 4844. [Google Scholar] [CrossRef] [Scilit]
- Shirzaei, M.; Bürgmann, R. Global Climate Change and Local Land Subsidence Exacerbate Inundation Risk to the San Francisco Bay Area. Sci. Adv. 2018, 4, eaap9234. [Google Scholar] [CrossRef] [Scilit] [PubMed]
- Liu, Y.; Ma, T.; Du, Y. Compaction of Muddy Sediment and Its Significance to Groundwater Chemistry. Procedia Earth Planet. Sci. 2017, 17, 392–395. [Google Scholar] [CrossRef] [Scilit]
- Herrera-García, G.; Ezquerro, P.; Tomás, R.; Béjar-Pizarro, M.; López-Vinielles, J.; Rossi, M.; Mateos, R.M.; Carreón-Freyre, D.; Lambert, J.; Teatini, P. Mapping the Global Threat of Land Subsidence. Science 2021, 371, 34–36. [Google Scholar] [CrossRef] [Scilit]
- Chai, J.-C.; Shen, S.-L.; Zhu, H.-H.; Zhang, X.-L. Land Subsidence Due to Groundwater Drawdown in Shanghai. Geotechnique 2004, 54, 143–147. [Google Scholar] [CrossRef]
- Ye, S.; Xue, Y.; Wu, J.; Yan, X.; Yu, J. Progression and Mitigation of Land Subsidence in China. Hydrogeol. J. 2016, 24, 685–693. [Google Scholar] [CrossRef] [Scilit]
- Hu, R.; Yue, Z.; Wang, L.; Wang, S. Review on Current Status and Challenging Issues of Land Subsidence in China. Eng. Geol. 2004, 76, 65–77. [Google Scholar] [CrossRef] [Scilit]
- Xu, Y.-S.; Ma, L.; Du, Y.-J.; Shen, S.-L. Analysis of Urbanisation-Induced Land Subsidence in Shanghai. Nat. Hazards 2012, 63, 1255–1267. [Google Scholar] [CrossRef] [Scilit]
- Tang, W.; Zhan, W.; Jin, B.; Motagh, M.; Xu, Y. Spatial Variability of Relative Sea-Level Rise in Tianjin, China: Insight from InSAR, GPS, and tide-gauge observations. IEEE J. Sel. Top. Appl. Earth Obs. Remote Sens. 2021, 14, 2621–2633. [Google Scholar] [CrossRef] [Scilit]
- Dong, Y.; Zhang, M.; Liu, J.; Zhang, X.; Feng, L. Coupling Relationship Between Groundwater and Ground Fissures of Land Subsidence in Xi’an City and Risk Prevention and Control Technology. Northwestern Geol. 2019, 52, 95–102. [Google Scholar]
- National Bureau of Statistics of China. Narrowed Decline in Total Population and Sustained Improvement in Population Quality; National Bureau of Statistics of China: Beijing, China, 2025. Available online: https://www.stats.gov.cn/xxgk/jd/sjjd2020/202501/t20250117_1958337.html (accessed on 12 October 2025).
- China Meteorological Administration (CMA). Ground Subsidence: The Pain of Cities. China Meteorological Administration (CMA). 2014. Available online: https://www.cma.gov.cn/2011xzt/2014zt/20140508/2014050805/201405/t20140512_245869.html (accessed on 18 August 2025).
- Zheng, Z.; Yin, H.; Zeng, X. Thermal Reservoir Models and Heat Flow Characteristics of Geothermal Field in Tianjin. Bull. Inst. Hydrogeol. Eng. Geol. 1990, 6, 25–42. [Google Scholar]
- Yin, L.X.; Fang, Z.; He, X.; Cao, S.J.; Wei, W.; Qiang, Y. Land Subsidence in Tianjin, China. Environ. Earth Sci. 2011, 62, 1151–1161. [Google Scholar] [CrossRef] [Scilit]
- Lixin, Y.; Jie, W.; Chuanqing, S.; Guo, J.-W.; Yanxiang, J.; Liu, B. Land Subsidence Disaster Survey and Its Economic Loss Assessment in Tianjin, China. Nat. Hazards Rev. 2010, 11, 35–41. [Google Scholar] [CrossRef] [Scilit]
- Bagheri-Gavkosh, M.; Hosseini, S.M.; Ataie-Ashtiani, B.; Sohani, Y.; Ebrahimian, H.; Morovat, F.; Ashrafi, S. Land Subsidence: A Global Challenge. Sci. Total Environ. 2021, 778, 146193. [Google Scholar] [CrossRef] [Scilit] [PubMed]
- Lin, Z.; Guo, H.L.; Liu, X.J.; Zhang, C.F.; Yang, M.; Wang, H.G.; Zeng, K.; Huang, M.M. Research progress and prospect of land subsidence. Hydrogeol. Eng. Geol. 2024, 51, 167–177. [Google Scholar]
- Shirzaei, M.; Freymueller, J.; Törnqvist, T.E.; Galloway, D.L.; Dura, T.; Minderhoud, P.S. Measuring, Modelling and Projecting Coastal Land Subsidence. Nat. Rev. Earth Environ. 2021, 2, 40–58. [Google Scholar] [CrossRef] [Scilit]
- Ferretti, A.; Fumagalli, A.; Novali, F.; Prati, C.; Rocca, F.; Rucci, A. A New Algorithm for Processing Interferometric Data-Stacks: SqueeSAR. IEEE Trans. Geosci. Remote Sens. 2011, 49, 3460–3470. [Google Scholar] [CrossRef] [Scilit]
- Berardino, P.; Fornaro, G.; Lanari, R.; Sansosti, E. A New Algorithm for Surface Deformation Monitoring Based on Small Baseline Differential SAR Interferograms. IEEE Trans. Geosci. Remote Sens. 2003, 40, 2375–2383. [Google Scholar] [CrossRef] [Scilit]
- Ferretti, A.; Prati, C.; Rocca, F. Permanent Scatterers in SAR Interferometry. IEEE Trans. Geosci. Remote Sens. 2002, 39, 8–20. [Google Scholar] [CrossRef] [Scilit]
- Hooper, A.; Zebker, H.; Segall, P.; Kampes, B. A New Method for Measuring Deformation on Volcanoes and Other Natural Terrains Using InSAR Persistent Scatterers. Geophys. Res. Lett. 2004, 31, 23. [Google Scholar] [CrossRef] [Scilit]
- Massonnet, D.; Rossi, M.; Carmona, C.; Adragna, F.; Peltzer, G.; Feigl, K.; Rabaute, T. The Displacement Field of the Landers Earthquake Mapped by Radar Interferometry. Nature 1993, 364, 138–142. [Google Scholar] [CrossRef] [Scilit]
- Perissin, D.; Wang, T. Time- Series InSAR Applications Over Urban Areas in China. IEEE J. Sel. Top. Appl. Earth Obs. Remote Sens. 2010, 4, 92–100. [Google Scholar] [CrossRef] [Scilit]
- Frattini, P.; Crosta, G.B.; Allievi, J. Damage to Buildings in Large Slope Rock Instabilities Monitored with the PSInSAR™ Technique. Remote Sens. 2013, 5, 4753–4773. [Google Scholar] [CrossRef] [Scilit]
- Lubitz, C.; Motagh, M.; Wetzel, H.-U.; Kaufmann, H. Remarkable Urban Uplift in Staufen im Breisgau, Germany: Observations from TerraSAR-X InSAR and Leveling from 2008 to 2011. Remote Sens. 2013, 5, 3082–3100. [Google Scholar] [CrossRef] [Scilit]
- Casu, F.; Manzo, M.; Lanari, R. A Quantitative Assessment of the SBAS Algorithm Performance for Surface Deformation Retrieval from DInSAR Data. Remote Sens. Environ. 2006, 102, 195–210. [Google Scholar] [CrossRef] [Scilit]
- Li, S.; Xu, W.; Li, Z. Review of the SBAS InSAR Time- Series Algorithms, Applications, and Challenges. Geod. Geodyn. 2022, 13, 114–126. [Google Scholar] [CrossRef] [Scilit]
- Hu, B.; Wang, H.S.; Sun, Y.L.; Hou, J.G.; Liang, J. Long-Term Land Subsidence Monitoring of Beijing (China) Using the Small Baseline Subset (SBAS) Technique. Remote Sens. 2014, 6, 3648–3661. [Google Scholar] [CrossRef] [Scilit]
- Guo, J.; Hu, J.; Li, B.; Zhou, L.; Wang, W. Land Subsidence in Tianjin for 2015 to 2016 Revealed by the Analysis of Sentinel-1A with SBAS-InSAR. J. Appl. Remote Sens. 2017, 11, 026024. [Google Scholar] [CrossRef] [Scilit]
- Zhang, Z.; Hu, C.; Wu, Z.; Zhang, Z.; Yang, S.; Yang, W. Monitoring and Analysis of Ground Subsidence in Shanghai Based on PS-InSAR and SBAS-InSAR Technologies. Sci. Rep. 2023, 13, 8031. [Google Scholar] [CrossRef] [Scilit] [PubMed]
- Tianjin Municipal People’s Government. The Geographical Location of Tianjin. Tianjin Municipal People’s Government Official Website. 2021. Available online: https://www.tj.gov.cn/sq/tjgk/zrdl/dlwz/ (accessed on 27 August 2021).
- Tianjin Municipal People’s Government. Tianjin Administrative Division. Tianjin Municipal People’s Government Official Website. 2025. Available online: https://www.tj.gov.cn/sq/tjgk/qhyrk/xzqh/202005/t20200522_2615441.html (accessed on 12 August 2025).
- Tianjin Municipal Bureau of Statistics, National Bureau of Statistics Tianjin Survey Team (Comps.). 2024 Tianjin Municipal Economic and Social Development Statistical Communique. Tianjin Municipal People’s Government Official Website. 2025. Available online: https://www.tj.gov.cn/sq/tjgb/202503/t20250324_6890361.html (accessed on 21 August 2025).
- Minissale, A.; Borrini, D.; Montegrossi, G.; Orlando, A.; Tassi, F.; Vaselli, O.; Huertas, A.D.; Yang, J.; Cheng, W.; Tedesco, D. The Tianjin Geothermal Field (North-Eastern China): Water Chemistry and Possible Reservoir Permeability Reduction Phenomena. Geothermics 2008, 37, 400–428. [Google Scholar] [CrossRef] [Scilit]
- Tianjin Geological Survey and Mineral Resources Administration; Geological Publishing House: Beijing, China, 1992.
- Yu, X.; Wang, G.; Hu, X.; Liu, Y.; Bao, Y. Land Subsidence in Tianjin, China: Before and After the South-to-North Water Diversion. Remote Sens. 2023, 15, 1647. [Google Scholar] [CrossRef] [Scilit]
- Zheng, G.; Cao, J.R.; Cheng, X.S.; Ha, D.; Liu, J. Experimental Study on Recharge of the Second Silty-Silty Sand Micro-Confined Aquifer in Tianjin. Chin. J. Geotech. Eng. 2018, 40, 592–601. [Google Scholar]
- Yang, J.; Huang, X. The 30 m Annual Land Cover Datasets and Its Dynamics in China from 1985 to 2023. Earth Syst. Sci. Data 2024, 13, 3907–3925. [Google Scholar] [CrossRef] [Scilit]
- Mora, O.; Mallorqui, J.J.; Broquetas, A. Linear and Nonlinear Terrain Deformation Maps from a Reduced Set of Interferometric SAR Images. IEEE Trans. Geosci. Remote Sens. 2003, 41, 2243–2253. [Google Scholar] [CrossRef] [Scilit]
- Cleveland, R.B.; Cleveland, W.S.; McRae, J.E.; Terpenning, I. STL: A Seasonal-Trend Decomposition. J. Off. Stat. 1990, 6, 3–73. [Google Scholar]
- Nicodemus, K.K. On the Stability and Ranking of Predictors from Random Forest Variable Importance Measures. Brief. Bioinform. 2011, 12, 369–373. [Google Scholar] [CrossRef] [Scilit]
- Breiman, L. Random Forests. Mach. Learn. 2001, 45, 5–32. [Google Scholar] [CrossRef] [Scilit]
- Breiman, L.; Friedman, J.; Olshen, R.A.; Stone, C.J. Classification and Regression Trees; Chapman and Hall/CRC: Boca Raton, FL, USA, 2017. [Google Scholar] [CrossRef] [Scilit]
- Sakoe, H.; Chiba, S. Dynamic Programming Algorithm Optimization for Spoken Word Recognition. IEEE Trans. Acoust. Speech Signal Process. 1978, 26, 43–49. [Google Scholar] [CrossRef] [Scilit]
- Itakura, F. Minimum Prediction Residual Principle Applied to Speech Recognition. IEEE Trans. Acoust. Speech Signal Process. 1975, 23, 67–72. [Google Scholar] [CrossRef] [Scilit]
- Zeitler, J.; Krause, M.; Müller, M. Soft Dynamic Time Warping with Variable Step Weights. In Proceedings of the ICASSP 2024–2024 IEEE International Conference on Acoustics, Speech and Signal Processing (ICASSP), Seoul, Republic of Korea, 14–19 April 2024; pp. 356–360. [Google Scholar] [CrossRef] [Scilit]
- Torrence, C.; Compo, G.P. A Practical Guide to Wavelet Analysis. Bull. Am. Meteorol. Soc. 1998, 79, 61–78. [Google Scholar] [CrossRef] [Scilit]
- Grinsted, A.; Moore, J.; Jevrejeva, S. Application of the Cross Wavelet Transform and Wavelet Coherence to Geophysical Time Series. Non-Linear Process. Geophys. 2004, 11, 561–566. [Google Scholar] [CrossRef] [Scilit]
- Joe, H. Multivariate Models and Multivariate Dependence Concepts; CRC Press: Boca Raton, FL, USA, 1997. [Google Scholar] [CrossRef] [Scilit]
- Dastourani, M.; Nazeri Tahroudi, M. Toward Coupling of Groundwater Drawdown and Pumping Time in a Constant Discharge. Appl. Water Sci. 2022, 12, 74. [Google Scholar] [CrossRef] [Scilit]
- Zhang, L.; Singh, V.P. Copulas and Their Applications in Water Resources Engineering; Cambridge University Press: Cambridge, UK, 2019. [Google Scholar] [CrossRef] [Scilit]
- McNeil, A.J.; Frey, R.; Embrechts, P. Quantitative Risk Management: Concepts, Techniques and Tools—Revised Edition; Princeton University Press: Princeton, NJ, USA, 2015. [Google Scholar]
- Zhang, T.; Sun, Y.; Guan, M.; Kang, J.; Zhang, B. Human Activity Intensity in China Under Multi-Factor Interactions: Spatio-Temporal Characteristics and Influencing Factors. Sustainability 2022, 14, 3113. [Google Scholar] [CrossRef] [Scilit]
- Wang, X.-Q.; Zhao, X.-Y. Impacts of Human Activities on Ecosystem Services in National Parks: A Case Study of Qilian Mountain National Park. J. Nat. Resour. 2023, 38, 966–982. [Google Scholar] [CrossRef] [Scilit]
- Tianjin Water Resources Bulletin Editorial Board. Tianjin Water Resources Bulletin (2016–2022); Tianjin Municipal Water Affairs Bureau: Tianjin, China, 2016–2022. Available online: https://swj.tj.gov.cn/zwgk_17147/xzfxxgk/fdzdgknr1/tjxx/ (accessed on 12 August 2025).
- Li, J.Q.; Jia, X.; Li, J.; Yin, C.R.; Gao, L.J. Distribution Characteristics and Evolution Trend of Severe Land Subsidence Areas in Tianjin City. Chin. J. Geol. Hazard Control 2023, 34, 53–60. [Google Scholar]
- Tianjin Municipal People’s Government. Measures of Tianjin Municipality for Controlling Land Subsidence; Tianjin Municipal People’s Government: Tianjin, China, 2014. Available online: http://www.tj.gov.cn/zwgk/szfgb/qk/2014/1_3302/ (accessed on 25 October 2025).
- Trefry, M.G.; McLaughlin, D.; Lester, D.R.; Metcalfe, G.; Johnston, C.; Ord, A. Stochastic Relationships for Periodic Responses in Randomly Heterogeneous Aquifers. Water Resour. Res. 2011, 47, 8. [Google Scholar] [CrossRef] [Scilit]
- Kuang, X.; Liu, J.; Scanlon, B.R.; Jiao, J.J.; Jasechko, S.; Lancia, M.; Biskaborn, B.K.; Wada, Y.; Li, H.; Zeng, Z. The Changing Nature of Groundwater in the Global Water Cycle. Science 2024, 383, eadf0630. [Google Scholar] [CrossRef] [Scilit]
- Zheng, G.; Li, Q.; Hada, E.A. Study on Stress State of Pressure-Bearing Layer and Settlement Law Caused by Decompression in Tianjin. Rock Soil Mech. 2018, 39, 285–294. [Google Scholar]
- Zheng, Y.J.; Gao, H.P.; Li, W.P.; Tian, X.W. Relationship Between Land Subsidence and Deep Groundwater Yield in the North China Plain. South–North Water Transf. Water Sci. Technol. 2014, 12, 165–169. [Google Scholar]
- Shi, D.; Jia, C.; Zhang, S.; Ding, P.; Shao, M.; Zhang, A. Regional Characteristics and Evolutionary Trend Prediction of Land Subsidence Caused by Groundwater Over Exploitation in North Shandong of the North China Plain. Acta Geol. Sin. 2020, 94, 1638–1654. [Google Scholar]
- Gao, H.P.; Bai, J.B.; Zheng, Y.Q.; Wang, L.Y.; Song, J.S.; Li, W.P.; Zheng, Z.C.; Wang, Y.L.; Zheng, J.Y.; Wang, H.G. The Evolution Characteristics and Mechanism of the Land Subsidence in Typical Areas of the North China Plain. Geol. China 2017, 44, 1115–1127. [Google Scholar]
- Bai, Y.; Wang, Y.; Chen, Y.; Zhang, L. Probabilistic Analysis of the Controls on Groundwater Depth Using Copula Functions. Hydrol. Res. 2020, 51, 406–422. [Google Scholar] [CrossRef] [Scilit]
- Candela, T.; Koster, K. The Many Faces of Anthropogenic Subsidence. Science 2022, 376, 1381–1382. [Google Scholar] [CrossRef] [Scilit]
- Parsons, T. The weight of cities: Urbanization Effects on Earth’s Subsurface. AGU Adv. 2021, 2, e2020AV000277. [Google Scholar] [CrossRef] [Scilit]
- China Institute for Geo-Environmental Monitoring. China Groundwater Level Yearbook for Geo-Environmental Monitoring (2018–2022); China Land Press: Beijing, China, 2018–2022. [Google Scholar]
- Tata, S.; Chu, H.-J. Effective hydraulic head control rule identification for unrecoverable subsidence mitigation. Water Resour. Manag. 2024, 38, 3313–3327. [Google Scholar] [CrossRef] [Scilit]
- Li, K.; Wang, J.; Altansukh, O.; Li, C.; Bavuu, E.; Tsengel, G.-E. Discovery of Groundwater Storage Changes and Zoning Feature Variations Over the Past Two Decades in the Mongolian Plateau for SDG 6.6. Remote Sens. Environ. 2025, 331, 115026. [Google Scholar] [CrossRef] [Scilit]
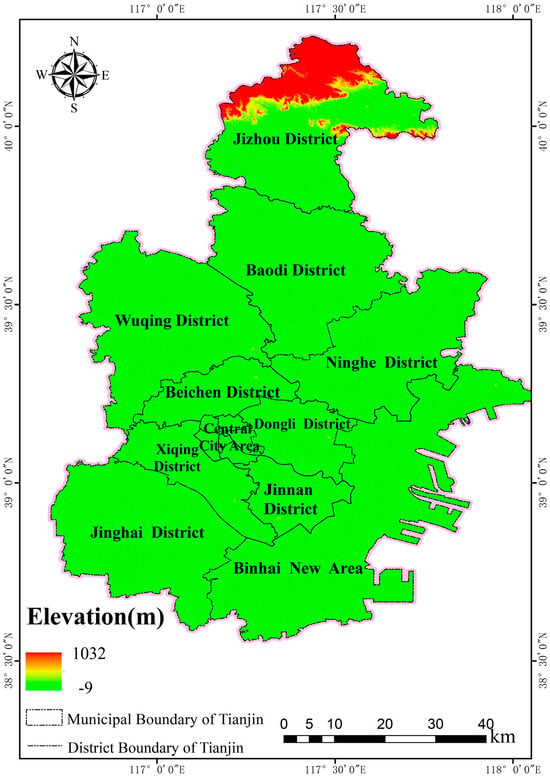
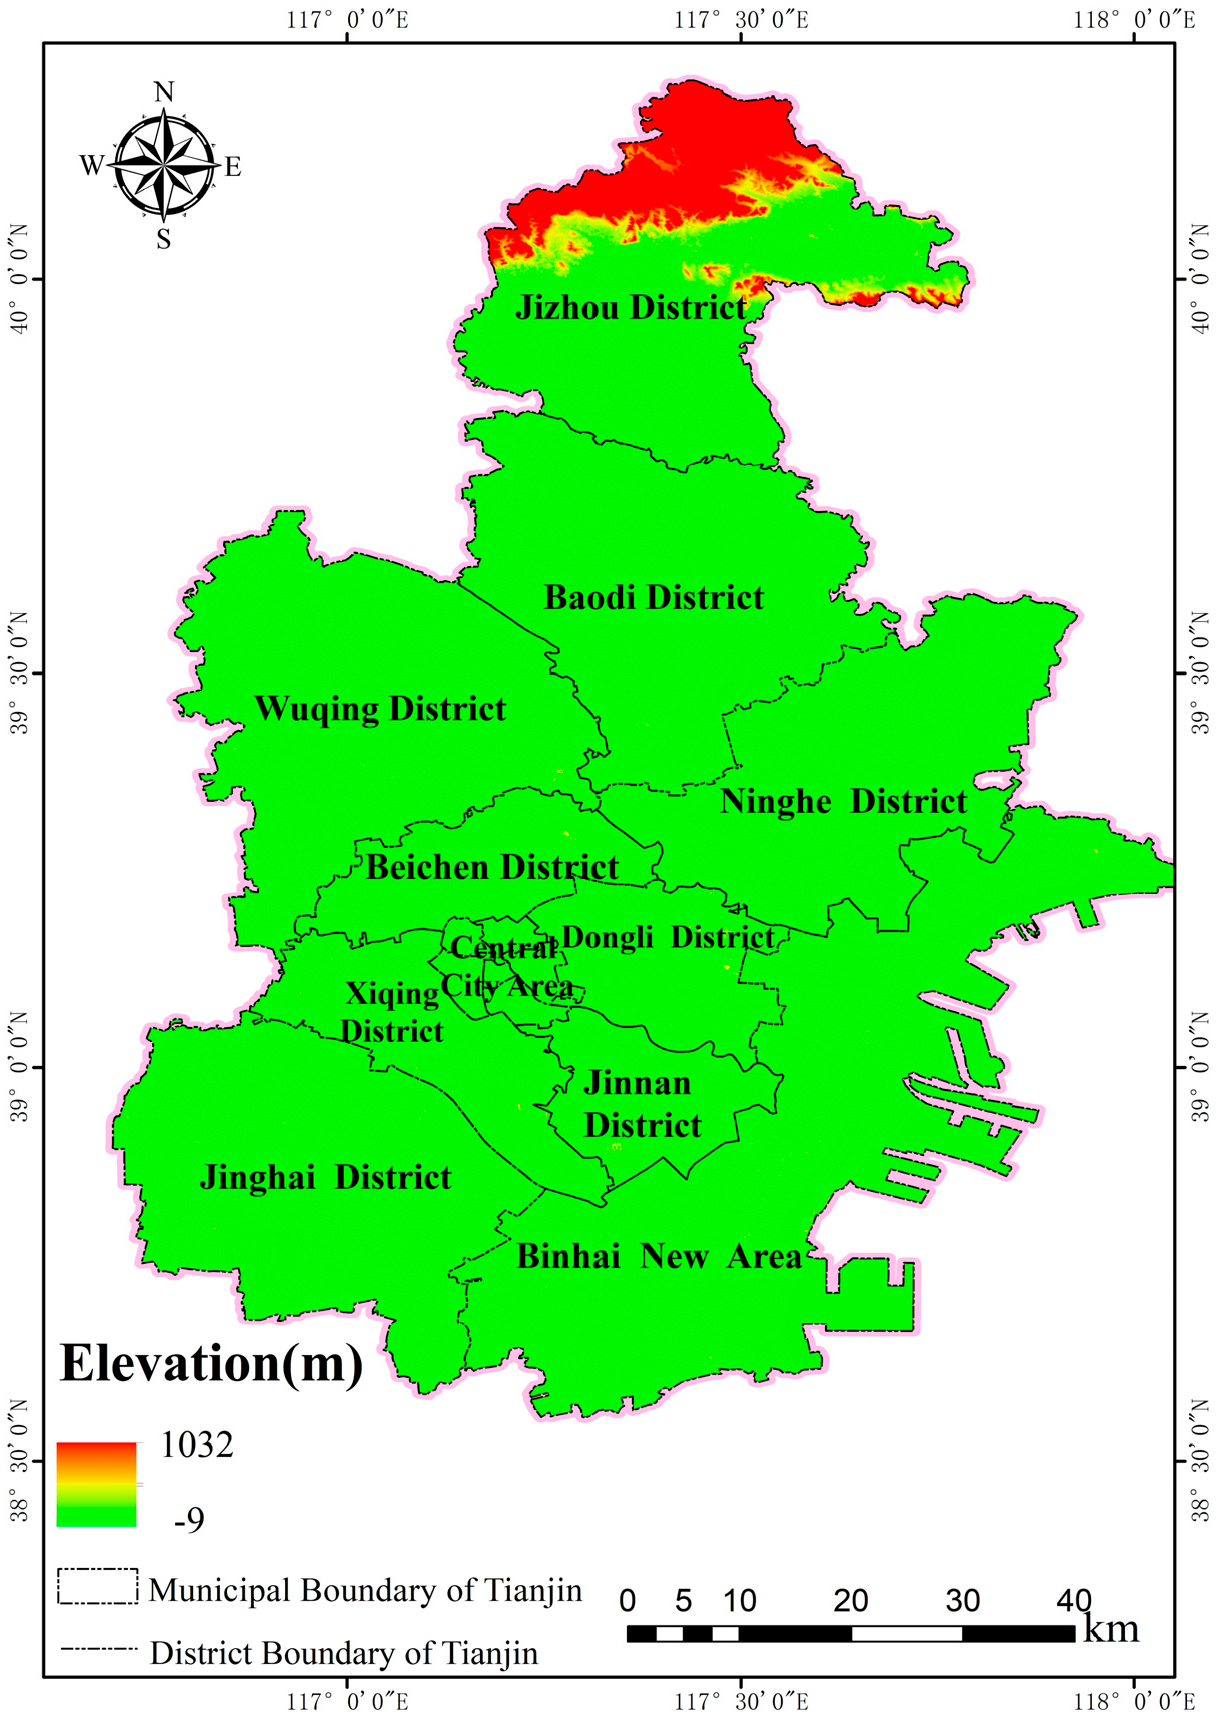
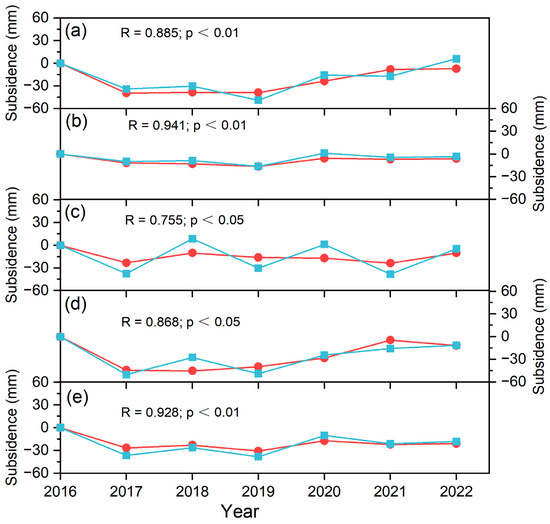
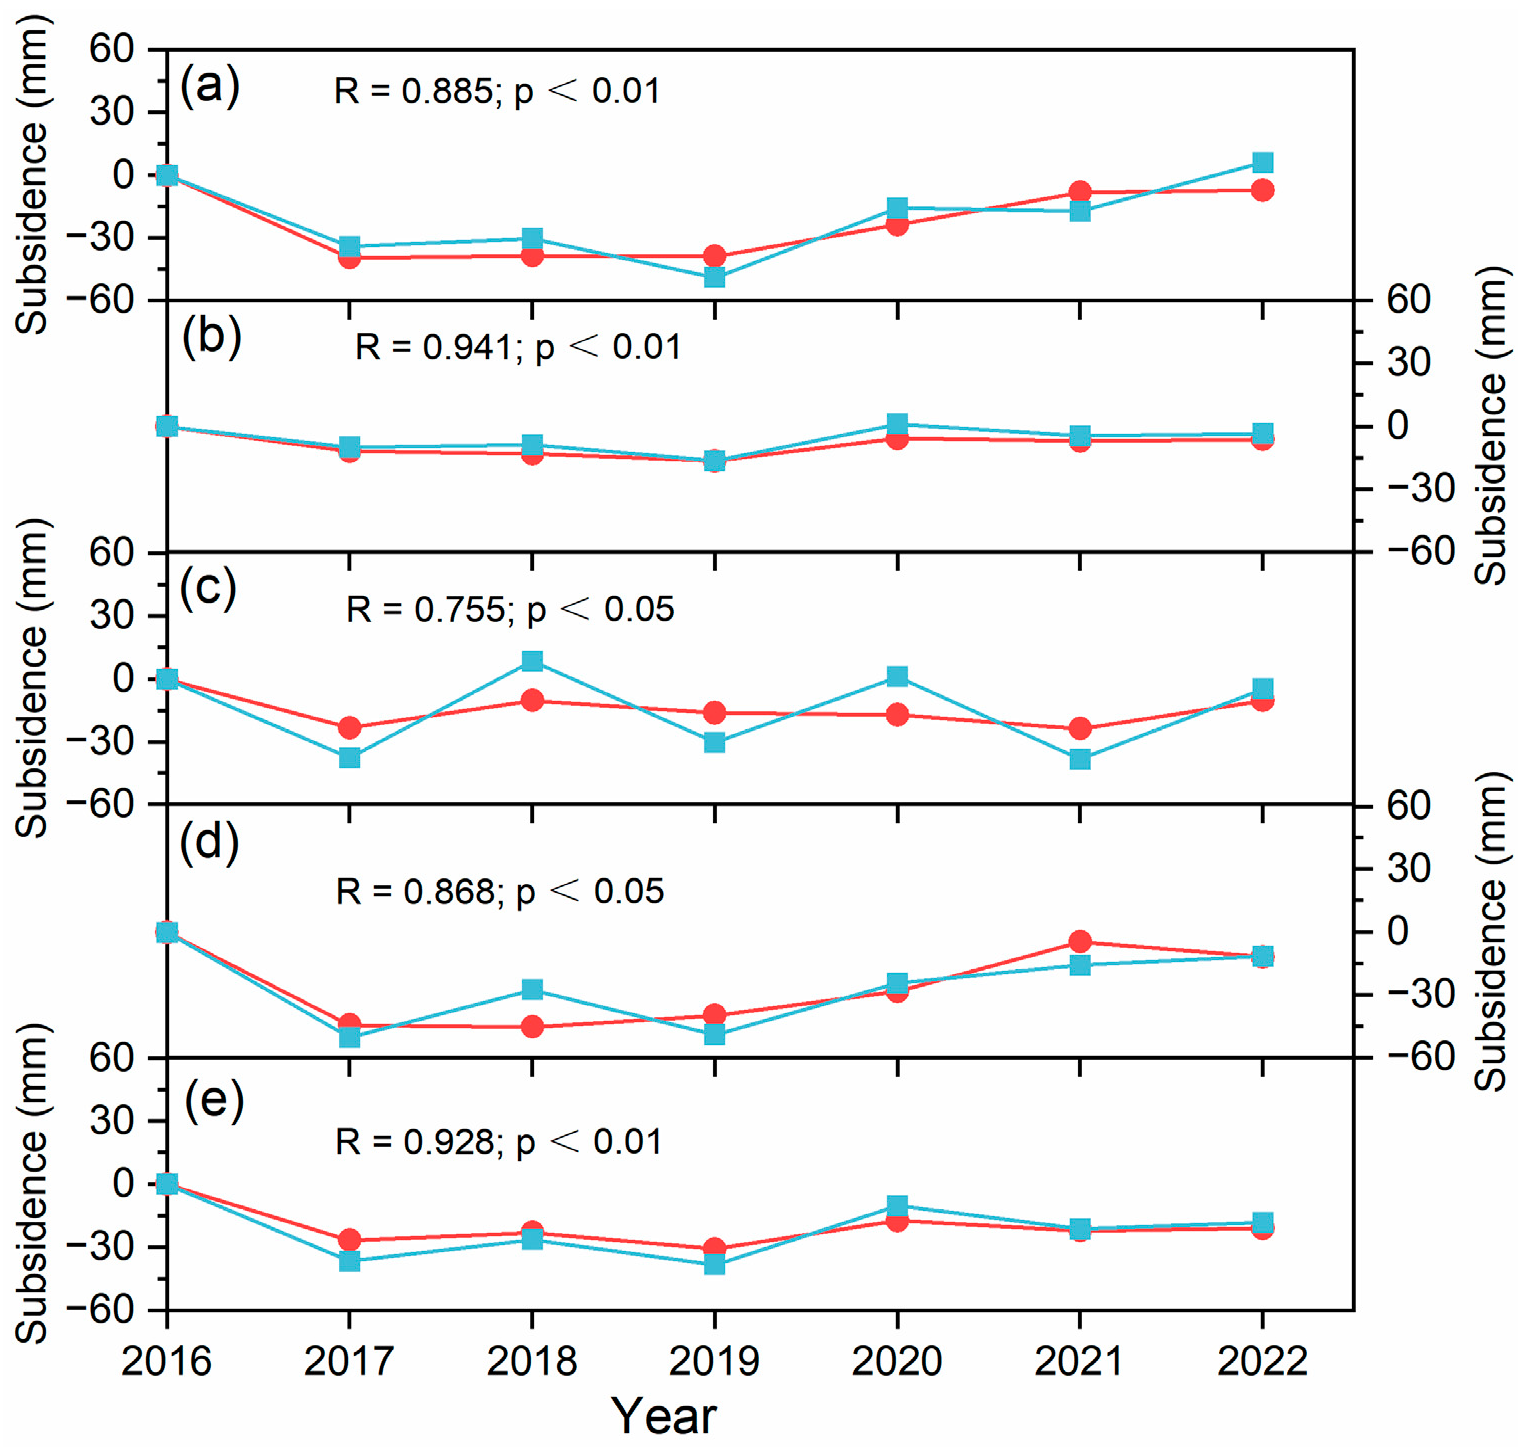
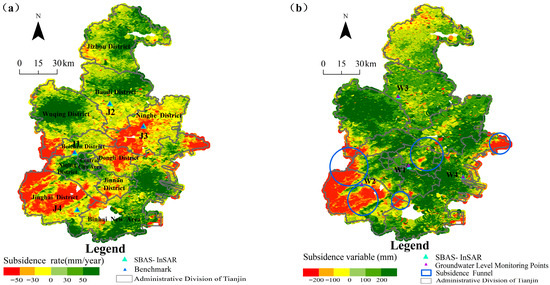
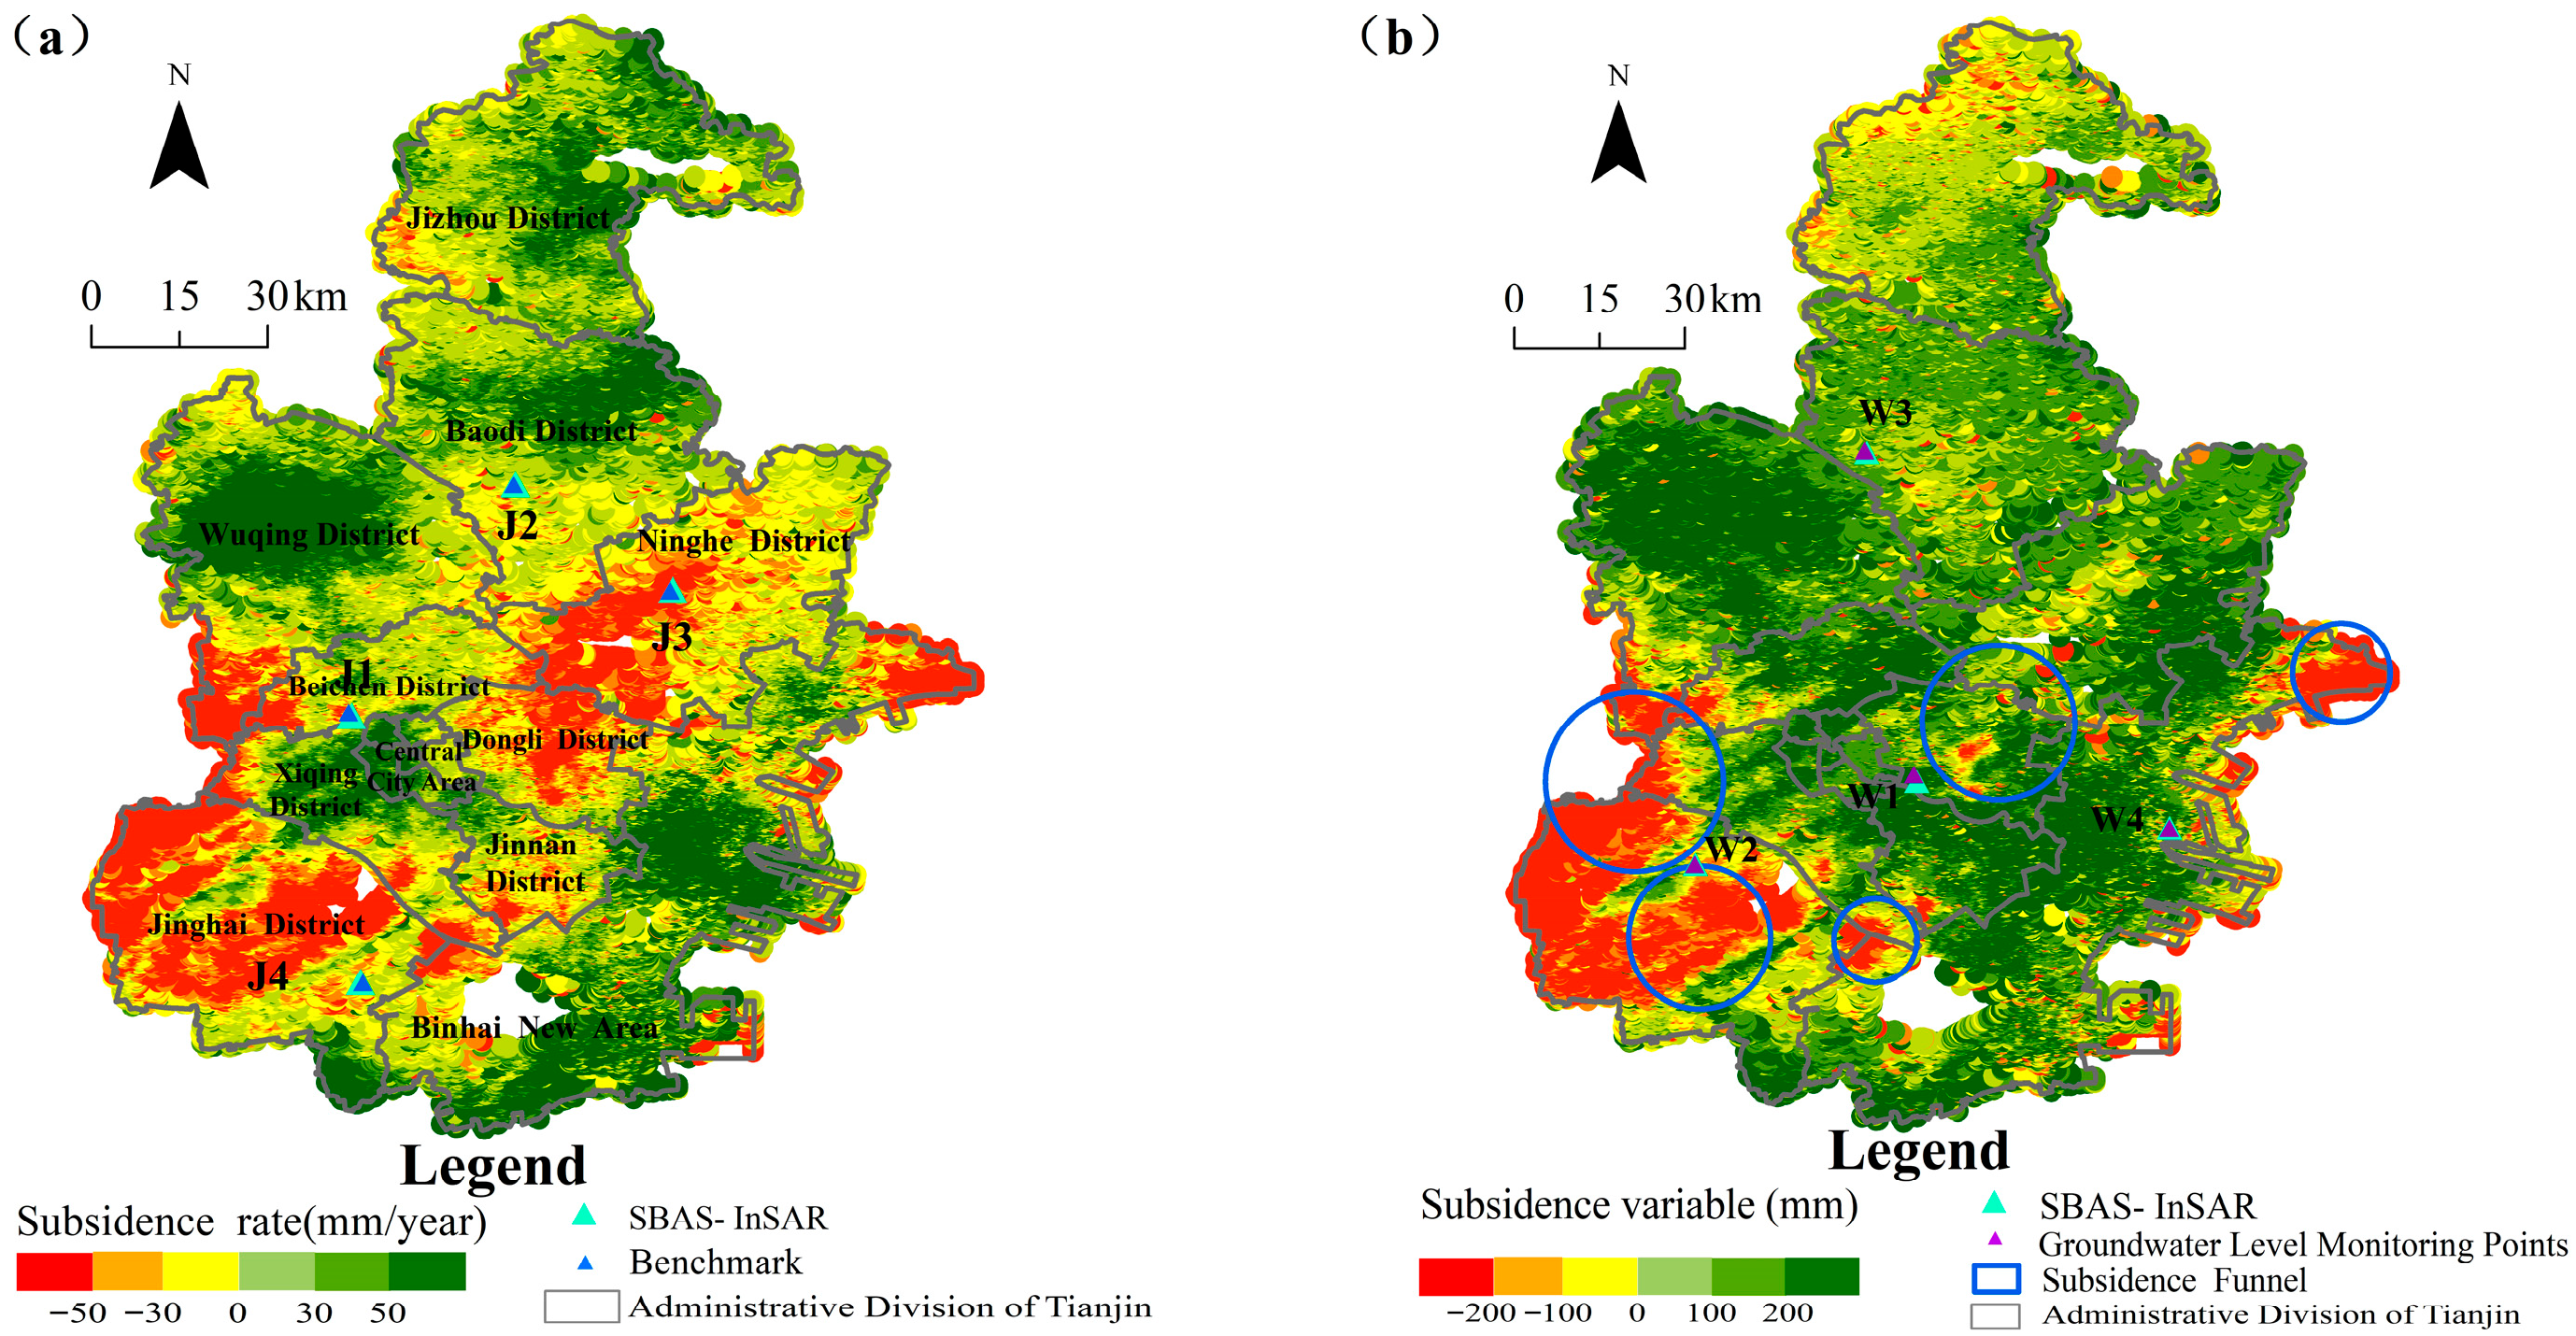
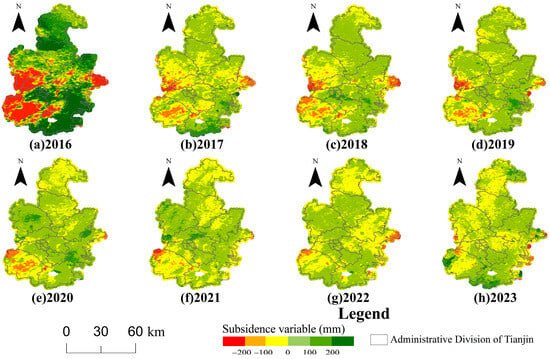
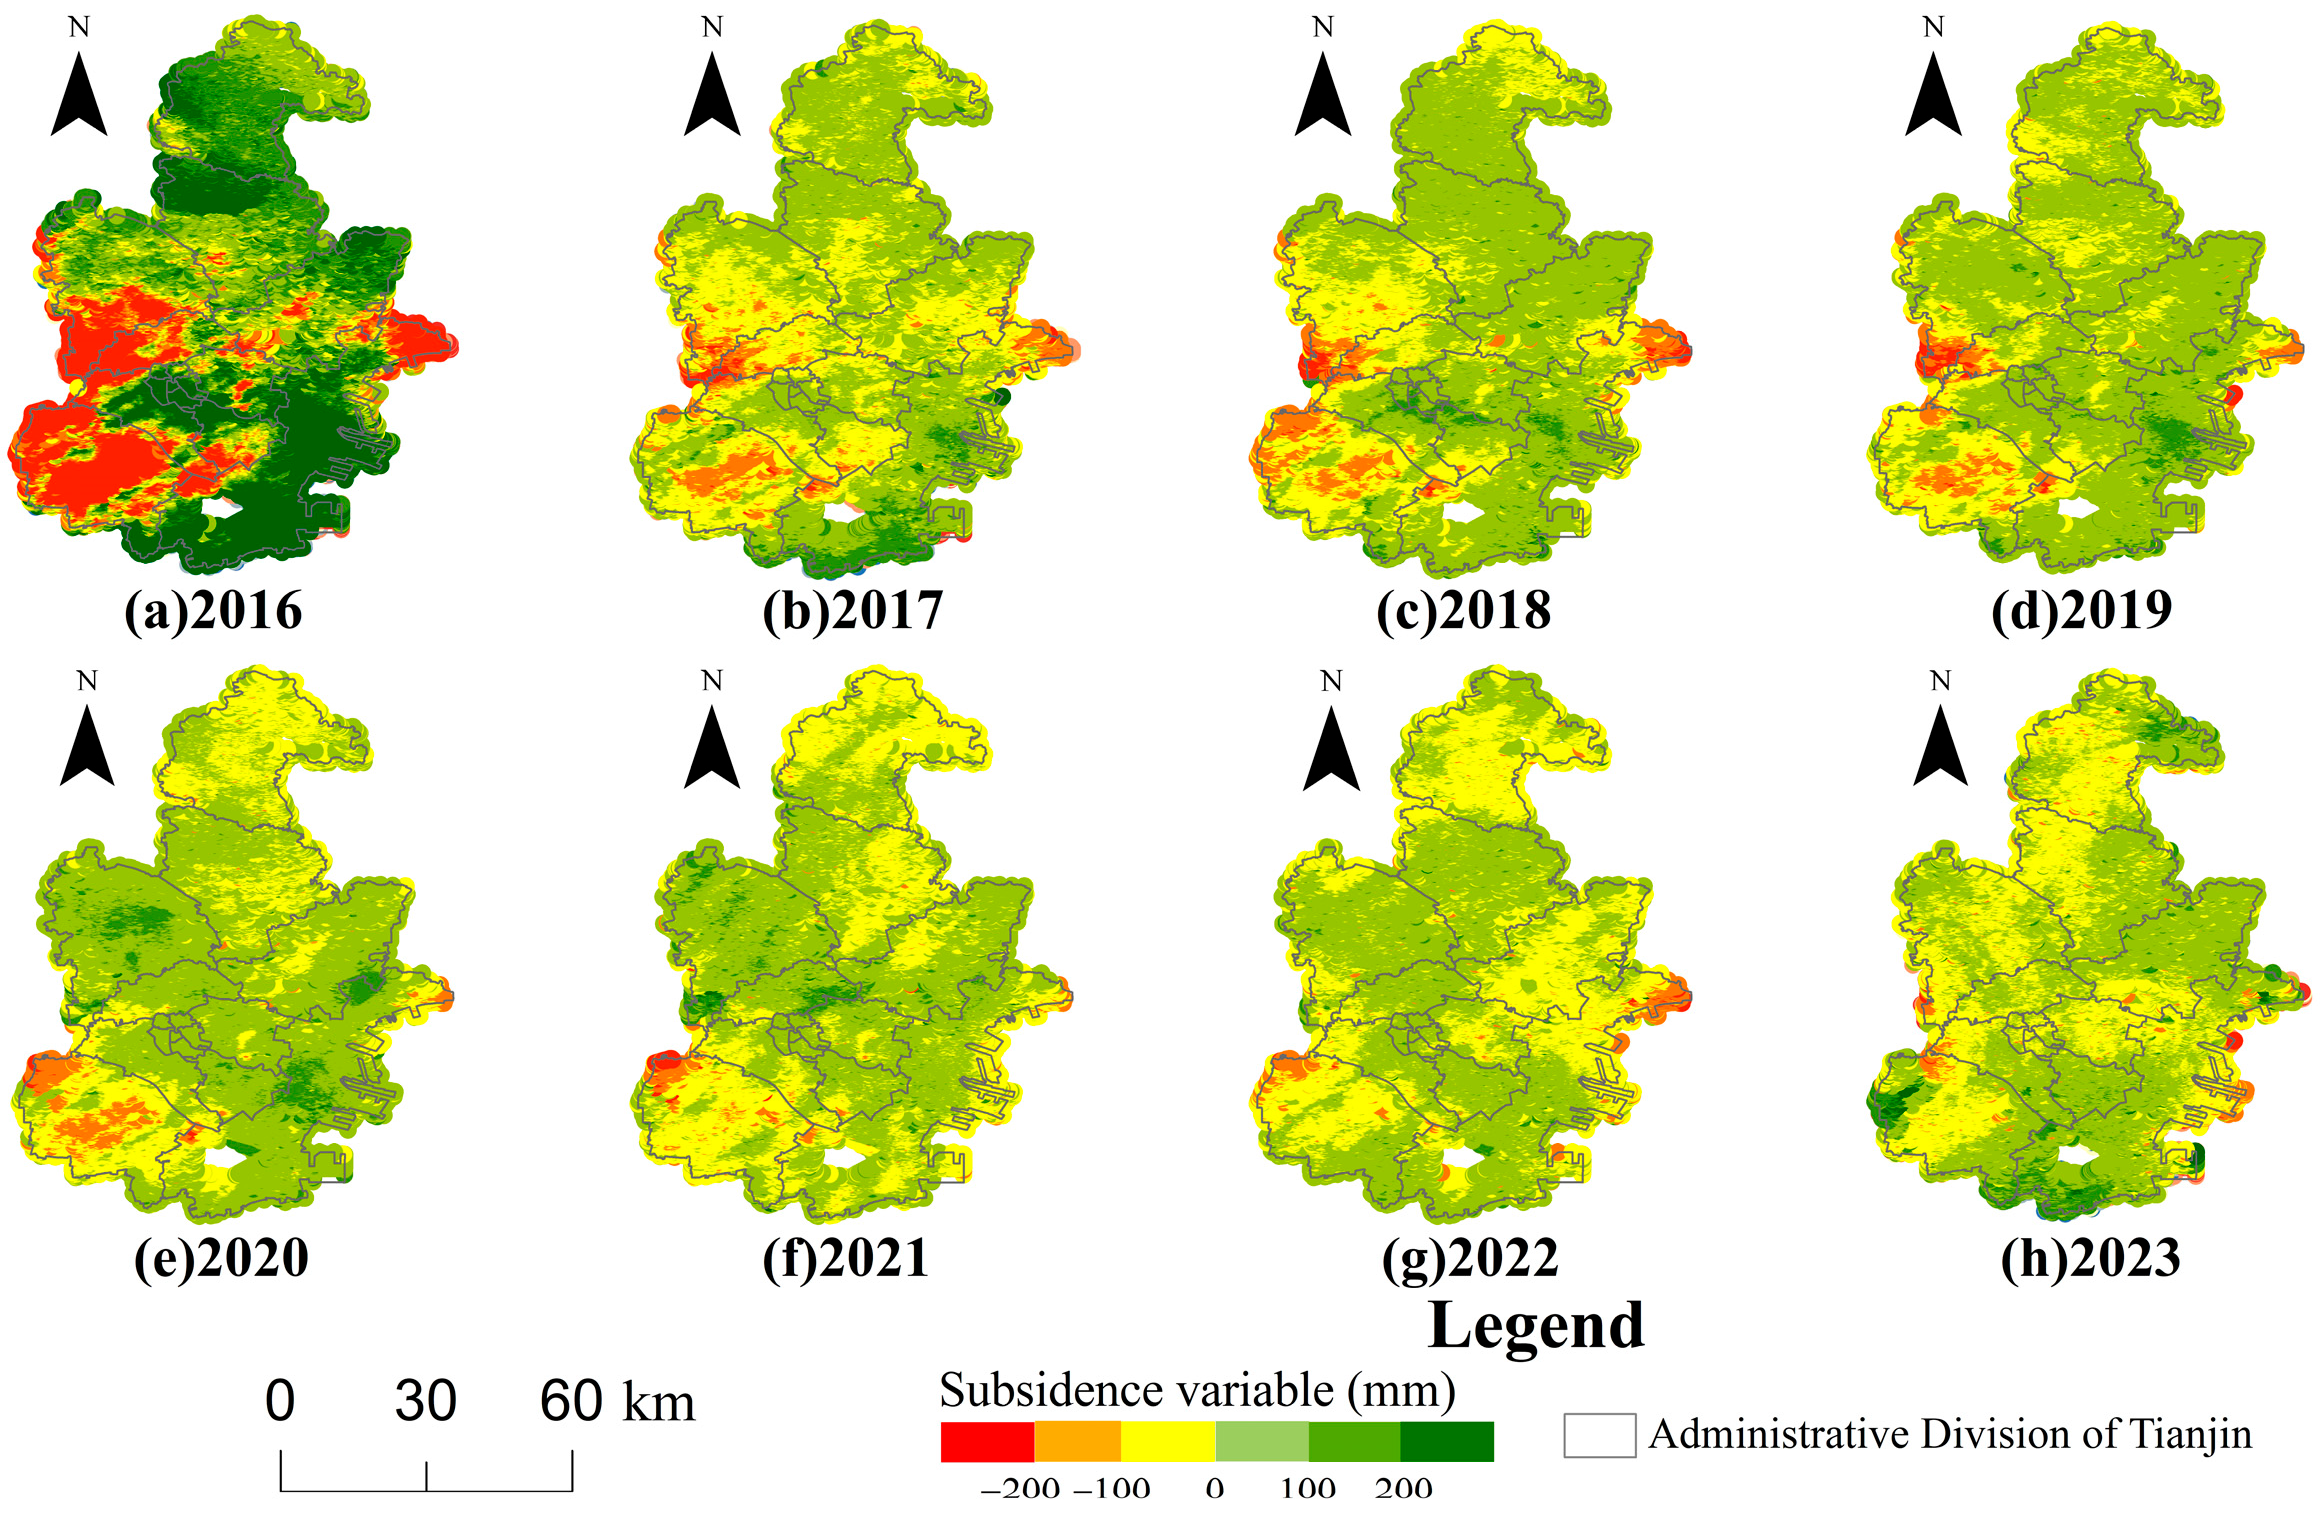
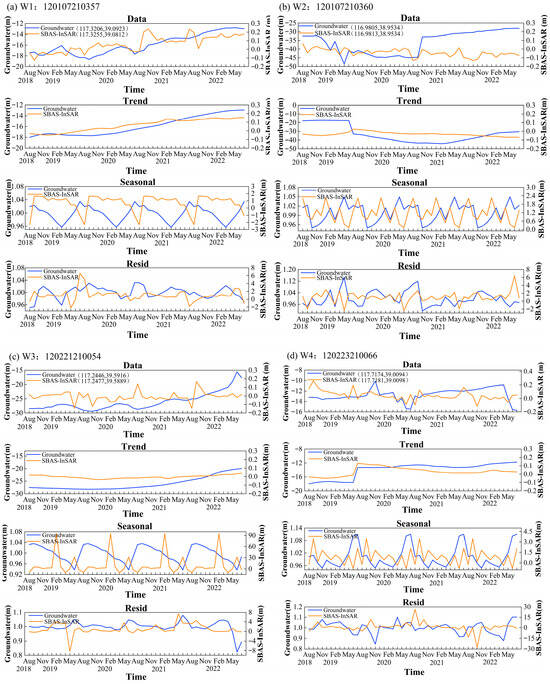
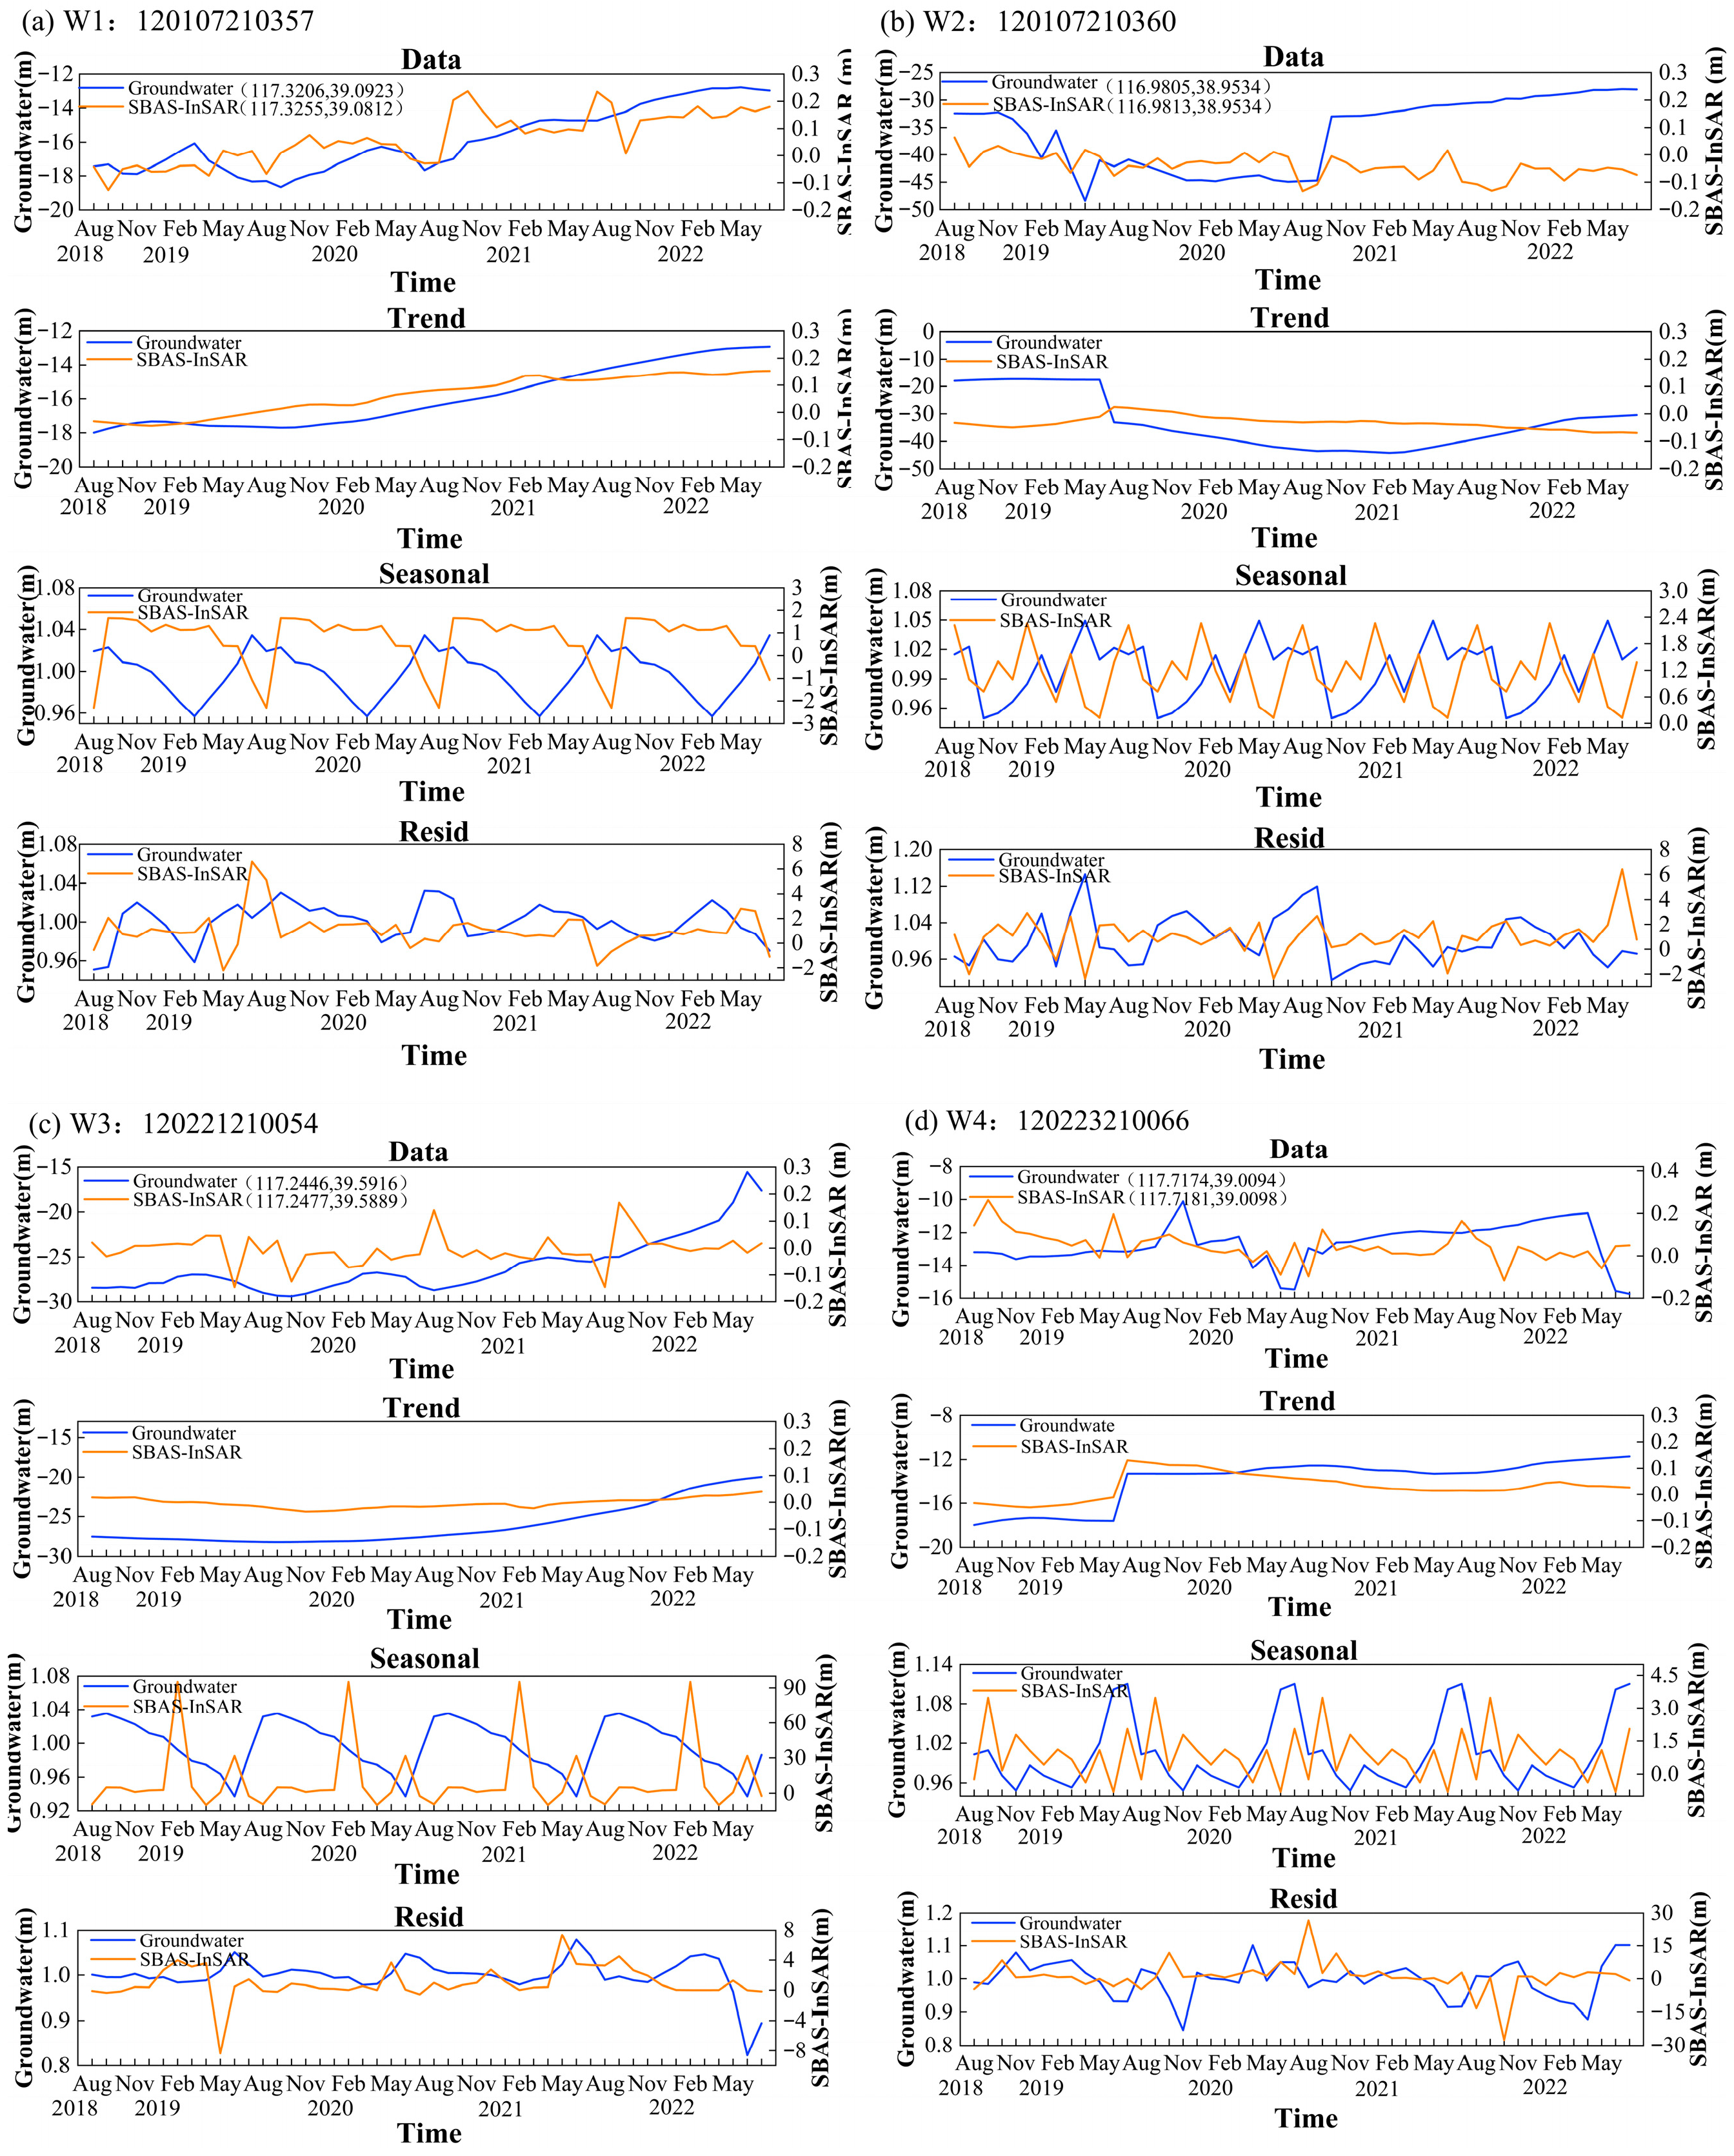
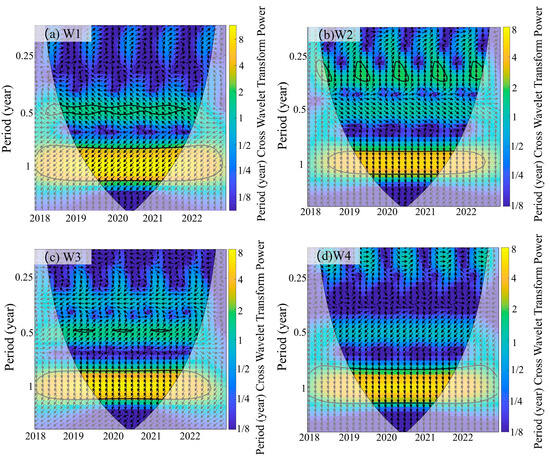
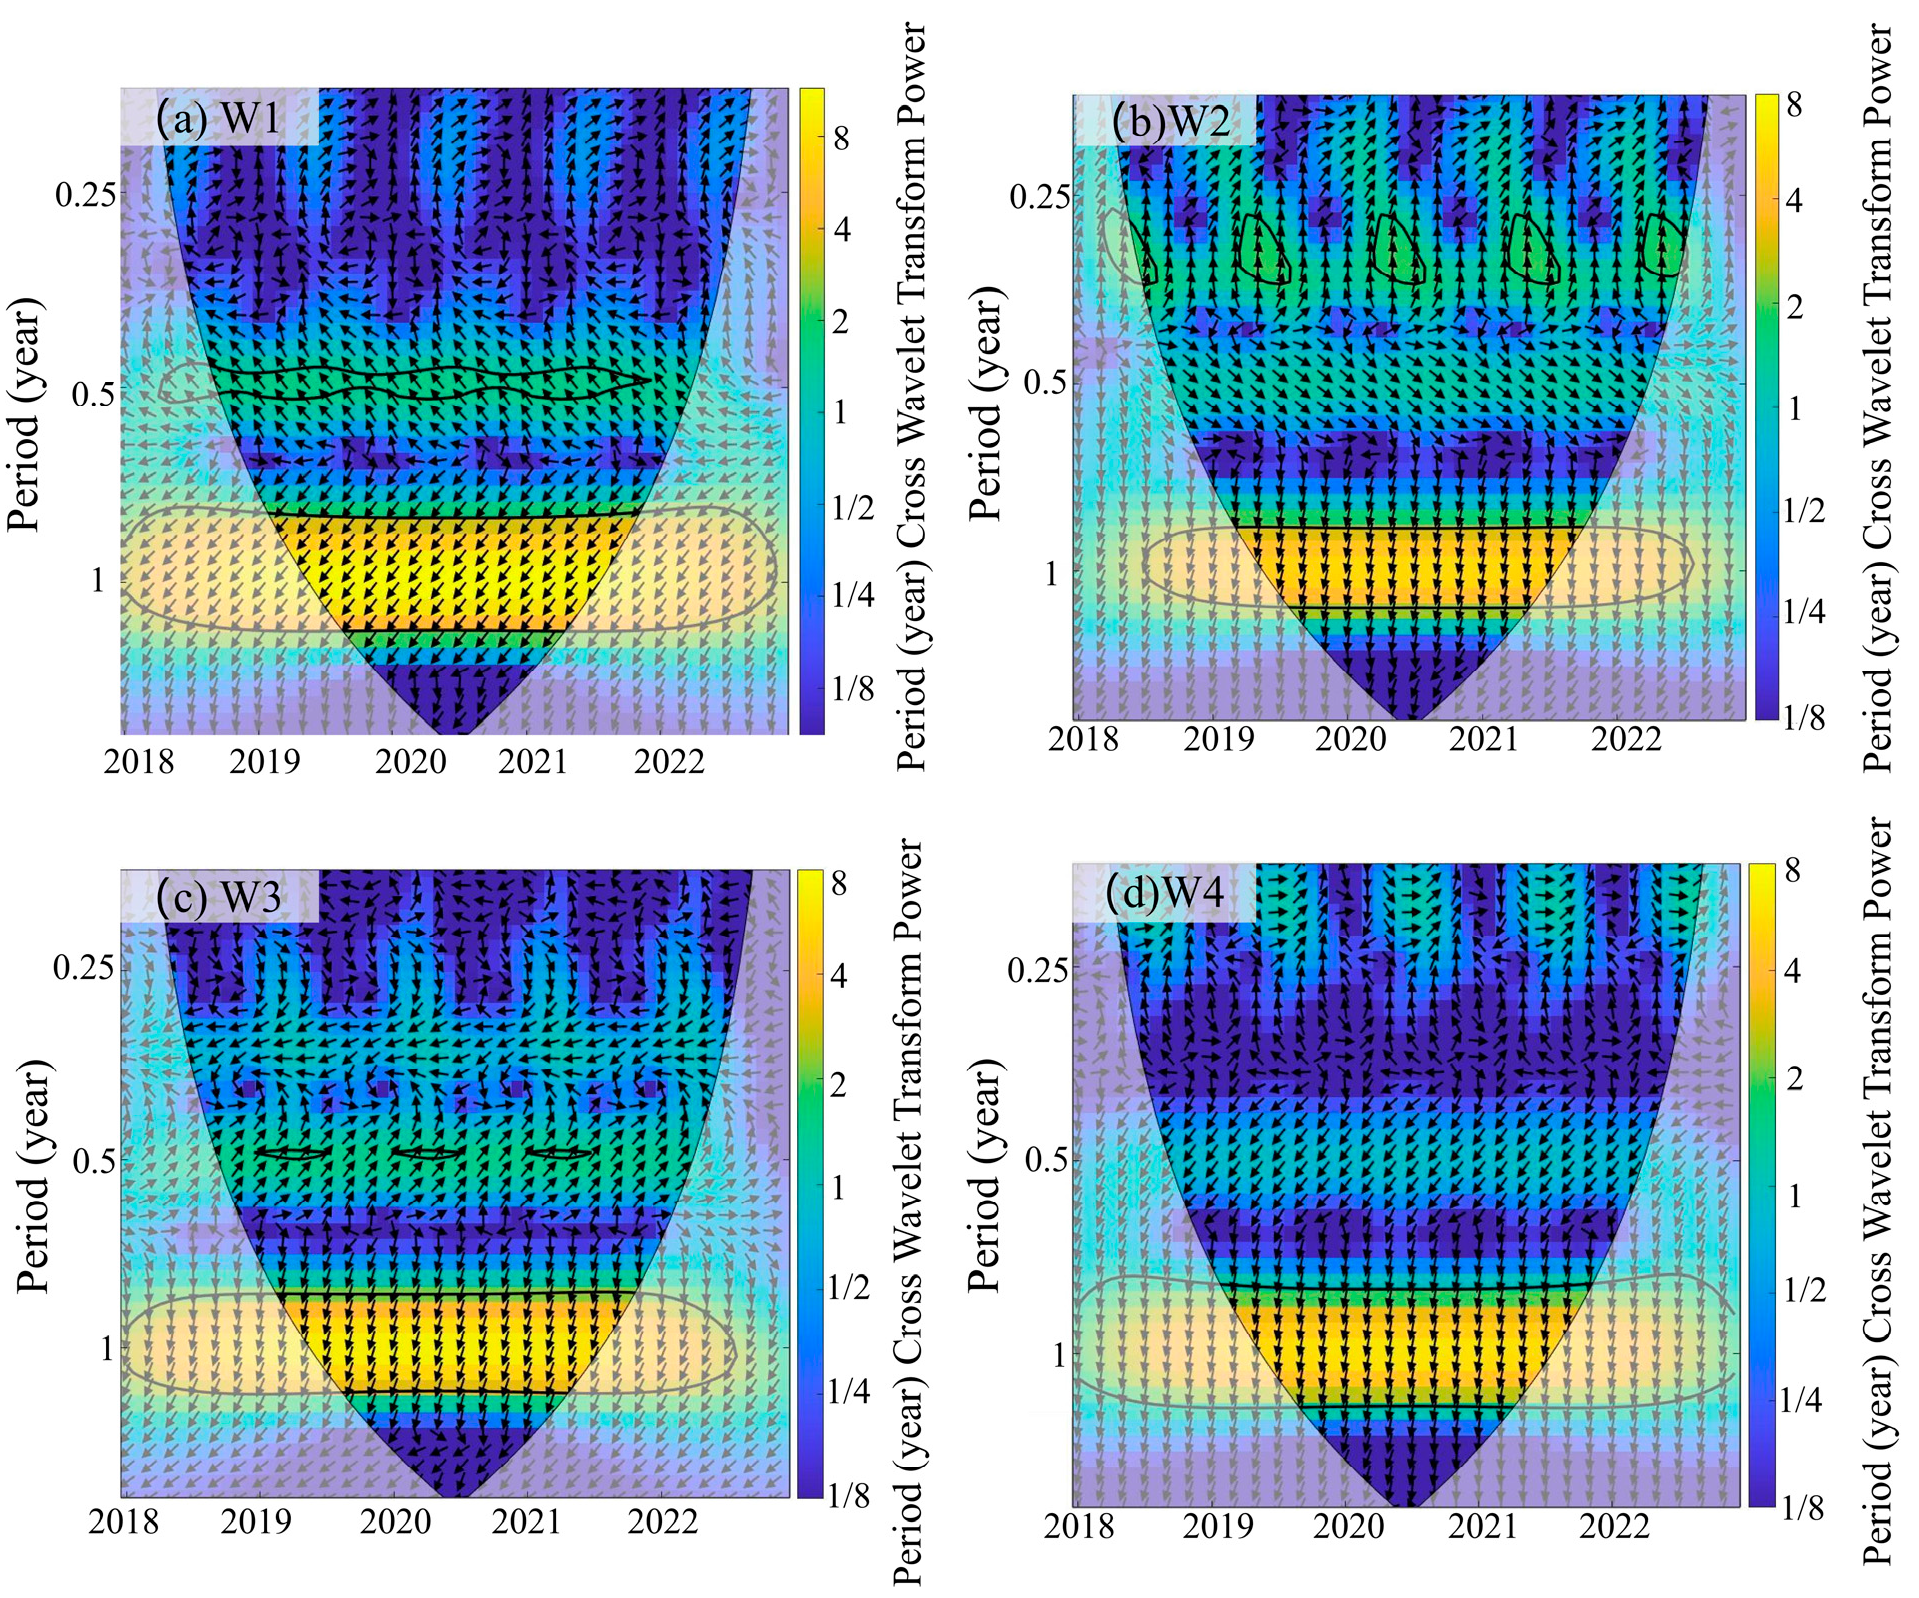
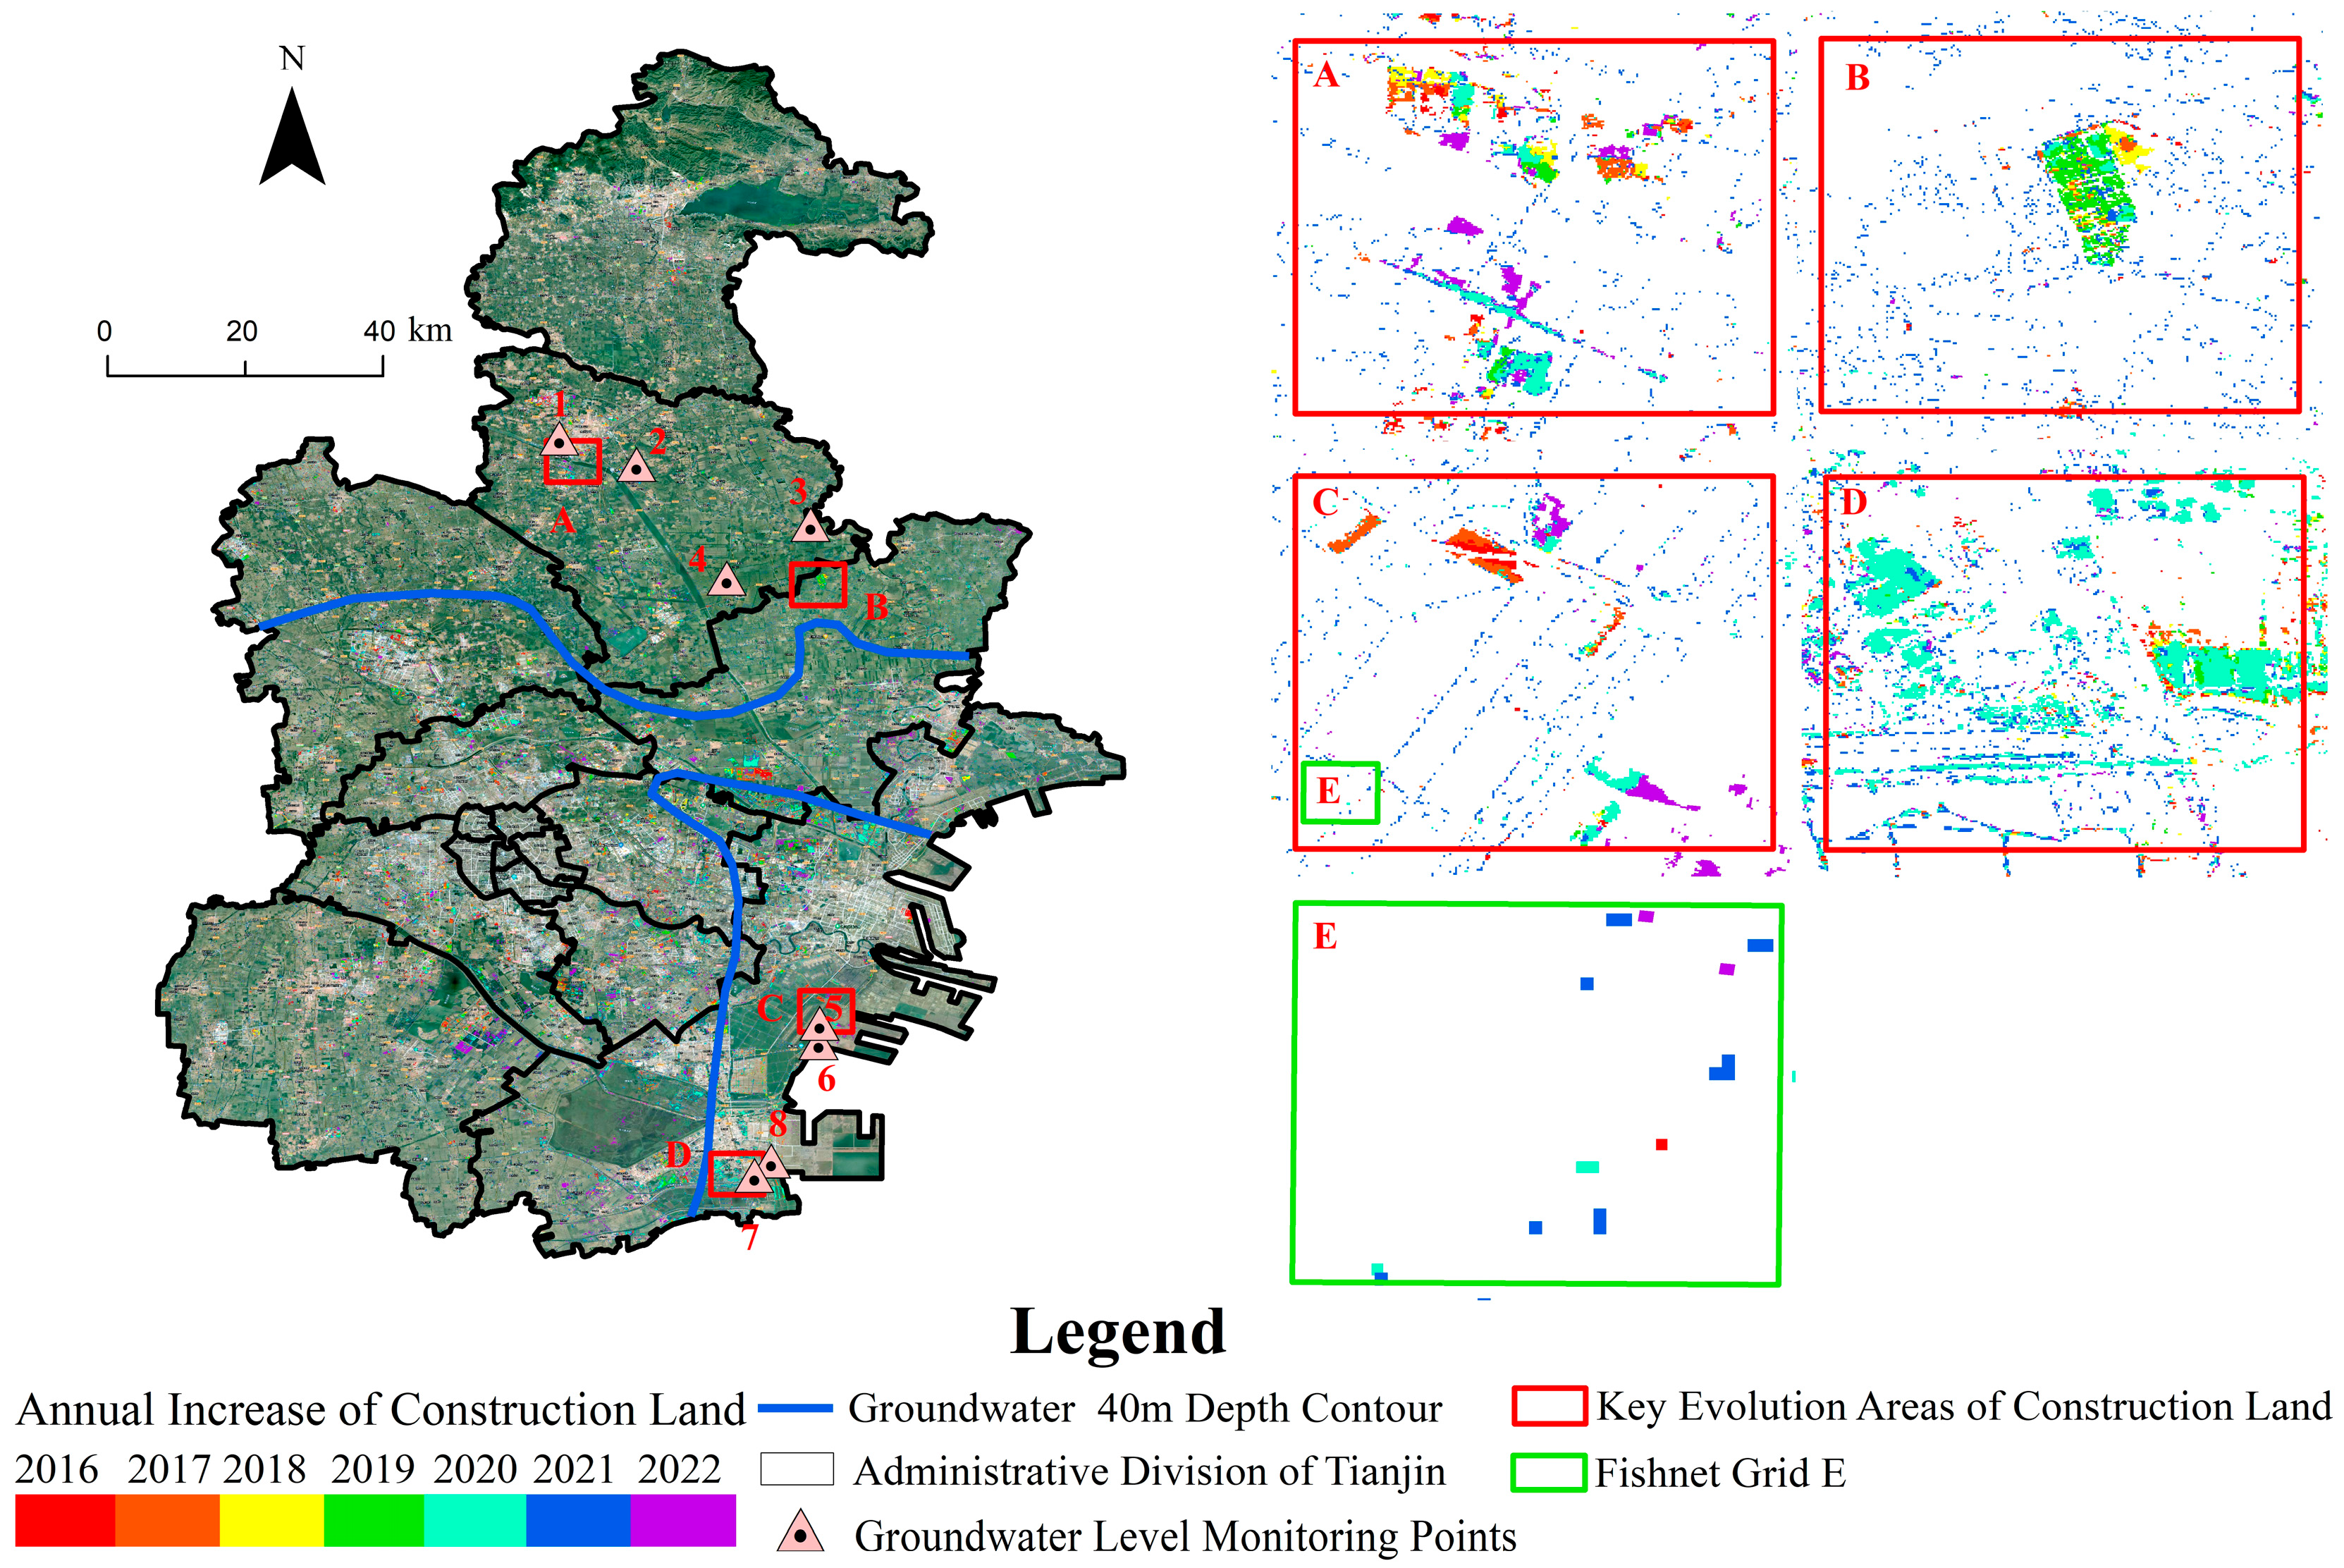
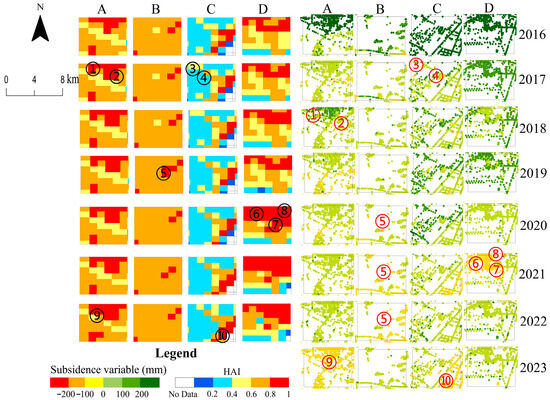
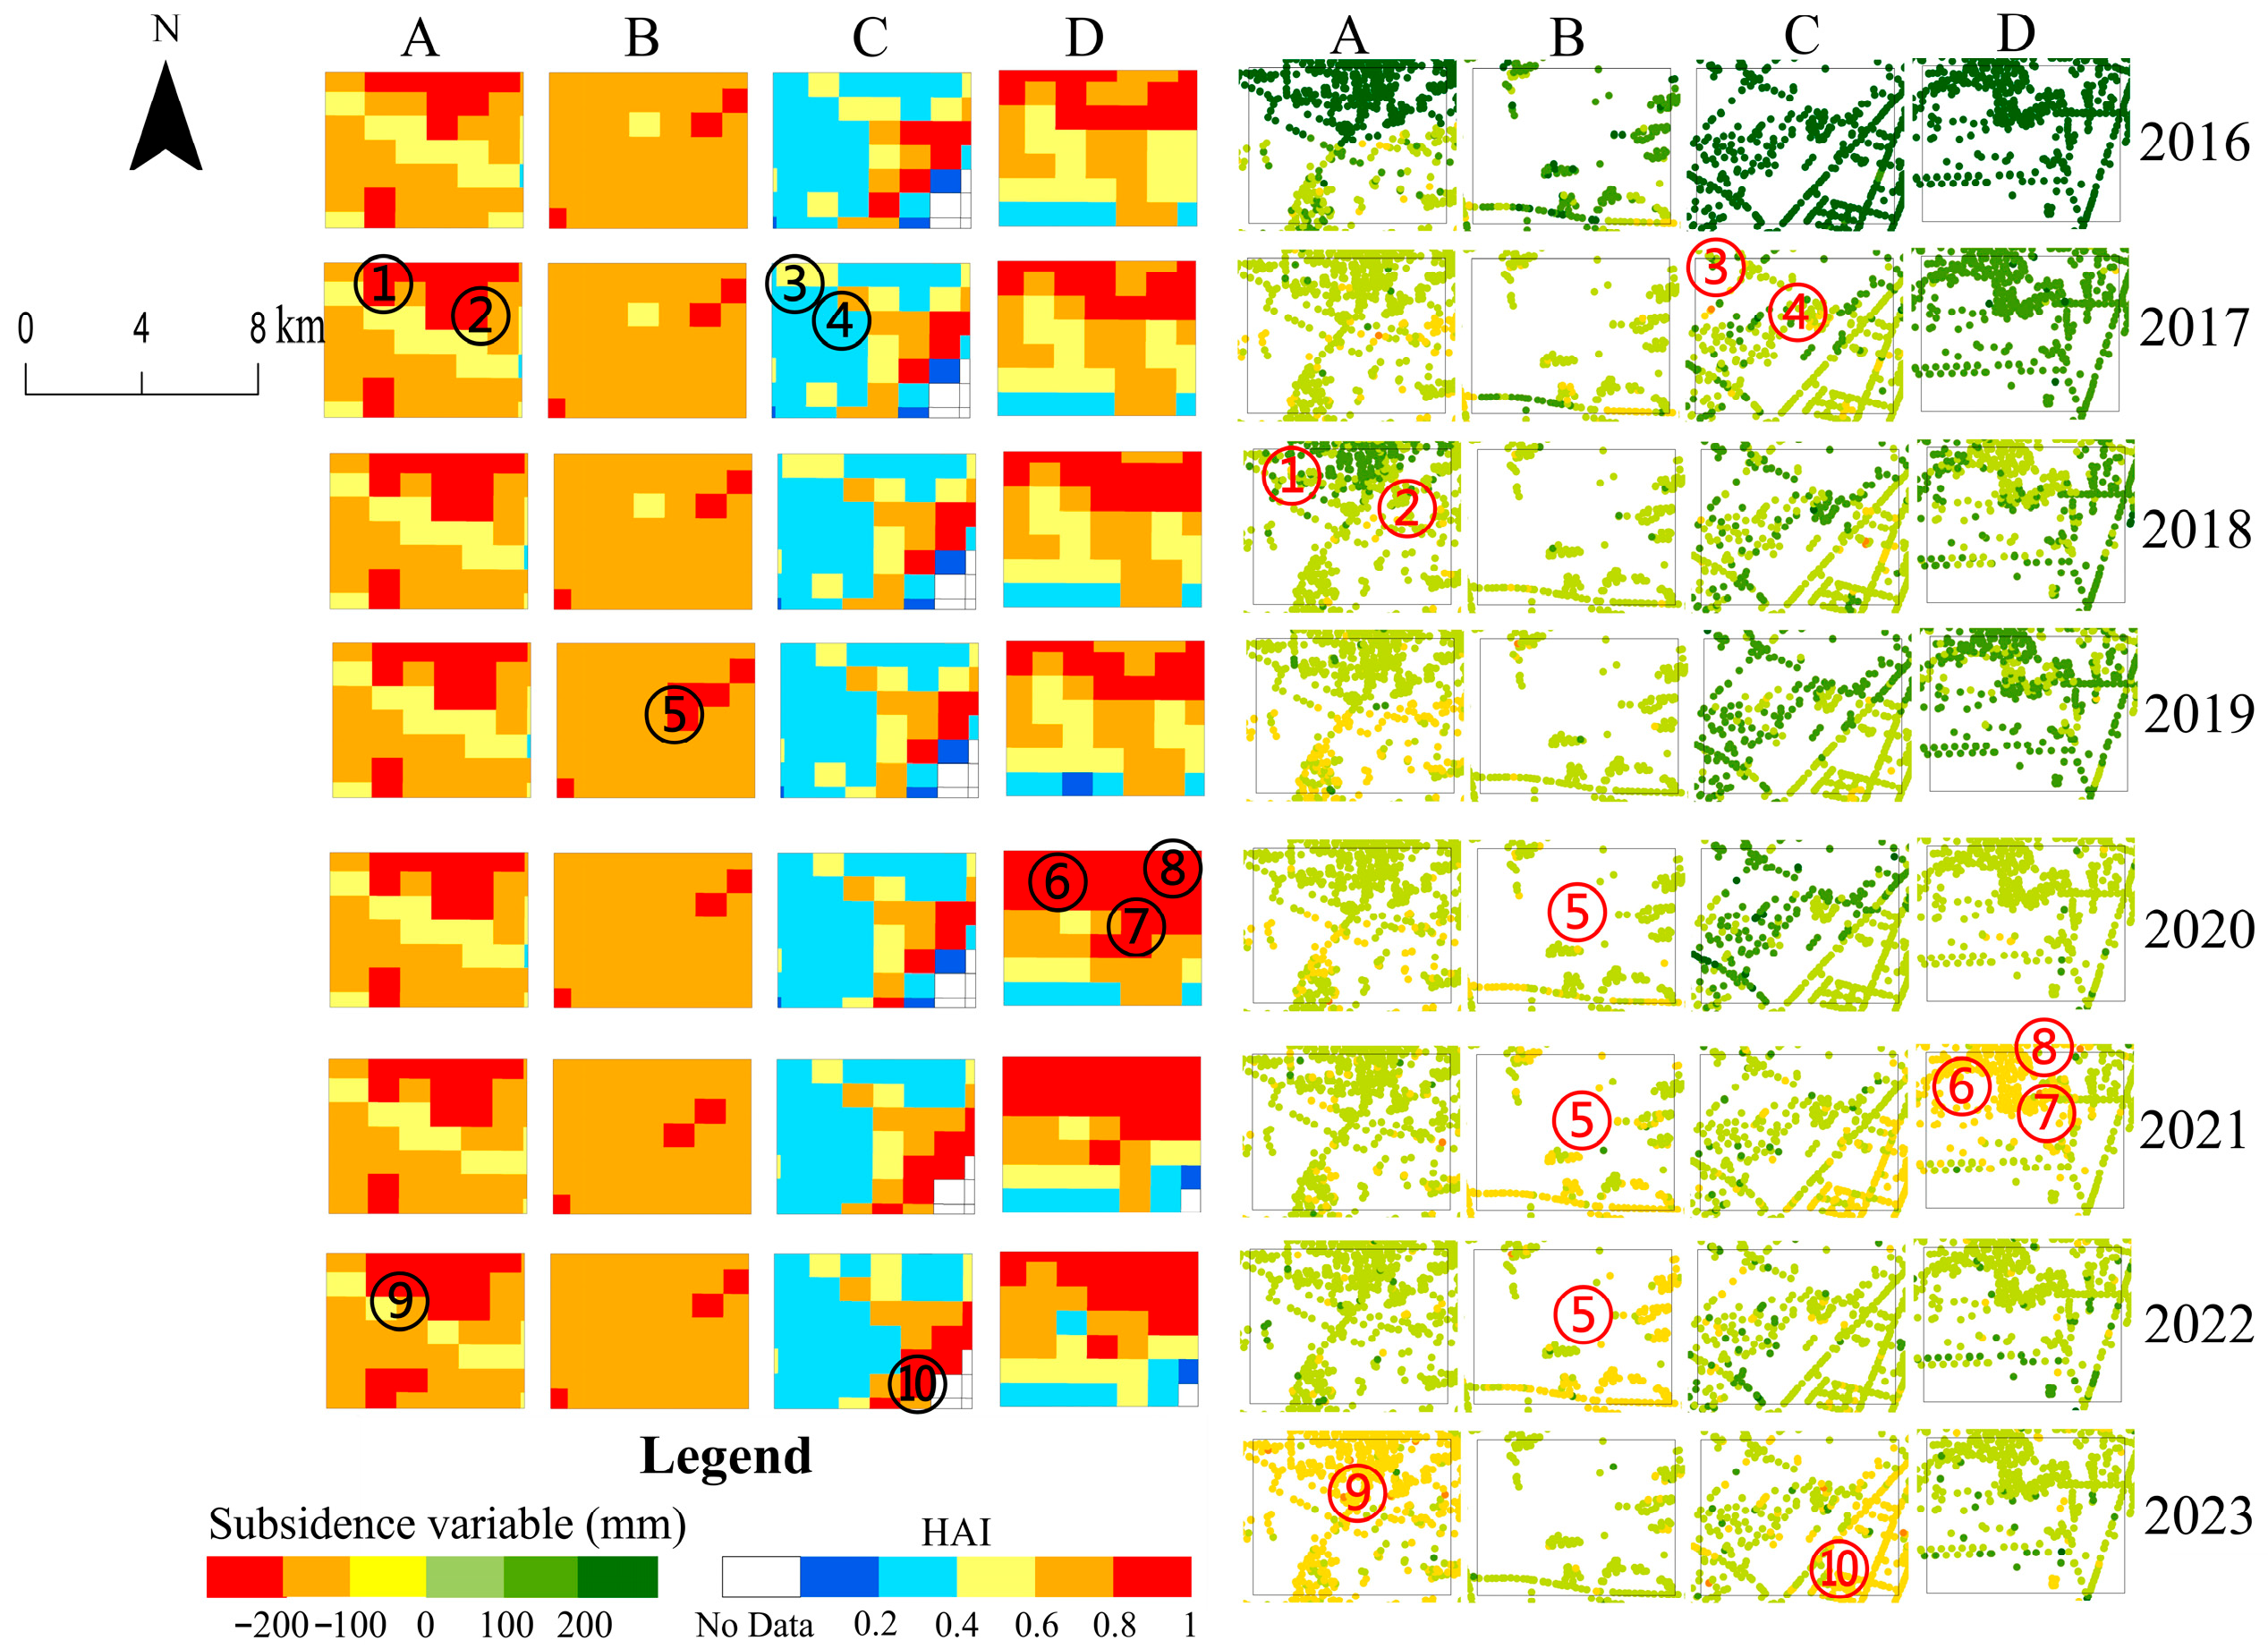

Disclaimer/Publisher’s Note: The statements, opinions and data contained in all publications are solely those of the individual author(s) and contributor(s) and not of MDPI and/or the editor(s). MDPI and/or the editor(s) disclaim responsibility for any injury to people or property resulting from any ideas, methods, instructions or products referred to in the content. |
© 2026 by the authors. Licensee MDPI, Basel, Switzerland. This article is an open access article distributed under the terms and conditions of the Creative Commons Attribution (CC BY) license.