Abstract
The Jurassic reservoirs in the Fukang Sag of the Junggar Basin exhibit heterogeneous overpressure. As the mechanisms underlying overpressure generation remain poorly constrained, this poses challenges for accurate pre-drilling-pressure prediction and hinders a comprehensive understanding of hydrocarbon accumulation processes. Through integrated analysis of measured pressure, mud weight, and well-logging curves, this study delineates distinct overpressure characteristics in sandstones and identifies the well-logging response to overpressure in mudstones. By coupling the loading-unloading response with the analysis of geological conditions conducive to overpressure, we differentiate the overpressure-generating mechanisms between sandstones and mudstones and assess their implications for deep petroleum exploration. The study reveals significant vertical heterogeneity in pressure regimes, with sandstones exhibiting pressure coefficients ranging from 1.2 to 1.8, locally exceeding 2.1. Strong overpressure preferentially develops in isolated sand bodies linked to deep source kitchens via oil-source faults. The logging response of overpressured mudstones shows high acoustic transit time, high neutron, and low resistivity, deviating from the normal compaction trend, yet demonstrates progressive density increases attributable to chemical compaction processes. Overpressure points with pressure coefficients between 1.2 and 1.4 align with the loading curve dominated by disequilibrium compaction. The overpressure with a pressure coefficient exceeding 1.4 correlates with abrupt unloading responses indicative of fault-transferred overpressure in sandstones. Our results highlight that overpressured fluid migration via faults is a critical process in hydrocarbon migration, with large-magnitude overpressured reservoirs being readily formed near oil-source faults. Multi-overpressure mechanisms create a complex pore-pressure distribution in deep layers, challenging conventional pressure-prediction models. These insights advance predictive models for pore pressure and provide a robust framework for optimizing exploration strategies in the Fukang Sag.
1. Introduction
Abnormally high pressure (overpressure) plays a dual role in hydrocarbon exploration and development [1,2,3,4]. On one hand, overpressure creates favorable conditions for hydrocarbon accumulation and preservation. The elevated energy gradients within the overpressured reservoirs significantly enhance hydrocarbon migration efficiency and contribute to economically viable resource extraction [5,6]. On the other hand, such abnormal pressure introduces substantial operational challenges, necessitating sophisticated engineering solutions to ensure safe, fast drilling, prevent formation damage, and enable efficient development during high-pressure operations [7,8]. Thus, identifying the mechanisms of overpressure generation and clarifying its diagnostic characteristics are crucial for accurately predicting its distribution and properly understanding its significance in the hydrocarbon accumulation process.
Recent years have witnessed remarkable progress in the qualitative identification, quantitative evaluation of overpressure mechanisms, and prediction methods of pore pressure [9,10,11]. Overpressure in mudstones commonly results from disequilibrium compaction and fluid expansion (notably gas generation), whereas in sandstones it is predominantly influenced by pressure transfer [1,9]. New overpressure mechanisms have been proposed, such as thermally activated chemical compaction in mudstones, which have emerged as dominant contributors to overpressure formation and preservation in deep burial conditions [12,13]. Strong tectonic compression leading to horizontal compaction has demonstrated pronounced influence on overpressure generation within foreland basins [14,15]. Fault-proximal regions frequently exhibit anomalous pressure, characterized by elevated pore pressures in permeable strata compared with adjacent low-permeability units (Figure 1), which is termed fault-transferred overpressure [16,17,18]. Distinct rock physical property signatures arising from different overpressure mechanisms, manifested through differential effective stress regimes and rock property responses, have established critical identification criteria for overpressure mechanism discrimination [19]. The cross-plot for determining overpressure mechanisms based on loading-unloading responses has been continuously improved and successfully applied in the qualitative analysis of overpressure mechanisms across various geological settings [20,21,22].
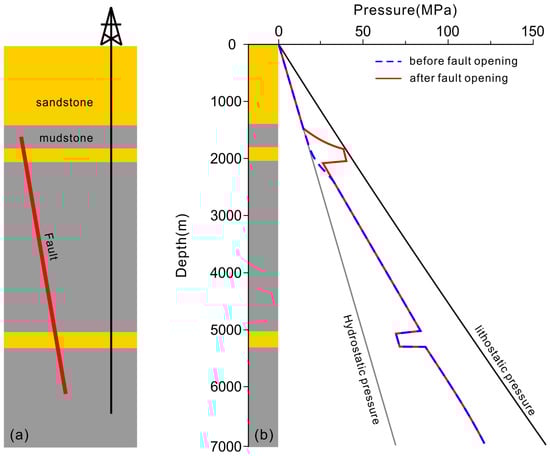
Figure 1.
The characteristics of the fault-transferred overpressure. (a) Profile and position of the fault. (b) Simulated pressures before and after fault opening.
The Fukang Sag in the Junggar Basin has encountered Jurassic reservoirs with abundant oil and gas resources, where overpressure is widespread. Further studies reveal a close relationship between hydrocarbon distribution and overpressure [23,24]. In recent years, with continuous advances in hydrocarbon exploration, the understanding of overpressure in the deep and ultra-deep layers of the Fukang Sag has deepened. Research has been conducted on current pressure fields, well-logging responses to overpressure, paleo-pressure reconstruction, and relationships between overpressure and hydrocarbon accumulation [25,26,27]. However, consensus has not yet been reached on the generation mechanisms of overpressure in the Jurassic formations [28,29]. Identification signal for overpressure mechanisms and geological conditions for overpressure generation remains insufficiently studied. And researchers have not analyzed the nature of the overpressure mechanism using rock-property–vertical-effective-stress cross-plots. Different overpressure generation mechanisms exhibit distinct relationships with hydrocarbon reservoir formation and distribution, leading to variations in accumulation patterns and enrichment regularities [30]. Overall, uncertainties regarding overpressure-generating mechanisms in the Fukang Sag not only affect the accuracy of pore-pressure prediction but also limit in-depth understanding of hydrocarbon accumulation.
In this study, we conduct a comprehensive analysis of measured pressure, mud weight, and well logs to characterize pore-pressure distribution patterns in sandstone and identify mudstone overpressure logging responses. Through an integrated investigation of the relationships between overpressure logging responses and vertical effective stress, combined with analyses of geological conditions for overpressure generation, we discuss the generation mechanisms of overpressure in both sandstone and mudstone intervals. The research further explores the implications of differential overpressure-generating mechanisms for understanding the hydrocarbon accumulation process and improving the accuracy of pore-pressure prediction.
2. Geological Setting
The Junggar Basin is a multi-cycle superimposed basin that evolved from the Late Paleozoic through the Mesozoic to the Cenozoic [31], which is the second-largest basin in northwestern China (Figure 2a). The basin has undergone six evolutionary stages, including the Carboniferous fault depression-depression, the Permian fault depression, the Middle Permian and Triassic foreland basin, the Jurassic extensional fault depression-compressor-shear basin, the Cretaceous–Paleogene intra-continental depression, and the Neogene–Quaternary intra-continental foreland basin [32]. The Fukang Sag in the Junggar Basin, which overlies the Carboniferous basement, is located in the southeastern part of the central Junggar Basin. To the north, it neighbors the Mosuowan Uplift and Baijiahai Uplift, to the west lies the Monan Uplift, to the east it connects with the Beisantai Uplift, and to the south it adjoins the Huomatuo Anticline Belt and the Fukang Fault Zone [33]. The Fukang Sag is a secondary-order negative structural unit within the Junggar Basin, trending east–west in its lateral extent, and is generally monocline-tilted southwestwardly (Figure 2b). The sag is characterized by well-developed strike-slip faults that initiate within the Permian strata and predominantly terminate at the top of the Jurassic formation; some extend further upward into the Cretaceous formations [34].
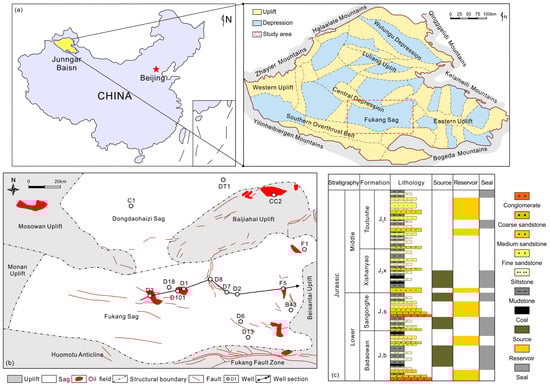
Figure 2.
(a) The map of the Junggar Basin showing the structural distribution and the location of the central Junggar Basin. (b) Schematic geological map and well distribution of Fukang Sag. (c) Generalized Jurassic stratigraphic column of the Fukang Sag (Modified from [30]).
The Fukang Sag exhibits a complete stratigraphic sequence, including the Carboniferous to the Quaternary from bottom to top [35]. Hydrocarbon shows have been found in the Jurassic, Triassic, and Permian formations, indicating significant exploration potential, with the Jurassic formation currently being the primary exploration target [28,29]. The Jurassic formation can be further divided into the lower Jurassic Badaowan formation (J1b) and Sangonghe formation (J1s), the middle Jurassic Xishanyao formation (J2x) and Toutunhe formation (J2t) (Figure 2c). The Upper Jurassic Qigu Formation (J3q) and Kalazha Formation (J3k) have been eroded in the Fukang Sag and are exposed on the northwest and southern edges of the Junggar Basin [36].
The Jurassic hydrocarbon-bearing intervals primarily occur within the J1s and J2t, with industrial oil flow production specifically identified in the J2t. Reservoir types are predominantly characterized by structural-lithologic reservoirs [36]. The J1b deposited widespread coal-bearing strata and dark mudstone, which serve as effective source rocks. Oil-source correlation studies demonstrate that the hydrocarbons in the J1s and J2t mainly originate from dark mudstones of J1b source rocks, with supplementary contributions from dark mudstones of Permian source rocks [37,38]. The source rocks and reservoir formations are not directly connected, exhibiting a fault-overpressure dual-control hydrocarbon-accumulation process [25,39]. Overpressure between the source rock and the reservoir provides migration-driving forces, oil-source rocks serve as pathways for hydrocarbon migration, and effective traps create charging spaces for accumulation [25].
3. Pore-Pressure and Logging Responses
3.1. Pore Pressure in Sandstones
The pore pressure in a permeable formation can be obtained through Drill Stem Testing (DST), representing the in situ pore pressure. In the Fukang Sag, a total of 12 wells encountered Jurassic formations, obtaining 25 pore-pressure test data between 3200 and 5500 m. The measured pressures range from 34.28 to 109.51 MPa (Figure 3a).
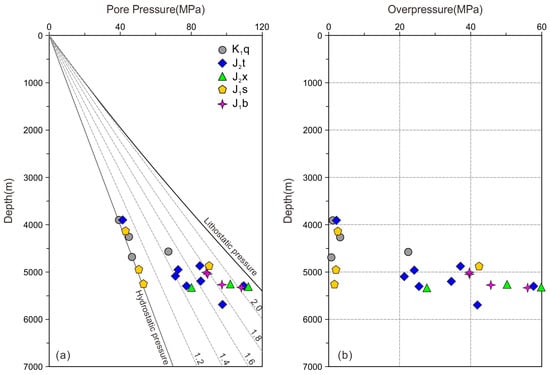
Figure 3.
(a) Plot of the measured pressure and excess pressure in Fukang Sag. (b) Plot of the excess pressure in Fukang Sag.
The pore-pressure distribution in Jurassic sandstones is highly complex. Some pressure points align along or scatter to the right of the hydrostatic pressure line (Figure 3a), reflecting variable pressure regimes across different depths. Normal pressure conditions are widely distributed over a broad depth interval of 3300–5300 m. Even within generally uniform intervals, isolated normal-pressure points are occasionally observed, illustrating the anomalous coexistence of normal and overpressured zones (Figure 3). Such normal pressure typically develops in shallow strata with relatively open hydraulic systems. However, in deeper sections, hydraulic connectivity with shallow layers via faults or other pathways can compromise seal integrity, leading to pressure dissipation and reversion to normal pressure conditions [40].
Overpressure is predominantly developed below 4200 m and in the J2t, J2s, and J1b formations. The pressure coefficients in these zones mostly range from 1.2 to 2.0, reaching a maximum of 2.1, corresponding to excess pressures of 20–50 MPa, with a maximum of 58 MPa (Figure 3b). Notably, the pressure coefficients in overpressure zones do not exhibit a systematic increase with depth. Instead, significant variation is observed at similar depths, reflecting the complex overpressure generation mechanisms in the sandstone reservoirs.
3.2. Logging Responses of Overpressure in Mudstone
Due to the extremely low permeability of mudstones, which makes it difficult to obtain reliable direct pressure measurements, well-logging responses serve as the primary dataset for evaluating the mudstone pressure state. First, mudstone intervals were identified using drilling lithology logs and interpreted clay content from well logging. Subsequently, thick and stable mudstone sections were selected from which comprehensive compaction curves were compiled, including acoustic transit time, density, neutron porosity, and resistivity. Finally, these curves were analyzed to identify and characterize the logging responses associated with overpressure.
Well D3, a deep well with comprehensive data acquisition in the Fukang Sag, was drilled to the J2s formation at a total depth of 6630 m. A measured pressure of 97.56 MPa was recorded in the J2t formation at 5484.5 m, corresponding to an excess pressure of 42.71 MPa and a pressure coefficient of 1.78. The mud weight profile shows the onset of overpressure from the Cretaceous Hutubihe formation at 4700 m, with a sharp pressure ramp observed within the J2t formation (Figure 4). Vertical variations in logging responses, displayed in the composite compaction curves (Figure 4), clearly distinguish the normal and abnormal pressure zones. Above 4700 m, acoustic transit time and neutron decrease systematically with depth, while density and resistivity increase, following normal compaction trends. In contrast, the overpressure zone below 4700 m is marked by a rightward deviation in acoustic transit time and neutron from normal compaction trends, accompanied by leftward shifts in density and resistivity, forming a characteristic signature for overpressure identification.
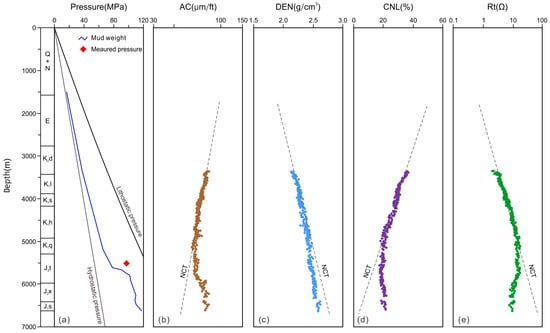
Figure 4.
Pore-pressure and comprehensive-mudstone-compaction curve of well D3 in Fukang Sag. (a) The relationship between pore pressure and depth. (b) The acoustic transit time versus depth. (c) The density versus depth. (d) The neutron versus depth. (e) The resistivity versus depth.
A comparative analysis reveals that the observed logging responses deviate from the typical patterns of disequilibrium compaction and hydrocarbon-generation overpressure. Although the density log shows a deviation from normal trends, it maintains a sustained, though reduced, increase with depth. This pattern indicates significant chemical compaction in deep, high-temperature mudstones [12,13].
4. Loading–Unloading Characteristics of Overpressure
While compaction curves can effectively identify overpressure zones, they cannot reliably distinguish the underlying mechanisms. The overpressure generation mechanism can be roughly inferred by analyzing the characteristic differences in logging responses between loading and unloading processes [19].
4.1. Acoustic Transit-Time–Density Cross-Plots
To investigate the overpressure generation mechanism in mudstone, the acoustic transit-time–density cross-plots were constructed for the deeper wells, D3 and D8. In normally pressured intervals, the data follow a normal compaction trend, characterized by acoustic transit time decreasing and density increasing with depth. Below a certain depth, however, the density exhibits a rapid increase that deviates from the shallow normal compaction trend, establishing a new compaction trend with increasing burial depth (Figure 5). In overpressured zones below 5000 m, an inversion is observed in the acoustic transit-time–density response. The simultaneous increase in both acoustic transit time and density is interpreted as a signature of chemical compaction, where diagenetic transformations enhance rock density despite the presence of overpressure.
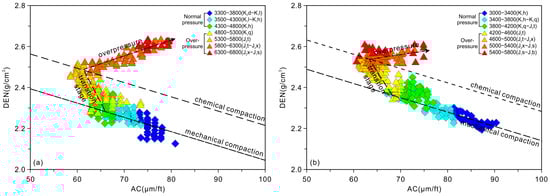
Figure 5.
Acoustic-time–density cross-plots of mudstone in wells D3 and D8 in the Fukang Sag. (a) Acoustic-time–density cross-plots of well D3. (b) Acoustic-time–dnsity cross-plots of well D8.
Based on the established understanding of mudstone compaction in the central Junggar Basin [13], where normal compaction is governed by clay mineral transformation. Three distinct stages, mechanical compaction, transitional stage, and chemical compaction, can be identified using acoustic transit-time–density cross-plots. Using the well-defined normal compaction trend baseline, the overpressure generation mechanism can be further analyzed. The acoustic transit-time–density cross-plots for the two wells reveal that mudstone overpressure predominantly falls within the domain of mixed mechanisms, combining chemical compaction and fluid expansion (i.e., hydrocarbon-generation or overpressure transfer) (Figure 5).
4.2. Vertical-Effective-Stress–Rock-Property Cross-Plots
To investigate the overpressure mechanisms in the sandstones, a dataset of 175 pore-pressure measurements, including 150 normal-pressure data calculated from mud weight, was assembled. The vertical effective stress for each pressure point was calculated based on the effective stress principle. Subsequently, the corresponding sonic velocity (derived from acoustic transit time) and density data for each pressure point were compiled into a cross-plot of logging response versus vertical effective stress.
Acoustic velocity and density both increase with vertical effective stress for data points with a pressure coefficient below 1.2, forming a loading curve trend used to identify overpressure mechanisms (Figure 6). Overpressure points with coefficients between 1.2 and 1.4 generally plot within the scattered zone of the loading curve, indicating that overpressure generated by mudstones’ disequilibrium compaction has been transmitted to adjacent sandstones. As the pressure coefficient exceeds 1.4, the logging responses progressively deviate from the loading curve, forming a distinct unloading curve, with larger coefficients corresponding to greater deviations and more pronounced unloading signatures. The overpressure with unloading features in mudstone is mostly caused by hydrocarbon generation, whereas that in permeable sandstone is always related to overpressure transfer. However, these cannot be reliably distinguished using log-response–vertical-effective-stress cross-plots [40]. It is noteworthy that while hydrocarbon-generation or fault-transferred overpressure typically exhibit decreasing or stable density responses, the continuous increase in density observed in deeper formations results from superimposed chemical compaction effects (Figure 6).
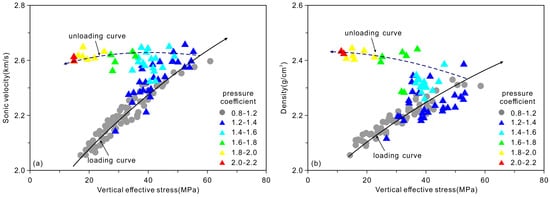
Figure 6.
The logging-responses–vertical-effective-stress cross-plots of the Jurassic formation in the Fukang Sag. (a) Sonic velocity–vertical effective stress- cross plot. (b) Density–vertical effective stress cross plot.
5. Analysis of the Overpressure-Generation Mechanism
Integrated logging response analysis indicates that the overpressure in the Jurassic formations of the Fukang Sag results from multiple mechanisms: disequilibrium compaction, chemical compaction, hydrocarbon generation, and fault transfer. Based on this understanding and incorporating geological conditions, this study further differentiates the overpressure-generation mechanisms between sandstone and mudstone and reveals their intrinsic geological controls through systematic geological interpretation.
5.1. Generation Mechanism of Overpressure in Mudstone
5.1.1. Mudstone Disequilibrium Compaction
Mudstone disequilibrium compaction is the most fundamental and important overpressure-generating process, with rapid burial and high clay content providing favorable geological conditions for its development [41]. Furthermore, deep formations typically exhibit poor physical properties that are conducive to forming effective seals. This enables the development of significant overpressure even under relatively lower sedimentation rates [42].
In the study area, representative wells were selected, and shale content (SH) across various formations was calculated from gamma-ray logs, calibrated with cuttings data. Sedimentation rates (SR) were determined by analyzing stratigraphic thickness and chronology. Together, these parameters indicate that the Jurassic sedimentary filling in the Fukang Sag establishes favorable geological conditions for the development of mudstone disequilibrium compaction (Figure 7).
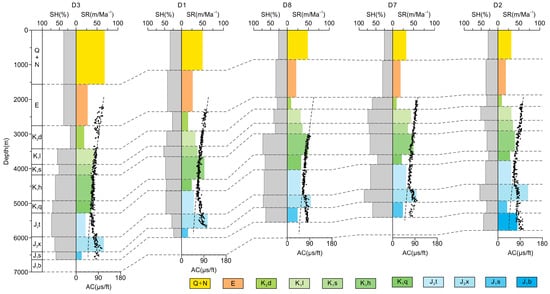
Figure 7.
Statistical results of mud content and sedimentation rate in typical wells in Fukang Sag.
The Badawan formation comprises lacustrine-deltaic dark mudstone interbedded with thin sandstone, with a shale content of about 60%. The overlying Sanggonghe formation consists of thick, dark mudstone interbedded with siltstone, with an average shale content of 70%, while both the Xishanyao and Toutunhe formations exhibit shale contents up to 75%. Compaction curves indicate that disequilibrium compaction initiated at 4500 m, resulting from rapid Cretaceous burial (sedimentation rates approaching 100 m/Ma) following the deposition of thick Jurassic fine-grained sediments. This rapid subsidence restricted pore fluid expulsion during compaction, leading to overpressure. The logging-response–vertical-effective-stress cross-plot confirms that the overpressure generated by mudstone disequilibrium compaction with pressure coefficients up to approximately 1.4. In summary, the combination of thick, clay-rich Jurassic successions and rapid Cretaceous burial created optimal conditions for preserving disequilibrium compaction overpressure through effective sealing.
Tectonic subsidence rate strongly controls disequilibrium compaction, with higher subsidence rates promoting its development [43]. Moreover, a well-established quantitative relationship exists between the subsidence rate and the overpressure coefficient, derived from extensive statistical analyses [44]:
where v is the subsidence (positive)or uplift (negative) rate, m/Ma, Pc is the pressure coefficient, and sign(v) denotes the sign of v.
Pc = 0.13·(log10|v|)2 + 0.008·sign(v) log10|v| + 0.95
By analyzing drilled formation characteristics and performing decompaction and erosion corrections, we restored the paleo-thickness of the strata using this basin modeling to investigate the tectonic subsidence history. This allowed us to delineate the tectonic subsidence patterns and calculate the corresponding subsidence rates (Figure 8). The results show that the Jurassic strata in the Fukang Sag subsided at relatively high rates, generally between 60 and 80 m/Ma, and underwent two regional uplift events during this period. Subsequently, from the Cretaceous to the Quaternary, overall subsidence rates remained relatively low. According to Equation (1), the disequilibrium compaction overpressure coefficient generated during the Jurassic in the Fukang Sag could reach 1.35–1.43. This range aligns well with the findings discussed in the preceding sections.
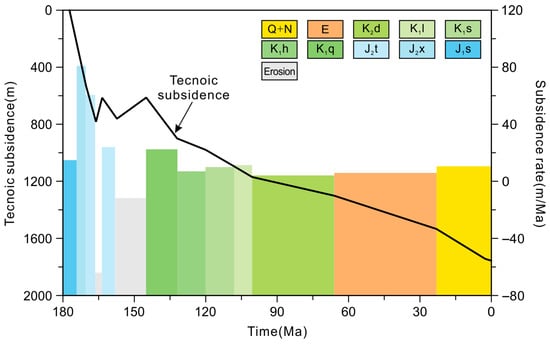
Figure 8.
The characteristics of tectonic subsidence and the subsidence rate of well D3 in Fukang Sag.
5.1.2. Mudstone Chemical Compaction
Under deep, high-temperature conditions, chemical compaction associated with clay mineral transformation commonly overprints earlier mechanical compaction in mudstones. The contribution of chemical compaction to overpressure development depends on the composition, content, and degree of transformation of clay minerals [12,13]. In the Fukang Sag, the top of the overpressure zone lies at approximately 4500 m, where formation temperatures range between 90 °C and 110 °C (Figure 9), which is consistent with the typical smectite-to-illite transformation window [13]. Mineralogical data confirm extensive clay mineral transformation: the content of illite-smectite mixed layers decreases from 80% at 4000 m to as low as 15%, accompanied by an approximately 20% increase in illite content (Figure 9). Although the volumetric dehydration associated with clay transformation is generally limited and considered negligible for overpressure generation, the dissolution–precipitation process among clay particles can redistribute stress, thereby enhancing overpressure [45]. No discrete smectite was identified in the Jurassic mudstones of the Fukang Sag. Given the limited volume of reactive clay minerals, the resulting stress transfer–induced overpressure generally does not exceed 5 MPa [13].
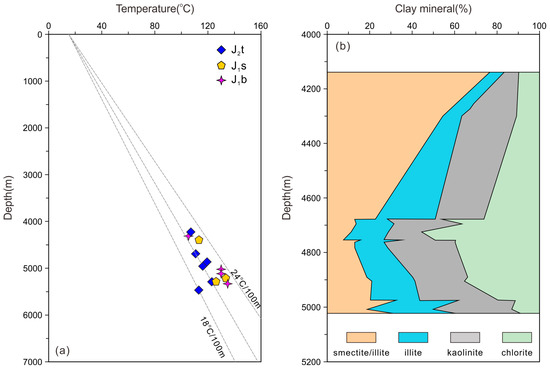
Figure 9.
Temperature–depth relationship and variation in clay minerals in the Fukang Sag. (a) The temperature distribution of the Jurassic Formations. (b) Variation in clay minerals in the Fukang Sag.
5.1.3. Hydrocarbon Generation in the Source Rocks
Hydrocarbon generation from organic matter represents an important overpressure mechanism in source rock intervals. However, the pressurization effect from liquid hydrocarbon generation is generally limited when total organic carbon (TOC) content is less than 5% [13]. To assess the potential for hydrocarbon-generation-induced overpressure in the Jurassic source rocks of the Fukang Sag, we reconstructed the burial, thermal, and hydrocarbon-generation history. The Badaowan formation source rocks were widely distributed, with an average TOC of 1.85%, a hydrogen index (HI) of 150 mg/g, and organic matter types dominated by Type II–III. The dark mudstones of the Sangonghe formation have an average TOC of 1.5%, and an HI of around 160 mg/g, and are predominantly Type II. Hydrocarbon generation modeling was performed using the Easy%Ro thermal maturity model integrated with Burnham’s kinetic model, calibrated against measured temperature and vitrinite reflectance data (Figure 10).
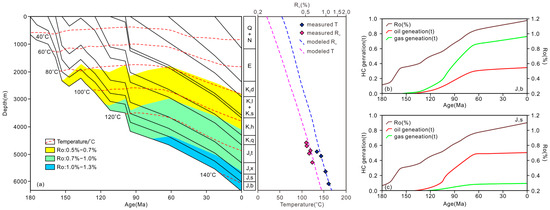
Figure 10.
Simulation results of burial–thermal–hydrocarbon generation history of well D1 in Fukang Sag. (a) Maturity and hydrocarbon generation evolution of Jurassic source rocks. (b) The simulated hydrocarbon generation under of J1b. (c) The simulated hydrocarbon generation under of J1s.
The simulation results delineate contrasting thermal and generative histories for the two formations. The Badaowan source rocks began generating hydrocarbons at 165 Ma. Although their maturation was interrupted by Late Jurassic uplift, it resumed subsequently, entering the oil window (Ro: 0.7–1.0%) around 125 Ma, with present-day maximum Ro values reaching 1.2%. In contrast, the Sangonghe formation reached low maturity at 155 Ma, attained the main oil-generation threshold (Ro = 0.7%) at 110 Ma, and approached peak generation (Ro = 1.0%) at 65 Ma, with a current maximum Ro of 1.1% (Figure 10). Due to its low TOC (<1.5%), low HI (<150 mg/g), and limited maturity (Ro < 1.2%), the Sangonghe Formation is inferred to have contributed minimally to overpressure via oil generation. Therefore, we conclude that the predominant overpressure from hydrocarbon generation is attributed to the Badaowan Formation. Here, type III kerogen has generally reached maturities exceeding 1.2% Ro, facilitating extensive gas generation and significant overpressure development [46].
5.2. Generation Mechanism of Overpressure in Sandstone
The measured pore pressures in sandstones display unambiguous signatures of unloading overpressure. Owing to the highly permeable nature, sandstones cannot effectively maintain the sealing conditions required for many common overpressure mechanisms observed in mudstones, such as those induced by hydrocarbon generation and chemical compaction. This interpretation is further supported by the presence of unloading overpressure within the hydrocarbon generation window, even in intervals that exhibit normal compaction trends, which rules out a direct genetic relationship with either hydrocarbon generation or chemical compaction. Consequently, the pronounced overpressure observed in sandstones must originate from mechanisms fundamentally different from those governing overpressure in mudstones.
Analysis of the lateral and vertical overpressure distribution within the Jurassic formation demonstrates a clear correlation with fault development (Figure 11). The Fukang Sag features two distinct overpressure systems: a deep overpressure system involving the Permian and Badaowan formations, and a shallow overpressure system within the Jurassic–Cretaceous interval. The deep overpressure system, composed of thick, mudstone-rich source rocks, possesses substantial hydrocarbon generation potential. Overpressure in this system results from a combination of disequilibrium compaction and hydrocarbon generation, leading to higher magnitudes of overpressure and an earlier initiation than in the shallow system [47]. Geochemical evidence confirms that the hydrocarbons in Jurassic reservoirs were derived from these deep Permian and Badaowan source rocks [21,23]. Strike-slip faults and associated fractures provide effective conduits for vertical hydrocarbon migration, connecting the deep source rocks with Jurassic reservoirs [28,29]. The multi-phase strike-slip fault system is active throughout the Hercynian, Indosinian, and Yanshanian tectonic episodes. In addition, during the Himalayan period, tectonic stress combined with pre-existing overpressure can induce episodic reactivation of closed faults [48], promoting the upward migration of overpressured, hydrocarbon-rich fluids from the deep system. This fault-controlled hydraulic connectivity enables overpressure to transfer into permeable intervals in J2s and J1t formations. The timing of overpressure transfer shows a strong correlation with hydrocarbon charging episodes. Fluid inclusion analysis indicates at least three distinct charging stages: Early Cretaceous, Late Cretaceous–Neogene, and Paleogene–Quaternary [36]. As a result, isolated Jurassic sand bodies connected to the deep overpressure system through faults display elevated overpressure, while variations in fault sealing capacity account for local pressure heterogeneity. The magnitude of fault-transferred overpressure is governed by multiple factors, including fault activity, top sealing capacity, and initial overpressure intensity. Due to the orders-of-magnitude lower permeability compared to sandstones, mudstone pressures remain largely static during fault activity, while sandstone pressures adjust significantly. These combined controls explain the occurrence of overpressure anomalies among different sand bodies, even within a single well (Figure 11).
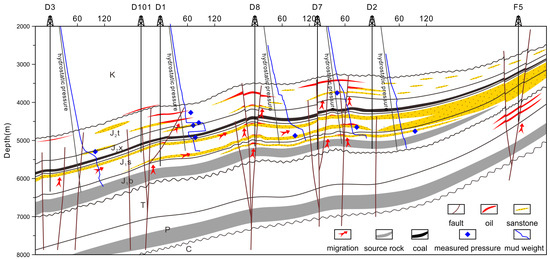
Figure 11.
Relationship between measured pressure and fault in the Jurassic formations in Fukang Sag.
6. The Significance of the Differential Mechanism of Overpressure
6.1. Implications for Pressure Predicting in Deep Formation
Different overpressure mechanisms generate distinct rock physics responses. Therefore, accurately identifying the specific mechanism is a prerequisite for reliable pore-pressure prediction. Although multiple well-logging responses can indicate the presence of overpressure, sonic transit time remains the primary data used in current prediction methods [3,49].
The Equivalent Depth Method and the Eaton Method are two widely used techniques for pore-pressure prediction. While the Equivalent Depth Method is particularly effective when overpressure is primarily due to disequilibrium compaction, the Eaton Method is an empirical approach. It matches predicted and measured pressures by calibrating the Eaton exponent, without requiring explicit consideration of specific overpressure mechanisms [49]. Given the multiple overpressure mechanisms in the Fukang Sag, which include disequilibrium compaction, chemical compaction, hydrocarbon generation, and pressure transfer, this study employs the Eaton method for pore-pressure prediction. The pore-pressure prediction from the four wells revealed variable performance. While the predicted values showed reasonable agreement with measured pressures in the normally pressured sections above 4500 m, significant discrepancies emerged in the deeper overpressured intervals. For wells D2, D3, and D6, satisfactory calibration between predicted and measured pressures was achieved by increasing the Eaton exponent, even in the absence of explicit overpressure mechanisms. In contrast, the Eaton Method failed to accurately capture the characteristic sharp pressure ramp recorded in the measured profile for well D1 (Figure 12).
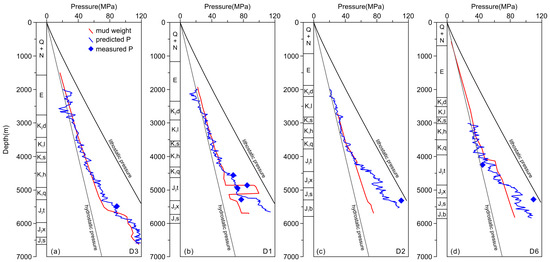
Figure 12.
Comparison of the predicted and measured pressure of typical wells in the Fukang Sag. (a) The predicted pressure of well D3. (b) The predicted pressure of well D1. (c) The predicted pressure of well D2. (d) The predicted pressure of well D6.
Based on geological analysis, we conclude that well D1 encountered fault-transferred overpressure. This mechanism results in significant pressure coefficient variations across permeable zones, producing an abrupt profile that conventional models struggle to capture. The pressure-prediction results indicate that the Eaton method is also inadequate for accurately predicting pressure in sandstone formations. Overpressure generated by fault transfer is often underestimated because sonic logs respond differently to overpressure induced by disequilibrium compaction than to unloading.
Traditional pore-pressure prediction methods encounter considerable limitations in formations deeper than 4500 m, characterized by complex overpressure mechanisms. First, chemical compaction alters the porosity-effective stress relationship in mudstones, rendering conventional mechanical normal compaction trends derived from shallow sections ineffective for deep-pressure prediction [13]. Second, fault-transferred overpressure typically develops after the main phase of formation compaction. As a result, it often lacks the characteristic logging responses commonly associated with elevated pore pressure, making it difficult to identify using standard techniques [40]. Moreover, such overpressure tends to distribute abruptly, generating sharp pressure contrasts across adjacent sandstone and mudstone layers. These factors collectively make the accurate prediction of fault-transferred overpressure a persistent challenge in deep exploration [18].
The Bowers method systematically accounts for both disequilibrium mechanical compaction and unloading-related overpressure mechanisms. It is therefore recognized as an effective predictive approach for unloading type overpressure. It is worth noting that the predicted pressure reflects continuous pressure changes in the mudstone. However, the predicted pressure of sandstone only reflects the pressure in the sandbodies, which are affected by overpressure vertical transfer, rather than the pressure distribution trend of the whole strata. The pressure in any interval should be between the predicted pressure of mudstone and the pressure of sandstone. To determine the pressure in sandstone.
6.2. Relationship Between Overpressure and Hydrocarbon Accumulation
Conventional models posit that overpressure helps preserve reservoir porosity and is critical for forming deep, effective reservoirs [50]. However, in the Jurassic formation of the Fukang Sag, no clear correlation is observed between pore pressure and reservoir quality (Figure 13). This discrepancy stems from the timing of overpressure generation relative to diagenesis history. For overpressure to effectively inhibit porosity loss, it must develop synchronously with, or prior to, the major reservoir compaction and cementation phase, a condition met by mechanisms such as disequilibrium compaction. In the study area, however, in permeable formations, the dominant overpressure mechanism is fault-transferred overpressure associated with late-stage fault activity, which occurs only after substantial porosity reduction. As a result, this late overpressure did not contribute to porosity preservation. These findings emphasize that evaluating the role of overpressure in reservoir quality requires focusing on its origin and temporal evolution, rather than relying solely on its current magnitude.
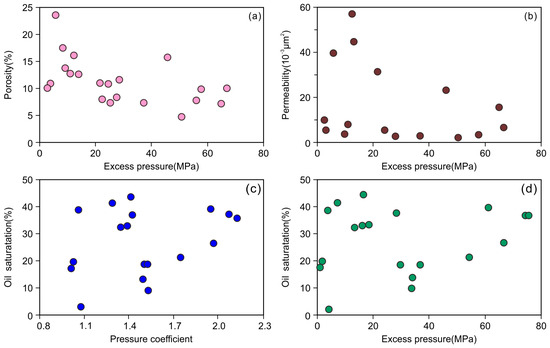
Figure 13.
Relationships between overpressure, reservoir physical properties, and oil saturation in the Fukang Sag. (a) The relationship between porosity and excess pressure. (b) The relationship between permeability and excess pressure. (c) The relationship between oil saturation and pressure coefficient. (d) The relationship between oil saturation and excess pressure.
A positive correlation is observed between oil saturation and both excess pressure and pressure coefficient in the study area (Figure 13). The hydrocarbons, sourced from the Permian and Badaowan source rocks, are associated with regionally continuous overpressure that increases gradually from west to east [30]. This overpressure system not only facilitates hydrocarbon expulsion from the source rocks but also creates a vertical pressure gradient, providing the primary drive for vertical migration along faults and subsequent lateral charging into Jurassic reservoirs. Intense overpressure further promotes the episodic reactivation of oil-source faults, enabling the upward migration of hydrocarbons and overpressure transfer. Consequently, sandstone bodies adjacent to these faults develop high overpressure and elevated oil saturation. When effectively sealed, such sandstones can preserve high overpressure over geological time. In contrast, laterally connected sand bodies experience rapid dissipation of transferred overpressure; although they exhibit lower pressure magnitudes, they can maintain favorable hydrocarbon potential. Conversely, distant from oil-source faults lack efficient migration pathways, resulting in lower pore pressures and poorer hydrocarbon potential.
6.3. Future Trends of Pore-Pressure Prediction
As the industry advances into deeper targets, several key research directions emerge to improve pressure prediction. First, it is crucial to move beyond the conventional shale disequilibrium compaction theory and develop more nuanced models. These models should integrate deeper geological constraints while explicitly analyzing the relationship between rock physical properties and effective stress variations. This approach paves the way for new prediction techniques capable of handling complex lithologies, multiple genetic mechanisms, and lateral pressure variations.
The rapid advancement of artificial intelligence (AI) offers a transformative pathway forward. By leveraging AI to interpret seismic and log data, we can more accurately identify deep faults and assess their role in pressure compartmentalization. Integrating these insights allows for the development of seismic-based, data-driven prediction models. Such models hold the promise of quantitatively resolving pore pressures, even in the most challenging deep settings characterized by multi-layered, genetically complex pressure systems. Advancing these methodologies remains a critical and worthwhile endeavor for the safe and efficient exploration of deep reservoirs.
7. Conclusions
(1) The Jurassic formations in the Fukang Sag exhibit significant variability in overpressure. Measured pore pressures range from 34.28 to 109.51 MPa, with pressure coefficients predominantly between 1.2 and 1.8, locally exceeding 2.1. Corresponding excess pressures are mostly 20–50 MPa, reaching a maximum of 55 MPa. Notably, pressure coefficients do not increase systematically with depth, illustrating the coexistence of overpressure and normal pressure in deep intervals alongside anomalously high values at shallow levels. High-magnitude overpressure is predominantly found in isolated sand bodies connected to oil-source faults. Logging responses include elevated acoustic transit time and neutron porosity, coupled with decreased resistivity. However, the concurrent continuous increase in density suggests that chemical compaction has partially overprinted the typical overpressure signatures.
(2) The overpressure mechanisms in the study area are diverse. Data points with pressure coefficients below 1.4 align with the loading curve, indicative of compaction-driven mechanisms. Whereas those exceeding 1.4 exhibit unloading behavior, identifying mechanisms include disequilibrium compaction, chemical compaction, hydrocarbon generation, and fault-transferred overpressure. Among these, disequilibrium compaction is the most widespread, with chemical compaction acting as a supplemental mechanism. In addition, Permian and Badaowan source rocks contribute significantly to overpressure through hydrocarbon generation. Notably, strong overpressure observed for the first time in sandstones primarily originates from vertical transfer via faults, although the contribution of this mechanism varies substantially across different wells.
(3) Investigating these overpressure mechanisms is of fundamental scientific importance. The complex origins of overpressure pose a considerable challenge to accurate pore-pressure prediction. Accurate formation pressure prediction methods suitable for deep and ultra-deep formations are urgently needed as hydrocarbon exploration advances to greater depths. Although late-stage fault-transferred overpressure contributes minimally to porosity preservation, it is the primary driving force for hydrocarbon accumulation in deep reservoirs. This critical role is clearly demonstrated by the strong positive correlation observed between oil saturation and both excess pressure and pressure coefficient.
Author Contributions
Conceptualization, Y.Q. and C.L.; Methodology, Y.Q., C.L. and L.Z.; Software, L.Z. and Y.Z.; Validation, L.Z., H.H., W.H. and Y.Z.; Resources, Z.Z. and C.B.; Data curation, C.L., W.H., Z.Z., C.B. and Y.Z.; Writing—original draft, Y.Q., C.L. and L.Z.; Writing—review and editing, Y.Q., C.L. and L.Z.; Visualization, W.H. and Z.Z.; Supervision, H.L. and Z.Z.; Project administration, H.H., H.L. and C.B.; Funding acquisition, H.H., H.L. and Z.Z. All authors have read and agreed to the published version of the manuscript.
Funding
This study is supported by the National Natural Science Foundation of China (42030808) and the SINOPEC Ministry of Science and Technology Project (P25156; P25180).
Data Availability Statement
The original contributions presented in this study are included in the article. Further inquiries can be directed to the corresponding authors.
Conflicts of Interest
Authors Y.Q., C.L., H.H., H.L., Z.Z. and C.B. are employed by the company Petroleum Exploration and Production Research Institute, China Petroleum & Chemical Corporation. W.H. is employed by the Research Institute of Petroleum Engineering Technology, Shengli Oilfield Company. The remaining authors declare that the research was conducted in the absence of any commercial or financial relationships that could be construed as a potential conflict of interest.
References
- Ruth, P.V.; Hillis, R.; Tingate, P. The origin of overpressure in the Carnarvon Basin, western Australia: Implications for pore-pressure prediction. Pet. Geosci. 2004, 10, 247–257. [Google Scholar] [CrossRef]
- Dasgupta, S.; Chatterjee, R.; Mohanty, S.P. Prediction of pore pressure and fracture pressure in Cauvery and Krishna-Godavari basins, India. Mar. Pet. Geol. 2016, 78, 493–506. [Google Scholar] [CrossRef]
- Gutierrez, M.; Braunsdor, N.R.; Couzens, B.A. Calibration and ranking of pore-pressure prediction models. Geophysics 2006, 25, 1516–1523. [Google Scholar]
- Wang, Q.C.; Chen, D.X.; Gao, X.Z.; Li, M.J.; Shi, X.B.; Wang, F.W.; Chang, S.Y.; Yao, D.S.; Li, S.; Chen, S.M. Overpressure origins and evolution in deep-buried strata: A case study of the Jurassic Formation, central Junggar Basin, western China. Pet. Sci. 2023, 20, 1429–1445. [Google Scholar] [CrossRef]
- Li, Y.B.; Pu, W.F.; Zhao, J.Y.; Zhao, Q.N.; Sun, L.; Jin, F.Y.; Zhao, J.Z.; Zhou, W. Variation of reservoir fluid property during the high pressure air injection process. Int. J. Green Energy 2016, 13, 173–180. [Google Scholar] [CrossRef]
- Wangen, M. A quantitative comparison of some mechanisms generating overpressure in sedimentary basins. Tectonophysics 2001, 334, 211–234. [Google Scholar] [CrossRef]
- Najibi, A.R.; Ghafoori, M.; Lashkaripour, G.R.; Asef, M.R. Reservoir geomechanical modeling: In-situ stress, pore pressure, and mud design. J. Pet. Sci. Eng. 2017, 151, 31–39. [Google Scholar] [CrossRef]
- Da, B.; Chatterjee, R. Mapping of pore pressure, in-situ stress and brittleness in unconventional shale reservoir of Krishna-Godavari basin. J. Nat. Gas Sci. Eng. 2017, 50, 74–89. [Google Scholar]
- Tingay, M.R.P.; Hollis, R.R.; Swarbirck, R.E.; Morley, C.K.; Damit, A.R. Origin of overpressure and pore-pressure prediction in the Baram province Brunei. AAPG Bull. 2009, 93, 51–74. [Google Scholar] [CrossRef]
- Bowers, G. Pore pressure estimation from velocity data: Accounting for overpressure mechanisms besides undercompaction. SPE 1995, 10, 89–95. [Google Scholar] [CrossRef]
- Qiu, N.S.; Liu, Y.F.; Liu, W.; Jia, J.K. Quantitative reconstruction of formation paleo-pressure in sedimentary basins and case studies. Sci. Sin. Terrae 2020, 50, 793–806. [Google Scholar] [CrossRef]
- Lahann, R.W.; Swarbrick, R.E. Overpressure generation by load transfer following shale framework weakening due to smectite diagenesis. Geofluids 2011, 11, 362–375. [Google Scholar] [CrossRef]
- Li, C.; Zhang, L.K.; Luo, X.R.; Zeng, Z.P.; Xiu, J.L.; Lei, Y.H.; Cheng, M.; Hu, C.Z.; Zhang, M.; He, W.J. Clay mineral transformations of Mesozoic mudstones in the central Junggar Basin, northwestern China: Implications for compaction properties and pore pressure responses. Mar. Pet. Geol. 2022, 144, 105847. [Google Scholar] [CrossRef]
- Wang, B.; Qiu, N.; Sebastian, A.; Duan, Y.J.; Ralf, L. Modelling of pore pressure evolution in a compressional tectonic setting: The Kuqa Depression, Tarim Basin, northwestern China. Mar. Pet. Geol. 2022, 146, 105936. [Google Scholar] [CrossRef]
- Obradors-Prats, J.; Medina, E.E.C.; Jones, S.J.; Rouainia, M.; Aplin, A.C.; Crook, A.J.L. Integrating petrophysical, geological and geomechanical modelling to assess stress states, overpressure development and compartmentalisation adjacent to a salt wall, Gulf of Mexico. Mar. Pet. Geol. 2023, 155, 106352. [Google Scholar] [CrossRef]
- Tingay, M.R.P.; Hillis, R.R.; Swarbrick, R.E.; Morley, C.K.; Damit, A.R. Vertically transferred overpressures in Brunei: Evidence for a new mechanism for the formation of high-magnitude overpressure. Geology 2007, 35, 1023–1026. [Google Scholar] [CrossRef]
- Fan, C.Y.; Wang, Z.L.; Wang, A.G.; Fu, S.T.; Wang, L.Q.; Zhang, Y.S.; Kong, H.X.; Zhang, X. Identification and calculation of transfer overpressure in the Northern Qaidam Basin, Northwest China. AAPG Bull. 2016, 100, 23–39. [Google Scholar] [CrossRef]
- Fan, C.W.; Xu, C.G.; Li, C.; Liu, A.Q.; Li, H.; Hou, J.X.; Zhang, X.Y.; Lu, B.; Li, J. Identification and prediction of allo-source overpressure caused by vertical transfer: Example from an HTHP gas reservoir in the Ledong Slope in the Yinggehai Basin. Geofluids 2021, 2021, 1–20. [Google Scholar] [CrossRef]
- Bowers, G.L. Detecting high overpressure. Lead Edge 2002, 21, 174–177. [Google Scholar] [CrossRef]
- Goulty, N.R.; Sargent, C.; Andras, P.; Aplin, A.C. Compaction of diagenetically altered mudstones Part 1: Mechanical and chemical contributions. Mar. Pet. Geol. 2016, 77, 703–713. [Google Scholar] [CrossRef]
- Li, J.; Tang, Y.; Wu, T.; Zhao, J.Z.; Wu, H.Y.; Wu, W.T.; Bai, Y.B. Overpressure origin and its effects on petroleum accumulation in the conglomerate oil province in Mahu Sag, Junggar Basin, NW China. Pet. Explor. Dev. 2020, 47, 679–690. [Google Scholar] [CrossRef]
- Radwan, A.E. A multi-proxy approach to detect the pore pressure and the origin of overpressure in sedimentary basins: An example from the Gulf of Suez rift basin. Front. Earth Sci. 2022, 10, 967201. [Google Scholar] [CrossRef]
- Qiao, J.; Liu, L.; Shang, X. Deposition conditions of the Jurassic lacustrine source rocks in the East Fukang Sag, Junggar Basin, NW China: Evidence from major and trace elements. Geol. J. 2020, 55, 4936–4953. [Google Scholar] [CrossRef]
- Han, Z.H.; Liu, H.; Li, J.; Cheng, B.; Zhang, H.R.; Meng, X.Y. Origin of overpressure and its effect on hydrocarbon enrichment in the hinterland of Junggar Basin, NW China. Acta Geol. Sin. (Engl. Ed.) 2024, 98, 1511–1532. [Google Scholar] [CrossRef]
- Zeng, Z.P. Characteristics of formation pressure system and its effect on petroleum distribution in Jurassic of Fukang Sag. Fault-Block Oil Gas Field 2017, 24, 337–341. (In Chinese) [Google Scholar]
- Wei, C.L.; Zhang, F.Q.; Jiang, Q.C.; Lu, X.S.; Liu, G.; Wei, Y.Z.; Li, S.B.; Jiang, W.L. Formation mechanism and evolution characteristics of overpressure in deep Permian in eastern Fukang Sag, Junggar Basin. Lithol. Reserv. 2024, 36, 167–177. (In Chinese) [Google Scholar]
- Zhang, H.R.; Liu, H.; Han, Z.H.; Li, J.; Zhang, W.B. Characteristics of fluid inclusions and pressure recovery during hydrocarbon accumulation period in Jurassic Sangonghe Formation in Fukang Sag, Junggar Basin. Earth Sci. 2024, 49, 2420–2433. [Google Scholar]
- Tan, S.Q.; Zeng, Z.P.; Gong, Y.J.; Min, F.Q.; Chen, X. Control of abnormal overpressure on hydrocarbon-reservoir evolution and hydrocarbon filling process in central of Junggar Basin. Fault-Block Oil Gas Field 2014, 21, 287–291. (In Chinese) [Google Scholar]
- Gong, Y.J.; Zhang, K.H.; Zeng, Z.P.; Qin, F.; Niu, J.J.; Fan, J.; Liu, H. Origin of overpressure, vertical transfer and hydrocarbon accumulation of Jurassic in Fukang Sag, Junggar Basin. Earth Sci. 2021, 46, 3588–3600. (In Chinese) [Google Scholar]
- Guo, X.W.; He, S.; Liu, K.Y.; Yang, Z.; Yuan, S.Q.; Liu, M.L. Generation and evolution of overpressure caused by hydrocarbon generation in the Jurassic source rocks of the central Junggar Basin, northwestern China. AAPG Bull. 2019, 103, 1553–1574. [Google Scholar] [CrossRef]
- Huang, L.J.; Su, J.B.; Pan, S.X.; Li, C.; Wang, Z.C. Tectonic evolution of the early Permian Junggar basin: Insights into a foreland basin shaped by lithospheric folding. Mar. Pet. Geol. 2025, 171, 107178. [Google Scholar] [CrossRef]
- Wang, Y.J.; Jia, D.; Pan, J.G.; Wei, D.T.; Tang, Y.; Wang, G.D.; Wei, C.R.; Ma, D.L. Multiple-phase tectonic superposition and reworking in the Junggar Basin of northwestern China—Implications for deep-seated petroleum exploration. AAPG Bull. 2018, 102, 1489–1521. [Google Scholar] [CrossRef]
- Yin, S.Z.; He, D.F.; Guo, W.J. The attribute and tectono-sedimentary evolution of the Fukang sag, Junggar basin. Acta Geol. Sin. 2024, 98, 3647–3661. [Google Scholar]
- Zhu, M.; Liang, Z.; Xiao, L.; Wei, L.; Wang, X.; Wang, R.; Yu, Y. Mesozoic strike-slip fault system at the margin of the Junggar Basin, NW China. J. Struct. Geol. 2023, 175, 104950. [Google Scholar] [CrossRef]
- Li, X.G.; Chen, G.; Wu, C.; Li, J.; Haproff, P.J.; Geng, M.; Wu, S.H.; Xu, S.H.; Li, Z.J.; Yang, D. Tectono-stratigraphic framework and evolution of East Junggar Basin, Central Asia. Tectonophysics 2023, 851, 229758. [Google Scholar] [CrossRef]
- Cao, B.; Luo, X.; Zhang, L.; Sui, F.G.; Lin, H.X.; Lei, Y.H. Diagenetic evolution of deep sandstones and multiple-stage oil entrapment: A case study from the Lower Jurassic Sangonghe Formation in the Fukang Sag, central Junggar Basin (NW China). J. Pet. Sci. Eng. 2017, 152, 136–155. [Google Scholar] [CrossRef]
- Li, B.C.; Tang, Y.J.; Chen, Z.H.; Wang, Y.F.; He, D.X.; Yan, K.; Chen, L. The geochemical characteristics of source rock and oil in the Fukang Sag, Junggar Basin, NW China. Minerals 2023, 13, 432. [Google Scholar] [CrossRef]
- Dang, W.; Gao, G.; You, X.C.; Wu, J.; Liu, S.J.; Yan, Q.; He, W.J.; Guo, L.B. Genesis and distribution of oils in Mahu Sag, Junggar Basin, NW China. Pet. Explor. Dev. 2023, 50, 840–850. [Google Scholar] [CrossRef]
- Liu, Y.; Wu, K.Y.; Wang, X.; Liu, B.; Guo, J.X.; Du, Y.N. Architecture of buried reverse fault zone in the sedimentary basin: A case study from the Hong-Che Fault Zone of the Junggar Basin. J. Struct. Geol. 2017, 105, 1–17. [Google Scholar] [CrossRef]
- Zhang, L.K.; Li, C.; Luo, X.R.; Zhang, Z.B.; Zeng, Z.P.; Ren, X.C.; Lei, Y.H.; Zhang, M.; Xie, J.Y.; Cheng, M.; et al. Vertically transferred overpressures along faults in Mesozoic reservoirs in the central Junggar Basin, northwestern China: Implications for hydrocarbon accumulation and preservation. Mar. Pet. Geol. 2023, 150, 106152. [Google Scholar] [CrossRef]
- Drews, M.C.; Bauer, W.; Caracciolo, L.; Stollhofen, H. Disequilibrium compaction overpressure in shales of the Bavarian Foreland Molasse Basin: Results and geographical distribution from velocity-based analyses. Mar. Pet. Geol. 2018, 92, 37–50. [Google Scholar] [CrossRef]
- Liu, H.; Yuan, F.F.; Jiang, Y.L.; Zhao, M.; Chen, K.T.; Guo, Z.Y.; Wang, Y.Q. Mechanisms for overpressure generated by the undercompaction of paleogene strata in the Baxian Depression of Bohai Bay Basin, China. Mar. Pet. Geol. 2019, 99, 337–346. [Google Scholar] [CrossRef]
- Spahić, D.; Lee, E.Y.; Šajnović, A.; Stepić, R. Opening and Post-Rift Evolution of Alpine Tethys Passive Margins: Insights from 1D Numerical Modeling of the Jurassic Mikulov Formation in the Vienna Basin Region, Austria. Geosciences 2024, 14, 202. [Google Scholar] [CrossRef]
- Mao, X.P.; Chen, X.R. The time difference between formation water infiltration and tectonic movement: Discussion on the two mechanisms of overpressure formation. Chin. J. Geol. (Sci. Geol. Sin) 2024, 59, 1614–1638. (In Chinese) [Google Scholar]
- Li, C.; Luo, X.R.; Zhang, L.K.; Fan, C.W.; Xu, C.G.; Liu, A.Q.; Li, H.; Li, J.; Lei, Y.H. New understanding of overpressure responses and pore pressure prediction: Insights from the effect of clay mineral transformations on mudstone compaction. Eng. Geol. 2022, 297, 106493. [Google Scholar] [CrossRef]
- Yu, C.Y.; Guo, X.W.; Ren, Z.L.; Ren, W.B.; Yang, G.L. Quantitative evaluation of hydrocarbon generation in the hinterland of Junggar Basin: Dongdao Haizibei depression. Chin. J. Geol. (Sci. Geol. Sin.) 2018, 53, 207–220. (In Chinese) [Google Scholar]
- Liu, H.M.; Wang, Q.J.; Ren, X.C.; Zhang, Y.J.; Chen, L.; Chai, Z.; Chen, Z.H. Overpressure of deep Jurassic system in the Central Junggar Basin and its influence on petroleum accumulation. Processes 2024, 12, 1572. [Google Scholar] [CrossRef]
- Luo, X.R.; Vasseur, G. Overpressure dissipation mechanisms in sedimentary sections consisting of alternating mud-sand layers. Mar. Pet. Geol. 2016, 78, 883–894. [Google Scholar] [CrossRef]
- Zhang, J.C. Pore pressure prediction from well logs: Methods, modifications, and new approaches. Earth Sci. Rev. 2011, 108, 50–63. [Google Scholar] [CrossRef]
- Xu, X.T.; Zeng, L.B.; Zhang, L.K.; Li, C.; Zhang, L.Q.; Zeng, Z.P.; Ren, X.C. Effects of overpressure on deep sandstone reservoir quality: A case study of the medium and lower Jurassic formation in the Shawan Sag, central Junggar Basin, western China. Geoenergy Sci. Eng. 2023, 230, 212203. [Google Scholar] [CrossRef]


Disclaimer/Publisher’s Note: The statements, opinions and data contained in all publications are solely those of the individual author(s) and contributor(s) and not of MDPI and/or the editor(s). MDPI and/or the editor(s) disclaim responsibility for any injury to people or property resulting from any ideas, methods, instructions or products referred to in the content. |
© 2026 by the authors. Licensee MDPI, Basel, Switzerland. This article is an open access article distributed under the terms and conditions of the Creative Commons Attribution (CC BY) license.