Abstract
The Jaboi geothermal field, located on Weh Island in western Indonesia, has a potential output of approximately 55 MWe. Previous geophysical surveys have not sufficiently identified the components of the geothermal system. The success of drilling in identifying a geothermal system depends heavily on the accuracy of the conceptual model. Consequently, developing a more precise subsurface model is crucial to minimizing drilling failures. This study aims to map the resistivity structure of the Jaboi geothermal field using the magnetotelluric method. In our research, we used 16 magnetotelluric sites that recorded data for 7 to 8 h. We successfully estimated the cap rock area with resistivity < 10 Ωm distributed across Jaboi Volcano to depths of 500 m and identified an intense resistive anomaly starting at depths of 1–2 km with resistivity > 5000 Ωm. This anomaly is probably due to a block of crystalline basement being uplifted by upwelling magmatic intrusions. The reservoir zone was estimated to be located directly below the cap rock area. The resistivity structure also reveals a fluid pathway zone in the upflow and outflow zone that connects the reservoir to the surface manifestations influenced by the Ceunohot Fault and Jaboi Fault. The resistivity structure confirmed the boundary of the Jaboi geothermal system along the coastline and in the southeastern part. This study successfully identifies key components of geothermal systems, including cap rock, reservoir zones, and fluid migration pathways.
1. Introduction
The demand for electrical energy continues to increase as the population grows. Environmentally friendly energy is a mandatory option considering the government’s target to reduce CO2 emissions [1]. Geothermal energy is a viable solution to meet this target, and its potential is abundant in Indonesia due to its tectonically active location within the Ring of Fire [2] and, most importantly, its minimal environmental impact compared to fossil fuels [3]. With a geothermal energy potential of 24 GW, utilization remains very low. Therefore, to support the Indonesian government’s target, additional surveys are needed, especially in greenfield areas. Jaboi is an area in western Indonesia with a geothermal energy potential of about 55 MWe [4]. This field is classified as a high-temperature geothermal system, evidenced by an estimated reservoir temperature above 250 °C from water and gas geothermometers [5]. Surface manifestations such as fumaroles, hot springs, and silica deposits indicate the presence of an active hydrothermal system beneath the surface [6].
Several geological and geophysical studies have attempted to map the geothermal system in the Jaboi area. The previous integrated studies utilized gravity, magnetic, and DC resistivity methods [6,7]. The gravity surveys in the Jaboi geothermal area indicate the presence of local fault structures but are limited in identifying geothermal system components, such as cap rock. The DC resistivity survey has successfully identified a low-resistivity zone, interpreted as a cap rock [8]. This conductive layer is mapped to form a dome-like structure, with the reservoir top detected at depths of 600 m to 850 m below sea level [6]. Another DC resistivity method only reveals groundwater conditions and conductive zones near the surface [9]. Both methods were only able to map shallow structures and failed to adequately map geothermal system components, such as the capping layer, a crucial component of the geothermal system [10]. Based on that information, two exploration wells had been drilled, but they did not produce enough steam to generate electricity economically. One factor is an inaccurate conceptual subsurface model, especially for the deep target of the Jaboi geothermal system.
The magnetotelluric method can be used to map deep structures up to several kilometers deep at the Jaboi geothermal field [11,12,13]. Low resistivity values are often associated with clay alteration zones or conductive hot fluids, while high resistivity values tend to indicate dense volcanic rocks or relatively dry reservoirs [14,15]. The application of magnetotelluric in volcanic geothermal systems at several locations, including Kenya [16], India [17], Japan [18], and Indonesia [19,20], demonstrates that this method is effective for identifying cap rock layers, reservoir zones, and fluid migration paths.
The application of magnetotelluric methods in geothermal exploration in Indonesia has experienced rapid development in recent years, enabling the mapping of resistivity structures to depths of several kilometers. For example, studies in Lake Ranau used integrated magnetotelluric analysis of impedance tensors and tipper vectors to identify conductive capping layers and reservoir zones [21]. In the Bengkulu region, research in Lemeu mapped potential geothermal resources to a depth of 7 km [22]. In comparison, studies in Telaga Tujuh Warna [23] and Babakan Bogor [22] used magnetotellurics to characterize capping layers and reservoirs at depths of 1 to 5 km. In addition to Sumatra, MT methods are also integrated with gravity data to study structural controls on geothermal systems, as in South Garut, where they were used to map magma pathways and the relationship between seismicity and resistivity structures [24]. In Sulawesi, studies in Lake Limboto-Pentadio used magnetotellurics to confirm the existence of fault and graben systems that control hydrothermal fluid circulation [25].
However, the magnetotelluric method has never been applied in the Jaboi area. Therefore, this study aims to develop a 2D resistivity model from magnetotelluric data in the Jaboi area. This study is expected to provide a better understanding of the subsurface structure, specifically the capping layer, reservoir zone, and hydrothermal fluid migration pathways, which can serve as a basis for future development of the Jaboi geothermal system. If development is complete, geothermal energy could meet the island’s electricity needs.
2. Geological Setting
The geological structure formed on Weh Island has the same pattern as the Sumatran Fault. The fault zone on Weh Island shows continuity or alignment with the Seulimum fault, which intersects the Krueng Raya bay on mainland Aceh [6]. Some of the main fault zones on Weh Island are generally NW-SE, as indicated in Balohan Bay and extending into Sabang Bay.
Weh Island is a type C volcano, an unknown eruption center that shows the characteristics of a fumarole field in its past activity [26]. The high P-wave-to-S-wave ratio indicates that Jaboi, as a Quaternary volcanic rock, may have a favorable heat source within a geothermal system [27]. The lithology of Weh Island formed from Tertiary and Quaternary rocks which is divided into four main rock groups [28]; Tertiary (Miocene) sedimentary volcanic rock group which is Weh Island rocks, old volcanic rock group from Weh Island which is Quaternary-Tertiary age made of lava and pyroclastic flows, Quaternary young volcanic rock groups are made of a series of young volcanic cones that form volcanic lines from northwest-southeast and north–south and a group of limestone reefs (Figure 1).
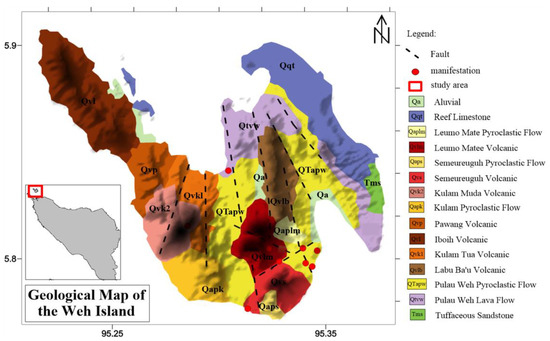
Figure 1.
Geological Map of Weh Island.
Weh Island has several main faults, mostly normal faults trending NNW-SSE. There are also secondary faults formed from tectonic processes in this area, such as Leumo Matee Fault (LMF), Ceunohot Fault (CF), Bangga Fault (BF), and Jaboi Fault (JF) (Figure 2). The Leumo Matee fault was observed in the NWW-SEE direction between Mount Leumo Matee and Mount Keunalo, representing the newest permeability zone of the geothermal system. It generates geothermal manifestations, including fumaroles, warm ground, and hot water. The advanced strike-slip movement of the Seulimum fault also generated the Ceunohot fault in NEE-SWW directions, crossing Mount Semereguh and Mount Leumo Matee. This fault also served as an additional permeability zone within the Jaboi Geothermal system.
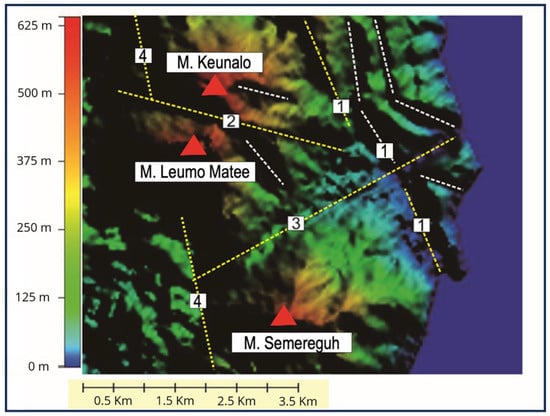
Figure 2.
Lineament pattern of the research area with major faults (yellow dashed line): (1) Jaboi Fault, (2) Leumo Matee Fault, (3) Ceuneuhot Fault, and (4) Bangga Fault, and minor fault (white dashed line). The red triangle represents a mountain peak of Mount Keunalo, Mount Leumo Matee, and Mount Semereguh.
3. Method
This study employs the magnetotelluric method across 16 sites in the Jaboi geothermal field to model the geothermal system by imaging the subsurface resistivity structure (Figure 3). The location can be accessed via a 1.5 h fast boat trip from Ulee Lheu Port (Banda Aceh) to Balohan (Weh Island), followed by a 2 km overland journey. Field conditions around the Jaboi geothermal area pose challenges, including rugged tropical terrain with dense vegetation and active manifestations such as hot pools and fumaroles that limit instrument mobility. The primary challenge during data acquisition was limited access to sites with steep slopes, necessitating adjustments to the distribution of 16 magnetotelluric stations to account for these constraints. Data acquisition, conducted for 7–8 h per site using KMS-820 equipment, measured the horizontal components of the electric field (, ) and the magnetic field components (, , and ). The magnetic field components were recorded using three induction coils: two installed horizontally, perpendicular to each other ( and ), and one installed vertically (). The electric field measurements were conducted using two pairs of porous spot electrodes installed in the north–south and east–west directions, 30 m long [11]. All of these sensors were connected to a data recording unit to acquire natural EM signals over a specified period. Quality control is performed using robust processing techniques, including FFT, time-series inspection, and 50 Hz notch filtering, to obtain stable long-term data. To mitigate anthropogenic electromagnetic noise (e.g., from settlements or power lines), the field team conducted a preliminary survey to ensure that the stations were located away from major sources of interference.
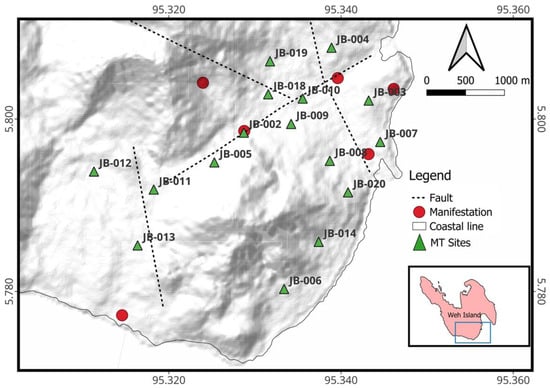
Figure 3.
Topographic map with magnetotelluric sites distribution at the Jaboi geothermal field.
Recorded data is typically stored in binary format, forming a time series. The raw data after preprocessing is transformed into the frequency domain using the Fast Fourier Transform (FFT) within a robust processing technique [29], which generates the impedance tensor and outputs it in the standard EDI format [30]. From the linear relationship between the electric and magnetic fields, an impedance tensor () of order 2 × 2 is obtained, which serves as the basis for calculating the MT parameters. From the impedance tensor, the apparent resistivity and phase are calculated based on [31],
where
In addition, the vertical magnetic field component () is used to calculate the tipper (T), which is a transfer function that identifies the lateral variation in resistivity [32]:
To more reliably evaluate the dimensions of subsurface structures, phase tensor analysis is used. The phase tensor () is defined as the product of the inverse of the real part of the impedance tensor () and its imaginary part () [33], namely:
The phase tensor is a 2 × 2 real matrix that can be represented as an ellipse. The main parameters derived from the phase tensor include strike orientation, ellipticity, and skew angle. The skew angle () is calculated as:
Skew angle values approaching zero indicate a dominant two-dimensional (2D) subsurface response, while large skew values indicate a three-dimensional (3D) structural contribution.
The impedance tensor was rotated to get the maximum value of and . The analyzed and rotated impedance data were then subjected to the 2D Occam’s Inversion algorithm [34] along five profiles that traverse the surface manifestations and significant geological structures. The initial model was defined as a homogeneous half-space with a resistivity of 100 Ωm, a value commonly adopted in geothermal MT studies to avoid imposing strong a priori constraints on subsurface structures. Model regularization was controlled through a trade-off parameter that balances data misfit and model roughness. The optimal regularization parameter was selected through iterative testing and L-curve analysis, ensuring the final model achieves an acceptable fit to the data while remaining geologically plausible.
The resulting 2D resistivity models were used to interpret the key zones of the geothermal system. The low-resistivity conductive layers are interpreted as the cap rock, moderate-resistivity zones as the hot fluid reservoir, and high-resistivity anomalies at depth as the heat source or basement rock [12,35,36].
4. Results
4.1. Rho Apparent, Tipper, and Phase Tensor
Figure 4 shows a representative plot of apparent resistivity and phase. The difference between component xy and yx indicates that lateral anisotropies and 2D or 3D structures are present. Primarily, there are two common trends. First, the apparent resistivity increases at short periods and decreases after 0.1 s. At a period of 10, the apparent resistivity increases, for example, at sites JB-04 and JB-11. It shows that, at those sites, there are several layers with different resistivity values. Another trend is that the apparent resistivity increases with the period, as seen at sites JB-10 and JB-18. Although the apparent resistivity eventually shows a different trend, it is influenced by a layer with a different resistivity value or by a non-homogeneous layer. Overall, these results show that the resistivity model in this area is heterogeneous. Apparent resistivity and phase plot for all stations can be found in the Supplementary Material (Figure S1).
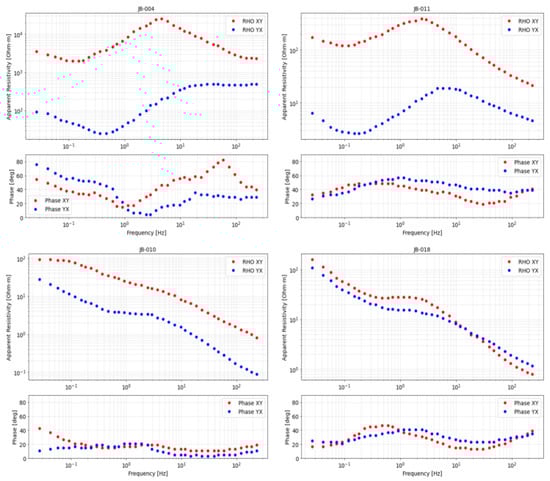
Figure 4.
Representative of apparent resistivity and phase at sites JB-04, JB-10, JB-11, and JB-18.
Details of the heterogeneity model are shown by the tipper vector and phase tender results (Figure 5). In general, the tipper response at station JB-12 has small amplitudes below 0.1, especially at low to mid-frequency levels. This finding indicates a weak lateral resistivity contrast at depth. The increase in tipper amplitude at higher frequencies indicates limited shallow heterogeneity due to hydrothermal alteration. The phase tensor at this station is dominated by slender ellipses with relatively consistent orientations across frequency, indicating a generally 2D structural character instead of 3D structure.
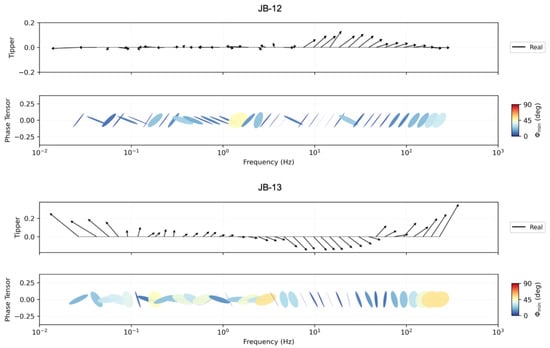
Figure 5.
Example results of the tipper vector and phase tensor at sites JB-12 and JB-13.
In contrast to JB-12, station JB-13 shows larger tipper amplitudes at low to mid frequencies, indicating a significant lateral resistivity contrast at depth and the presence of elongated conductive structures. At high frequencies, the tipper direction varies, reflecting the complexity of the shallow structure. The phase tensor exhibits a more rounded ellipse, with orientation changing with frequency, indicating the influence of local 3D structures. Tipper station plot for all stations is provided in the Supplementary Material (Figure S2).
The histogram of skew angle () across all frequencies and stations is shown in Figure 6. A significant concentration of data is found at < 30°, indicating that 1D–2D structures dominate. This relatively small skew angle supports the assumption that the 2D inversion approach remains valid for representing the main resistivity structures at the regional scale. However, the presence of > 40° indicates a strong influence of the 3D structure in certain frequency ranges. This suggests the presence of complex lateral heterogeneity, which is likely related to lithological variations, hydrothermal alteration zones, or fault systems that develop in the Jaboi geothermal area. The symmetrical distribution of skew angles about zero also indicates that structural complexity is not unidirectional, but rather reflects a complex, segmented geological setting. Overall, structures at Jaboi geothermal area are influenced by a combination of 2D and 3D structures. Therefore, the 2D inversion is considered adequate for mapping the main resistivity structural framework of the Jaboi geothermal system. However, local 3D effects need to be considered when interpreting inversion results, especially in shallow zones and areas with high skew angles.
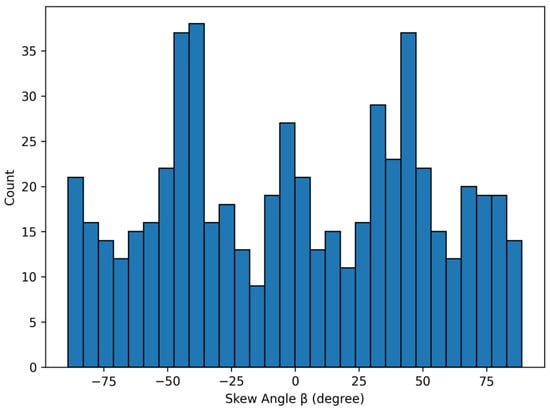
Figure 6.
Histogram of skew angle across all frequencies and stations.
4.2. Two-Dimensional Inversion
Before performing inversion, the first step is to determine the profiles to be used for 2D inversion (Figure 7). In this study, 2D inversion was performed for five profiles surrounding the Jaboi geothermal system area, which crosses the interpreted fault shown by the dotted lines in Figure 7. The interpreted faults act as the main structural controls for the Jaboi geothermal system, including the Jaboi Fault (JF), Leumo Matee Fault (LMF), Ceuneuhot Fault (CF), and Bangga Fault (BF) (Figure 2). The inversion was performed using Occam’s algorithm with a maximum of 30 iterations. The quality of the inversion results was evaluated using the root-mean-square (RMS) misfit between the observed and calculated magnetotelluric responses. For all profiles, the RMS misfit values range between 7.651 and 2.475, indicating a satisfactory fit to the data given the noise level and site conditions.
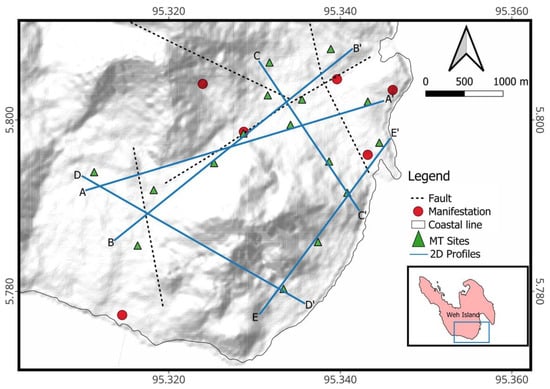
Figure 7.
Topography map with 2D magnetotelluric inversion profile at Jaboi Geothermal Field.
The inversion results are shown in Figure 8, Figure 9, Figure 10, Figure 11 and Figure 12. The results show a complex structure with low-resistivity zones (<10 Ωm), attributed to cap rock layers, and high-resistivity zones (>5000 Ωm), associated with source rocks or heat sources. We also identified a contrast in resistivity between the two boundaries of the conductive and resistive layers, which acts as a major fault for upflow and outflow zones.
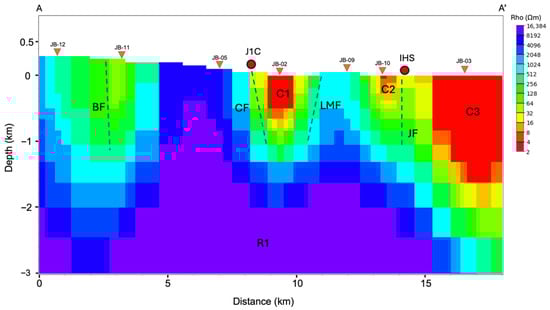
Figure 8.
Two-dimensional resistivity model of profile A-A’. This profile crosses two manifestations: Jaboi 1 Crater (J1C) and Ieseum Hot Spring (IHS). Strikes and dips of each fault in this profile are Bangga Fault (BF) N350°E/80°; Ceunohot Fault (CF) N240°E/70°; Leumo Matee Fault (LMF) N114°E/70°; Jaboi Fault (JF) N333°E/90°.
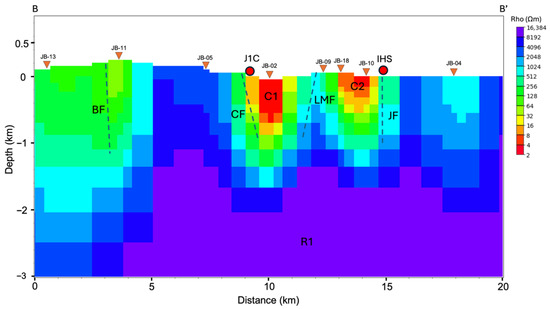
Figure 9.
Two-dimensional resistivity model of profile B-B’. This profile crosses two manifestations: Jaboi 1 Crater (J1C) and Ieseum hot spring (IHS). Strikes and dips of each fault in this profile are Bangga Fault (BF) N350°E/80°; Ceunohot Fault (CF) N240°E/70°; Leumo Matee Fault (LMF) N114°E/70°; Jaboi Fault (JF) N333°E/90°.
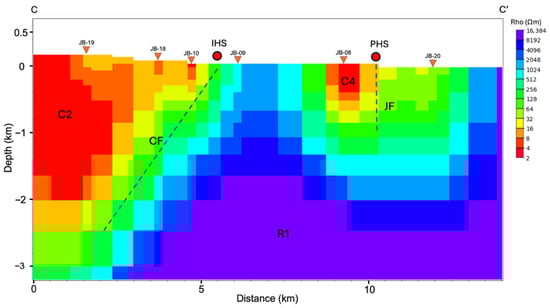
Figure 10.
Two-dimensional resistivity model of profile C-C’. This profile crosses two manifestations: Pasi Jaboi hot spring (PHS) and Ieseum hot spring (IHS). Strikes and dips of each fault in this profile are Ceunohot Fault (CF) N240°E/70°; Jaboi Fault (JF) N333°E/90°.
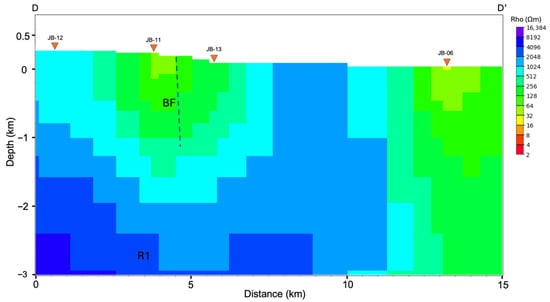
Figure 11.
Two-dimensional resistivity model of profile D-D’. Strikes and dips of each fault in this profile are Bangga Fault (BF) N350°E/80°.
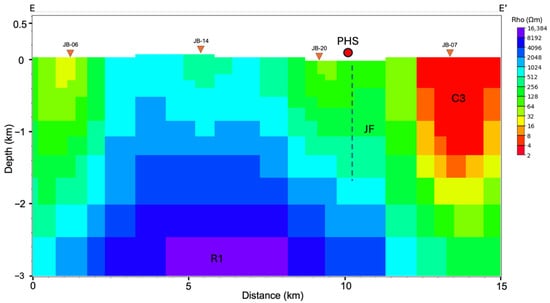
Figure 12.
Two-dimensional resistivity model of profile E-E’. This profile crosses one manifestation: the Pasi Jaboi Hot Spring (PHS). Strikes and dips of each fault in this profile are Jaboi Fault (JF) N333°E/90°.
The inversion result of the first profile A-A’ crossed seven magnetotelluric measurement points (JB-12, JB-11, JB-05, JB-02, JB-09, JB-10, and JB-03) (Figure 8). This profile crosses the Jaboi 1 Crater (J1C), which features fumaroles and solfataras near the JB-02 station, and the Ieseum Hot Spring (HIS). The subsurface model on profile 1 is 17 km long and 3 km deep. We used the same depth as other profiles to estimate the geothermal system in the area. We identified a massive resistivity body extending to 1 km below the surface in this profile (R1), accompanied by several conductive layers near the surface, located beneath the JB-02 (C1), JB-10 (C2), and JB-03 (C3) sites. We confirmed the resistivity contrast boundary as fault planes in profile A-A’ inversion results, namely Bangga Fault (BF), Ceunohot Fault (CF), Leumo Matee Fault (LMF), and Jaboi Fault (JF). Previous studies confirm the dip of these fault planes [6,7,8,28]. The inversion result also confirms that the Ceunohot Fault and Jaboi Fault act as pathways for the outflow of fluids to the surface at Jaboi 1 Crater and Ieseum Hot Spring.
We created another profile, B-B’ (Figure 9), which crosses the Jaboi 1 crater, and profile A-A’, which covers other stations, namely JB-13 and JB-04, to obtain additional information in this area. The inversion result on profile B-B’ crossed eight magnetotelluric measurement points. From southwest to northeast, the sites are JB-13, JB-11, JB-05, JB-02, JB-09, JB-18, JB-10, and JB-04. The subsurface model on profile 1 is 20 km long. We found a similar pattern in profile B-B’ as in profile A-A’. The difference is that we found a less conductive layer in the northeast area near the JB-04 station. In profile B-B’, we also confirmed the resistivity boundaries as fault planes for four faults (BF, CF, LMF, and JF) and two faults act as permeable zones (CF and JF) for Jaboi 1 Crater and Ieseum Hot Spring.
We then create the other two profiles that cross profile A-A’ and B-B’, namely profile C-C’ (Figure 10) and profile D-D’ (Figure 11), to obtain additional information along the northwest-to-southeast direction. Profile C-C’ with 14 km length crosses six stations, namely JB-19, JB-18, JB-10, JB-09, JB-08, and JB-20. In this profile, we identified a conductive layer in the northern part of the Jaboi 1 crater (C2) that extends across three stations: JB-19, JB-18, and JB-10. Unlike the previous profiles, the top of the resistive reservoir here is flat and deep, with no evidence of the doming associated with thermal upflow. The result suggests that Line C-C’ sits on the periphery of the high-temperature system, where the conductive layer is interpreted as hot groundwater filling a sedimentary reservoir. In this profile, we also identified a massive resistivity body at a depth of 1.5 km below the surface in the southeastern part of the profile (R1), and a conductive layer surrounding the JB-08 station (C4). Profile C-C’ also confirms resistivity boundaries as fault planes as found in profiles A-A’ and B-B’.
For the profile D-D’ with a 15 km length, it crosses four stations. From northwest to southeast, the stations are JB-12, JB-11, JB-13, and JB-06. In this profile, there is no conductive layer. However, we found a resistive body (R1) below JB-12, JB-11, and JB-13, starting at approximately 1.5 km depth. In the western part, it displays a more heterogeneous resistivity distribution, with resistivity values ranging from 32 Ωm to 512 Ωm and variable basement depth, indicative of a distal environment with less intense hydrothermal alteration. This profile confirmed the boundary of the geothermal system in the southeast area and the Bangga Fault planes.
The last profile E-E’ to cover the eastern part of the study area has a 15 km length profile (Figure 12). This profile crosses four stations, namely JB-06, JB-14, JB-20, and JB-07 from south to north. This profile is parallel with profile B-B’ and shows a similar pattern, but the resistive body (R1) is smaller, and there is a highly conductive layer at the coastline side. We interpreted Jaboi Fault planes that act as a permeable zone for the Pasi Jaboi Hot Spring in profile E-E’. This anomaly is attributed to saline seawater intrusion into the formation, which is also found at profile A-A’.
5. Discussion
The Jaboi geothermal field is a volcanic geothermal system characterized by high enthalpy, as confirmed by geochemical analysis, and a reservoir temperature of approximately 250 °C [5,6]. There is a consistent result of conductive layer from profile A-A’, profile B-B’, and profile C-C’ interpreted as a cap rock with a resistivity value less than 10 Ωm (Figure 13). This finding is also confirmed by the hydrothermal alteration zone around Jaboi crater [5,27,29]. The presence of this conductive layer at depths of 200 m to 400 m shows as a function of the watertight cover over the reservoir.
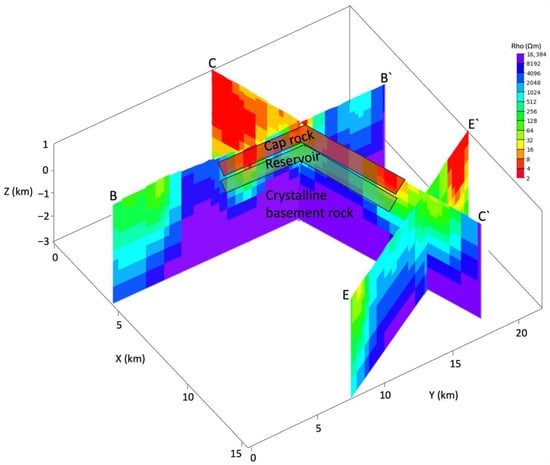
Figure 13.
Three-dimensional pseudo cross-section of the resistivity model of the Jaboi geothermal field area based on five profiles. This result shows the caprock, reservoir, and crystalline basement rock.
5.1. Upflow and Outflow
Identification of resistive values along profiles A-A’, B-B’, and C-C’ is crucial because it reveals the upflow zones, as evidenced by manifestations such as fumaroles and hot springs, which are controlled by the major fault structure. The major fault system on Weh Island, particularly the Ceunohot Fault (trending NE-SW), is believed to serve as a conduit for hydrothermal fluid ascent from deep reservoirs [37], also confirmed by the 2D magnetotelluric model. These areas are correlated with high surface mercury (Hg) and carbon dioxide (CO2) anomalies [6], indicating fluid leakage from deep within.
The magnetotelluric resistivity distribution supports the upflow-outflow model previously established from DC resistivity surveys [7]. The conductive layer indicates that the caprock extends into the outflow zone. The geometry of the conductive layer extends laterally east-southeastward toward the hot spring manifestations on the Jaboi coast [8]. The Pasi Jaboi hot spring flows through a Jaboi fault that is identified in all profiles crossing the fault. Profile D-D’ shows as a peripheral zone or outflow zone toward Keuneukai with a resistivity value of about 30 Ωm to 500 Ωm, which is also confirmed by the previous DC resistivity study [8]. The resistivity results confirmed the outflow area along the coastline, extending to the Jaboi and Keneukai areas in the southern region of the study.
5.2. Cap Rock and Reservoir Zone
The presence of a conductive layer at very shallow depths (approximately 200–400 m) varies with water tightness. This layer is characterized by very low resistivity (2 Ωm to 10 Ωm), which is typical of argillaceous alteration minerals, such as smectite or smectite–illite mixtures, resulting from moderate to high-temperature hydrothermal alteration [38,39]. This conductive zone lies above surface manifestations, such as hot springs and fumaroles. Below this caprock layer is a reservoir zone (Figure 13), consistent with previous DC resistivity surveys that delineated the top of the conductive layer at depths of 600 m to 850 m [6,7,8]. The reservoir zone is confirmed by geochemical analysis. Water from the exploration wells (SP1 and SP2) is classified as a chloride-type [5]. This reservoir water exhibits extremely high salinity levels, with chloride concentrations exceeding 7000 mg/L. The water and gas geothermometers indicate that the reservoir temperature exceeds 250 °C.
5.3. Heat Source
The geothermal heat source in Jaboi is thought to originate from the magma remnants of Mount Leumo Matee and Mount Semereguh, located at depths exceeding 4 km [6]. The volcanic rocks (lava and pyroclastics) of Leumo Matee are Quaternary (1.1 ± 0.1 Ma) and are classified as young volcanic rocks, hot enough to heat the geothermal fluids in the reservoir. Previous gravity surveys in the area show a high-density anomaly (probably partially melted magma from Leumo Matee) at a shallower depth of approximately 1.8 km, and it is supported by the high magnetic anomalies around the Jaboi fumaroles, which are associated with rocks demagnetized by high temperatures [6,7]. The heat source is believed to be located in this area at a deeper location. The thick resistivity patterns, ranging in depth from 1 to 1.5 km, as confirmed by this study, support the gravity and magnetic results. We interpreted the resistivity block as a crystalline basement uplifted by upwelling magmatic intrusions.
5.4. Implication for Jaboi Geothermal System
The spatial analysis of resistivity distributions, which have greater penetration than those from the previous model from the DC resistivity method, reveals a distinct hydrological regime characterized by a central upflow, lateral outflow, and a coastal boundary. The upflow is constrained to the intersection of the Ceunohot Fault, which represents the most prospective target for production drilling. Wells targeted here should be directionally drilled to intersect the fault zone at reservoir depths up to 1000 m to maximize permeability, with a vertical uncertainty range of approximately ±100 m based on the MT inversion resolution at that depth. Conversely, the thickening cap rock to the southeast (Line C-C’) and the dipping outflow plume to the northeast (Line E-E’) indicate the migration of cooler, degassed fluids. These areas are not suitable for high-temperature production, but they can be a strategic place for reinjection wells. Injection wells in geothermal field development are generally placed on the boundary or outside the production reservoir area to minimize the risk of thermal breakthrough in production wells. Another alternative is the application of deep injection, which involves injecting fluids at depths below the reservoir, approximately 500–1000 m deeper, depending on geological conditions and fracture systems. To ensure the effectiveness of the injection strategy and to understand the connectivity between the injection well and the production well, well testing, such as tracer testing, is required to evaluate the fluid flow path and the injection travel time to the production zone. The identification of seawater intrusion in profiles A-A’ and E-E’ provides a clear northern limit for future development and warns against drilling near the coast to prevent contamination of the reservoir by saline fluids.
6. Conclusions
The 2D magnetotelluric inversion at the Jaboi geothermal field has successfully provided a detailed view of the subsurface resistivity structure. The conductive layer around Jaboi Crater 1 was consistently confirmed and interpreted as a cap rock. This layer was detected down to a depth of 500 m below the surface manifestations near Jaboi Crater and also in the outflow area near the coastline. The core of the main upflow zone was mapped as a massive resistive anomaly (up to >512 Ωm) at shallow depths, indicating a high-permeability zone likely controlled by major fault structures, such as the Ceunohot Fault and the Jaboi Fault. Based on the magnetotelluric results, the reservoir area is interpreted to lie directly beneath the cap rock, with resistivity values ranging from 32 Ωm to 512 Ωm. Horizontally, the low-resistivity zone exhibits an outflow pattern toward the East-Southeast (Jaboi) and the Southwest (Keuneukai), as confirmed by other geophysical and geochemical data. The heat source of the Jaboi geothermal system is associated with magma remnants of Mount Leumo Matee and Mount Semereguh. Although this 2D model provides strong validation of the Jaboi high-enthalpy system, this study is limited in fully characterizing the complex 3D geological structure due to the highly heterogeneous resistivity distribution in this area. To improve model accuracy in the future, using 3D MT inversion is highly recommended to capture reservoir geometry and fluid channels more precisely. Given the large study area, additional research is recommended to increase the number of MT stations to improve the lateral resolution of the deep resistivity structure and strengthen the reliability of the inversion model. Further integration with other geophysical methods, such as ambient noise tomography or integrated multi-method surveys, will be highly beneficial in reducing uncertainty before production drilling.
Supplementary Materials
The following supporting information can be downloaded at: https://www.mdpi.com/article/10.3390/geosciences16020058/s1. The supporting information related to apparent resistivity vs. phase plot for all stations, tipper vector vs. phase tensor plot for all stations, example of iteration vs. RMS misfit, and station coordinate and elevation can be found.
Author Contributions
Conceptualization: M.M., D.D., A.A., R.R. and C.A.H.; Methodology: D.D., R.S.S. and T.H.; Software: A.A. and F.H.; Formal analysis: A.A., F.H., R.R., C.A.H., T.H. and D.B.D.; Resources: A.A., T.H., F.S. and D.B.D.; Data curation: A.A., R.S.S., F.H., T.H. and D.B.D.; Writing: M.M., D.D., R.S.S., R.R., C.A.H. and F.S.; Supervision: M.M.; Project administration: D.D.; Funding acquisition: M.M. All authors have read and agreed to the published version of the manuscript.
Funding
This research was funded by the Ministry of Higher Education, Science and Technology Indonesia under the Penelitian Fundamental Reguler funding scheme, Contract Number: 105/UN11.L1/PG.01.03/DPPM/2025.
Data Availability Statement
The data used in this study are available upon request to the corresponding author.
Acknowledgments
The authors would like to express their gratitude to all parties who assisted in implementing this research, especially the field and laboratory teams involved in acquiring magnetotelluric data in the research area. This support enabled the implementation of all research activities, from field surveys to data analysis, leading to the successful completion of this research.
Conflicts of Interest
The authors declare no conflicts of interest.
References
- IEA. An Energy Sector Roadmap to Net Zero Emissions in Indonesia; International Energy Agency: Paris, France, 2022. [Google Scholar]
- Pambudi, N.A. Geothermal Power Generation in Indonesia, a Country within the Ring of Fire: Current Status, Future Development and Policy. Renew. Sustain. Energy Rev. 2018, 81, 2893–2901. [Google Scholar] [CrossRef]
- Ouerghi, F.H.; Omri, M.; Nisar, K.S.; Abd El-Aziz, R.M.; Taloba, A.I. Investigating the Potential of Geothermal Energy as a Sustainable Replacement for Fossil Fuels in Commercial Buildings. Alex. Eng. J. 2024, 97, 215–229. [Google Scholar] [CrossRef]
- Direktorat Jenderal EBTKE; Kantor Pusat Kementerian ESDM. Buku Potensi Panas Bumi Indonesia 2017 Jilid 1; Direktorat Jenderal EBTKE; Kantor Pusat Kementerian ESDM: Jakarta, Indonesia, 2017. [Google Scholar]
- Idroes, R.; Marwan, M.; Yusuf, M.; Muslem, M.; Helwani, Z. GEOCHEMICAL INVESTIGATION ON JABOI MANIFESTATION, JABOI VOLCANO, SABANG, INDONESIA. Int. J. GEOMATE 2021, 20, 170–185. [Google Scholar] [CrossRef]
- Dwipa, S.; Widodo, S.; Suhanto, E.; Kusnadi, D. INTEGRATED GEOLOGICAL, GEOCHEMICAL AND GEOPHYSICAL SURVEY IN JABOI GEOTHERMAL FIELD, NANGRO ACEH DARUSSALAM, INDONESIA. In Proceedings of the 7th Asian Geothermal Symposium, Qingdao, China, 25–26 July 2006. [Google Scholar]
- Sumintadireja, P.; Suhanto, E. Jaboi Geothermal Field Boundary, Nangroe Aceh Darussalam, Based on Geology and Geophysics Exploration Data. In Proceedings of the World Geothermal Congress, Bali, Indonesia, 25–30 April 2010. [Google Scholar]
- Suhanto, E. DELINIATION OF PROSPEST AREA AND RESERVOIR STRUCTURES OF JABOI GEOTHERMAL AREA AS MAPPED FROM RESISTIVITY. In Proceedings of the Joint Convention HAGI, IAGI, IATMI, Bali, Indonesia, 13–16 November 2007. [Google Scholar]
- Yanis, M.; Zaini, N.; Abdullah, F.; Isa, M.; Marwan, M.; Idris, S.; Paembonan, A.Y.; Ananda, R.; Zainal, M.; Ghani, A.A.; et al. Vertical Electrical Sounding for Revealing the Groundwater Resources in the Geothermal Spring of Jaboi Volcano. Acta Geophys. 2024, 72, 1617–1635. [Google Scholar] [CrossRef]
- Ars, J.-M.; Tarits, P.; Hautot, S.; Bellanger, M. Geophysical Models Integration Using Principal Component Analysis: Application to Unconventional Geothermal Exploration. Geophys. J. Int. 2024, 239, 1789–1798. [Google Scholar] [CrossRef]
- Chave, A.D.; Jones, A.G. The Magnetotelluric Method: Theory and Practice; Cambridge University Press: Cambridge, UK, 2012; ISBN 0-521-81927-X. [Google Scholar]
- Maryanto, S.; Dewi, C.N.; Syahra, V.; Rachmansyah, A.; Foster, J.; Nadhir, A.; Santoso, D.R. Magnetotelluric-Geochemistry Investigations of Blawan Geothermal Field, East Java, Indonesia. Geosciences 2017, 7, 41. [Google Scholar] [CrossRef]
- Newman, G.A.; Gasperikova, E.; Hoversten, G.M.; Wannamaker, P.E. Three-Dimensional Magnetotelluric Characterization of the Coso Geothermal Field. Geothermics 2008, 37, 369–399. [Google Scholar] [CrossRef]
- Arafa-Hamed, T.; Zaher, M.A.; El-Qady, G.; Marzouk, H.; Elbarbary, S.; Fujimitsu, Y. Deep Heat Source Detection Using the Magnetotelluric Method and Geothermal Assessment of the Farafra Oasis, Western Desert, Egypt. Geothermics 2023, 109, 102648. [Google Scholar] [CrossRef]
- Ramotoroko, C.; Thiede, A.; Junge, A.; Shemang, E. Geothermal Resource Mapping in Northern Botswana Inferred from Three-Dimensional Magnetotelluric Inversion. Appl. Sci. 2023, 13, 11236. [Google Scholar] [CrossRef]
- Maithya, J.; Fujimitsu, Y. Analysis and Interpretation of Magnetotelluric Data in Characterization of Geothermal Resource in Eburru Geothermal Field, Kenya. Geothermics 2019, 81, 12–31. [Google Scholar] [CrossRef]
- Kumar, D.; Singh, A.; Israil, M. Necessity of Terrain Correction in Magnetotelluric Data Recorded from Garhwal Himalayan Region, India. Geosciences 2021, 11, 482. [Google Scholar] [CrossRef]
- Aoyama, K.; Mogi, T.; Suzuki, K.; Sasaki, J.; Yamaya, Y. Magnetotelluric Study on a Vapor-Dominated Geothermal Reservoir in the Matsukawa Area, Japan. Geothermics 2022, 101, 102362. [Google Scholar] [CrossRef]
- Marwan, M.; Yanis, M.; Nugraha, G.S.; Zainal, M.; Arahman, N.; Idroes, R.; Dharma, D.B.; Saputra, D.; Gunawan, P. Mapping of Fault and Hydrothermal System beneath the Seulawah Volcano Inferred from a Magnetotellurics Structure. Energies 2021, 14, 6091. [Google Scholar] [CrossRef]
- Marwan, M.; Idroes, R.; Ismail, N. 2D Inversion and Static Shift of MT and TEM Data for Imaging the Geothermal Resources of Seulawah Agam Volcano, Indonesia. Int. J. GEOMATE 2019, 17, 173–180. [Google Scholar] [CrossRef]
- Maryadi, M.; Firdaus, A.; Zarkasyi, A.; Mizunaga, H. Electrical Resistivity Structure of Danau Ranau Geothermal Prospect Area Based on Integrated 3-D Inversion of Impedance Tensor and Tipper Vector. Geothermics 2022, 106, 102575. [Google Scholar] [CrossRef]
- Farid, M.; Hadi, A.I.; Sari, L.P. Investigation of Geothermal Using Magnetotelluric Method in Babakan Bogor, Bengkulu Province, Indonesia. Indones. J. Geosci. 2021, 8, 221–231. [Google Scholar] [CrossRef]
- Maesaroh, R.M.; Farid, M.; Refrizon, R.; Sumajaya, E.; Ansory, A.R.A.; Naldo, A. CHARACTERIZATION OF GEOTHERMAL POTENTIAL USING 2D MAGNETOTELLURIC INVERSION AT TELAGA TUJUH WARNA, LEBONG REGENCY, BENGKULU PROVINCE, INDONESIA. Indones. Phys. Rev. 2025, 8, 700–711. [Google Scholar] [CrossRef]
- Arisbaya, I.; Wijanarko, E.; Warsa; Sumintadireja, P.; Sudrajat, Y.; Handayani, L.; Mukti, M.M.; Grandis, H. Magnetotellurics (MT) and Gravity Study of a Possible Active Fault in Southern Garut, West Java, Indonesia. Int. J. Geophys. 2023, 2023, 4482074. [Google Scholar] [CrossRef]
- Susilawati, A.; Niode, M.; Surmayadi, M.; Pratomo, P.M.; Nurhasan; Mustopa, E.J.; Sutarno, D.; Srigutomo, W. Resistivity and Density Structure of Limboto Lake—Pentadio, Gorontalo, Indonesia Based on Magnetotelluric and Gravity Data. Appl. Sci. 2023, 13, 644. [Google Scholar] [CrossRef]
- De Neve, G. Quaternary Volcanism and Other Phenomena Attribute to Volcanocity in the Aceh Region North Sumatra. In Proceedings of the PIT XII Ikatan Ahli Geologi Indonesia, Yogyakarta, Indonesia, 6–8 December 1983; pp. 67–90. [Google Scholar]
- Feng, M.; Wei, S.; Chen, L.; Muksin, U.; Lythgoe, K.; Wang, T.; Wu, Z. Pervasive Crustal Volcanic Mush in the Highly Stretched Sunda Plate Margin of Northern Sumatra. Geophys. Res. Lett. 2023, 50, e2023GL104391. [Google Scholar] [CrossRef]
- Dirasutisna, S.; Hasan, A.R. Geologi Panas Bumi Jaboi, Sabang, Propinsi Aceh Nangroe Darussalam; Direktorat Inventaris Sumber Daya Mineral: Bandung, Indonesia, 2005. [Google Scholar]
- Löwer, A.; Junge, A. Magnetotelluric Transfer Functions: Phase Tensor and Tipper Vector above a Simple Anisotropic Three-Dimensional Conductivity Anomaly and Implications for 3D Isotropic Inversion. Pure Appl. Geophys. 2017, 174, 2089–2101. [Google Scholar] [CrossRef]
- Cordell, D.; Unsworth, M.J.; Lee, B.; Hanneson, C.; Milling, D.K.; Mann, I.R. Estimating the Geoelectric Field and Electric Power Transmission Line Voltage during a Geomagnetic Storm in Alberta, Canada Using Measured Magnetotelluric Impedance Data: The Influence of Three-dimensional Electrical Structures in the Lithosphere. Space Weather 2021, 19, e2021SW002803. [Google Scholar] [CrossRef]
- Simpson, F.; Bahr, K. Practical Magnetotellurics; Cambridge University Press: Cambridge, UK, 2005; ISBN 0-521-81727-7. [Google Scholar]
- Vozoff, K. The Magnetotelluric Method in the Exploration of Sedimentary Basins. Geophysics 1972, 37, 98–141. [Google Scholar] [CrossRef]
- Caldwell, T.G.; Bibby, H.M.; Brown, C. The Magnetotelluric Phase Tensor. Geophys. J. Int. 2004, 158, 457–469. [Google Scholar] [CrossRef]
- Constable, S.C.; Parker, R.L.; Constable, C.G. Occam’s Inversion: A Practical Algorithm for Generating Smooth Models from Electromagnetic Sounding Data. Geophysics 1987, 52, 289–300. [Google Scholar] [CrossRef]
- Bodvarsson, G. Geothermal Resource Energetics. Geothermics 1974, 3, 83–92. [Google Scholar] [CrossRef]
- DiPippo, R. Geothermal Power Plants: Principles, Applications, Case Studies and Environmental Impact; Butterworth-Heinemann: Oxford, UK, 2012; ISBN 0-12-394787-1. [Google Scholar]
- Nugraha, R.P.; O’Sullivan, J. A Key Process of Natural State Modeling: 3D Geological Model of Jaboi Geothermal Field, Nangro Aceh Darussalam, Indonesia. IOP Conf. Ser. Earth Environ. Sci. 2019, 254, 012024. [Google Scholar] [CrossRef]
- Lévy, L.; Gibert, B.; Sigmundsson, F.; Flóvenz, Ó.G.; Hersir, G.; Briole, P.; Pezard, P. The Role of Smectites in the Electrical Conductivity of Active Hydrothermal Systems: Electrical Properties of Core Samples from Krafla Volcano, Iceland. Geophys. J. Int. 2018, 215, 1558–1582. [Google Scholar] [CrossRef]
- Kristinsdóttir, L.H.; Flóvenz, Ó.G.; Árnason, K.; Bruhn, D.; Milsch, H.; Spangenberg, E.; Kulenkampff, J. Electrical Conductivity and P-Wave Velocity in Rock Samples from High-Temperature Icelandic Geothermal Fields. Geothermics 2010, 39, 94–105. [Google Scholar] [CrossRef]


Disclaimer/Publisher’s Note: The statements, opinions and data contained in all publications are solely those of the individual author(s) and contributor(s) and not of MDPI and/or the editor(s). MDPI and/or the editor(s) disclaim responsibility for any injury to people or property resulting from any ideas, methods, instructions or products referred to in the content. |
© 2026 by the authors. Licensee MDPI, Basel, Switzerland. This article is an open access article distributed under the terms and conditions of the Creative Commons Attribution (CC BY) license.