


Abstract
Lithofacies heterogeneity may separate organic matter enrichment from the normalized oil-bearing response of lacustrine shale, complicating the identification of effective shale oil intervals. To examine this relationship, the Chang 9 Member of Well Danye-1 in the Ordos Basin was investigated through core observation, X-ray diffraction (XRD), total organic carbon (TOC) analysis, Rock-Eval pyrolysis, chloroform bitumen “A” extraction, vitrinite reflectance (Ro), scanning electron microscopy, and porosity–permeability measurements. The TOC values range from 0.07 to 9.62 wt.% and average 2.18 wt.%. The interval is thermally mature, with Ro values of 0.85–1.15% and a mean of 0.99%. Mud-rich groups generally contain higher TOC, S1, S2, and chloroform bitumen “A” content, and the positive correlations among these parameters indicate that the organic matter abundance exerts the primary control on the hydrocarbon generation potential and absolute hydrocarbon abundance. However, oil saturation index (OSI) maxima do not consistently coincide with TOC maxima: several samples with TOC above 4 wt.% have only moderate OSI values, while elevated OSI values occur locally in samples containing less than 2 wt.% TOC. The reservoir is generally tight, with porosity of 0.39–5.67% and permeability of 0.000170–0.0630 mD. Mud-rich groups are characterized by higher organic matter richness and hydrocarbon-related geochemical parameters; they contain abundant interlayer pores and organic-related nanopores that favor retention but restrict pore throat connectivity. Silt-rich rocks contain relatively abundant feldspar and locally preserve residual intergranular pores, dissolution pores, and bedding-parallel microfractures, indicating pore morphologies that differ from those observed in mud-rich rocks. The OSI-TOC geochemistry demonstrates that the low residual OSI in organic-rich mudstone reflects efficient hydrocarbon expulsion rather than insufficient hydrocarbon generation. The geological sweet-spot evaluation should therefore integrate hydrocarbon supply, the absolute oil content, and pore network effectiveness instead of relying on TOC or OSI alone.
1. Introduction
Unconventional hydrocarbons are becoming an increasingly important component of the global energy supply, attracting growing attention towards their resource potential, geological controls, and environmental implications [1]. Against the background of the global energy transition and China’s efforts to strengthen domestic energy security, shale oil and gas have emerged as major targets for unconventional petroleum exploration [2,3]. Lacustrine shale oil is particularly important in China, where its occurrence and producibility are strongly influenced by pronounced sedimentary and lithofacies heterogeneity. The Ordos Basin is one of China’s principal energy-producing regions. Its Upper Triassic Yanchang Formation contains one of the earliest and most extensive continental organic-rich shale successions worldwide. In Northern Shaanxi, the mudstones and shales of the Chang 9 Member exhibit abundant oil reserves and considerable resource potential, making this interval another major target for shale oil and gas exploration after the Chang 7 Member [4,5].
As shale oil and gas exploration extends into deeper strata and increasingly focuses on fine-grained sedimentary successions, the pronounced vertical heterogeneity of lacustrine deposits is attracting growing attention towards their depositional environments and mechanisms of organic matter enrichment [6]. Lake-level fluctuations, changes in terrigenous sediment supply and hydrodynamic conditions, and episodic depositional events may generate frequent alternations among muddy deposits, silty laminae, and thin sandy beds over short stratigraphic intervals [7,8,9]. These changes modify the spatial relationships among organic matter, detrital minerals, and pore systems [10]. Organic-rich fine-grained rocks may function as both source rocks and reservoirs, yet organic matter enrichment, the abundance of hydrocarbons already present in the rock, and the storage capacity do not necessarily respond to lithofacies variations in the same manner [11,12]. TOC primarily represents the abundance of organic carbon. Rock-Eval (S1) records hydrocarbons released during the low-temperature stage of pyrolysis, and the oil saturation index (OSI), calculated as S1 × 100/TOC, is used to describe the Rock-Eval S1 response normalized to TOC. In this study, the OSI is treated as a descriptive geochemical parameter rather than a direct measure of in situ oil saturation, mobility, or recoverability. Because TOC forms the denominator in this calculation, a high OSI value does not necessarily indicate greater oil mobility, higher oil saturation, or stronger production potential [13]. The interpretation of oil occurrence in lacustrine fine-grained rocks therefore requires clear distinction among the geological meanings and evidential limits of these parameters.
The Upper Triassic Yanchang Formation in the Ordos Basin accumulated within a fluvial–deltaic–lacustrine depositional system, where fine-grained deposits are vertically interbedded with siltstone and sandstone units of variable thickness [14]. Previous investigations have concentrated largely on the Chang 7 Member. Organic–geochemical evidence nevertheless indicates that the Chang 9 Member also contains organic-rich mudstones, whose organic matter type and thermal maturity provide the material basis and thermal conditions required for liquid hydrocarbon generation [15,16,17,18]. Regional sedimentological studies suggest that Chang 9 deposition was governed by alternating phases of lake basin expansion and clastic supply from delta fronts. Episodic processes, including gravity flows in some areas, produced complex associations of muddy background deposits and silt to silt-rich beds [19,20].
Previous work on the Chang 9 Member has generally followed three lines of investigation. Studies of regional sedimentary facies and sand body distribution have focused on the origin and spatial configuration of sandy deposits [21,22]. Source rock assessments have mainly employed the total organic carbon (TOC), Rock-Eval pyrolysis parameters, organic matter type, and thermal maturity indicators to evaluate the hydrocarbon generation potential and map effective source rocks [23,24]. Reservoir studies have examined the sandstone mineralogy, pore systems, diagenetic facies, and the effects of compaction, cementation, and dissolution on reservoir quality [25,26]. Together, these studies have established a regional framework for understanding Chang 9’s sedimentation, source rock development, reservoir heterogeneity, and petroleum accumulation.
However, the different datasets have commonly been applied separately to source rock or reservoir evaluation, leaving the coordinated variation in these parameters within high-frequency mud–silt interbeds insufficiently constrained. It remains unclear whether the TOC and absolute (S1) content vary synchronously between adjacent lithofacies, whether the (S1) response per unit organic carbon follows the same trend, and whether the porosity and permeability exhibit a corresponding lithofacies-dependent pattern. By comparing these relationships, this study evaluates the degree of consistency and the points of divergence among organic matter enrichment, hydrocarbons already present in the rock, and reservoir properties at the vertical scale of a single well. This approach also avoids inferring oil mobility or hydrocarbon migration from individual parameters without direct supporting evidence. Well Danye-1 is located in the Zhidan area of Northern Shaanxi, Ordos Basin. The Chang 9 interval contains a vertically continuous succession of closely interbedded mudstone, silty mudstone, siltstone, and fine sandstone, providing a suitable record for investigating fine-grained lacustrine sedimentation.
This study focuses on the 1223–1255 m interval of the Chang 9 Member in Well Danye-1 and integrates core-scale sedimentological observations, X-ray diffraction, TOC analysis, Rock-Eval pyrolysis, chloroform-extractable bitumen “A”, vitrinite reflectance, scanning electron microscopy, and porosity–permeability measurements. The aims are to (1) characterize the vertical lithofacies associations and variations in mineral composition; (2) compare TOC, S1, S2, and chloroform-extractable bitumen “A” among lithofacies and determine whether increasing organic matter abundance is accompanied by a corresponding rise in S1 per unit TOC; and (3) integrate porosity–permeability data with SEM-observed pore types to establish whether reservoir properties and organic–geochemical parameters display consistent lithofacies responses. By jointly constraining vertical lithofacies variations within a high-frequency interbedded succession using multiple datasets, this work provides a high-resolution, well-scale case study for the detailed evaluation of fine-grained and silt-rich Chang 9 interbeds and offers a geological basis for further petroleum exploration in this interval of the Ordos Basin.
2. Geological Setting
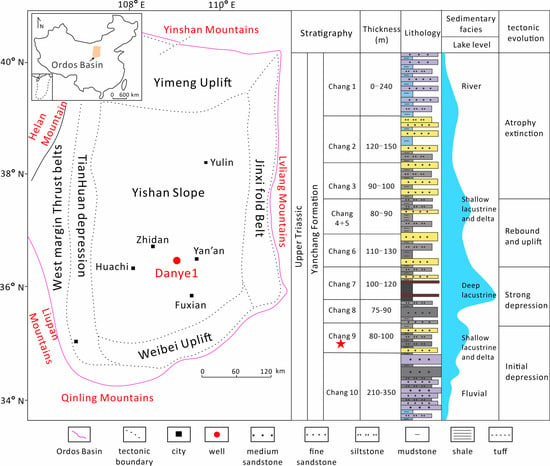
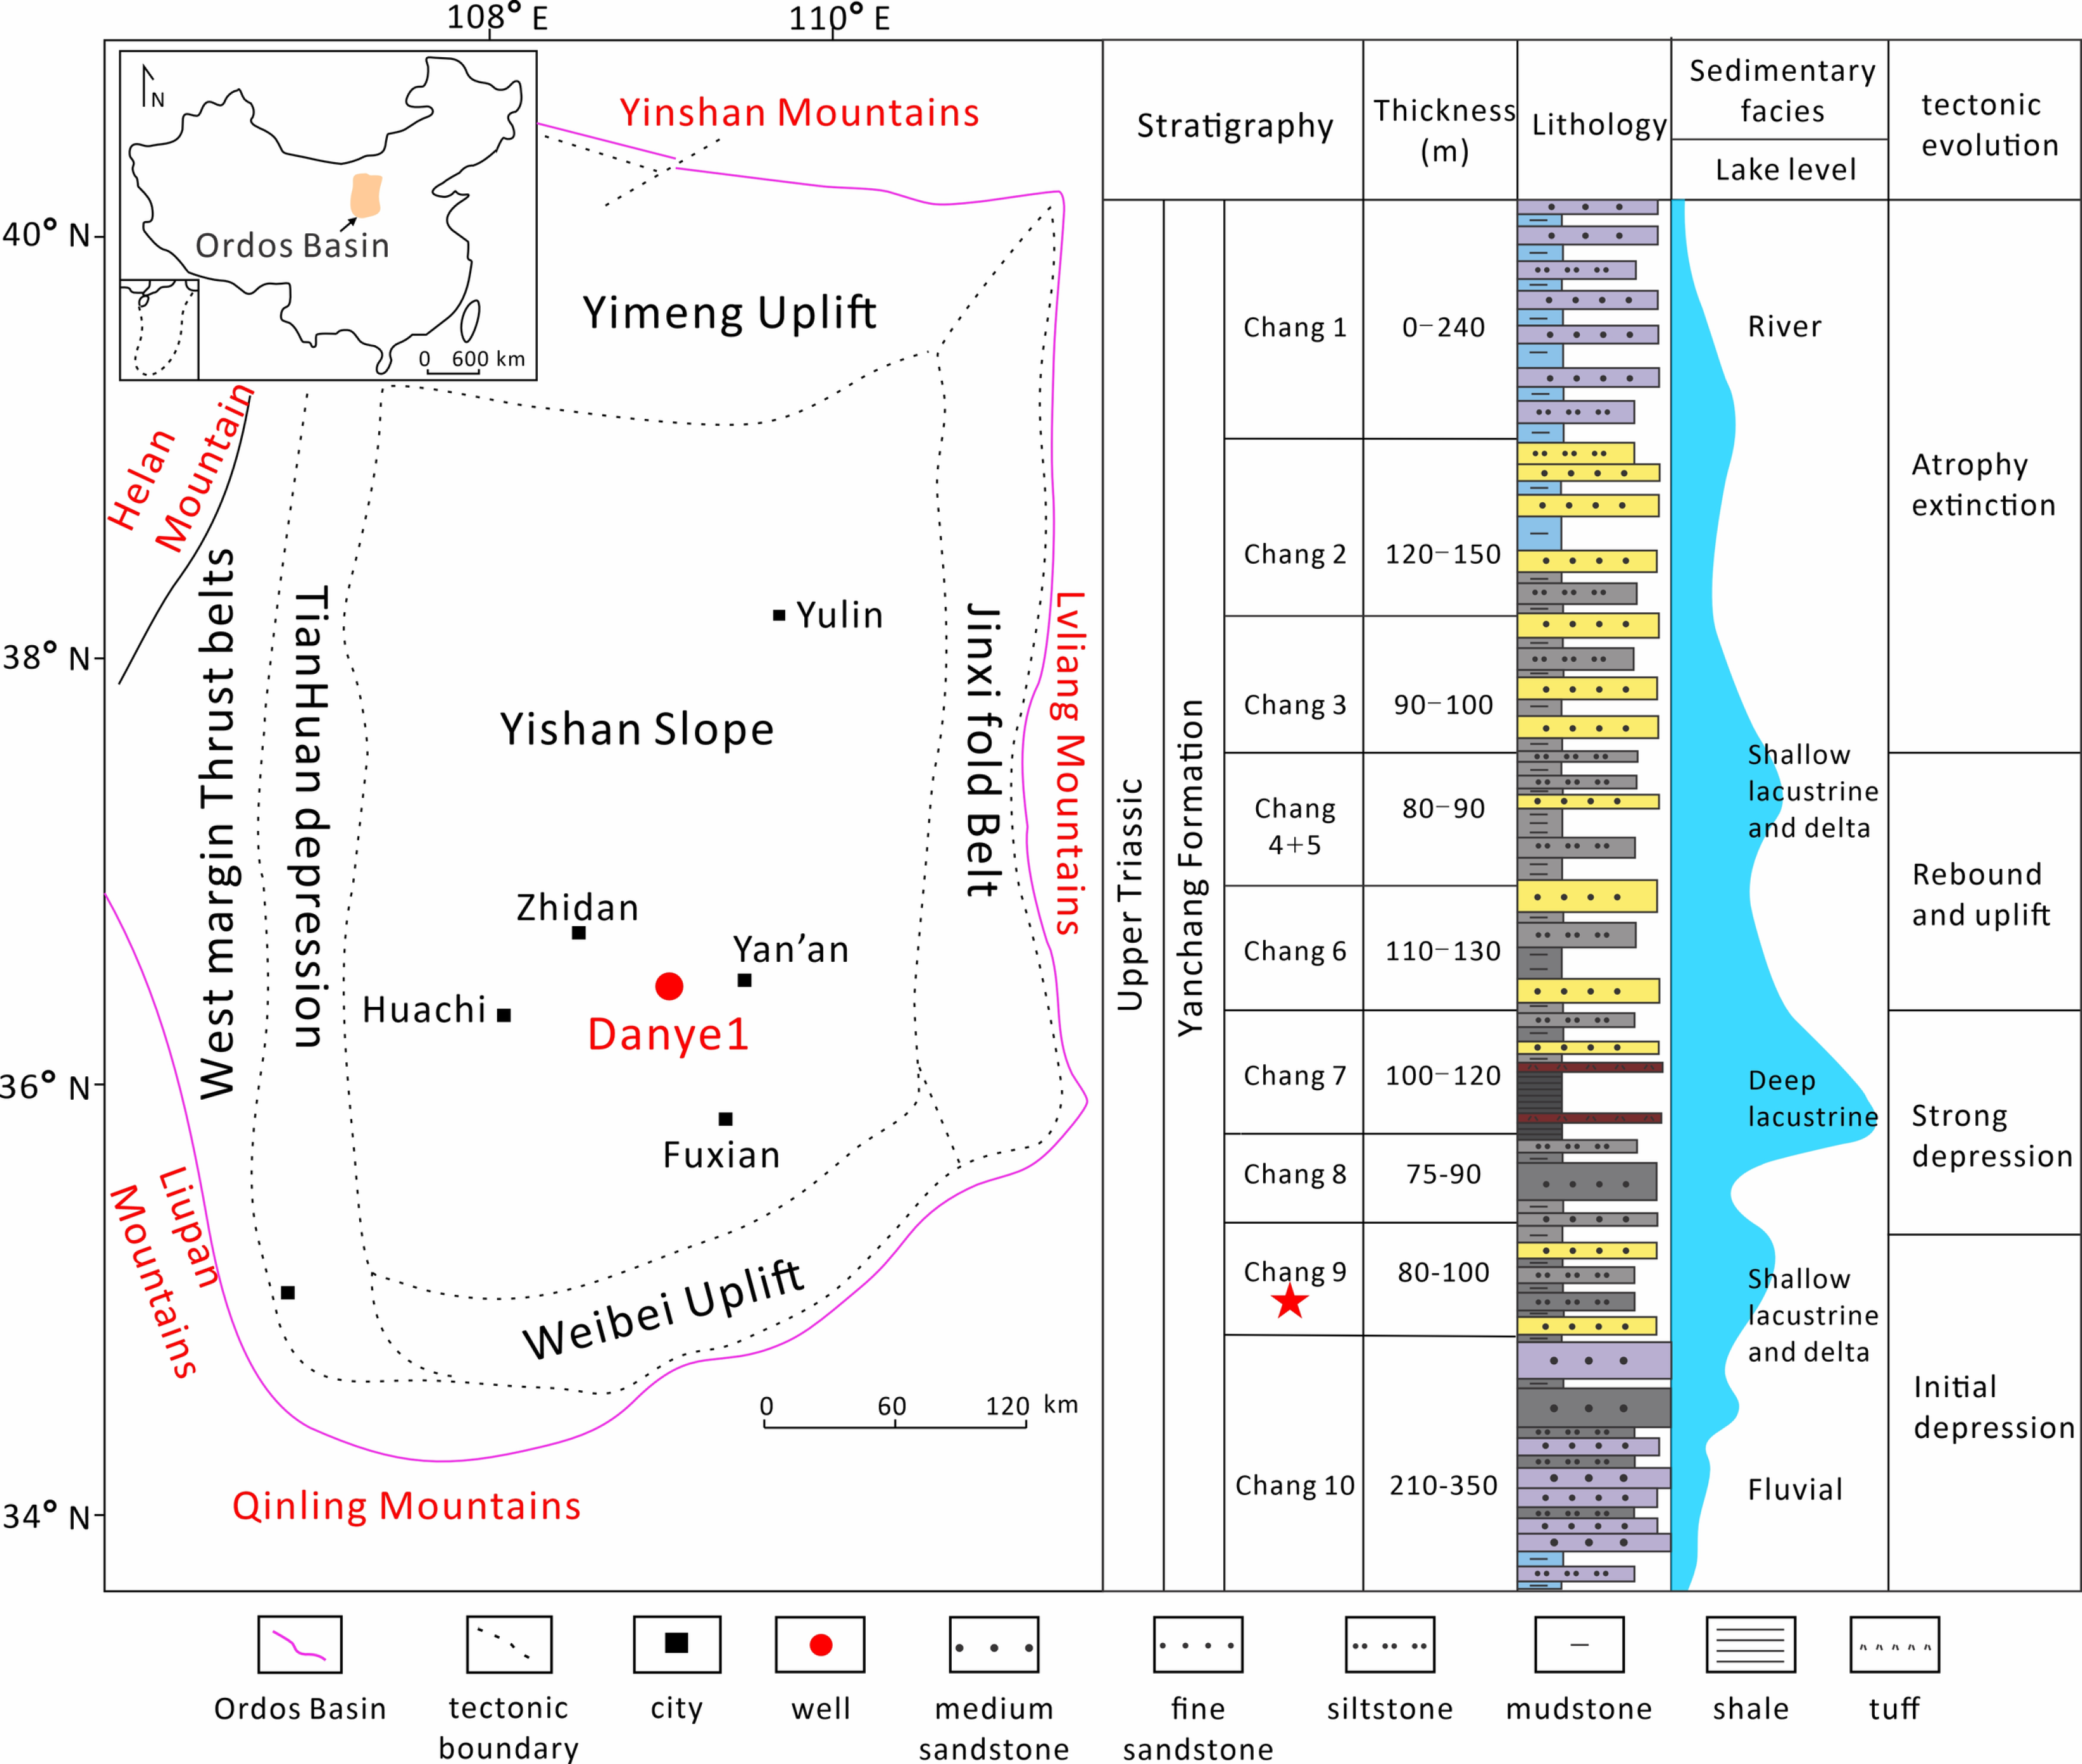
The Ordos Basin, located in the western part of the North China Craton, is a large cratonic basin that experienced relatively stable intracontinental subsidence and extensive lacustrine sedimentation during the Mesozoic [27,28]. Based on its present-day tectonic framework, the basin is commonly divided into six first-order structural units: the Yimeng Uplift, Weibei Uplift, Jinxi Fold Belt, Western Thrust Belt, Tianhuan Depression, and Yishan Slope. The study area lies in the northern part of the Shaanbei Slope in the central–western Ordos Basin, where relatively gentle structures provided favorable conditions for the preservation of Upper Triassic lacustrine fine-grained successions (Figure 1) [29,30]. During the Late Triassic, sustained basin subsidence and episodic lake-level rise promoted the deposition of the Yanchang Formation, which constitutes one of the most important continental petroleum-bearing successions in China [31,32]. In petroleum stratigraphic practice, the formation is conventionally subdivided, from base to top, into ten informal oil-bearing members, Chang 10 through Chang 1 [31,32]. The Chang 9 Member records an early major lake-transgressive stage, followed by the maximum lake expansion during the deposition of the Chang 7 Member; a smaller and relatively short-lived lake expansion occurred during the Chang 4 + 5 interval [4,20]. These lake-level fluctuations controlled the repeated development of lacustrine mudstone and shale interbedded with siltstone and sandstone. Dark organic-rich mudstone and shale are especially widespread in the Chang 7 Member, while mudstone-rich lacustrine deposits also occur in the Chang 9 succession [32,33].
Figure 1.
Regional geological map and stratigraphic column of the Yanchang Formation in the Ordos Basin (modified from [29,30]). The red star represents the target layer.
The Chang 9 Member records an early stage of lake expansion, during which deltaic and shore-shallow-lacustrine environments remained widespread across the basin, while semi-deep to deep-lacustrine settings developed locally toward the basin center [20,32]. Sedimentation during this period was influenced by fluctuating lake levels, variable terrigenous supply, and episodic gravity flow activity [19,32,34]. Core observations from Well Danye-1 reveal dark laminated mudstone, silty mudstone, thin silty laminae, graded siltstone beds, massive mudstone, and locally developed soft-sediment deformation structures. These features record repeated alternations between low-energy suspension settling and event-driven sediment transport. Mud-rich intervals were mainly accumulated under relatively quiet, suspension-dominated lacustrine conditions, whereas silt-rich beds reflect episodic clastic influx and downslope sediment redistribution from delta-front or shallow-lacustrine settings [35].
Compared with the Chang 7 Member, which represents the maximum expansion of the Yanchang lake and contains laterally extensive, relatively thick shale-dominated successions, the Chang 9 interval records an earlier and generally shallower lake expansion stage with a stronger influence from deltaic sediment supply [20,32,36]. In Well Danye-1, the thinner mudstone intervals and frequent silty interbeds further indicate relatively active terrigenous input and recurrent event sedimentation during Chang 9 deposition.
3. Samples and Methods
3.1. Samples
Sampling for Well Danye-1 took place in the southeastern part of the Zhidan area, Ordos Basin. Core samples of various lithologies, including mudstone, silty mudstone, argillaceous siltstone, siltstone, and fine-grained sandstone, were collected from 1223 m to 1255 m of the Chang 9 Member of Well Danye-1 (Table S1). The sampled interval covers the principal lithofacies associations of the Chang 9 Member and preserves good vertical continuity, allowing lithofacies variations, organic geochemical characteristics, and pore system evolution to be evaluated within a consistent stratigraphic framework.
Detailed core description was conducted before laboratory analysis, with an emphasis on the lithology, sedimentary structures, lamination style, sandstone–mudstone interbedding, and visible oil-bearing features. Lithofacies were identified by integrating core observations, thin-section petrography, mineral compositions, and well-log responses. To minimize the effects of weathering and drilling-related contamination, all analytical specimens were taken from fresh inner parts of the cores. Powdered samples were prepared for organic geochemical and mineralogical analyses, oriented thin sections were used for petrographic observation, and argon-ion-polished blocks were prepared for scanning electron microscopy [37]. All analyses were carried out at the Lanzhou Center for Oil and Gas Resources, Northwest Institute of Eco-Environment and Resources, Chinese Academy of Sciences.
3.2. Organic Geochemistry
In total, 34 samples were prepared to perform organic geochemical analyses, which included total organic carbon, Rock-Eval pyrolysis, and chloroform bitumen “A” extraction (Table S2). Meanwhile, 57 samples were tested for vitrinite reflectance (Table S3).
For TOC measurement, samples were crushed to less than 200 mesh, 0.2 g of which was weighed on a balance and placed sequentially in a crucible before being transferred to a glass plate. Dilute hydrochloric acid at a 1:7 volume ratio was slowly added to the plate until it covered the crucible, and the mixture was left to soak for 12–15 h. The glass plate was then heated in a water bath with the temperature controlled below 80 °C until no reaction occurred upon the addition of the dilute acid; the heating was maintained at this temperature for an additional 30 min. The crucible was placed on a filter press, rinsed thoroughly with distilled water, removed, and arranged sequentially on a metal crucible rack. The sample was subsequently placed in a constant-temperature drying oven and dried at 80 °C for 4 h. A combustion aid (tungsten) was added to the crucible, and the sample was analyzed using a LECO CS-230 carbon–sulfur analyzer. A duplicate sample was tested every eight samples. The sensitivity of the instrument and the accuracy for standard and duplicate samples were generally better than 0.1 μg/g and 0.1%, respectively. TOC values are expressed in wt.% [38] and were used to evaluate organic matter abundance.
The Rock-Eval 6 instrument produced by the French VINVI company was used for rock sample pyrolysis analysis to obtain the S1, S2, Tmax, and hydrogen index (HI) values. First, the samples were ground to pass through a 200-mesh sieve. Approximately 100 mg of each powdered sample was weighed into a crucible, which was then covered with a lid. After the instrument had been preheated, the crucible was placed in the pyrolysis furnace and held isothermally at 300 °C for 3–4 min to quantify the thermally liberated hydrocarbons (S1). The furnace temperature was subsequently increased to 550 °C (heating rate: 25 °C/min) to determine the hydrocarbons generated from kerogen cracking (S2), and the temperature corresponding to the maximum S2 signal was recorded as Tmax. During heating from 300 to 390 °C, the CO2 released by kerogen pyrolysis was measured and reported as the S3 peak. S1 represents free hydrocarbons; S2 reflects the hydrocarbon generation potential of kerogen. Samples with TOC > 0.1% had an analysis error of less than 10%. The HI was calculated as S2 × 100/TOC and was used to characterize the organic matter type and hydrocarbon generation capacity [39]. The OSI = S1 × 100/TOC, where the OSI is expressed in mg HC/g TOC, S1 in mg HC/g rock, and TOC in wt.% [40]. S1 is affected by sample preservation, volatilization loss, contamination, maturity, mineral matrix effects, adsorption/desorption, and the influence of exogenous transported hydrocarbons; low total organic carbon levels exacerbate the OSI effect.
Chloroform bitumen “A” was extracted from powdered samples with purified chloroform in a Soxhlet apparatus for 72 h [41]. Chloroform bitumen “A” is used here as a measure of solvent-extractable organic matter. It is not treated as a direct proxy for movable or producible oil.
Fifty-seven mudstone samples were selected for vitrinite reflectivity measurement. The rock samples were first crushed to separate organic particles, which were then mixed with epoxy resin to form optical sections. Measurement was performed using an Axio Scope.A1 Pol microscope and MSP200, which includes a polarizing microscope equipped with a photomultiplier tube for light intensity measurement. The filtering device uses a monochromatic filter, with the transmission peak wavelength strictly controlled at 546 nm ± 5 nm (green light) and a half-peak width of less than 30 nm to reduce light wave interference. An oil-immersed objective lens was used to measure the aperture within a limited area of less than 80 μm, and it had to coincide with the center of the crosshair of the eyepiece. The standard sample was calibrated using yttrium aluminum garnet. When 0.5% ≤ Ro ≤ 2.0%, the number of measuring points should not be less than 20. If the number of measurement points is less than 10, it should be noted that the data are for reference only. The determination of vitrinite reflectance was based on the Chinese Petroleum and Natural Gas Industry Standard SY/T5124-2012 “Method for Determination of Vitrinite Reflectivity in Sedimentary Rocks” [42]. Reprocessing: If the polished surface of the sample has been exposed to air or oil for a long time, it must be repolished according to the standard and dried in a dryer (or 30–40 °C oven) before measurement to avoid surface oxidation or contamination affecting the reflected light signal. Suppression treatment: For low-maturity samples (Ro < 0.5%) or mirror bodies with surface oxidation interference, special attention should be paid to eliminating oxidation interference. During measurement, particles with smooth surfaces and no oxidation traces should be strictly screened or corrected by data exclusion to ensure that the measured values accurately reflect the true degree of thermal evolution.
3.3. Mineralogy and Petrological Analysis
Mineralogical composition analysis was performed on 38 samples using X-ray diffraction (Table S4). Both sample preparation and testing for X-ray diffraction analysis were conducted at the Gansu Provincial Key Laboratory of Oil and Gas Resources, Northwest Institute of Eco-Environmental Resources, Chinese Academy of Sciences. The mineral compositions were determined by X-ray diffraction (XRD) using a Rigaku Ultima IV (Japan), with accuracy of 1.0%. The detailed instrument parameters are as follows: (1) X-ray generator (3 kW, Cu Kα), (2) goniometer (285 mm) with goniometer range of -110~180°, and (3) detector: one-dimensional high-speed omnipotent matrix detector with active area of 12.8 × 20 mm, maximum count of 1 × 10¹² cps. The scanning speed was 3°/min, and the scanning angle was in the range of 3–50°. Generally, the accuracy and stability for test samples were better than ± 0.02° and ± 0.002 in this study, respectively. The detailed testing steps were as follows: samples were ground to 200 mesh and sieved; the powdered samples were then placed in grooves on a sample holder, ensuring that the measured surface remained rough while maintaining flatness and uniformity relative to the holder’s surface, before being mounted on an X-ray diffractometer for whole-rock analysis. Clay mineral analysis involves separating clay minerals using the suspension method. The separated clay is then mixed with water equivalent to four times its volume, shaken thoroughly, and applied to a glass slide by dipping a glass rod; the sample is air-dried. The resulting dried thin slice is termed a natural slice (N slice) and analyzed on a testing apparatus at an angle of 3–15° and a scanning speed of 3°/min. The natural slice is subsequently treated with ethylene glycol at 50 °C for 7 h to produce an ethylene glycol-saturated slice (E slice), which is immediately tested under the same conditions (angle 3–30°, speed 3°/min). Finally, the E slice is heated in a muffle furnace at 450–480 °C for 2 h, allowed to cool naturally, and then tested again at the same parameters. Mineral identification followed established XRD procedures [43]. The mineral content of both whole-rock and clay minerals was calculated according to the Chinese petroleum and natural gas industry standard SY/T5163-2010 “X-ray Diffraction Analysis Methods for Clay Minerals and Common Non-Clay Minerals in Sedimentary Rocks” [44].
Petrographic observations were conducted on thin sections, and image analysis was used for quantitative measurement to identify the rock texture, grain composition, sedimentary structures, cementation, and dissolution features. Scanning electron microscopy (SEM) was performed on argon-ion-polished and carbon-coated samples using a field-emission SEM device. First, the rock samples were cut and ground to an appropriate size, ensuring a smooth surface to prevent electron beam defocusing caused by roughness. Then, the samples were placed in a carbon sputtering apparatus and the chamber was evacuated until the required vacuum level was achieved, followed by carbon sputtering treatment. Subsequently, the samples were examined using a field-emission scanning electron microscope (FESEM) and photographs were taken. The instrument model was the German Zeiss Merlin Compact. Actual operating conditions: acceleration voltage ranging from 20 V to 30 kV, continuously adjustable in 10 V increments, and probe current ranging from 5 pA to 20 nA. Imaging mode: Mixed imaging mode of secondary electrons and backscattered electrons. Investigated lithofacies: SEM observations focused on the pore type, pore morphology, mineral–organic matter associations, clay mineral occurrence, dissolution features, and microfractures [36]. Examination depth: The examination depth of SEM is affected by the acceleration voltage. The low-acceleration-voltage (such as 1–5 kV) electron beam penetrates shallowly (about 5–10 nm on the surface), mainly reflecting the microstructure of the rock surface; a high-acceleration-voltage (such as 10–20 kV) electron beam (penetration depth of about 0.1–1 μm) can reflect the microstructure and composition distribution inside or across the rock.
Under normal circumstances, natural microcracks propagate along mineral particle boundaries, in a transgranular manner, and take on a dendritic or network-like shape. The bottom is smooth and often accompanied by a real microscopic morphology, such as local ductile dimples and cleavage steps, and their distribution is consistent with the original structure and stress direction of the rock. The preparation of artifacts usually has artificial or local anomalous features—for example, scratches and indentations caused by mechanical cutting or friction (with strong directionality and curled edges, different from the equiaxed or smooth bottom of real microcracks). Pollution artifacts, such as dust, fibers, or corrosion products attached to the surface, are randomly distributed, and EDS spectra show non-matrix elements. To distinguish natural cracks and prepare artifacts, it is necessary to incorporate EDS energy spectrum analysis to confirm the elemental composition of abnormal areas (excluding contamination artifacts), combine this with low-magnification panoramic observation to confirm the direction of abnormal traces (excluding mechanical damage artifacts), and make logical judgments based on the original stress state of the sample.
No three-dimensional pore network reconstruction or quantitative image-based connectivity analysis was performed; therefore, SEM observations are not used as direct evidence of bulk pore connectivity or fluid transport.
3.4. Reservoir Properties
A total of 53 samples were analyzed for reservoir porosity and permeability (Table S5), with the porosity measured using the helium method and permeability determined by the sampling pulse attenuation method. The samples were cut into plug specimens measuring 2–5 cm in length and 2.5 cm in diameter, cleaned, dried, and then loaded into the PHI-220 helium porosity analyzer and the PDP-200 pressure pulse ultra-low permeability analyzer for the measurement of the porosity and permeability, respectively. Cleaning and drying process: chloroform was used to remove oil stains, impurities, and residual fluids from the surfaces of the rock samples, ensuring smooth pore channels; the cleaned sample was placed in an oven and dried to a constant weight at around 105 °C to remove moisture and avoid moisture affecting the porosity and permeability measurement results. Before testing, it is necessary to conduct a leak check on the testing system: close all valves, fill the system with gas at a certain pressure, and observe whether the pressure is stable. If the pressure drops, it indicates that there is a leak in the system, and the leak point needs to be investigated and repaired to ensure the accuracy of the test results. The porosity tester operated under a helium pressure of 200 psi, with the solenoid valve controlling the pressure at 100 psi. The permeability tester operated under a nitrogen pressure of 1000 psi and a confining pressure of 1450 psi, with the solenoid valve regulating the pressure at 100 psi. The repeatability error of porosity testing should not exceed ± 0.1%, and the repeatability error of permeability testing should not exceed ± 5%.
3.5. Statistical Analysis
Descriptive statistics were calculated from the final master dataset. Because several geochemical and petrophysical variables showed skewed distributions and the numbers of observations differed among lithofacies groups, relationships between continuous variables were evaluated using Spearman’s rank correlation coefficient (ρ). Differences between the mud-rich and silt-rich groups were evaluated using the Mann–Whitney U test. Sample numbers (n) and p values are reported together with the corresponding statistical results. Linear regression lines in crossplots are retained only as descriptive visual aids and are not used alone to infer genetic relationships. Statistical significance was evaluated at p < 0.05.
4. Results
4.1. Lithology and Lithofacies
The Chang 9 Member in Well Danye-1 is dominated by fine-grained siliciclastic deposits. To facilitate discussion, we classify the nine lithological segments into two major categories: one comprising silt-rich groups (fine sandstone, siltstone, and argillaceous siltstone) and the other consisting of mud-rich groups (mudstone and silty mudstone). The studied interval at 1223–1255 m shows frequent vertical alternations between sandstone- and mudstone-dominated lithologies, with small amounts of tuff interbeds and lithological heterogeneity.
Lithofacies were classified following the texture-based nomenclature of Folk (1954) and Lazar et al. (2015) [45,46], with modifications appropriate for the Chang 9 succession. Lithofacies were classified primarily according to the relative proportions of clay-sized (<4 μm), silt-sized (4–63 μm), and sand-sized (>63 μm) terrigenous particles, supplemented by core observations, thin-section petrography, sedimentary structures, and the mineral composition. Mudstone and silty mudstone are mud-supported, with the latter containing more identifiable silt-sized grains or discrete silty laminae. Argillaceous siltstone and siltstone are silt-supported; the former contains an appreciable argillaceous matrix, while the latter is dominated by silt-sized grains. Fine sandstone is grain-supported and consists predominantly of fine-sand-sized particles. Sedimentary structures and the mineral composition were used as supporting rather than independent classification criteria.
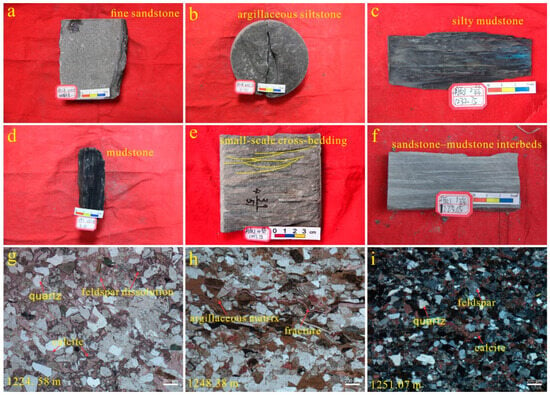
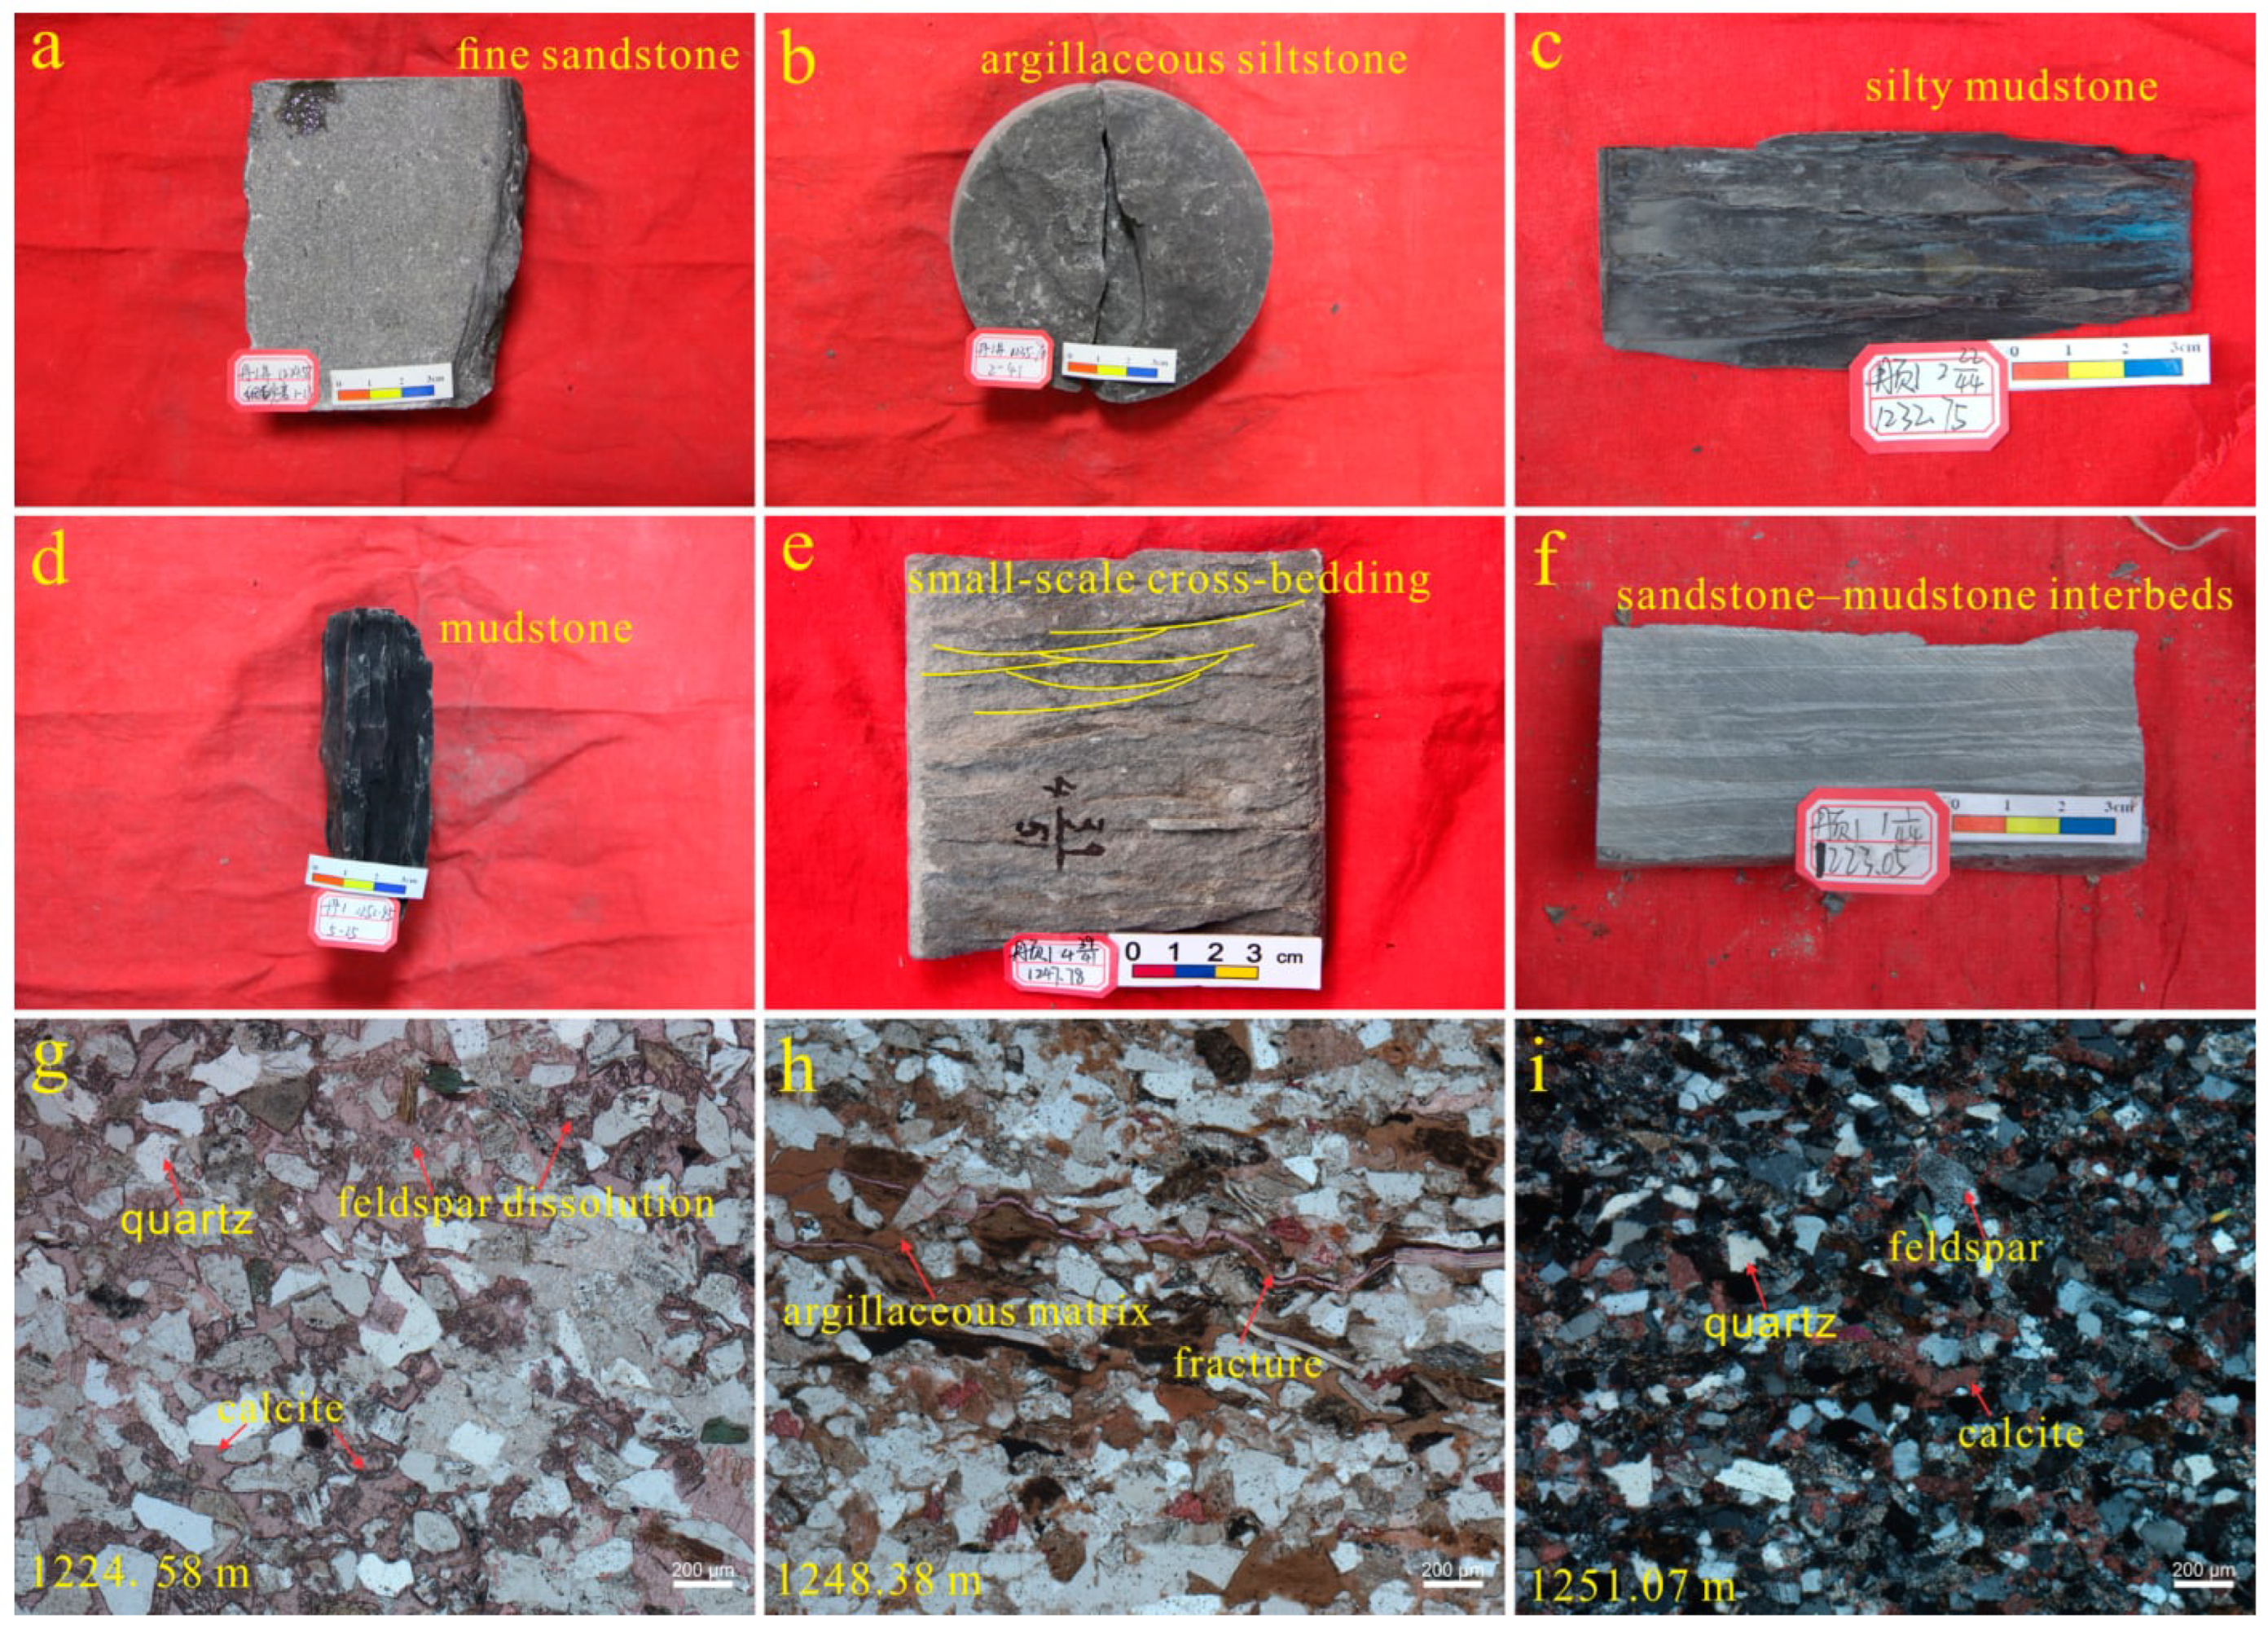
On the basis of the core observations, thin-section petrography, sedimentary structures, grain size characteristics, and mineral composition analysis, different lithofacies exhibit distinct mineral assemblages and sedimentary structural features. The fine sandstone lithofacies is generally gray and composed mainly of quartz and feldspar grains, with relatively low clay mineral content (Figure 2a). Parallel bedding and small-scale cross-bedding are locally developed (Figure 2e,f). The siltstone and argillaceous siltstone lithofacies are dark gray and characterized by thin lamination and moderate clay content (Figure 2b). The silty mudstone and mudstone lithofacies are dark gray to black and commonly display horizontal bedding, lenticular bedding, and locally developed soft-sediment deformation structures (Figure 2c,d).
Figure 2.
Core photographs and thin-section photomicrographs showing lithofacies, sedimentary structures, and petrographic characteristics of the Chang 9 Member in Well Danye-1: (a) 1224.58 m, fine sandstone; (b) 1235.70 m, argillaceous siltstone; (c) 1232.75 m, silty mudstone; (d) 1252.45 m, mudstone; (e) 1247.78 m, small-scale cross-bedding; (f) 1223.05 m, sandstone–mudstone interbeds; (g) 1224.58 m, calcite cement and feldspar dissolution; (h) 1248.38 m, argillaceous matrix and microfractures; (i) 1251.07 m, framework grains, calcite cement and microfractures. The Chinese labels in Figures a–f represent the core information taken during photography.
Vertically, the Chang 9 Member can be divided into three lithological intervals. The upper interval at 1223–1235 m is dominated by silty mudstone and siltstone, with a relatively low proportion of sandstone. The middle interval at 1235–1244 m contains the thickest mudstone succession and the highest shale proportion. The lower interval at 1244–1255 m is characterized by increased fine sandstone interbeds and relatively coarse-grained lithologies. Thin-section observations show that the sandstones are mainly lithic feldspathic sandstone and feldspathic lithic sandstone (Figure 2g–i). Grain contacts vary upward from dominantly linear contacts in the lower interval to point-linear and floating contacts. Carbonate cementation is common, with calcite occurring as pore-filling and replacive cements.
The sedimentary structures observed in the cores include parallel bedding, ripple lamination, lenticular bedding, trough cross-bedding, dewatering structures, and soft-sediment deformation structures. Plant fragments, rhizomes, bivalve shells, and bioturbation traces are locally present. These observations indicate that the Chang 9 Member is characterized by interbedded fine-grained siliciclastic deposits with variable sandstone–mudstone ratios and diverse sedimentary structures.
4.2. Mineralogical Characteristics
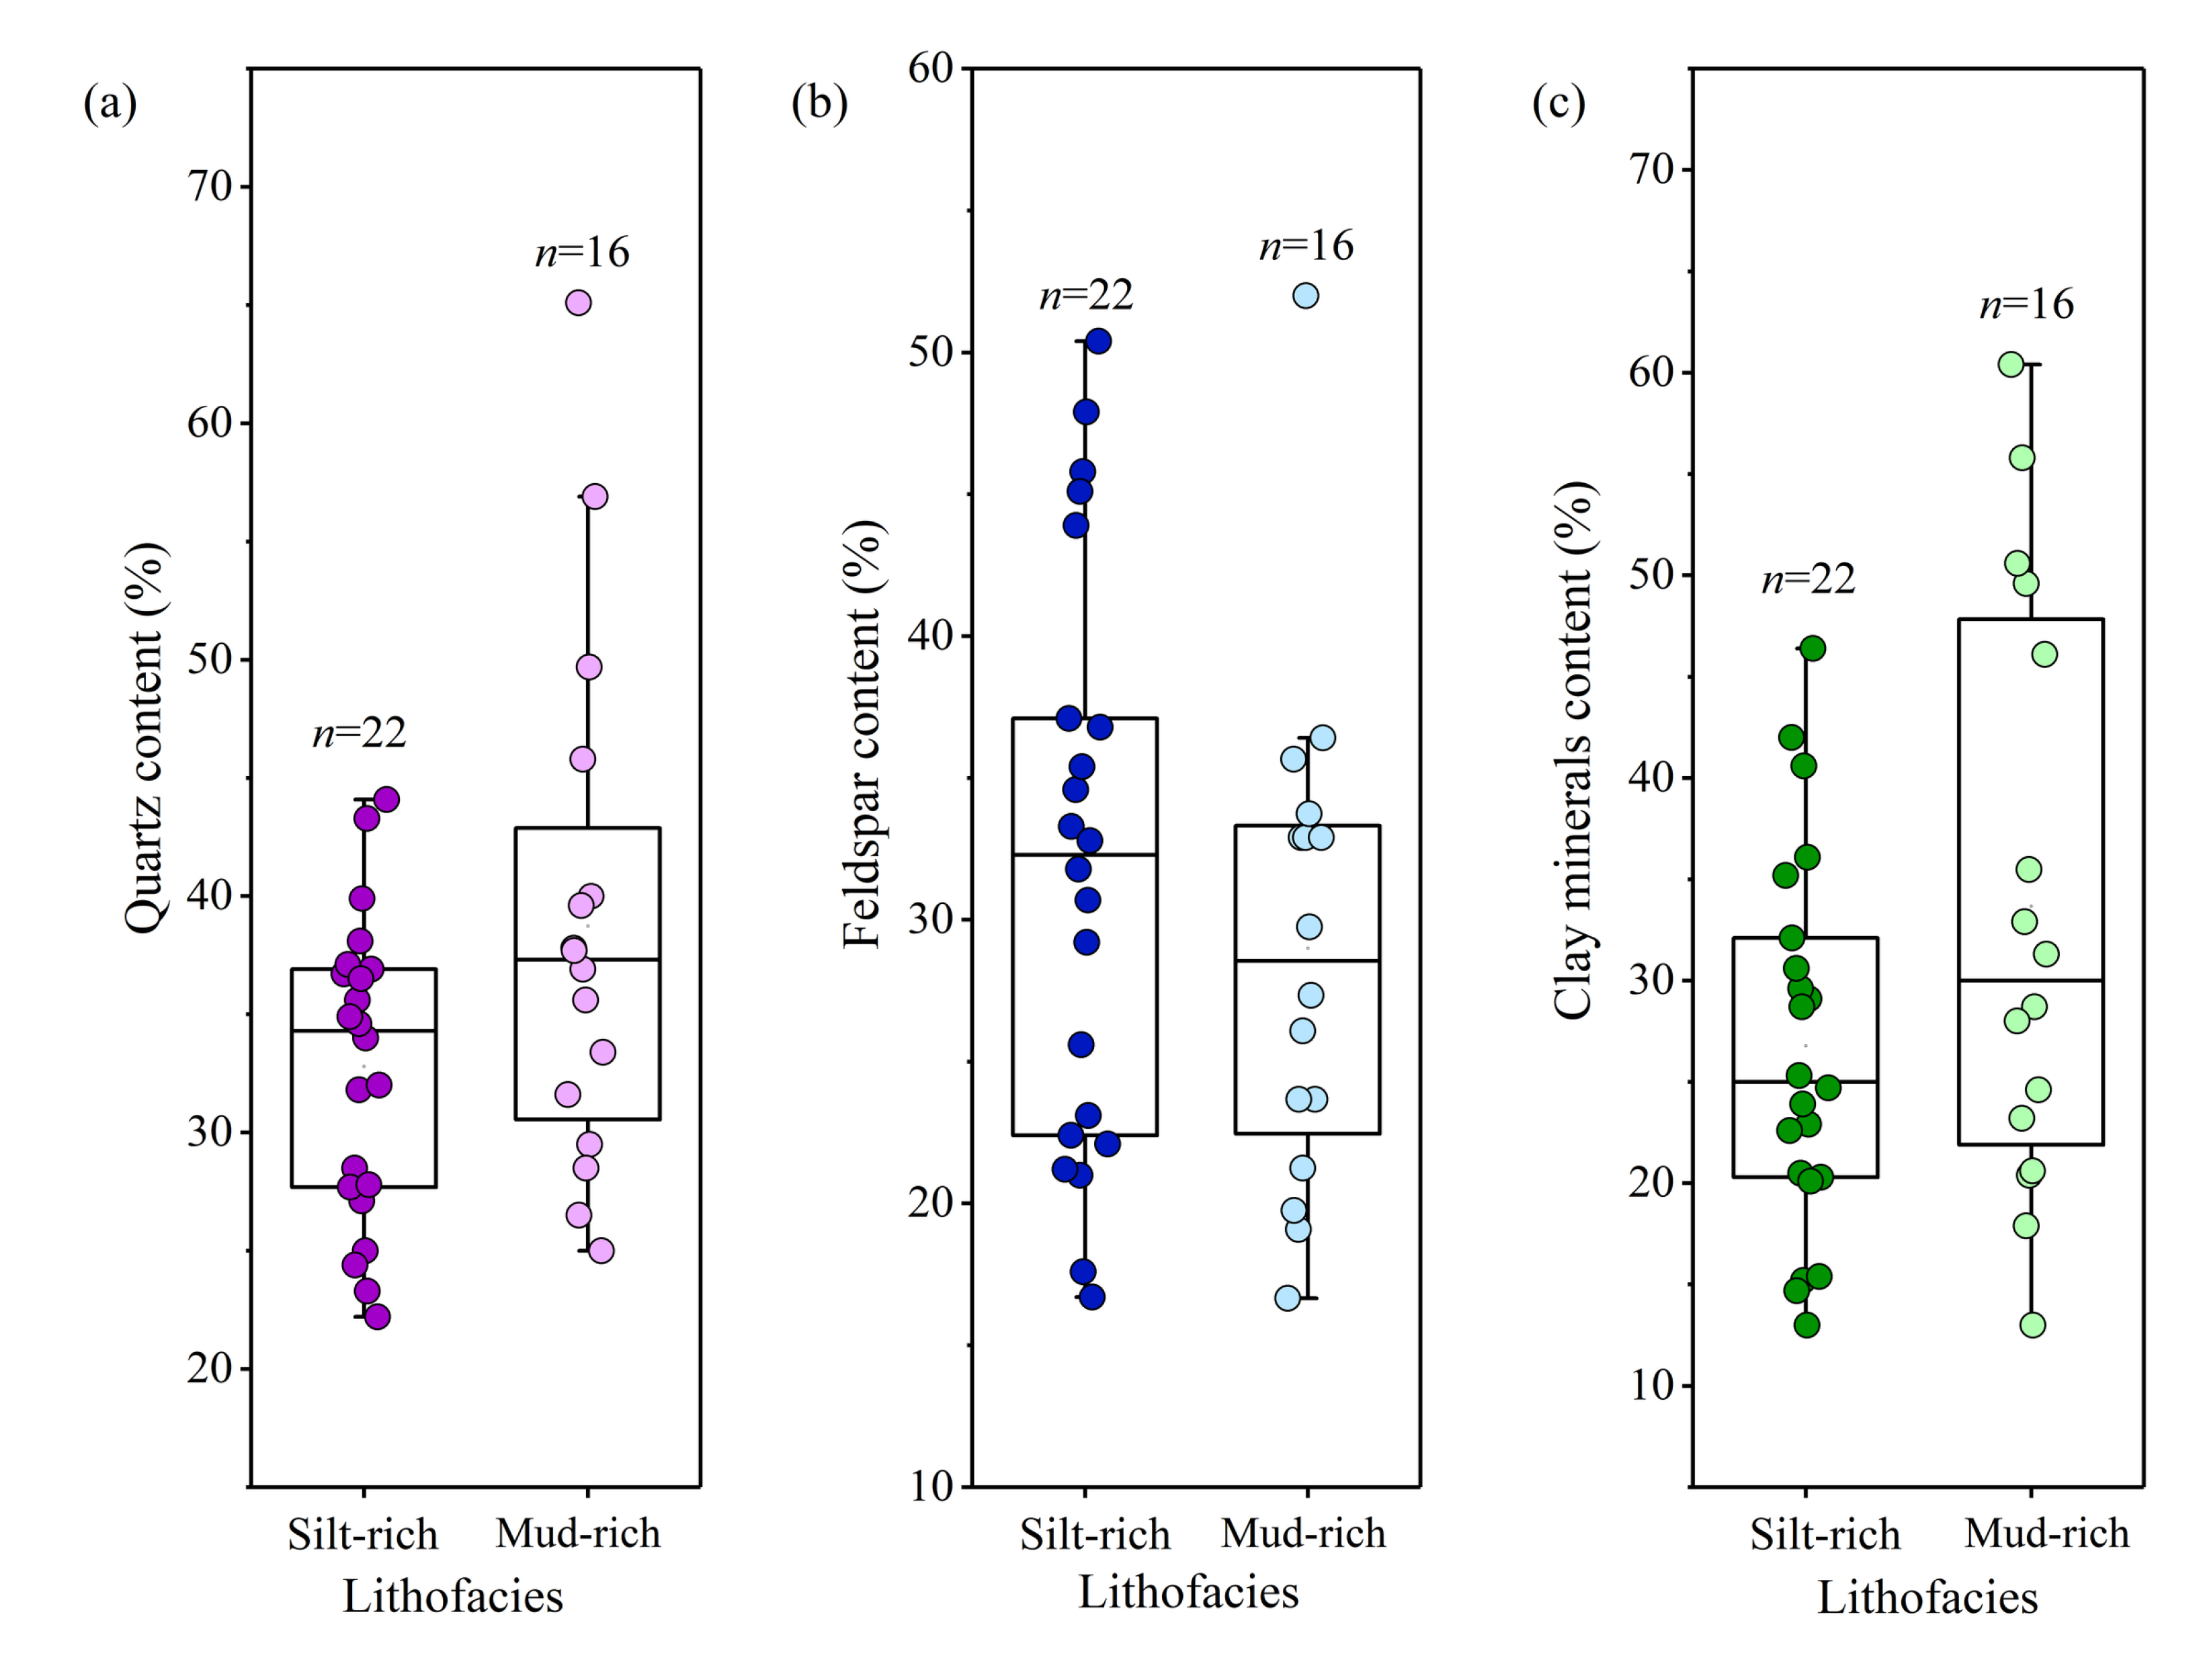
The X-ray diffraction analyses show that the Chang 9 shale and associated fine-grained sediments are dominated by quartz, feldspar, and clay minerals, with minor carbonate minerals and pyrite. The quartz content ranges from 22.2% to 65.1% (mean = 35.7%), the feldspar content ranges from 8.0% to 50.4% (mean = 28.2%), and clay minerals range from 13.0% to 60.4% (mean = 30.0%). Carbonate minerals (primarily calcite, with minor dolomite) typically account for less than 15% of the total mineral composition but can reach up to 33.8% in some individual samples. Pyrite occurs in trace to minor amounts and is locally enriched in mudstone intervals. The content of brittle minerals, including quartz, feldspar, and carbonate minerals, can reach up to 87%, indicating a high overall abundance of brittle minerals in the study area. Clay minerals mainly consist of illite, chlorite, illite/smectite mixed-layer minerals, and minor kaolinite. Illite and illite/smectite mixed layers constitute the dominant clay mineral assemblage. Kaolinite occurs mainly in mudstone lithofacies and is rarely observed in sandstone intervals. The mineral composition varies systematically among lithofacies. Fine sandstone and siltstone lithofacies are enriched in feldspar. In contrast, mudstone and silty mudstone lithofacies contain higher clay mineral content. Carbonate minerals are locally enriched in calcareous sandstone intervals.
Vertical mineralogical variations are not very significant. No statistically significant monotonic relationship with depth is observed for quartz (Spearman ρ = 0.19, p = 0.254) or feldspar (ρ = −0.21, p = 0.204). The clay mineral content shows a weak positive relationship with depth (ρ = 0.37, p = 0.022), although considerable sample-to-sample variability remains (Figure 3). Silt-rich samples contain significantly higher feldspar content than mud-rich samples. The SEM observations reveal widespread authigenic quartz, pyrite framboids, and clay mineral aggregates. Illite and mixed-layer clay minerals commonly occur as pore-lining and pore-filling phases, while pyrite mainly forms framboidal aggregates within organic-rich mudstones.
4.3. Organic Geochemistry Characteristics
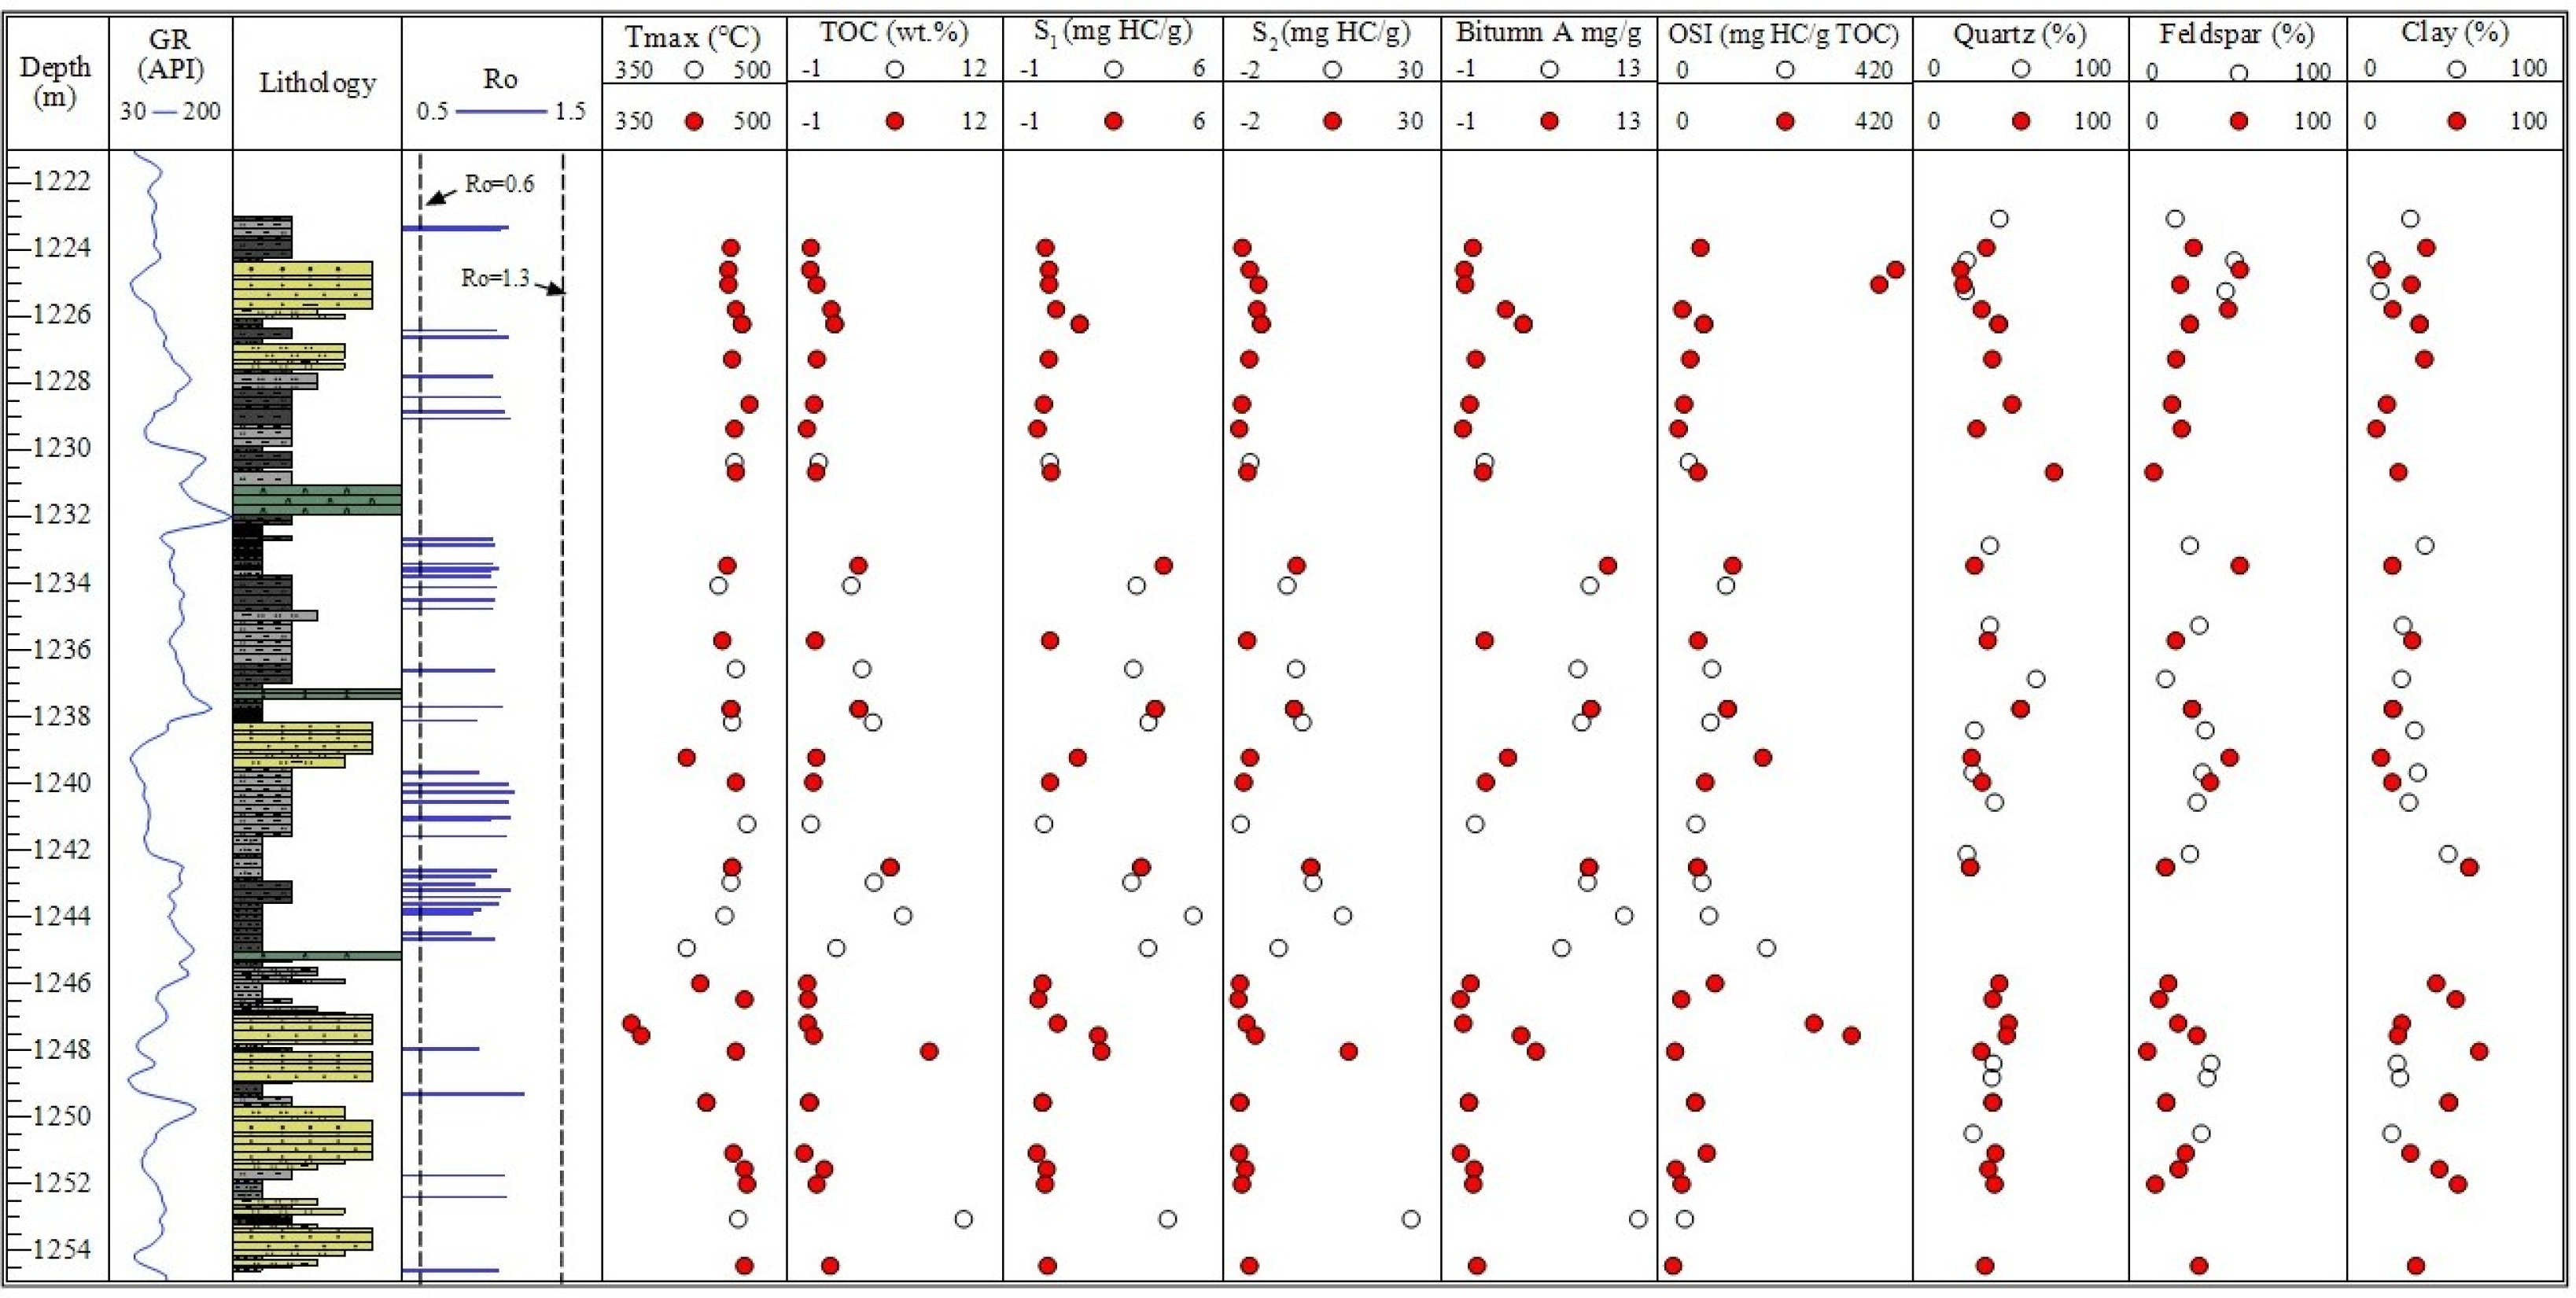
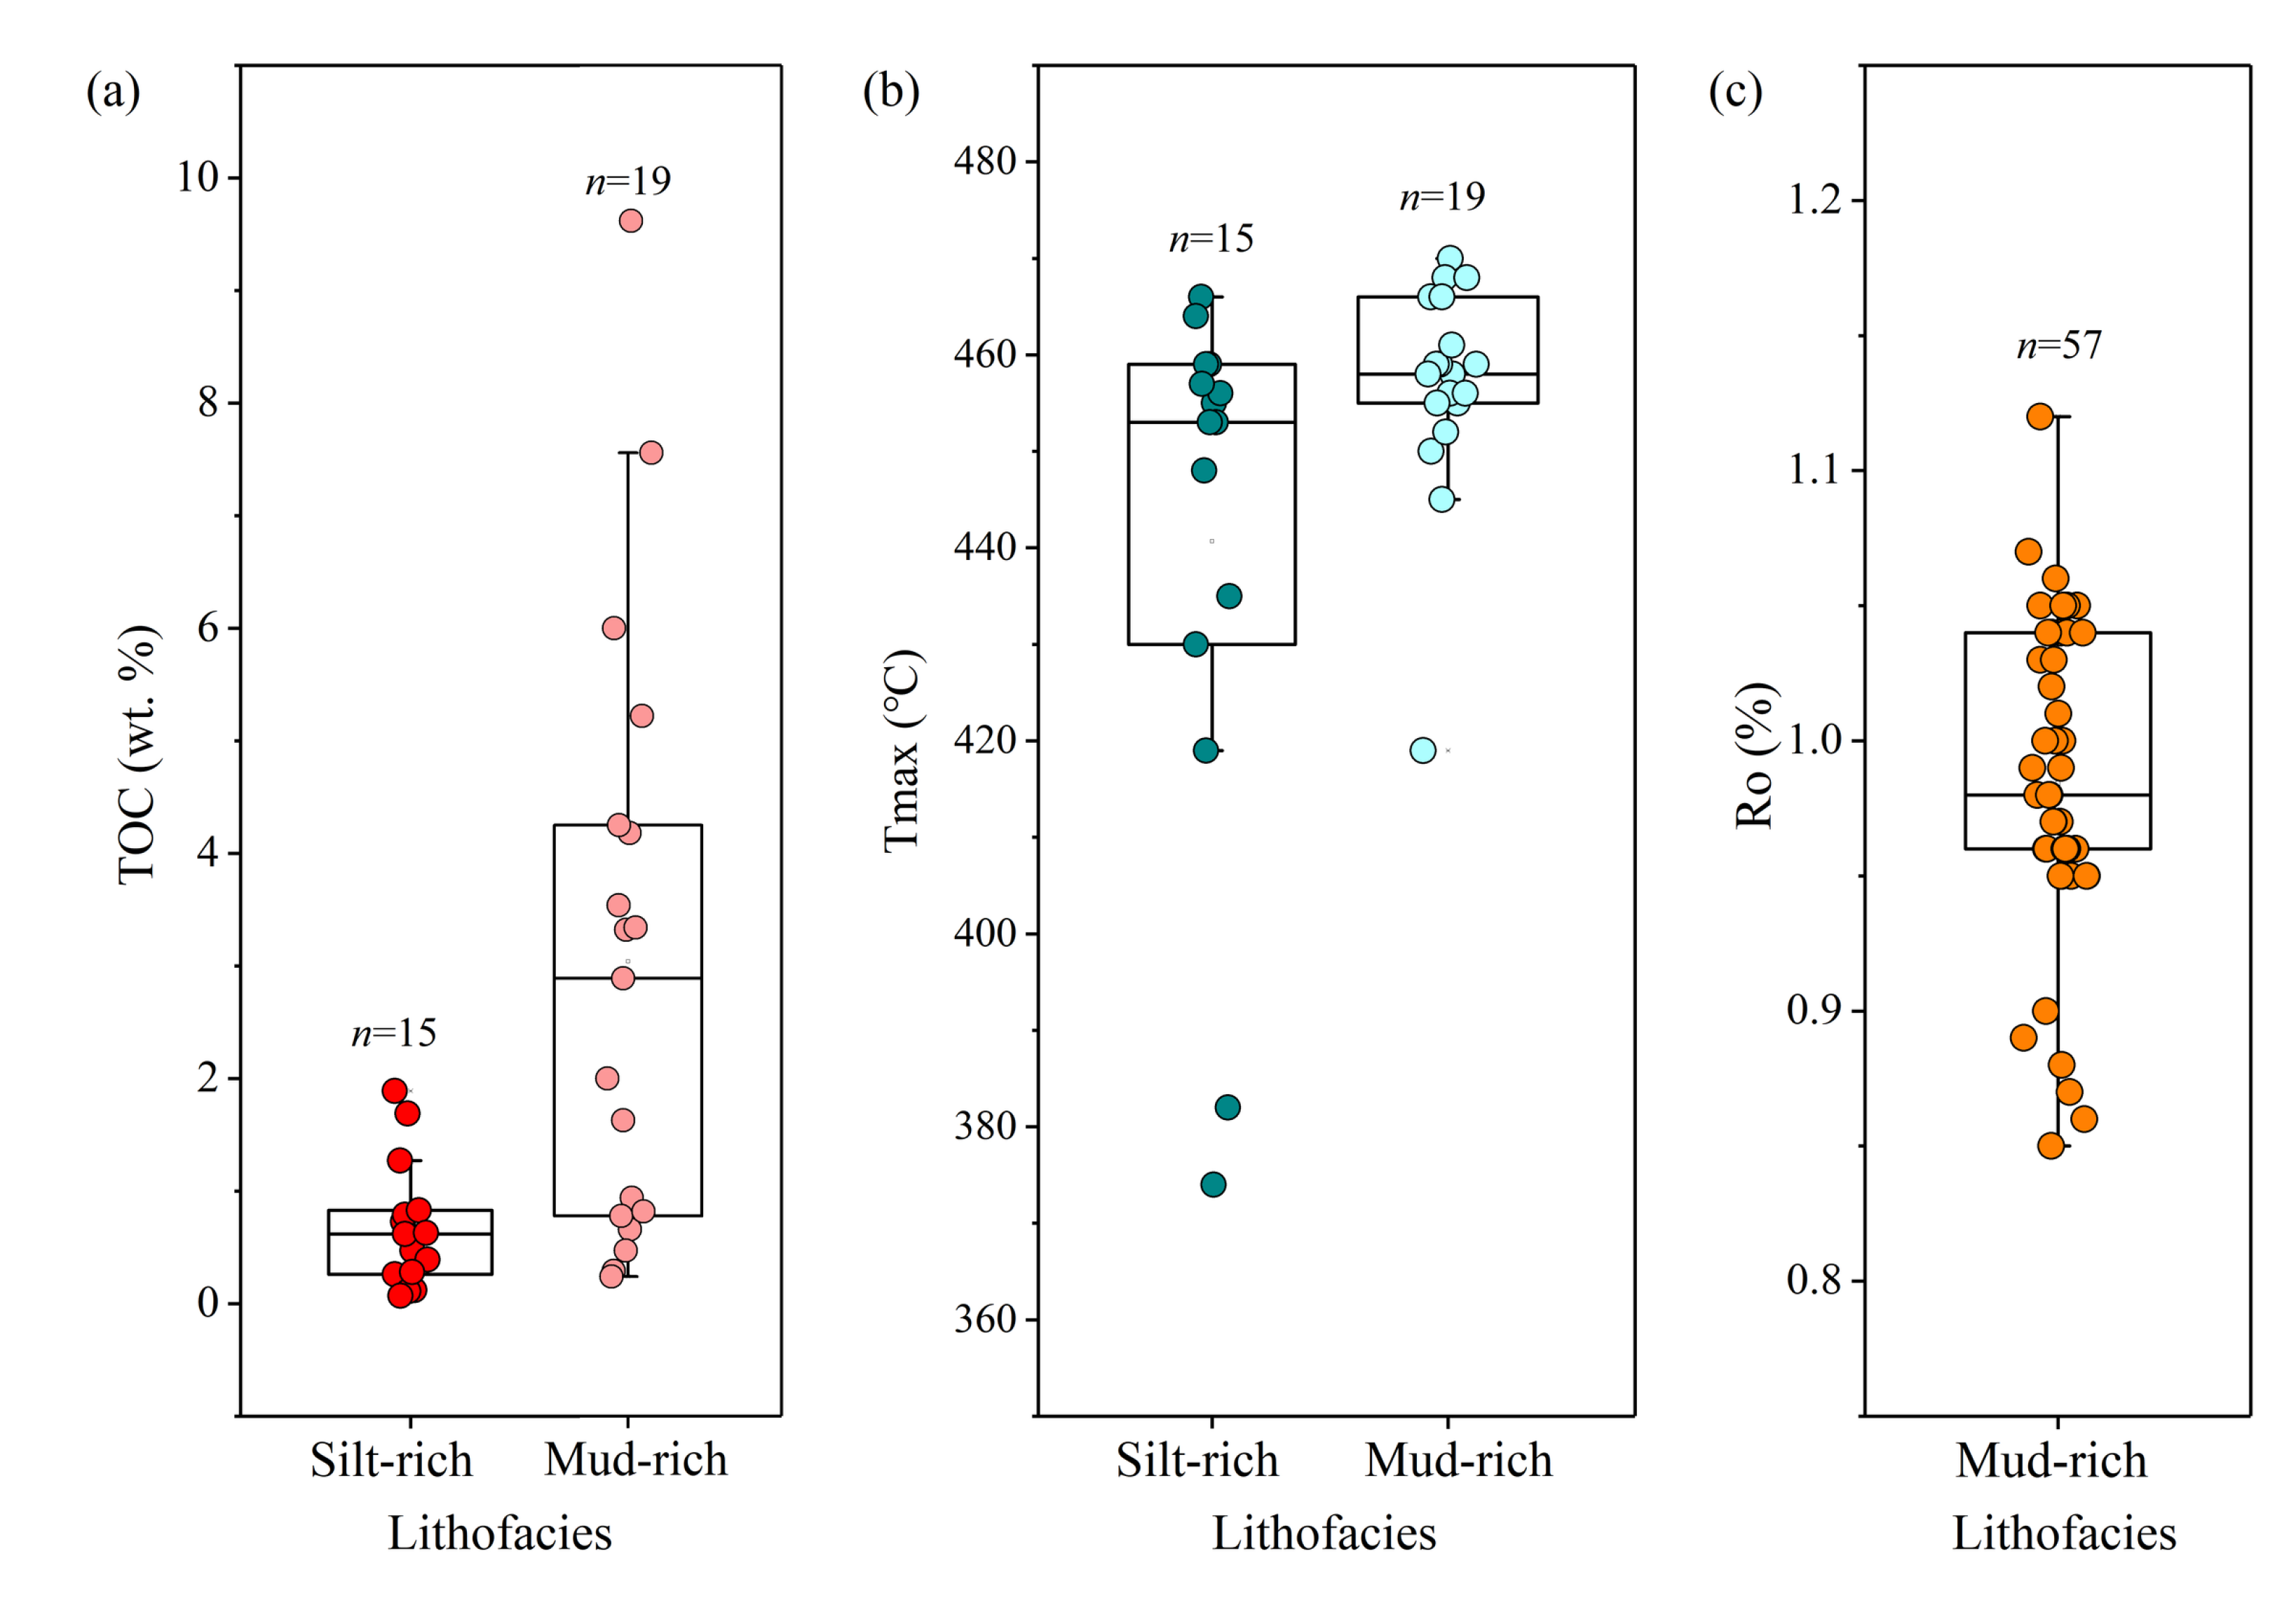
The Chang 9 Member shows considerable variation in organic matter abundance. The TOC values range from 0.07 wt.% to 9.62 wt.%, with an average of 2.18 wt.%. Approximately 60% of the analyzed mud-rich samples have TOC values greater than 2 wt.% (Figure 4). The TOC content differs markedly among lithofacies. Mudstone and silty mudstone lithofacies generally exhibit higher TOC values than sandstone- and siltstone-dominated lithofacies. High TOC and bitumen “A” peaks are concentrated mainly in mud-rich intervals, but OSI peaks do not always coincide with TOC maxima (Figure 3). Organic-rich intervals are mainly concentrated in the middle part of the studied section at 1235–1244 m.
Figure 3.
Integrated stratigraphic column of the Chang 9 Member in Well Danye-1, showing lithofacies, thermal maturity, organic geochemical parameters, and mineral composition. The solid red circle represents the corresponding sample values one by one, while the circle represents the incomplete corresponding sample values.
The Chang 9 source rocks have Ro values of 0.85–1.15%, averaging 0.99%. The Tmax values range from 374 to 470 °C, with the range for mudstone being 419–470 °C (Figure 4). Several samples yielded anomalously low Tmax values associated with weak S2 responses. Because Tmax becomes unreliable when the S2 peak is weak or poorly resolved, these values were retained in the master dataset for transparency but excluded from thermal maturity interpretation. Thermal maturity is therefore evaluated primarily using vitrinite reflectance, with reliable Tmax values used only as supporting evidence. According to the current industry standard for evaluating hydrocarbon source rocks (SY/T 5735-2019 [47]) and the vitrinite reflectance data, the studied Chang 9 interval is thermally mature and lies within the oil generation window.
Figure 4.
Distributions of TOC and thermal maturity parameters among lithofacies in the Chang 9 Member of Well Danye-1. (a) Total organic carbon (TOC, wt. %); (b) Rock-Eval maximum pyrolysis temperature (Tmax, °C); and (c) vitrinite reflectance (Ro, %). In each box plot, the central horizontal line represents the median, and the box indicates the interquartile range (25th–75th percentiles).
The Rock-Eval pyrolysis results show that the S1 values range from 0.06 to 5.03 mg HC/g rock, with an average of 1.57 mg HC/g rock. The S2 values range from 0.16 to 25.61 mg HC/g rock and average 5.17 mg HC/g rock (Figure 3). The hydrocarbon generation potential, expressed as S1 + S2, ranges from 0.27 to 29.83 mg HC/g rock, with an average of 6.72 mg HC/g rock. The HI and OI values range from 55.34 to 489.29 mg HC/g TOC and from 0.56 to 106.82 mg CO2/g TOC, with average values of 222.90 mg HC/g TOC and 9.93 mg CO2/g TOC, respectively.
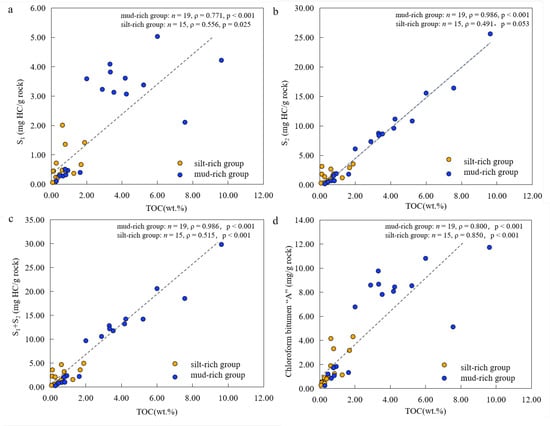
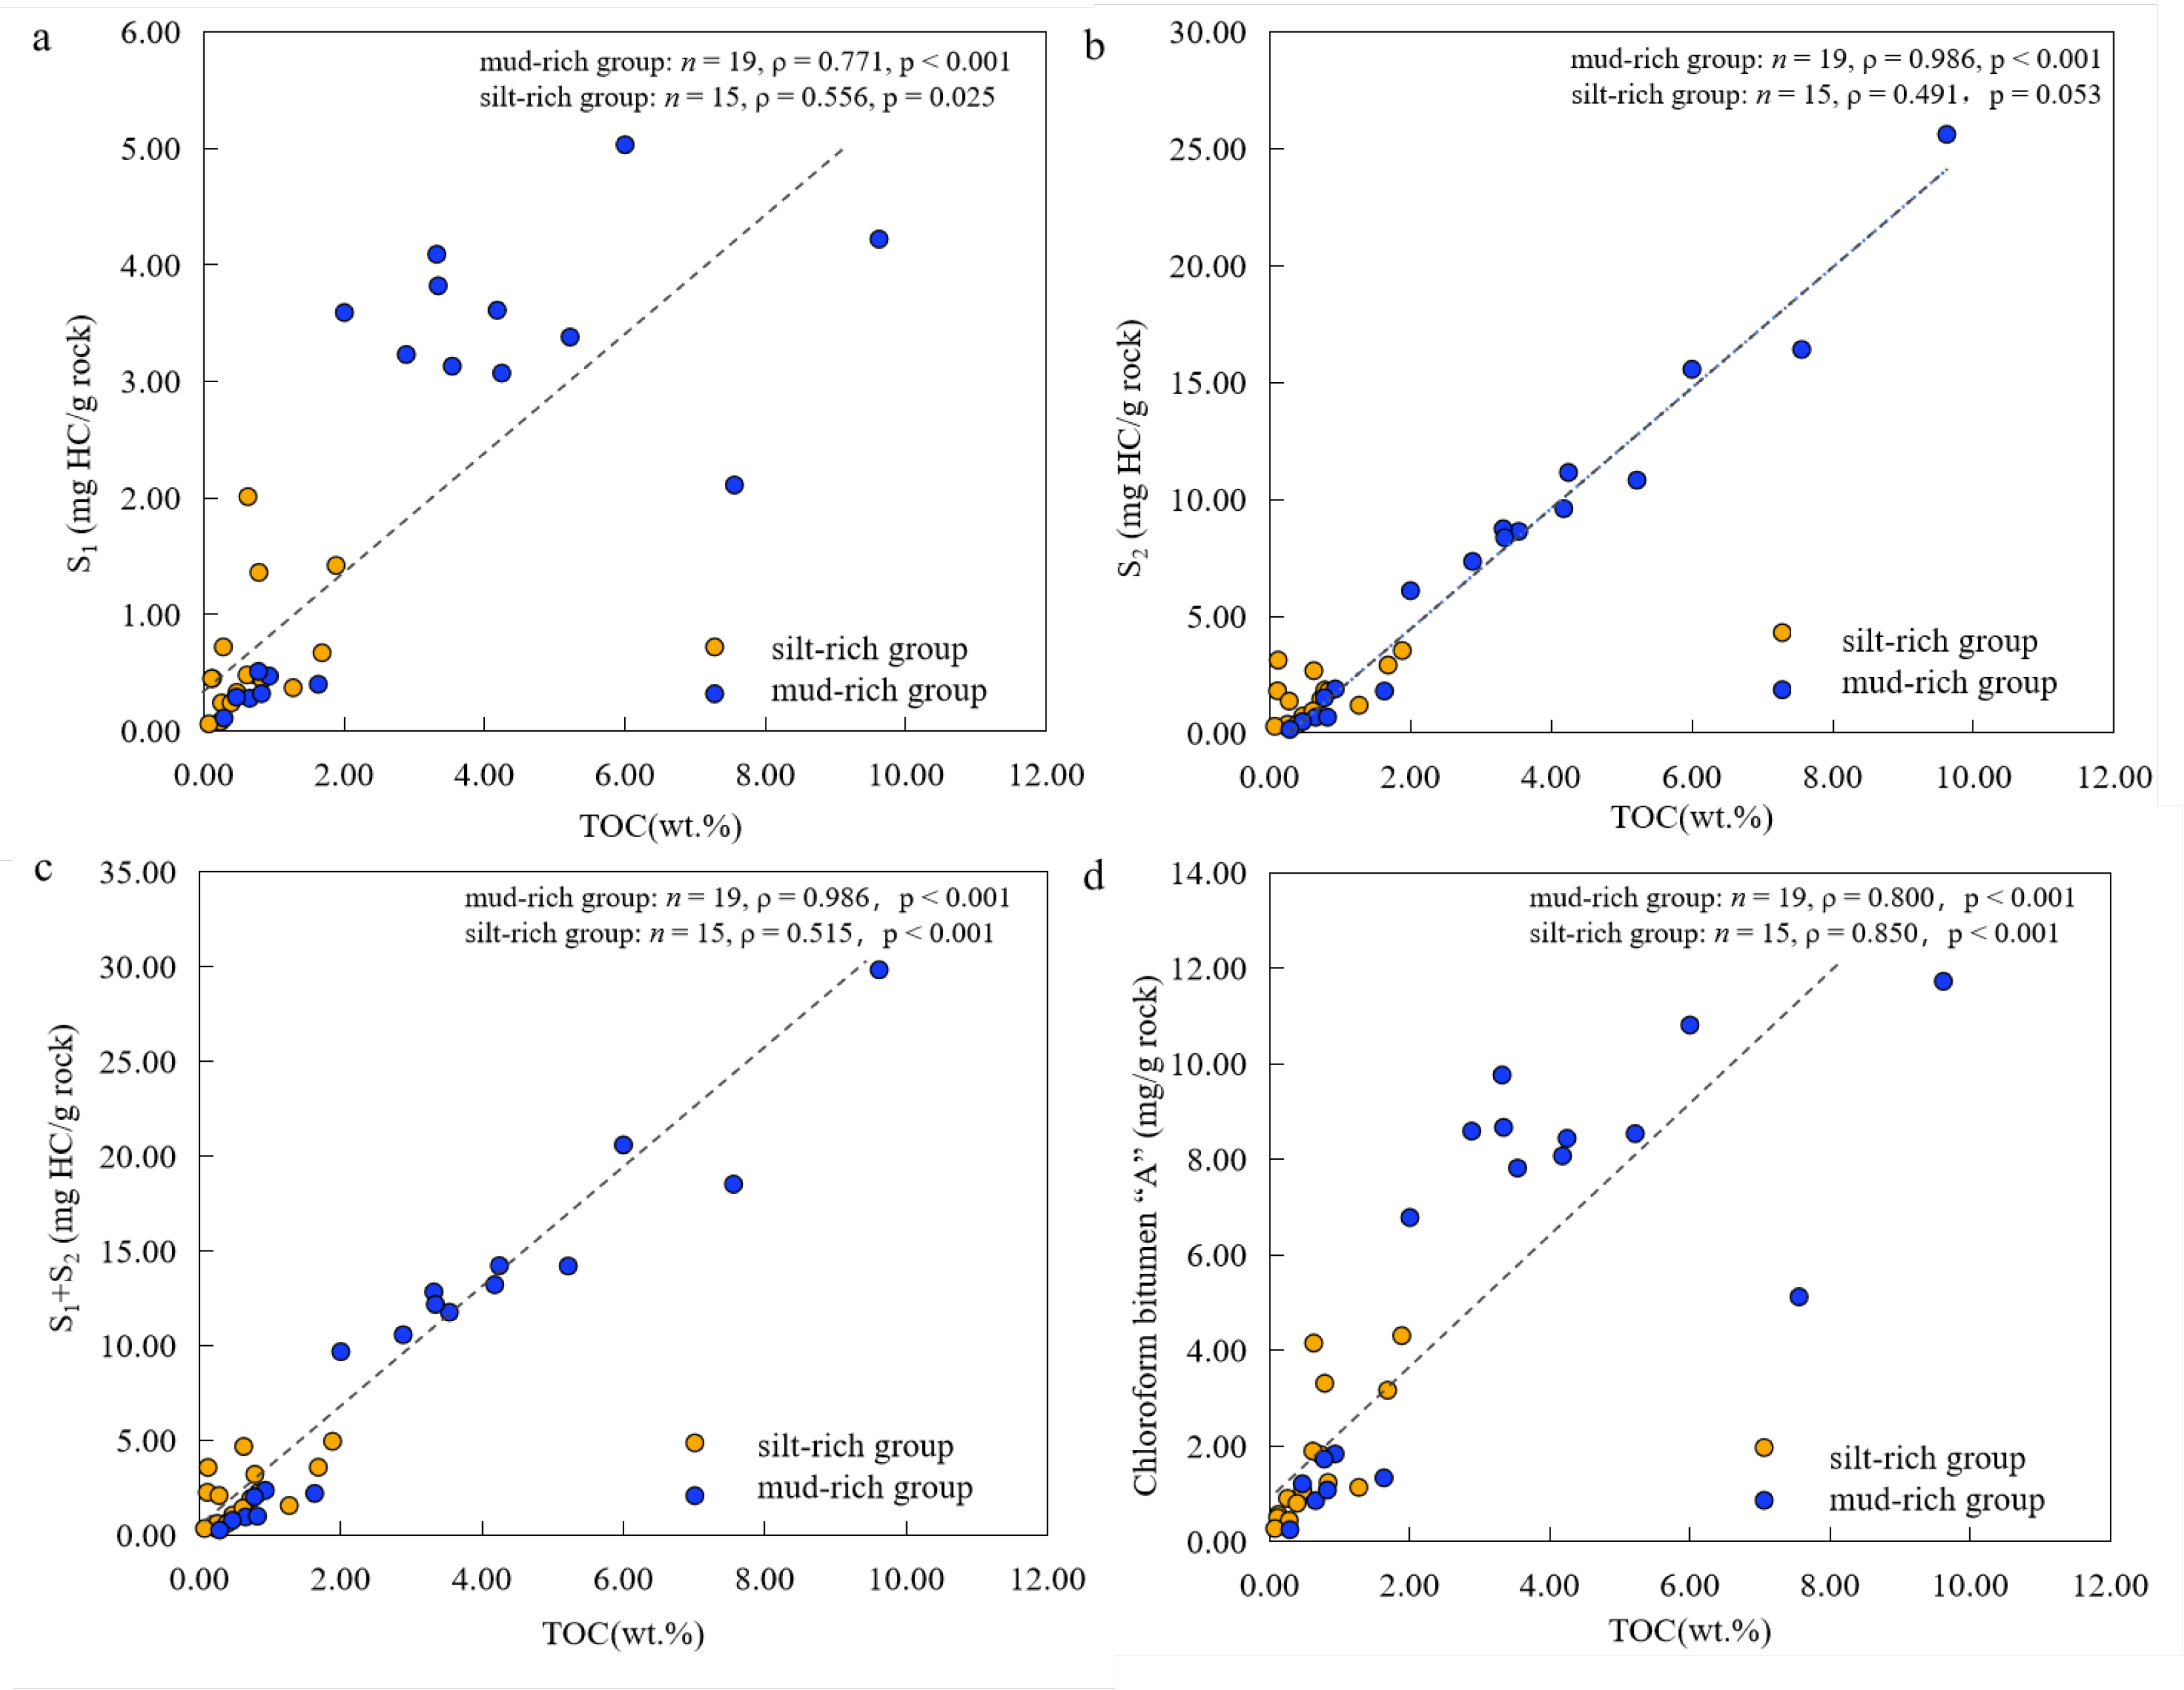
The chloroform bitumen “A” content ranges from 0.25 to 11.72 mg/g rock, with an average of 3.90 mg/g rock (Figure 3), indicating strong heterogeneity in extractable organic matter and retained hydrocarbon abundance. Mudstone and silty mudstone lithofacies generally contain higher chloroform bitumen “A” content than sandstone and siltstone lithofacies. TOC is significantly and positively correlated with S1 (Figure 5) across the complete dataset (Spearman ρ = 0.807, p < 0.001, n = 34). When the samples are separated by lithofacies, the positive relationship remains significant in both the mud-rich group (ρ = 0.771, p < 0.001, n = 19) and the silt-rich group (ρ = 0.556, p = 0.025, n = 15), although the correlation is weaker in the latter. TOC is also significantly correlated with S2 for the complete dataset (ρ = 0.846, p < 0.001, n = 34). This relationship is particularly strong within the mud-rich group (ρ = 0.986, p < 0.001, n = 19), whereas the relationship in the silt-rich group is weaker and does not reach the p < 0.05 significance level (ρ = 0.491, p = 0.053, n = 15). TOC and solvent-extractable bitumen show a strong positive relationship for the complete dataset (ρ = 0.901, p < 0.001, n = 34), and significant positive relationships are retained within both the mud-rich (ρ = 0.800, p < 0.001, n = 19) and silt-rich groups (ρ = 0.850, p < 0.001, n = 15).
Figure 5.
Relationships between TOC and Rock-Eval or solvent-extractable hydrocarbon parameters in different lithofacies of the Chang 9 Member. (a) TOC versus S1; (b) TOC versus S2; (c) TOC versus S1 + S2; (d) TOC versus chloroform bitumen “A”. Mud-rich group: mudstone, silty mudstone; silt-rich group: argillaceous siltstone, siltstone, fine sandstone. Spearman’s rank correlation coefficients (ρ), p values, and sample numbers (n) are reported for statistical evaluation. Linear regression lines are shown only to illustrate the overall trends and are not used independently to infer genetic relationships.
4.4. Reservoir Characteristics
The Chang 9 Member contains two principal reservoir types: sandstone reservoirs, including fine sandstone, calcareous sandstone, and argillaceous siltstone, and mudstone reservoirs, including silty mudstone and mudstone. The helium porosity ranges from 0.39% to 5.67%, with an average of 2.63%. The permeability ranges from 0.000170 to 0.0630 mD and averages 0.00785 mD, indicating ultra-low-permeability reservoir conditions.
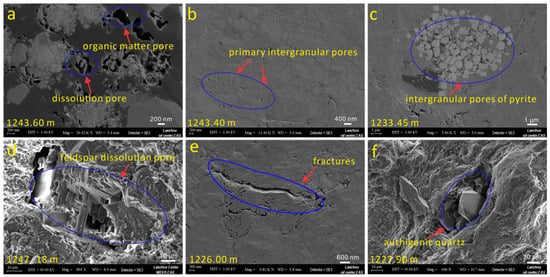
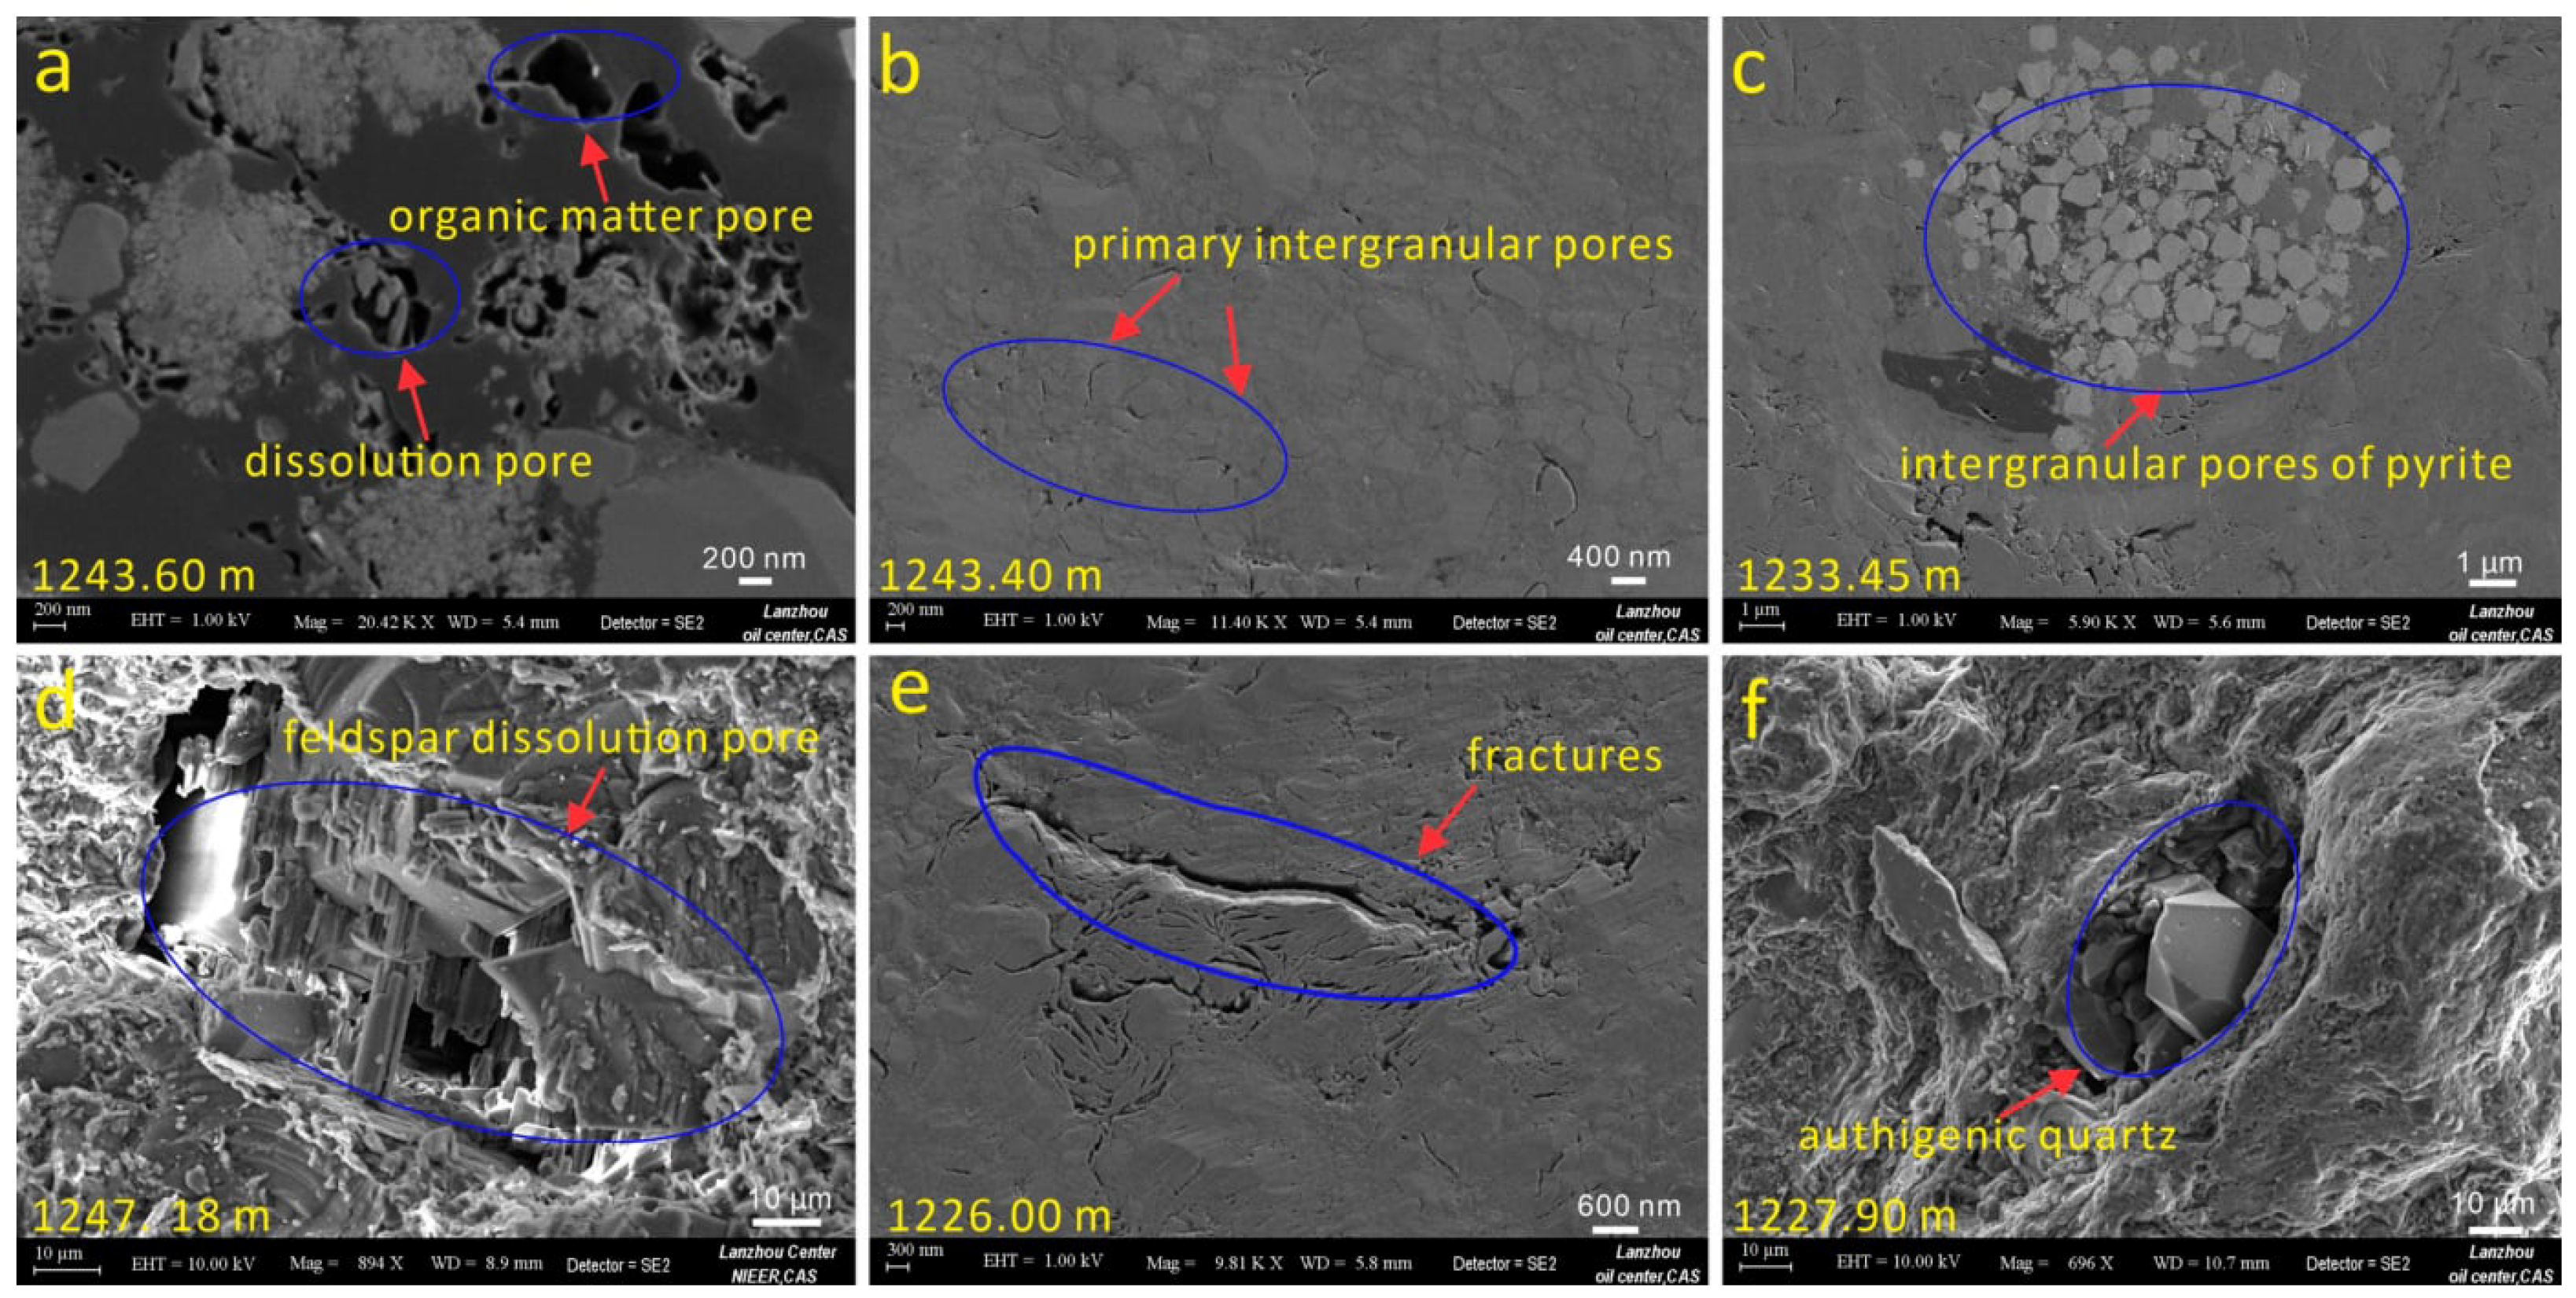
Sandstone reservoirs are commonly affected by carbonate cementation. Calcite occurs as a pore-filling cement and locally replaces feldspar grains. Dissolution pores are mainly developed within feldspar grains and carbonate cements, and bedding-parallel microfractures are locally observed. Mudstone reservoirs contain more abundant nanoscale pore systems. The SEM observations show that intergranular pores, intercrystalline pores, organic matter pores, clay mineral interlayer pores, and microfractures are widely developed (Figure 6). Intergranular pores occur mainly between rigid mineral particles and pyrite framboids, whereas organic matter pores are developed within organic matter aggregates. Clay mineral interlayer pores are commonly associated with illite and mixed-layer clay minerals.
Figure 6.
SEM images of representative pore types, microfractures, and authigenic minerals in the Chang 9 Member of Well Danye-1: (a) 1243.60 m, mudstone, organic matter pore, and dissolution pore; (b) 1243.40 m, mudstone, residual primary intergranular pore; (c) 1233.45 m, mudstone, intercrystalline pores within a pyrite aggregate; (d) 1247.18 m, fine sandstone, feldspar dissolution pore; (e) 1226.00 m, argillaceous siltstone, microfracture; (f) 1227.90 m, siltstone, authigenic quartz.
5. Discussion
5.1. Relationship Between Rock Type and Hydrocarbon Abundance
The TOC of the Chang 9 samples in Well Danye-1 exhibits strong positive relationships with S2 and S1 + S2, indicating that the remaining hydrocarbon generation potential and total pyrolyzable hydrocarbon abundance increase primarily with the organic matter content. The statistical results confirm that the organic matter abundance is closely associated with hydrocarbon-related geochemical parameters, but the strength of this relationship varies between lithofacies. The particularly strong TOC-S2 relationship in the mud-rich group (ρ = 0.986, p < 0.001) indicates close coupling between the organic matter richness and hydrocarbon generation potential. In contrast, the weaker and statistically non-significant TOC-S2 relationship in the silt-rich group (ρ = 0.491, p = 0.053) suggests that this coupling is less consistent within the more clastic-rich lithofacies.
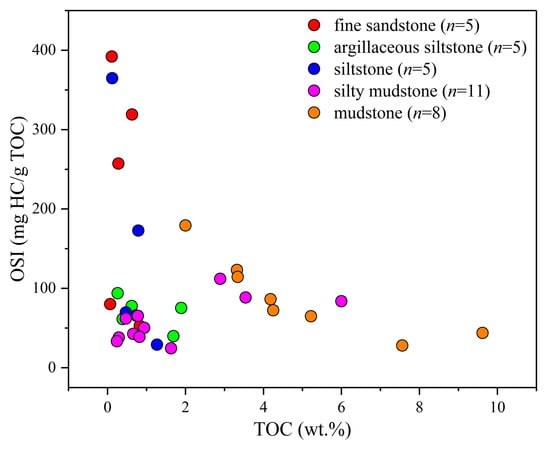
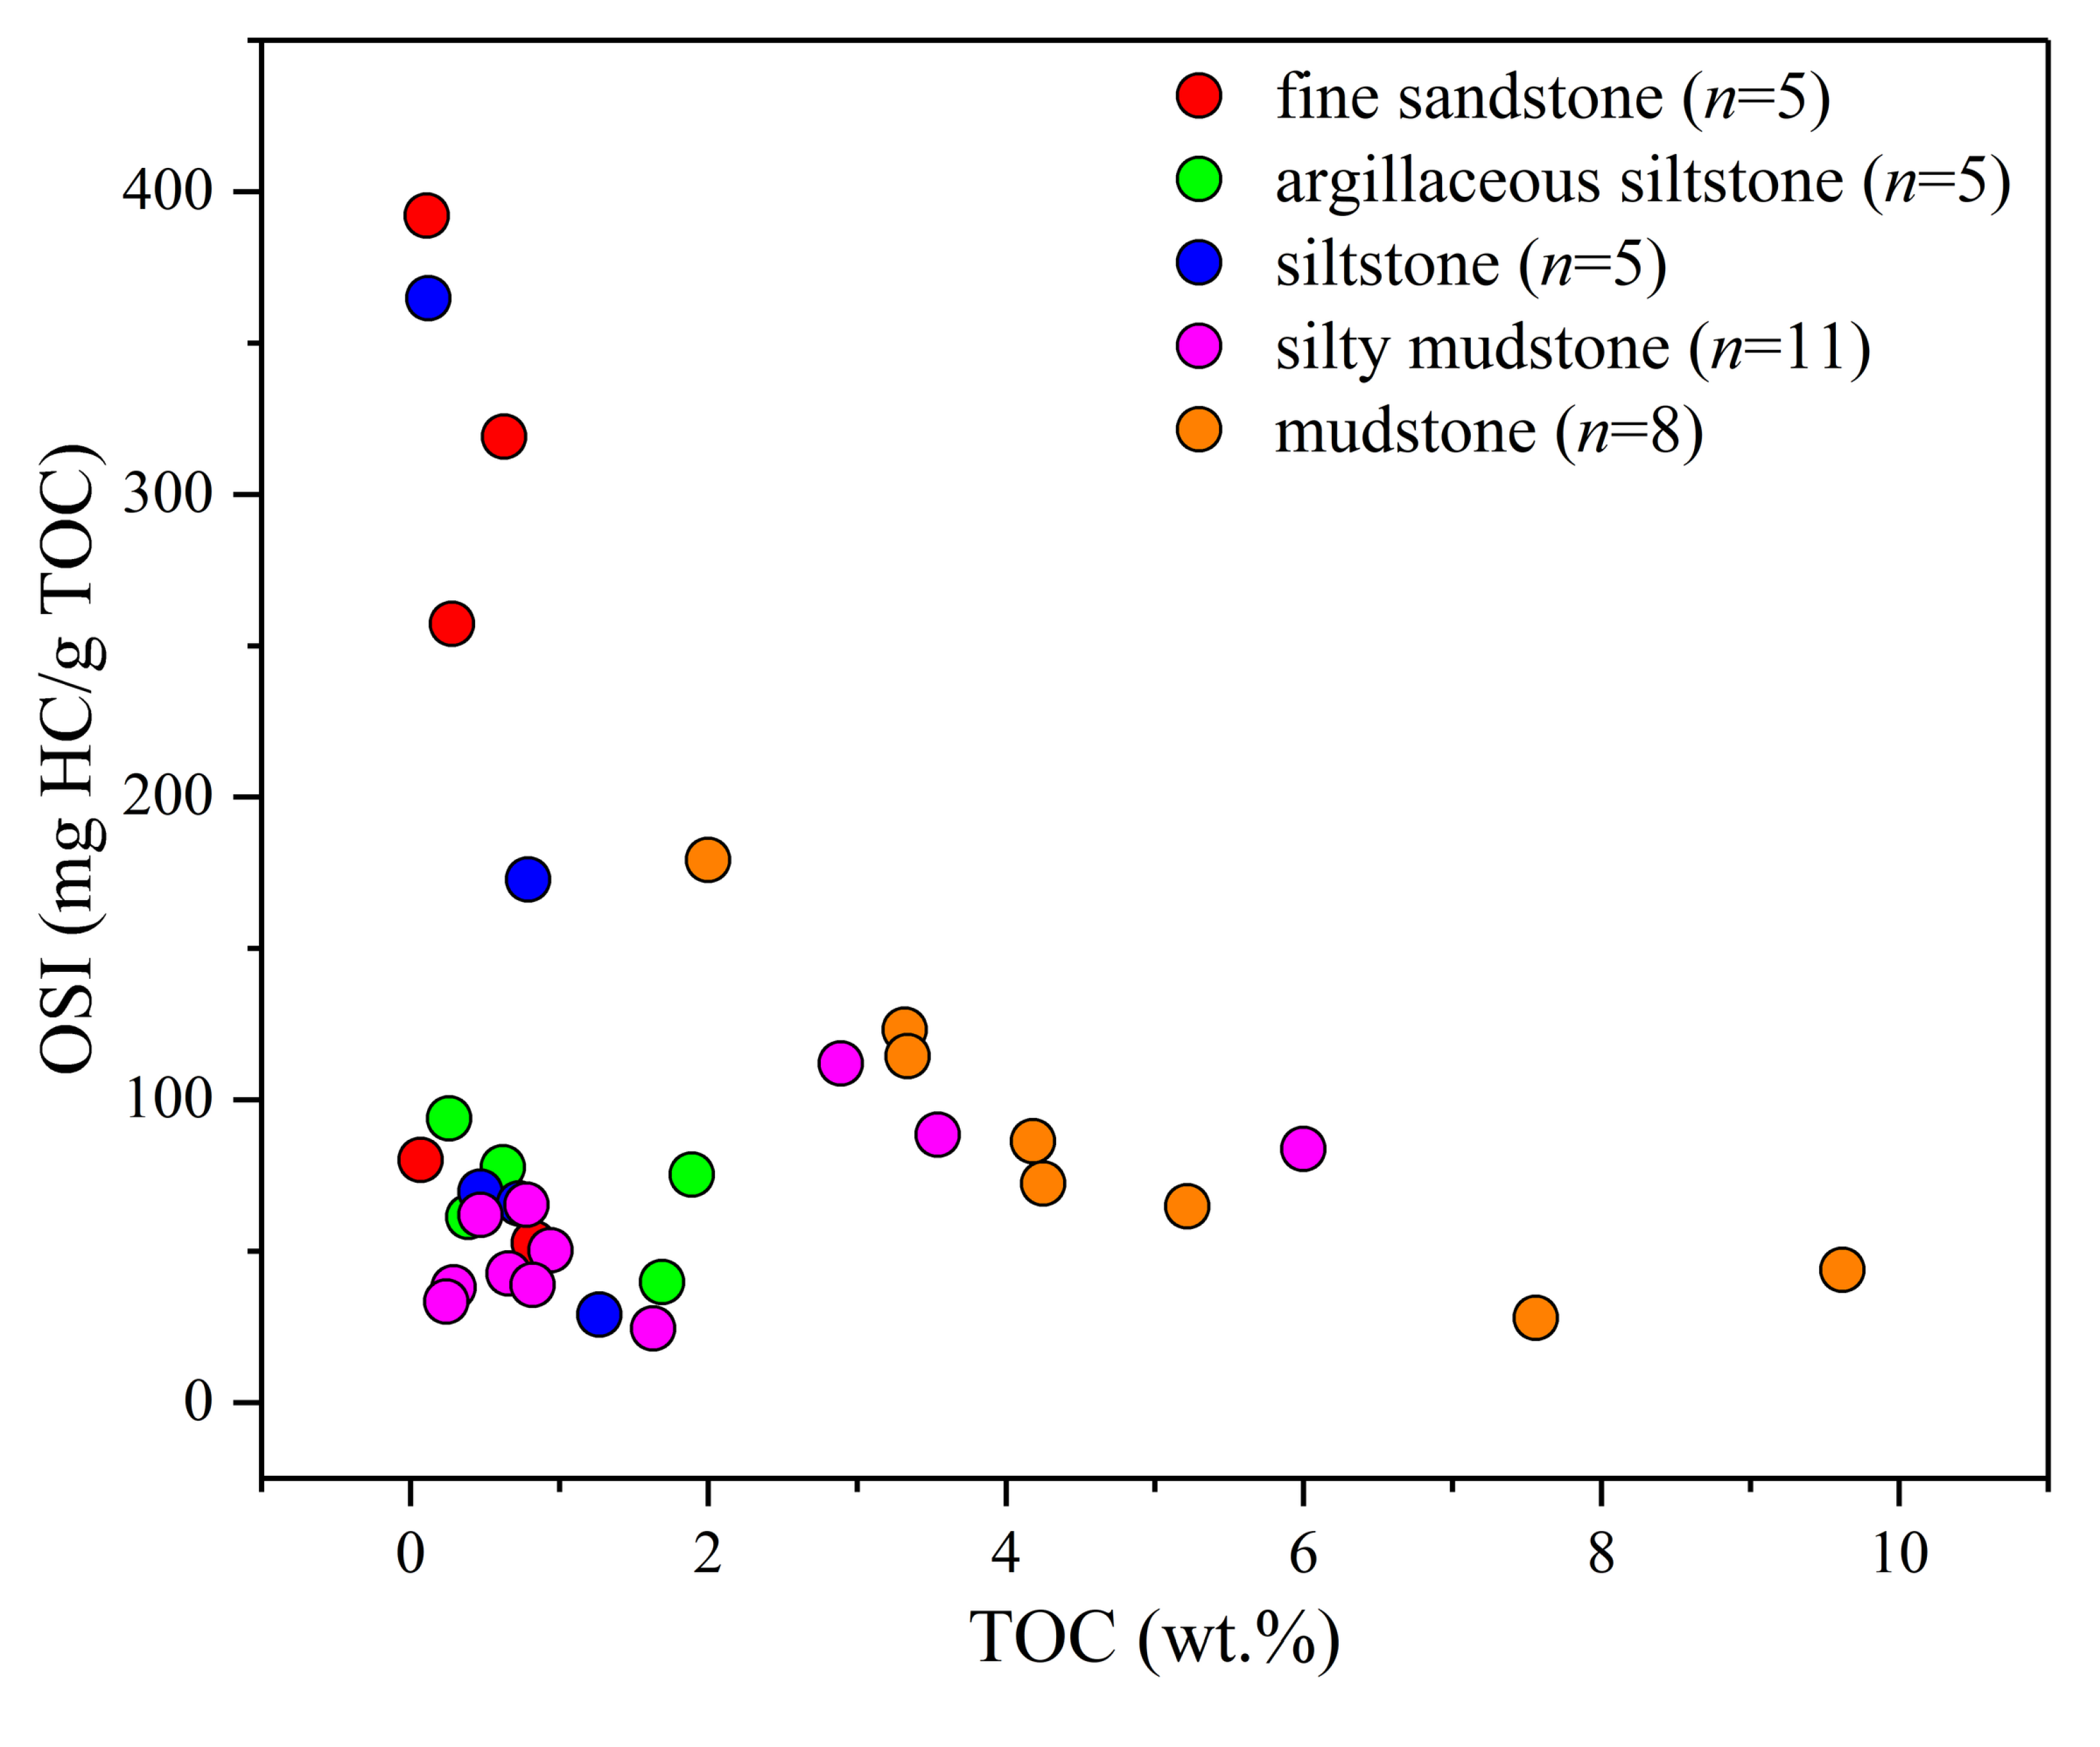
This indicates that strata that are rich in organic matter typically contain more abundant hydrocarbon resources, as evidenced by their higher extractable organic content. However, this relationship is not mirrored by the TOC-OSI distribution (Figure 7). Fine sandstones and siltstones, despite very low TOC content (0.07–1.89 wt%), exhibit extremely high OSI values reaching up to 319.05 mg HC/g TOC, with most points exceeding the conventional oil crossover threshold of 100 mg HC/g TOC [40]. Because these sandstones lack sufficient indigenous organic matter to generate such free hydrocarbon volumes, the elevated OSI is best interpreted as a geochemical fingerprint of externally sourced, migrated oil charged into the sandstone carrier beds from adjacent mature mudstones. In contrast, mudstones and silty mudstones with much higher TOC (up to 9.62 wt%) display OSI values predominantly below 100 mg HC/g TOC. Given that the Chang 9 source rocks in the study area have already entered the oil window (Ro ≈ 0.85–1.15%), this low OSI in organic-rich intervals does not reflect immature, unexpelled oil; rather, it indicates efficient hydrocarbon expulsion—the generated oil has largely exited the source matrix, leaving only the residual sorbed fraction. This interpretation is consistent with previous work on the Chang 7 source rocks in the Ordos Basin, where the oil expulsion threshold has been estimated at approximately 70–83 mg HC/g TOC, substantially lower than the North American marine shale benchmark of 100 mg HC/g TOC [48,49]. However, the OSI cannot directly characterize the process of oil and gas migration, so it should not be regarded as a direct measure of hydrocarbon mobility, pore connectivity, or producibility. Integrated source rock evaluation commonly requires Rock-Eval parameters to be considered together with independent molecular, isotopic, maturity, and mineralogical constraints, particularly where individual geochemical indices may have non-unique geological interpretations [50].
Figure 7.
Crossplot of TOC and OSI for different lithofacies in the Chang 9 Member of Well Danye-1. OSI is calculated as S1 × 100/TOC and represents the S1 response normalized to TOC; it should not be interpreted as a direct measurement of oil mobility or recoverability.
This discrepancy indicates that hydrocarbon abundance is governed by different components of the shale system. If organic matter abundance were the dominant control on oil-bearing efficiency enrichment, TOC and the OSI would be expected to increase broadly in tandem. Therefore, hydrocarbon generation and hydrocarbon occurrence should be evaluated as related but non-equivalent processes. This distinction is particularly important for lacustrine shale reservoirs, where rapid lithofacies transitions produce strong variations in pore architecture over short vertical intervals [51]. Within the Chang 9 Member, the critical issue is not simply the amount of hydrocarbons generated but how the generated hydrocarbons are accommodated within the pore system. Similar mismatches between organic matter abundance and normalized oil-bearing efficiency have been reported in other shale reservoirs, where oil occurrence is strongly mediated by pore-scale storage and transport properties rather than by source richness alone. Depositional partitioning exerted a first-order control on hydrocarbon enrichment in the source rocks [52,53,54].
5.2. Pore Architecture and Reservoir Effectiveness
The lithofacies modifies the Chang 9 pore architecture but does not produce a simple facies–permeability relationship. Mud-rich rocks mainly contain clay interlayer pores and organic-related nanopores, while residual intergranular pores, dissolution pores, and bedding-parallel microfractures are observed in representative silt-rich samples. Comparable lithofacies-related differences in pore types have been documented in lacustrine shales of the Yanchang Formation and other shale successions [55,56,57]. These locally observed pore types may provide potential storage spaces and local pathways, but their occurrence in two-dimensional SEM images does not demonstrate a connected three-dimensional transport network. Consistent with this limitation, the bulk reservoir quality remains poor, with the porosity ranging from 0.39% to 5.67% and permeability from 0.000170 to 0.0630 mD.
This apparent mismatch reflects both diagenetic modification and scale dependence. Quartz- and feldspar-rich beds may preserve locally larger pores or develop dissolution pores, but compaction and cementation can prevent these features from forming a continuous plug-scale network [25,26]. Mud-rich rocks may retain substantial nanoscale pore volumes, although narrow throats, tortuous pathways, and large mineral surface areas enhance capillary confinement and fluid–solid interactions, thereby limiting effective flow [51,55]. In the Chang 9 samples, the combination of low porosity and ultra-low permeability indicates that the relatively large pores observed locally under SEM do not constitute a continuously effective flow network at the plug scale. This interpretation highlights the need to distinguish locally imaged pore spaces from the connected pore volume governing bulk fluid transport. Bedding-parallel microfractures may represent potential local pathways, but their contribution to the effective permeability depends on the fracture aperture, lateral continuity, mineral filling, present stress state, and orientation relative to the dominant fluid flow direction [55,57]. Their presence under SEM therefore indicates potential transport pathways rather than direct evidence of a continuously conductive fracture network.
Many organic-rich intervals exhibit moderate OSI values despite their high TOC and chloroform bitumen “A” content (Figure 3), indicating that hydrocarbon abundance does not necessarily correspond to effective mobility. Mud-rich groups contain higher TOC and hydrocarbon-related geochemical parameters and are therefore interpreted as the principal intervals of organic matter enrichment and hydrocarbon generation potential. Their SEM images are dominated by clay interlayer pores and organic-related nanopores. However, the present two-dimensional observations do not quantify three-dimensional pore connectivity or hydrocarbon mobility. Consequently, the relationship between these local pore morphologies and the occurrence of movable hydrocarbons cannot be established directly from the present dataset [58,59,60,61,62].
Notably, elevated OSI values should not be interpreted simply as greater hydrocarbon abundance. The OSI represents the Rock-Eval S1 response normalized to TOC. It does not directly measure in situ oil saturation or hydrocarbon mobility [13,40]. Moreover, Rock-Eval S1 may include both free and adsorbed hydrocarbons, and a high OSI can result from a low TOC denominator even when the absolute S1 content is limited [40]. This distinction is important in the Chang 9 succession because some silt-rich intervals exhibit higher OSI values than adjacent mud-rich intervals despite having lower absolute S1 and total retained hydrocarbon content. Such intervals contain more S1-detectable hydrocarbons per unit TOC, but the available data do not demonstrate that they contain a larger absolute quantity of oil or a higher proportion of movable oil. The OSI should therefore be interpreted together with the absolute S1, TOC, chloroform bitumen “A”, pore structure characteristics, and independent fluid mobility evidence, rather than being used as a standalone measure of shale oil enrichment or recoverability [40].
5.3. Mineral and Reservoir Effectiveness
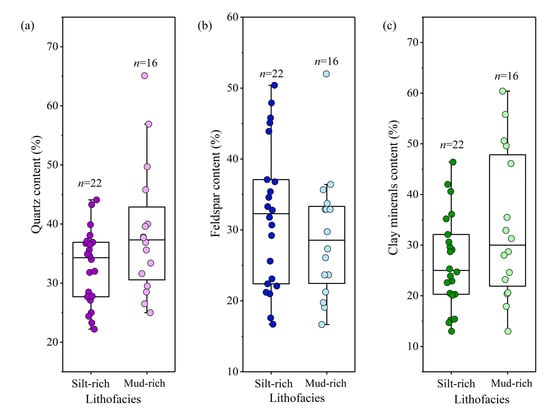
Compared with mud-rich groups, silt-rich groups contain higher proportions of feldspar and lower clay mineral content, while the quartz content shows substantial overlap between the two lithofacies groups (Figure 8). Such mineralogical compositions favor the development and preservation of a more rigid grain-supported framework during burial. Although compaction and carbonate cementation may reduce the primary porosity, feldspar-rich lithofacies may retain residual intergranular pores and develop secondary dissolution pores through the dissolution of feldspar grains and carbonate cements [25,26]. Bedding-parallel microfractures further connect otherwise isolated matrix pores and locally improve local pore throat connectivity [63]. Petrographic studies of mudrocks and tight sandstones therefore indicate that rigid grain frameworks, secondary dissolution pores, and microfractures may enhance the effective storage and fluid flow capacity, even where the total porosity remains limited and the pore network is strongly modified by diagenesis [64,65,66].
Figure 8.
Lithofacies-related distributions of quartz, feldspar, and clay mineral content in the Chang 9 Member of Well Danye-1. (a) Quartz content (%); (b) Feldspar content (%); (c) Clay minerals content (%). In each box plot, the central horizontal line represents the median, and the box indicates the interquartile range (25th–75th percentiles).
The SEM observations support this interpretation. Dissolution pores, residual intergranular pores, and bedding-parallel microfractures are more common in silt-rich intervals than in mud-rich groups. Similar pore assemblages have been documented in lacustrine mudrocks and tight siltstones, in which intergranular and dissolution pores provide relatively large storage spaces, while microfractures may connect otherwise isolated matrix pores [36,63]. The reservoir property data are consistent with this view. The Chang 9 reservoirs are generally tight, with average porosity of 2.63% and average permeability of 0.00785 mD. The relatively high OSI values in low-TOC silt-rich intervals are therefore interpreted to indicate greater amounts of S1-detectable hydrocarbons per unit TOC, rather than enhanced hydrocarbon generation or greater absolute oil abundance. Comparable migration from organic-rich mudstone or shale into closely interbedded siltstone has been documented in the Chang 7 Member, where high-TOC mud-rich group intervals act primarily as hydrocarbon generation units, and better-connected siltstone beds serve as hydrocarbon accumulation units [67,68].
The inferred reservoir mechanism of the Chang 9 Member also differs from the pore preservation models reported for some organic-rich shale systems. In many organic-rich mudstones, storage is closely associated with organic matter-hosted pores, while authigenic microcrystalline quartz or other early diagenetic mineral frameworks may protect the matrix and organic pores against compaction [63,69]. In the studied Chang 9 samples, organic-related nanopores occur mainly in mud-rich groups, but the comparatively effective pore assemblages of silt-rich intervals are more closely associated with abundant rigid detrital quartz and feldspar grains, residual intergranular pores, feldspar- and carbonate-related dissolution pores, and bedding-parallel microfractures. These features suggest that the lithofacies-dependent inorganic pore architecture, rather than the organic pore abundance alone, exerts an important control on hydrocarbon redistribution and local accumulation in the Chang 9 succession [70].
5.4. Implications for Shale Oil Evaluation
The integrated lithofacies, geochemical, mineralogical, and pore structure data indicate that shale oil enrichment in the Chang 9 Member is controlled by the coupling between hydrocarbon supply and reservoir effectiveness. Mud-rich groups constitute the principal hydrocarbon generation and retention domains. Their relatively high TOC, S1, and chloroform bitumen “A” content indicate greater organic matter abundance and retained hydrocarbon content than those of the adjacent silt-rich lithofacies. Similar source–reservoir relationships have been documented in the Chang 7 Member, where organic-rich mudstone and shale primarily function as hydrocarbon generation and retention units [67,68]. Previous multi-scale pore structure studies indicate that the clay-rich, nanopore-dominated pore systems of the Chang 9 mud-rich group are generally characterized by small pore throats and limited connectivity, which may enhance hydrocarbon retention while restricting fluid transport [56,63].
Silt-rich lithofacies play a different role in this enrichment system. Although they generally have lower TOC and hydrocarbon generation potential, their feldspar-rich and clay-poor compositions, together with residual intergranular pores, dissolution pores, and bedding-parallel microfractures, provide comparatively effective storage spaces and potential migration pathways [25,26]. Consequently, some silt-rich intervals display higher OSI values despite having lower absolute S1, TOC, and chloroform bitumen “A” content. Because the OSI represents the amount of S1-detectable hydrocarbons normalized to TOC, these elevated values should not be interpreted directly as evidence of greater absolute oil abundance or higher oil mobility. The importance of the silt-rich intervals therefore lies mainly in their relatively effective inorganic pore throat networks and their capacity to accommodate hydrocarbons, rather than in their in situ hydrocarbon generation potential [67,68].
The vertical juxtaposition of hydrocarbon-rich mudstones and silt-rich intervals with contrasting local pore morphologies provides a geological basis for considering limited short-distance hydrocarbon redistribution.
6. Conclusions
The Chang 9 interval of Well Danye-1 is characterized by frequent vertical alternations of mud-rich and silt-rich lithofacies. Mudstone and silty mudstone generally contain higher TOC, S1, S2, and solvent-extractable bitumen than the associated silt-rich rocks, indicating that organic matter-rich lithofacies constitute the principal intervals of hydrocarbon generation potential and contain greater quantities of S1-detectable and solvent-extractable organic components. Vitrinite reflectance indicates that the studied succession is thermally mature and lies within the oil window.
In terms of reservoir characteristics, lithofacies variations modify the pore architecture but do not produce a simple facies–permeability relationship. The studied interval is characterized by low porosity and very low permeability. The SEM observations reveal lithofacies-related differences in pore morphology: clay mineral interlayer pores and organic-related nanopores occur in mud-rich samples, whereas residual intergranular pores, dissolution pores, and bedding-parallel microfractures are observed in representative silt-rich samples. These observations do not demonstrate three-dimensional pore connectivity.
The OSI-TOC relationship in the Chang 9 Member indicates that mature mudstone (Ro ≈ 0.85–1.15%) has expelled most of the generated oil, and the expelled hydrocarbons have been captured nearby by adjacent interbedded sandstones, showing extremely low TOC (0.07–1.89 wt%) and an abnormally high OSI (up to 319.05 mg HC/g TOC). Therefore, the low residual OSI in organic rich mudstone reflects efficient hydrocarbon expulsion rather than insufficient hydrocarbon generation.
Supplementary Materials
The following supporting information can be downloaded at: https://www.mdpi.com/article/10.3390/geosciences16100429/s1, Table S1. Sample Information Table; Table S2. TOC, Chloroform Asphalt A, and Rock Pyrolysis Data; Table S3. Reflectance data of vitrinite; Table S4. X-ray Diffraction (XRD) test data; Table S5. Porosity and permeability data; Table S6. Mann Whitney U test for porosity and permeability.
Author Contributions
Conceptualization, Y.W. and S.L.; methodology, Y.W.; software, J.C. and W.W.; validation, Y.W., X.L., and Z.Z.; formal analysis, Y.W.; investigation, S.L.; resources, S.L.; data curation, Y.W., M.S., and W.W.; writing—original draft preparation, Y.W.; writing—review and editing, Y.W.; visualization, Y.W. and M.S.; supervision, X.L. and Z.Z.; project administration, S.L.; funding acquisition, Y.W. and J.C. All authors have read and agreed to the published version of the manuscript.
Funding
Funding was provided by the Gansu Provincial Science and Technology Program (Grant No. 22JRSRA045) and the Key Laboratory of Mineralization and Exploration of the Upper Yellow River, MNR (Grant No. YSMRKF-202315).
Data Availability Statement
All numerical data used to generate the figures, descriptive statistics, and principal conclusions of this study are provided in the Supplementary Materials. Additional raw analytical records that are subject to institutional data management restrictions may be obtained from the corresponding author upon reasonable request, where permitted.
Acknowledgments
The authors thank Chen Xiu for providing assistance with sampling.
Conflicts of Interest
The authors declare no conflicts of interest.
Abbreviations
The following abbreviations are used in this manuscript:
| TOC | Total organic carbon |
| OSI | S1-normalized oil-bearing efficiency index |
| HI | Hydrogen index |
| OI | Oxygen index |
| Ro | Vitrinite reflectance |
| XRD | X-ray diffraction |
| SEM | Scanning electron microscopy |
| S1 | Free hydrocarbon peak |
| S2 | Kerogen pyrolysis hydrocarbon peak |
| Tmax | Temperature maximum |
| HC | Hydrocarbons |
References
- Kokkinos, N.; Nkagbu, D.; Marmanis, D.; Dermentzis, K.I.; Maliaris, G. Evolution of Unconventional Hydrocarbons: Past, Present, Future and Environmental FootPrint. J. Eng. Sci. Technol. Rev. 2022, 15, 15–24. [Google Scholar] [CrossRef] [Scilit]
- Wang, Z.; Fan, Z.; Chen, X.; Li, Y.; Fan, Z.; Wei, Q.; Peng, Y.; Liu, B.; Yue, W.; Wang, X.; et al. Global oil and gas development situation, trends and enlightenment in 2023. Pet. Explor. Dev. 2024, 51, 1536–1555. [Google Scholar] [CrossRef] [Scilit]
- Tao, S. Exploration and Development of Unconventional Oil and Gas Resources: Latest Advances and Prospects. Energies 2025, 18, 3933. [Google Scholar] [CrossRef] [Scilit]
- Bai, Y.; Ma, Y. Geology of the Chang 7 Member oil shale of the Yanchang Formation of the Ordos Basin in central north China. Pet. Geosci. 2020, 26, 355–371. [Google Scholar] [CrossRef] [Scilit]
- Wang, R.; Wang, G.; Zhao, G.; Qian, M.; Liu, Y.; He, W.; Li, Z. Geological characteristics and resources potential of shale oil in Chang 7 Member of Upper Triassic Yanchang Formation in Fuxian area, southern Ordos Basin, western China. Unconv. Resour. 2023, 3, 237–247. [Google Scholar] [CrossRef] [Scilit]
- Guo, X.; Wang, E.; Ma, X.; Li, M.; Qian, M.; Cao, T.; Li, Z.; Chu, J. Lacustrine shale oil systems in China: Advances in characterization methods and resource accumulation models. Earth-Sci. Rev. 2025, 270, 105256. [Google Scholar] [CrossRef] [Scilit]
- Punning, J.M.; Terasmaa, J.; Vaasma, T. The Impact of Lake-Level Fluctuations on the Sediment Composition. In The Interactions Between Sediments and Water; Kronvang, B., Faganeli, J., Ogrinc, N., Eds.; Springer: Dordrecht, The Netherlands, 2006. [Google Scholar] [CrossRef] [Scilit]
- Renaut, R.W.; Owen, R.B. Lake Processes and Sedimentation. In The Kenya Rift Lakes: Modern and Ancient. Syntheses in Limnogeology; Springer: Berlin/Heidelberg, Germany, 2023. [Google Scholar] [CrossRef] [Scilit]
- Schillereff, D.N.; Chiverrell, R.C.; Macdonald, N.; Hooke, J.M. Flood stratigraphies in lake sediments: A review. Earth-Sci. Rev. 2014, 135, 17–37. [Google Scholar] [CrossRef] [Scilit]
- Feng, G.; Zhang, L.; Yan, J.; Chen, S.; Pu, X.; Han, W.; Shi, Z.; Zhang, W. Lithofacies-based analysis of pore structure characteristics and controlling factors of shale reservoirs: A case study of the second member of the Kongdian Formation in the Cangdong Sag, Bohai Bay Basin, China. Mar. Pet. Geol. 2025, 182, 107575. [Google Scholar] [CrossRef] [Scilit]
- Katz, B.; Lin, F. Lacustrine basin unconventional resource plays: Key differences. Mar. Pet. Geol. 2014, 56, 255–265. [Google Scholar] [CrossRef] [Scilit]
- Wang, E.; Feng, Y.; Guo, T.; Li, M. Oil content and resource quality evaluation methods for lacustrine shale: A review and a novel three-dimensional quality evaluation model. Earth-Sci. Rev. 2022, 232, 104134. [Google Scholar] [CrossRef] [Scilit]
- Li, Q.; Chen, F.; Wu, S.; Zhang, L.; Wang, Y.; Xu, S. A simple and effective evaluation method for lacustrine shale oil based on mass balance calculation of Rock-Eval data. Appl. Geochem. 2022, 140, 105287. [Google Scholar] [CrossRef] [Scilit]
- Zhao, Y.G.; Zhang, C.Y.; Lu, J.G.; Zhu, X.; Li, L.; Si, S. Sedimentary Environment and Model for Organic Matter Enrichment: Chang 7 Shale of Late Triassic Yanchang Formation, Southern Margin of Ordos Basin, China. Energies 2022, 15, 2948. [Google Scholar] [CrossRef] [Scilit]
- Sun, X.; Liang, Q.; Jiang, C.; Enriquez, D.; Zhang, T.; Hackley, P. Liquid hydrocarbon characterization of the lacustrine Yanchang Formation, Ordos Basin, China: Organic-matter source variation and thermal maturity. Interpretation 2017, 5, SF225–SF242. [Google Scholar] [CrossRef] [Scilit]
- Li, M.; Li, W.; Gu, M.; Wu, S.; Wang, P.; Wang, Y.; Cao, Q.; Xu, Z.; Hao, Y. Reservoir Characteristics and Shale Oil Enrichment of Shale Laminae in the Chang 7 Member, Ordos Basin. Energies 2025, 18, 5342. [Google Scholar] [CrossRef] [Scilit]
- Yang, W. Movable hydrocarbon evaluation of lacustrine shale oil: A case study of the Triassic Chang 7 shale, Ordos Basin, China. In Proceedings of the 30th International Meeting on Organic Geochemistry (IMOG 2021); European Association of Geoscientists & Engineers: Utrecht, The Netherlands, 2021; Volume 2021, pp. 1–2. [Google Scholar] [CrossRef] [Scilit]
- Zhang, K.; Liu, R.; Liu, Z. Sedimentary sequence evolution and organic matter accumulation characteristics of the Chang 8–Chang 7 members in the Upper Triassic Yanchang Formation, southwest Ordos Basin, central China. J. Pet. Sci. Eng. 2021, 196, 107751. [Google Scholar] [CrossRef] [Scilit]
- Wang, Z.; Mao, Z.; Yuan, X.; Deng, X.; Hui, X.; Zhang, Z.; Cui, J. Types, characteristics and geological significance of event deposits of Chang 9 Member of Triassic Yanchang Formation in southwestern Ordos Basin, NW China. Pet. Explor. Dev. 2023, 50, 588–602. [Google Scholar] [CrossRef] [Scilit]
- Qiu, X.; Wang, Y. Evaluation of Sedimentary Characteristics of the Chang 9 Oil Layer Formation in the Yanchang Formation, Ordos Basin. Appl. Sci. 2024, 14, 4035. [Google Scholar] [CrossRef] [Scilit]
- Ma, M.; Ding, X.; He, X. Sedimentary characteristics of the delta sandstone from the Chang-9 oil reservoirs in the Yanchang Formation, Ordos Basin. Int. Core J. Eng. 2021, 7, 1–10. [Google Scholar] [CrossRef]
- Ding, X.; Chen, J.S.; Tan, X.C.; Lin, D.; Zhao, Z.-H.; Yao, J.-L.; Deng, X.-Q.; Li, Y.-H. Vertical structure and dominating factors of sand body during Late Triassic Chang 9 time of Yanchang Formation in Ordos Basin, NW China. J. Cent. South Univ. 2015, 22, 1405–1418. [Google Scholar] [CrossRef] [Scilit]
- Hui, X.; Ke, X.; Qi, Y.; Shi, S.; Zhu, J.; Wang, Y. Predicting source rock distribution of the Ninth Member of the Upper Triassic Yanchang Formation based on well-logging parameters and TOC values in the Longdong area, Ordos Basin, China. ACS Omega 2024, 9, 50377–50384. [Google Scholar] [CrossRef] [Scilit]
- Cao, L.; Yan, X.; Li, H.; Wu, W.; Bai, Y.; Zhao, Z. Geochemical characteristics, distribution, and shale oil resource potential of source rocks in the 8th and 9th oil groups of the Yanchang Formation, northern Shaanxi, Ordos Basin. Oil Gas Geol. 2025, 46, 1410–1429. [Google Scholar] [CrossRef]
- Li, Y.; Chang, X.; Yin, W.; Wang, G.; Zhang, J.; Shi, B.; Zhang, J.; Mao, L. Quantitative identification of diagenetic facies and controls on reservoir quality for tight sandstones: A case study of the Triassic Chang 9 oil layer, Zhenjing area, Ordos Basin. Mar. Pet. Geol. 2019, 102, 680–694. [Google Scholar] [CrossRef] [Scilit]
- Liu, H.; Zhao, Y.; Luo, Y.; Xiao, G.; Meng, Y.; Zhou, S.; Shao, L. Origin of the reservoir quality difference between Chang 8 and Chang 9 Member sandstones in the Honghe oil field of the southern Ordos Basin, China. J. Pet. Sci. Eng. 2020, 185, 106668. [Google Scholar] [CrossRef] [Scilit]
- Deng, X.; Chu, M.; Wang, L.; Chen, X.; Wang, Y. Two stages of subsidence and their formation mechanisms in the Middle–Late Triassic Ordos Basin, NW China. Pet. Explor. Dev. 2024, 51, 576–588. [Google Scholar] [CrossRef] [Scilit]
- Guo, Y.Q.; Li, B.Q.; Li, B.; Li, W.-H.; Cao, H.-X.; Liao, Y.; Wu, Z.-Z.; Fei, S.-X.; Zhang, Q.; Chen, Q.; et al. Sedimentary system and palaeogeographic evolution of Ordos Basin, northern China. J. Palaeogeogr. 2025, 14, 501–534. [Google Scholar] [CrossRef] [Scilit]
- Zhang, Z.Y.; Chen, X.; Wang, Y.T.; Geng, L.; Yang, Z.; Li, S.; Ma, H. Formation environment and organic matter enrichment mechanism of the shale from the ninth member of Yanchang Formation in the Shanbei area, Ordos Basin. Nat. Gas Geosci. 2026, 37, 751–769. [Google Scholar] [CrossRef]
- Zhao, C.H.; Liu, X.D.; Jia, W.L.; Zhang, W.; Chen, J.; Li, J.; Peng, P. Main controls on nitrogen cycling and Mo-U enrichment of the Middle Triassic Chang 7 Member in the Ordos Basin: Implications for redox and ultra-organic enrichment in a giant highly productive lake. Mar. Pet. Geol. 2025, 181, 107508. [Google Scholar] [CrossRef] [Scilit]
- Zavala, C.; Liu, H.; Li, X.; Geng, L.; Yang, Z.; Li, S.; Ma, H. Chapter 16-Lacustrine sequence stratigraphy: New insights from the study of the Yanchang Formation (Middle-Late Triassic), Ordos Basin, China. In Sedimentological Research for Hydrocarbons Exploration: In the Ordos Basin; Elsevier: Amsterdam, The Netherlands, 2022; pp. 309–335. [Google Scholar] [CrossRef] [Scilit]
- Ruppel, S.C.; Rowe, H.; Milliken, K.; Gao, C.; Wan, Y. Facies, rock attributes, stratigraphy, and depositional environments: Yanchang Formation, central Ordos Basin, China. Interpretation 2017, 5, SF15–SF29. [Google Scholar] [CrossRef] [Scilit]
- Er, C.; Li, Y.; Zhao, J.; Wang, R.; Wei, Z. Characteristics of lacustrine organic-rich shale: A case study of the Chang 7 member, Triassic Yanchang Formation, Ordos Basin, China. J. Nat. Gas Geosci. 2016, 1, 173–185. [Google Scholar] [CrossRef] [Scilit]
- Yang, H.; Deng, X. Deposition of Yanchang Formation deep-water sandstone under the control of tectonic events in the Ordos Basin. Pet. Explor. Dev. 2013, 40, 549–557. [Google Scholar] [CrossRef] [Scilit]
- Zhang, J.; Zhao, J.; Gao, Z.; Shen, W.; Wei, F.; Meng, X.; Yan, X.; Zhang, X.; Wu, W.; Zhao, Z.; et al. Characterization of gravity-flow deposits in the Chang 7-9 oil groups in the Yanchang Formation, Ganquan County, Ordos Basin. Energy Geosci. 2026, 7, 100520. [Google Scholar] [CrossRef] [Scilit]
- Fu, J.; Li, S.; Niu, X.; Deng, X.; Zhou, X. Geological characteristics and exploration of shale oil in Chang 7 Member of Triassic Yanchang Formation, Ordos Basin, NW China. Pet. Explor. Dev. 2020, 47, 931–945. [Google Scholar] [CrossRef] [Scilit]
- Loucks, R.G.; Reed, R.M.; Ruppel, S.C.; Hammes, U. Spectrum of pore types and networks in mudrocks. AAPG Bull. 2012, 96, 1071–1098. [Google Scholar] [CrossRef] [Scilit]
- Peters, K.E.; Cassa, M.R. Applied source rock geochemistry. In The Petroleum System—From Source to Trap; Magoon, L.B., Dow, W.G., Eds.; AAPG Memoir; American Association of Petroleum Geologists: Tulsa, OK, USA, 1994; Volume 60, pp. 93–120. [Google Scholar]
- Espitalié, J.; Deroo, G.; Marquis, F. Rock-Eval pyrolysis and its applications. Oil Gas Sci. Technol. 1985, 40, 563–579. [Google Scholar] [CrossRef] [Scilit]
- Jarvie, D.M. Shale resource systems for oil and gas: Part 2—Shale-oil resource systems. In Shale Reservoirs—Giant Resources for the 21st Century; AAPG Memoir; American Association of Petroleum Geologists: Tulsa, OK, USA, 2012; Volume 97, pp. 89–119. [Google Scholar] [CrossRef] [Scilit]
- Hunt, J.M. Petroleum Geochemistry and Geology, 2nd ed.; W.H. Freeman and Company: New York, NY, USA, 1996. [Google Scholar]
- SY/T 5124-2012; Method for Determination of Vitrinite Reflectivity in Sedimentary Rocks. Petroleum Industry Press: Beijing, China, 2012.
- Moore, D.M.; Reynolds, R.C. X-ray Diffraction and the Identification and Analysis of Clay Minerals, 2nd ed.; Oxford University Press: Oxford, UK, 1997. [Google Scholar]
- SY/T 5163-2010; Analysis Method for Clay Minerals and Ordinary Non-Clay Minerals in Sedimentary Rocks by the X-ray Diffraction. Petroleum Industry Press: Beijing, China, 2010.
- Folk, R.L. The distinction between grain size and mineral composition in sedimentary-rock nomenclature. J. Geol. 1954, 62, 344–359. [Google Scholar] [CrossRef] [Scilit]
- Lazar, O.R.; Bohacs, K.M.; Macquaker, J.H.S.; Schieber, J.; Demko, T.M. Capturing key attributes of fine-grained sedimentary rocks in outcrops, cores, and thin sections: Nomenclature and description guidelines. J. Sediment. Res. 2015, 85, 230–246. [Google Scholar] [CrossRef] [Scilit]
- SY/T 5735-2019; Geochemical Method for Source Rock Evaluation. Petroleum Industry Press: Beijing, China, 2019.
- Huang, Z.; Hao, Y.; Li, S.; Wo, Y.; Sun, D.; Li, M.; Chen, J. Oil−bearing potential, mobility evaluation and significance of shale oil in Chang 7 shale system in the Ordos Basin: A case study of well H317. Geol. China 2020, 47, 210–219, (In Chinese with English abstract). [Google Scholar] [CrossRef]
- Sayid, M.A.; Yao, Z.G.; Li, R.; Saif, M.M.A. Hydrocarbon generation and retention potential of Chang 7 organic-rich shale in the Ordos Basin, China. Pet. Geosci. 2023, 29, petgeo2022-008. [Google Scholar] [CrossRef] [Scilit]
- Fathy, D.; Farouk, S.; Qteishat, A.; Ahmad, F.; Sami, M.; Al-Kahtany, K.; Lee, E.Y. Geochemical characterization of Upper Cretaceous organic-rich deposits: Insights from the Azraq Basin in Jordan. J. Asian Earth Sci. 2024, 276, 106365. [Google Scholar] [CrossRef] [Scilit]
- Li, M.; Yan, X.; Jiang, Y.; Zhuang, H.; Wang, Z. Fractal Characteristics of Pore Structure in Lacustrine Shale Oil Reservoirs and Controlling Factors of Oil Occurrence State: A Case Study of Da’anzhai Member, Sichuan Basin. Fractal Fract. 2026, 10, 111. [Google Scholar] [CrossRef] [Scilit]
- Huang, X.; Li, Z.; Han, X. Lithofacies-Controlled Pore Characteristics and Mechanisms in Continental Shales: A Case Study from the Qingshankou Formation, Songliao Basin. Minerals 2025, 15, 1239. [Google Scholar] [CrossRef] [Scilit]
- Passey, Q.R.; Bohacs, K.M.; Esch, W.L.; Klimentidis, R.; Sinha, S. From oil-prone source rock to gas-producing shale reservoir: Geologic and petrophysical characterization of unconventional shale-gas reservoirs. In Proceedings of the SPE International Oil and Gas Conference and Exhibition in China, Beijing, China, 8–10 June 2010. [Google Scholar] [CrossRef]
- Josh, M.; Esteban, L.; Delle Piane, C.; Sarout, J.; Dewhurst, D.N.; Clennell, M.B. Laboratory characterisation of shale properties. Mar. Pet. Geol. 2012, 38, 107–124. [Google Scholar] [CrossRef] [Scilit]
- Mei, Q.; Guo, R.; Zhou, X.; Cheng, G.; Li, S.; Bai, Y.; Liu, J.; Wu, W.; Zhao, J. Pore structure characteristics and impact factors of laminated shale oil reservoir in Chang 73 sub-member of Ordos Basin, China. J. Nat. Gas Geosci. 2023, 8, 227–243. [Google Scholar] [CrossRef] [Scilit]
- Hou, L.; Wu, S.; Jing, Z.; Jiang, X.-H.; Yu, Z.-C.; Hua, G.; Su, L.; Yu, C.; Liao, F.-R.; Tian, H. Effects of types and content of clay minerals on reservoir effectiveness for lacustrine organic matter-rich shale. Fuel 2022, 327, 125043. [Google Scholar] [CrossRef] [Scilit]
- Gale, J.F.W.; Laubach, S.E.; Olson, J.E.; Eichhuble, P.; Fall, A. Natural fractures in shale: A review and new observations. AAPG Bull. 2014, 98, 2165–2216. [Google Scholar] [CrossRef] [Scilit]
- Javadpour, F. Nanopores and apparent permeability of gas flow in mudrocks. J. Can. Pet. Technol. 2009, 48, 16–21. [Google Scholar] [CrossRef] [Scilit]
- Chalmers, G.R.L.; Bustin, R.M.; Power, I.M. Characterization of gas shale pore systems by porosimetry, pycnometry, surface area, and field emission scanning electron microscopy/transmission electron microscopy image analyses: Examples from the Barnett, Woodford, Haynesville, Marcellus, and Doig units. AAPG Bull. 2012, 96, 1099–1119. [Google Scholar] [CrossRef] [Scilit]
- Bai, Y.; Zhang, J.; Bai, J.; Lin, T.; Kang, D.; Wang, J.; Wu, W. Lithofacies-Constrained Pore Networks in Lacustrine Shales: Multi-Scale Characterization of the Lower Cretaceous Shahezi Formation, NE China. Minerals 2026, 16, 410. [Google Scholar] [CrossRef] [Scilit]
- Curtis, M.E.; Cardott, B.J.; Sondergeld, C.H.; Rai, C.S. Development of organic porosity in the Woodford Shale with increasing thermal maturity. Int. J. Coal Geol. 2012, 103, 26–31. [Google Scholar] [CrossRef] [Scilit]
- Milliken, K.L.; Rudnicki, M.; Awwiller, D.N.; Zhang, T.W. Organic matter-hosted pore system, Marcellus Formation, Pennsylvania. AAPG Bull. 2013, 97, 177–200. [Google Scholar] [CrossRef] [Scilit]
- Ko, L.T.; Loucks, R.G.; Milliken, K.L.; Liang, Q.; Zhang, T.; Sun, X.; Hackley, P.C.; Ruppel, S.C.; Peng, S. Controls on pore types and pore-size distribution in the Upper Triassic Yanchang Formation, Ordos Basin, China: Implications for pore-evolution models of lacustrine mudrocks. Interpretation 2017, 5, SF127–SF148. [Google Scholar] [CrossRef] [Scilit]
- Pommer, M.; Milliken, K. Pore types and pore-size distributions across thermal maturity, Eagle Ford Formation, southern Texas. AAPG Bull. 2015, 99, 1713–1744. [Google Scholar] [CrossRef] [Scilit]
- Iqbal, M.A.; Rezaee, R.; Smith, G.; Ekundayo, J.M. Shale lithofacies controls on porosity and pore structure: An example from Ordovician Goldwyer Formation, Canning Basin, Western Australia. J. Nat. Gas Sci. Eng. 2021, 89, 103888. [Google Scholar] [CrossRef] [Scilit]
- Ilgen, A.G.; Heath, J.E.; Akkutlu, I.Y.; Bryndzia, L.T.; Cole, D.R.; Kharaka, Y.K.; Kneafsey, T.J.; Milliken, K.L.; Pyrak-Nolte, L.J.; Suarez-Rivera, R. Shales at all scales: Exploring coupled processes in mudrocks. Earth-Sci. Rev. 2017, 166, 132–152. [Google Scholar] [CrossRef] [Scilit]
- Guo, Q.; Yao, Y.; Hou, L.; Tang, S.; Pan, S.; Yang, F. Oil migration, retention, and differential accumulation in “sandwiched” lacustrine shale oil systems from the Chang 7 Member of the Upper Triassic Yanchang Formation, Ordos Basin, China. Int. J. Coal Geol. 2022, 261, 104077. [Google Scholar] [CrossRef] [Scilit]
- Pan, S.; Guo, Q.; Zou, C.; Jing, Z.; Yuan, M.; He, Y.; Zheng, H.; Mu, Y.; Yang, Z.; Li, S.; et al. Identification of sweet spots in shale-type and siltstone-type “shale oil systems”: A case study of the Chang 7 Member in Ordos Basin. Sci. China Earth Sci. 2023, 66, 1647–1663. [Google Scholar] [CrossRef] [Scilit]
- Dong, T.; He, Q.; He, S.; Zhai, G.; Zhang, Y.; Wei, S.; Wei, C.; Hou, Y.; Guo, X. Quartz types, origins and organic matter-hosted pore systems in the Lower Cambrian Niutitang Formation, middle Yangtze Platform, China. Mar. Pet. Geol. 2021, 123, 104739. [Google Scholar] [CrossRef] [Scilit]
- You, F.; Liu, G.; Sun, M.; An, C.; Li, C.; Li, Y. Impacts of Pore Structure on the Occurrence of Free Oil in Lacustrine Shale Pore Networks. Energies 2023, 16, 7205. [Google Scholar] [CrossRef] [Scilit]
Disclaimer/Publisher’s Note: The statements, opinions and data contained in all publications are solely those of the individual author(s) and contributor(s) and not of MDPI and/or the editor(s). MDPI and/or the editor(s) disclaim responsibility for any injury to people or property resulting from any ideas, methods, instructions or products referred to in the content. |
© 2026 by the authors. Licensee MDPI, Basel, Switzerland. This article is an open access article distributed under the terms and conditions of the Creative Commons Attribution (CC BY) license.