


Abstract
Reservoir screening for geological CO2 storage must balance hydraulic performance against geochemical reactivity, but these attributes are rarely compared under a common numerical design. We used a unified two-dimensional radial TOUGHREACT v3.32/E CO2N benchmark to compare marble, granite, and sandstone at 75 and 100 °C. Six cases shared the same geometry, brine salinity, flow functions, boundary conditions, and nominal 12.5 kg/s injection schedule. Injection lasted 10 years, followed by post-injection evolution to approximately 100 years. At 10 years, a finite-domain component balance placed 86.51–87.66% of injected CO2 in the gas phase and 12.39–13.47% in incremental aqueous CO2. Closure errors were 0.0025–0.0836%, and SmCO2 remained zero within output precision. Sandstone produced the lowest overpressure (10.7–12.0 bar), marble provided the strongest carbonate buffering, and granite showed the largest pressure and acidification penalties. A G75 rerun with half the maximum time step reproduced the 10-year metrics but reduced the approximately 100-year local porosity extreme from 18.224% to 0.171%, showing that the original long-term extreme was not time-step robust. Sensitivity tests identify injection rate as the primary control on pressure and plume extent, whereas reactive surface area mainly controls carbonate-reaction magnitude. These results show that lithology does not rank along a single performance axis: robust screening must jointly evaluate injectivity, plume footprint, phase partitioning, and post-injection reaction pathways.
1. Introduction
Geological CO2 storage and utilization involve coupled injection, phase behavior, transport, and containment processes in subsurface systems [1,2,3,4]. Reservoir screening must therefore balance hydraulic performance against geochemical reactivity. High porosity and permeability facilitate injection and limit pressure buildup, but they may also sustain a larger mobile CO2 inventory. Reactive mineral assemblages can buffer acidification and promote stabilization, yet they may occur in rocks with less favorable hydraulic properties. Screening should therefore connect engineering indicators, including overpressure and plume extent, with aqueous buffering, phase partitioning, and mineral-reaction pathways. Carbonate-rich rocks illustrate why reactivity cannot be equated with net mineral trapping. Natural carbonate successions show how fracture-associated dissolution, karstification, and later cementation reshape flow pathways [5]. CO2 storage analogues also document coupled dissolution and carbonate reprecipitation during fluid migration [6]. Calcite and dolomite can buffer pH rapidly, but dissolution and reprecipitation may mainly recycle carbon and cations within the pre-existing assemblage. Fractured-carbonate simulations further show that clay mineralogy, Ca/Mg ratio, brine composition, and fracture–matrix exchange control structural, dissolution, and mineral trapping [7]. High-temperature simulations of the Kizildere geothermal reservoir likewise found limited CO2 mineralization in marble and calcite-bearing assemblages [8]. Carbonate abundance should therefore indicate reaction and buffering potential, not direct evidence of net solid-phase storage. Granite provides the contrasting crystalline end member. It contains abundant feldspar and quartz but little primary carbonate, so cation release and secondary-carbonate formation depend on slow silicate reactions. Experiments and TOUGHREACT simulations for the Matouying system identify plagioclase, quartz, and K-feldspar as the principal controls on granite–water interaction at 150 °C and 30 MPa [9]. These reactions may become important over long post-injection periods, but their contribution on operational timescales is likely to remain kinetically limited.
Sandstone commonly occupies the hydraulically favorable end of the spectrum because of its larger pore volume and higher permeability. Its geochemical response, however, is controlled less by volumetrically dominant quartz than by minor carbonates, feldspars, clays, and Fe–Mg-bearing phases. Storage-efficiency simulations confirm that lithology and depositional environment affect pore-space utilization [10], while experiments and reactive-transport studies show that calcite, dolomite/ankerite, chlorite, feldspar, and quartz reactions can alter sandstone pore structure and solute release [11,12,13]. Sandstone may thus combine good injectivity with reaction pathways governed by minerals that are minor in bulk abundance. Site-specific numerical research has also evaluated geological CO2 storage in the pre-Comondu sandstones of the Las Tres Virgenes geothermal area [14].
Previous studies establish the behavior of individual lithologies, but differences in geometry, boundary conditions, brine composition, injection rate, and reaction parameters prevent direct comparison. We therefore used a common two-dimensional radial TOUGHREACT workflow to address four objectives: (1) quantify finite-domain gas-phase and incremental aqueous CO2 partitioning and closure at the end of injection; (2) compare injectivity, plume footprint, and aqueous buffering among lithological end members; (3) distinguish post-injection mineral-reaction pathways from quantified net mineral trapping; and (4) determine which screening interpretations remain supported by parameter, grid, and targeted time-step tests. Related geoenergy studies have also evaluated CO2 injection as a means of combining heat extraction with carbon sequestration [15].
2. Materials and Methods
2.1. Numerical Simulator and Equation of State
Reactive-transport simulations were performed with TOUGHREACT v3.32. PHREEQC and TOUGHREACT are complementary rather than interchangeable numerical choices. PHREEQC is widely used for aqueous speciation, equilibrium and kinetic reaction calculations, and one-dimensional reactive transport. TOUGHREACT couples these geochemical processes to non-isothermal, multiphase flow and transport in the present two-dimensional radial geometry. The contribution is a controlled cross-lithology benchmark and multi-metric screening workflow, not a new solver. Fluid properties were calculated with ECO2N for the H2O-NaCl-CO2 system [16,17,18]. Early coupled studies evaluated mineral trapping in deep arenaceous formations and aquifers [19,20]. The model includes water, NaCl, and CO2 mass components and solves the energy-conservation equation. Each case was initialized at a uniform target temperature.
The applicability range of ECO2N constrains the temperature interval considered in this benchmark. The study therefore focuses on 75 and 100 °C, both of which lie within the practical range of the equation-of-state module used here. The 150–220 °C geothermal scenarios discussed by Xu et al. [9] and Erol et al. [8] are used only as external comparisons and are not directly simulated in this study.
Thermodynamic and kinetic calculations used the EQ3/6-compatible geochemical framework adopted in the TOUGHREACT project [16]. Reactive-transport simulations are sensitive to thermodynamic databases, mineral kinetic parameters, phase descriptions, and numerical implementation, and different simulators or database conversions can produce appreciable differences [21]. Because the objective here is a cross-lithology benchmark comparison rather than history matching for a single field site, all cases use the same numerical workflow, output-time selection, and post-processing criteria. In the absence of an independent element mass-balance conversion, all mineral-volume-fraction changes reported in the main text are interpreted as reaction-path indicators.
2.2. Conceptual Model, Geometry, and Boundary Conditions
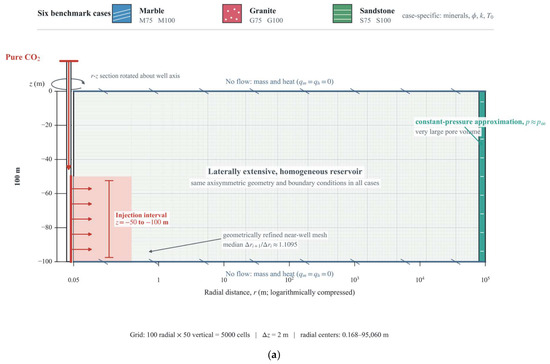
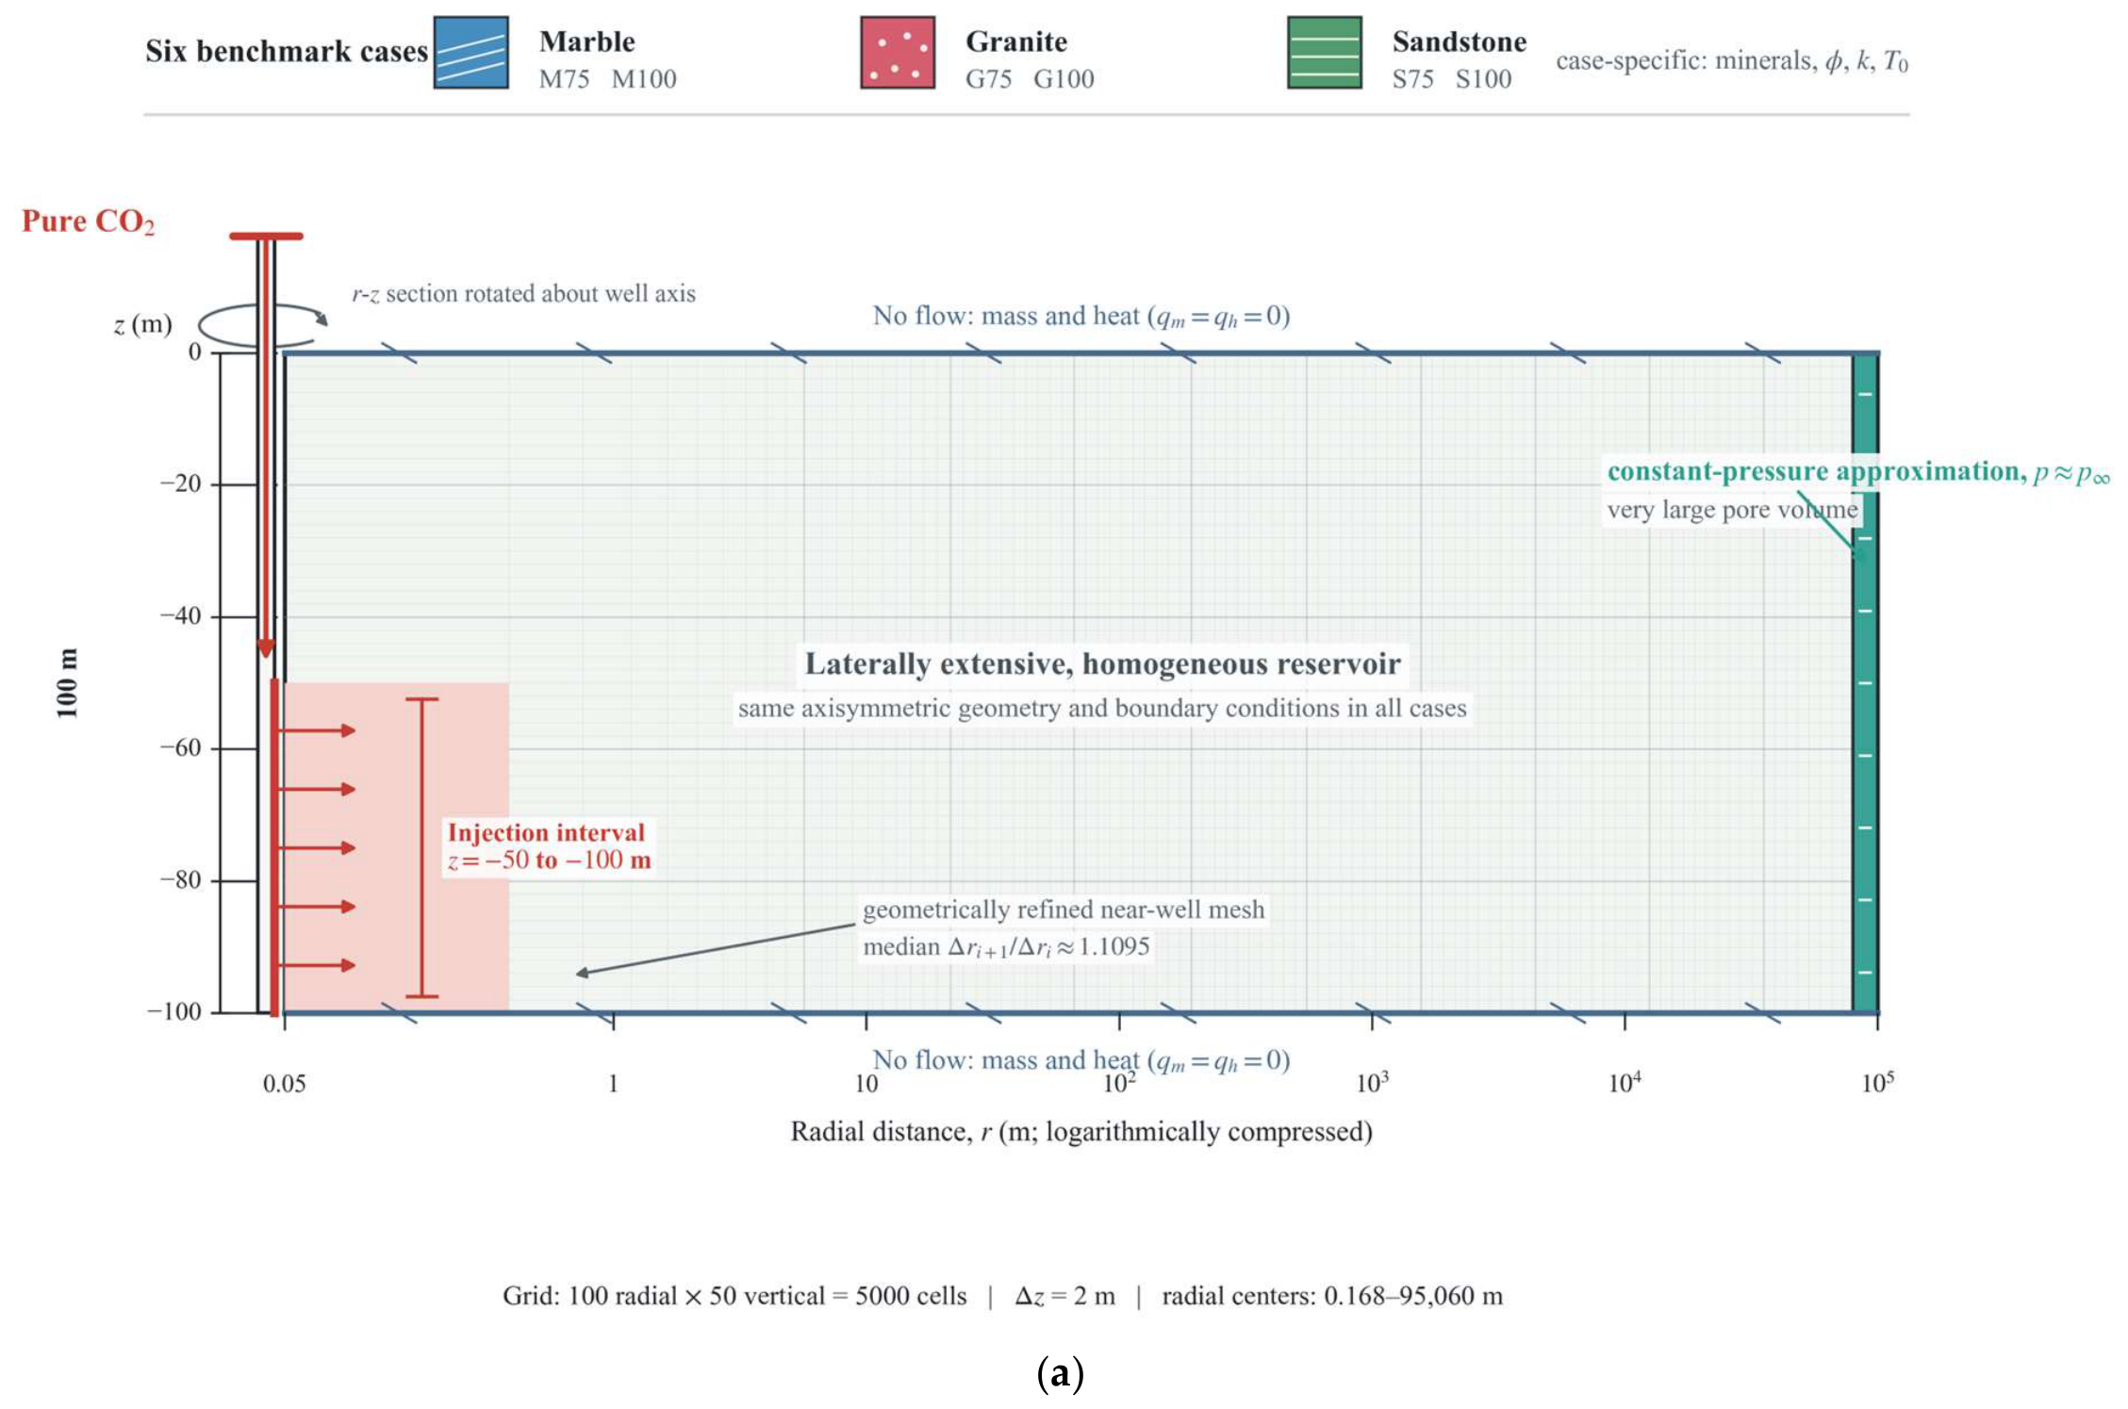
Figure 1a summarizes the common conceptual and numerical setup used for all six benchmark cases. A single vertical well injects pure CO2 into a laterally extensive, homogeneous reservoir represented by a two-dimensional radial-axisymmetric (r–z) section. Marble, granite, and sandstone are each simulated at 75 and 100 °C. Their mineral assemblages, porosity, permeability, and initial temperature differ, whereas the geometry, grid architecture, injection interval, and boundary conditions remain identical.
Figure 1.
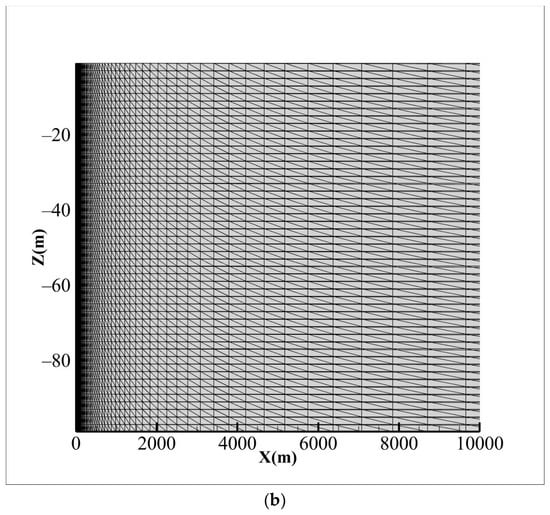
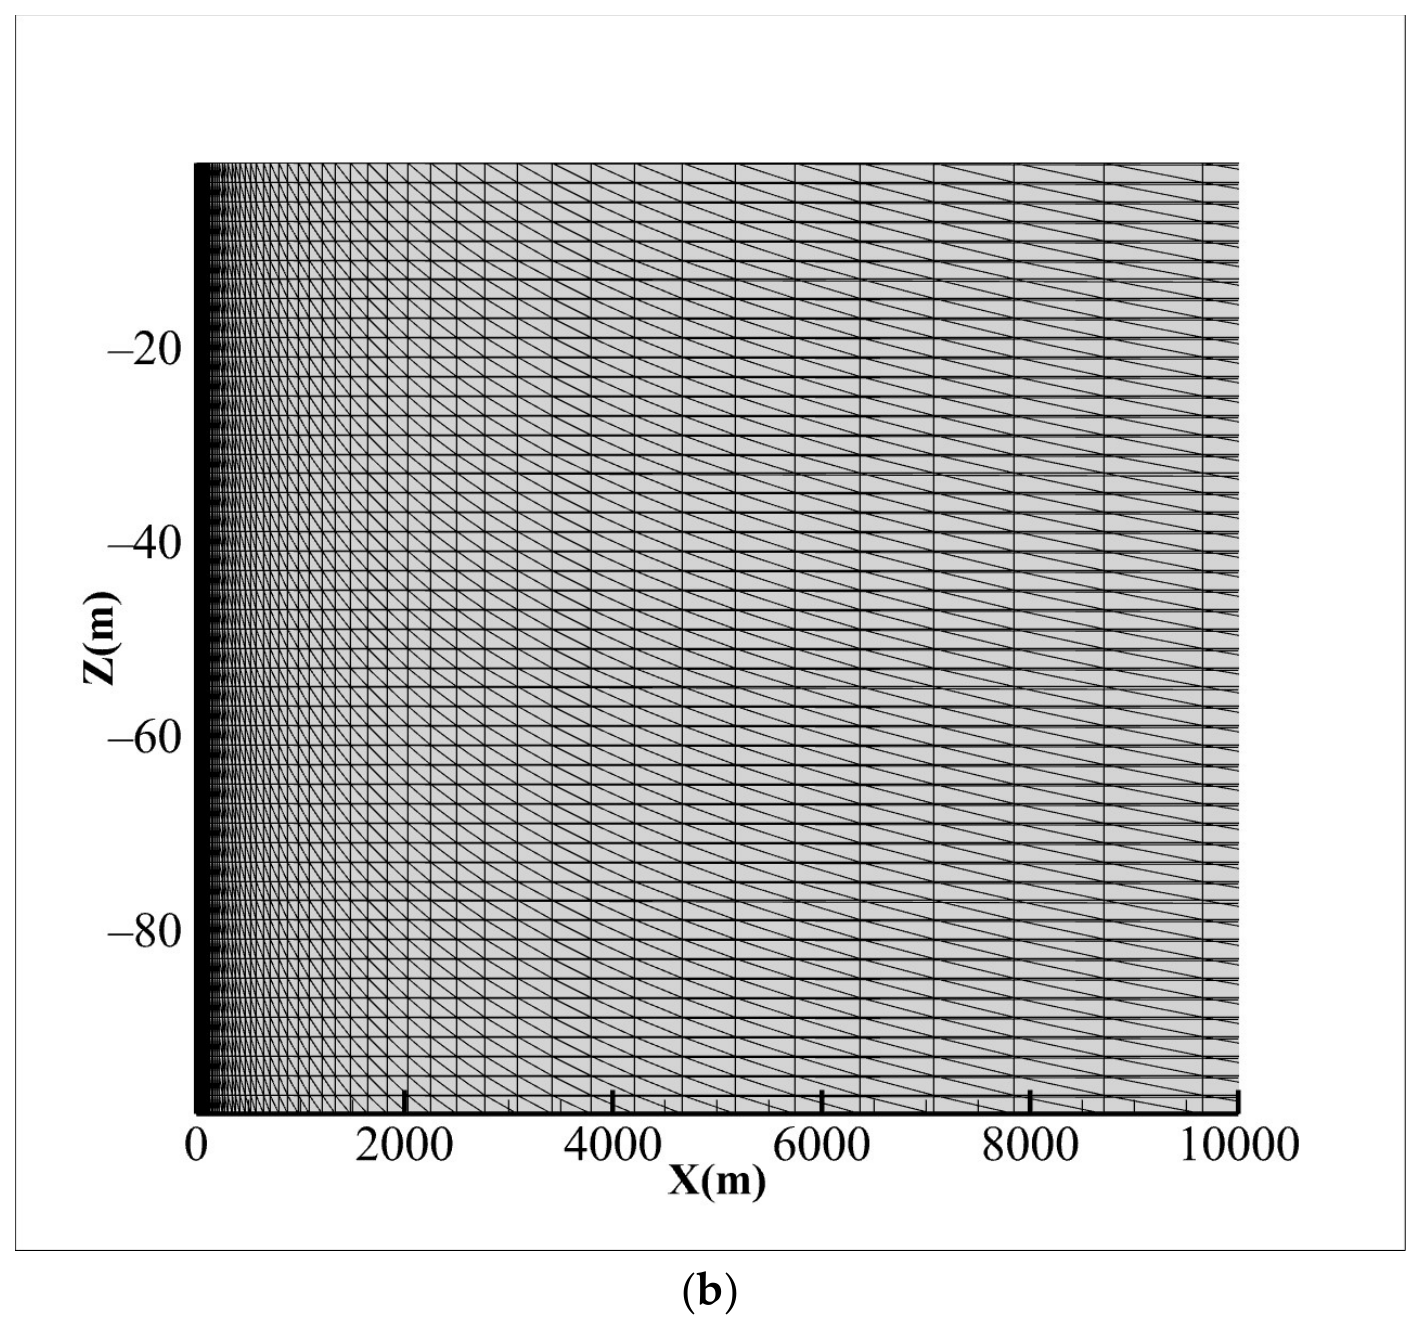
(a) Conceptual model shared by the six lithology–temperature cases. The diagram shows the single vertical injection well, the 50 m injection interval from z = −50 to −100 m, the logarithmically compressed radial domain, near-well mesh refinement, no-flow boundaries for mass and heat at the top and bottom, and the large-pore-volume outer boundary used to approximate constant far-field pressure. Marble, granite, and sandstone are each evaluated at 75 and 100 °C. (b) Near-well view of the numerical mesh in the two-dimensional radial-axisymmetric domain. The 100 radial columns are geometrically refined toward the injection well, whereas the 50 vertical layers are uniformly spaced at 2 m.
The common numerical domain extends from r = 0.05 to 100,000 m and from z = 0 to z = −100 m. The benchmark grid comprises 100 radial columns and 50 uniformly spaced vertical layers, giving 5000 cells with a layer thickness of 2 m. Radial cell centers span approximately 0.168 to 95,060 m. Radial spacing increases away from the well, with a median cell-width growth ratio of approximately 1.1095. Figure 1a summarizes this strongly nonuniform domain on a logarithmically compressed radial axis, whereas Figure 1b shows the computational mesh directly.
Pure CO2 was imposed as a uniform source along the lower 50 m of the innermost radial column, from z = −50 to −100 m. All six models used the same remote constant-boundary concept. The outermost radial column was assigned a very large pore volume to maintain approximately constant far-field pressure. The upper and lower boundaries were impermeable and adiabatic. Finite-domain inventories excluded the same 50 cells in the outermost radial column for every case. Differences in their printed global-balance representation reflect output accounting, not different physical boundary conditions.
This geometry is intended as a computationally efficient radial benchmark. It retains the vertical coordinate and gravity term but imposes rotational symmetry around the well. It therefore cannot represent asymmetric plume migration, three-dimensional gravity segregation, heterogeneous permeability, discrete faults, caprock architecture, wellbore constraints, or geomechanical feedback. The results are consequently interpreted as comparative screening evidence rather than site-specific plume or containment predictions.
2.3. Lithological End Members
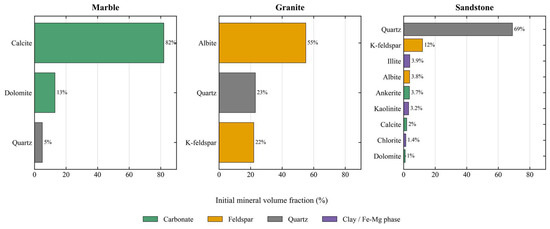
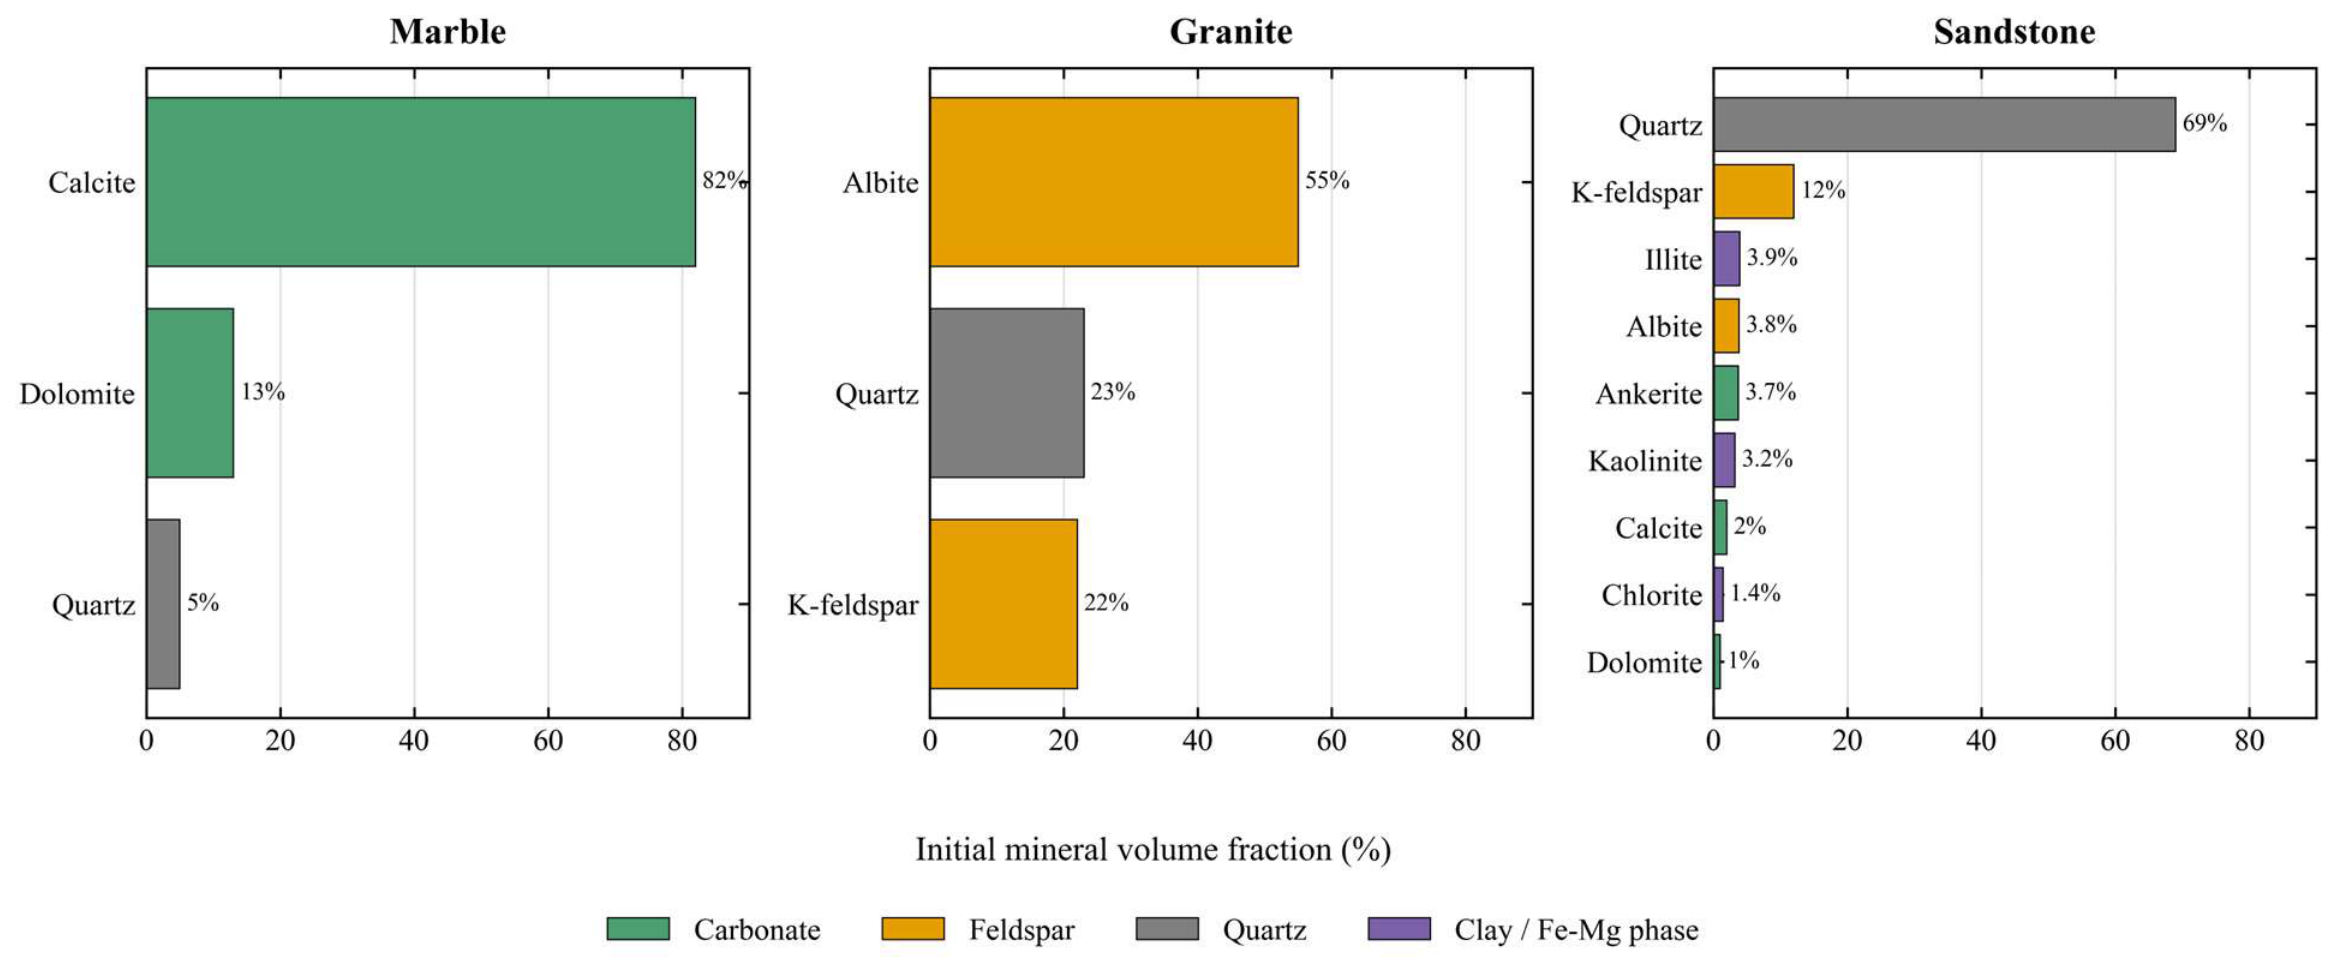
The three simulated lithologies represent carbonate, crystalline, and siliciclastic end members (Figure 2). Marble is based on the carbonate-rich mineral assemblage discussed by Erol et al. [8]; granite uses the XRD mineral composition reported by Xu et al. [9]; and sandstone adopts the Heletz-type mineral assemblage described by Wolf et al. [13]. Initial porosity and permeability differ among the lithologies in order to preserve representative reservoir contrasts. Comparable lithology-property coupling has also been reported in CO2 storage-efficiency simulations for saline formations, where differences in relative permeability, porosity, and permeability among clastics, limestone, and dolomite alter storage-efficiency factors [10]. Thus, this study compares realistic coupled petrophysical–geochemical end members rather than isolating mineral assemblages under identical flow properties.
Figure 2.
Initial mineral-volume-fraction compositions of the three lithological end members. Colors distinguish mineral groups, including carbonates, feldspars, quartz, and clay/Fe–Mg-bearing phases.
Secondary minerals allowed to precipitate include calcite, dolomite, ankerite, magnesite, siderite, dawsonite, hematite, illite, kaolinite, montmorillonite, and chalcedony. Calcite was specified as a local-equilibrium mineral to represent rapid carbonate buffering; consequently, no independent calcite kinetic rate constant was used. All other minerals were described kinetically. This equilibrium assumption may accelerate local dissolution and reprecipitation relative to a finite-rate calcite formulation, particularly near the well at 100 °C. Carbonate responses are therefore interpreted as assumption-dependent buffering and reaction-path signals rather than field-calibrated kinetic predictions. Kinetic parameterization was applied consistently across cases, with sandstone values following Wolf et al. [13].
All six inputs use the same two-phase flow functions. Relative permeability uses the van Genuchten–Mualem option, IRP = 7, with RP(1–4) = 0.457, 0.30, 1.0, and 0.05. These values define λ, Slr, Sls, and Sgr, respectively. Capillary pressure uses the van Genuchten option, ICP = 7, with CP(1–5) = 0.457, 0.0, 5.1 × 10⁻⁵ Pa−1, 1.0 × 10⁷ Pa, and 0.999. These values define λ, Slr, 1/P0, Pmax, and Sls; CP(3) corresponds to P0 ≈ 19.6 kPa. The functions are identical across lithologies, so flow contrasts arise from assigned porosity and intrinsic permeability rather than different saturation functions.
It is important to emphasize that allowing a mineral to precipitate does not mean that this mineral necessarily forms an appreciable net solid-phase CO2 inventory. This study distinguishes among three types of information: free-phase, dissolved, and SmCO2 entries in the CO2 mass inventory; individual mineral-volume-fraction changes in the solid output; and the additional element mass-balance and mineral-stoichiometry conversion required to quantify net mineralized CO2. This treatment is consistent with common interpretations of CO2–brine–rock experiments and reactive-transport simulations, in which mineral-volume changes, local pore-structure evolution, and net CO2 fixation must be distinguished using independent mass-balance or experimental constraints [21,22]. Except for SmCO2, individual mineral ΔV values are used only to indicate reaction pathways and spatial redistribution.
2.4. Initial Brine and Injection Scheme
All simulations used NaCl-dominated brine with a salinity of approximately 0.06 by mass fraction, close to 1 molal NaCl. This controlled saline-brine reference lies within the H2O-NaCl-CO2 conditions represented by ECO2N and is used consistently across all cases to isolate lithological effects rather than reproduce a site-specific formation-water chemistry [17]. Before injection, the brine was equilibrated separately with each lithological mineral assemblage to obtain lithology-dependent initial aqueous chemistry. The resulting far-field pH was approximately neutral to weakly alkaline.
The initial top pressure was 150 bar for the 75 °C models and 200 bar for the 100 °C models. The nominal injection rate is 12.5 kg/s. The 25 discrete source terms sum to 12.4992 kg/s, corresponding to 3.941747712 × 10⁹ kg over the 315,360,000 s injection interval. The 10-year state is therefore used to assess injection-period pressure, plume extent, and phase partitioning. Injection was then stopped, and the six models were continued to approximately 100 years solely to evaluate post-injection pressure relaxation, plume redistribution, dissolution, and mineral-reaction evolution.
2.5. Simulation Matrix and Sensitivity Analysis
The six benchmark models combine three lithologies and two temperatures (Table 1).
Table 1.
Benchmark simulation matrix.
The one-factor sensitivity analysis used M75 as the reference case and independently perturbed only mineral reactive surface area A, CO2 injection rate q, and permeability k at 0.5 and 2.0 times their benchmark values while holding the remaining M75 inputs fixed. The corrected permeability set is exactly two-sided: k/k0 = 0.5 and 2.0. Porosity, temperature, and initial pressure were not independently perturbed. Across the six benchmark cases, temperature co-varied with initial pressure, whereas mineralogy, porosity, permeability, and equilibrated initial brine chemistry co-varied with lithology. Those paired contrasts therefore represent coupled end members rather than single-parameter sensitivity tests. Grid refinement and the G75 maximum-time-step rerun were evaluated separately as numerical diagnostics.
2.6. Metrics and Post-Processing
The CO2 plume radius is the radial coordinate of the outermost cell center where gas saturation, Sg, exceeds 0.01. It is not a vertically averaged radius or a sharp physical interface. The retained 10-year flow fields were also post-processed at Sg thresholds of 0.001, 0.005, 0.02, and 0.05. The dry-out radius is the outermost cell center where liquid saturation, Sl, is below 0.05. Pressure response is reported as maximum domain pressure and, for injectivity comparison, ΔPmax relative to initial top pressure. Aqueous profiles exclude cells with Sl < 0.05 and require liquid in at least 80% of vertical cells at each radius. Individual mineral-volume-fraction changes are reaction-path indicators. SmCO2 is the reported solid-phase CO2 inventory term.
Finite-domain CO2 inventories were reconstructed cell by cell as VφSρX for gas and aqueous phases, using MESH volumes and the saved component fields. The common outermost 50 constant-boundary cells were excluded, leaving 4950 cells in each case. Initial inventory was estimated from the earliest saved zone after correcting for the small injected amount at that time. The closure residual is R = [MCO2(t) − MCO2(initial)] − Minjected, and relative closure error is 100|R|/Minjected. Gas-phase XCO2 equals 1 − XH2O,gas; aqueous XCO2 is read directly. SmCO2 is zero in every uploaded solid-output record. The 75 and 100 °C models used different initial top pressures. We therefore report both absolute Pmax,final and overpressure relative to initial top pressure, ΔPmax. Absolute pressure describes the model-domain pressure state. ΔPmax is more appropriate for comparing injectivity and pressure penalty. pH metrics include only liquid-containing cells. Near-well dry-out cells contain too little liquid to support robust acidification estimates.
Grid-sensitivity tests evaluated the influence of radial discretization on the 75 °C marble, granite, and sandstone models. All grids retained the same domain, boundaries, initial pressure, injection rate, injection duration, and lithology-specific reaction parameters. Each grid used 50 vertical layers; only radial-cell number and geometric growth ratio varied. The coarse, benchmark, and fine grids contained 80 × 50, 100 × 50, and 150 × 50 cells, respectively. Their median radial-spacing growth ratios were approximately 1.1002, 1.1094, and 1.0699, respectively. Comparison metrics included 10-year Pmax, ΔPmax, plume radius, dry-out radius, minimum liquid-cell pH, porosity change, and major mineral-volume-fraction changes. A targeted post hoc time-step diagnostic was performed separately for G75 by reducing the maximum allowed step from 172,800 to 86,400 s while retaining the benchmark grid, boundaries, injection schedule, flow functions, and geochemical setup. The same metrics and finite-domain CO2 balance were compared at 10, 50, and approximately 100 years. Because only one smaller maximum time step was tested, this comparison diagnoses sensitivity but does not constitute a formal temporal-convergence series.
For comparison among the six benchmark models, this study uses a multi-metric storage screening index, MSSI:
where N denotes min–max normalization across the six benchmark cases. ΔPmax is used instead of absolute final pressure so that the 50 bar difference in initial top pressure does not enter the injectivity penalty. Because SmCO2 is zero in all cases, N(Mmineral) is zero and does not affect the score. For the four active terms [aqueous CO2, ΔPmax, ΔpH, max|Δφ|], the reference weights are (1, 1, 1, 1). Pressure-heavy, geochemistry-heavy, porosity-heavy, and injectivity-first checks use (1, 3, 1, 1), (3, 1, 3, 1), (1, 1, 1, 3), and (1, 5, 1, 1), respectively. These targeted post hoc calculations use the same stored outputs and do not add simulations. MSSI is an internal, weight-dependent comparison aid and is not an engineering site-selection, safety, or regulatory criterion.
MSSI = N(Mdissolved) + N(Mmineral) − N(ΔPmax) − N(ΔpH) − N(max|Δφ|)
3. Results
3.1. CO2 Plume Migration and Pressure Response
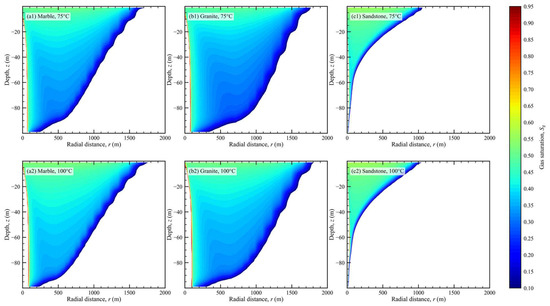
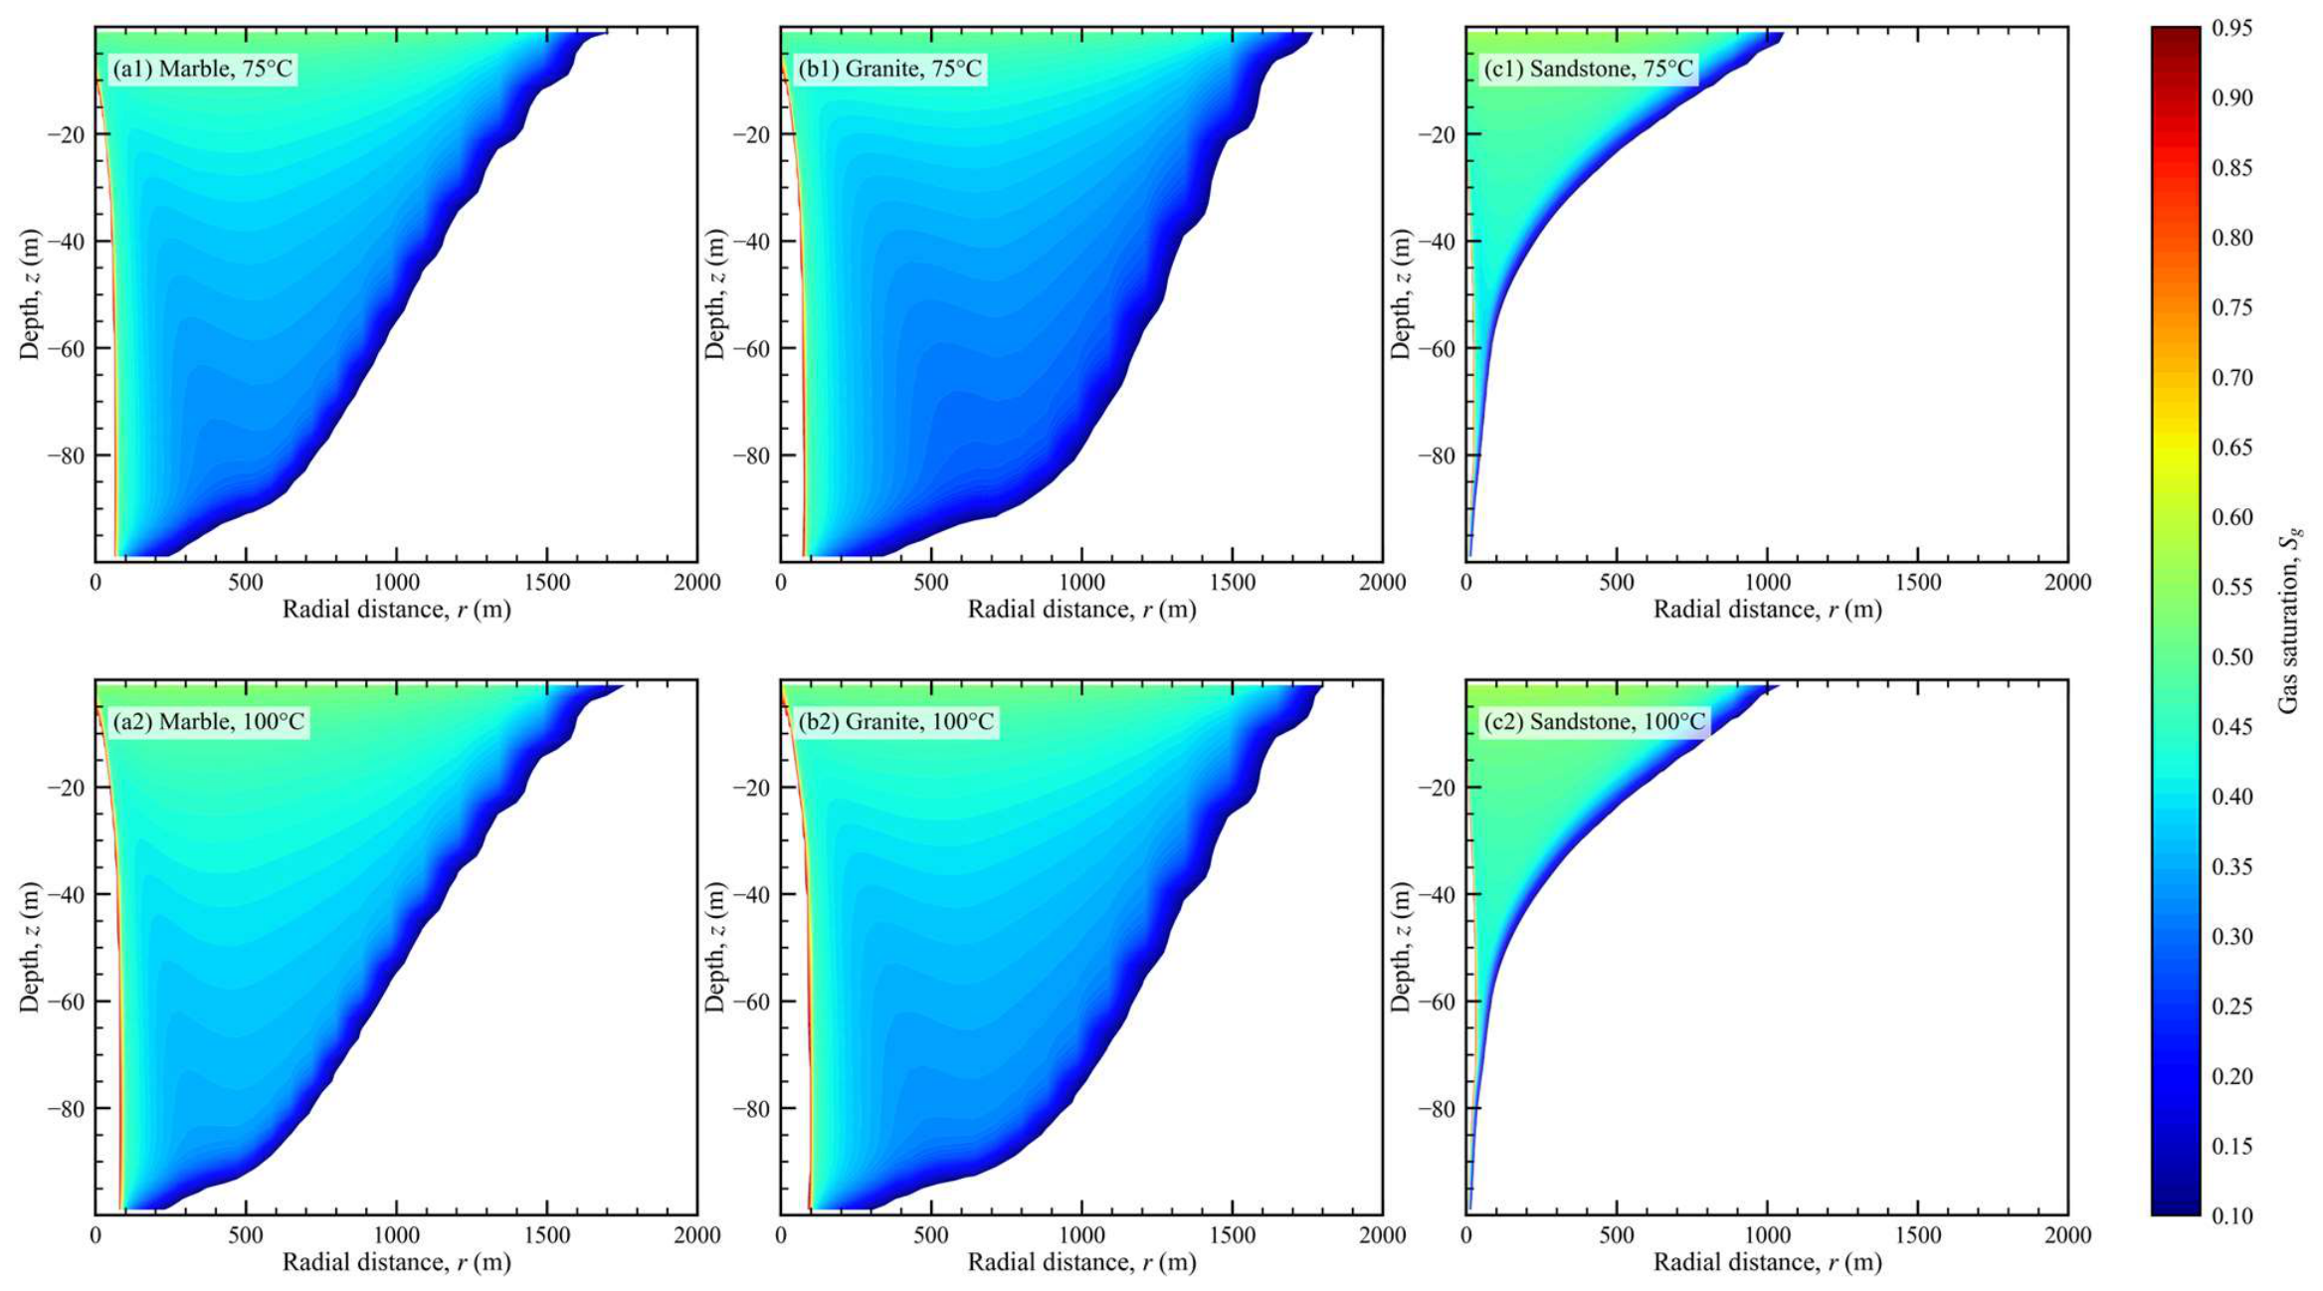
All six cases developed the same first-order plume architecture after 10 years. Each contained a near-well dry-out zone, a high-saturation CO2 core, and a sharp two-phase transition toward the far field (Figure 3). This shared architecture provided a common basis for comparing plume footprint and pressure response.
Figure 3.
Gas-phase CO2 saturation at the end of the 10-year injection period: (a1) marble at 75 °C; (a2) marble at 100 °C; (b1) granite at 75 °C; (b2) granite at 100 °C; (c1) sandstone at 75 °C; (c2) sandstone at 100 °C. The color bar denotes Sg Pressure response revealed the clearest; plume radius is defined as the outermost radial cell-center distance satisfying Sg > 0.01, with additional threshold checks reported in Section 3.1.
Lithology separates the cases primarily through plume footprint. At Sg > 0.01, the 10-year radius is about 1.65 km in M75, M100, and G75. It is 1.83 km in G100 and 0.98 km in both sandstone cases (Figure 3). Reprocessing at thresholds from 0.001 to 0.05 leaves the radius unchanged for five cases and preserves the cross-model ordering. S75 alone expands from 978.8 to 1086 m at the two lowest thresholds. The threshold therefore provides a reproducible operational front definition, but the radius is not geometrically threshold independent. Temperature expands the dry-out zone from 62.8 to 78.0 m in marble and from 22.8 to 28.8 m in sandstone. Granite spans 70.0–96.7 m.
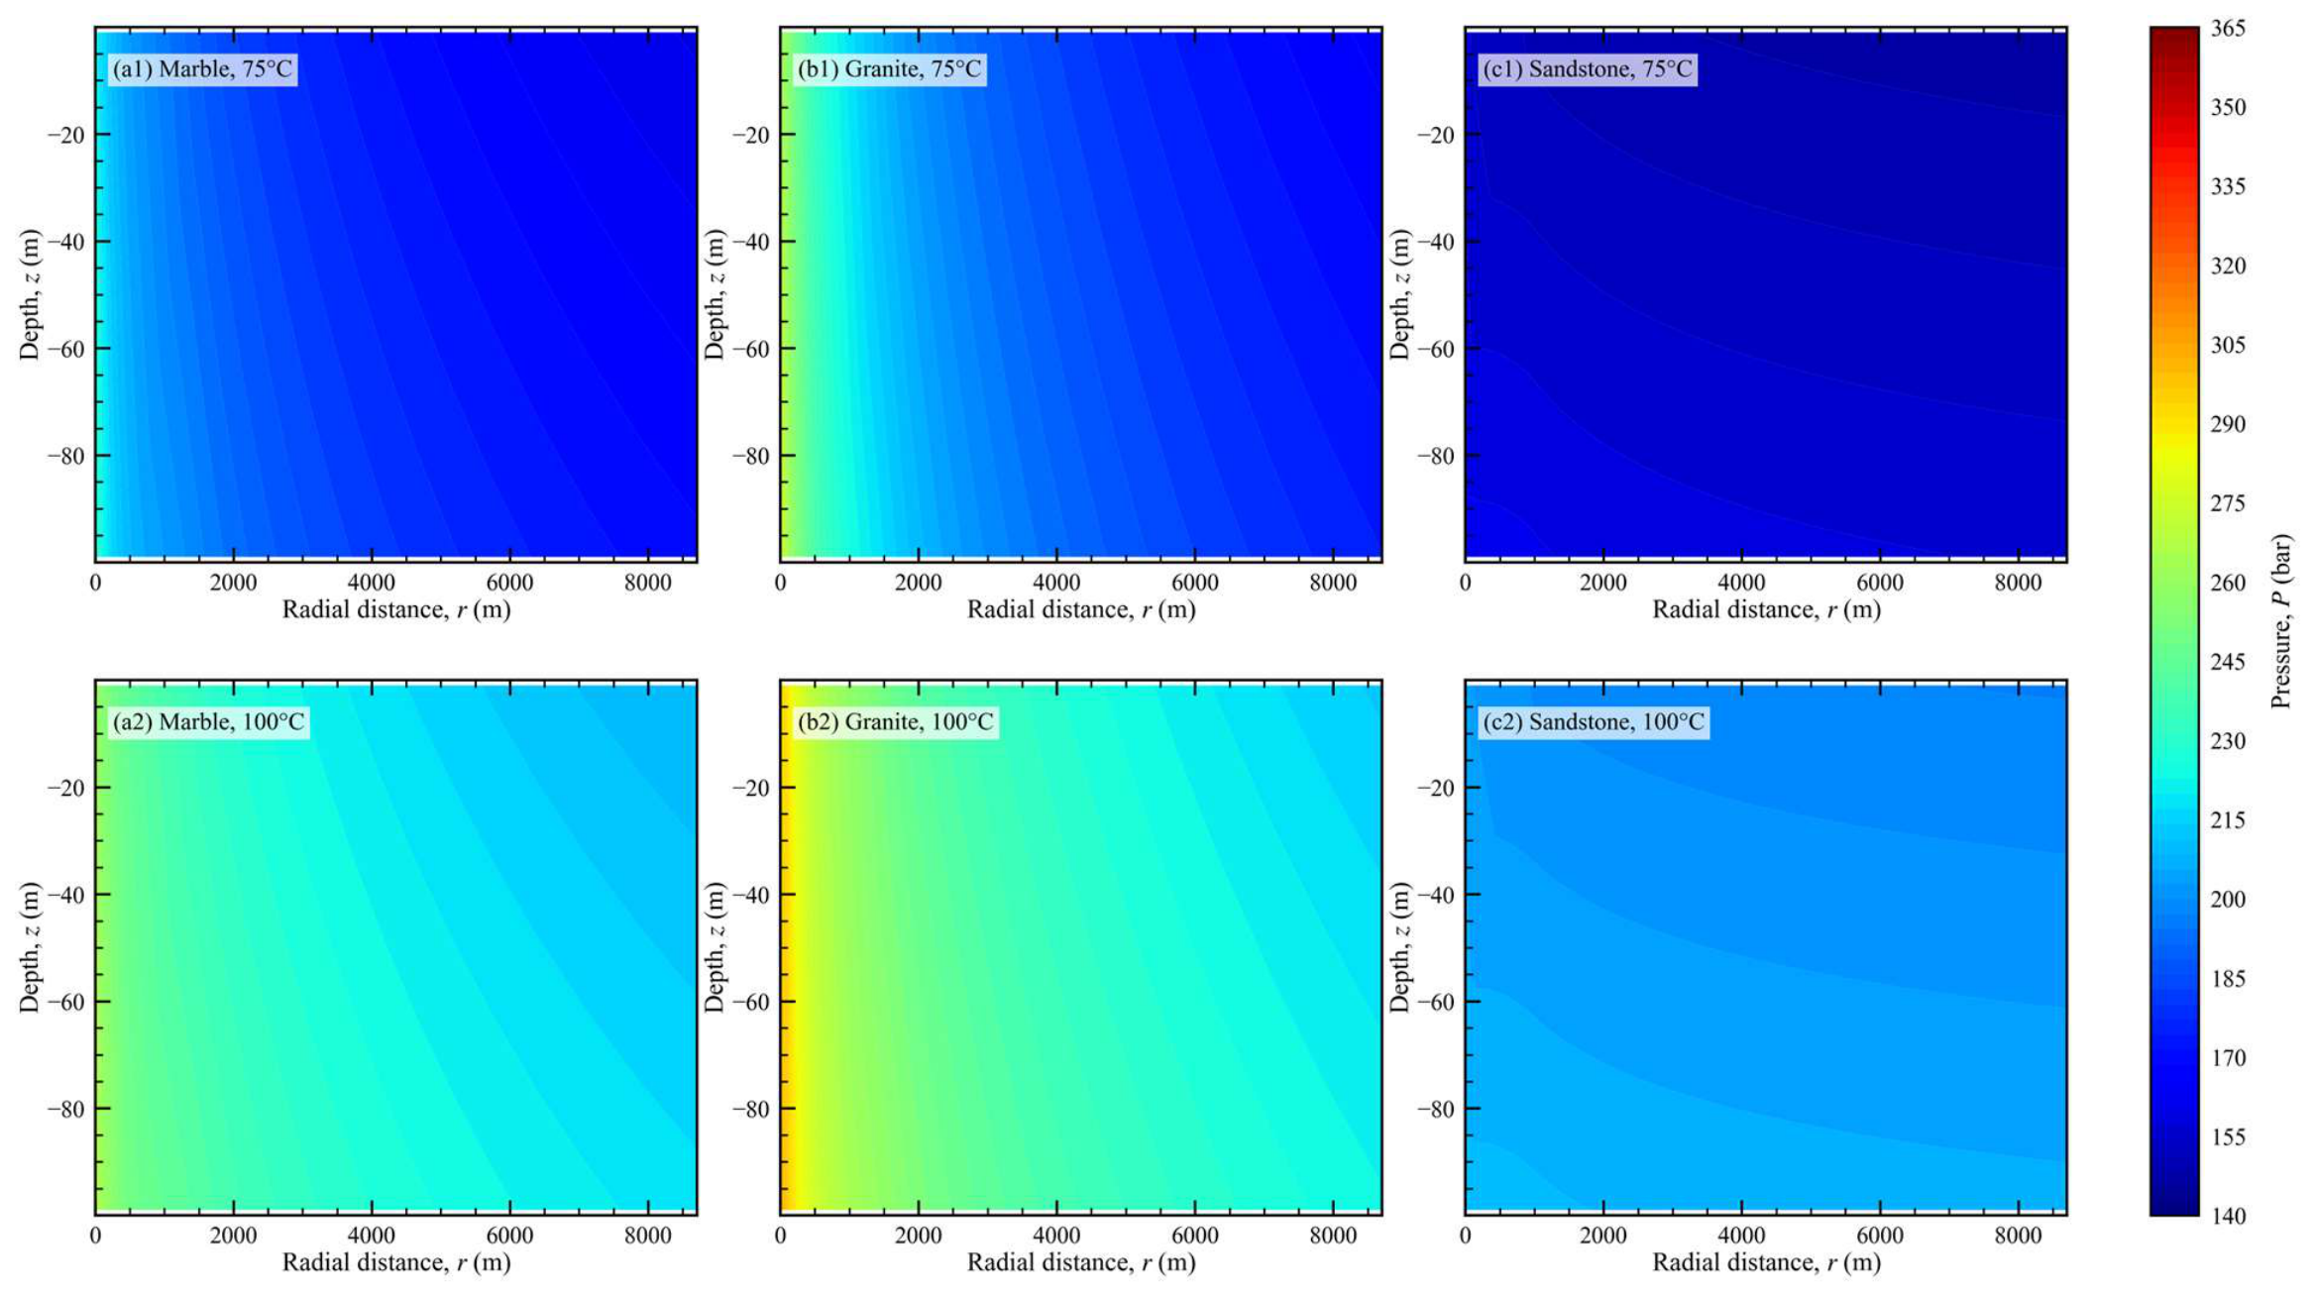
Pressure response revealed the clearest operational ranking (Figure 4; Table 2). Final pressures were 248.7–286.2 bar in marble, 306.4–335.2 bar in granite, and 162.0–210.7 bar in sandstone. The 75 and 100 °C cases started at 150 and 200 bar, respectively. Overpressure therefore provided the more consistent injectivity metric. Sandstone increased by 10.7–12.0 bar, marble by 86.2–98.7 bar, and granite by 135.2–156.4 bar. The ordering sandstone > marble > granite was robust within both temperature groups.
Figure 4.
Pressure, P, at the end of the 10-year injection period: (a1) marble at 75 °C; (a2) marble at 100 °C; (b1) granite at 75 °C; (b2) granite at 100 °C; (c1) sandstone at 75 °C; (c2) sandstone at 100 °C. Because the 75 and 100 °C models have different initial top pressures, cross-temperature differences in absolute pressure should not be interpreted as purely thermal effects; injectivity comparisons use ΔPmax relative to initial top pressure (Table 2).
Table 2.
Injection-period flow and chemical indicators at 10 years. Plume and dry-out radii use the outermost cell centers satisfying Sg > 0.01 and Sl < 0.05, respectively; ΔPmax is referenced to the initial top pressure; pH minima include only liquid-containing cells; gas-phase fractions are finite-domain component-mass estimates relative to injected CO2.
Post-injection evolution changes plume extent more than the lithological pressure ordering. By approximately 100 years, maximum pressures relax to 156.95–236.69 bar and plume radii expand to 1.83–3.08 km. These outputs do not extend the injection-performance test: the 10-year state corresponds to the prescribed end of injection, whereas 50- and 100-year states describe redistribution after the source is removed. Injection-period injectivity and post-injection plume evolution are therefore evaluated as separate time scales.
3.2. pH and Aqueous Chemistry
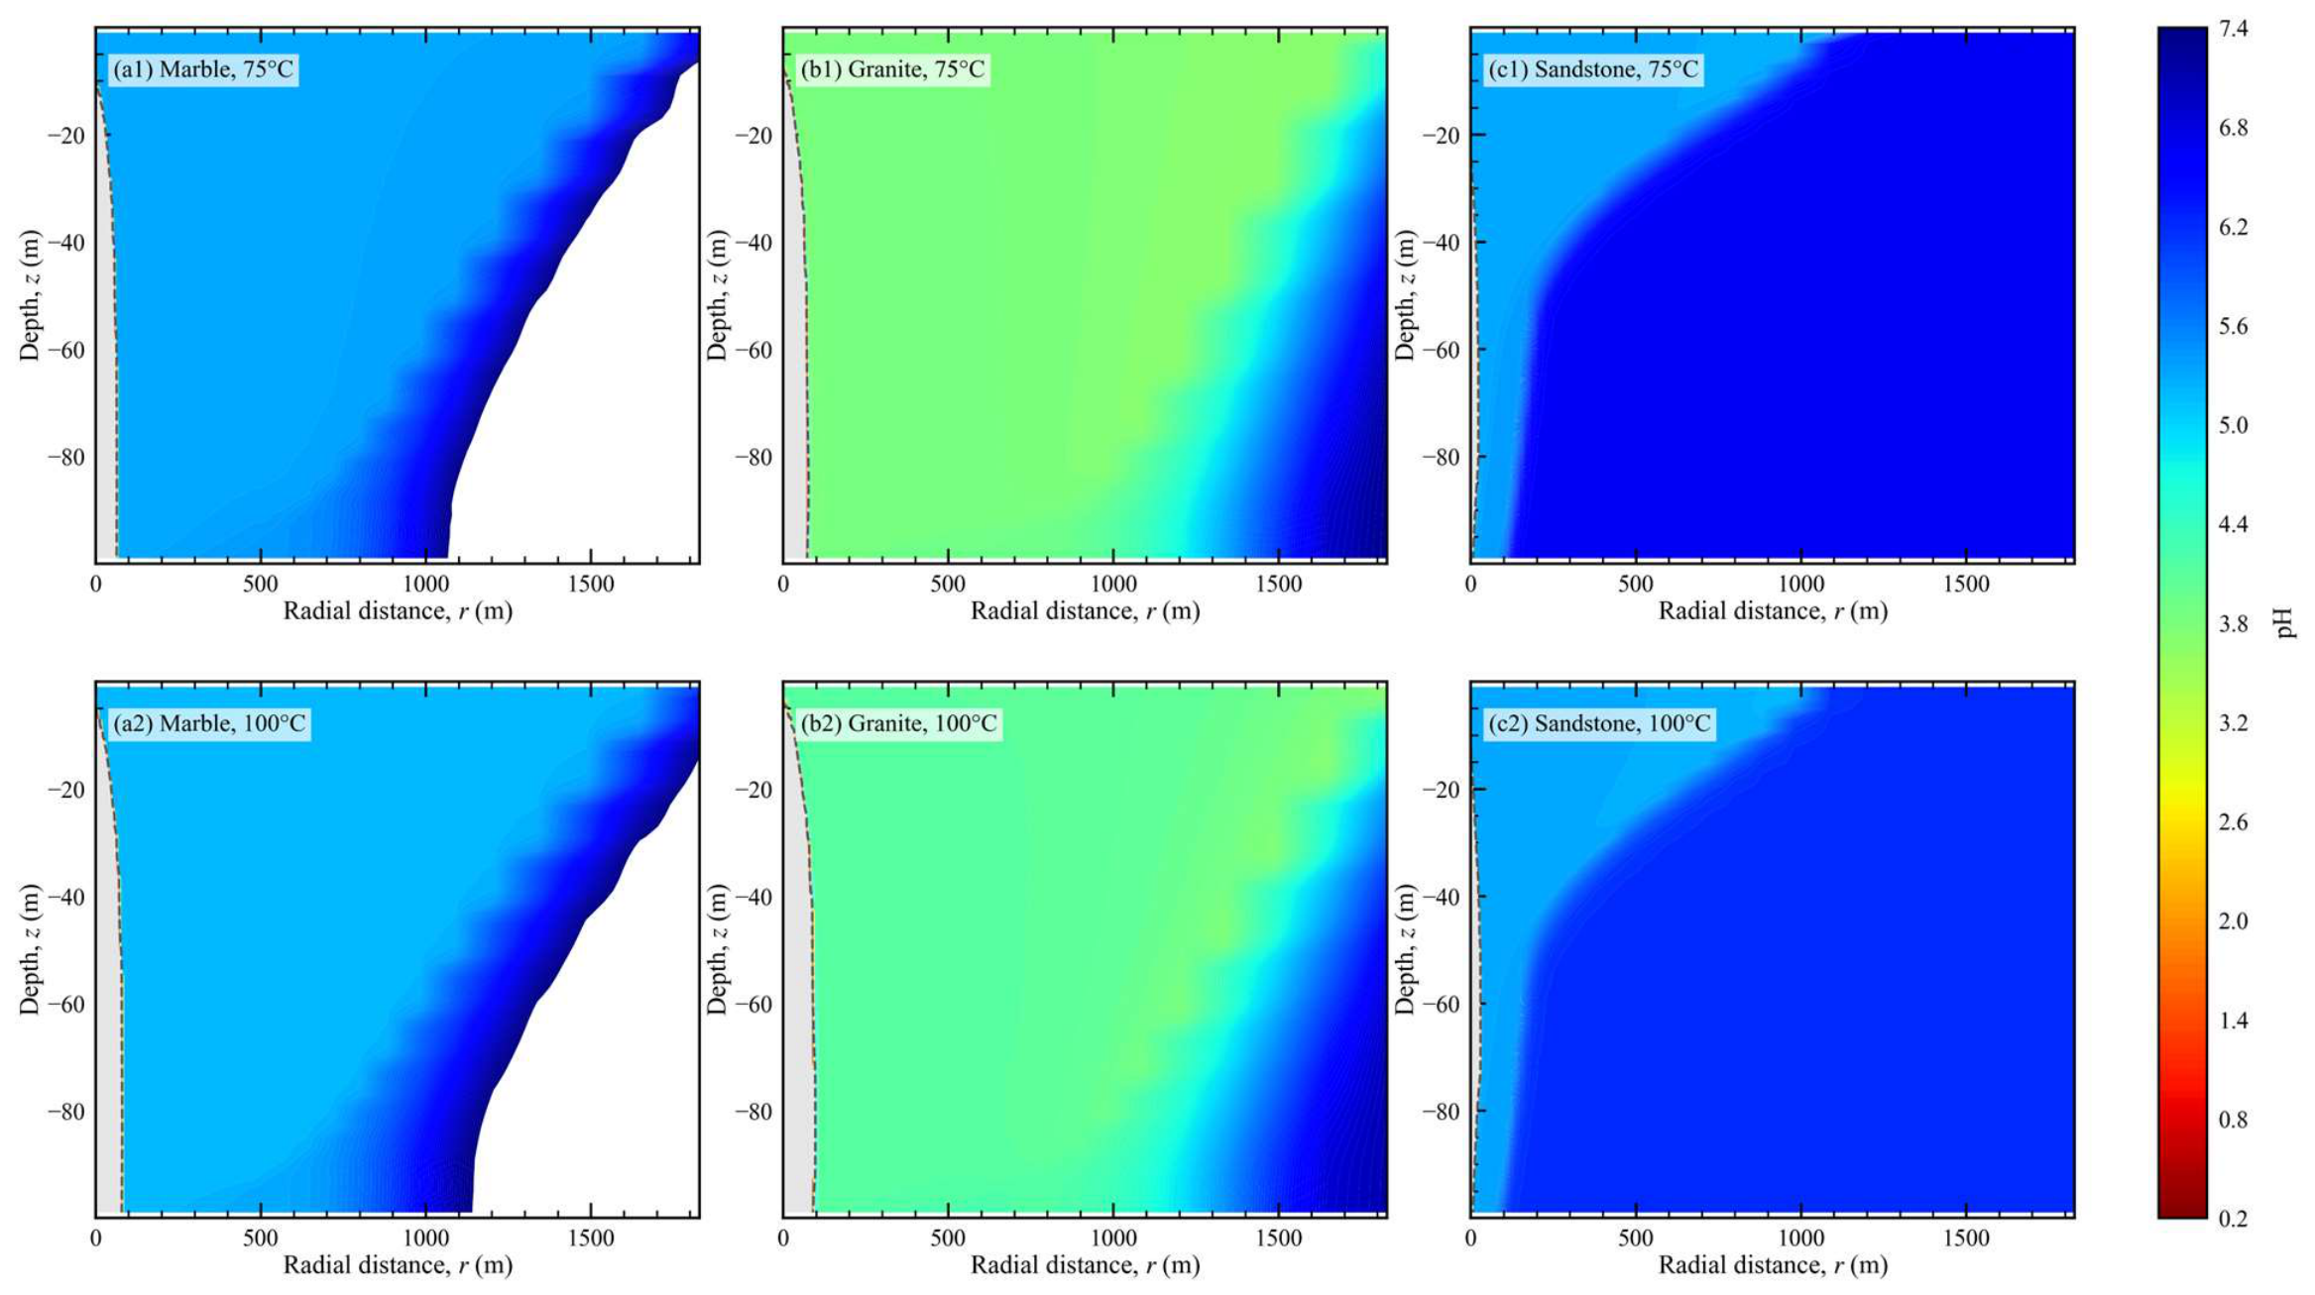
Aqueous chemistry separated buffering capacity from hydraulic performance (Figure 5). After excluding cells with Sl < 0.05, minimum pH was 5.18–5.29 in marble and 5.20–5.24 in sandstone. Granite reached lower values of 3.66–3.70. In G75, 48 of 3660 liquid-containing cells (1.31%) had pH ≤ 3.70; they occurred between r = 1.206 and 1.648 km and z = −59 to −1 m, near the outer and upper part of the 10-year gas front. In G100, only one of 3492 liquid-containing cells had pH ≤ 3.70, at r = 1.829 km and z = −1 m; 14 cells (0.40%) had pH ≤ 3.80. The reported minima therefore describe spatially restricted plume-front states rather than formation-wide acidity. Their physical magnitude remains conditional on the selected thermodynamic database, kinetic parameters, equilibrium-calcite treatment, and exclusion threshold.
Figure 5.
pH in liquid-containing regions at the end of the 10-year injection period: (a1) marble at 75 °C; (a2) marble at 100 °C; (b1) granite at 75 °C; (b2) granite at 100 °C; (c1) sandstone at 75 °C; (c2) sandstone at 100 °C. Near-well dry-out regions with Sl < 0.05 are not interpreted as valid aqueous acidification signals; pH comparisons are restricted to grid cells that retain a liquid phase.
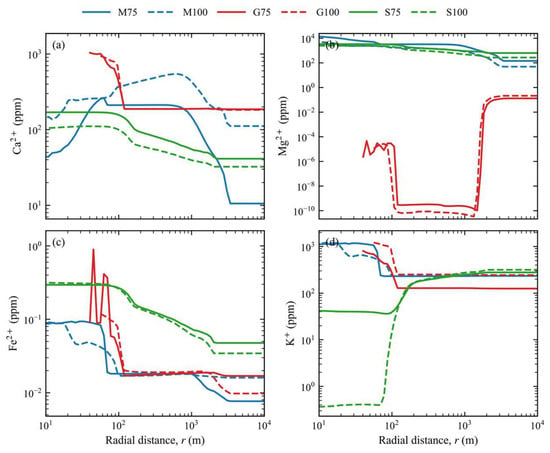
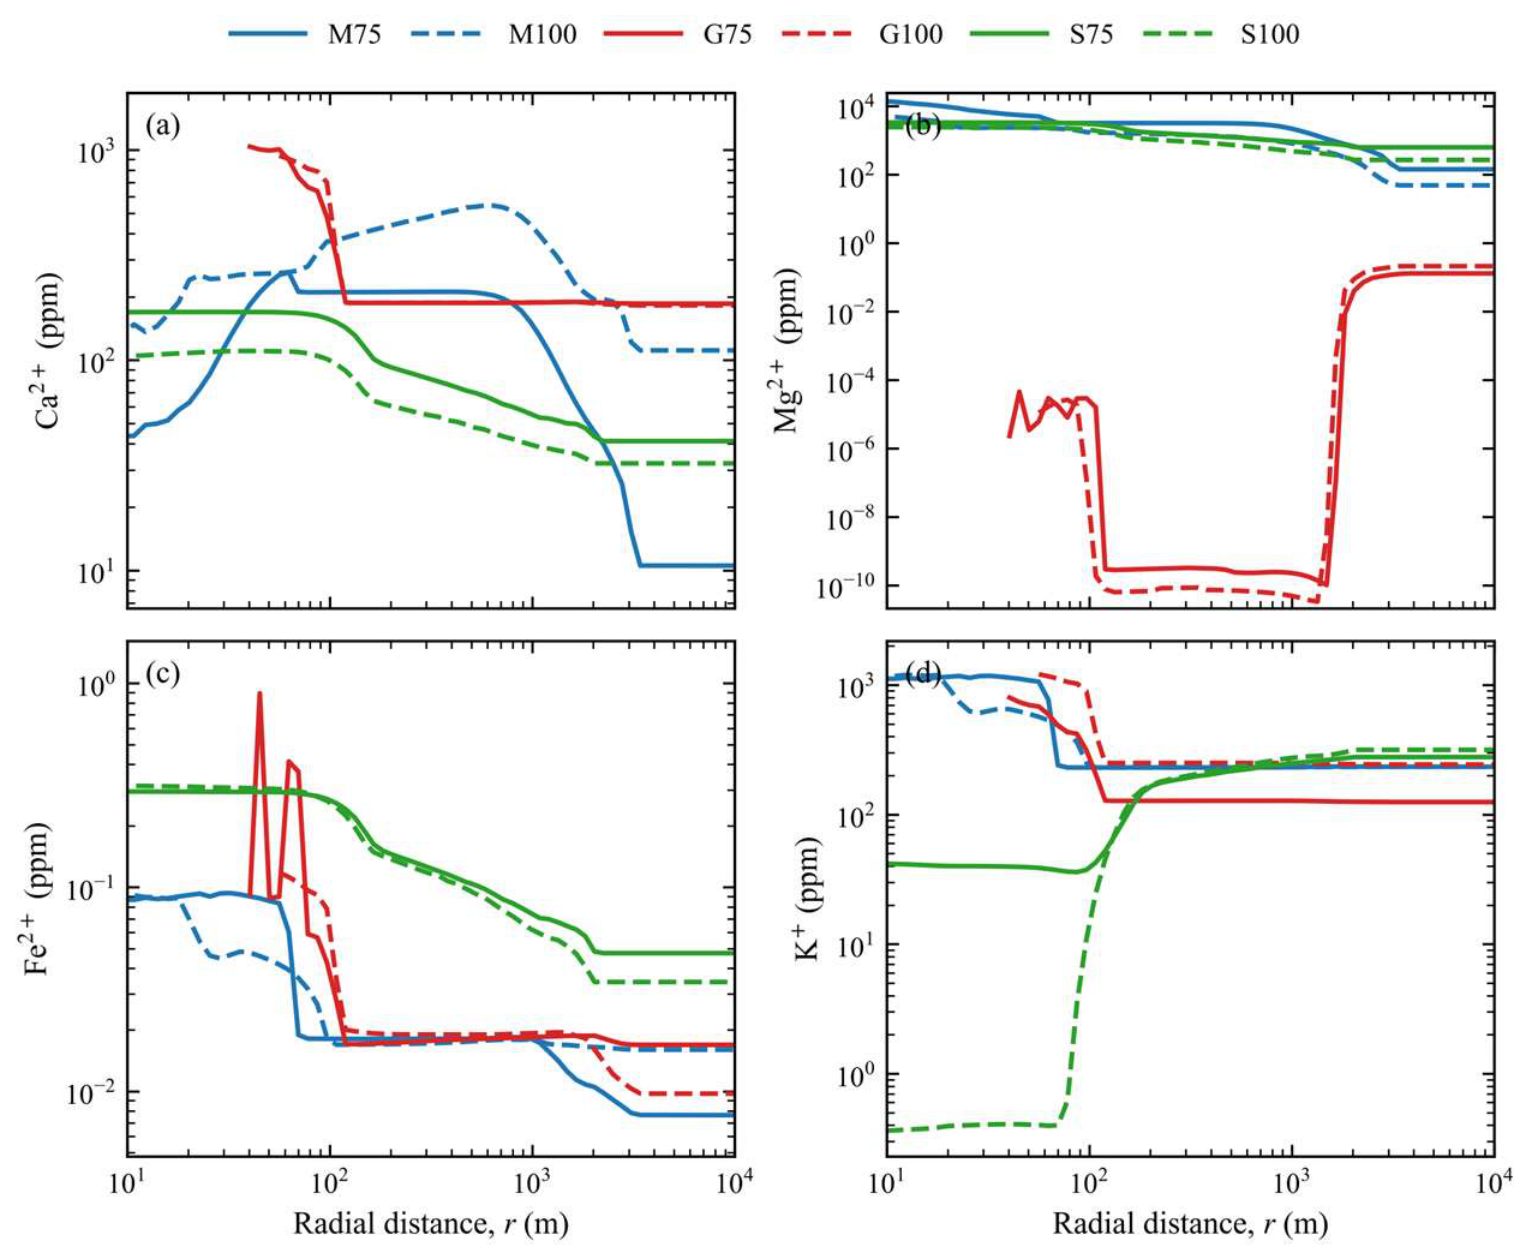
Radial cation profiles quantified the approximately 100-year aqueous response (Figure 6). In M75, Mg2+ and Ca2+ peaked at about 1.45 × 10⁴ and 3.58 × 10³ ppm, respectively. The corresponding M100 peaks were 4.96 × 10³ and 5.44 × 10² ppm. Together with dolomite dissolution and calcite reprecipitation, these values support different Ca and Mg retention within the modeled carbonate reaction path. They do not constitute saturation-index evidence because SI histories were not retained. Granite K+ peaked at about 800–1217 ppm, while Fe2+ remained at about 0.09–0.89 ppm. In sandstone, Mg2+ decreased from about 3.30 × 10³ ppm in S75 to 2.45 × 10³ ppm in S100. K+ increased from 278 to 316 ppm, while Fe2+ remained at about 0.29–0.32 ppm. Section 4.1 discusses the model-dependent mechanistic implications of these profiles.
Figure 6.
Radial aqueous-cation profiles at the approximately 100-year final state: (a) Ca2+; (b) Mg2+; (c) Fe2+; (d) K+. Blue, red, and green denote marble, granite, and sandstone, respectively; solid and dashed lines denote 75 and 100 °C, respectively. Profiles include only liquid-containing cells, and each plotted radius retains liquid in at least 80% of vertical cells.
3.3. Mineral-Reaction Pathways
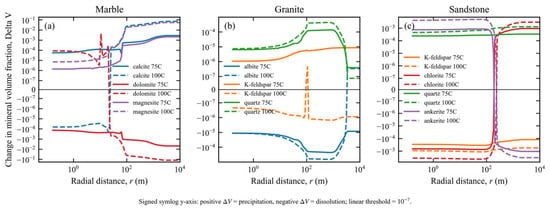
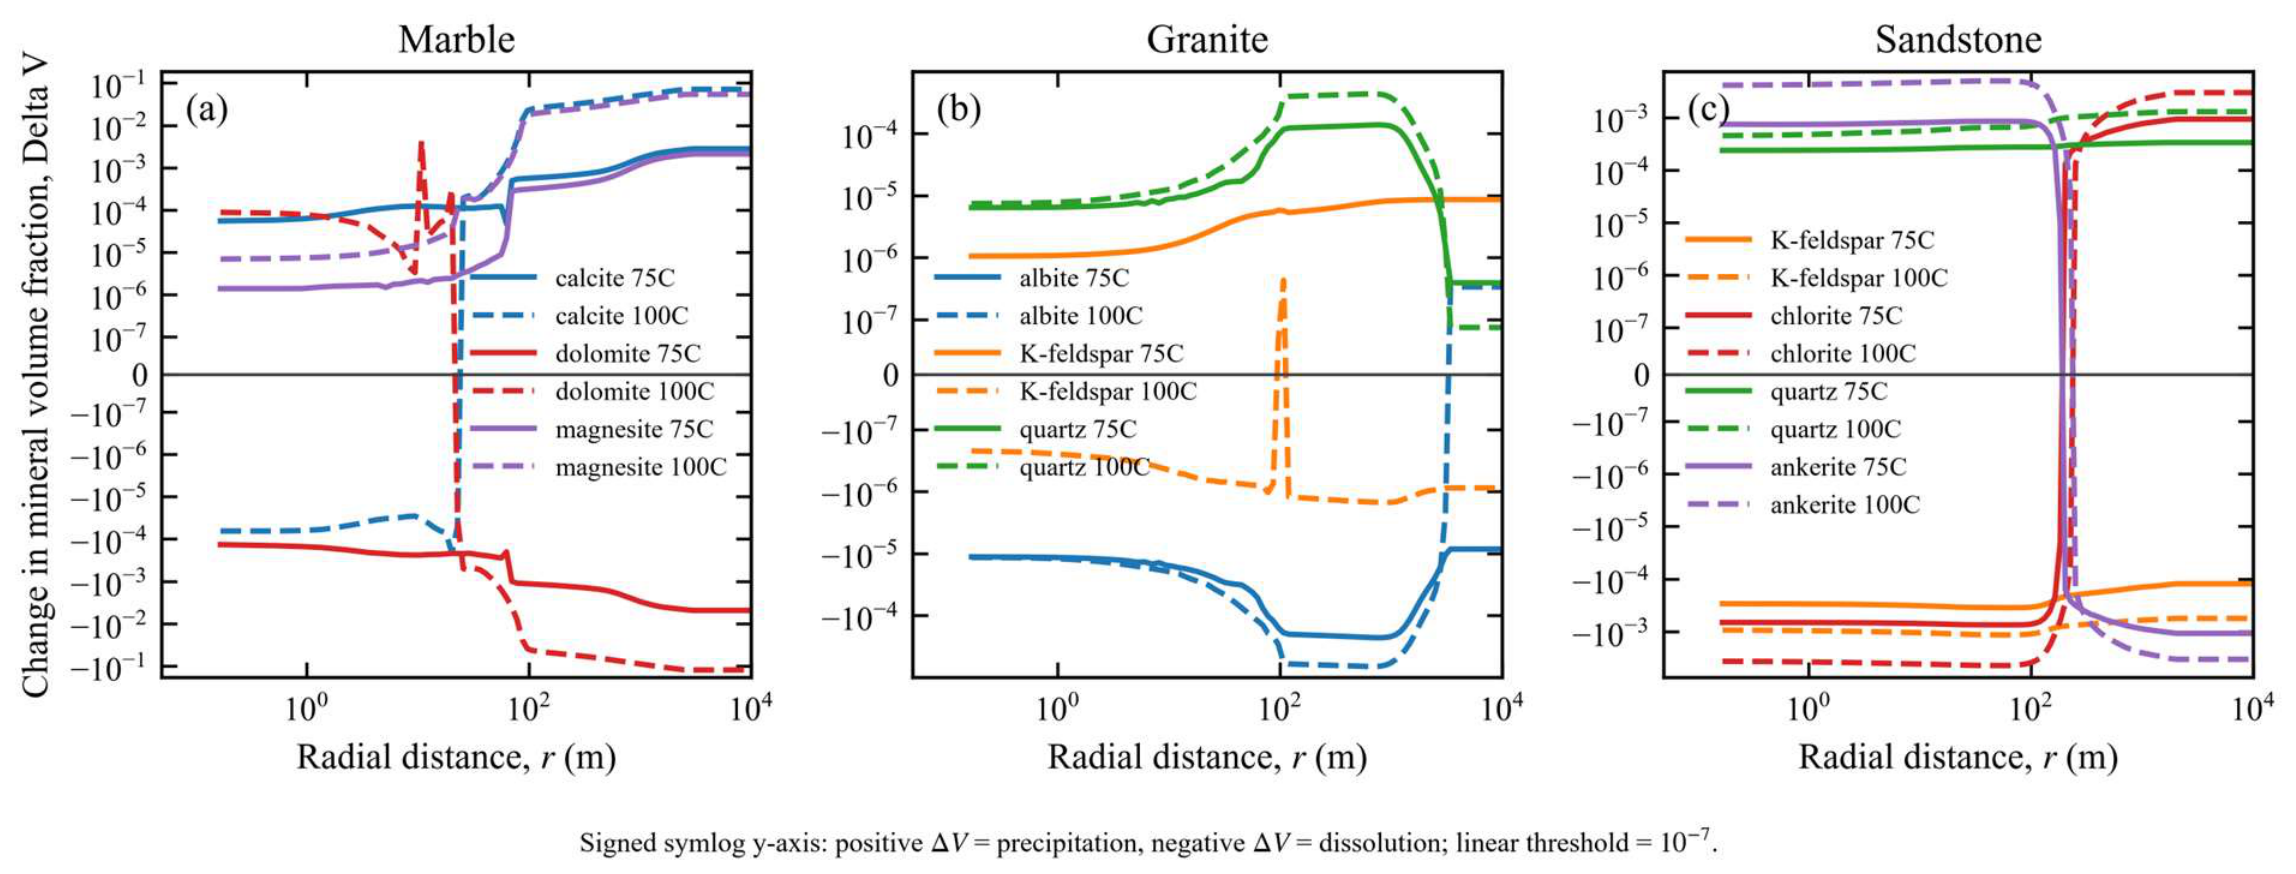
Mineral reactions remain small during injection but become clearly differentiated during the post-injection period (Figure 7). Mineral-bound CO2 is still zero within output precision at approximately 100 years, so the reported mineral-volume changes diagnose reaction pathways and spatial redistribution rather than quantify net mineral storage.
Figure 7.
Radial profiles of representative mineral-volume-fraction changes at the approximately 100-year final state: (a) marble; (b) granite; (c) sandstone. Solid and dashed lines denote 75 and 100 °C, respectively; colors identify the minerals listed in each panel legend. The vertical axis uses a signed symlog scale with a linear threshold of 10−7; positive values denote precipitation and negative values denote dissolution. The figure indicates reaction pathways and spatial redistribution rather than net mineral CO2 mass.
Carbonate redistribution was most pronounced in marble. In M75, calcite precipitation reached 2.86 × 10⁻³, dolomite dissolution reached −5.01 × 10⁻³, and magnesite precipitation reached 2.11 × 10⁻³. In M100, dolomite changes reached +2.15 × 10⁻¹ and −1.25 × 10⁻¹ in the positive and negative directions. Calcite and magnesite reached +7.17 × 10⁻² and +5.46 × 10⁻², respectively. SmCO2 remained zero, so these values quantify mineral-volume redistribution rather than net mineralized CO2.
In granite, feldspar alteration and siliceous-phase precipitation continued. At 10 years, the minimum liquid-cell pH in G75 was 3.659 and the maximum relative porosity change was 0.706%. Coarse, benchmark, and fine grids gave pH 3.64–3.66 and porosity changes of 0.618–0.713%. The half-maximum-timestep rerun reproduced the 10-year pH and porosity metrics. After injection, however, the baseline minimum pH of 0.6356 changed to 0.7423, and the approximately 100-year relative porosity extreme decreased from 18.224% to 0.171%. Both runs retained seven cells at the 1 × 10⁻³⁰ m2 permeability floor, but the porosity-extreme location changed. Albite dissolution and quartz precipitation extrema differed by less than 0.1%, whereas the dawsonite maximum decreased by 53.2%. The baseline long-term pH, porosity, dawsonite, kaolinite, and illite extrema were therefore retained only as time-step-sensitive diagnostics, not quantitative reaction predictions. Saturation-index and alternative-database tests were not performed.
Sandstone showed the clearest mineral-volume pathway involving minor Fe–Mg phases. In S75, calcite precipitation reached 1.82 × 10⁻³, ankerite precipitation reached 9.55 × 10⁻⁴, and dolomite dissolution reached −2.69 × 10⁻³. In S100, ankerite precipitation reached 5.42 × 10⁻³, dolomite change reached +3.31 × 10⁻³, and chlorite dissolution reached −4.84 × 10⁻³. SmCO2 remained zero, so these changes identify a reaction pathway rather than net mineral trapping.
Table 3 summarizes the most representative mineral reactions and porosity changes at the 100-year final state, but it does not represent net mineral CO2 mass because Sm CO2 remains zero in all cases.
Table 3.
Representative post-injection indicators at approximately 100 years. Mineral-volume changes denote reaction paths, not net mineral CO2 masses; anomalous kaolinite and illite extrema are excluded. Paired G75 rows compare baseline and half-step diagnostics (maximum steps 172,800 and 86,400 s); the latter is not a seventh benchmark. This direct comparison makes the localized sensitivity explicit; the local pH, porosity, and dawsonite extrema are not interpreted as time-step-converged.
Table 3 intentionally excludes numerically anomalous local kaolinite/illite extremes in G75 and G100 because these outputs require further diagnosis before they can be used as reliable mineral-reaction quantities.
3.4. CO2 Mass Partitioning
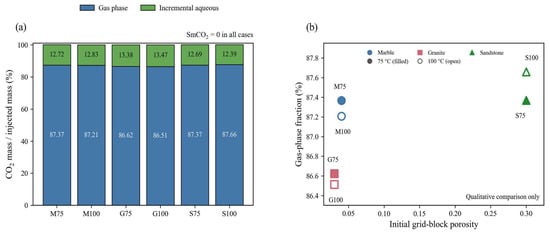
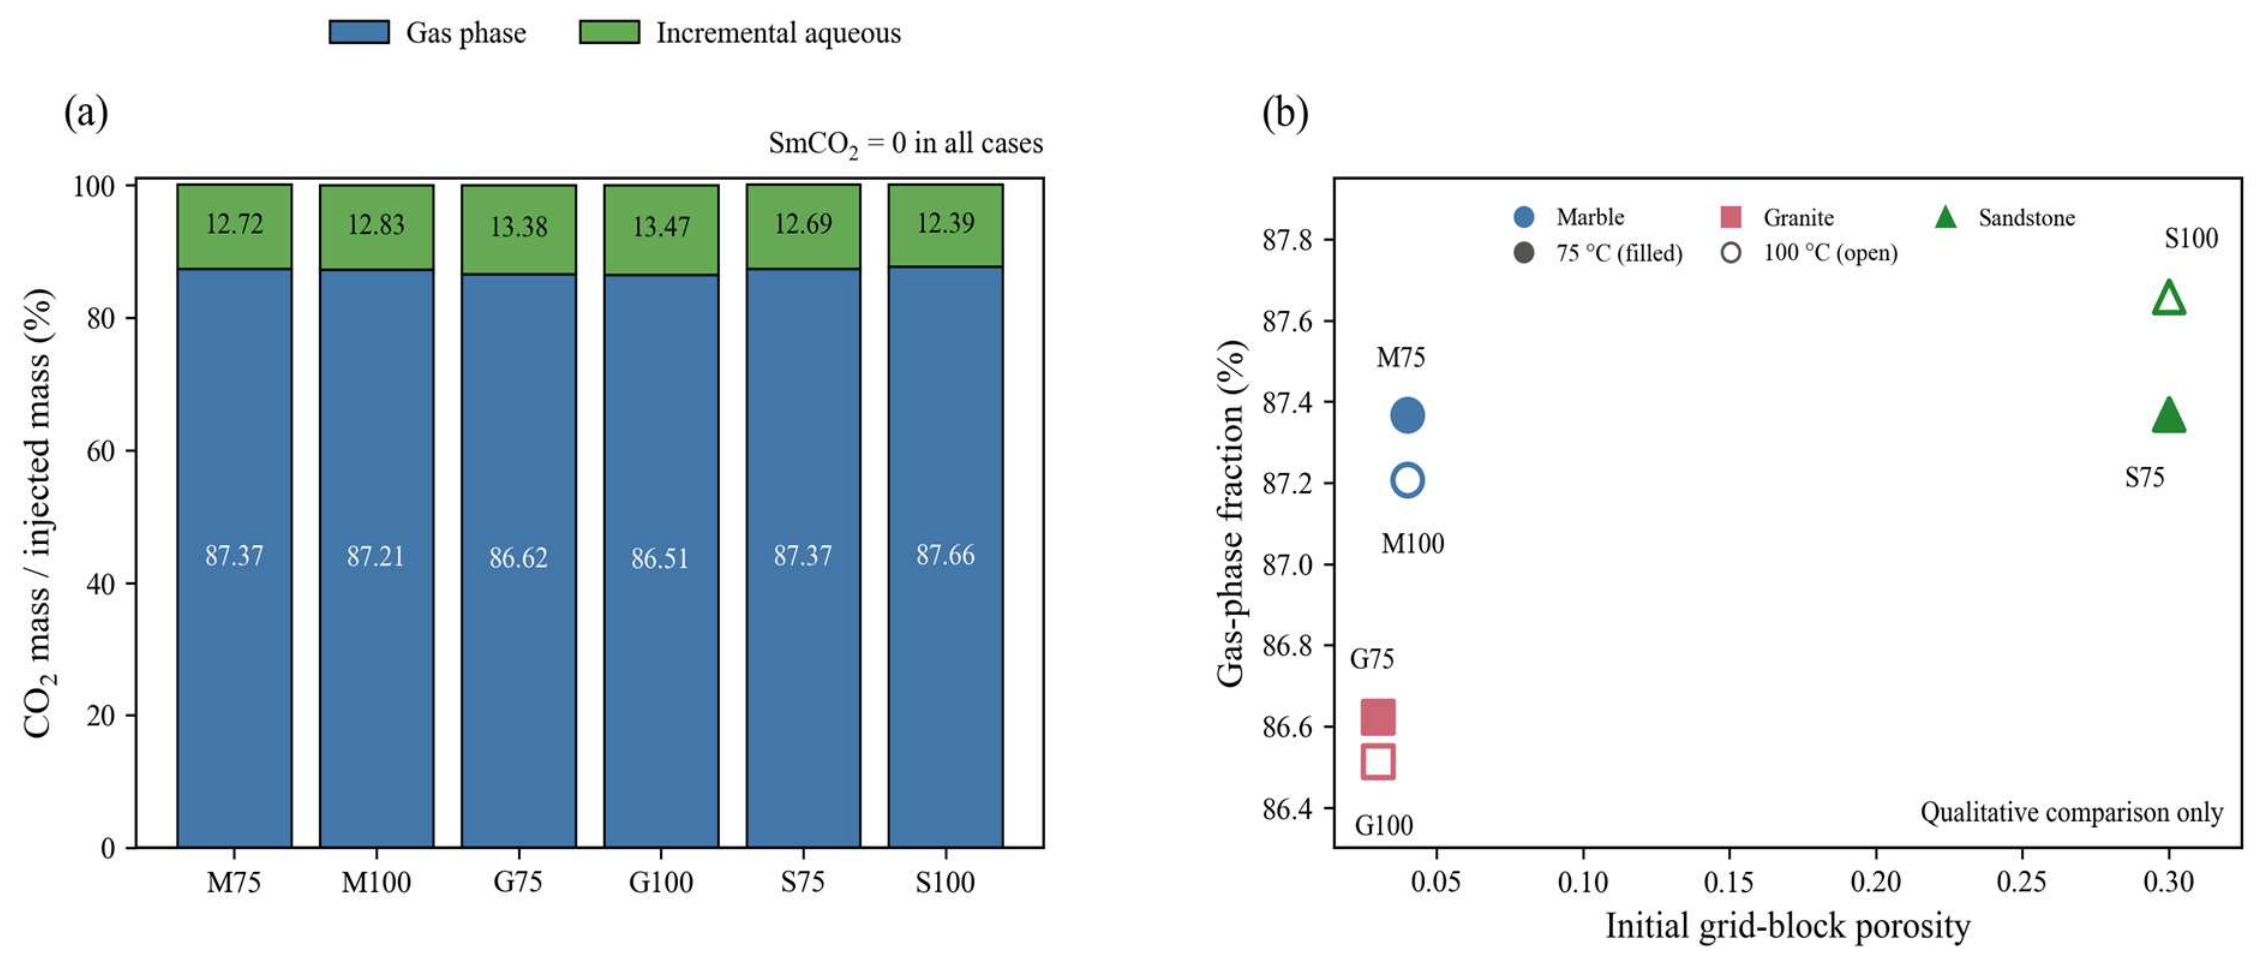
The finite-domain injection-period balance was dominated by gas-phase and incremental aqueous CO2 (Figure 8, Table 4). Across the six cases, gas-phase CO2 accounted for 86.51–87.66% of injected mass and incremental aqueous CO2 for 12.39–13.47%. SmCO2 was zero, and closure errors were 0.0025–0.0836%.
Figure 8.
Finite-domain CO2 mass partitioning at the end of the 10-year injection period. (a) Gas-phase and incremental aqueous masses are expressed as percentages of the exact modeled injected mass; SmCO2 is zero. (b) Initial porosity is the homogeneous grid-block porosity assigned to each porous-medium model; no separate fracture and matrix continua are represented. The six deterministic points show only a qualitative cross-model pattern; no regression or statistical significance is inferred.
Table 4.
Finite-domain CO2 mass partitioning at 10 years. Masses were reconstructed from cell volumes, porosity, saturation, phase density, and CO2 mass fraction after consistently excluding the 50 cells in the common outer constant-boundary column. Fractions are relative to 3.941747712 × 10⁹ kg injected CO2; SmCO2 is zero.
Within each lithology, changing from 75 to 100 °C changes the 10-year gas-phase fraction by no more than 0.29 percentage points. The case-specific closure errors are 0.0835% (M75), 0.0357% (M100), 0.0025% (G75), 0.0136% (G100), 0.0549% (S75), and 0.0495% (S100). Initial porosity does not show a monotonic relationship with gas-phase fraction across these six deterministic cases, so Figure 8b is interpreted qualitatively. At approximately 100 years, gas-phase fractions are 72.95–81.58%, and incremental aqueous fractions are 18.37–27.07%. Closure errors are 0.01–0.55%, indicating continued post-injection transfer to the aqueous phase, especially in sandstone.
It should be emphasized that SmCO2 in the 100-year solid output remains zero. Therefore, the mineral-volume-fraction changes observed in Figure 7 and Figure 9 should be interpreted as enhanced reaction pathways rather than quantified net mineral CO2 mass.
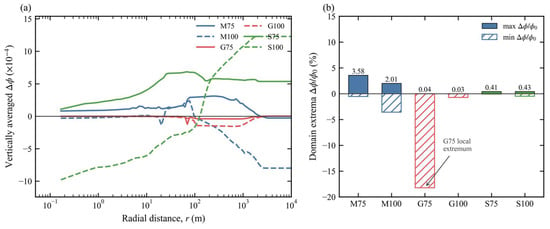
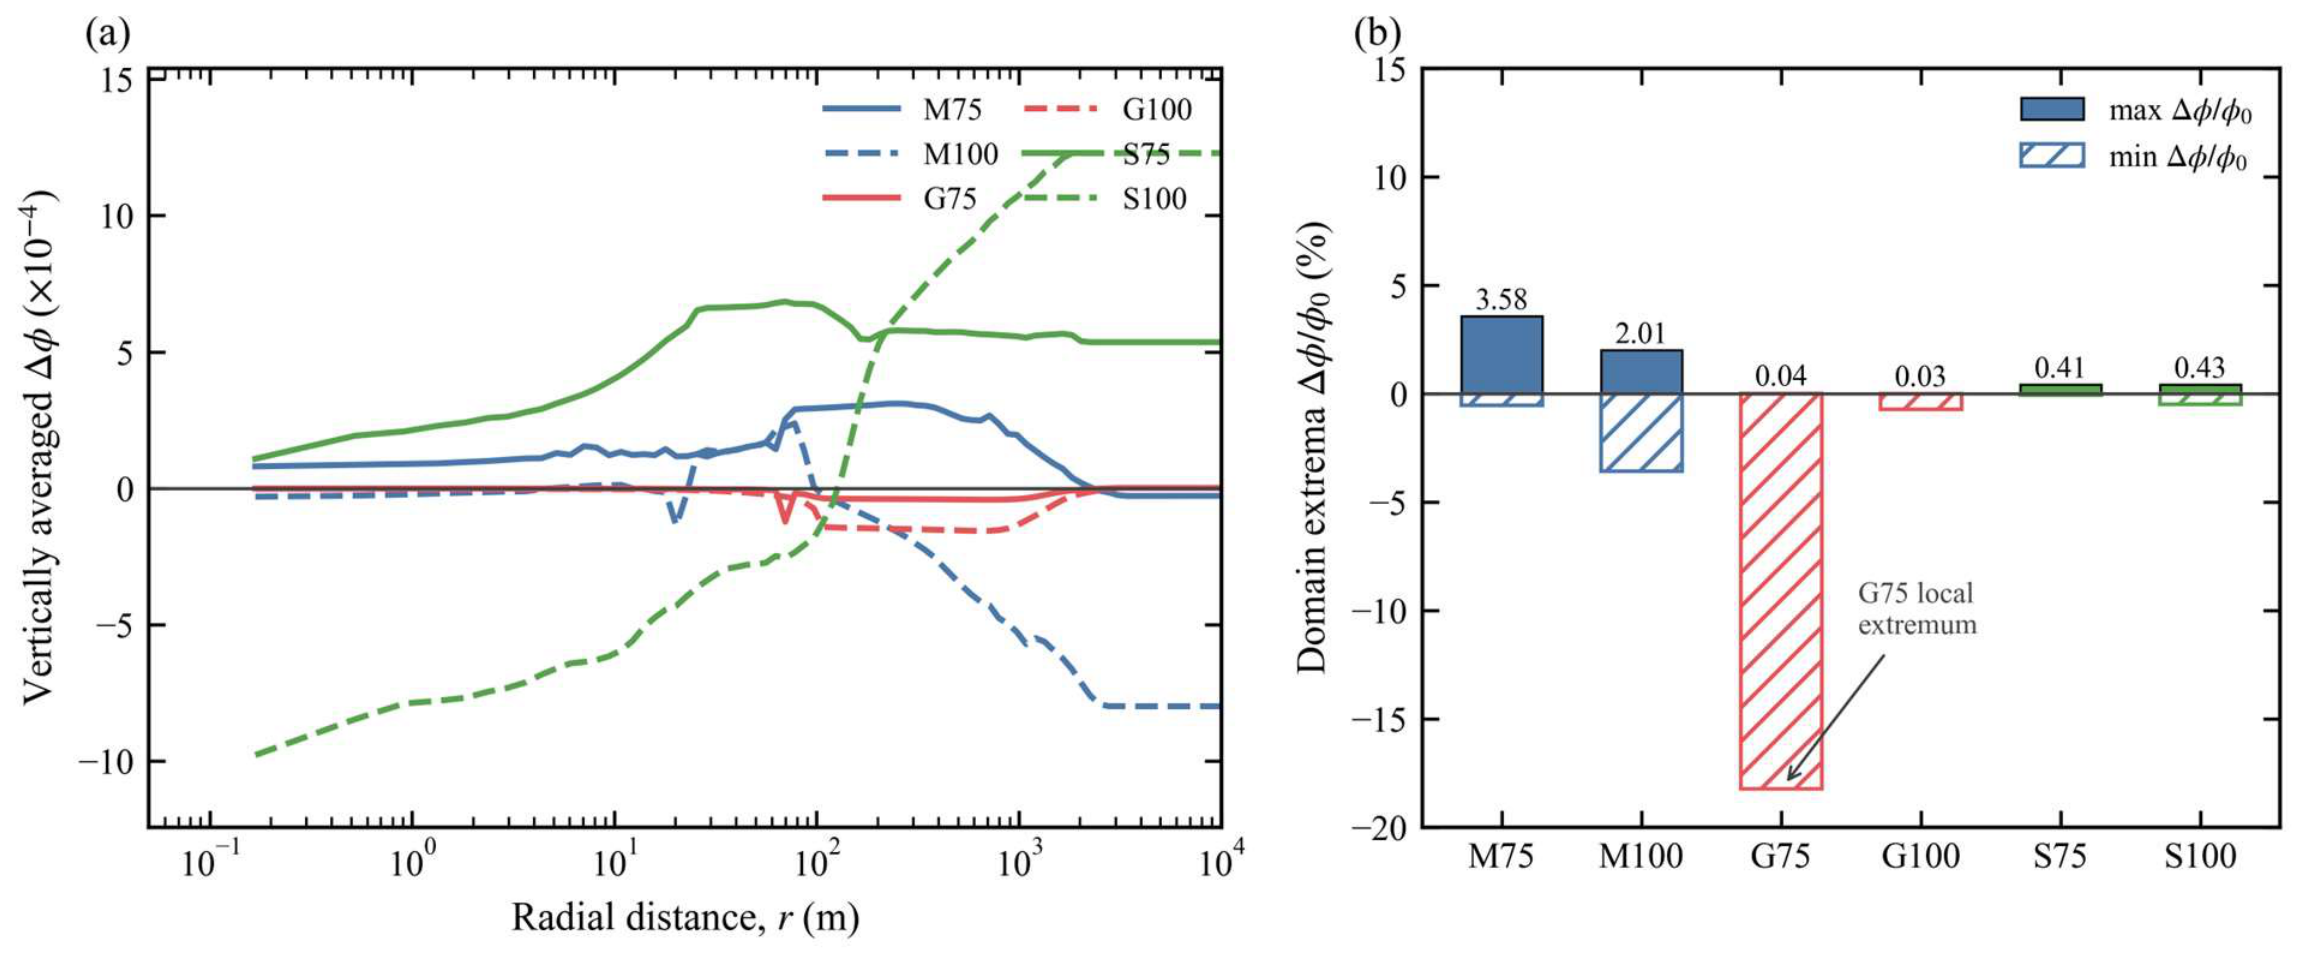
Figure 9.
Baseline-model porosity change at the approximately 100-year final state. (a) Vertically averaged absolute porosity change, Δφ, plotted in units of 10−4; blue, red, and green lines denote marble, granite, and sandstone, respectively, and solid and dashed lines denote 75 and 100 °C, respectively. (b) Domain extrema of relative porosity change, Δφ/φ0 (%); solid bars denote maxima and hatched bars denote minima, with the same lithology colors. The reported variable is the grid-block porosity of the homogeneous porous medium. The localized 18.224% G75 baseline extreme decreased to 0.171% in the half-maximum-timestep rerun and is shown only for diagnostic transparency, not as a time-step-converged regional trend.
3.5. Porosity Evolution
Figure 9 shows porosity evolution in the baseline models at the approximately 100-year final state. Marble reached maximum relative changes of about 3.58%, sandstone remained at 0.414–0.489%, and G100 reached about 0.732%. The baseline G75 value of 18.224% was a localized extreme, but it decreased to 0.171% when the maximum time step was halved. It was therefore not time-step robust and is retained in Figure 9 only to document the baseline output, not as a validated spatial trend. Stable 10-year grid results and similar finite-domain CO2 closure errors show that this sensitivity is localized rather than a domain-wide mass-balance failure.
Vertical-average profiles show that the main porosity changes in marble and sandstone remain concentrated from the near-well region to the inner plume and decay radially outward. The average positive porosity change in marble mainly reflects spatial mismatch between carbonate dissolution and reprecipitation, whereas sandstone is controlled mainly by chlorite and feldspar reactions. Overall, except for the local G75 extreme, porosity–permeability feedback remains limited over 100 years, but it can no longer be ignored completely.
3.6. Relative Storage Screening
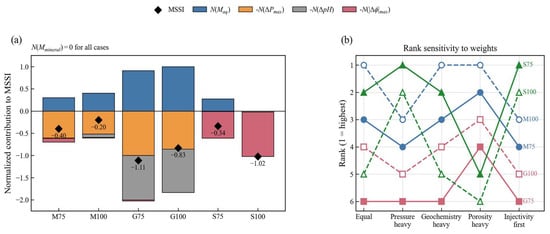
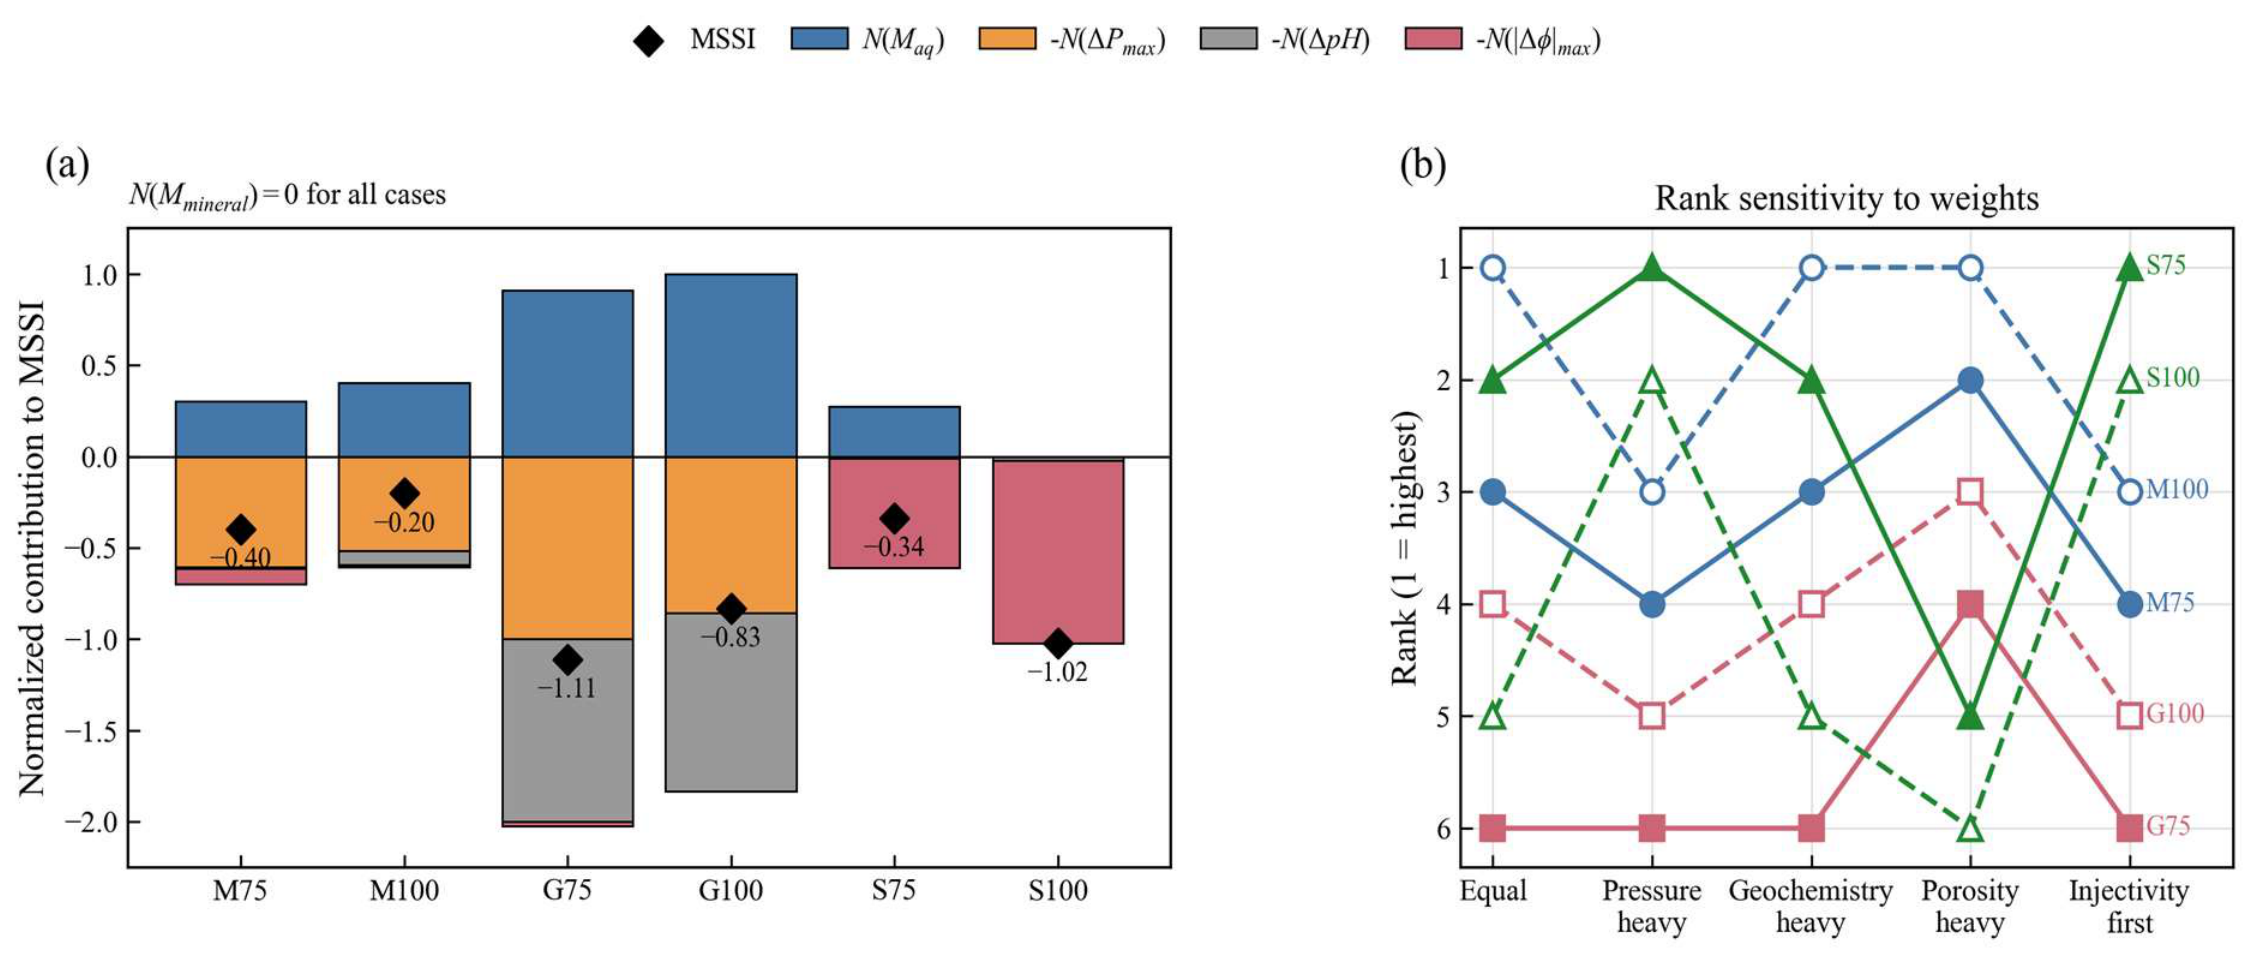
Using corrected incremental aqueous CO2 mass and ΔPmax, the equal-weight MSSI order was M100 > S75 > M75 > G100 > S100 > G75 (Figure 10). The respective scores were −0.202, −0.336, −0.398, −0.831, −1.023, and −1.113. These values have meaning only under the stated six-case min–max normalization. Because SmCO2 was zero and the weights were judgment dependent, neither the score nor its rank measured absolute storage performance, safety, or engineering suitability.
Figure 10.
Contribution and weight sensitivity of the multi-metric storage screening index (MSSI) at 10 years. (a) Equal-weight contributions from incremental aqueous CO2 mass, ΔPmax, ΔpH, and maximum absolute porosity change; SmCO2 contributes zero. (b) Rank positions under equal, pressure-heavy, geochemistry-heavy, porosity-heavy, and injectivity-first weight sets of (1, 1, 1, 1), (1, 3, 1, 1), (3, 1, 3, 1), (1, 1, 1, 3), and (1, 5, 1, 1), respectively, for the four active terms. Rank 1 is highest. MSSI is an internal comparison aid, not an engineering or regulatory decision criterion.
The normalized components were more informative than the net score. Increasing the ΔPmax penalty by factors of 3 or 5 moved S75 and S100 to the first two positions. Tripling the porosity penalty moved both sandstone cases to the bottom. Tripling the aqueous-mass and pH terms retained M100 first. These calculations used the same saved outputs and required no new simulation. The stable component-level result was that sandstone minimized pressure penalty, marble provided the clearest carbonate buffering, and granite combined the largest pressure and acidification penalties. MSSI was therefore used to expose trade-offs, not to select a universally superior lithology.
3.7. Sensitivity and Grid-Convergence Analysis
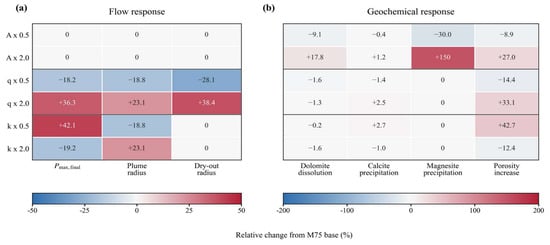
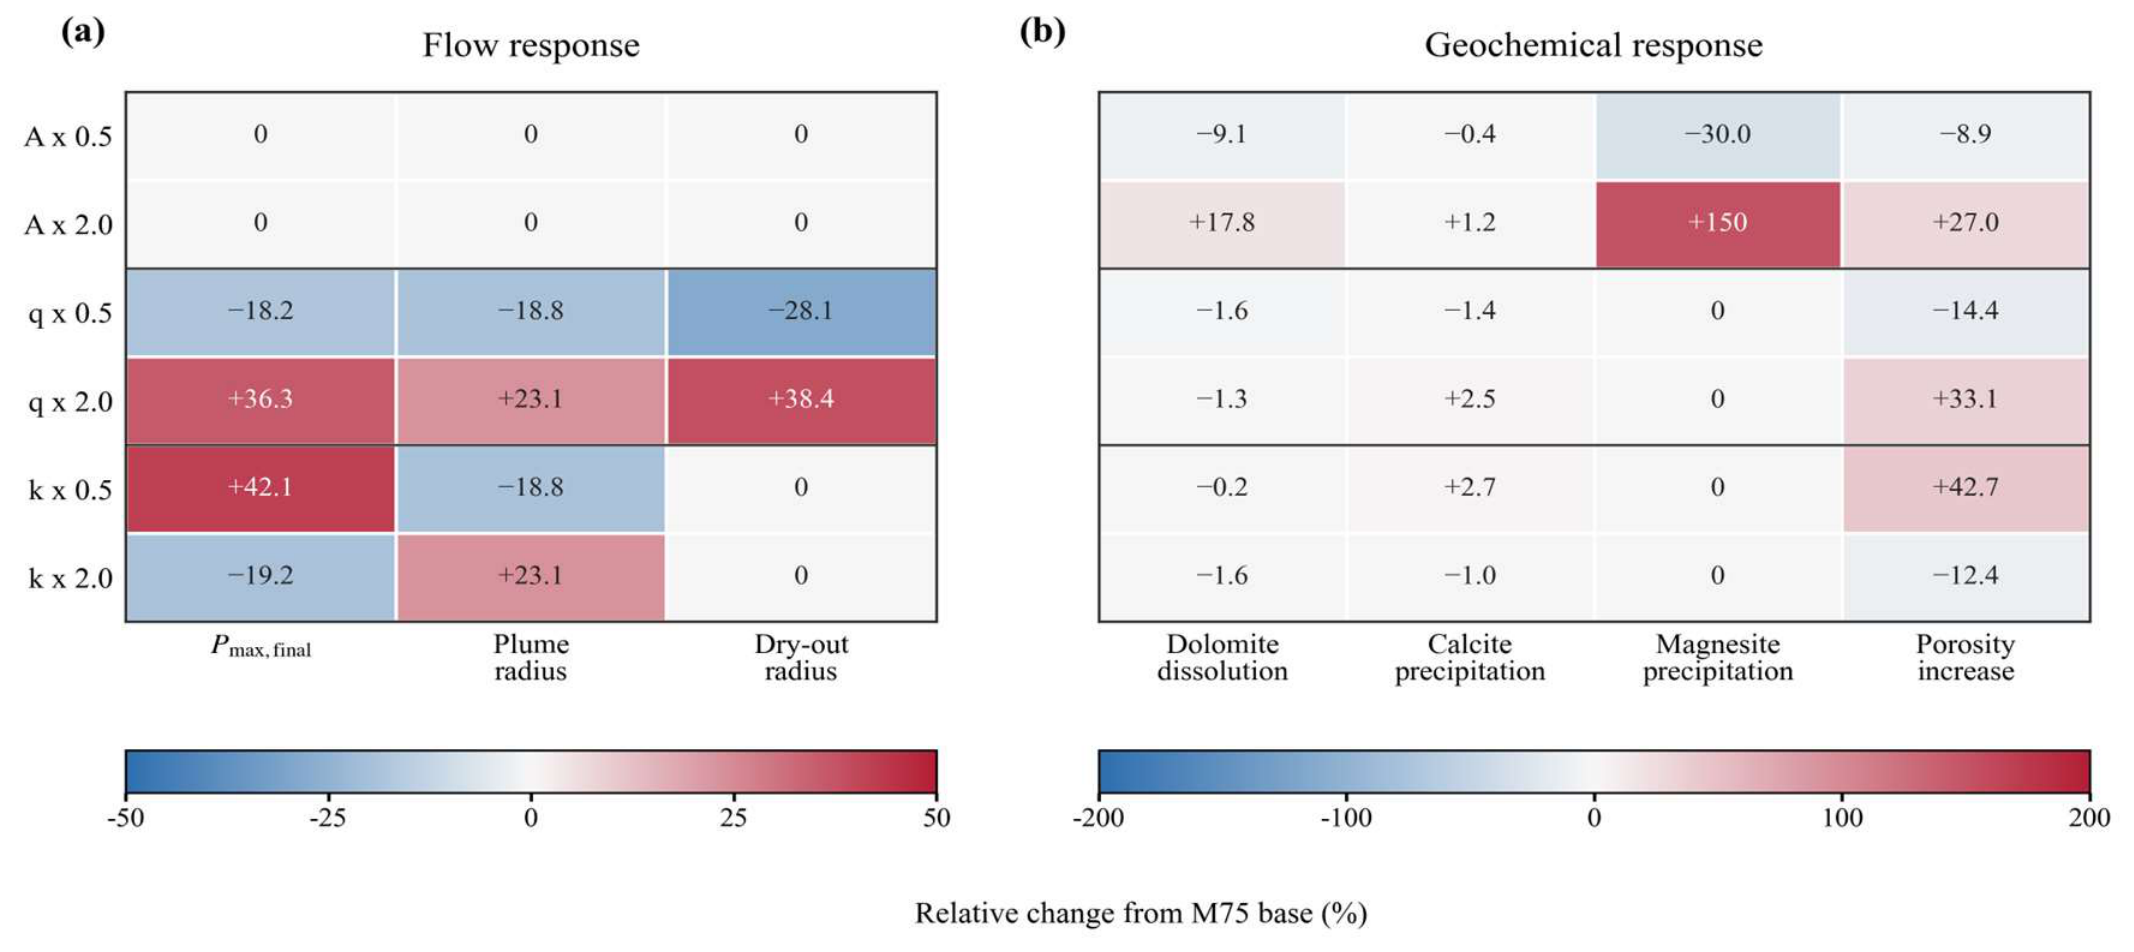
The M75 sensitivity cases separate directly perturbed hydraulic and geochemical controls from the coupled benchmark contrasts (Figure 11, Table 5). Changing reactive surface area by a factor of two alters final pressure by at most 0.1% and leaves plume and dry-out radii unchanged. Within the tested 0.5–2.0 range, injection rate has the strongest hydraulic effect: halving q lowers final pressure by 18.2% and plume radius by 18.8%, whereas doubling q raises them by 36.3% and 23.1%, respectively. This is a local hierarchy around M75, not a global parameter-importance ranking.
Figure 11.
One-factor sensitivity of the 75 °C marble model to reactive surface area, CO2 injection rate, and permeability at the end of the 10-year injection period. Values are percentage changes from the M75 benchmark. (a) Flow responses in final pressure, plume radius, and dry-out radius. (b) Geochemical responses in carbonate mineral-volume changes and maximum porosity increase. Only A, q, and k were directly perturbed; the figure is not a global uncertainty analysis. Permeability perturbations show the expected pressure-plume trade-off. Reducing k to 0.5 × increases Pmax,final to 353.5 bar (+42.1%) and reduces plume radius to 1338 m (−18.8%). Increasing k to 2 × reduces Pmax,final to 201.0 bar (−19.2%) and increases plume radius to 2029 m (+23.1%). This response indicates that low permeability substantially increases injection pressure and constrains radial CO2 expansion, whereas high permeability improves pressure dissipation but expands the plume footprint.
Table 5.
One-factor sensitivity results for the 75 °C marble model at the end of the 10-year injection period.
The solid output indicates that reactive surface area primarily changes the magnitude of carbonate reactions in marble. A × 0.5 reduces the dolomite dissolution magnitude, magnesite precipitation, and maximum porosity increase by 9.1%, 30.0%, and 8.9%, respectively; A × 2 increases them by 17.8%, 150.4%, and 27.0%, respectively. Calcite precipitation is insensitive to A perturbation, with changes of only about −0.4% to +1.2%, suggesting that calcite reprecipitation during the 10-year injection period is already strongly limited by local carbonate equilibrium and Ca supply. By contrast, injection-rate and permeability perturbations have smaller effects on peak carbonate mineral-volume changes, but they alter the affected area and near-well dry-out intensity, thereby changing the maximum porosity increase. In particular, k × 0.5 increases the maximum porosity increase by 42.7%, whereas k × 2 decreases it by 12.4%.
The dolomite dissolution magnitude is |min(ΔVdolomite-2)|, and calcite and magnesite precipitation are reported as max(ΔV). Mineral-volume-fraction changes are dimensionless. Permeability multipliers were checked against Permx in the solid output; M75_k05 corresponds to k × 0.5 and M75_k2 corresponds to k × 2.
Grid-Convergence Results:Grid-sensitivity results (Table 6) show that the coarse grid underestimates maximum pressure in the low-porosity marble and granite models by −5.00% and −6.81%, respectively, relative to the fine grid; it is therefore not suitable as the final benchmark grid. The pressure difference between the benchmark and fine grids is much smaller: Pmax differs by −0.42%, −0.51%, and −0.05% for marble, granite, and sandstone, respectively. Minimum pH in liquid-containing cells varies by only 0.01–0.02 pH units, and max|Δφ|/φ0 differs by 2.19%, −0.97%, and 1.52%, respectively.
Table 6.
Grid-sensitivity results for the three 75 °C lithological models at the end of the 10-year injection period.
The apparent grid sensitivity of plume radius and dry-out radius is somewhat higher because the front position is defined here as the outermost radial cell center satisfying Sg > 0.01 or Sl < 0.05; movement of the front between adjacent radial cells can therefore be amplified into a several percent difference in radius. Even so, the benchmark grid differs from the fine grid by less than approximately 6% in plume radius and less than approximately 7.4% in dry-out radius. The dominant directions of mineral change remain consistent across grids: dolomite dissolution in marble, albite dissolution in granite, and dolomite dissolution in sandstone. Therefore, the 100 × 50 benchmark grid robustly supports the pressure ranking, pH-buffering differences, and main reaction-path interpretations. For front-threshold radii and local mineral extremes, however, it is more rigorous to describe the grid sensitivity as limited rather than to claim absolute grid independence.
The G75 time-step test further separated injection-period robustness from long-term local sensitivity. Halving the maximum step changed the 10-year Pmax from 306.4481 to 306.4444 bar, left plume and dry-out radii unchanged, reproduced the minimum pH of 3.6593, and changed max|Δφ|/φ0 from 0.70590% to 0.70589%. At approximately 100 years, the plume radius remained 3077 m and the CO2 closure error changed only from 0.1144% to 0.1154%, but minimum pH changed from 0.6356 to 0.7423 and max|Δφ|/φ0 from 18.224% to 0.171%. Albite dissolution and quartz precipitation extrema differed by less than 0.1%, whereas the dawsonite maximum decreased by 53.2%. Thus, the benchmark supports the injection-period pressure, pH-buffering, plume, phase-partition, and primary feldspar-silica pathway interpretations, but not the quantitative long-term G75 local extrema.
4. Discussion
4.1. Lithology-Dependent Injectivity and Geochemical Pathways
Taken together, the benchmark cases do not identify a universally superior lithology. Instead, they define an injectivity-reaction trade-off: sandstone is hydraulically favorable, marble is strongly buffered and reaction prone, and granite combines weak injectivity with slow silicate-controlled stabilization. This distinction is more useful for screening than ranking rocks by mineral abundance alone. This lithology-dependent response is consistent with comparative CO2-exposure studies of limestone and sandstone [23].
Marble illustrates the difference between reaction intensity and net trapping. The cation profiles and mineral outputs are consistent with dolomite releasing both Mg and Ca, followed by preferential Ca removal through equilibrium calcite reprecipitation. More persistent Mg enrichment is consistent with kinetically limited magnesite precipitation. This explanation remains model dependent because saturation-index histories were not retained. SmCO2 remained zero, so the mineral-volume changes cannot be converted into a net mineralized CO2 mass. Marble is therefore a strongly buffered, carbonate-redistributing end member rather than a demonstrably high-mineralization reservoir [7,8]. Granite occupies the least favorable injection-period end of the comparison. It develops the highest overpressure and strongest acidification, while feldspar alteration and quartz precipitation proceed too slowly to provide substantial stabilization during injection. The 100-year appearance of dawsonite and continued albite dissolution shows that aluminosilicate–carbonate coupling is possible, but only on a longer timescale.
The granite results require the greatest caution. G75 was grid stable and time step-stable during injection, but its post-injection local extrema were not. Halving the maximum time step reduced the approximately 100-year porosity extreme from 18.224% to 0.171%, changed the minimum liquid-cell pH from 0.6356 to 0.7423, and reduced the dawsonite maximum by 53.2%. In contrast, plume radius, phase partitioning, finite-domain CO2 closure, albite dissolution, and quartz precipitation remained similar. The original extreme was therefore not caused by a domain-wide CO2 imbalance, but it also cannot be treated as a converged local reaction state. Long-term G75 pH, porosity, dawsonite, and clay extrema are excluded from quantitative interpretation pending saturation-index, element-balance, and thermodynamic-database checks.
Sandstone represents the hydraulically favorable side of the comparison. Its larger pore volume and higher permeability minimize overpressure and keep the 10-year plume relatively compact. Finite-domain inventories give gas-phase fractions of 87.37% for S75 and 87.66% for S100. These values are not consistently greater than those of marble or granite at the end of injection. Sandstone’s advantage is therefore injectivity, not demonstrably stronger dissolution or mineral trapping. Sandstone’s longer-term reaction pathway is controlled by minor rather than dominant minerals. Chlorite dissolution and ankerite precipitation intensify in S100, while aqueous Fe2+ remains below 1 ppm. This response is consistent with experimental and natural-analogue studies showing that clays, cements, feldspars, and Fe–Mg carbonates can govern alteration in quartz-rich reservoirs [11,12]. The result is a plausible stabilization pathway, not evidence of substantial mineral trapping within the simulated century.
4.2. Temperature Effects on Flow and Reaction Pathways
Increasing temperature from 75 to 100 °C produces two competing effects. First, CO2 solubility in brine decreases, potentially weakening acidification and reducing dissolved CO2 mass. Second, mineral reaction rates increase through Arrhenius kinetics, potentially enhancing feldspar, chlorite, and carbonate reactions. These effects act in different directions, so the temperature response cannot be summarized simply as stronger mineralization at higher temperature.
The approximately 100-year results show that temperature effects are mineral specific. Carbonate redistribution is stronger in M100 than M75; ankerite precipitation and chlorite dissolution are more pronounced in S100 than S75; and G100 shows stronger albite dissolution and quartz precipitation. At 10 years, paired temperature cases differ in gas-phase fraction by no more than 0.29 percentage points. However, the 75 and 100 °C models also differ in initial top pressure. Therefore, temperature effects on flow cannot be isolated from paired baseline results alone, and injectivity comparisons are based on ΔPmax rather than absolute pressure.
4.3. Time-Dependent Storage and Reaction Pathways
The most important cross-lithology result is that SmCO2 was zero after 10 years and remained zero after the approximately 100-year extension. During injection, the finite-domain inventory was controlled by gas-phase and aqueous CO2. After injection stopped, the gas fraction declined and the incremental aqueous fraction increased, while mineral-volume changes identified possible reaction pathways. These changes did not constitute a quantified net mineral CO2 mass. Because gas-phase CO2 still accounted for 86.51–87.66% at 10 years, storage security remained dependent on caprock integrity, plume containment, pressure management, dissolution, and later immobilization. The benchmark did not assess leakage probability or establish long-term storage security. Injection performance and post-injection evolution were therefore reported on separate time scales.
This separation of timescales is consistent with reactive-transport literature. During injection, pressure, relative permeability, capillary trapping, and dissolution dominate [22,24]. Afterward, the acidification front migrates, plume mobility decreases, and released cations react progressively with dissolved inorganic carbon. Mineral assemblage therefore becomes more important over decades to centuries. Long-term geothermal-reservoir simulations likewise show that mineral alteration, porosity-permeability feedback, and fluid chemistry require extended timescales to develop [25]. The present approximately 100-year outputs show stronger reaction pathways but do not establish substantial net mineral storage. The benchmark compares injection-period performance and identifies post-injection reaction pathways; it does not estimate final mineral-storage capacity. Field-scale basalt projects have demonstrated rapid mineralization under favorable conditions [26,27]. Reviews identify mineral carbonation as strongly dependent on mineralogy and fluid-rock interaction [28]. Deccan basalt simulations further show that reservoir conditions and injection strategy govern mineral trapping [29].
4.4. Implications for CCUS Geoenergy Reservoir Screening
CCUS reservoir screening cannot be reduced to injectivity or reactivity alone. Sandstone offers the strongest pressure management without a consistently higher dissolved fraction at 10 years. Marble offers strong buffering and carbonate redistribution without quantified net mineral storage. Granite requires the largest pressure allowance and the most cautious interpretation of local long-term extrema. Candidate reservoirs should therefore be evaluated using ΔPmax, plume footprint, finite-domain phase partitioning, aqueous buffering, and reaction-path indicators.
The sensitivity evidence provides a bounded hierarchy for screening and scenario design. Within the two-sided M75 perturbations, injection rate is the first-order hydraulic lever, permeability governs the pressure-plume trade-off, and reactive surface area mainly changes carbonate-reaction magnitude and porosity feedback. These tests do not establish global parameter importance or isolate porosity, temperature, or initial pressure because those variables were not independently perturbed. Across the six benchmarks, lithology packages mineralogy, porosity, permeability, and equilibrated brine chemistry, while temperature is paired with a different initial pressure. Field-scale assessment should therefore combine pressure management, plume containment, pore-volume utilization, and reaction-path indicators with site-specific uncertainty analysis rather than use mineral abundance or the present local sensitivity ranking as a decision rule. These implications remain benchmark scale rather than site specific. Radial symmetry and homogeneous properties permit a controlled and computationally efficient comparison. However, they cannot reproduce asymmetric plume spreading, three-dimensional gravity segregation, heterogeneous permeability, faults, caprock architecture, wellbore constraints, or geomechanical feedback. The one-factor tests are local perturbations around M75 rather than a global uncertainty analysis. Field application therefore requires site-specific heterogeneity, structural boundaries, coupled geomechanics, and calibrated flow and geochemical parameters [30].
4.5. Limitations
This benchmark study has several limitations. First, approximately 100 years is shorter than the time required for many mineral-storage assessments, and SmCO2 remains zero; mineral-volume changes are reaction-path indicators only. Second, the dedicated G75 half-maximum-timestep rerun reproduced the 10-year metrics but showed that the post-injection local pH, porosity, and dawsonite extrema were not time-step robust. Saturation-index analysis, element mass balance, and alternative thermodynamic-database tests were not performed, so those long-term extrema are excluded from quantitative interpretation. Third, calcite equilibrium may overstate rapid local carbonate re-equilibration relative to a finite-rate formulation. Fourth, the homogeneous radial model omits heterogeneity, faults, caprock reactions, wellbore integrity, asymmetric gravity-driven migration, and geomechanics. Fifth, 75 and 100 °C cases also differ in initial pressure, so paired temperature results do not isolate temperature alone. Sixth, MSSI uses six-case min–max normalization and subjective weights; its rank is scenario dependent. These limitations bound the manuscript’s conclusions to comparative screening rather than site prediction.
5. Conclusions
- A unified TOUGHREACT/ECO2N benchmark demonstrates that lithology redistributes performance among injectivity, phase partitioning, and post-injection reaction pathways rather than producing a single best reservoir type. At the end of the prescribed 10-year injection period, the finite-domain balance placed 86.51–87.66% of injected CO2 in the gas phase. Incremental aqueous CO2 accounted for 12.39–13.47%. Closure errors were 0.0025–0.0836%, and SmCO2 was zero.
- Sandstone provides the best injectivity, with only 10.7–12.0 bar of overpressure, without a consistently higher gas-phase or dissolved fraction at 10 years. Marble provides strong aqueous buffering and carbonate redistribution without quantified net mineral storage. Granite develops the largest pressure and acidification penalties, and its feldspar-quartz-dawsonite pathway emerges mainly during post-injection evolution.
- The 10-year state measured injection performance, whereas 50- and 100-year outputs described post-injection redistribution and reaction evolution. Marble showed strong carbonate buffering, granite showed slower aluminosilicate pathways, and sandstone showed chlorite–ankerite reactions. The G75 half-maximum-timestep test reproduced the injection-period metrics but not the quantitative long-term local pH, porosity, or dawsonite extrema. None of the mineral-volume changes demonstrated net mineral trapping because SmCO2 remained zero.
- Existing sensitivity and grid tests supported component-level screening. Injection rate was the primary hydraulic control, permeability governed the pressure-plume trade-off, and reactive surface area controlled reaction magnitude. Benchmark-grid pressures differed from fine-grid values by less than 0.6%. Alternative MSSI weights changed the exact rank, confirming that it is an internal comparison aid rather than a decision rule. Overall, sandstone offered hydraulic advantage, marble offered buffering and redistribution, and granite required greater pressure margin and stricter numerical qualification. No lithology was superior on every metric.
Supplementary Materials
The following supporting information can be downloaded at: https://www.mdpi.com/article/10.3390/geosciences16100404/s1, complete TOUGHREACT model input files, processed figure datasets, and original figure files.
Author Contributions
Conceptualization, B.H. and B.F.; methodology, B.H.; software, B.H.; validation, B.H., B.F., C.D., X.Z., H.Z. and H.T.; formal analysis, B.H.; investigation, B.H.; resources, B.F., C.D., X.Z., H.Z. and H.T.; data curation, B.H.; writing—original draft preparation, B.H.; writing—review and editing, B.F., C.D., X.Z., H.Z. and H.T.; visualization, B.H.; supervision, B.F. and H.T.; project administration, H.T.; funding acquisition, B.F. and H.T. All authors have read and agreed to the published version of the manuscript.
Funding
This research is mainly supported by the National Science and Technology Major Project of China, grant number 2026ZD1014200, and the Xinjiang Project “Research on Cenozoic Mantle-Derived Magmatic Activity and Metallogenic Potential in Xinjiang: A Case Study of Huangshi-Kalaqiaoke”, grant number XGBST202614.
Data Availability Statement
The complete TOUGHREACT model input files, processed figure datasets, and original figure files supporting this study are included in the Supplementary Materials. Owing to their large file size, the complete raw simulation outputs and post-processing data are available from the corresponding author on reasonable request.
Conflicts of Interest
The authors declare no conflicts of interest. The funders had no role in the design of the study; in the collection, analyses, or interpretation of data; in the writing of the manuscript; or in the decision to publish the results.
References
- Ajayi, T.; Gomes, J.S.; Bera, A. A review of CO2 storage in geological formations emphasizing modeling, monitoring and capacity estimation approaches. Pet. Sci. 2019, 16, 1028–1063. [Google Scholar] [CrossRef] [Scilit]
- Wu, J.; Li, Q.; Li, Q.; Wang, F.; Cheng, Y.; Yan, C. Design and optimization of bottom-hole temperature-pressure combinations in gas production from gas hydrates via carbon dioxide replacement strategy. Energies 2026, 19, 3536. [Google Scholar] [CrossRef] [Scilit]
- Li, Q.; You, D.; Li, Q.; Wang, F.; Wang, Y.; Yang, Y. Analysis of sedimentation behavior and influencing factors of solid particles in CO2 fracturing fluid. Processes 2025, 13, 4049. [Google Scholar] [CrossRef] [Scilit]
- Li, Q.; Han, Y.; Liu, X.; Ansari, U.; Cheng, Y.; Yan, C. Hydrate as a by-product in CO2 leakage during the long-term sub-seabed sequestration and its role in preventing further leakage. Environ. Sci. Pollut. Res. 2022, 29, 77737–77754. [Google Scholar] [CrossRef] [Scilit] [PubMed]
- Medici, G.; Marianelli, D.; Cornacchia, I.; Gori, F.; Brandano, M. Multi-disciplinary approach to paleokarst occurrence in the Eocene-Oligocene succession of the Apulia Carbonate Platform (Salento, Italy). Facies 2026, 72, 17. [Google Scholar] [CrossRef] [Scilit]
- Kampman, N.; Bickle, M.; Wigley, M.; Dubacq, B. Fluid flow and CO2-fluid-mineral interactions during CO2-storage in sedimentary basins. Chem. Geol. 2014, 369, 22–50. [Google Scholar] [CrossRef] [Scilit]
- Azadivash, A.; Rabbani, A.R.; Mehdipour, V. Influence of clay mineralogy and brine chemistry on CO2 storage in fractured carbonate reservoirs: A case study of the Asmari Formation, Iran. Geoenergy Sci. Eng. 2026, 264, 214546. [Google Scholar] [CrossRef] [Scilit]
- Erol, S.; Akin, T.; Baser, A.; Saracoglu, O.; Akin, S. Fluid-CO2 injection impact in a geothermal reservoir: Evaluation with 3-D reactive transport modeling. Geothermics 2022, 98, 102271. [Google Scholar] [CrossRef] [Scilit]
- Xu, J.; Feng, B.; Cui, Z.; Liu, X.; Ke, Z.; Feng, G. Comparative study of acid and alkaline stimulants with granite in an enhanced geothermal system. Acta Geol. Sin. (Engl. Ed.) 2021, 95, 1926–1939. [Google Scholar] [CrossRef] [Scilit]
- Haeri, F.; Myshakin, E.M.; Sanguinito, S.; Moore, J.; Crandall, D.; Gorecki, C.D.; Goodman, A.L. Simulated CO2 storage efficiency factors for saline formations of various lithologies and depositional environments using new experimental relative permeability data. Int. J. Greenh. Gas. Control 2022, 119, 103720. [Google Scholar] [CrossRef] [Scilit]
- Fuchs, S.J.; Espinoza, D.N.; Lopano, C.L.; Akono, A.-T.; Werth, C.J. Geochemical and geomechanical alteration of siliciclastic reservoir rock by supercritical CO2-saturated brine formed during geological carbon sequestration. Int. J. Greenh. Gas. Control 2019, 88, 251–260. [Google Scholar] [CrossRef] [Scilit]
- Wei, W.; Zhu, X.; Lu, P.; Tan, M. Effects of inorganic CO2 intrusion on diagenesis and reservoir quality of lacustrine conglomerate sandstones: Implications for geological carbon sequestration. Geoenergy Sci. Eng. 2023, 229, 212111. [Google Scholar] [CrossRef] [Scilit]
- Wolf, J.L.; Niemi, A.; Bensabat, J.; Rebscher, D. Benefits and restrictions of 2D reactive transport simulations of CO2 and SO2 co-injection into a saline aquifer using TOUGHREACT V3.0-OMP. Int. J. Greenh. Gas. Control 2016, 54, 610–626. [Google Scholar] [CrossRef] [Scilit]
- Guerrero, F.J.; Perez-Zarate, D.; Prol-Ledesma, R.M.; Garza-Galindo, R.; Reyes-Sandoval, A.; Garcia-Zamorano, E.A. A numerical experiment for geological sequestration of CO2 in the pre-Comondu sandstones of Las Tres Virgenes geothermal area, Baja California Sur, Mexico. Int. J. Greenh. Gas. Control 2022, 115, 103630. [Google Scholar] [CrossRef] [Scilit]
- Sun, Z.; Yao, J.; Huang, X.; Xu, Y.; Zhang, J.; Liu, J.; Yu, C.; Bongole, K. CO2 injection for heat extraction and carbon sequestration in a geothermal site: Huizhou Sag, the Pearl River Mouth Basin. Geothermics 2016, 64, 331–343. [Google Scholar] [CrossRef] [Scilit]
- Xu, T.; Spycher, N.; Sonnenthal, E.; Zhang, G.; Zheng, L.; Pruess, K. TOUGHREACT Version 2.0: A simulator for subsurface reactive transport under non-isothermal multiphase flow conditions. Comput. Geosci. 2011, 37, 763–774. [Google Scholar] [CrossRef] [Scilit]
- Pruess, K.; Spycher, N. ECO2N—A fluid property module for the TOUGH2 code for studies of CO2 storage in saline aquifers. Energy Convers. Manag. 2007, 48, 1761–1767. [Google Scholar] [CrossRef] [Scilit]
- Spycher, N.; Pruess, K. CO2-H2O mixtures in the geological sequestration of CO2. II. Partitioning in chloride brines at 12–100 °C and up to 600 bar. Geochim. Cosmochim. Acta 2005, 69, 3309–3320. [Google Scholar] [CrossRef] [Scilit]
- Xu, T.; Apps, J.A.; Pruess, K. Reactive geochemical transport simulation to study mineral trapping for CO2 disposal in deep arenaceous formations. J. Geophys. Res. Solid Earth 2003, 108, 2071. [Google Scholar] [CrossRef] [Scilit]
- Xu, T.; Apps, J.A.; Pruess, K. Numerical simulation of CO2 disposal by mineral trapping in deep aquifers. Appl. Geochem. 2004, 19, 917–936. [Google Scholar] [CrossRef] [Scilit]
- Addassi, M.; Omar, A.; Ghorayeb, K.; Hoteit, H. Comparison of various reactive transport simulators for geological carbon sequestration. Int. J. Greenh. Gas. Control 2021, 110, 103419. [Google Scholar] [CrossRef] [Scilit]
- Berrezueta, E.; Kovacs, T.; Herrera-Franco, G.; Mora-Frank, C.; Caicedo-Potosi, J.; Carrion-Mero, P.; Carneiro, J. Laboratory studies on CO2-brine-rock interaction: An analysis of research trends and current knowledge. Int. J. Greenh. Gas. Control 2023, 123, 103842. [Google Scholar] [CrossRef] [Scilit]
- Massarweh, O.; Alherbawi, M.; Al-Ansari, T.; Abushaikha, A.S. Comparative effects of CO2 exposure on limestone and sandstone relevant to carbon sequestration in subsurface reservoirs. Ore Energy Resour. Geol. 2025, 19, 100110. [Google Scholar] [CrossRef] [Scilit]
- Massarweh, O.; Abushaikha, A.S. CO2 sequestration in subsurface geological formations: A review of trapping mechanisms and monitoring techniques. Earth-Sci. Rev. 2024, 253, 104793. [Google Scholar] [CrossRef] [Scilit]
- Altar, D.E.; Kaya, E.; Zarrouk, S.J.; Chambefort, I. Natural state geothermal reservoir modelling: Mineralogical and geochemical evolution perspective. Geothermics 2024, 123, 103132. [Google Scholar] [CrossRef] [Scilit]
- Matter, J.M.; Stute, M.; Snaebjornsdottir, S.O.; Oelkers, E.H.; Gislason, S.R.; Aradottir, E.S.; Sigfusson, B.; Sigurdardottir, H.; Gunnlaugsson, E.; Axelsson, G.; et al. Rapid carbon mineralization for permanent disposal of anthropogenic carbon dioxide emissions. Science 2016, 352, 1312–1314. [Google Scholar] [CrossRef] [Scilit] [PubMed]
- Gunnarsson, I.; Aradóttir, E.S.; Oelkers, E.H.; Clark, D.E.; Arnarson, M.Þ.; Sigfússon, B.; Snæbjörnsdóttir, S.Ó.; Matter, J.M.; Stute, M.; Júlíusson, B.M.; et al. The rapid and cost-effective capture and subsurface mineral storage of carbon and sulfur at the CarbFix2 site. Int. J. Greenh. Gas. Control 2018, 79, 117–126. [Google Scholar] [CrossRef] [Scilit]
- Snæbjörnsdóttir, S.O.; Sigfusson, B.; Marieni, C.; Goldberg, D.; Gislason, S.R.; Oelkers, E.H. Carbon dioxide storage through mineral carbonation. Nat. Rev. Earth Environ. 2020, 1, 90–102. [Google Scholar] [CrossRef] [Scilit]
- Punnam, P.R.; Vishal, V.; Sen, B. Reactive transport modelling of CO2 sequestration in Deccan Basalt: Mineral trapping vis-a-vis reservoir conditions and injection strategies. Fuel 2026, 426, 139483. [Google Scholar] [CrossRef] [Scilit]
- Audigane, P.; Chiaberge, C.; Mathurin, F.; Lions, J.; Picot-Colbeaux, G. A workflow for handling heterogeneous 3D models with the TOUGH2 family of codes: Applications to numerical modeling of CO2 geological storage. Comput. Geosci. 2011, 37, 610–620. [Google Scholar] [CrossRef] [Scilit]

Disclaimer/Publisher’s Note: The statements, opinions and data contained in all publications are solely those of the individual author(s) and contributor(s) and not of MDPI and/or the editor(s). MDPI and/or the editor(s) disclaim responsibility for any injury to people or property resulting from any ideas, methods, instructions or products referred to in the content. |
© 2026 by the authors. Licensee MDPI, Basel, Switzerland. This article is an open access article distributed under the terms and conditions of the Creative Commons Attribution (CC BY) license.