


Abstract
This study investigates the hydrography and geochemical signature in Ilha Grande Bay (RJ, Brazil), focusing on the seasonal intrusion of South Atlantic Central Water (SACW) and its interaction with lead sources. CTD (Conductivity, Temperature, and Depth) data revealed the presence of SACW during the summer campaigns (Mangaratiba/2011 and Frade/2012), characterized by temperatures below 20 °C and salinity between 34.6 and 36. The intrusion is driven by northeasterly winds that favor coastal upwelling, establishing a classic thermohaline stratification. The winter campaigns did not detect SACW, confirming its seasonal nature. Isotopic analysis of Pb in sediments identified six Pb206/Pb207 intervals, indicating multiple sources, including natural contributions, industrial waste, and urban effluents. The Pb206/Pb207 ranges were defined based on cluster analysis and frequency histograms, which are common methods in isotopic provenance studies. An overlap between the most radiogenic isotopic signatures and the presence of SACW suggests that this water mass acts as a vector for transporting trace elements from the deep oceanic region to the coast. This study provides the first evidence that the South Atlantic Central Water (SACW) acts as a seasonal vector, importing a distinct radiogenic Pb isotopic signature onto the continental shelf of Ilha Grande Bay. By synoptically coupling physical water-mass analysis (CTD) with Pb isotopic tracers, we introduce a novel approach that successfully discriminates oceanic from anthropogenic Pb sources, offering a new framework for understanding contaminant transport in coastal areas influenced by boundary currents. It is concluded that the coastal dynamics in Ilha Grande Bay are governed by the seasonal interaction of coastal, continental, and oceanic waters, and that the integration of physical and geochemical data is crucial for understanding mixing processes and contaminant transport in this complex environment.
1. Introduction
A water mass is defined as a body of water with a common formation history, originating in a specific region of the ocean, known as the source region, where the water mass acquires its characteristic properties [1]. The interface between the open ocean and coastal ecosystems is highly dynamic and influenced by the intrusion of deep oceanic water masses, generating direct impacts on primary productivity, the biogeochemistry of coastal regions, nutrient recirculation, and the transport and migration of pollutants across the oceans [2]. The study of the behavior and characteristics of water masses is of great importance due to their influence on atmospheric circulation patterns and climate, such as the El Niño phenomenon. Their distribution is based on conservative properties, particularly salinity and temperature. These properties act as fingerprints that enable the identification and differentiation of distinct water masses present in each location. The alteration of these properties can only occur through the mixing of water masses, a process that occurs very slowly, thereby allowing the original salinity and temperature values to remain relatively stable.
Several authors [3,4,5,6] describe the presence of different superficial and deep-water masses operating in the Brazil Basin: Tropical Water (TW), South Atlantic Central Water (SACW), Antarctic Intermediate Water (AAIW), Upper Circumpolar Water (UCPW), North Atlantic Deep Water (NADW), and Antarctic Bottom Water (AABW). In this context, Ilha Grande Bay (IGB), located on the southern coast of Rio de Janeiro, is a complex environment influenced by Tropical Water (TW), through which the Brazil Current flows, by Coastal Water (CW), which operates near the coast and is characterized by low salinity, and by South Atlantic Central Water (SACW), found at approximately 200 m depth on the edge of the continental shelf [7,8]. Tropical Water (TW) is characterized as a warm and saline water mass that occupies the surface of the Tropical South Atlantic and is transported southward by the Brazil Current. The surface properties of TW originate from intense solar radiation and an excess of evaporation over precipitation, which is characteristic of the Tropical Atlantic, resulting in a strong correlation between its temperature and salinity variations and the climatic conditions of its region. TW is defined by temperatures exceeding 20 °C and salinities above 36 along the southeastern Brazilian coast [8]. The sigma-t density of TW ranges from 24.5 to 26.6 and varies with location, being denser in the south and less dense near the equator [4]. Coastal Water (CW) exhibits properties of its specific region; however, its salinity is consistently lower due to continental influence [7]. In the Ilha Grande Bay (IGB) region, South Atlantic Central Water (SACW) emerges. Formed in the Brazil-Malvinas Confluence, SACW is characterized by low temperatures (6 to 20 °C) and moderate salinities (34.6 PSU to 36 PSU). After its formation, SACW is incorporated into the Subtropical Gyre at the pycnocline level until it reaches the Brazilian coast, where it bifurcates, flowing partially northward and southward and acting as a nutrient repository. When introduced into the shelf ecosystem, these nutrients can sustain productivity peaks, supporting large populations of pelagic and demersal fish [9,10]. The identification and definition of different water masses is achieved through the temporal and spatial analysis of classical physical parameters, such as temperature and salinity. However, the analysis of this dataset can be further refined by integrating salinity and temperature data with geochemical tracers. Together, these act as a powerful tool for “labeling” water masses and tracking their influence. In this context, the analysis of lead (Pb) isotopic ratios (e.g., Pb206/Pb207) jointly with temperature and salinity data allows for the investigation of sources and mixing processes and enables the differentiation of partial contributions from natural (continental rocks) and anthropogenic sources (fuels, industries, domestic sewage, etc.), in addition to being able to record specific oceanic signatures [11,12].
Despite its ecological importance and its location in a region directly influenced by major western boundary currents, Ilha Grande Bay remains poorly characterized with respect to the mechanisms that regulate the intrusion, persistence, and mixing of oceanic water masses within its interior [13].
Most existing studies have focused on surface circulation, contamination assessments, or local hydrodynamics, while the subsurface and intermediate water masses–especially the occurrence, variability, and vertical penetration of SACW- remain insufficiently described. The chemical dynamics of the water column on the continental shelf adjacent to Ilha Grande Bay are largely influenced by the mixing of oceanic and coastal water masses [14]. This prevailing condition supports the present study’s hypothesis that Central South Atlantic Water (SACW), Tropical Water (TW), and local coastal waters interact complexly within the bay.
Furthermore, the seasonal and interannual dynamics governing the relative influence of TW, CS, and SACW inside this semi-enclosed system are still poorly constrained, creating uncertainties about how oceanographic forcing impacts nutrient inputs, biogeochemical cycling, and pollutant transport. Another important knowledge gap concerns the lack of integrated physical-geochemical approaches capable of resolving mixing processes between coastal and oceanic waters in the region. Although Pb isotopic ratios have been successfully applied in other coastal systems, their potential to discriminate water masses and trace oceanic contributions in IGB has not yet been explored, limiting our understanding of both natural pathways and anthropogenic inputs [15]. The Pb isotopic composition in coastal sediments is influenced by a mixture of natural geogenic backgrounds and anthropogenic inputs. In industrialized coastal zones like the Ilha Grande Bay region, potential anthropogenic sources include industrial waste, urban and port activities, and atmospheric deposition. These gaps highlight the need for a combined physical-isotopic analysis to advance the identification of water masses and their temporal behavior in Ilha Grande Bay.
While Pb isotopes are a well-established tool for provenance studies [11,12], and physical oceanographic studies of Ilha Grande Bay exist [7,8,16] a significant methodological gap remains. Previous research in the region and in similar coastal systems has typically treated these disciplines in parallel. Studies have either characterized physical water masses and their dynamics without directly linking them to specific geochemical signatures [8] or have identified and apportioned contaminant sources using isotopes without directly tracing their physical transport mechanism by a specific, identified water mass [3]. This disconnect between physical and geochemical tracing is a common challenge in coastal oceanography. This study bridges this gap. Unlike previous work, we synoptically integrate CTD data and Pb isotopic analysis from the same campaigns to directly trace the SACW not only as a physical entity but also as a chemical vector. This integrated approach allows us to uniquely demonstrate that the seasonal intrusion of an oceanic water mass is a key mechanism for importing a specific geochemical signature into the coastal zone, a process seldom demonstrated with direct evidence in complex coastal systems.
The main objective of this work is to conduct a spatial and temporal analysis of physical parameters from CTD data (temperature and salinity), integrated with Pb isotopic ratios from the Ilha Grande Bay region in southern Rio de Janeiro. This integrated approach will help identify the water masses present in the region, improve the characterization of their mixing processes, and verify the occurrence and variability of SACW during the measurement period.
2. Physical Setting of the Study Area
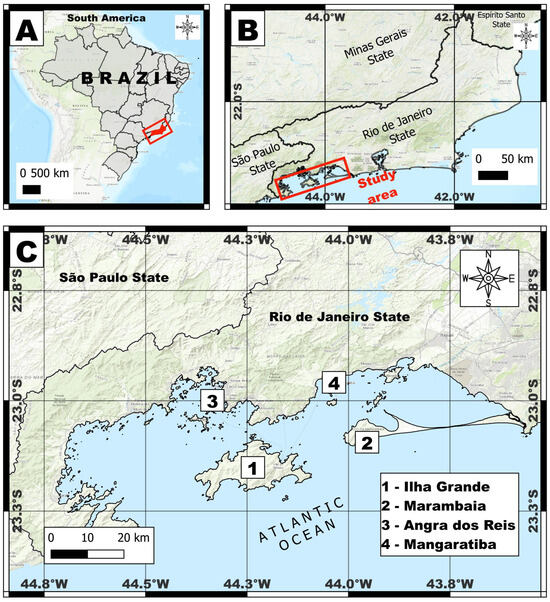
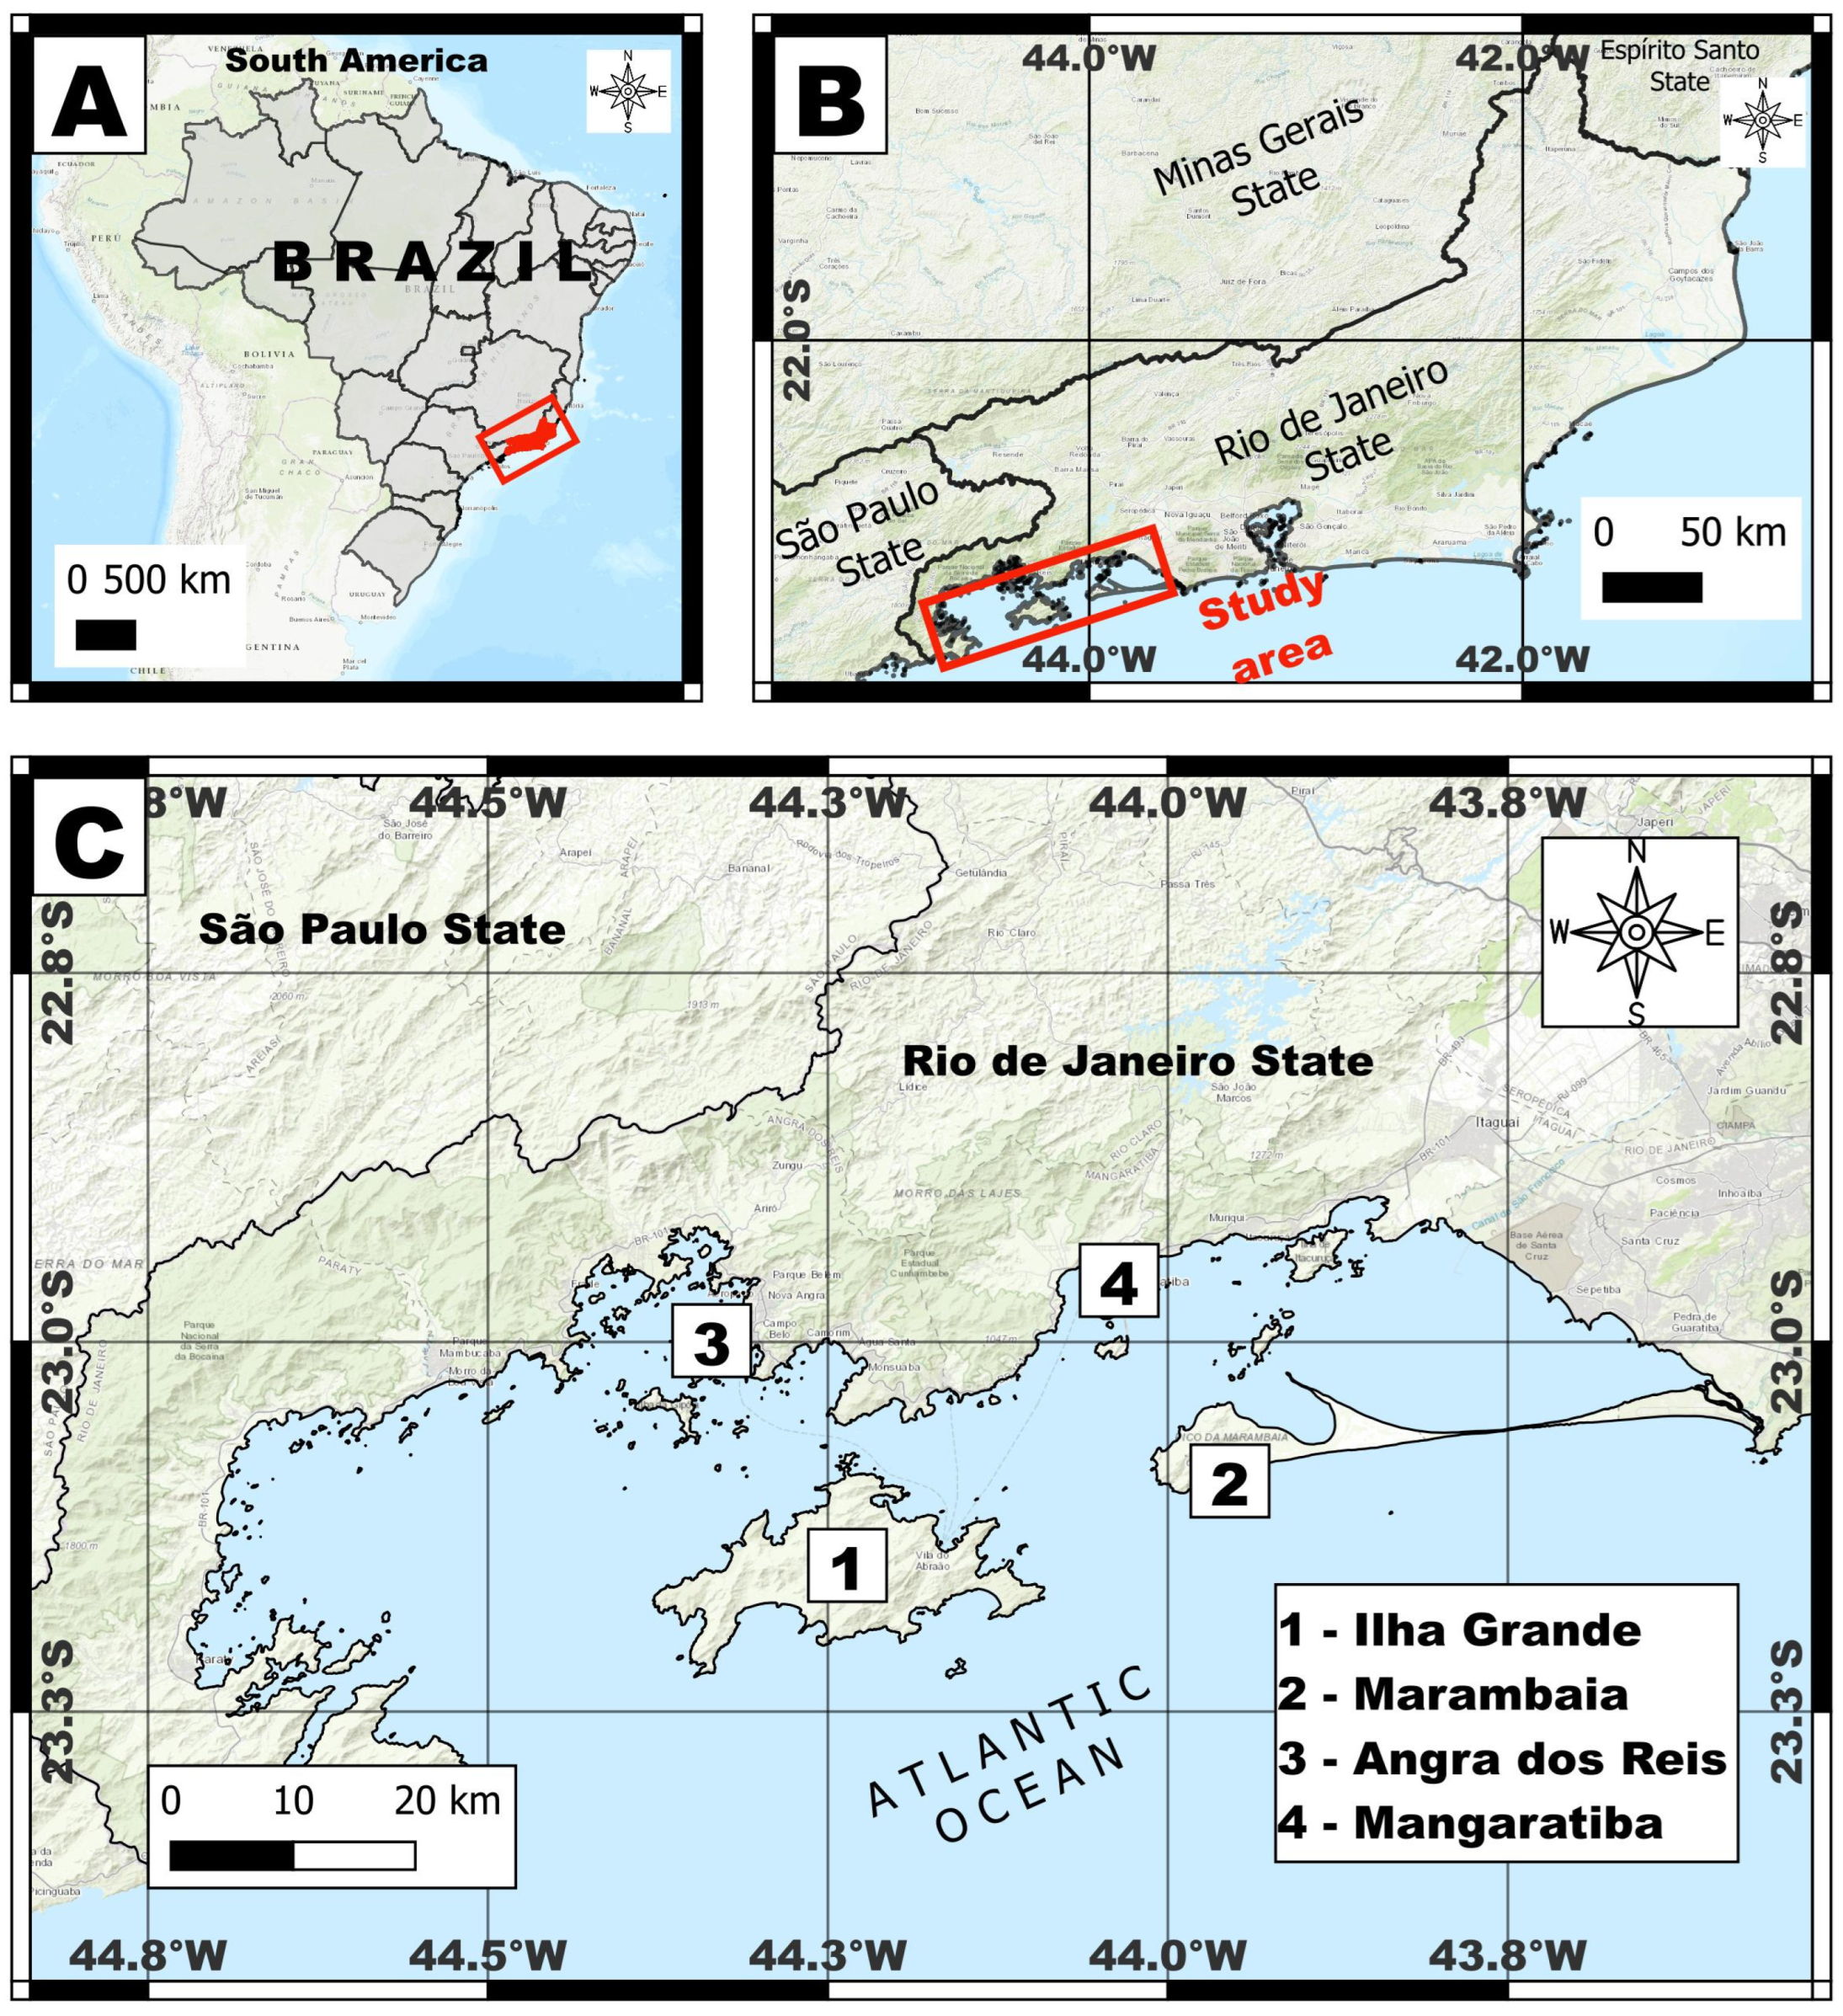
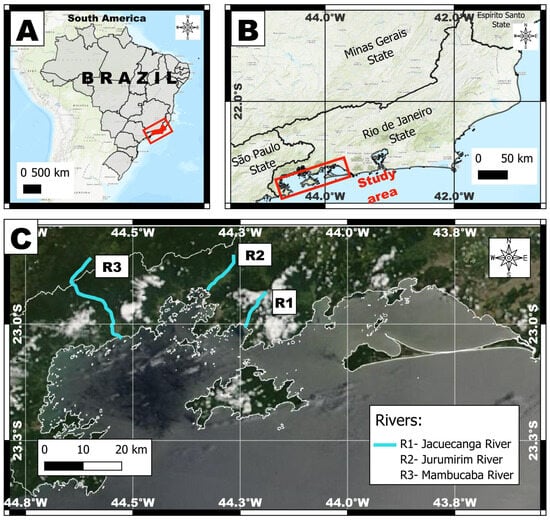
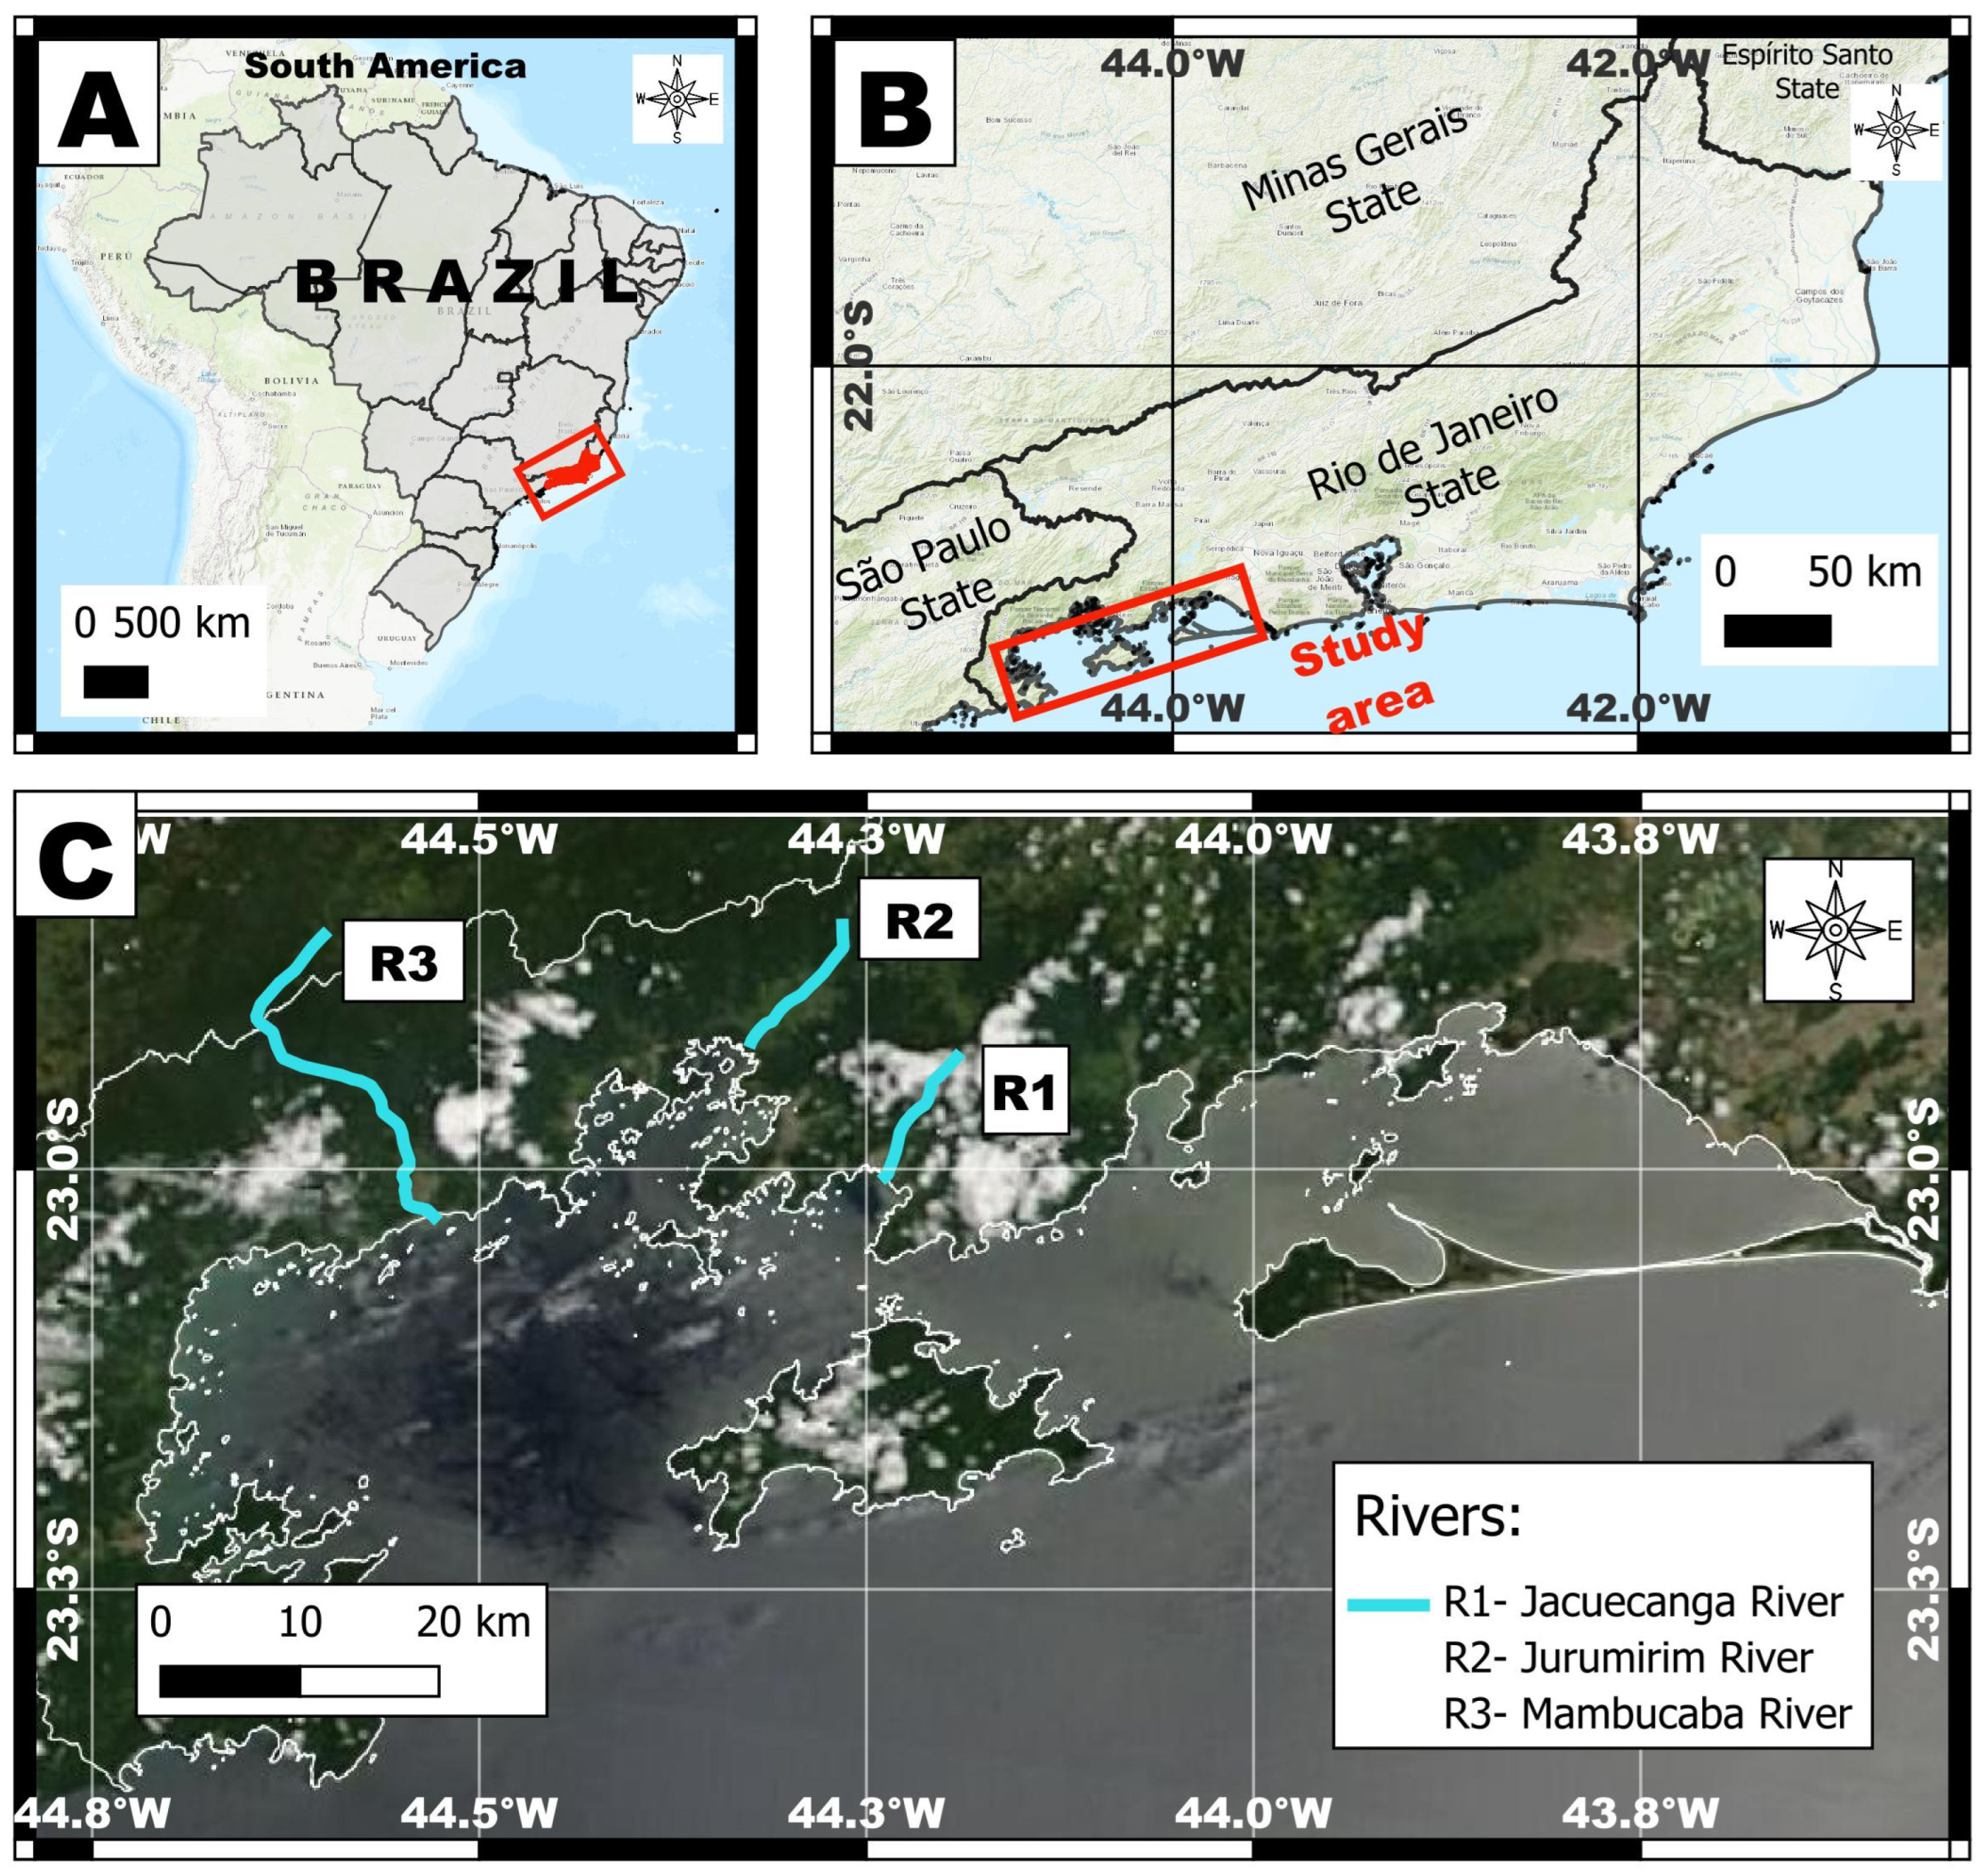
The Ilha Grande Bay is located on the Southern coast of the Rio de Janeiro state (Figure 1), within the central portion of the southeastern continental shelf. It is a water body defined by the presence of Ilha Grande, with approximate boundary coordinates of 22°50′ S–23°20′ S and 44°00′ W–44°45′ W [16]. The bay is in a relatively well-preserved area and is considered an important region harboring remnants of the insular Atlantic Rainforest. It features a significant diversity of marine ecosystems and is largely surrounded by rock shores, islands, sandy beaches, and mangroves, which are characteristic features of the “Green Coast” (Costa Verde) of the Brazilian Southeast, where the Serra do Mar Mountain range intercepts the coastline at several places [17].
Figure 1.
Study area: (A) localization of the study area in South America; (B) localization of the study area in Rio de Janeiro State; (C) localization of Baía de Ilha Grande in Rio de Janeiro State.
The study area (Figure 1B) is located within the most significant geoeconomic region of Brazil, encompassing the cities of Rio de Janeiro, São Paulo, Belo Horizonte, and Vitória. It is considered a potentially catalytic area for development, emerging as one of the industrial hubs of Rio de Janeiro state and a major tourist center. According to [18], the numerous economic and industrial activities developed in its vicinity and the adjacent maritime domain represents a significant attraction for labor concentration, both directly and through necessary secondary services. In this region, due to its high socioeconomic relevance, there is intense vessel traffic (ranging from small boats to cargo ships).
This coastal region (Figure 1C) extends beyond the Ilha Grande, encompassing highly urbanized areas with significant population centers such as the municipalities of Angra dos Reis and Mangaratiba [19]. A key environmental feature is the Restinga da Marambaia, a substantial sandy barrier that plays a crucial role in protecting the Rio de Janeiro coastline from erosive processes and storm surges. Furthermore, the region is of considerable strategic and industrial importance, hosting critical infrastructure including the Petrobras Oil Terminal (TEBIG–Ilha Grande Bay Terminal), the Verolme Marina, the BRASFELS Shipyard, and the Angra nuclear Power Plants, which are situated near the city of Angra dos Reis.
These are potential modifiers of the region’s physical variables [16,20,21]. The impacts experienced by the coastal region, whether caused by natural or anthropogenic factors, originate from both inland areas- via rivers and tributaries along the margins- from its mouth, where it connects with the open ocean. The active natural phenomena encompass a broad spectrum, including events with periodicities ranging from seconds (surface gravity waves) to trends spanning hundreds of years (mean sea level behavior).
The effects of anthropogenic alterations can be felt in the environment directly, through the discharge of effluents from diverse sources, both organic and industrial, which can impose restrictions on other water uses, such as sports and recreation. Indirectly, these effects can be observed, for example, through coastal engineering works and dredging operations, which alter the dynamics of substance transport and sediment distribution, potentially impacting coastal urban occupation [18]. Given that this is a region of significantly vested interests, encompassing both economic and commercial as well as environmental and ecological concerns, it is imperative to maintain the complex balance between the activities conducted there and the surrounding environment.
2.1. Geomorphological Features
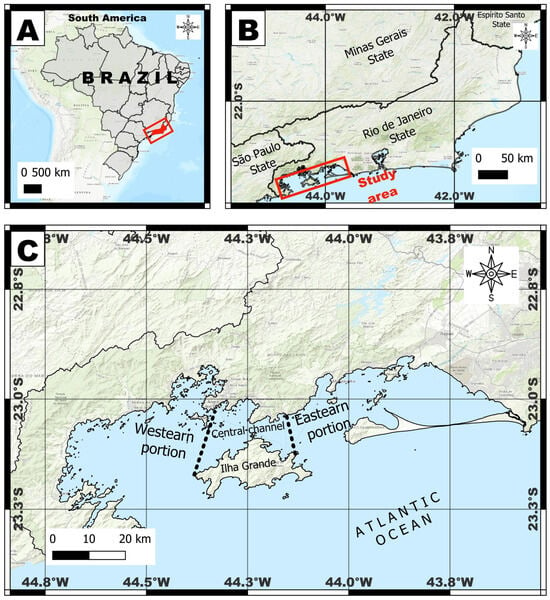
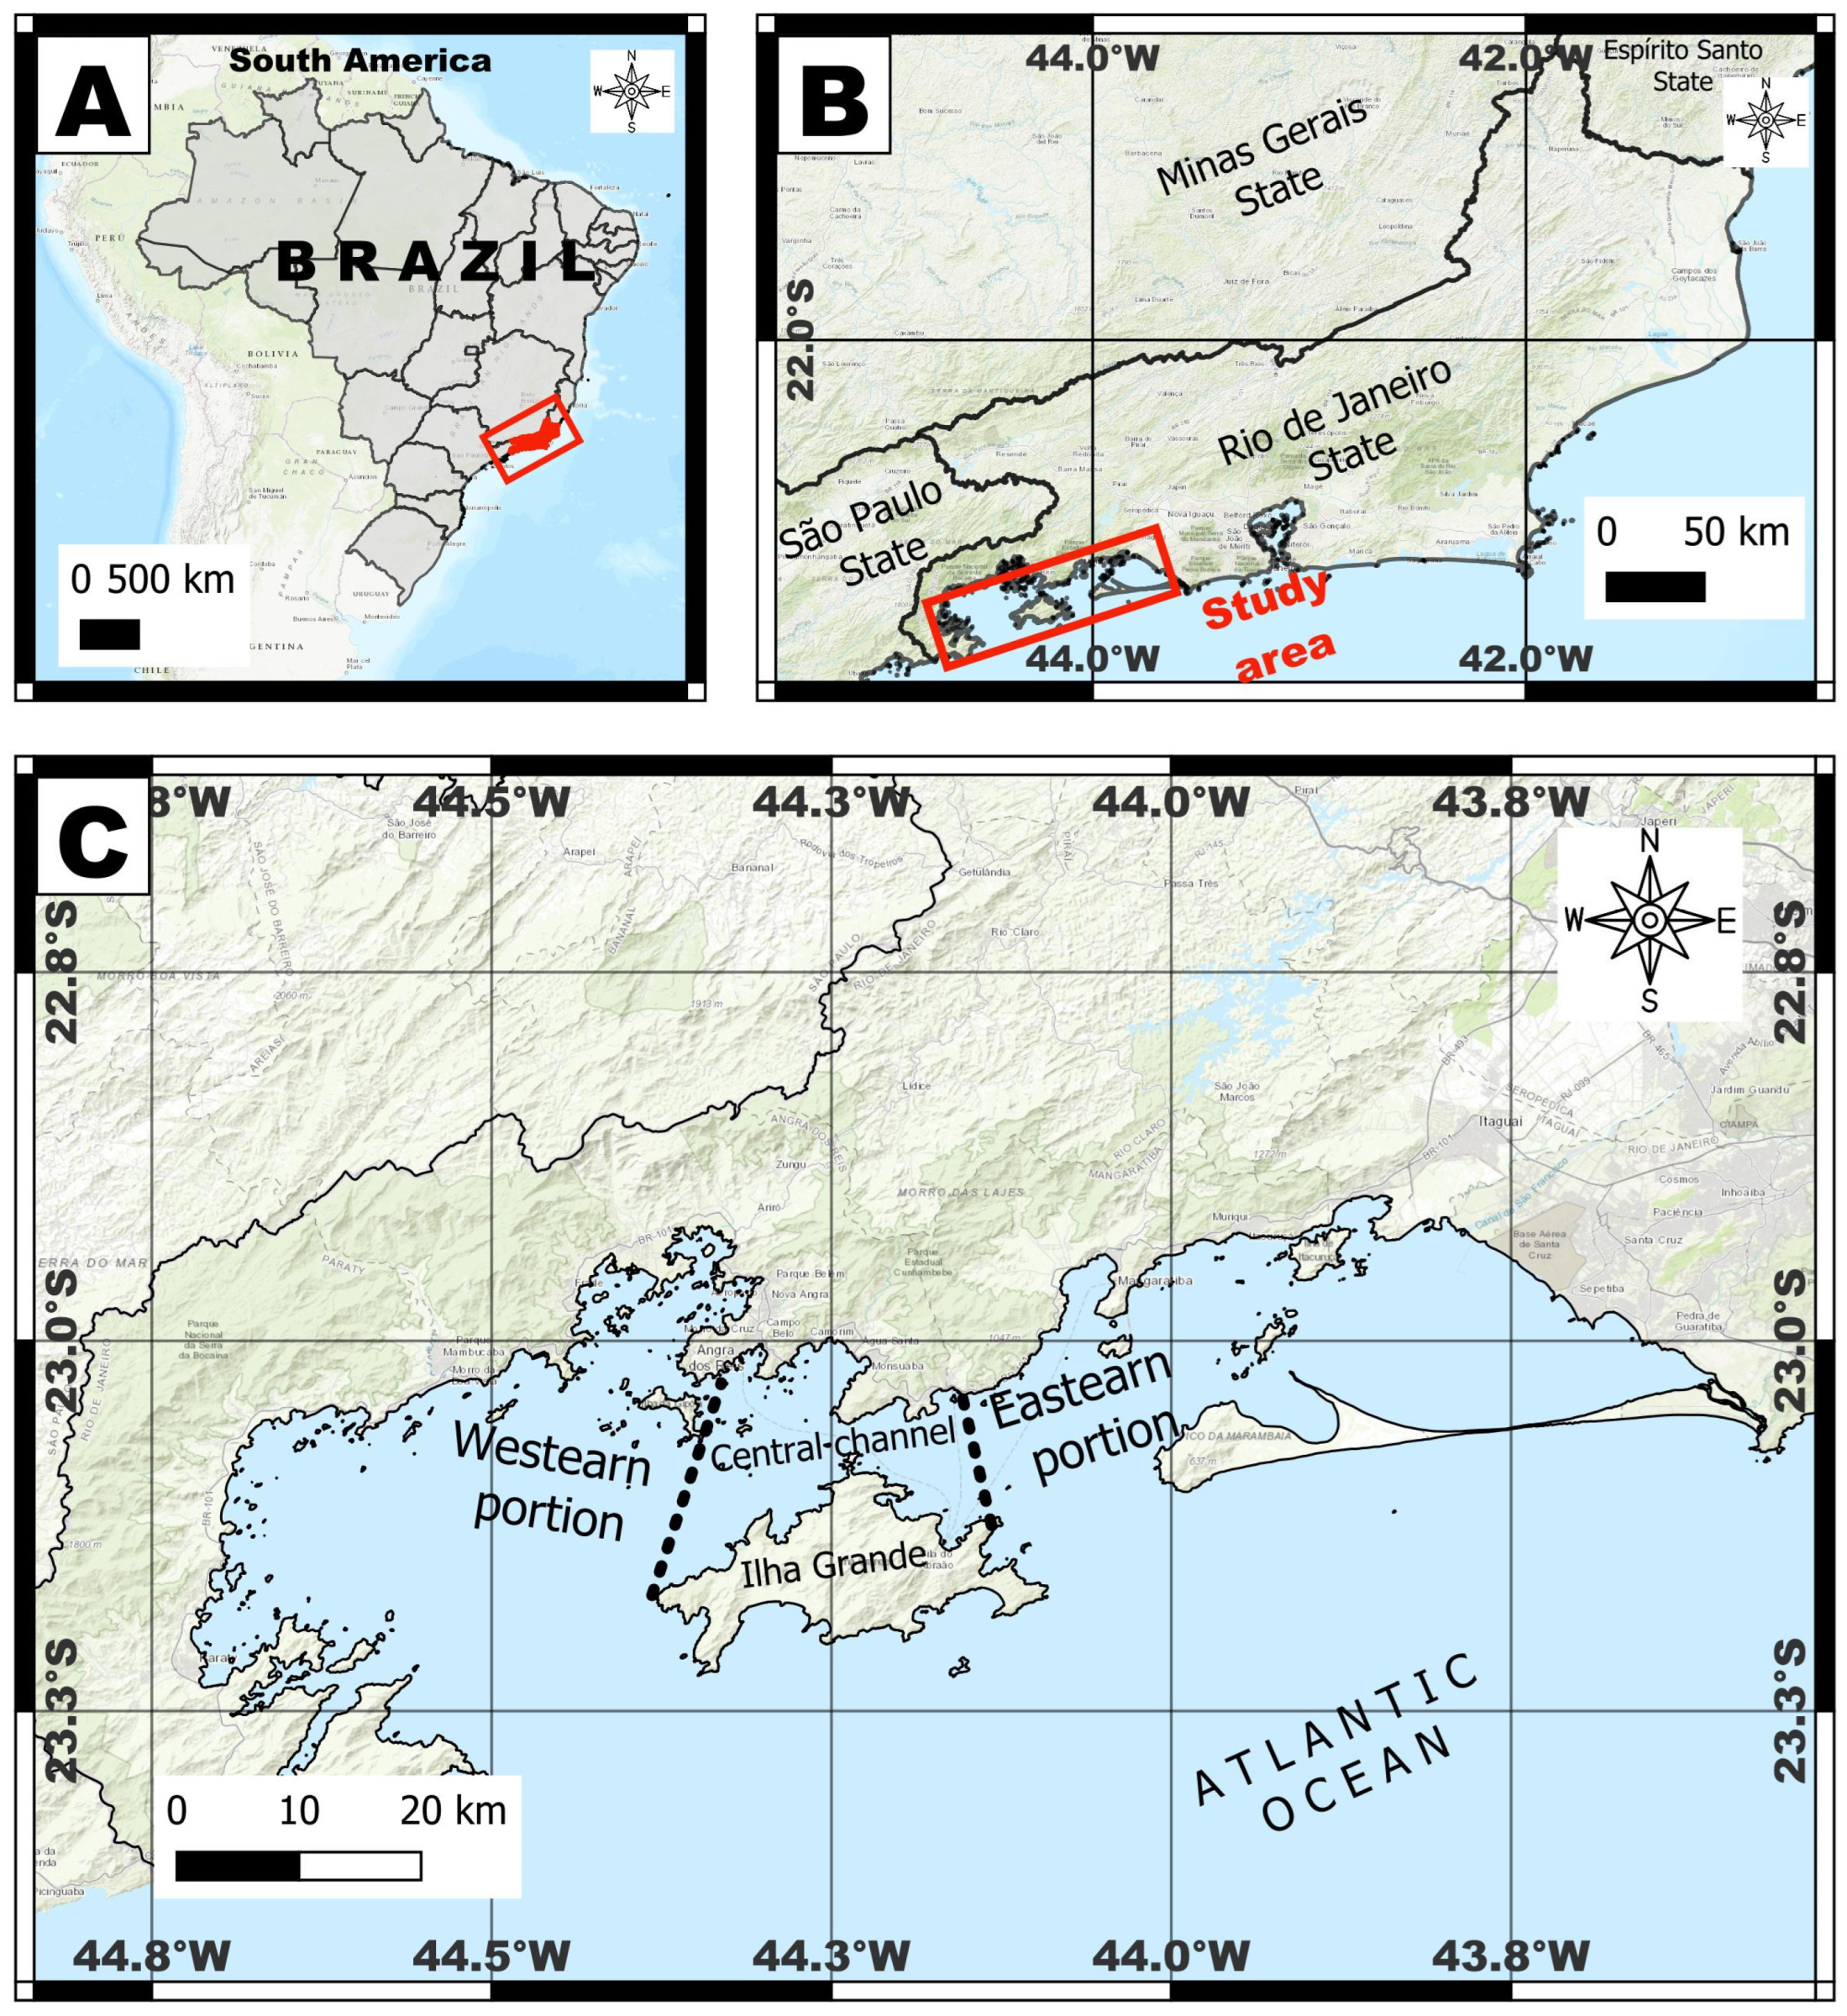
The geomorphological feature of this bay can be essentially described as two water bodies separated by a narrow channel formed between Ilha Grande and the mainland. According to its physiographic characteristics, the region can be subdivided into three distinct portions: The Western Portion, the Eastern Portion, and the Central Channel (Figure 2) [16]. According to their study, the western portion has a maximum depth on the order of 40 m and a direct connection to the open sea through a wide opening approximately 20 km across. The central channel, which is narrow and elongated in an east–west direction, is approximately 20 km long and contains the greatest depths within the bay, with a maximum reaching 55 m. The Eastern portion has a maximum depth of 25 m, is intersected by an extension of the central channel, and features a connection to the open sea approximately 10 km wide.
Figure 2.
(A) Study area in South America; (B) Study area in the Rio de Janeiro State; (C) Zoning of the study area. Adapted from [17].
2.2. Climate Characteristics
Climate variations, whether natural or anthropogenic, can trigger environmental impacts such as a rise or fall in mean sea level; an increase or decrease in the frequency and intensity of severe rainfall, droughts, heatwaves, cold spells, and transient meteorological systems (e.g., fronts, tropical cyclones, extratropical cyclones, among others) [20]. According to [21], the region’s climate is type “A”, characterized as hot and humid tropical, with an average annual precipitation ranging between 1400 mm and 2500 mm, and a prevalence of calm winds.
The state of Rio de Janeiro exhibits a high annual rainfall index, with frequent rains throughout the year and a heterogeneous spatial distribution of precipitation [22]. The highest rainfall indices are observed on the Southern coast of the state, which can be explained by the interaction between the orientation of the topography and the trajectory of polar fronts [20]. In the Ilha Grande region, the Serra do Mar range runs parallel to the coast. When polar fronts reach the area, they encounter the slopes of the Serra do Mar, forcing the air mass to ascend, leading to its saturation and subsequent precipitation. Air convection, induced by high temperatures combined with strong humidity—a condition favored by the presence of the Atlantic Forest—is another triggering factor for rainfall in the region. This scenario results in the slopes of the Serra do Mar having an annual rainfall index above 2000 mm, exceeding 2500 mm in certain locations [23].
Generally, the highest rainfall indices occur in summer, while a sharp reduction in total precipitation is observed in winter. This seasonal variation can interfere with the discharge of local rivers, influencing temperature and salinity in the areas where these rivers discharge. Regarding the prevailing winds in the region [24], using 14 years of climatological data from the Guaíba Island meteorological station near the entrance to Sepetiba Bay, demonstrated that winds from the Southern quadrant are significantly more frequent and energetic than those from the Northern quadrant. The Santa Cruz area, according to [25], also indicated that the most frequent winds at that station are from the Southern quadrant, with average speeds between 3 and 5 m/s.
This finding was corroborated by [26], who used 30 years of climatological data from the Angra dos Reis station, found a higher incidence of winds from the South, with speeds between 2 and 4 m/s. Therefore, it can be concluded that the prevailing winds in this region are from the south/southwest direction, being the most frequent and having the highest speeds. These winds are primarily associated with the passage of cold fronts and cause coastal downwelling, resulting in the retreat of the South Atlantic Central Water (SACW) from the shelf. Wind-induced coastal upwelling events (intrusion of SACW onto the continental shelf) are more common during summer and are related to winds from the NNE quadrant [27]. The regularity of this wind that induces this process: the offshore movement of coastal water above the seasonal thermocline is compensated by the intrusion of SACW towards the coast [27]. Figure 3 presents a high-resolution (1 km) sea surface temperature (SST) composite of the Rio de Janeiro coastline on 8 December 2019, revealing key mesoscale oceanographic structures. Thermally, the waters within the Ilha Grande-Sepetiba Bay complex (BIG-BS) are moderately cool (21–22 °C), contrasting sharply with the warmer offshore waters (>24.6 °C) to the east and south, effectively illustrating the complex thermal gradient and dynamic processes dominating the region [17,25].
Figure 3.
(A) Study area in south America; (B) study area in Rio de Janeiro state; (C) hydrography and image of the sea surface temperatures of coastal and shelf waters along the coast of the state of Rio de Janeiro on 8 December 2019, based on the Group for High Resolution Sea Surface Temperature (GHRSST) Level 4, Multiscale Ultrahigh Resolution (MUR) analysis product, which uses wavelets to interpret night-time skin and sub-skin SST from based on the NASA Advanced Microwave Scanning Radiometer-EOS (AMSR-E), the Moderate Resolution Imaging Spectroradiometer (MODIS) on the NASA Aqua and Terra platforms, the US Navy microwave WindSat radiometer, and in situ SST observations from the NOAA iQuam project. The spatial resolution is 1 km. Images are available online from PO. DAAC-GHRSST Level 4 G1SST Global Foundation Sea Surface Temperature Analysis.
2.3. Hydrography and Current Circulation
The region’s hydrographic basin is characterized by direct contact of the Serra do Mar with the ocean. The rivers in the region have a low average discharge due to their small drainage areas and are classified as having an austral flow regime, exhibiting their highest discharge peaks in summer and low discharges in winter. They originate at high altitudes and are short on the order of 15 km in length [28,29]. According to [30], the most important rivers in the coastal region are: Mambucaba, Bracuí, Jurumirim, Japuíba, and Jacuecanga (Figure 3). Among these five, the Mambucaba River stands out, having the greatest length, approximately 58 km. It exhibits a regime of higher discharges from January to March. The dry period corresponds to the months from June to October, with August and September being the driest [29]. Circulation along the Brazilian coast is still poorly understood due to a scarcity of continuous data, which prevents a more precise understanding of hydrodynamic processes. In Ilha Grande Bay, this same difficulty is faced with only a few studies attempting to describe the local hydrodynamics. These studies predominantly present discrete and short-duration data, hindering a complete understanding of the hydrodynamic processes in the area. As it is a highly productive environment with considerable economic potential, knowledge of its hydrodynamic pattern is of paramount importance in understanding its evolution and functioning, as well as for elucidating issues that directly impact society and the economy. A large, partially mixed estuarine system formed by Ilha Grande Bay and Sepetiba Bay is observed in this region. It features two oceanic water inlets, one on each side of the island, with Sepetiba Bay acting as the main source of freshwater due to the high fluvial discharge into that bay [25]. According to [31,32,33,34], the gradient of salinity and temperature from Sepetiba Bay towards Ilha Grande Bay indicates that the freshwater input into Ilha Grande Bay primarily originates from Sepetiba Bay [31,32]. As a result of the interaction between these two water masses through continuous recordings of temperature and salinity, the presence of a salinity front has been detected along the southern entrance of Sepetiba Bay, between Ponta Grossa da Marambaia and Ponta de Castellanos. The existence of this front was attributed to the interaction of coastal water with less saline, slightly warmer water emanating from Sepetiba Bay. Ref. [33] observed salinity fronts at four points within the bay and concluded that the passage of fronts separating oceanic water from coastal water is frequent in the area, always accompanied by rapid current reversals. A predominant, quasi-stationary clockwise circulation pattern around Ilha Grande was observed. This motion was attributed to the horizontal density distribution between oceanic waters from the continental shelf entering Ilha Grande Bay and the fresher waters from Sepetiba Bay, with weak influence from tides and wind [33,34]. Observing the characteristics of current circulation in Ilha Grande Bay, [30] identified a bottom circulation in a clockwise direction, with water entering through the western portion and exiting through the eastern portion. According to the authors, bottom currents penetrate Ilha Grande Bay through the western portion at 6.1 cm/s, pass through the Central Channel at 16.1 cm/s, and exit towards the ocean through the Eastern portion at a speed of 5.0 cm/s. Furthermore, from these observations, they discovered the occurrence of a periodic phenomenon occurring only at a depth of 10 m, which they termed “pulsation”. It occurred every hour and lasted about 10 to 20 min, imparting a quite intense acceleration to the current. Ref. [34] indicates that the current in the channel is modulated, meaning its intensity decreases during the ebb tide, but not sufficiently to cause a reversal in current direction. Data obtained by [16] from two current meters at a fixed station positioned in the central channel over 32 h identified the existence of distinct dynamic processes near the bottom (25 m) and at the surface (10 m). [35] indicates the presence of an intense, unidirectional current at the surface, with an almost total predominance of a southeastward direction and speed around 0.5 m/s. In contrast, currents measured near the bottom exhibited a bidirectional pattern, alternating direction between northeast and southeast, with much lower speeds, on the order of 0.1 m/s. According to [30], a suspended particle would take 7 days or 14 tidal cycles to travel from the western entrance to the eastern entrance under favorable conditions. Ref. [22] highlights the minor influence of tides on the transport process. The tidal wave entering through both ends (east and west) of Ilha Grande Bay would cause them to meet in the Central Channel. This meeting of waves would cause a cancellation in their propagation. Based on tidal gauge stations located in the region, the tide in Ilha Grande and Sepetiba Bays is classified as mixed, mainly diurnal, meaning two consecutive high/low tides show a significant difference in amplitude [36].
3. Methodology
3.1. CTD Data Acquisition
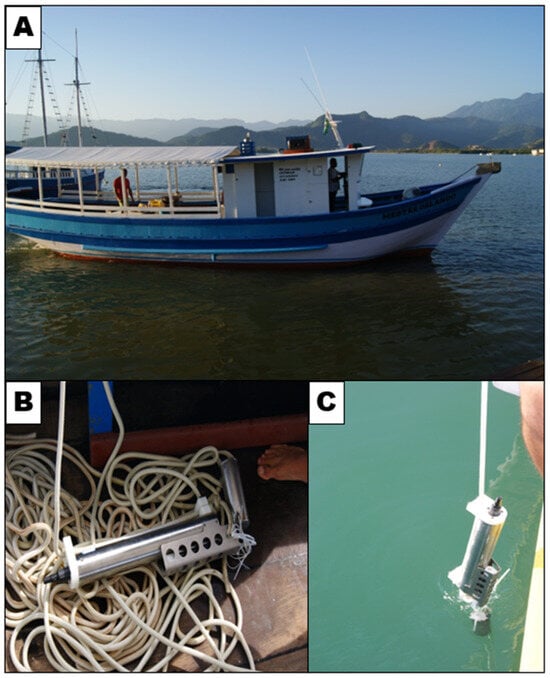
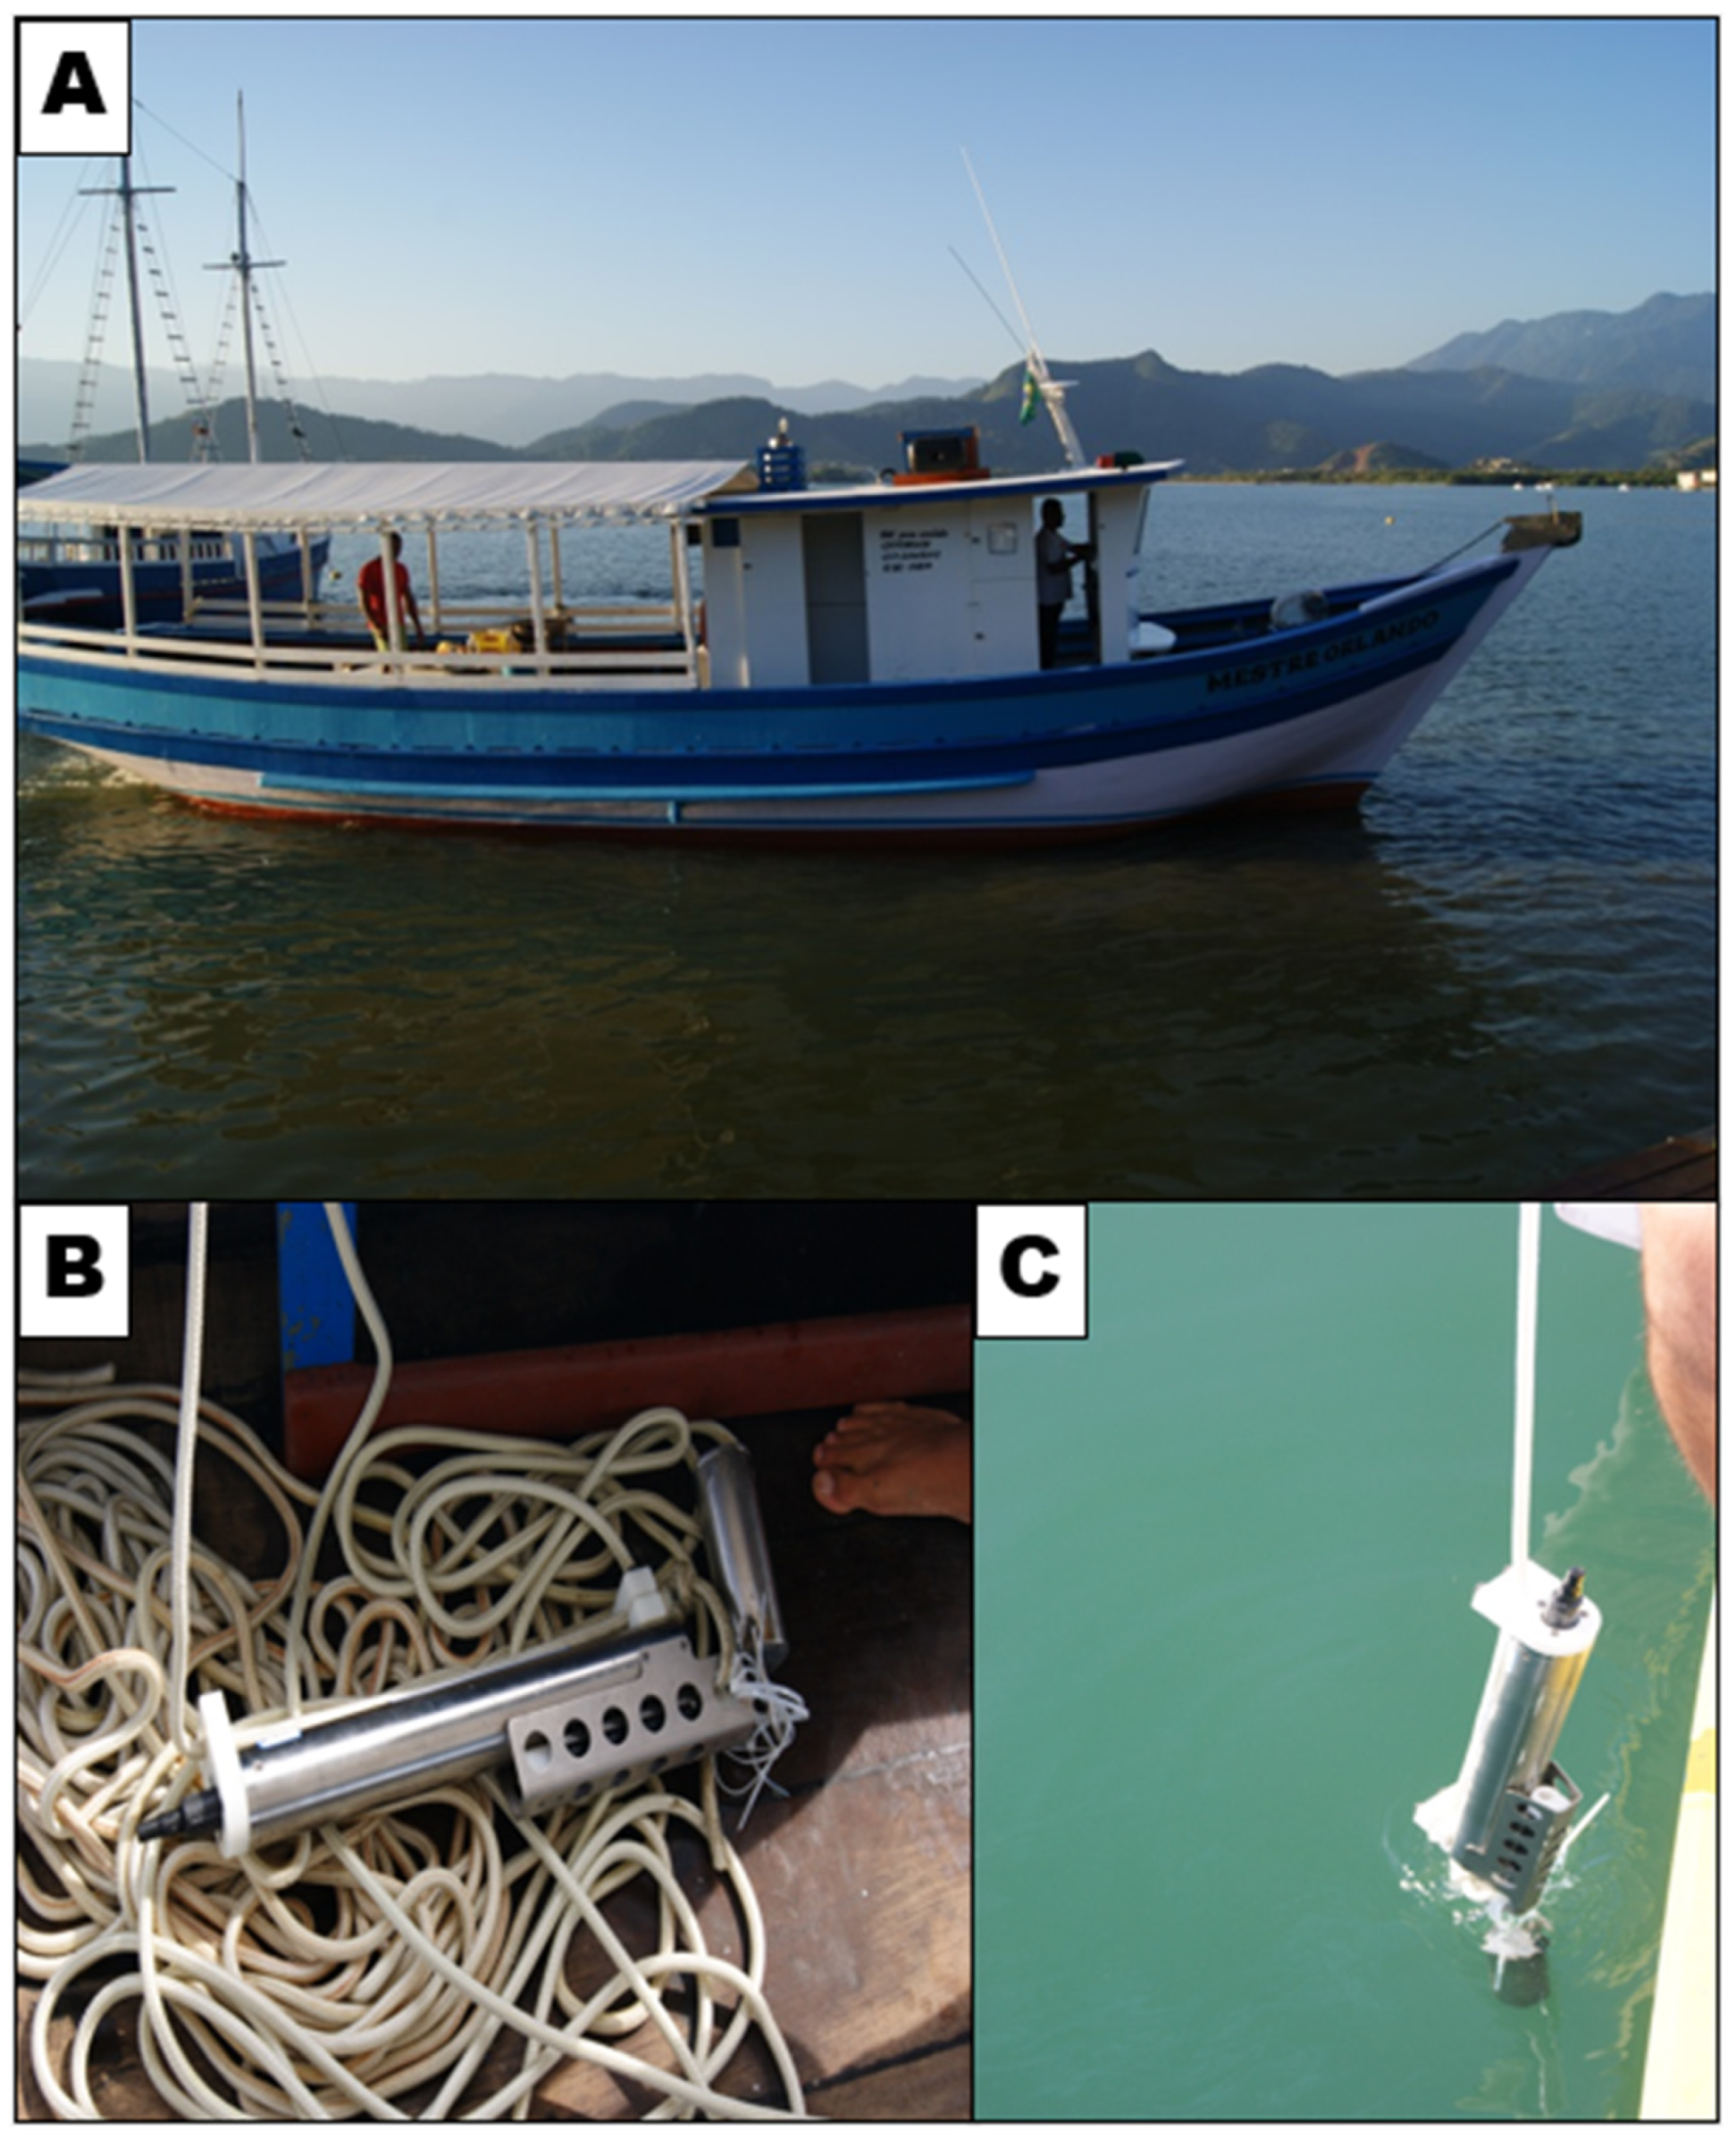
Data acquisition campaigns were conducted aboard a trawler-class vessel (Figure 4A). Data was collected using an SBE 37-MicroCAT CTD (Conductivity, Temperature, and Depth) instrument manufactured by Sea-Bird Electronics (Bellevue, WA, USA). This instrument features a data output port at one end for connection to a computer, which is necessary for data access (Figure 4B). The opposite end houses a pressure port and a protective grille that contains the conductivity cell and provides an attachment point for a weight to prevent instrument drift. The CTD is the standard oceanographic equipment used to measure seawater properties such as conductivity and temperature, as well as the corresponding depth of collection. The model used in this work has a cylindrical shape, approximately 50 cm in length and 8 cm in diameter and is constructed from titanium to withstand great depths (up to 7000 m). The maximum depth reached during the sampling campaigns was approximately 45 m.
Figure 4.
(A) Vessel employed during the survey campaigns for data gathering; (B) CTD SBE 37-MicroCAT; (C) position of the CTD as it is being lowered to profile the water column.
3.2. Sampling Design and Procedure
The sampling grid was designed with collection points spaced approximately 1.5 km apart, resulting in a regular grid covering the entire area of interest. The coastline features more sheltered bays, protected by the physical barrier of Ilha Grande, as well as areas more exposed to the open ocean and forces such as waves, marine currents, and winds. The CTD is lowered into the water column using a rope, allowing it to reach the bottom (Figure 4C). The instrument was deployed slowly, as a measurement is recorded every 5 s. A minimum of three measurements per meter is ideal to construct a high-resolution water column profile, enabling the identification of small variations throughout the water column. The sampling grid consisted of stations spaced 1.5 to 2 km apart to homogeneously cover the entire study area, totaling 249 sampling stations (Figure 5).
Figure 5.
(A) Study area in South America; (B) study area in Rio de Janeiro state; (C) study area with the general location of the sampling stations.
At each station, latitude and longitude were recorded from aboard the vessel using a Garmin, eTrex32x handheld GPS unit (Garmin International Inc., Olathe, KS, USA, 2021). A total of five campaigns were conducted to achieve satisfactory spatial coverage of the study area. The first campaign (17 March 2011) and the second (14–16 July 2011) were launched from Mangaratiba. These were followed by campaigns at Ponta Leste (29–31 July 2011), Baía da Ribeira (10–12 August 2011), and finally at Frade (24–26 January 2012). The collection on 17 March 2011, in Mangaratiba, represented the initial use of the equipment and its operational procedures. This resulted in robust data, as the CTD was lowered and raised through the water column efficiently, and these data were analyzed and considered in the present work.
3.3. Data Processing
Data processing and graph generation were performed using the MATLAB R2012a software from MathWorks (Santa Clara, CA, USA). Vertical profiles of temperature, salinity, conductivity, and density were produced for each sampling station to identify water masses. MATLAB (an acronym for MATrix LABoratory) is a high-performance interactive environment oriented towards numerical computation. MATLAB integrates numerical analysis, matrix computation, signal processing, and graph plotting. It is an interactive system whose basic data element is an array that does not require dimensioning. This system allows the solution of many numerical problems in a fraction of the time required to write a similar program in a scalar language. Furthermore, solutions to problems are expressed in MATLAB almost exactly as they are written mathematically [37].
Salinity values were derived by converting the conductivity measured by the CTD. Density was calculated from the measured temperature (from the CTD) and the derived salinity. These computations were performed using the routines from the Sea Water toolbox for MATLAB. During the creation and analysis of the graphs, spurious values were removed. These outliers resulted from inherent limitations of the collection method, as CTD continuously records parameters throughout the campaign, including while on the vessel. Therefore, after submersion, it is necessary to wait for a period, still near the surface, for the sensors to stabilize.
3.4. Isotope Analysis
A total of 67 sediment samples were collected during the two field campaigns in March and July 2011, totaling four days of sampling. The samples were sieved using a 200-mesh screen and sent to ActLabs for total digestion analysis. Elemental concentrations and isotopic ratios were determined by ICP-MS and TD-ICP. The geostatistical data were processed using the following parameters: correlation index, scatter plots (x-y), and trendlines with a 2nd-order polynomial curve. Cluster diagrams were generated using the Euclidean distance method, alongside correlation matrices and factors. Concentrations are reported with a precision of two decimal places, and isotopic signatures with a precision of three decimal places. Lead isotope analyses were performed to define the isotopic signatures and ratios of the sediments, which were subsequently correlated with their respective metal concentrations. Quality Assurance and Quality Control (QA/QC) procedures were rigorously applied throughout the analytical process. For metal concentration analysis via ICP-MS, certified reference materials (CRMs) from the National Research Council Canada (MESS-3 for marine sediments) were used to ensure accuracy, with recoveries ranging between 92% and 105%. Analytical precision, determined by repeated analysis of samples (n = 5), was better than 5% for all elements. For Pb isotopic analysis, the standard reference material NIST SRM 981 (Common Lead Isotopic Standard, Gaithersburg, MD, USA, 2014) was analyzed repeatedly to monitor instrument performance, yielding results within the certified values. The reproducibility for Pb isotopic ratios was better than 0,1%. Statistical reliability of mean concentrations and isotopic ratios was assessed using descriptive statistics, and significant differences between groups were evaluated using Student’s t-tests and one-way ANOVA were appropriate, with a significance level of p < 0.05. The resulting p-values and confidence intervals are reported in the relevant results. Detailed QA/QC data, statistical outputs, and supplementary geostatistical plots are provided in the Supplementary Materials.
4. Results and Discussion
4.1. CTD Data Analysis
Following data collection, the vertical profiles of Temperature (T) and Salinity (S) from each station were analyzed. Following the methodology of [8], the presence of South Atlantic Central Water (SACW) was identified by observing the intervals 6 °C < T < 20 °C and 34.6 PSU < S < 36 PSU. In this region, as mentioned previously, two sampling campaigns were conducted: one in March 2011 and another in July 2011.
4.1.1. Ponta Leste Campaign (PTL)
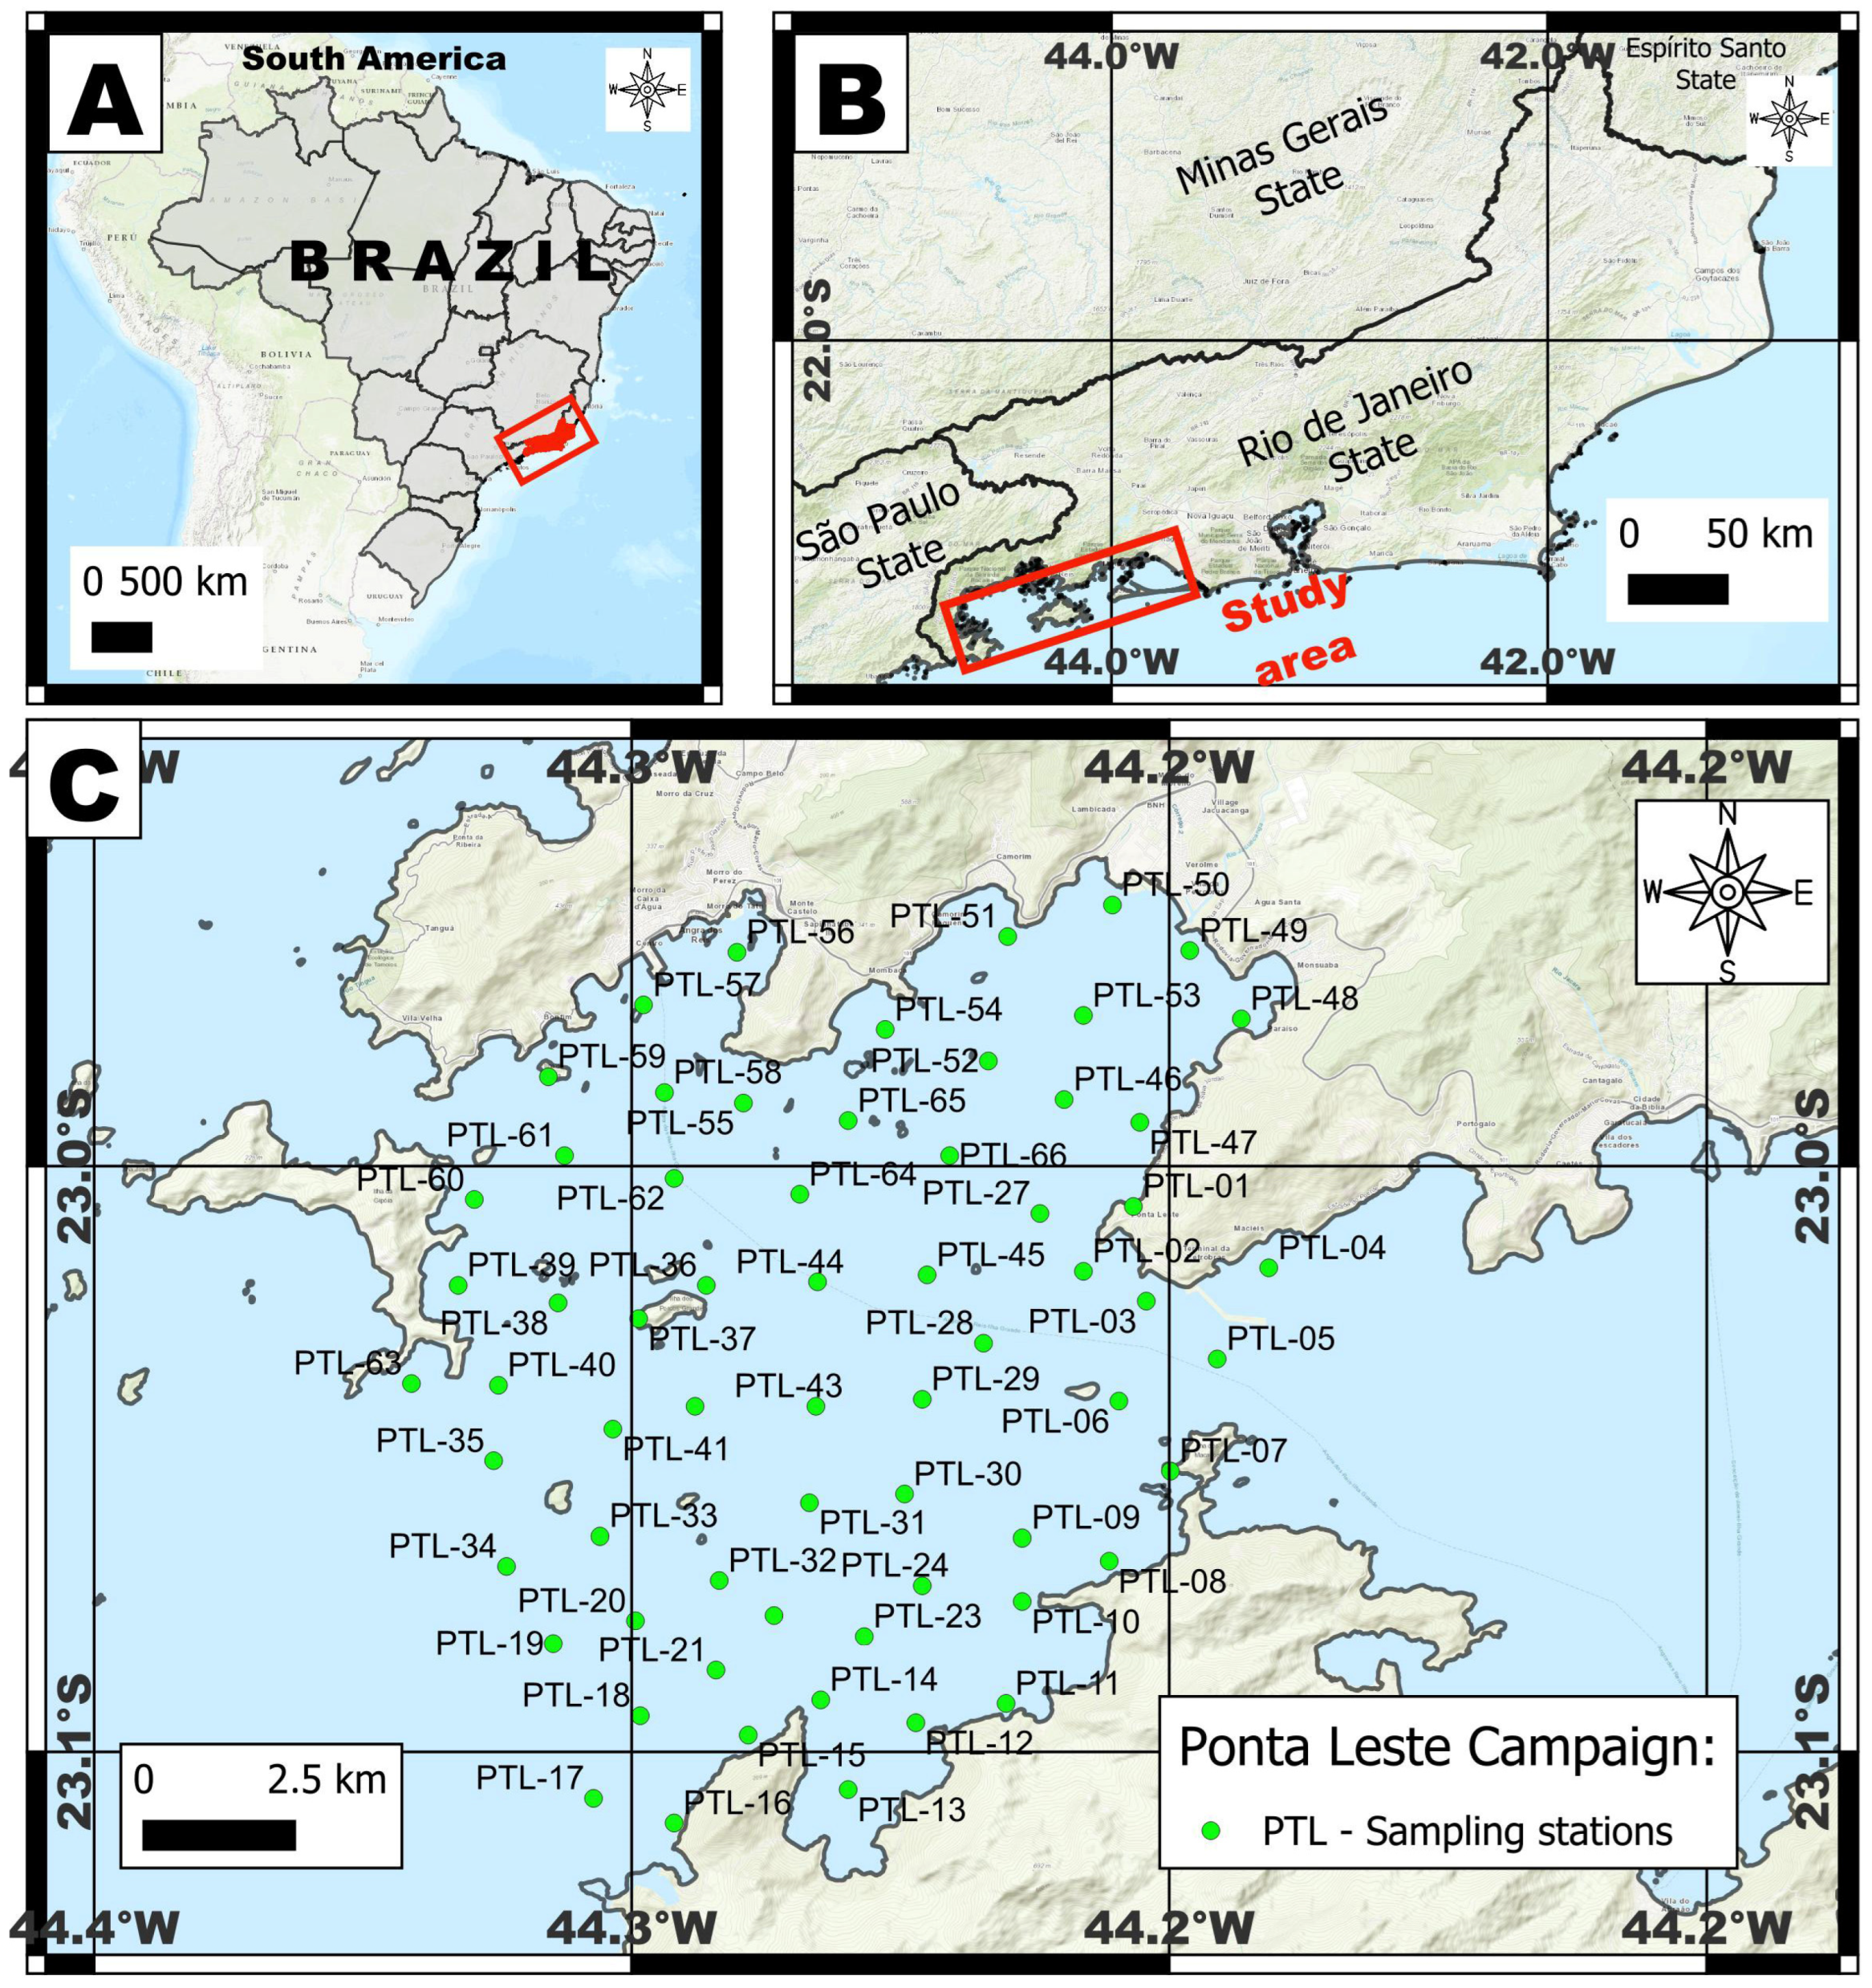
The PTL campaign was completed over three days (29–31 July 2011), resulting in a total of 66 stations (Figure 6). On 29 July, stations PTL01 through PTL26 were completed. The following day, 30 July, stations PTL27 to PTL34 and PTL36 to PTL46 were sampled. On the final day, PTL35 and stations PTL47 to PTL66 were completed. The minimum depth recorded was at station PTL56 (5.09 m), and the maximum depth was at PTL06 (46.23 m). The lowest salinity was 30.77 PSU at PTL49, and the highest was 35.76 PSU at PTL33. Regarding temperature, the minimum was 20.29 °C at PTL17, and the maximum was 22.93 °C at PTL19.
Figure 6.
(A) Study area in South America; (B) study area in Rio de Janeiro state; (C) location of the PTL sampling stations.
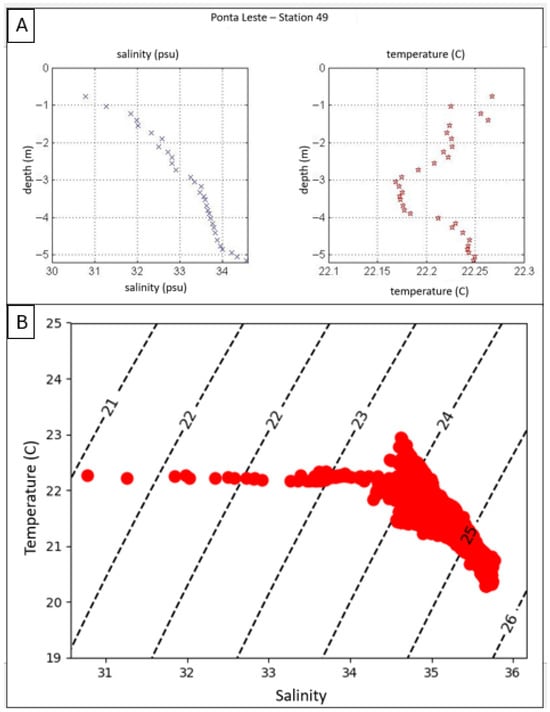
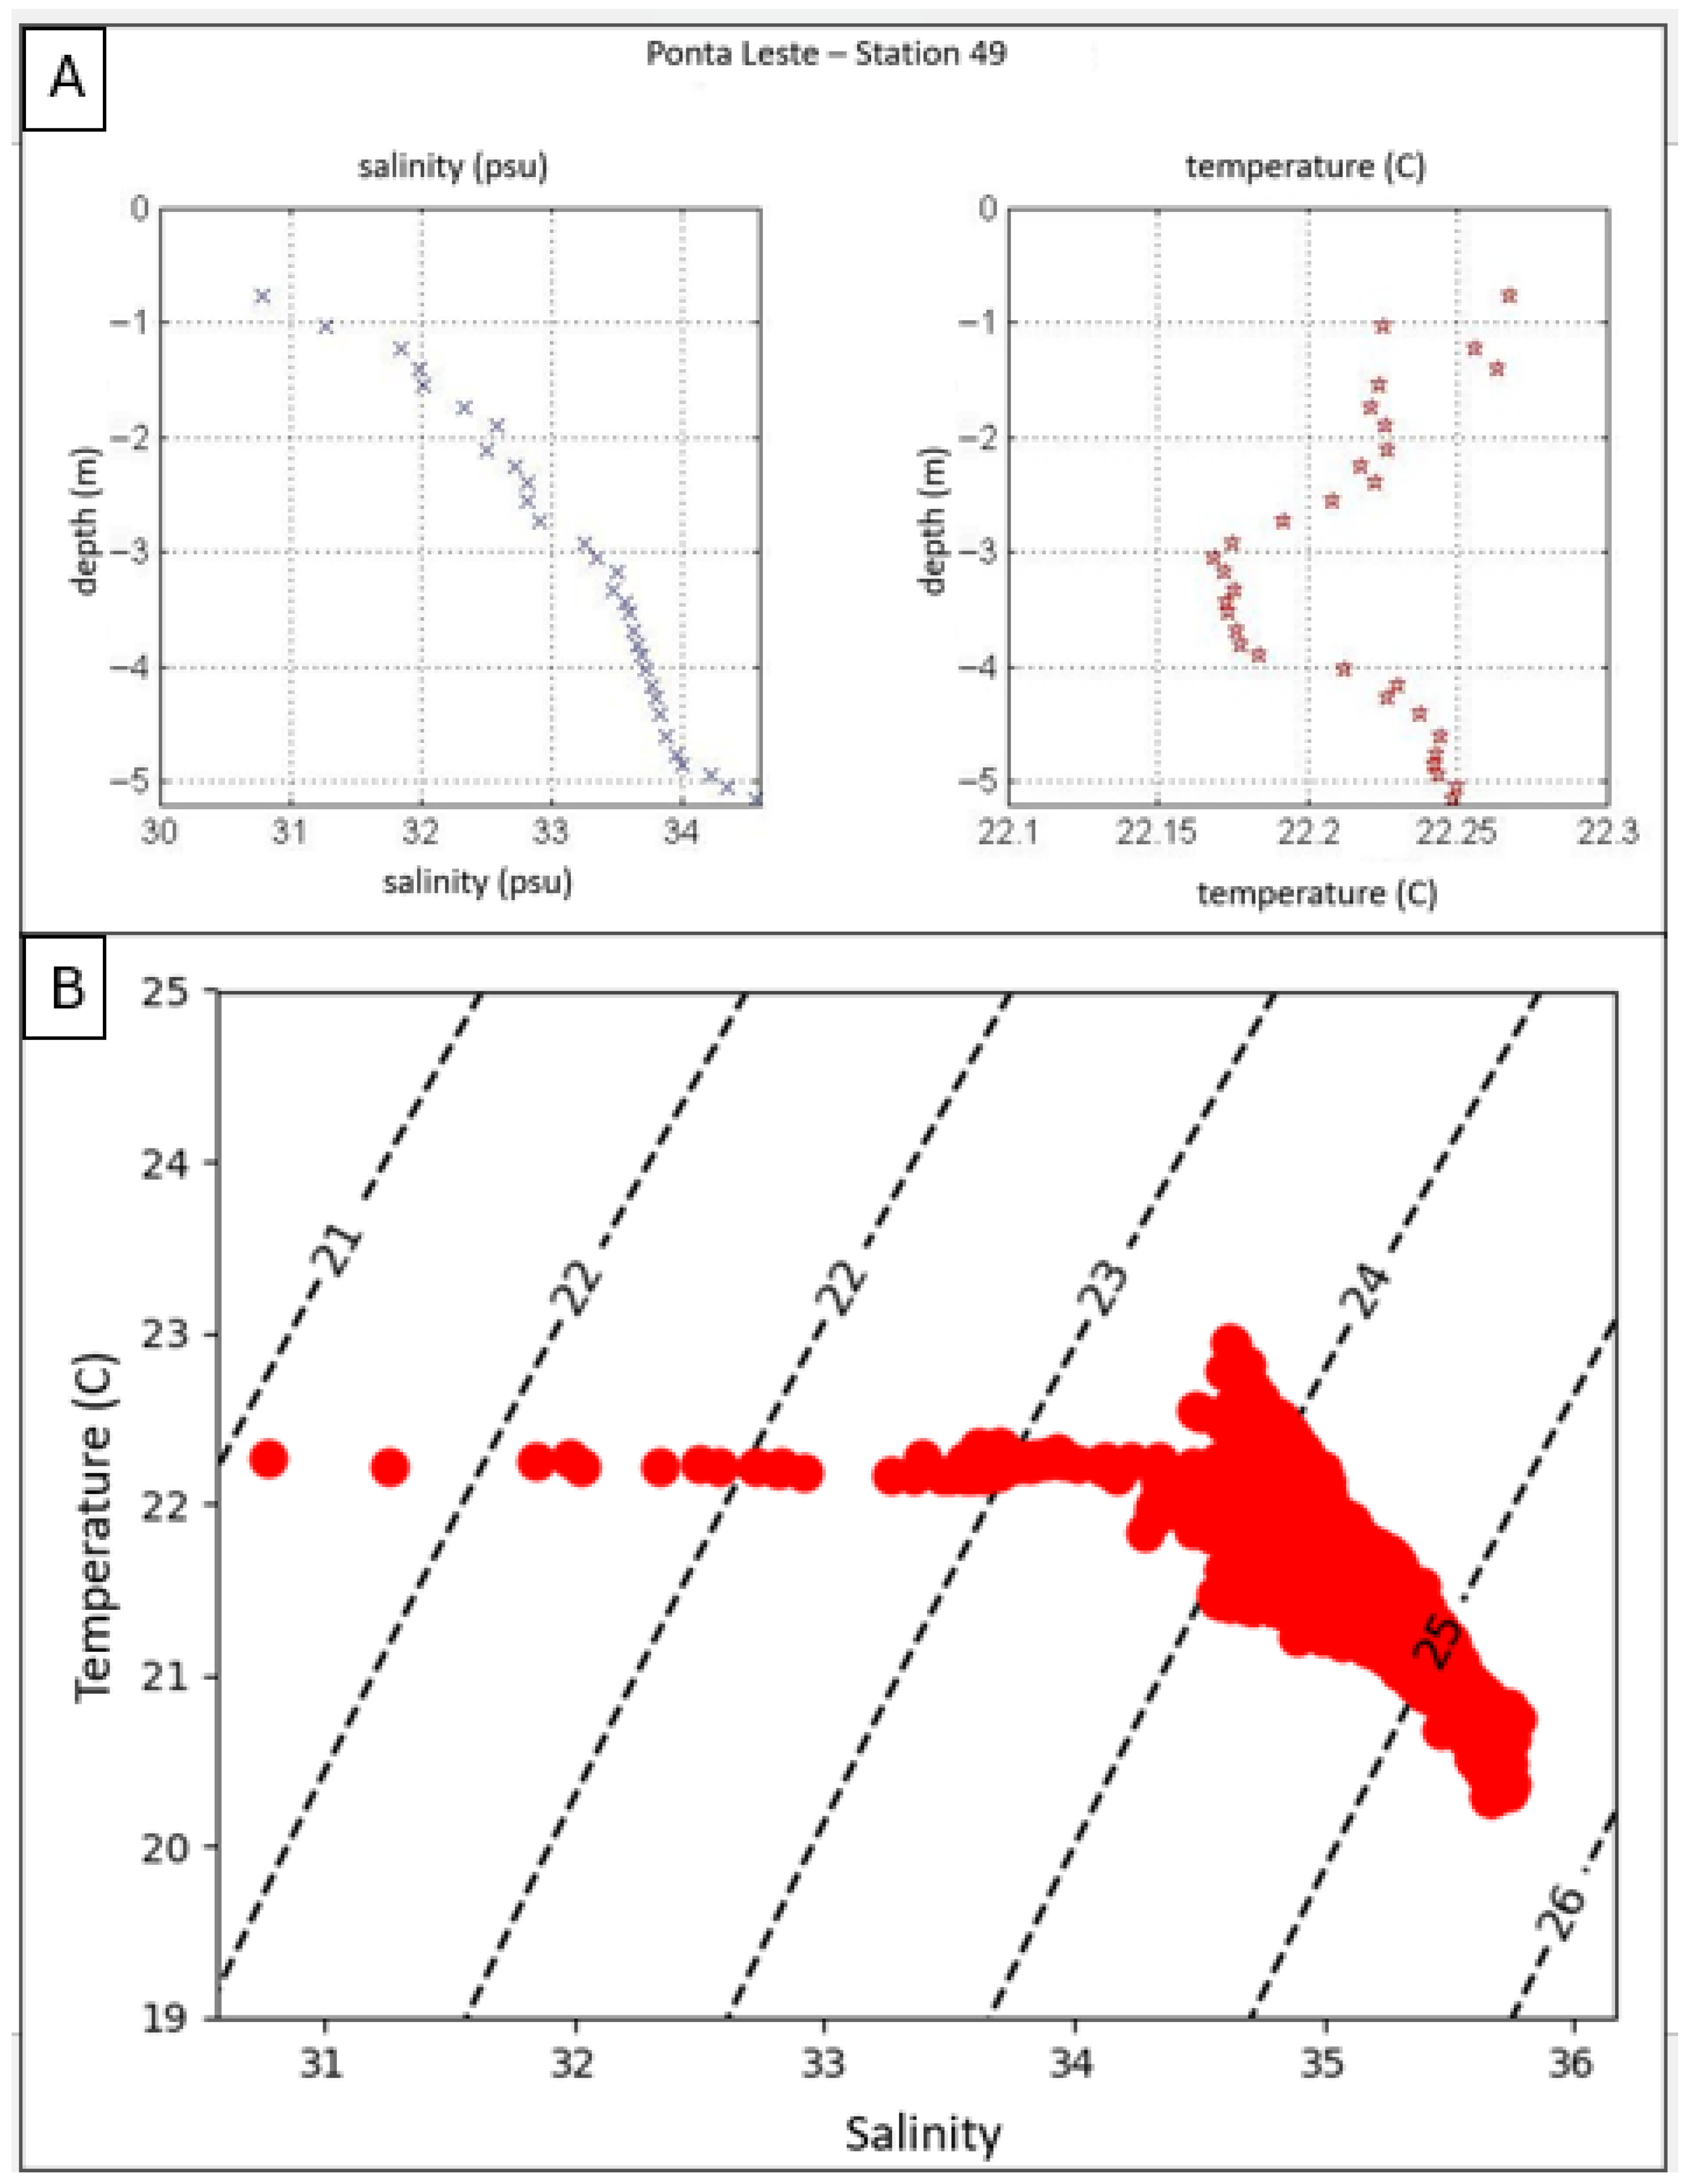
An analysis of the salinity profile for PTL49 (Figure 7) reveals a significantly lower surface salinity compared to the results from adjacent stations. This is attributed to the station’s location directly at the mouth of the Jacuecanga River, thus receiving considerable freshwater input. The salinity and temperature parameters did not indicate the presence of SACW at any station.
Figure 7.
(A) Salinity and temperature at station PTL49; (B) TS diagram containing data from all PTL stations. No SACW occurrence is observed.
4.1.2. Baía Da Ribeira Campaign (BAR)
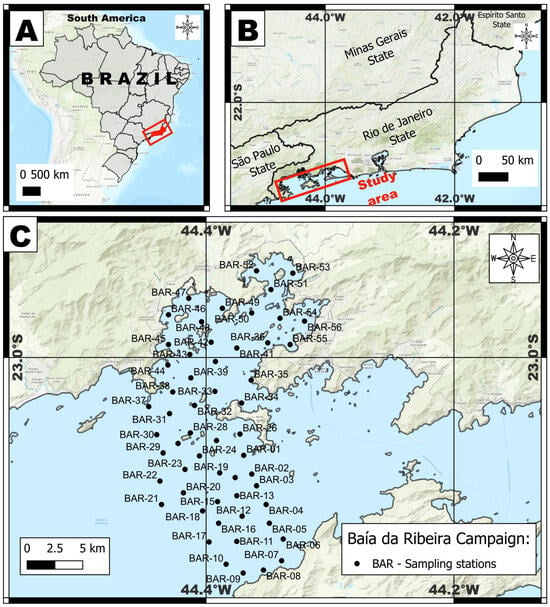
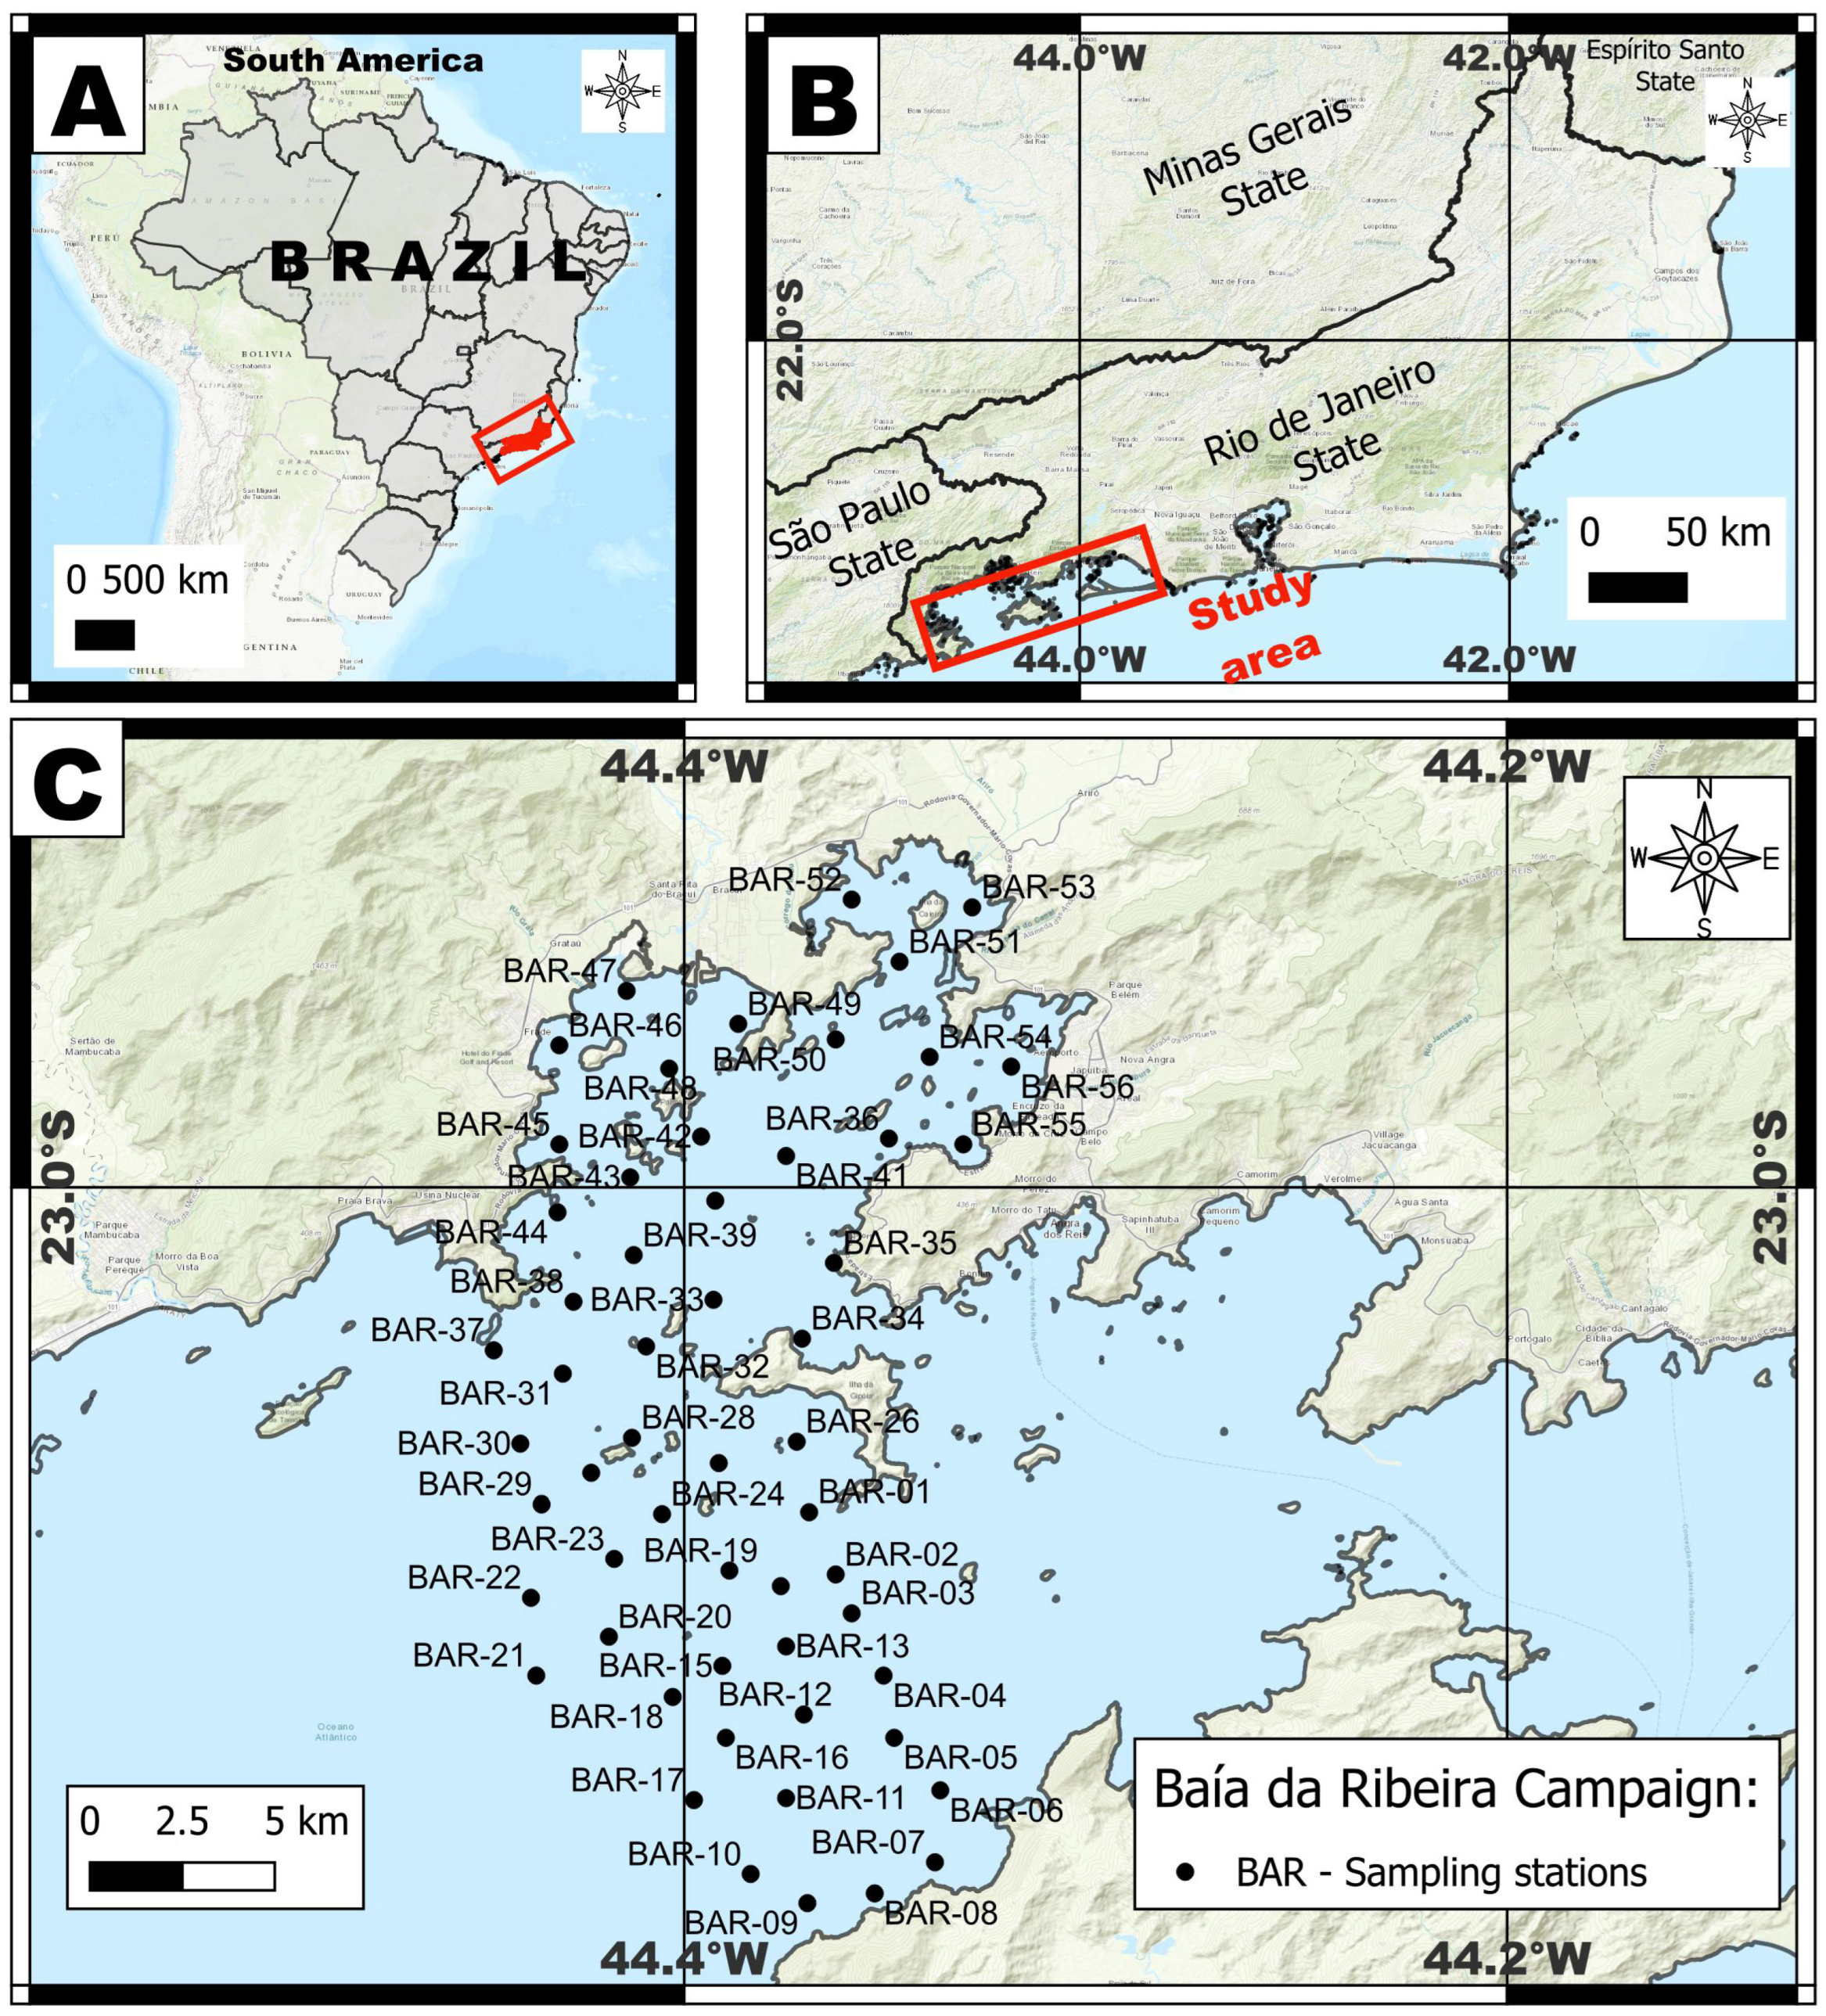
The sampling campaigns in Ribeira Bay resulted in 56 sampling stations (Figure 8), conducted on 10–12 August 2011. On the first day, stations BAR01 through BAR19 were completed. On the second day, stations BAR20 through BAR36 were sampled, and on the final day, stations BAR37 through BAR56 were sampled. Station BAR47 recorded the shallowest depth at 4.29 m, while the greatest depth was found at BAR10 (28.18 m). The lowest salinity was 31.9 PSU at BAR47, and the highest was 36.3 PSU at BAR44. The minimum temperature observed was 20.5 °C at BAR17, and the maximum was 26.2 °C at BAR44.
Figure 8.
(A) Study area in South America; (B) study area in Rio de Janeiro state; (C) location of the BAR sampling stations.
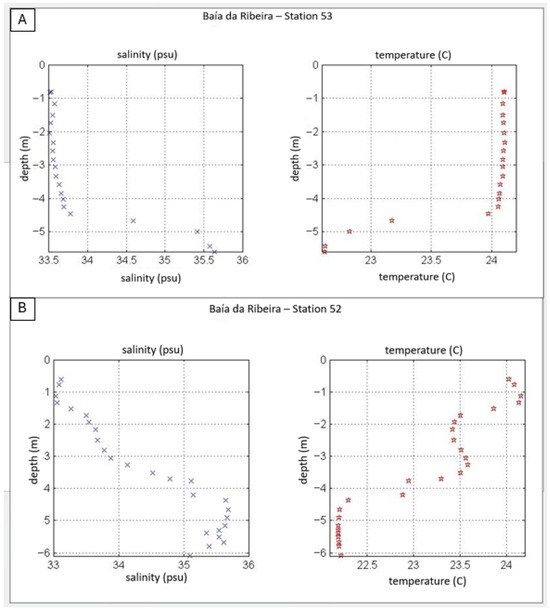
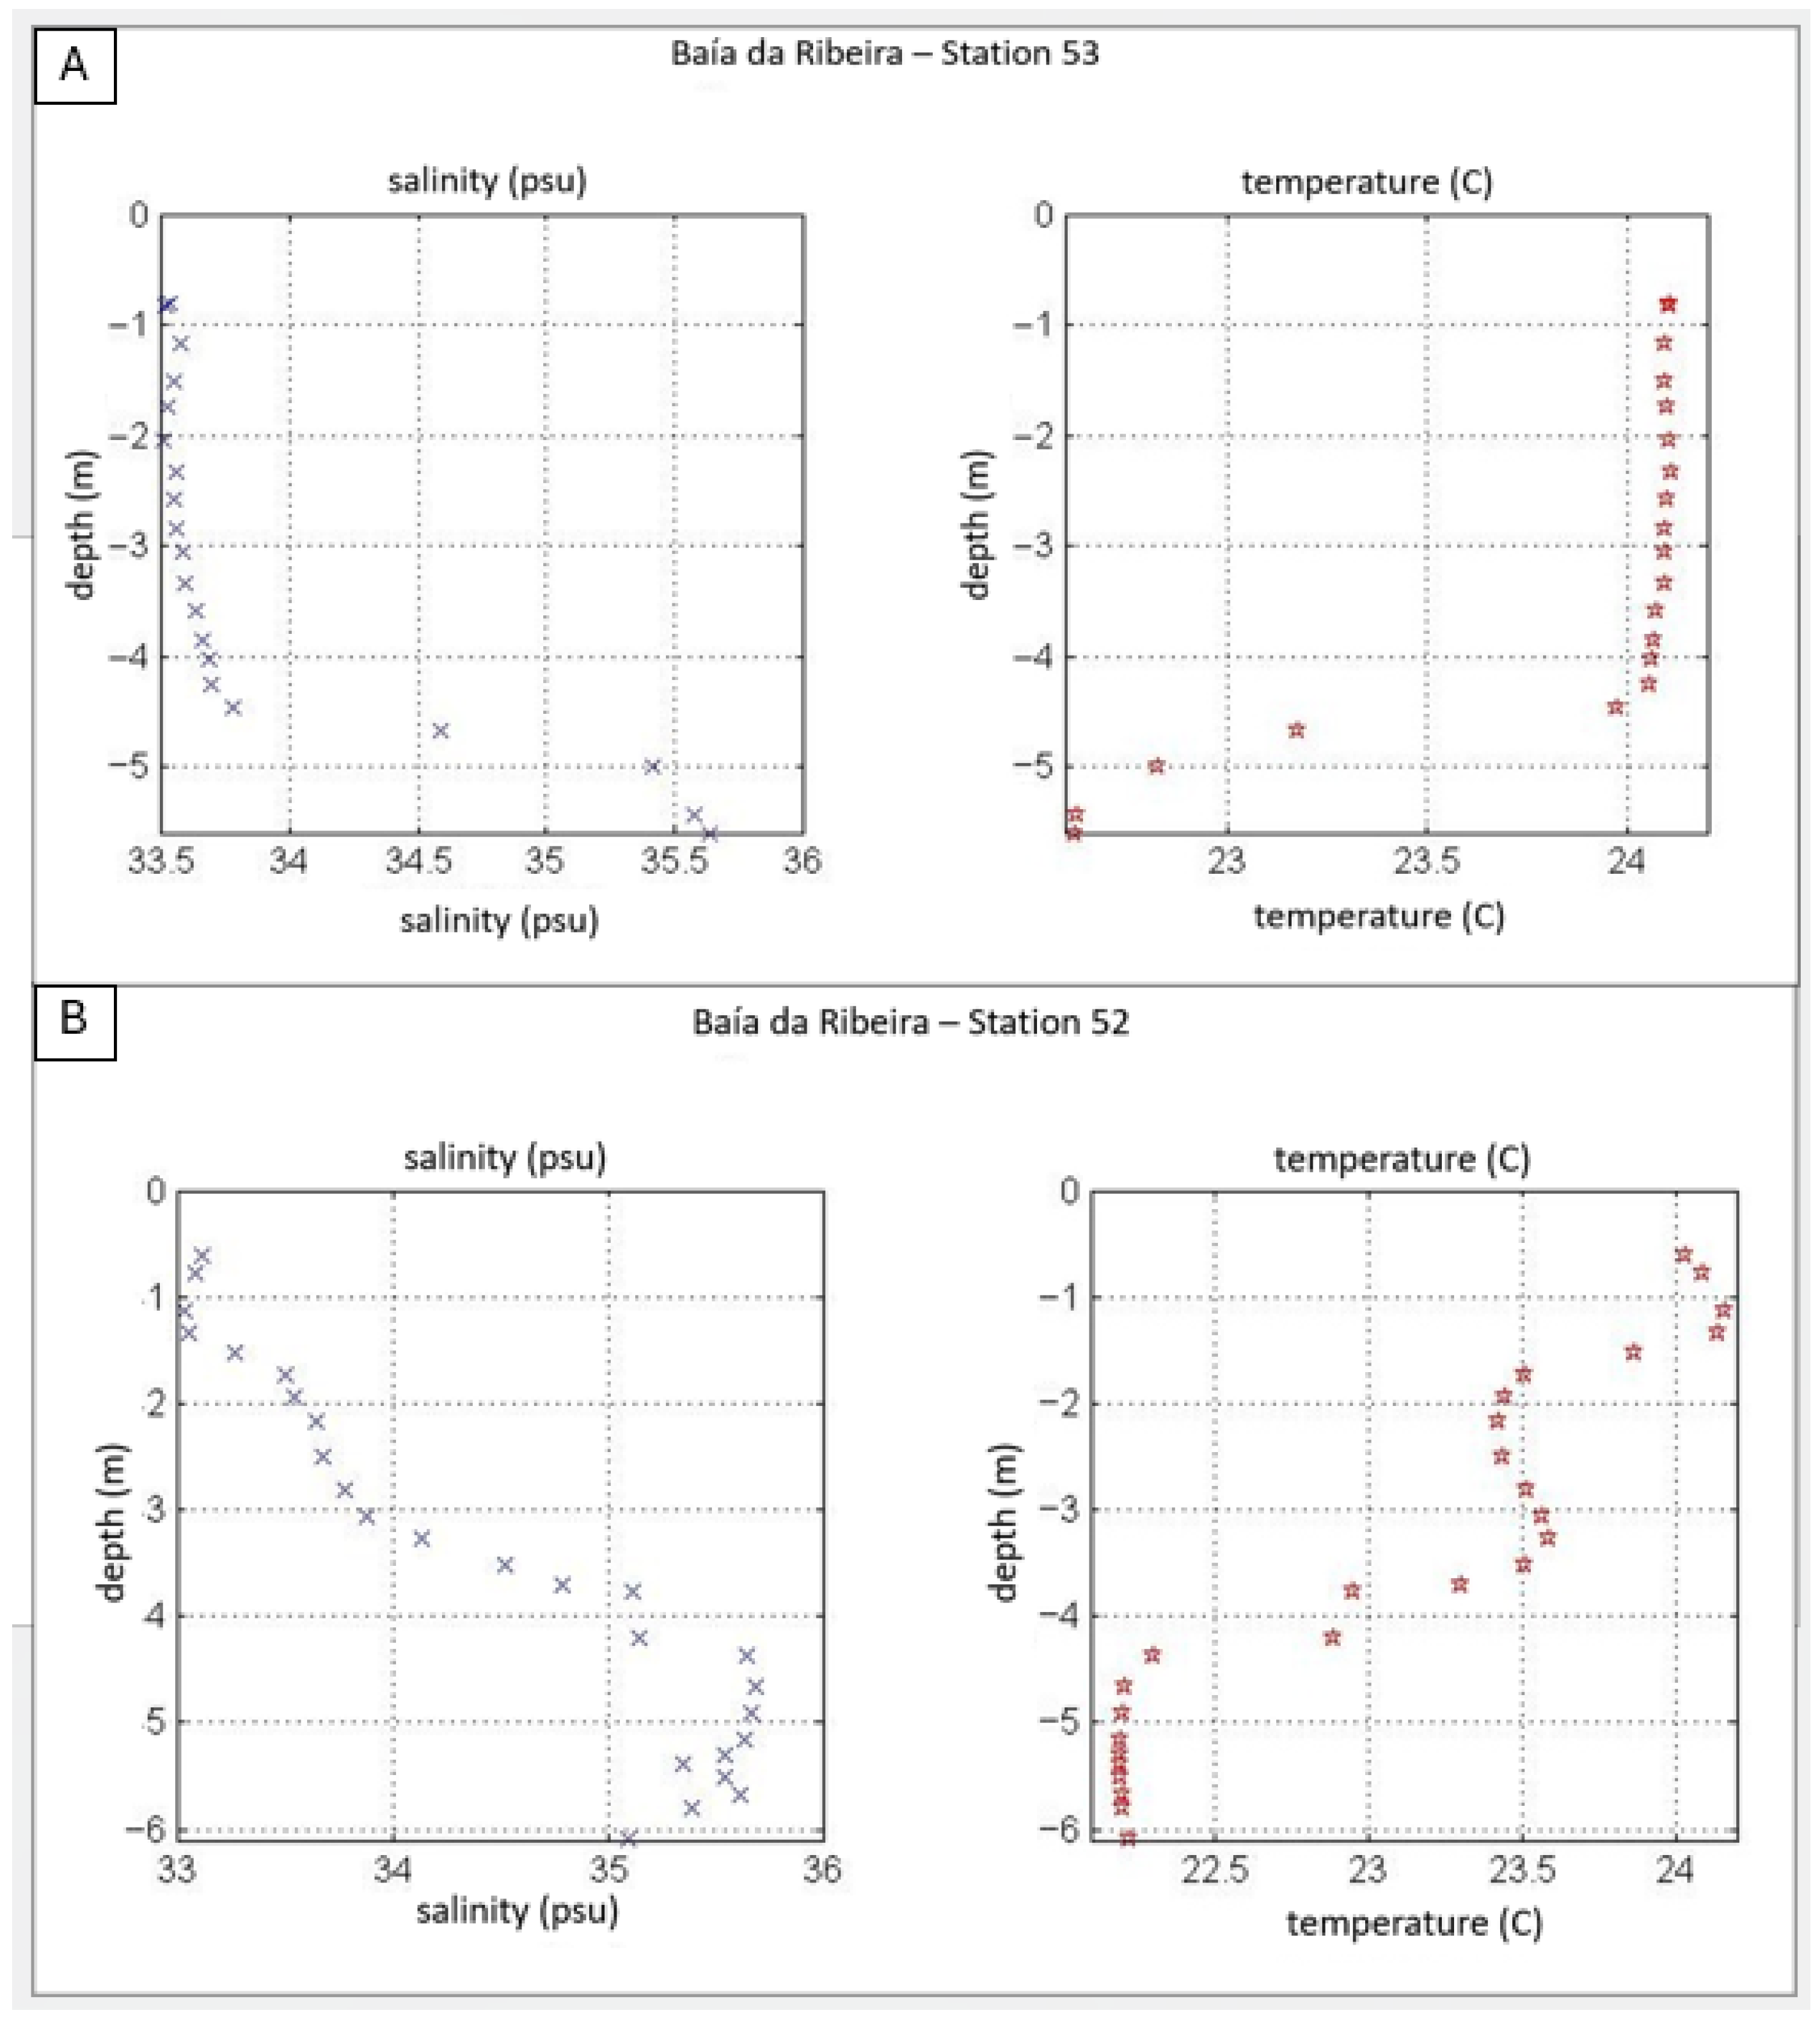
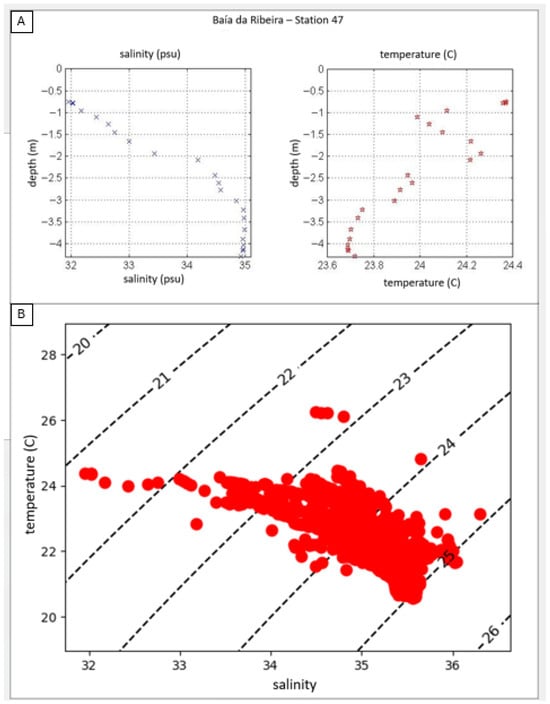
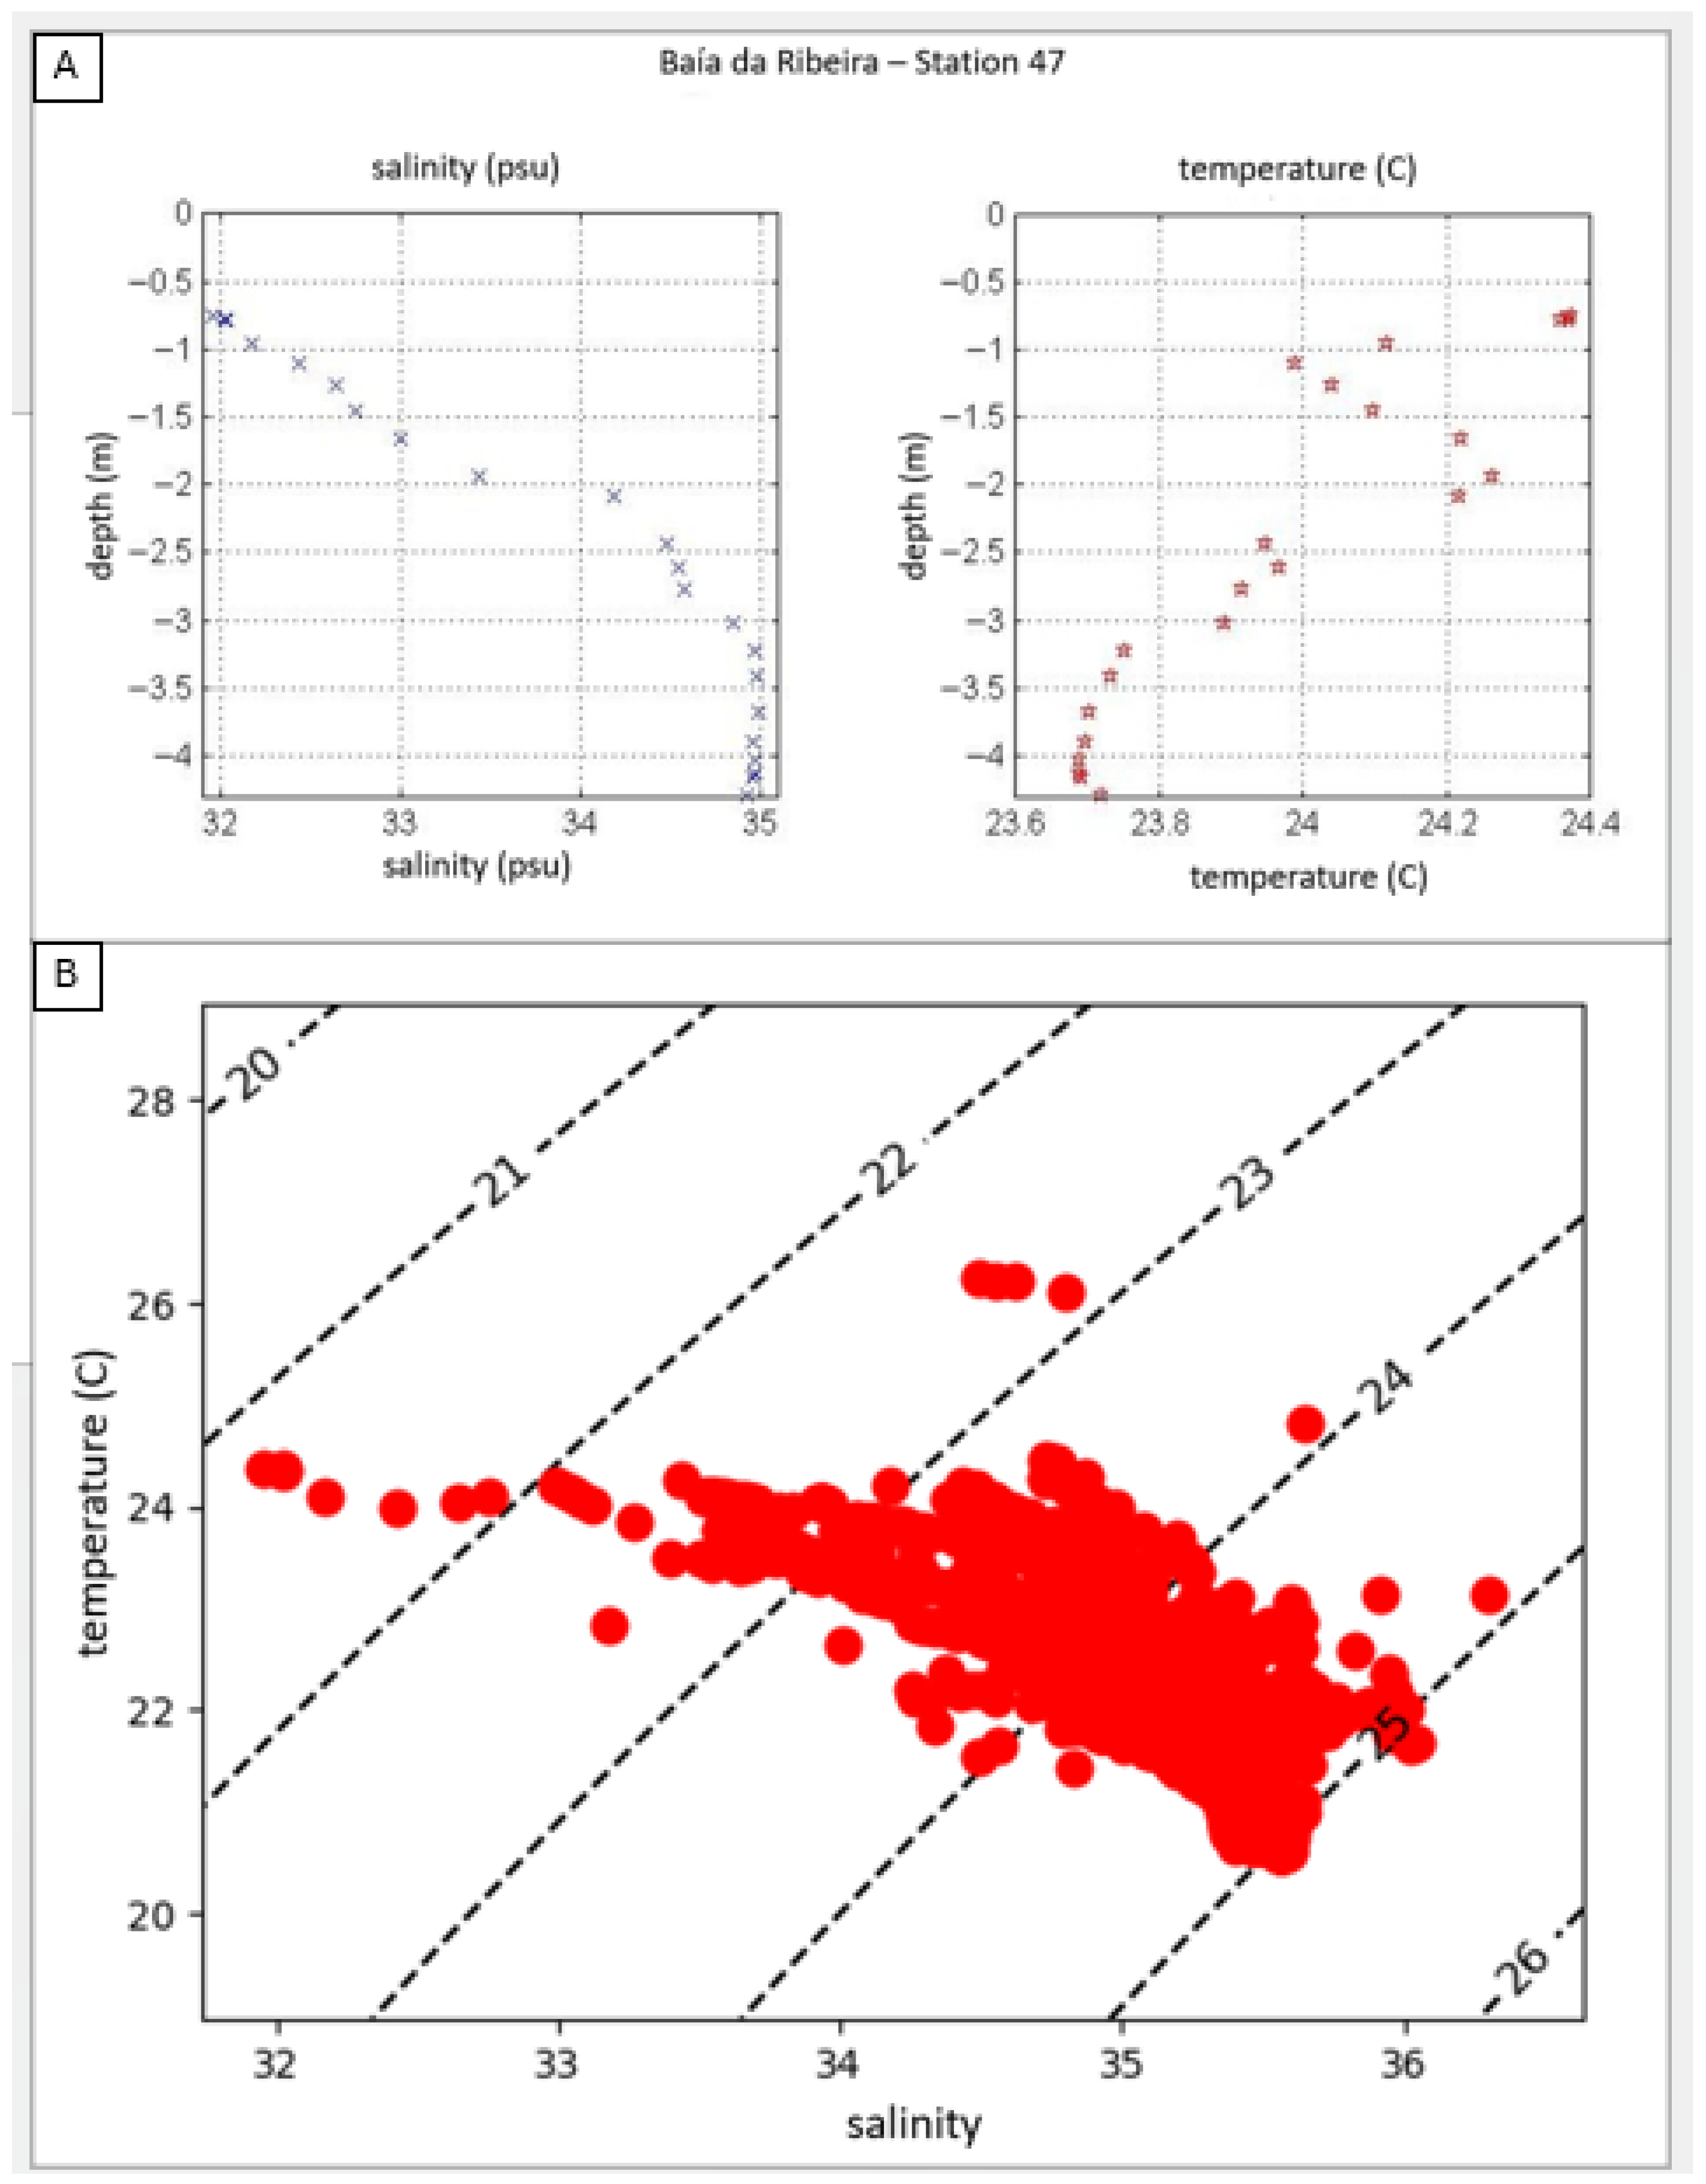
Low salinity values of 33.0 PSU and 33.5 PSU were found at BAR52 and BAR53, respectively (Figure 9). These stations are located very close to the shore, where the influence of river discharges, such as from the Ariró and Jurumirim Rivers, can be observed. Analysis of the profiles from BAR47 (Figure 10) shows a markedly lower surface salinity, which can be attributed to the influence of the Grataú and Bracuí river mouths, which discharge into the region on either side of this station.
Figure 9.
(A) Salinity and temperature at station BAR53; (B) salinity and temperature at station BAR52.
Figure 10.
(A) Salinity and temperature at station BAR47; (B) TS diagram containing the data from all BAR stations. No SACW occurrence is observed.
As mentioned previously, the lowest temperature recorded was 20.5 °C. Based on this parameter alone, it can be concluded that South Atlantic Central Water (SACW) was not present in the region, as it is characterized by temperatures below 20.0 °C. This conclusion is corroborated by the T-S diagram for the region (Figure 10B).
4.1.3. Frade Campaign (FRD)
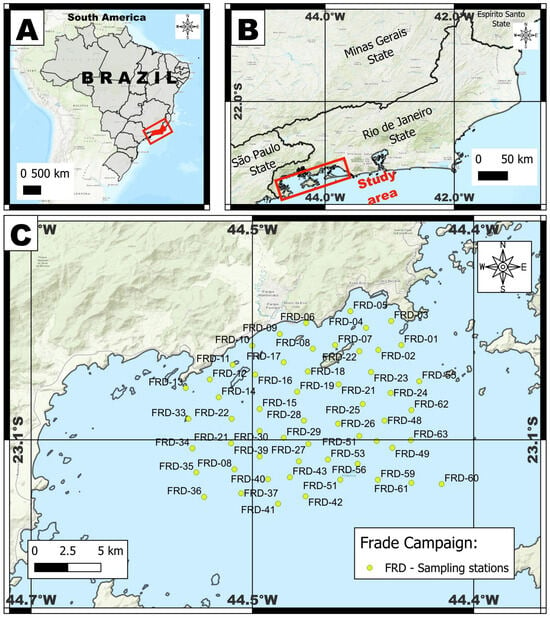
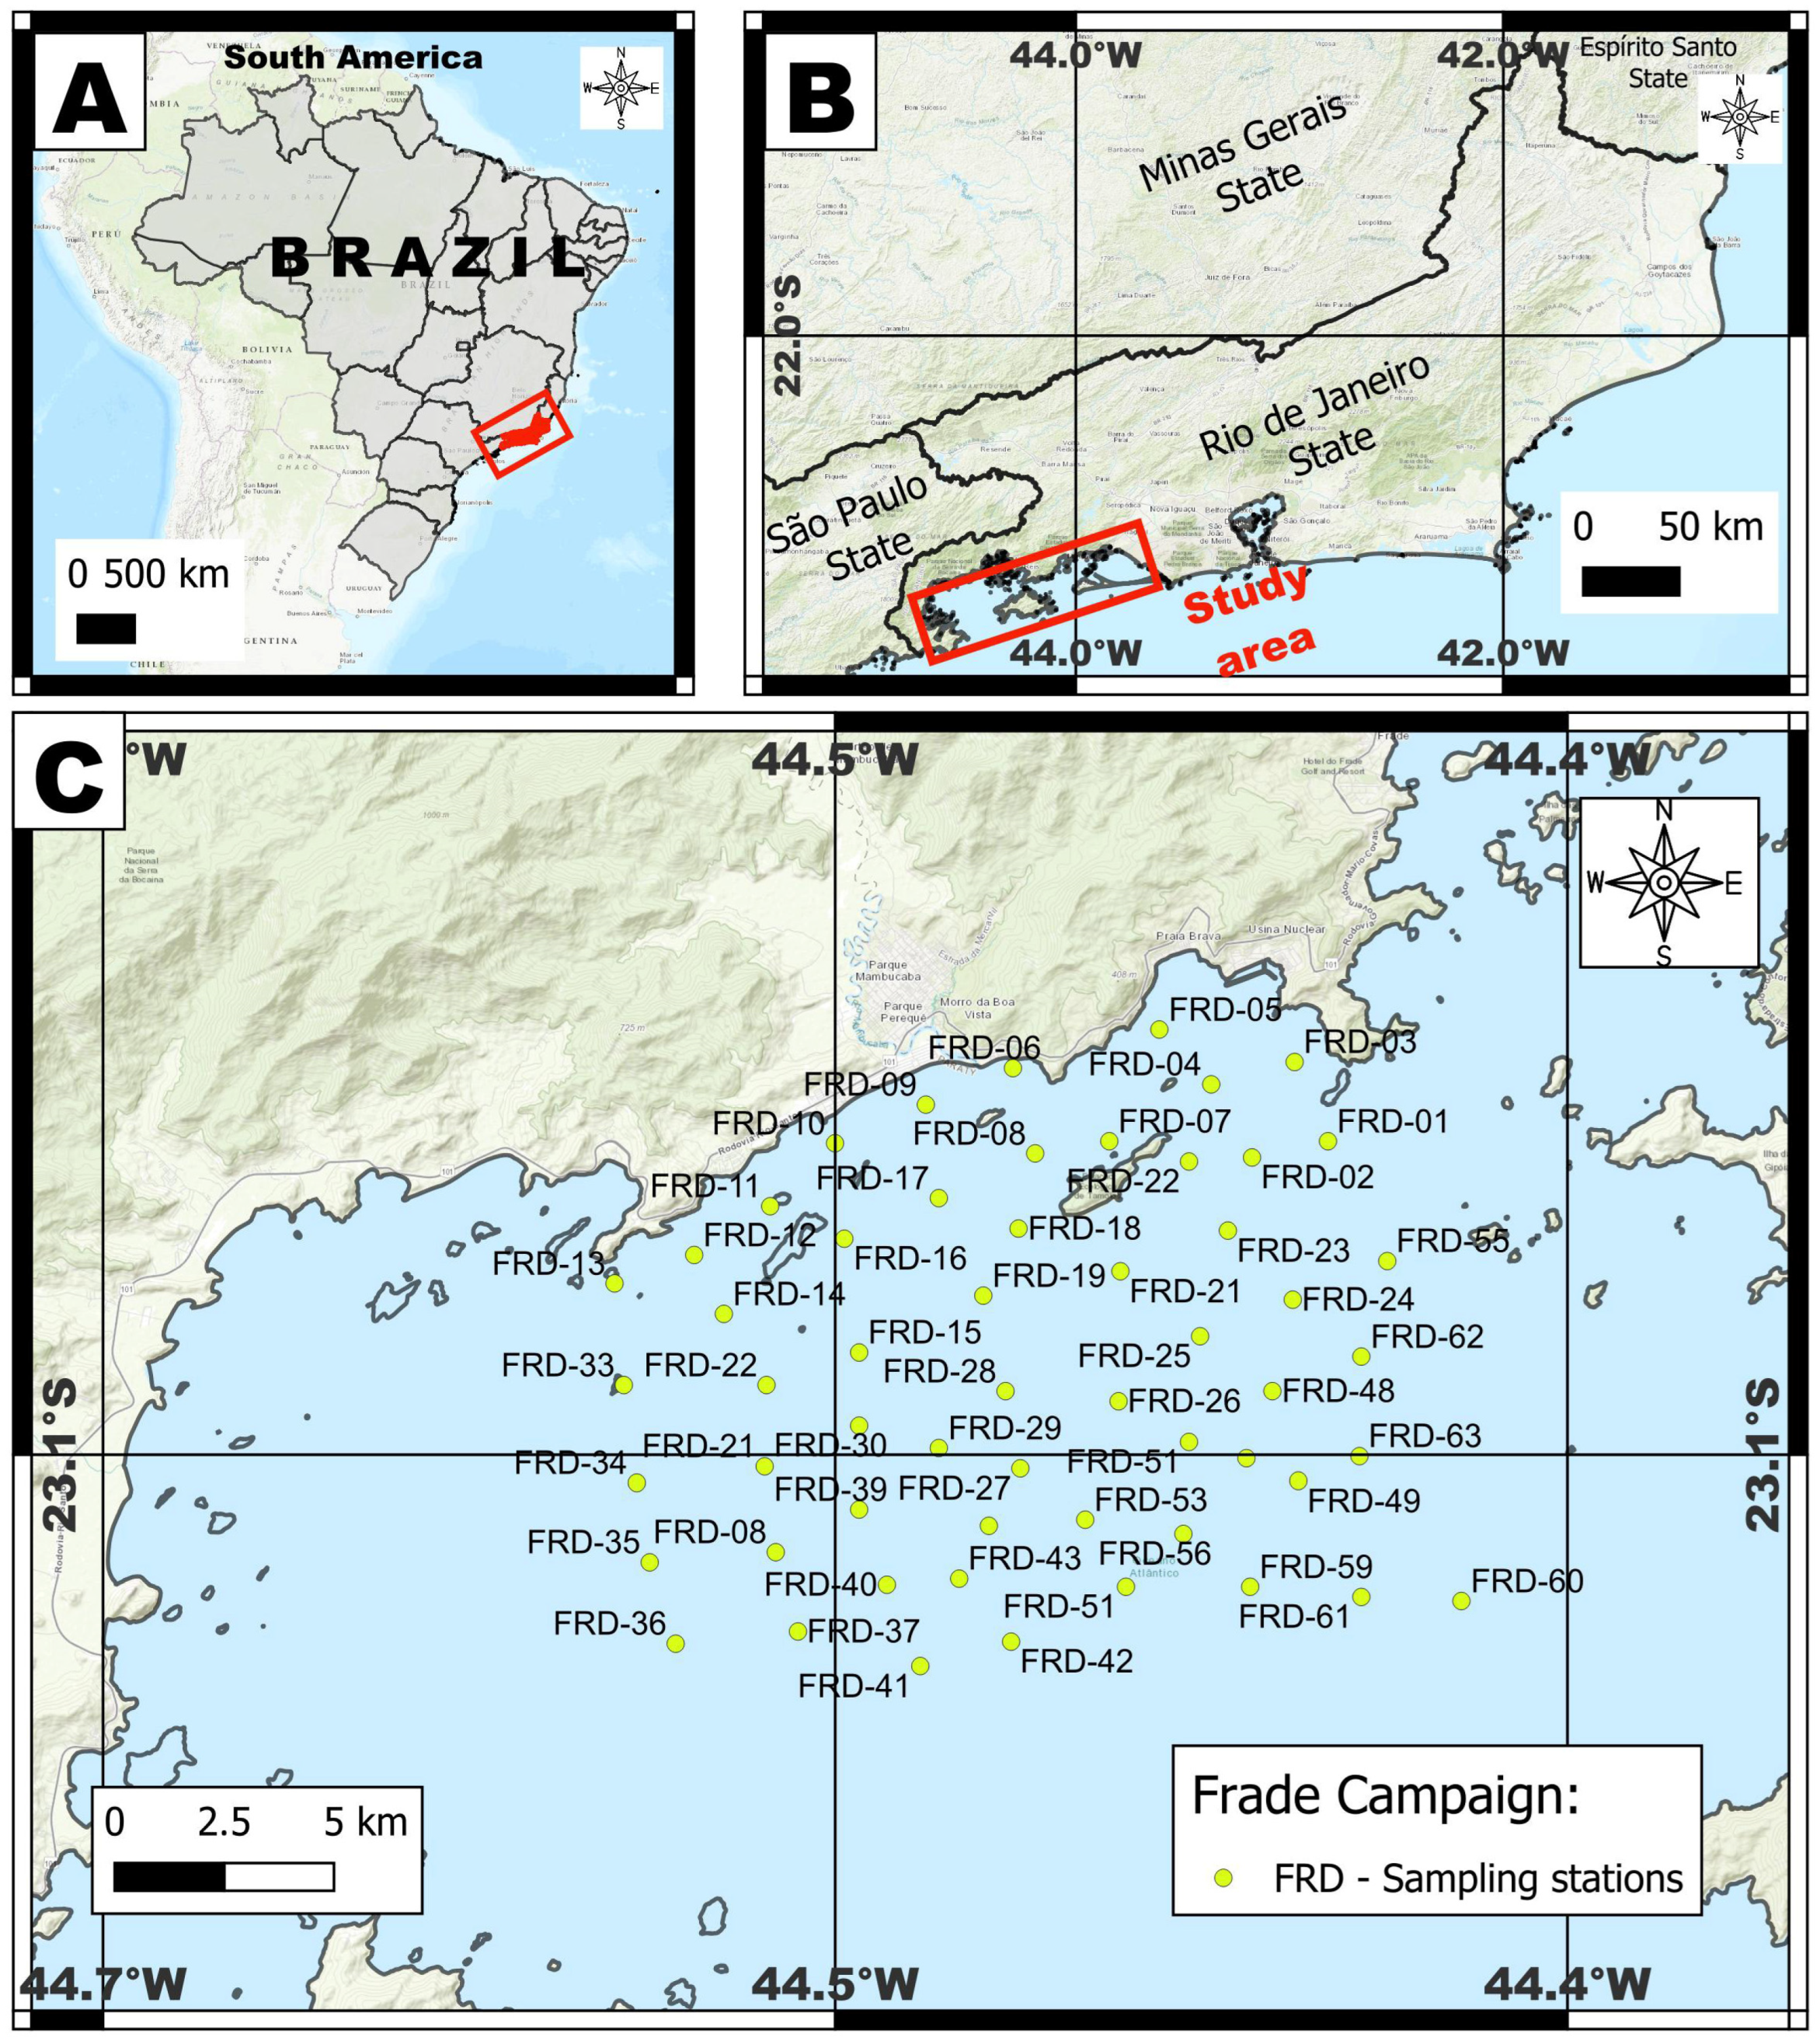
The sampling campaigns in Frade Bay resulted in 63 sampling stations (Figure 11), conducted on 24 January 2012, covering a coastal area with depths ranging from 5 to 22 m. Sea surface temperature exhibited relative spatial homogeneity, with values between 27.80 °C (FRD-09) and 28.62 °C (FRD-12). In contrast, minimum temperatures, recorded near the bottom, varied significantly among stations, ranging from 14.99 to 22.38 °C, consistent with its shallow maximum depth of 5.25 m, which limits the development of thermal stratification. The vertical thermal gradient was more pronounced at the deeper stations (FRD-18 and FRD-21), where the difference between surface and bottom temperatures reached up to 12.41 °C. This pattern is consistent with the formation of a seasonal thermocline in coastal regions with a sufficient water column.
Figure 11.
(A) Study area in South America; (B) study area in Rio de Janeiro state; (C) location of the FRD sampling stations.
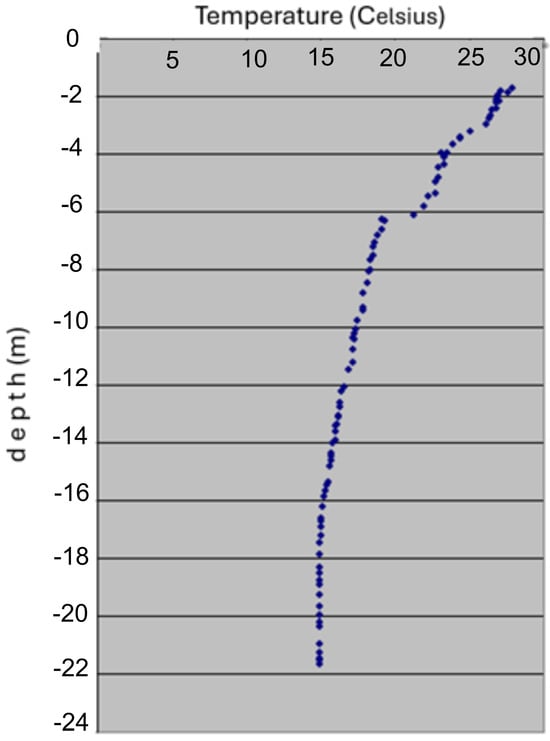
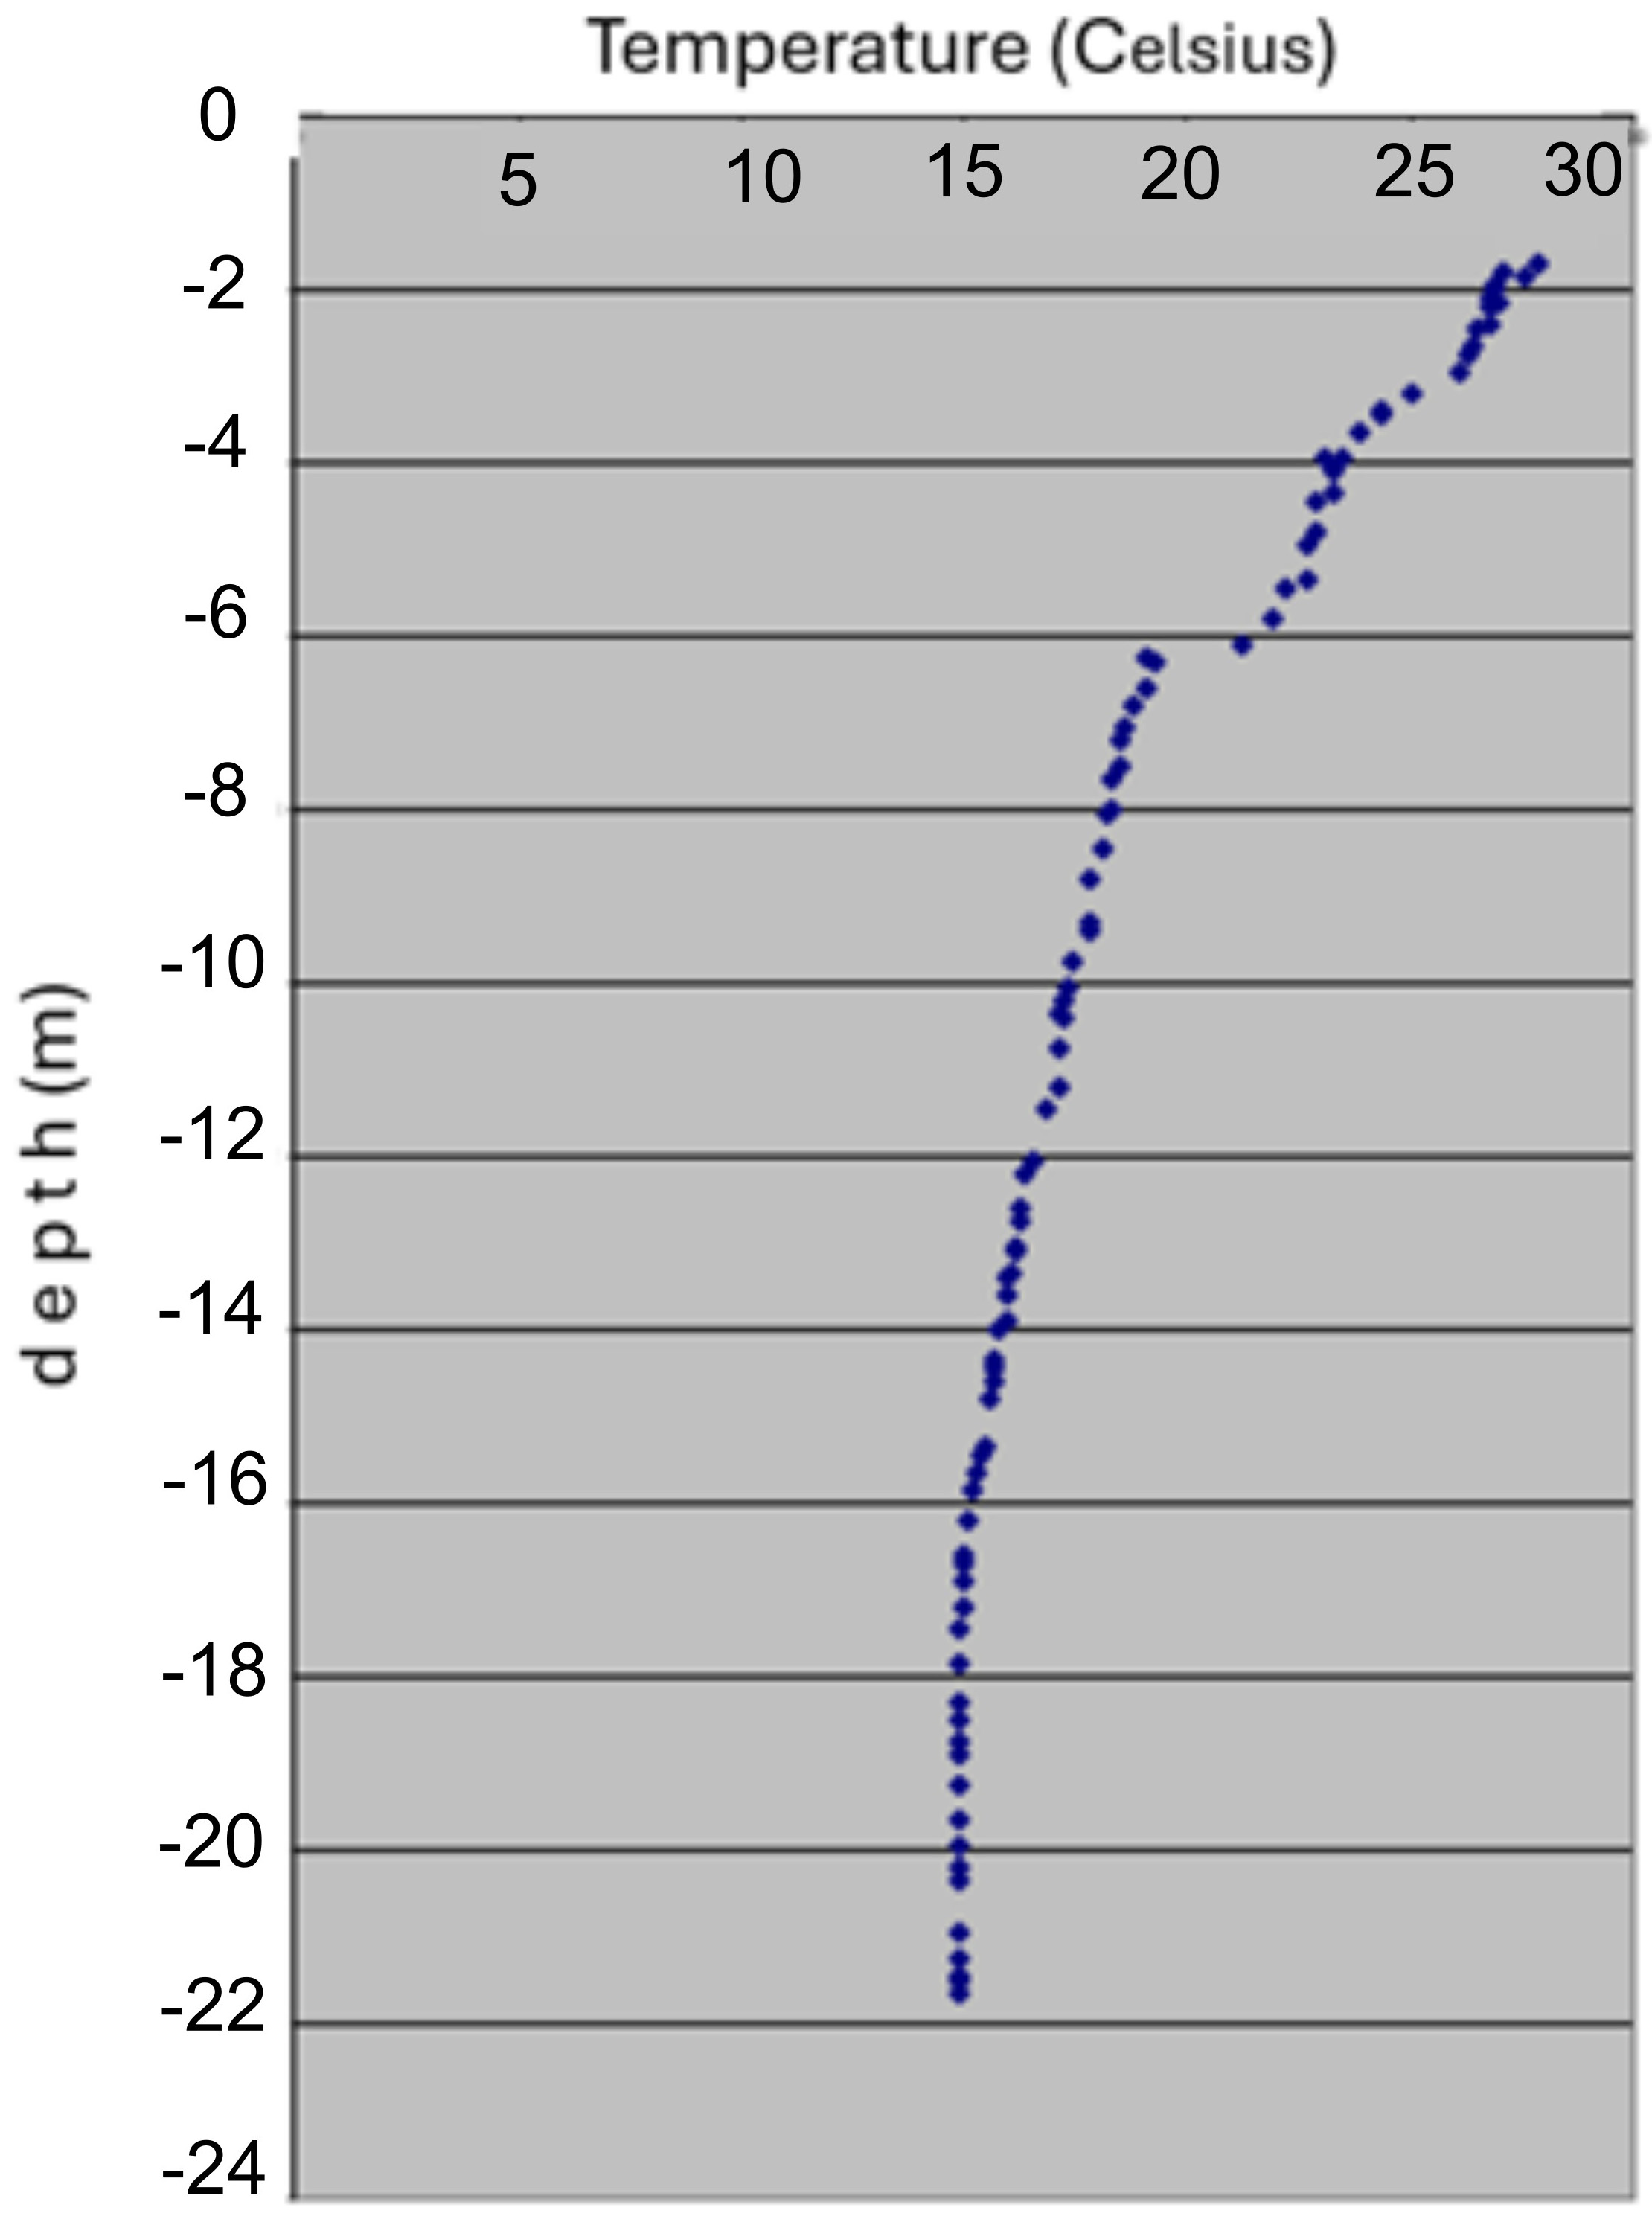
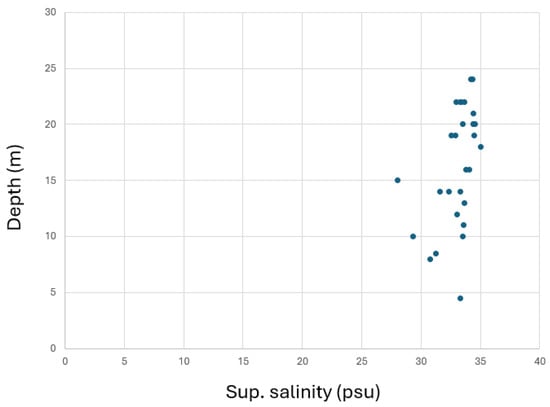
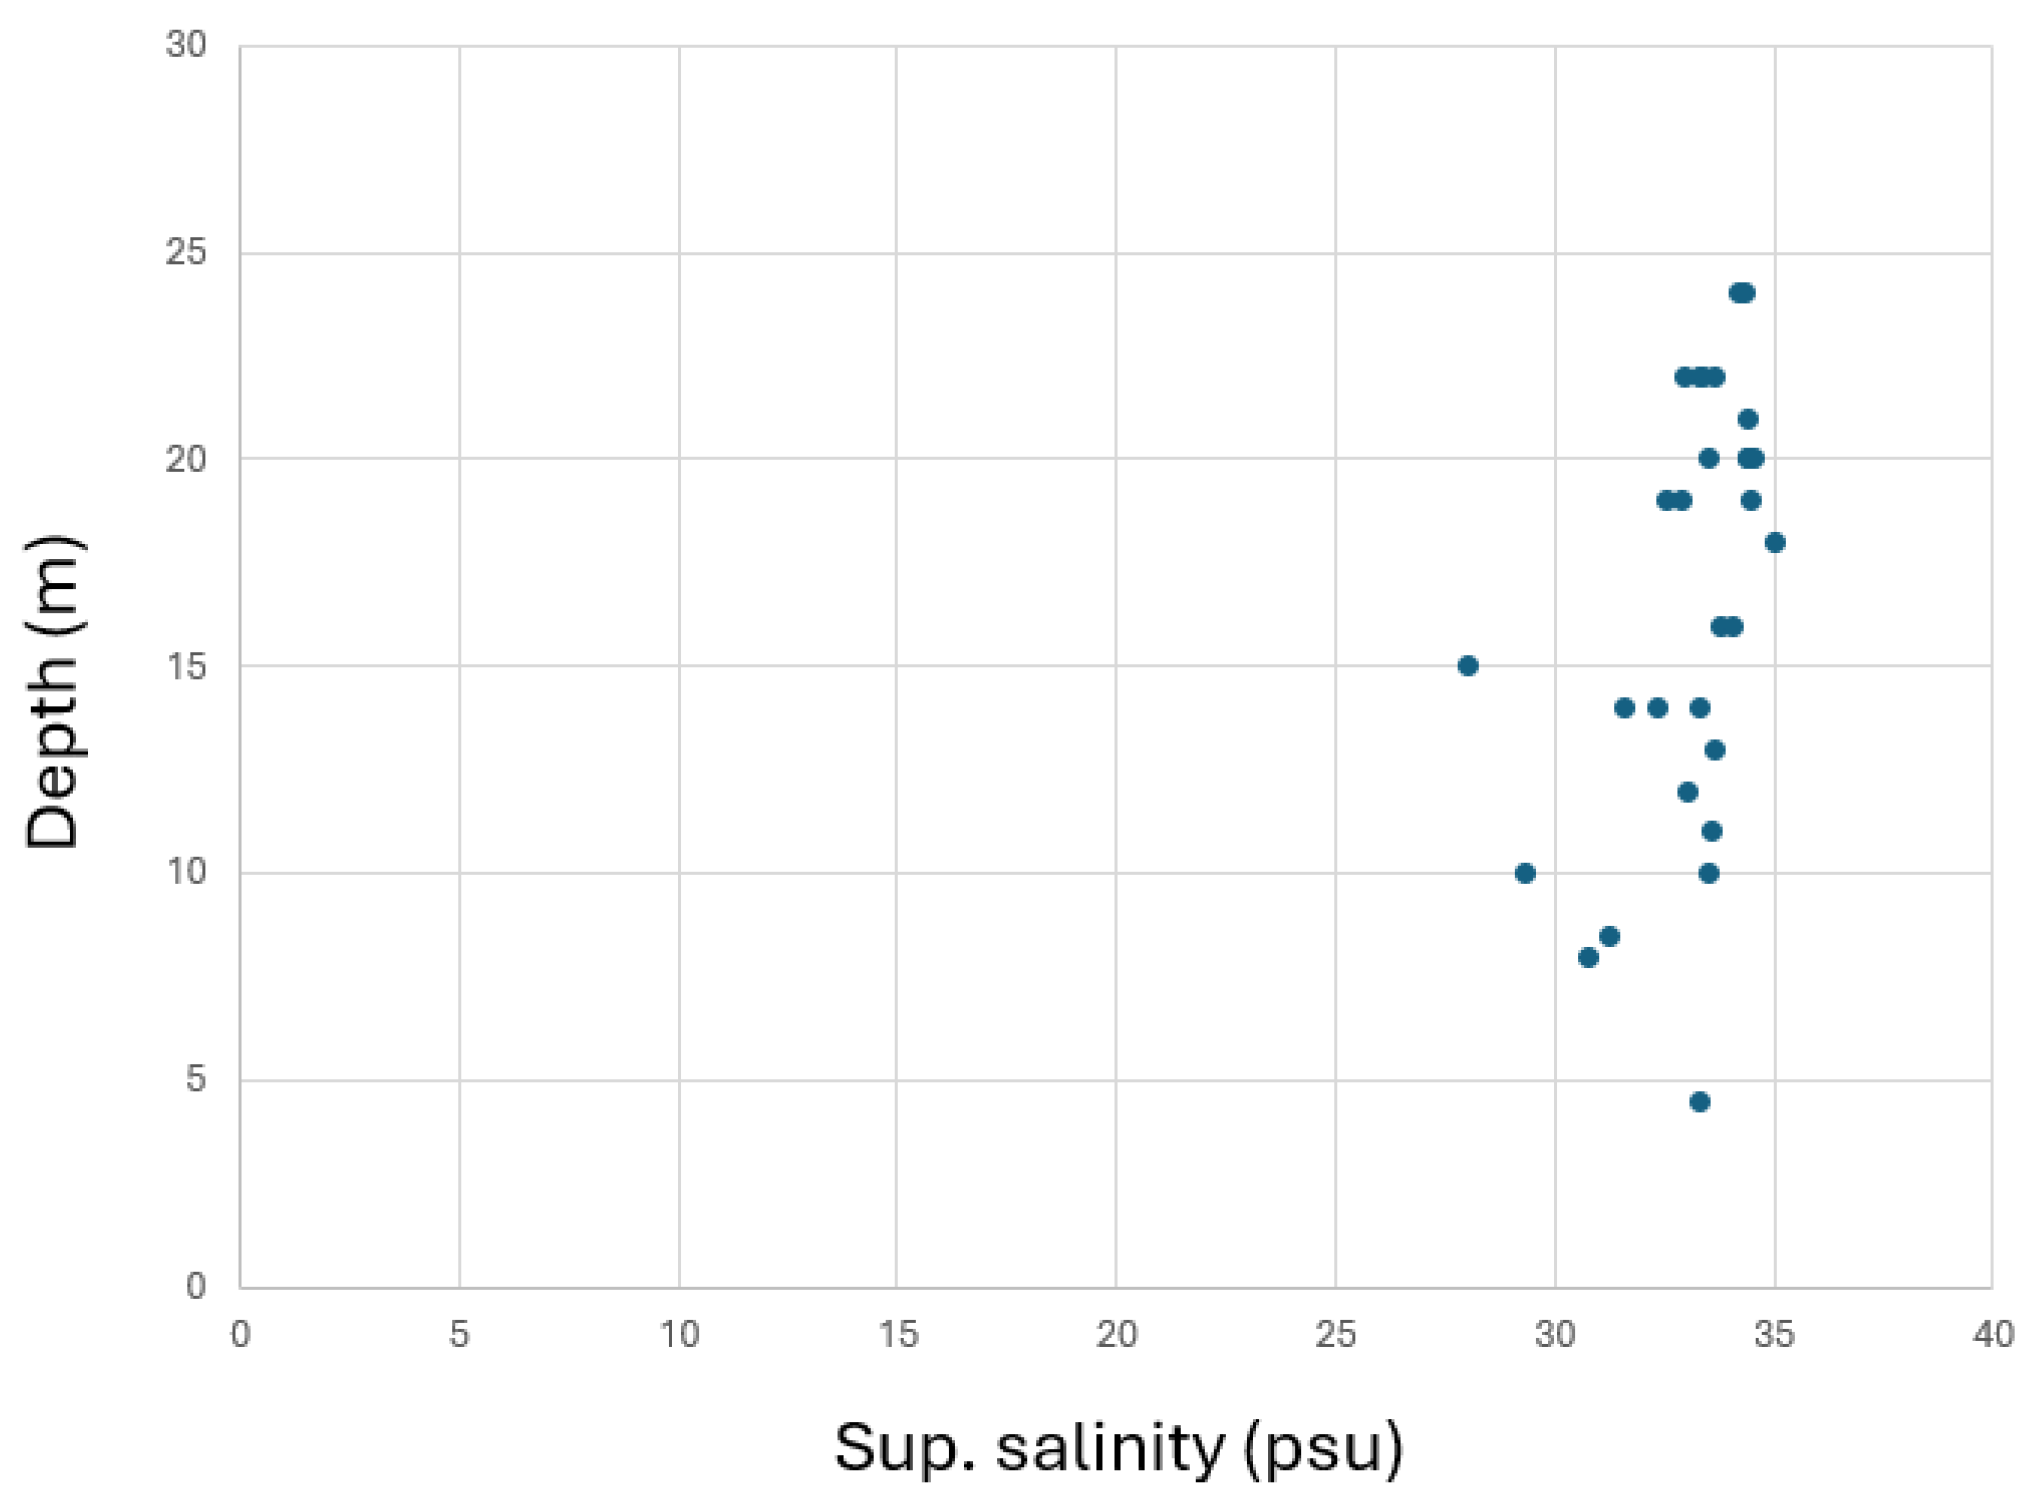
Surface salinity varied considerably (28.04 to 35.04 PSU), reflecting varying influences of continental freshwater inputs. Station FRD-14 showed the lowest surface value (28.04 PSU), suggesting proximity to a freshwater discharge. In contrast, station FRD-15 registered a high surface salinity (35.04 PSU), indicating the dominance of oceanic waters. At all stations, bottom salinity was higher than surface salinity, with values between 35.37 (FRD-21) and 36.14 (FRD-10). The high bottom salinity recorded at station FRD-10 (36.14 PSU) is not attributable to evaporation, which is a surface process. Instead, it is a direct signature of the intrusion of SACW. The SACW, which originates in the subtropical South Atlantic, is characterized by its high salinity (34.6–36) and low temperature (<20 °C). As this denser oceanic water mass intrudes onto the continental shelf, it subducts beneath the warmer, less saline surface waters, forming a distinct bottom layer. This creates the classic thermohaline stratification observed during the summer campaign, with a sharp pycnocline separating the two water masses [8]. Overall, nearly all stations exhibited temperatures below 20 °C in their deeper layers, as observed at stations FRD-02, FRD-03, and FRD-18 to FRD-21, with temperatures varying from 14.99 to 15.63 °C. These consistently cold bottom temperatures are related to the thermal range of the South Atlantic Central Water (SACW) and are significantly lower than the surface water (~28 °C). Furthermore, the bottom salinity at all stations fits within the SACW salinity range, according to [8], with representative values found at stations FRD-02 (35.38 PSU), FRD-03 (35.42), FRD-10 (36.14 PSU), and FRD-15 (35.47 PSU). These data reinforce the existence of a classic summer thermohaline stratification, characterized by a warm surface layer with high temperatures (T > 27 °C) and variable salinity (28 and 35 PSU), overlying a cold bottom layer with lower temperatures (T < 20 °C) and high salinity (S > 35.3 PSU). These characteristics coincide with the signature of the South Atlantic Central Water (SACW). Below is the depth and temperature diagram at the FRD-01 station (Figure 12), also salinity and temperature diagram for FRD-01 to FRD-30 (Figure 13).
Figure 12.
Temperature vs. depth at station FRD-01.
Figure 13.
Salinity and depth at stations FRD-01 to FRD-30.
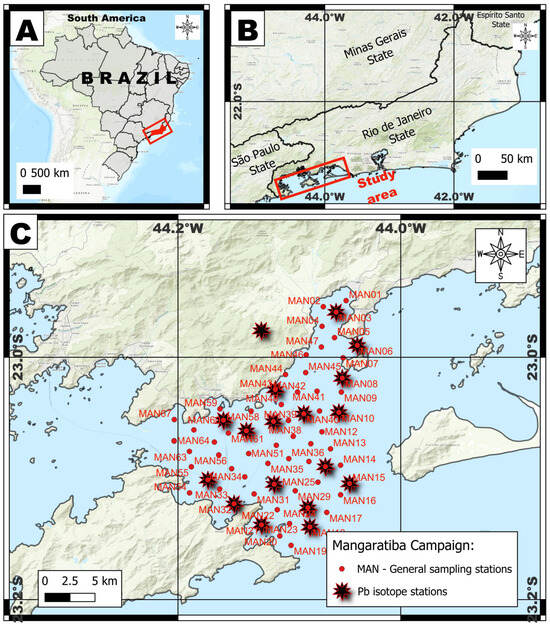
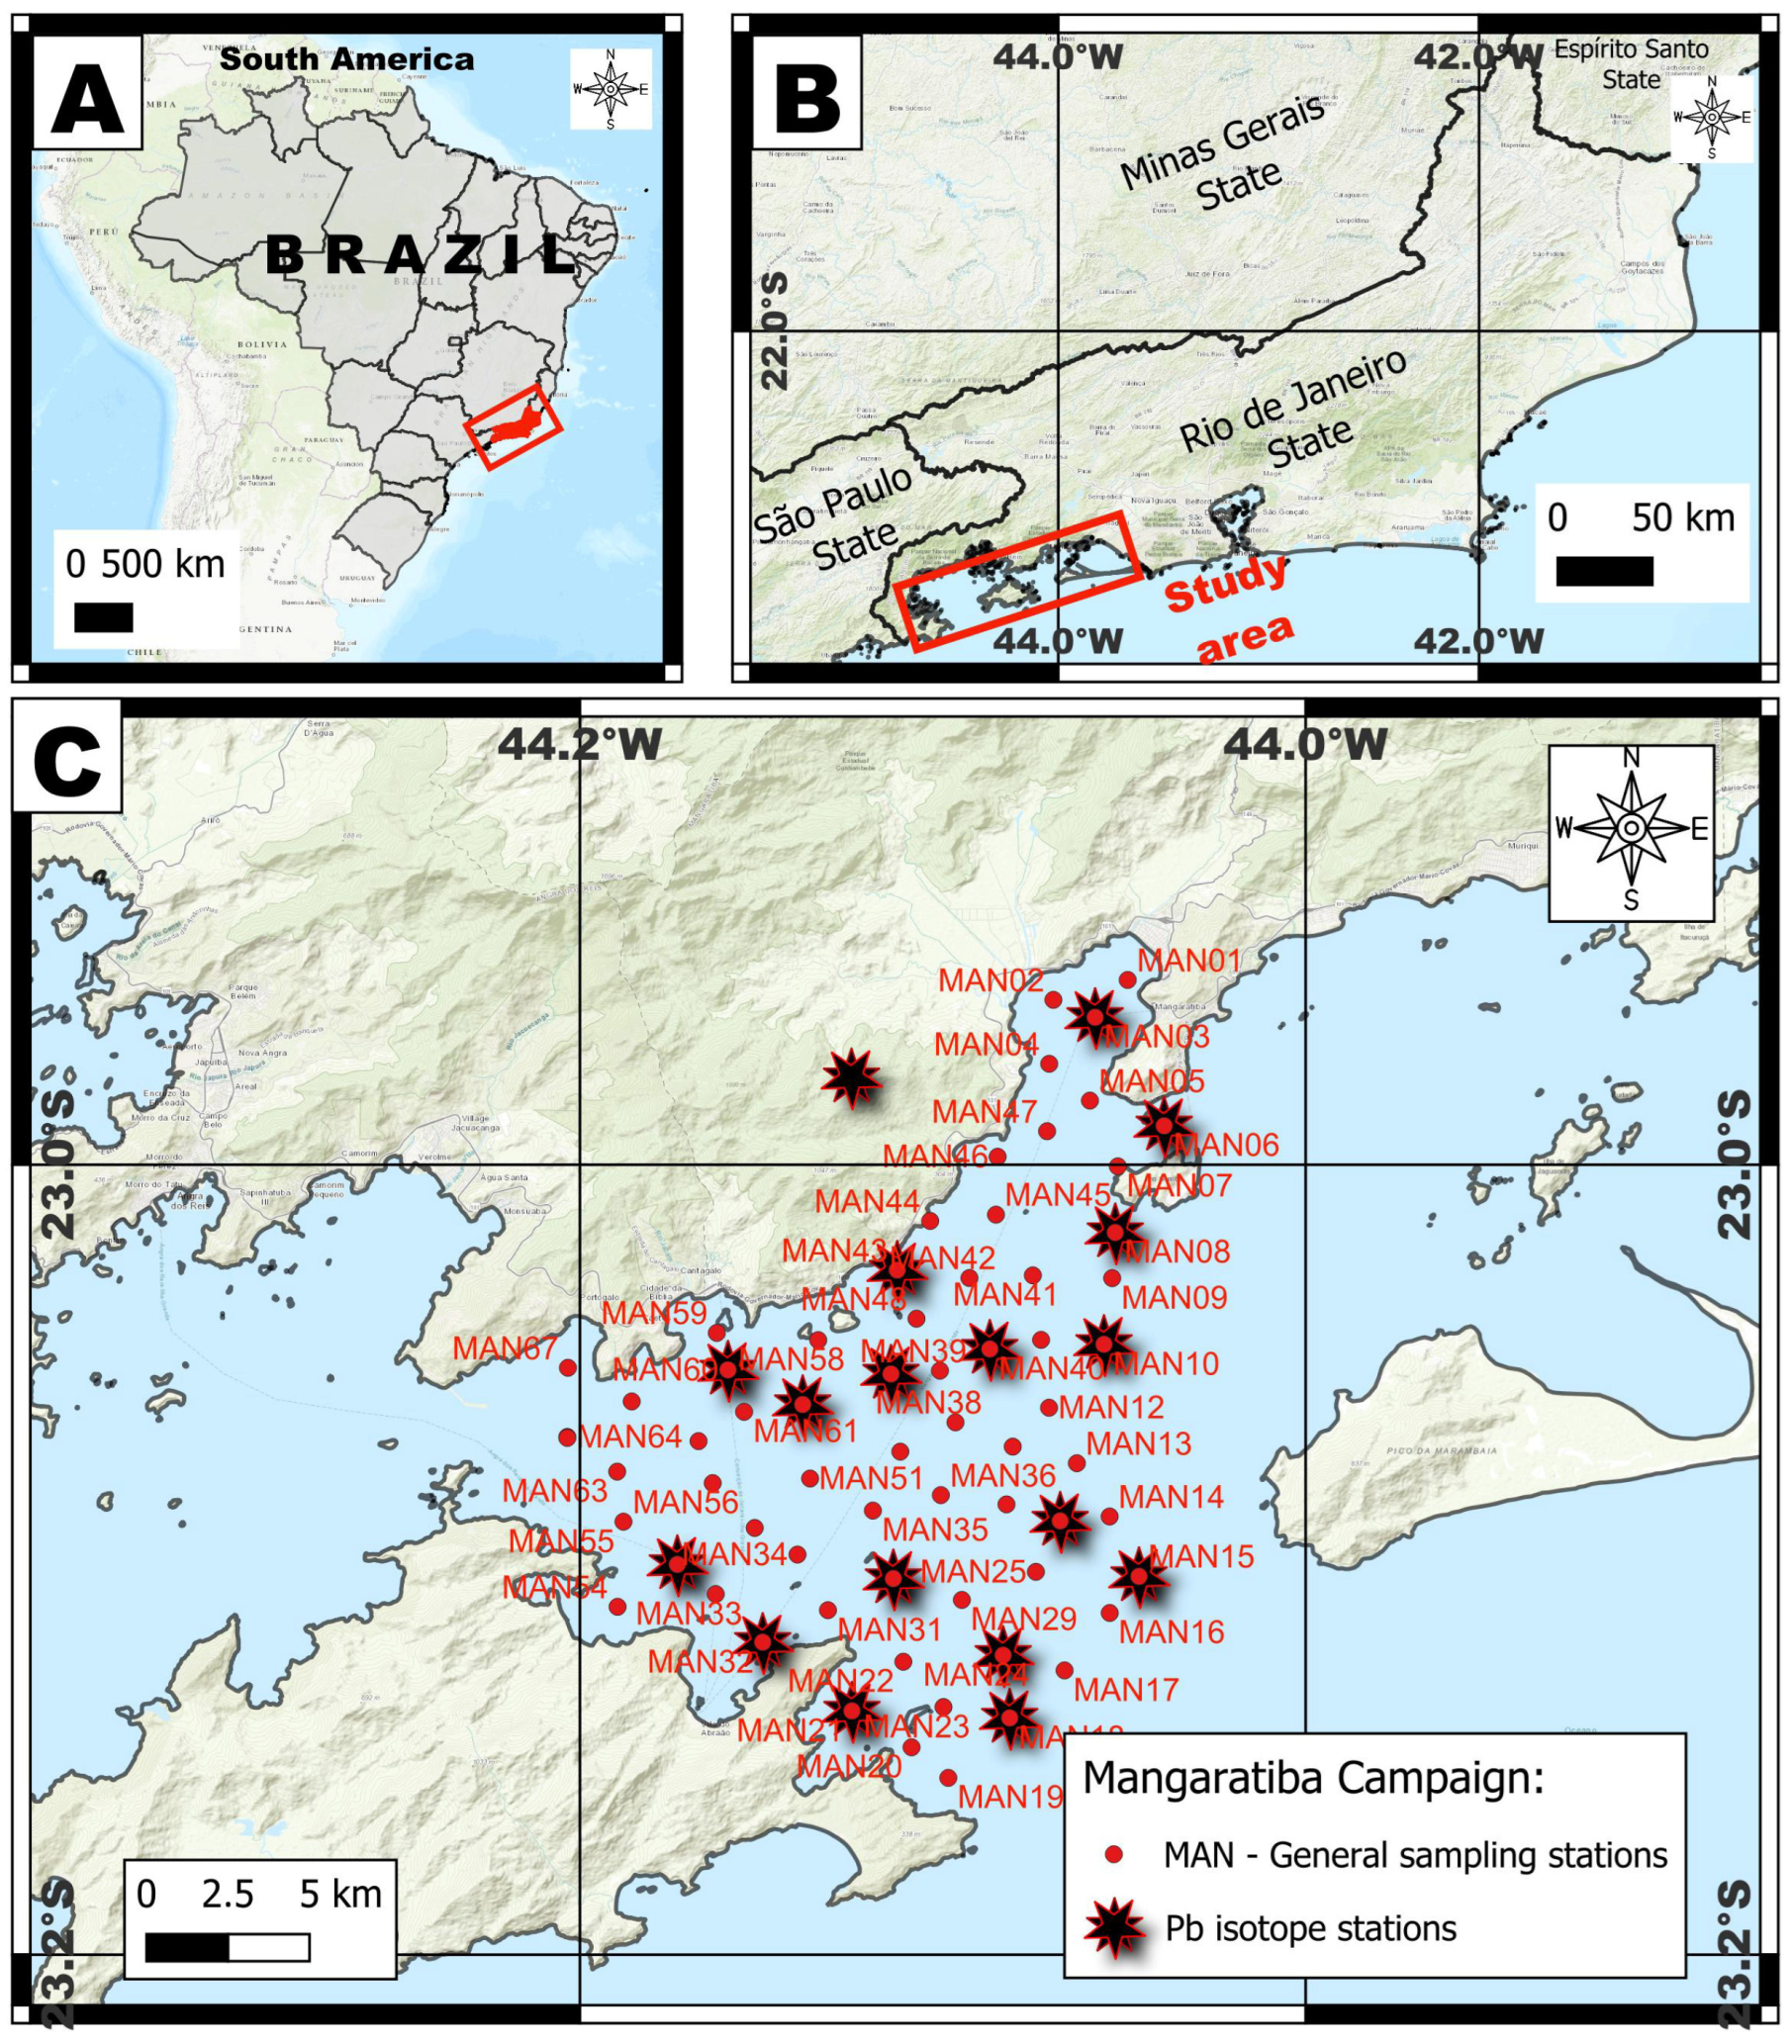
4.2. Pb Isotopic Data Analysis in Mangaratiba (MAN)
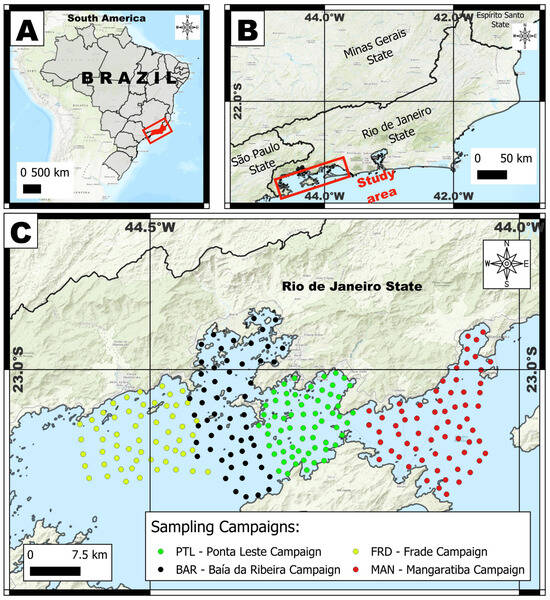
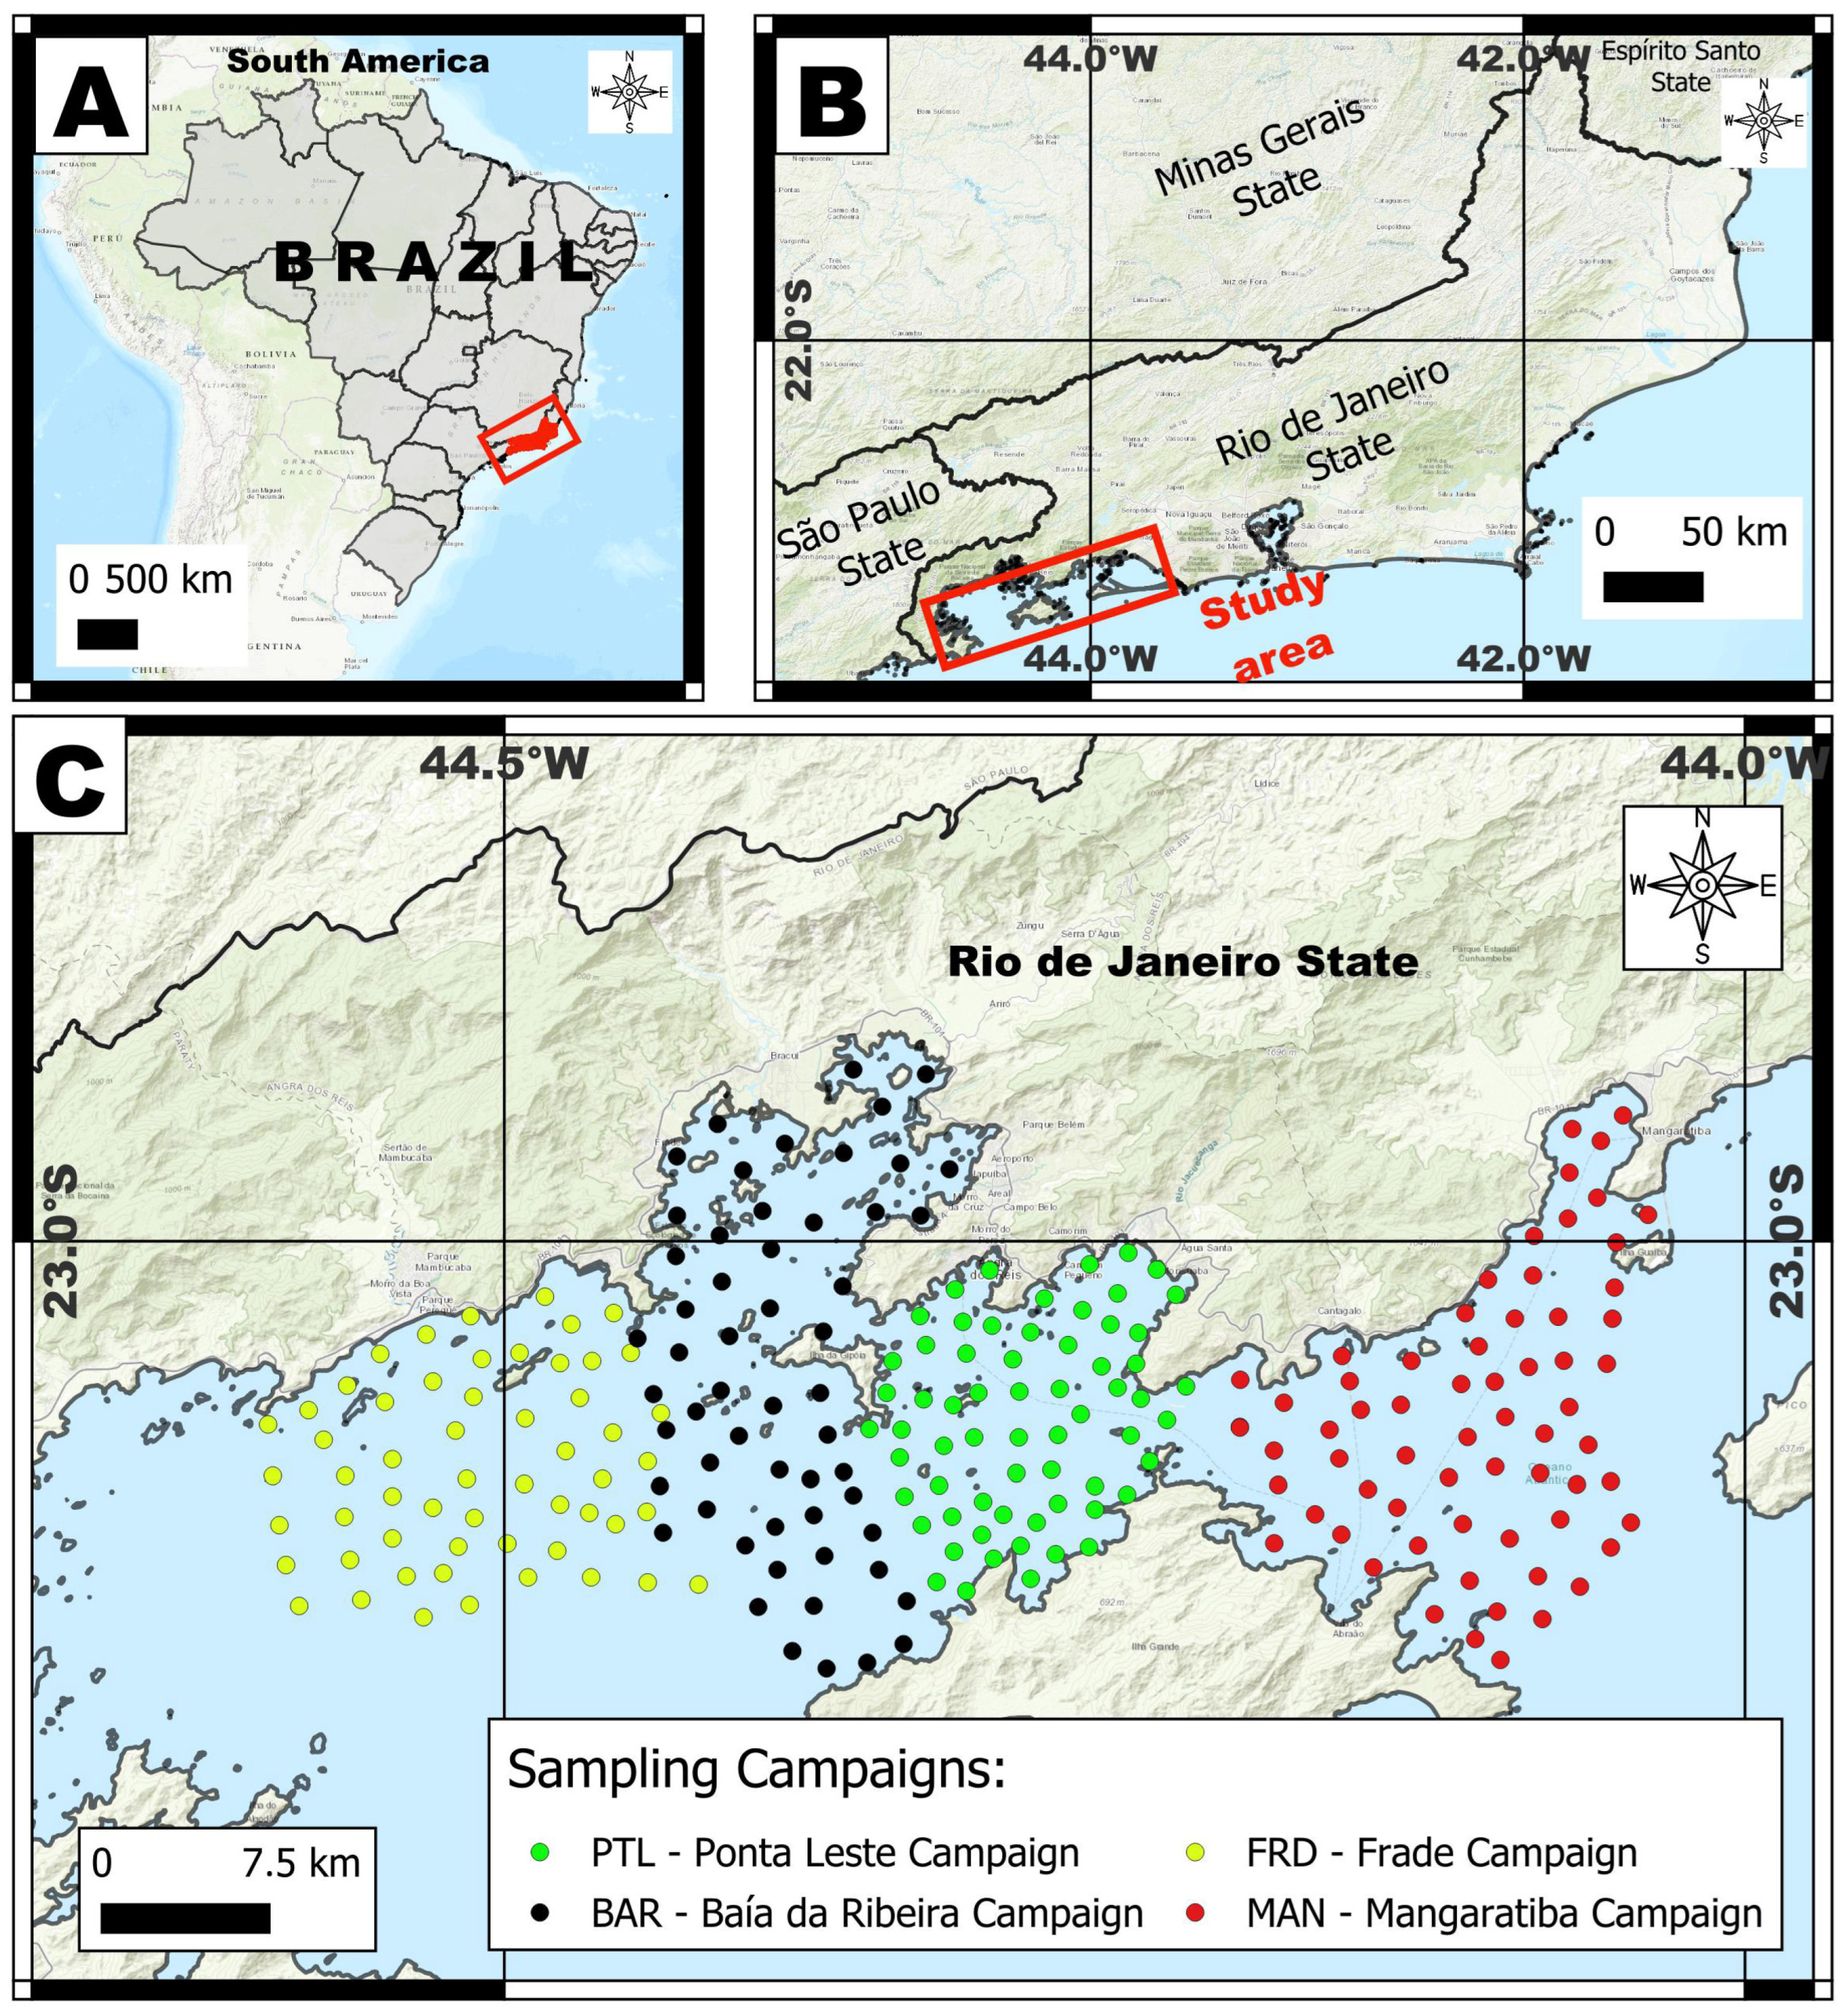
A total of 67 sediment samples were collected in March and July 2011 from the Mangaratiba embayment (Figure 14). Samples were sieved (200 mesh) and analyzed by total digestion. Metal concentrations (Cd, Co, Cr, Cu, Mn, Ni, Pb, S, Sr, U, V, Zn) were determined by ICP-MS, and Pb isotopic ratios (Pb206/Pb204, Pb207/Pb204, Pb208/Pb204, Pb206/Pb207) were measured using TD-ICP at ActLabs.
Figure 14.
(A) Study area in South America; (B) study area in Rio de Janeiro state; (C) location of the MAN general sampling stations and the Pb isotope points.
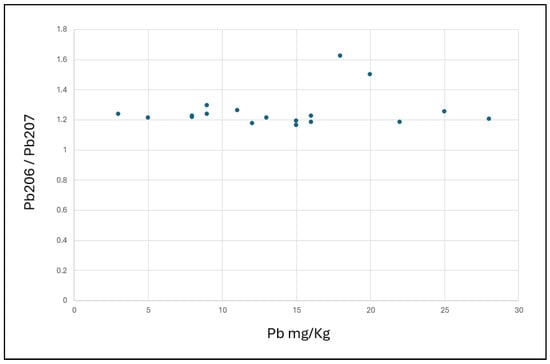
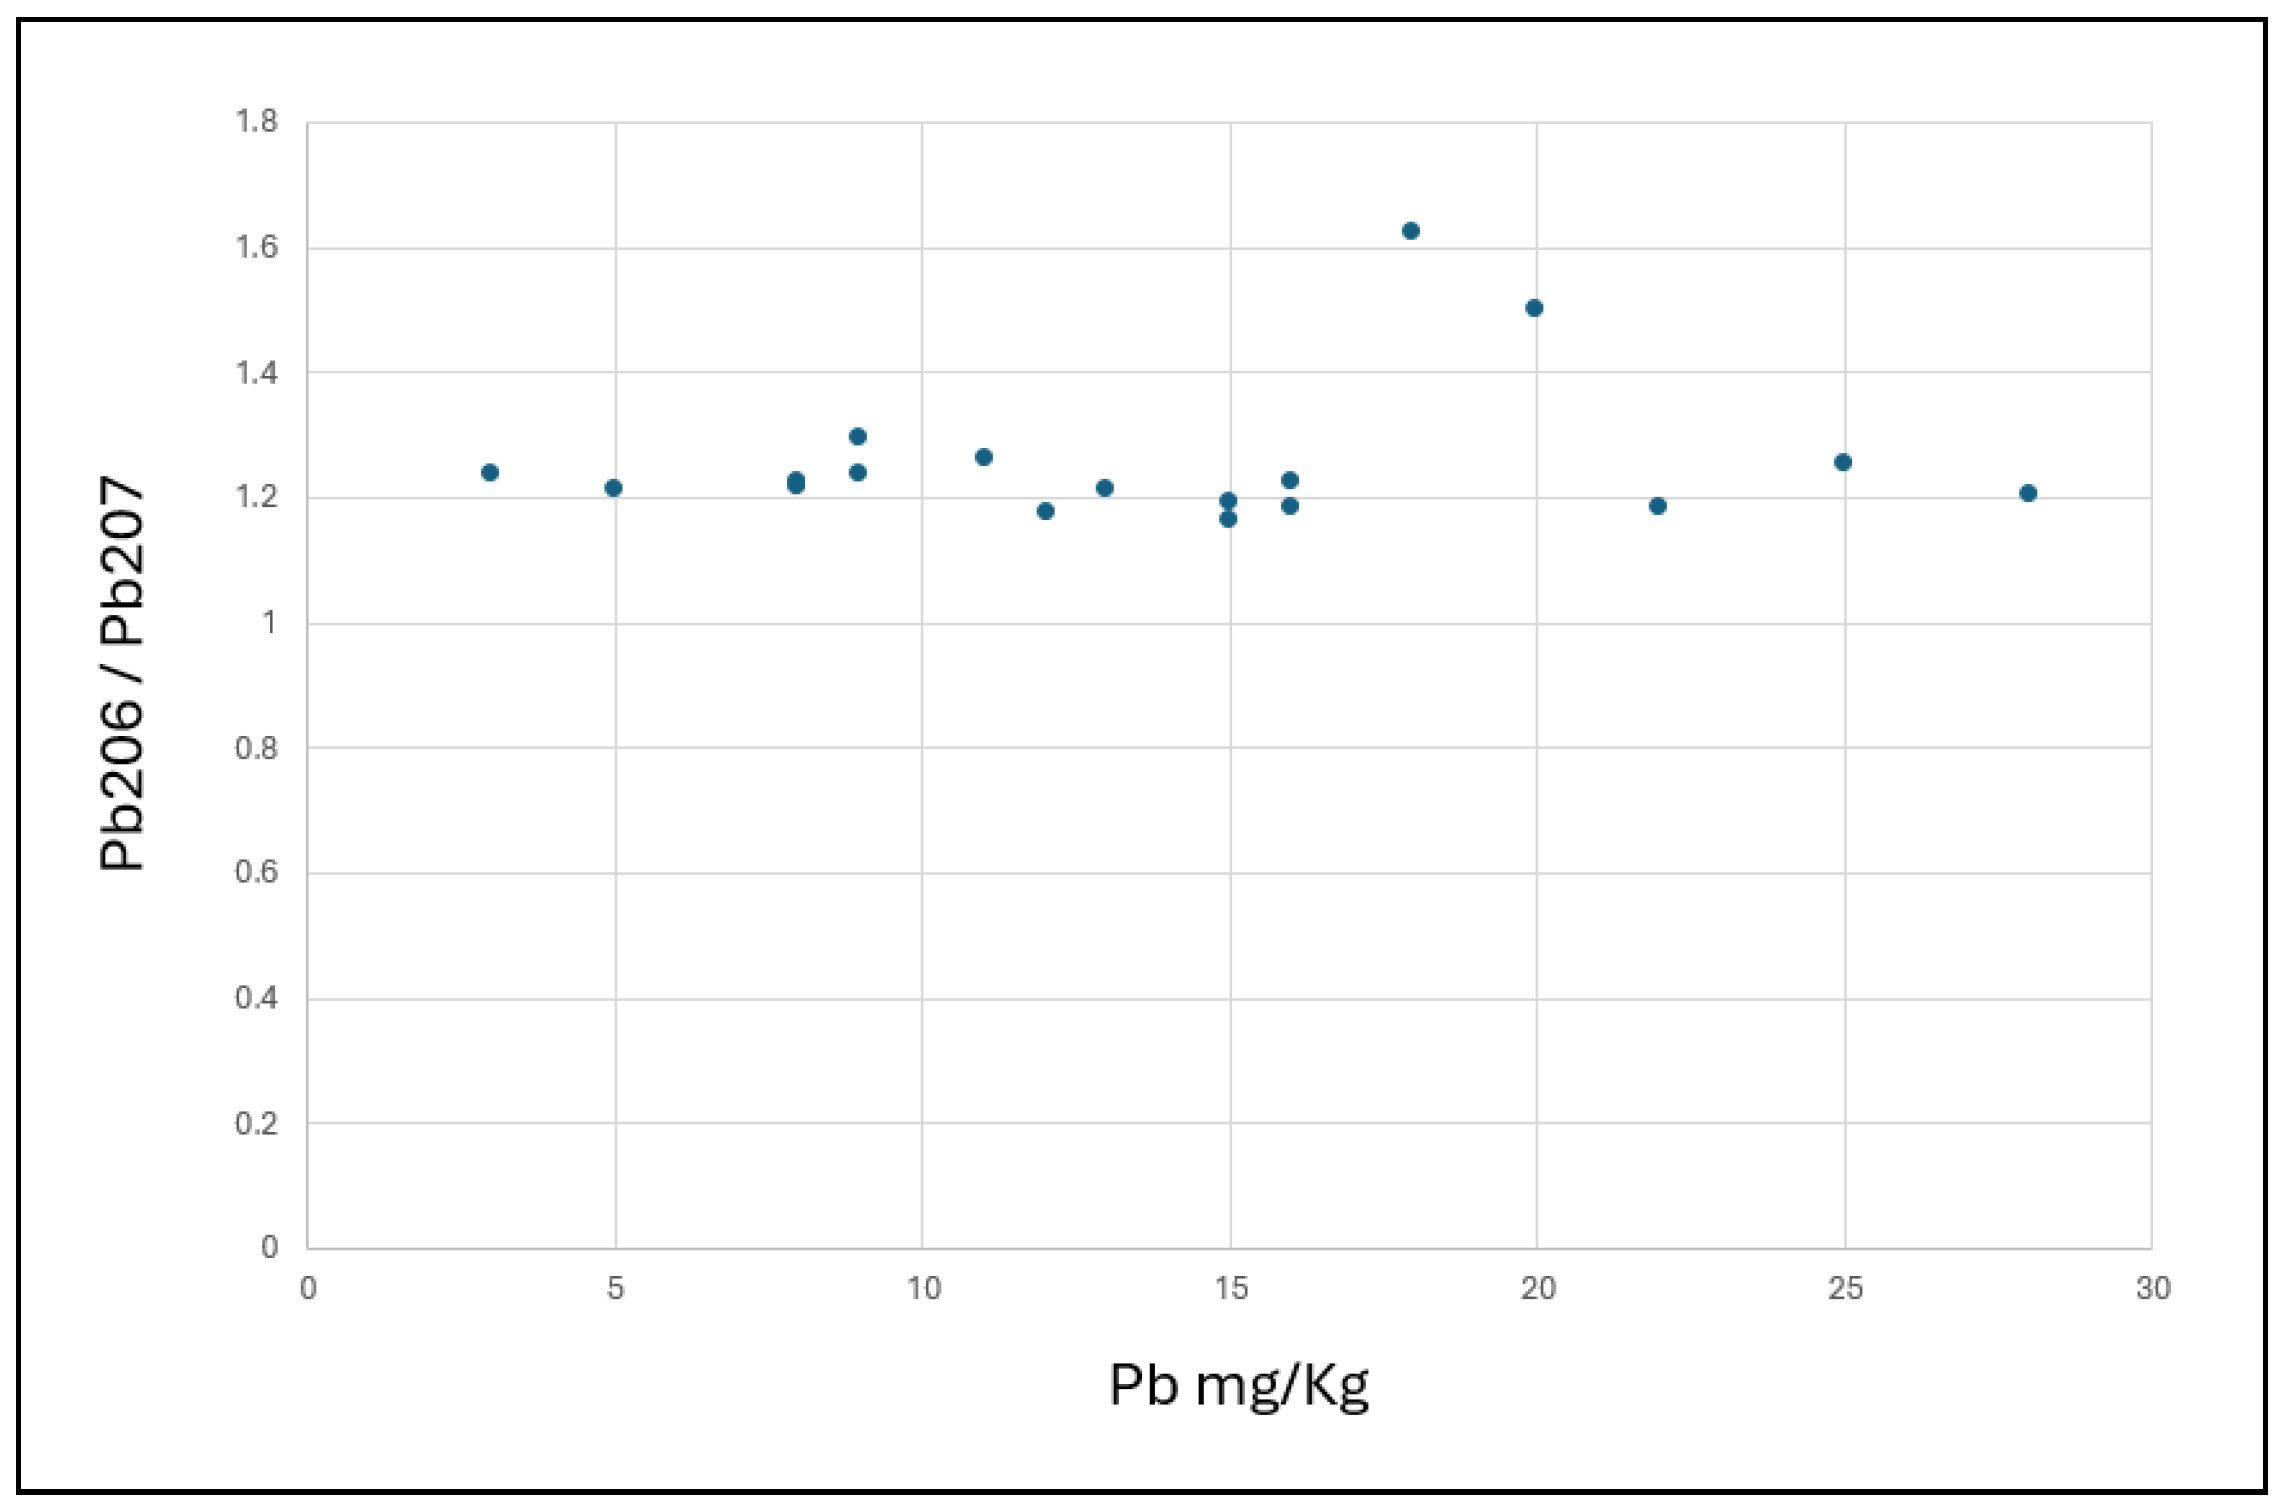
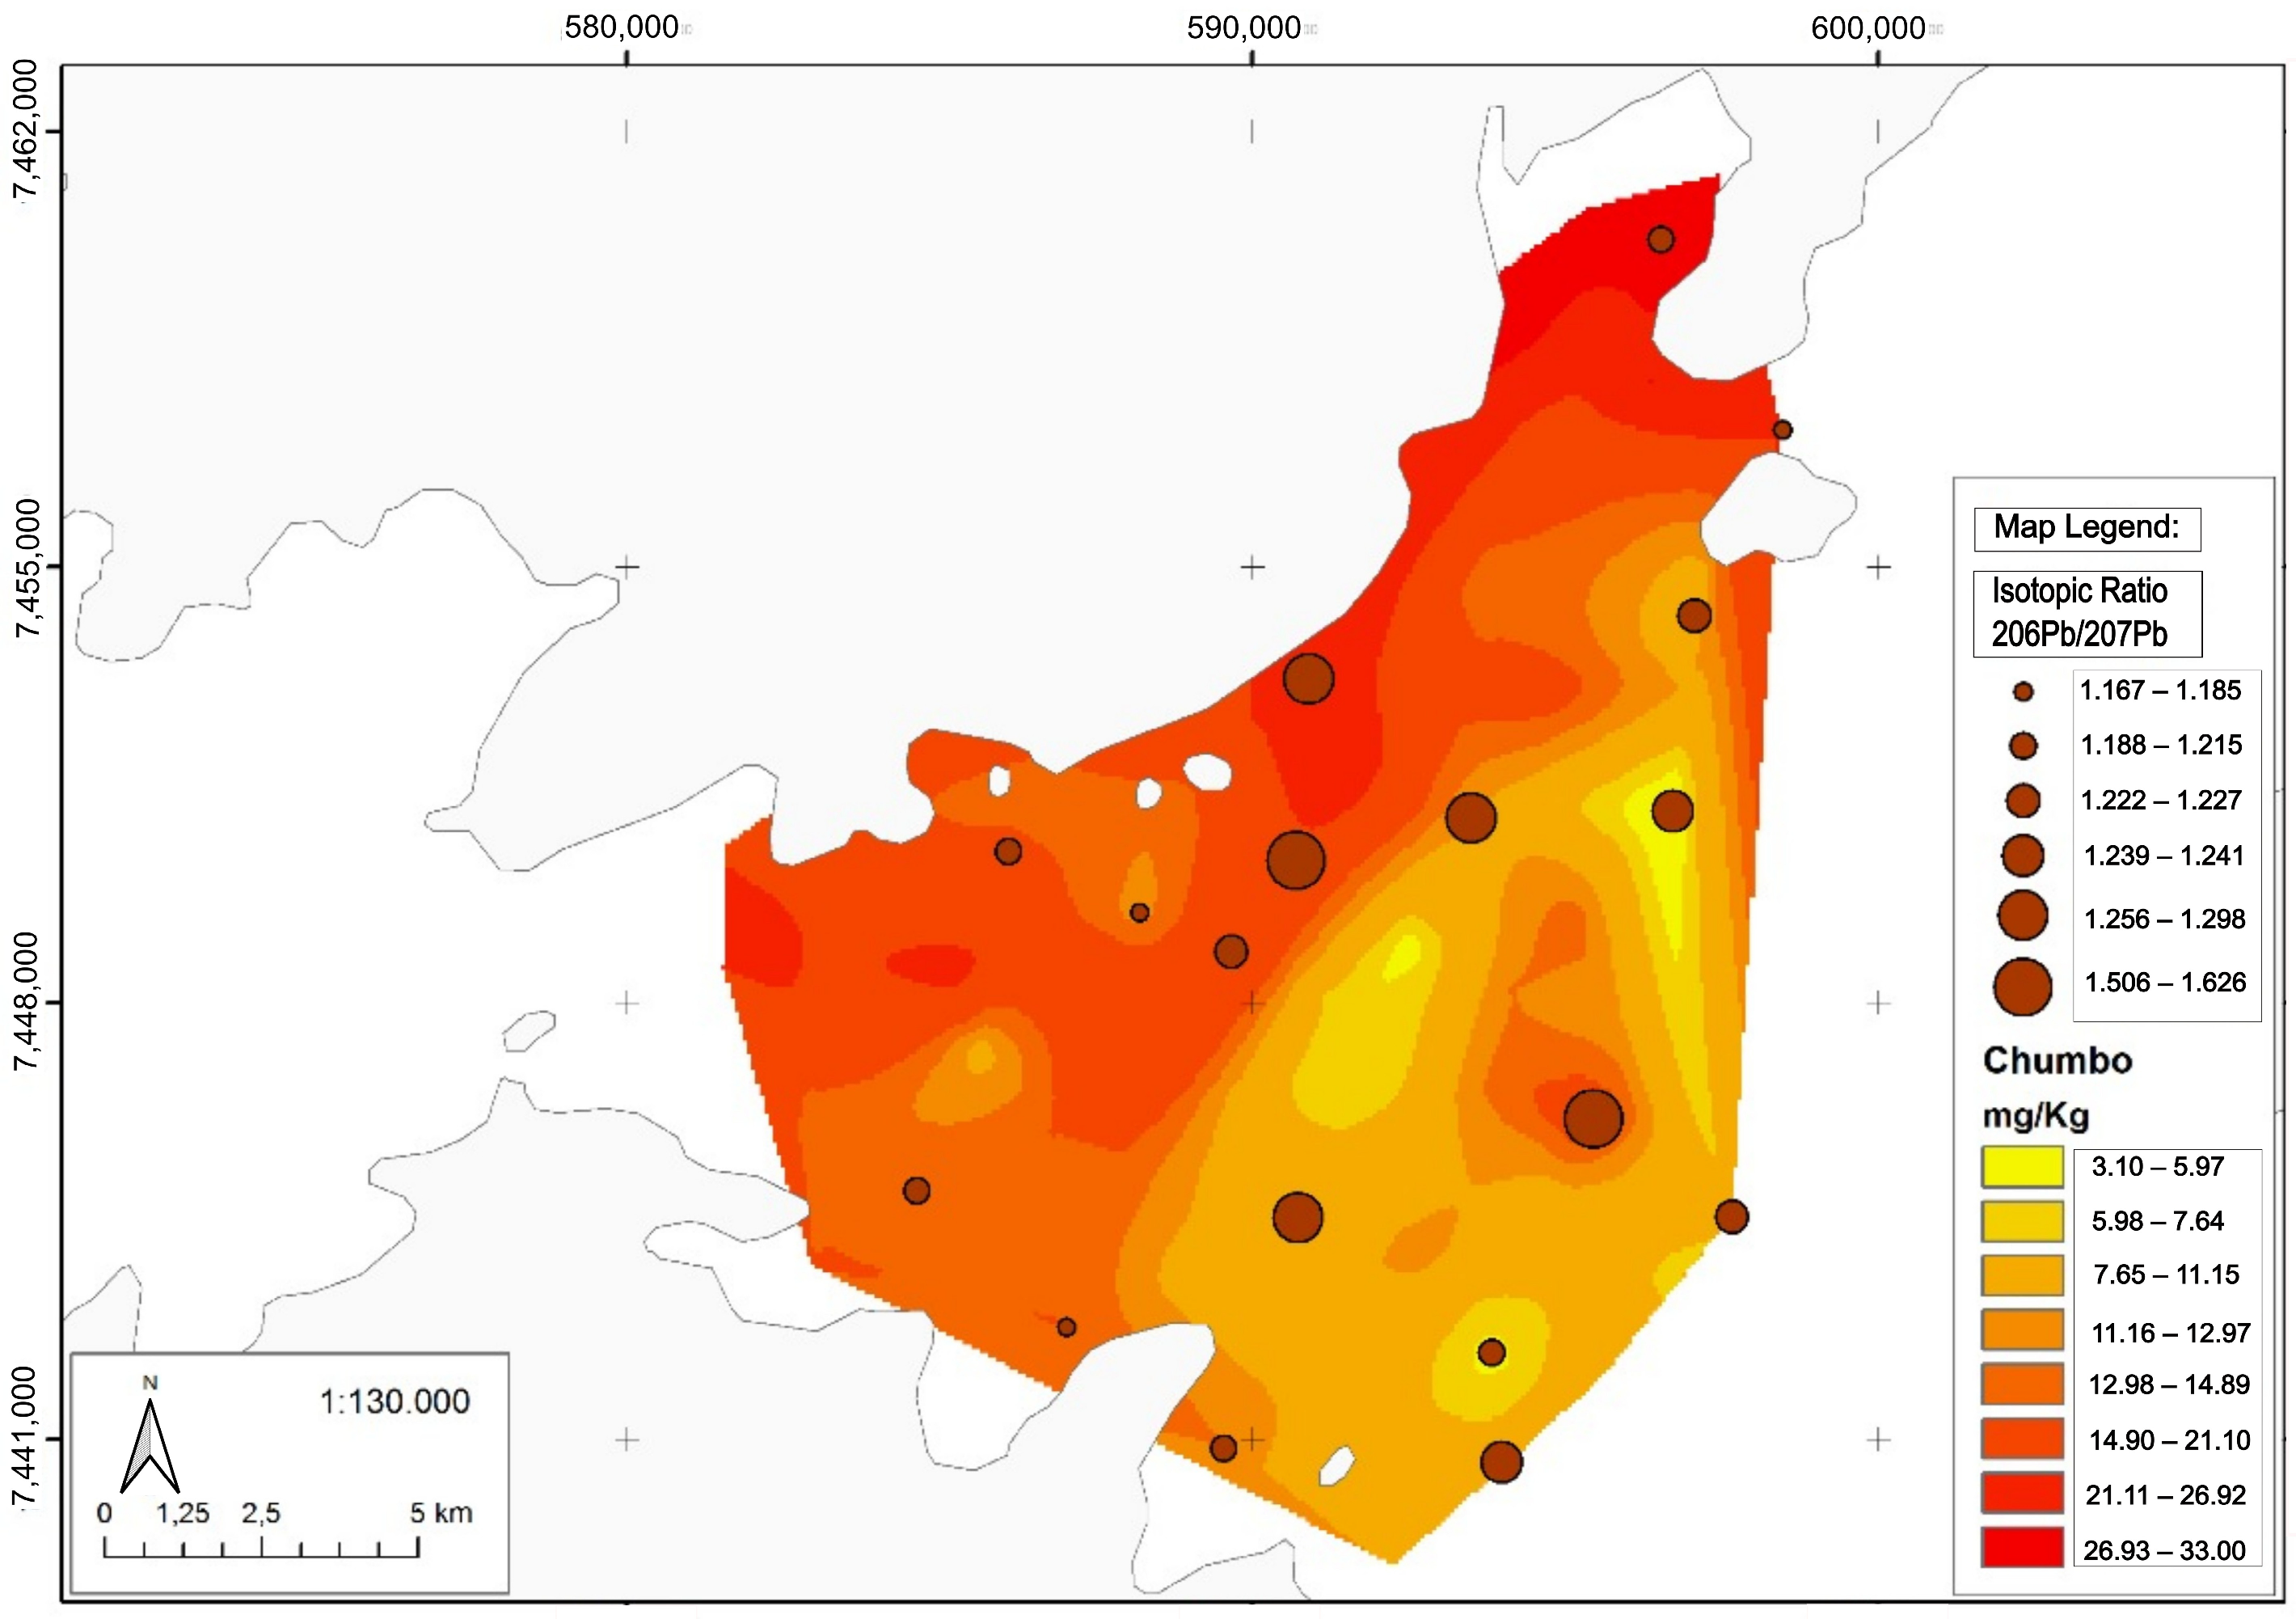
Lead (Pb) isotopic data revealed the existence of six intervals of Pb206/Pb207 ratios in the Mangaratiba embayment, reflecting the complexity of sources and mixing processes in the region. The observed intervals (Figure 15) can be interpreted as sample groups and, consequently, may characterize specific source signatures. The first interval identified can be partially correlated with those described by [38] for rocks of the Oriental Terrane and can also be compared to data obtained by [39,40] for industrial waste, being spatially distributed near Ilha Grande. Furthermore, the first interval also exhibits similarity with the signatures identified by [41] related to urbanization processes. The second interval shows a dispersed distribution within the cove, indicating a strong mixing of sources. This is particularly evident given its location along the margins of the corridor formed by the Ilha Grande channel and between Ilha Grande and the Marambaia sandbar, an area of water exchange between all the coves on the open sea. The third, fourth, and fifth intervals show a correlation with data collected by [39] for industrial waste.
Figure 15.
Isotopic signature Pb206/Pb207 for Mangaratiba embayment.
The sixth interval (206Pb/207Pb: 1.506–1.626) is significantly more radiogenic than the others and is attributed to one of two distinct sources. It may represent a localized anthropogenic signature from the TEBIG terminal or Verolme shipyard, where the processing of specific metallic alloys and ores could release Pb with an unusual isotopic composition. Alternatively, and more consistent with the observed spatiotemporal overlap, this signature may be imported by the SACW, which can transport radiogenic Pb from deep-oceanic reservoirs, such as those influenced by hydrothermal inputs or remote atmospheric deposition, onto the continental shelf [42]. Notably, the most radiogenic interval (1.506 to 1.626) was recorded in samples located near the Ilha Grande Channel, an area under the direct influence of deep oceanic waters and anthropogenic activities, such as the Ilha Grande Bay Terminal (TEBIG) and the Verolme shipyard.
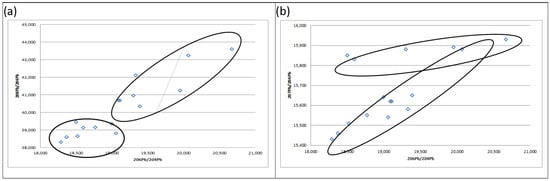
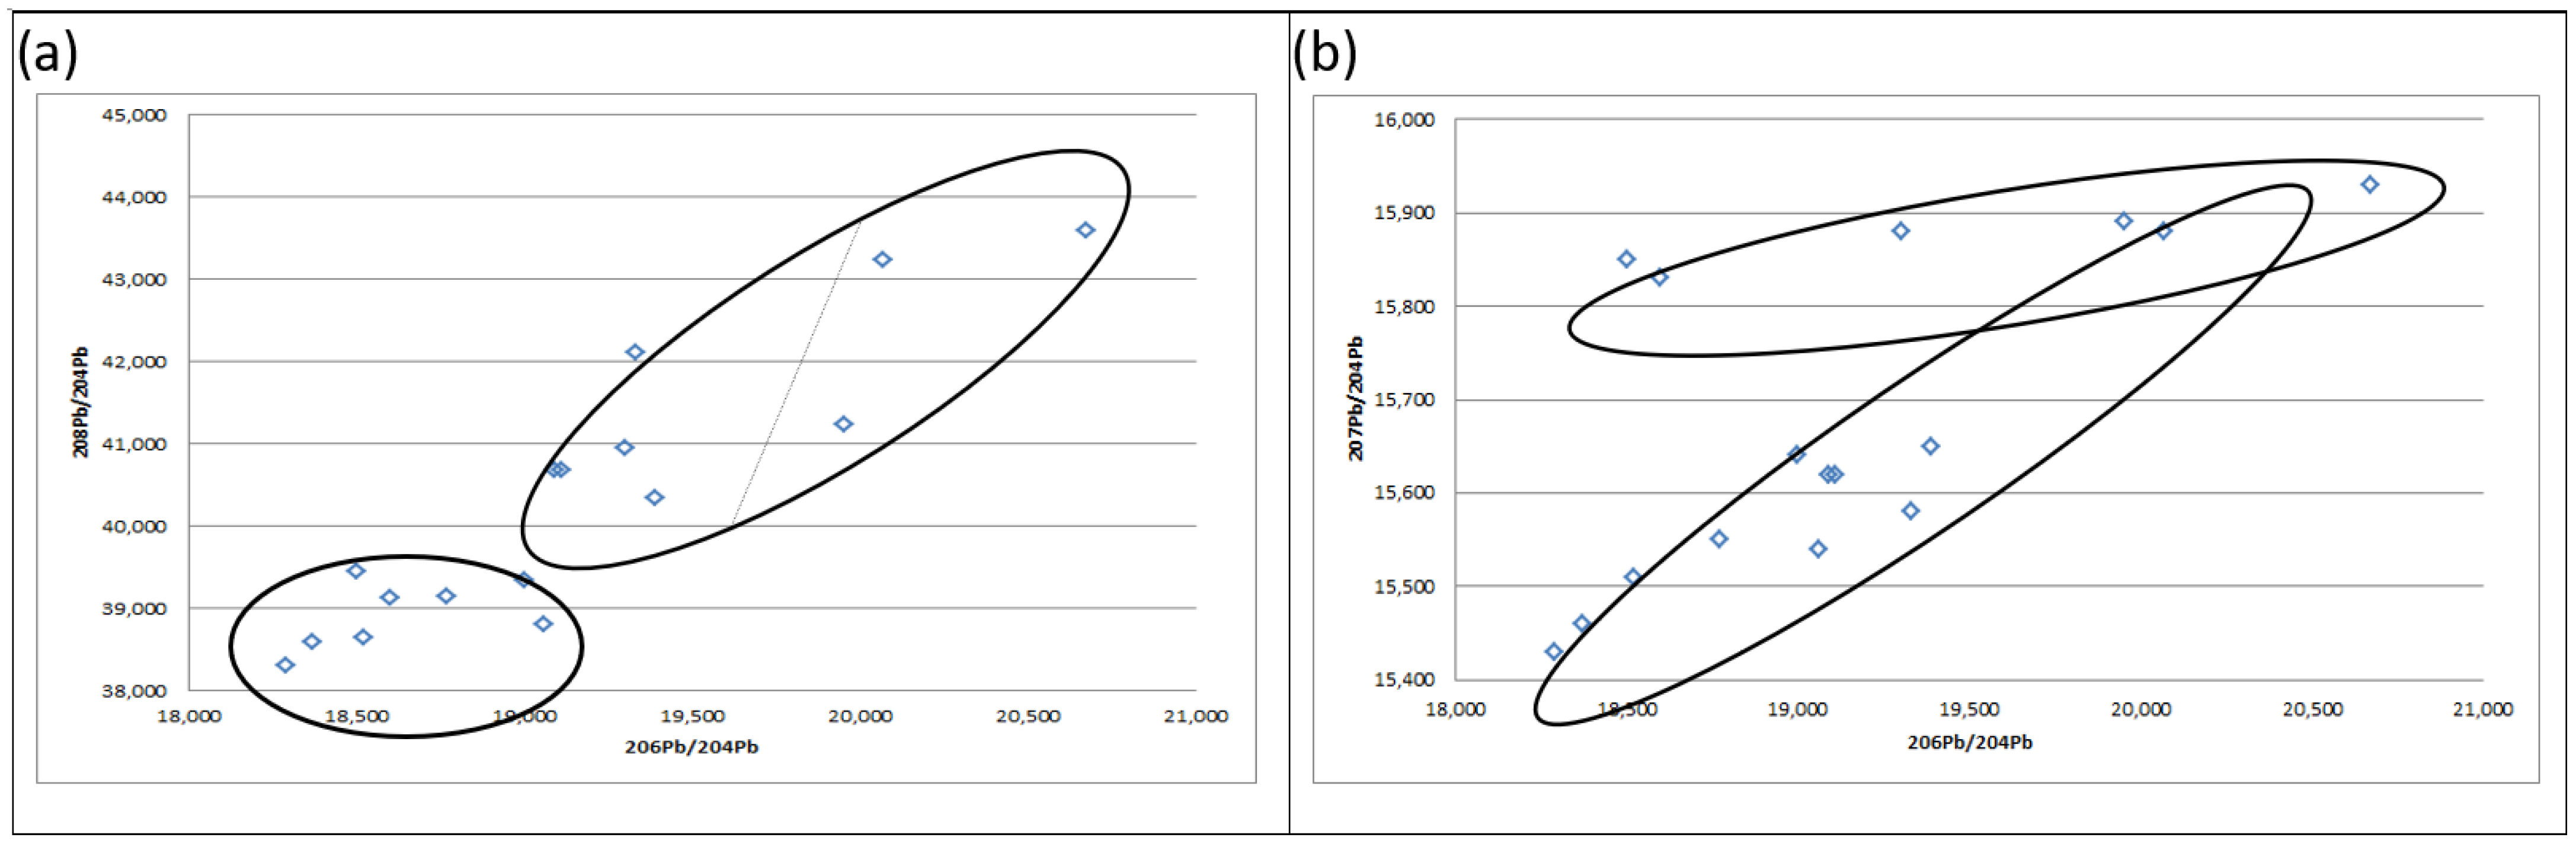
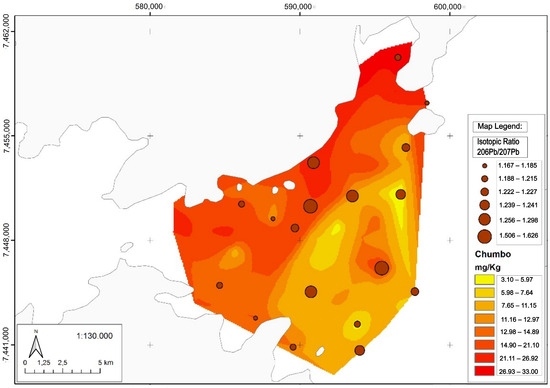
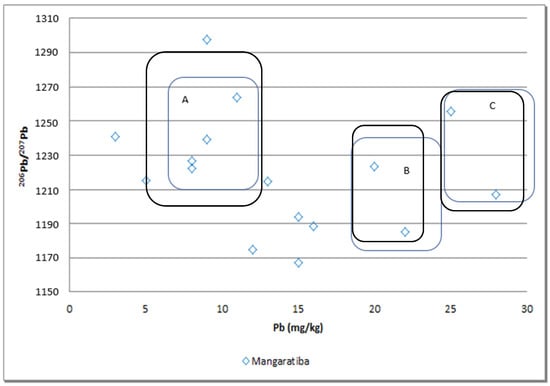
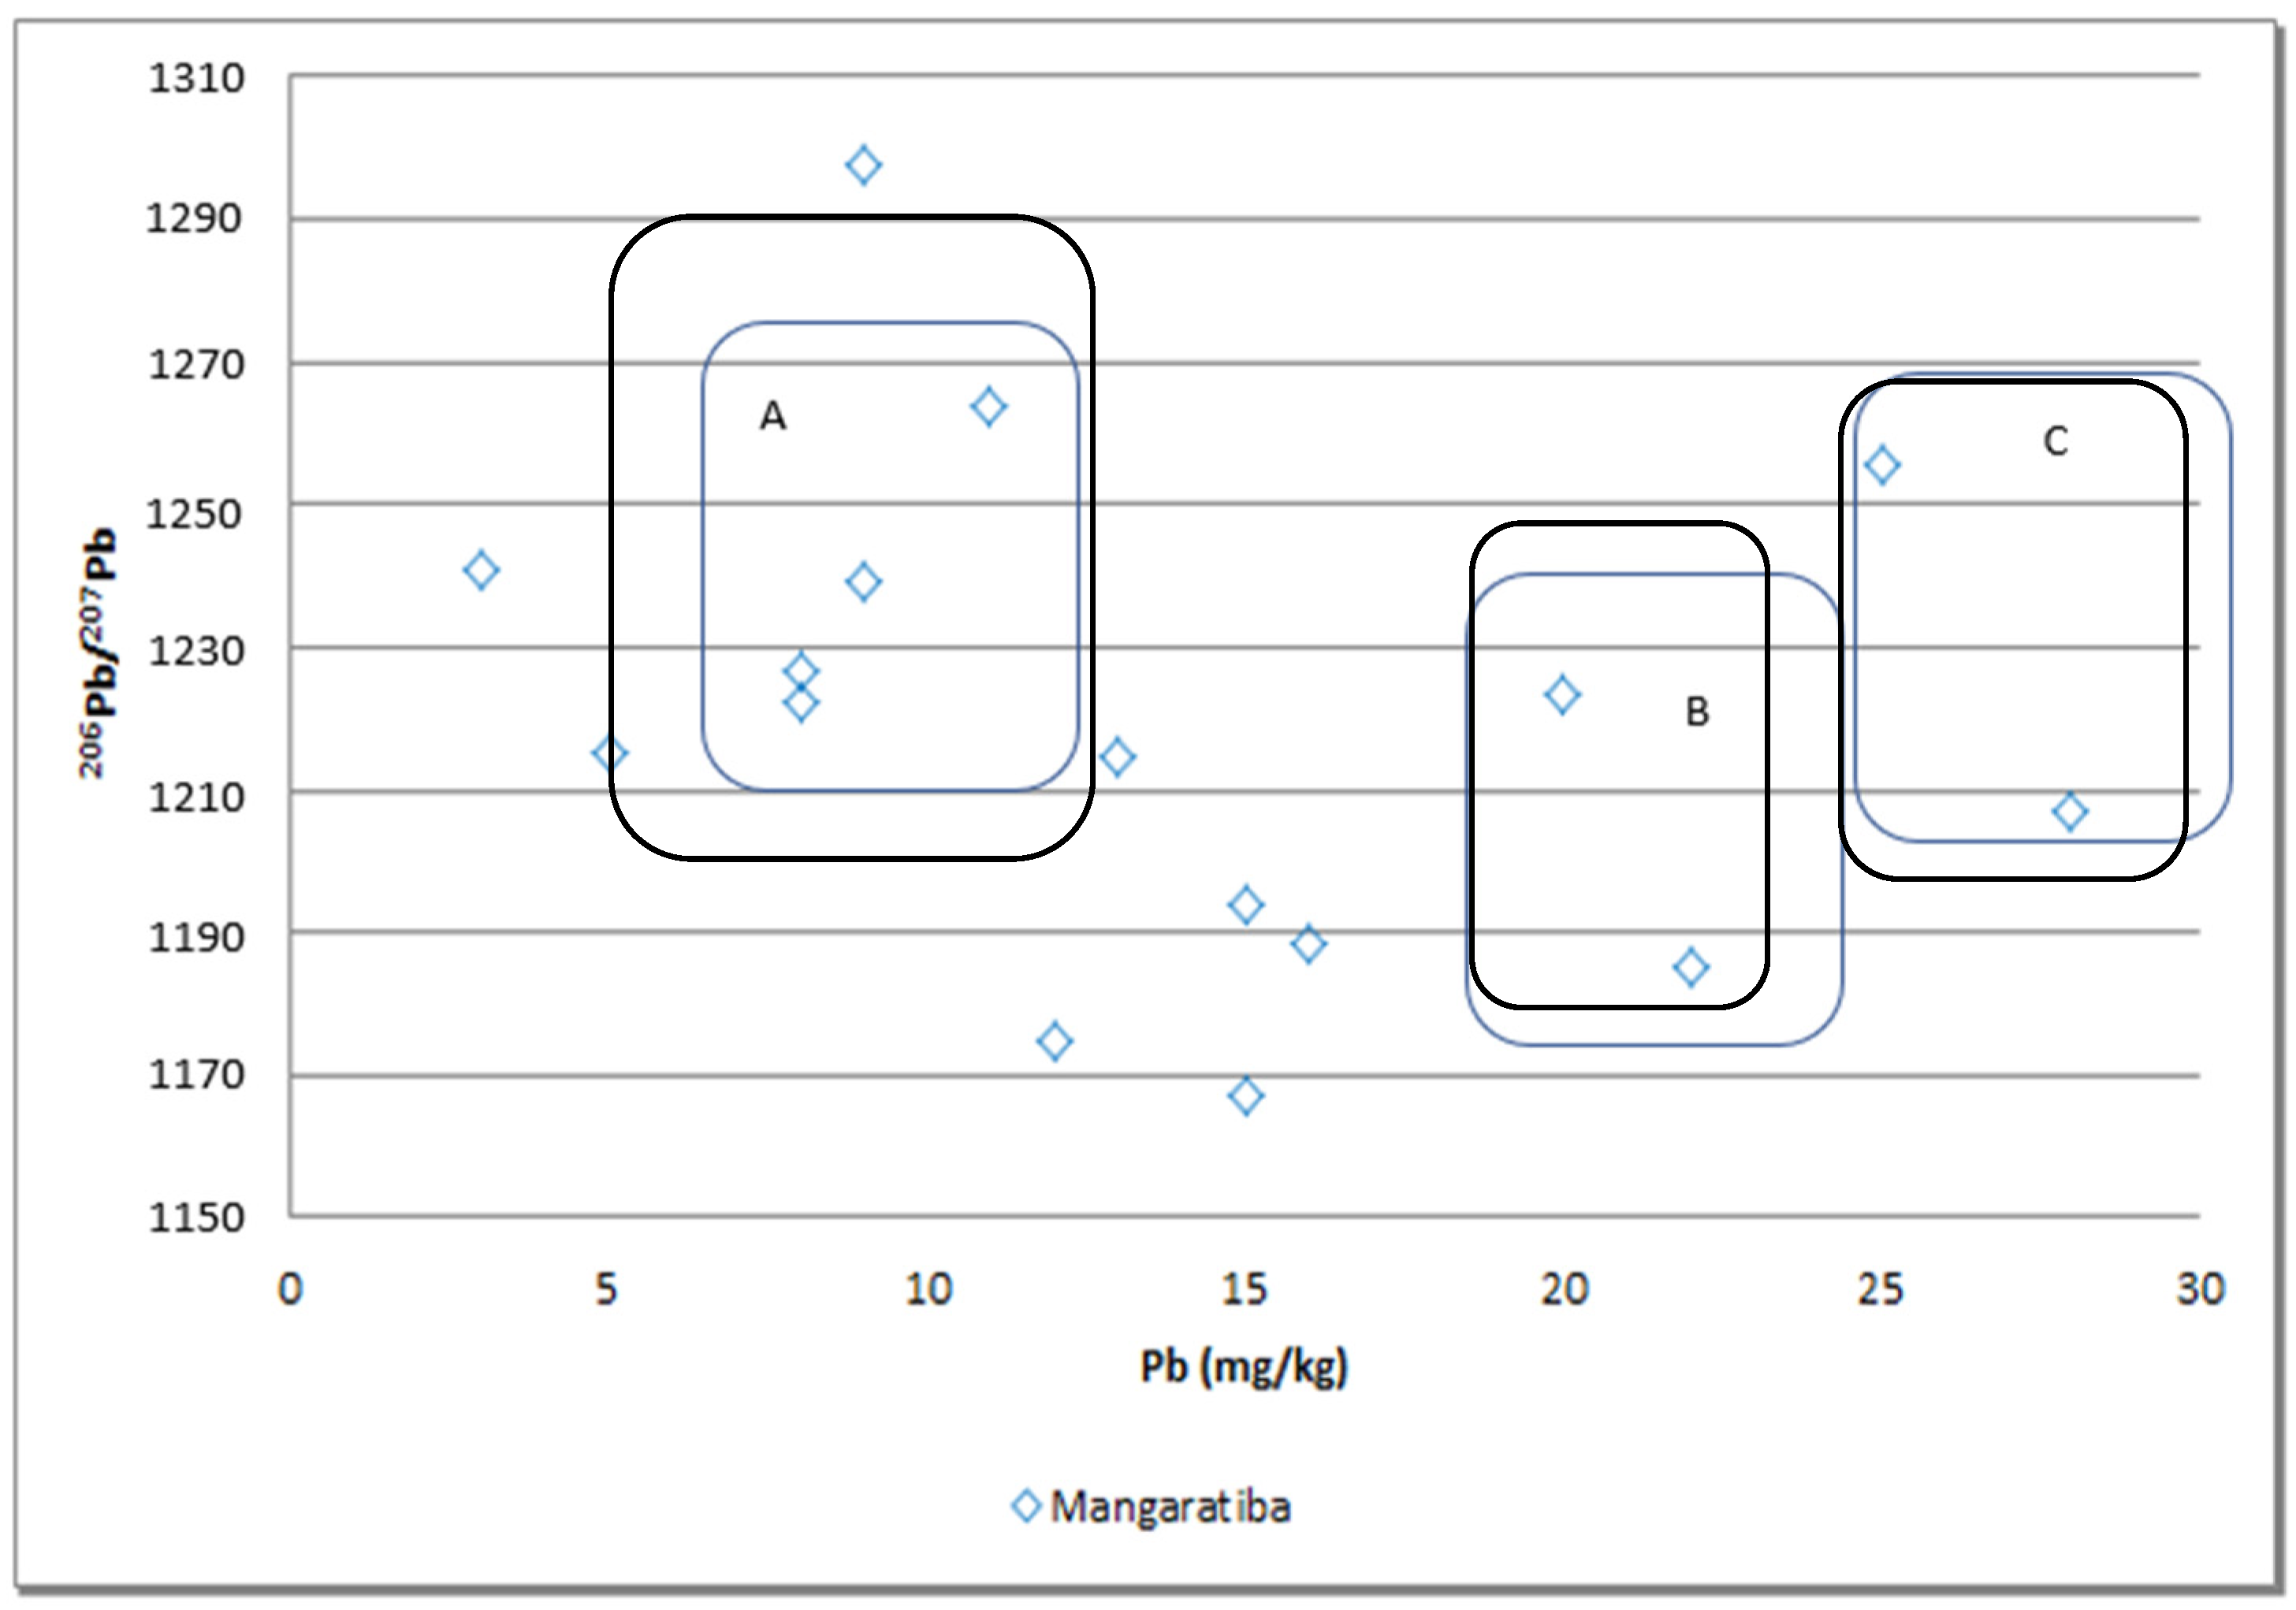
The three Pb groups (A, B, C) (Figure 16) were defined through an integrated approach combining Principal Component Analysis (PCA) of the full isotopic dataset with spatial distribution mapping. The low correlation (<5%) between Pb concentrations and Pb206/Pb207 ratios itself signifies multiple, overlapping sources, making multivariate analysis essential for discrimination. This methodology robustly identifies endmembers in complex environments where simple bivariate relationships are insufficient, as established in environmental tracer studies [43]. A spatial distribution of lead concentrations and isotopic signatures is shown (Figure 17). The ranges of the Pb206/Pb207 signatures for these groups partially overlap but are easily distinguishable when Pb concentration is considered. In this context, Group A exhibits a directly proportional relationship with Pb concentration, whereas Group B exhibits an inversely proportional relationship. Group C shows a highly scattered trend (Figure 17). Concurrently, temperature and salinity profiles obtained by CTD confirmed the presence of South Atlantic Central Water (SACW) in the region during the summer periods, characterized by temperatures below 20 °C and salinity between 34.6 and 36 PSU. This intrusion is seasonal, driven by northeasterly winds that favor coastal upwelling processes, as observed during the March 2011 and January 2012 campaigns.
Figure 16.
Isotopic signatures for Mangaratiba embayment: (a) Pb208/Pb204 × Pb206/Pb204; (b) Pb207/Pb204 × Pb206/Pb204.
Figure 17.
Distribution map of lead concentrations and isotopic signatures.
The assertion that SACW acts as a vector for radiogenic Pb is supported by a compelling spatiotemporal linkage (Figure 18). The most radiogenic Pb isotopic signatures (Group C) were exclusively recorded during the summer campaigns, which concurrently detected the intrusion of SACW onto the shelf via CTD profiles. This synchronicity indicates a direct coupling between the physical presence of this water mass and the geochemical signal. The most straightforward interpretation is that SACW, which originates in the open ocean, carries a distinct Pb isotopic signature-potentially acquired from atmospheric deposition over the South Atlantic or interactions with deep-sea sediments- and injects it into the coastal system during upwelling events. This mechanism provides a coherent explanation for the occurrence of these radiogenic signatures in the Ilha Grande Channel, a pathway for oceanic waters, and is consistent with the role of ocean currents in transporting trace elements over long distances, as documented in other boundary current systems [42]. Notably, nickel (Ni) exhibited a uniquely strong and significant correlation (62.57%) with the Pb206/Pb207 isotopic ratio, when the anomalous sixth isotopic group was excluded. This robust statistical relationship suggests that Ni concentration and distribution in the embayment are strongly controlled by the same sources that supply the radiogenic Pb signature. This finding underscores the potential of using Pb isotopes not only for tracing Pb itself but also as a proxy for understanding the behavior and origin of other metals, like Ni, that share common anthropogenic or oceanic pathways. This metal, like Pb, can be mobilized from deep marine sediments or industrial effluents located in the adjacent oceanic region.
Figure 18.
Isotopic correlation between isotopic signatures Pb206/Pb207 and concentration of lead, highlighting three main groups.
The seasonality of the SACW intrusion also explains the greater geochemical variability observed in summer, when oceanographic conditions favor the renewal of water masses and the introduction of new isotopic inputs. In winter, the absence of SACW and the predominance of less dynamic coastal waters result in more homogeneous and less radiogenic isotopic signatures.
Therefore, the Pb isotopic data not only reflects local anthropogenic sources but also records the influence of large-scale oceanic processes. The combination of isotope geochemistry and physical oceanographic parameters proved to be a powerful tool for elucidating the origin and transport of contaminants in complex coastal environments. These results highlight the importance of continuous and integrated monitoring of geochemical and oceanographic variables for understanding the dispersion mechanisms of metals in regions under both anthropogenic and oceanic influence, such as the Mangaratiba embayment. Table 1 shows the isotopic ratios of lead for Mangaratiba embayment.
Table 1.
Isotopic ratios of lead for Mangaratiba embayment. Uncertainties are based on repeated analysis of NIST SRM 981 and are provided in Section 3.
5. Conclusions
Based on the results obtained in this study, the following conclusions can be drawn:
- Using the temperature (T < 20 °C) and salinity (34.6 PSU < S < 36 PSU) thresholds defined by [8] for South Atlantic Central Water (SACW), the presence of this water mass in the Ilha Grande Bay region was confirmed during the Mangaratiba March 2011 and Frade campaigns.
- These two campaigns were conducted during the summer (of 2011 and 2012, respectively), the season when coastal upwelling events are most frequent, as stated by [24].
- The Mangaratiba July 2011, Ponta Leste, and Ribeira Bay campaigns took place during the winter of 2011 and did not indicate the presence of SACW, reinforcing the understanding that its intrusion is more frequent in summer. This does not, however, preclude its occurrence in other seasons.
- The shallowest depth at which SACW was detected was at station MAN07, where it was observed from 4 m below the surface.
- A classic stratification of the water column was observed during the summer, characterized by a warm surface layer of variable salinity overlying a cold, saline bottom layer, a feature typical of the SACW.
- The stations located closer to the coast, particularly those under the influence of river outflows (such as the Jacuecanga, Grataú, and Bracuí rivers) and Sepetiba Bay, exhibited the lowest salinity values, demonstrating the significant influence of continental freshwater.
- During the Frade campaign, a saline layer separating the SACW from the overlying water mass was also observed.
- Comparing the two Mangaratiba campaigns, stations located inside the cove presented lower salinity values than those in the surrounding areas. In March 2011, these measurements were lower than those obtained in July 2011, corroborating the assertion by [26] that rivers have their highest discharge peaks during the summer, when rainfall indices are also highest.
- This study observed that the Mangaratiba stations located closer to the entrance of Sepetiba Bay exhibited the lowest salinity levels in the region, confirming an active interaction between the two bays and corroborating the results reported by [22] in Sepetiba Bay, due to its high fluvial discharge of freshwater for the eastern part of Ilha Grande Bay.
- A spatiotemporal overlap was identified between the presence of the SACW and the more radiogenic Pb isotopic signatures, suggesting that this water mass acts as a vector for transporting trace elements and isotopes from the deep oceanic environment to the coastal region.
- This study demonstrates that combining physical oceanographic parameters (T/S) with geochemical tracers (Pb isotopes) provides a powerful tool for elucidating the origin and transport of contaminants in complex coastal environments.
- For improved monitoring, the ideal approach would be to establish fixed stations at strategic points throughout the study area, conducting continuous measurements of temperature and salinity throughout the water column. This would enable the acquisition of simultaneous data, allowing for the precise determination of the timing and location of SACW intrusion events in the region.
Supplementary Materials
The following supporting information can be downloaded at: https://www.mdpi.com/article/10.3390/geosciences16010051/s1. Figure S1: Distribution map of lead concentrations and isotopic signatures; Figure S2: Distribution map of lead concentration and isotopic signatures: (a) cadmium; (b) cobalt: (c) copper; (d) chromium; (e) sulfur; (f) strontium; (g) manganese; (h) nickel; (i) vanadium and uranium; (j) zinc; Figure S3: Cluster diagram for Mangaratiba cove; Figure S4: Isotopic signature Pb-Pb at Mangaratiba embayment; Figure S5: Isotopic signatures for Mangaratiba. A) 208Pb/204Pb x 206Pb/204Pb; b) 207Pb/204Pb x 206Pb/204Pb; Figure S6: Distribution of Pb and Zn concentrations and the 4th-order polynomial trend line; Figure S7: Isotopic signatures and its sources for Mangaratiba cove; Table S1: Metal concentration in Mangaratiba cove; Table S2: Correlation factor for Mangaratiba Cove; Table S3: Correlation matrix between the analyzed elements in Mangaratiba Cove; Table S4: Lead isotopic ratios for Mangaratiba cove.
Author Contributions
Conceptualization, A.F., A.D.T. and M.C.G.; methodology, A.F. and M.C.G.; software, A.M.d.S.; validation, L.F.D.S.; formal analysis, A.M.d.S. and M.C.G.; investigation, A.F.; data curation, L.F.D.S.; writing—original draft, L.F.D.S.; supervision, A.M.d.S.; funding acquisition, A.D.T. All authors have read and agreed to the published version of the manuscript.
Funding
This paper is the result of a doctoral project by the first author, financed by the Rio de Janeiro Research Council (FAPERJ # 100.173/2014) and CAPES Brazilian Council (Sandwich fellowship No. 99999.006532/2015-02). We thank the staff of the Universidade do Estado do Rio de Janeiro (MultiLab).
Data Availability Statement
Data is contained within the article or Supplementary Materials.
Conflicts of Interest
The authors declare no conflict of interest.
References
- Tomczak, M. Some historical, theoretical and applied aspects of quantitative water mass analysis. J. Mar. Res. 1999, 57, 275–303. [Google Scholar] [CrossRef] [Scilit]
- Sperb, R.M.; Modro, N.R.; Martins, A.; Pacheco; Roberto, C.S. Classificação de Massas D’água: Um Enfoque Difuso; Programa de Pós-Graduação em Engenharia de Produção—PPGEP; Centro Tecnológico, Universidade Federal de Santa Catarina: Florianópolis, Brazil, 1999. [Google Scholar]
- De Madron, X.D.; Weatherly, G. Circulation, transport and bottom boundary layers of the deep currents in the Brazil Basin. J. Mar. Res. 1994, 52, 583–638. [Google Scholar] [CrossRef] [Scilit]
- Tsuchiya, M.; Talley, L.D.; Mccartney, M.S. Water-mass distributions in the western South Atlantic: A section from South Georgia Island (54° S) northward across the Equator. J. Mar. Res. 1994, 52, 55–81. [Google Scholar] [CrossRef] [Scilit]
- Stramma, L.; England, M. On the water masses and mean circulation of the South Atlantic Ocean. J. Geophys. Res. Oceans 1999, 104, 20863–20883. [Google Scholar] [CrossRef] [Scilit]
- Mémery, L.; Arhan, M.; Alvarez-Salgado, X.A.; Messias, M.J.; Merier, H.; Castro, C.G.; Rios, A.F. The water masses along the western boundary of the South and Equatorial Atlantic. Prog. Oceanogr. 2000, 47, 69–98. [Google Scholar] [CrossRef] [Scilit]
- Emilson, I. The shelf and coastal waters off southern Brazil. Bol. Inst. Ocean. 1961, 11, 101–112. [Google Scholar]
- Silveira, I.C.A.d.; Schmidt, A.K.; Campos, E.J.D.; Godoi, S.S.d.; Ikeda, Y.A. Corrente do Brasil ao largo da costa leste brasileira. Rev. Bras. Oceanogr. 2000, 48, 171–183. [Google Scholar] [CrossRef] [Scilit]
- Matsuura, Y. Contribuição ao estudo da estrutura oceanográfica da região sudeste entre Cabo Frio (RJ) e Cabo Santa Marta Grande (SC). Ciênc. Cult 1986, 38, 1439–1450. [Google Scholar]
- Moser, G.A.O.; Gianesella-Galvão, S.M.F. Biological and oceanographic upwelling indicators at Cabo Frio (RJ). Rev. Bras. Oceanogr. 1997, 45, 11–23. [Google Scholar]
- Bollhöfer, A.; Rosman, K.J.R. Isotopic source signatures for atmospheric lead: The Northern Hemisphere. Geochim. Cosmochim. Acta 2001, 65, 1727–1740. [Google Scholar] [CrossRef] [Scilit]
- Bollhöfer, A.; Rosman, K.J.R. Isotopic source signatures for atmospheric lead: The Southern Hemisphere. Geochim. et Cosmochim. Acta 2000, 64, 3251–3262. [Google Scholar] [CrossRef] [Scilit]
- Breves, A.; Moraes, F.C.; Pimenta, A.D.; Junqueira, A.O.R. A unique subtidal vermetid reef formation in a nuclear power plant discharge area at Ilha Grande Bay (southwestern Atlantic Ocean). Mar. Biodivers. Rec. 2016, 9, 65. [Google Scholar] [CrossRef] [Scilit]
- Niencheski, L.F.; Windom, H.L.; Moore, W.S. Controls on water column chemistry of the southern Brazilian continental shelf. Cont. Shelf Res. 2014, 88, 126–139. [Google Scholar] [CrossRef] [Scilit]
- Venancio, I.M.; Belem, A.L.; dos Santos, T.H.R.; Zucchi, M.D.R.; Azevedo, A.E.G.; Capilla, R.; Albuquerque, A.L.S. Influence of continental shelf processes in the water mass balance and productivity from stable isotope data on the Southeastern Brazilian coast. J. Mar. Syst. 2014, 139, 241–247. [Google Scholar] [CrossRef] [Scilit]
- Mahiques, M.; Furtado, V.V. Utilização da Análise dos Componentes Principais na Caracterização dos Sedimentos de Superfície e de Fundo da Baía de Ilha Grande (RJ). Bol. Inst. Ocean. 1989, 37, 1–19. [Google Scholar] [CrossRef] [Scilit]
- Belo, W.C.; Dias, G.T.M.; Dias, M.S. O fundo marinho da baía da Ilha Grande, RJ: O relevo submarino e a sedimentação no canal central. Rev. Bras. Geofísica 2003, 20, 2002. [Google Scholar] [CrossRef] [Scilit]
- Cavalcante, S.L.S. Estudo da Influência da Dinâmica da Plataforma Continental nas Baías de Ilha Grande e Sepetiba via Aninhamento de Modelo Numérico Costeiro a Modelo Numérico Oceânico. Ph.D. Thesis, Universidade Federal do Rio de Janeiro, Rio de Janeiro, Brazil, 2010; 129p. [Google Scholar]
- Kjerfve, B.; Dias, G.T.M.; Filippo, A.; Geraldes, M.C. Oceanographic and environmental characteristics of a coupled coastal bay system: Baía de Ilha Grande-Baía de Sepetiba, Rio de Janeiro, Brazil. Reg. Stud. Mar. Sci. 2020, 1, 101594. [Google Scholar] [CrossRef] [Scilit]
- Silva, W.L.; Dereczynski, C.P. Caracterização Climatológica e Tendências Observadas em Extremos Climáticos no Estado do Rio de Janeiro. Anuário Inst. Geociências—UFRJ 2014, 37, 123–138. [Google Scholar] [CrossRef] [Scilit]
- da Fonseca, S.A.R. Observações dos Padrões de Circulação e do Fluxo de Material Particulado em Suspensão nas Proximidades do Canal de Acesso à Baía de Sepetiba (RJ). Master’s Thesis, Departamento de Oceanografia, Universidade do Estado do Rio de Janeiro, Rio de Janeiro, Brazil, 2013; 88p. [Google Scholar]
- Monteiro, C.A.F. O Estudo Geográfico do Clima. In Cadernos Geográficos; Departamento de Geociências—UFSC: Florianópolis, Brazil, 1999; pp. 7–36. [Google Scholar]
- Nimer, E. Climatologia do Brasil; Recursos Naturais e Meio Ambiente; IBGE: Rio de Janeiro, Brazil, 1979; 422p.
- Fragoso, M.D.R. Estudo Numérico da Circulação Marinha da Região das Baías de Sepetiba e Ilha Grande (RJ). Ph.D. Thesis, Universidade de São Paulo, São Paulo, Brazil, 1999; 134p. [Google Scholar]
- Signorini, S.R. A study of the circulation in Bay of Ilha Grande and Bay of Sepetiba. Part 1. A survey of the circulation based on experimental field data. Bol. Inst. Ocean. 1980, 29, 41–55. [Google Scholar] [CrossRef] [Scilit]
- Borges, H.V. Dinâmica Sedimentar da Restinga da Marambaia e Baía de Sepetiba; Programa de Pós-graduação em Geologia—Departamento de Geologia; Universidade Federal do Rio de Janeiro: Rio de Janeiro, Brazil, 1990. [Google Scholar]
- Coelho, A.L. Intrusão da ACAS na região costeira adjacente à Baía de Sepetiba. An. Hidrográficos Rev. Anu. Dir. Hidrogr. Naveg. 2010, 16, 109–116. [Google Scholar]
- Corrêa, M.A. Análise das Oscilações das Correntes Observadas na Baía de Ilha Grande (RJ). Master’s Thesis, Universidade de São Paulo, São Paulo, Brazil, 1994. [Google Scholar]
- Soares, A.D. Modelagem da Dispersão de Trítio a Partir de Liberações Acidentais Postuladas de Centrais Nucleares. Master’s Thesis, Instituto de Engenharia Nuclear, PPGIEN, Rio de Janeiro, Brazil, 2010; 113p. [Google Scholar]
- Silva, C.F. Caracterização do canal central da baia da Ilha Grande com base em sísmica rasa de 7.0 khz. Master’s Thesis, Centro de Estudos Gerais, Instituto de Geociências, Universidade Federal Fluminense, Rio de Janeiro, Brazil, 2001; 111p. [Google Scholar]
- Tommasi, L.R.; Marini, A.C.; Rosa, C.F.A. Briozoários lumiliformes da região da Ilha Grande (RJ). Bol. Inst. Oceanogr. 1972, 21, 137–147. [Google Scholar] [CrossRef] [Scilit]
- Miranda, L.B.; Ikeda, Y.; Castro, B.M.; Pereira Filho, N. Note on the occurrence of saline fronts in the Ilha Grande (RJ) region. Bol. Inst. Ocean. 1977, 26, 249–256. [Google Scholar] [CrossRef] [Scilit]
- Ikeda, Y.; Stevenson, M.R. Determination of circulation and short period fluctuation in Grande Bay (RJ), Brazil. Bol. Inst. Oceanogr. 1980, 29, 89–98. [Google Scholar] [CrossRef] [Scilit]
- Ikeda, Y.; Stevenson, M.R. Seasonal Characteristics of Hydrography, Turbulence and Dispersion Near Ilha Grande (RJ), Brazil, Based on R/V “Prof. W. Besnard” Data. Bol. Inst. Oceanogr. 1982, 31, 11–32. [Google Scholar] [CrossRef] [Scilit]
- Mahiques, M.M. Considerações sobre os sedimentos de superfície de fundo da baía de Ilha Grande (RJ). Master’s Thesis, Instituto Oceanográfico, USP, São Paulo, Brazil, 1987. [Google Scholar]
- Godoi, V.A.; Calado, L.; Watanabe, W.D.B.; Yaginuma, L.E.; Bastos, M. Evento extremo de ondas na Baía da Ilha Grande: Um estudo de caso. Bol. Do Obs. Ambient. Alberto Ribeiro Lamego 2011, 5, 27–44. [Google Scholar]
- Vieira, J.M.N. Matlab num Instante; Departamento de Eletrónica e Telecomunicações da Universidade de Aveiro: Aveiro, Portugal, 2004. [Google Scholar]
- Souza, A.M.d. Caracterização Ambiental da Bacia Hidrogáfica do Rio São Domingos a Partir da Análise Geoquímica e Isotópica Pb/Pb. Master’s Thesis, State University of Rio de Janeiro, Rio de Janeiro, Brazil, 2011. [Google Scholar]
- Aily, C. Caracterização Isotópica de Pb na Atmosfera: Um Exemplo da Cidade de São Paulo. Ph.D. Thesis, Universidade de São Paulo, São Paulo, Brazil, 2001. [Google Scholar]
- Moraes, R.P.; Figueiredo, B.R.; Lafon, J.-M. Pb-Isotopic tracing of metal-pollution sources in the Ribeira Valley, Southeastern Brazil. Terrae 2004, 1, 26–33. [Google Scholar]
- Gioia, S.M.C.L.; Pimentel, M.M.; Guimaràes, E.M.; Campos, J.E.G.; Dantas, E.L.; Maruoka, M.T.S. Atmospheric Deposition and Sources of Anthropogenic Lead in Sediments from a Recent Lake in Brasilia-Central Brazil. In Proceedings of the Symposium on Isotope Geology 2003, Salvador, Brazil, 24–27 August 2003. [Google Scholar]
- Bridgestock, L.; Rehkämper, M.; van de Flierdt, T.; Paul, M.; Milne, A.; Lohan, M.C.; Achterberg, E.P. The distribution of lead concentrations and isotope compositions in the eastern Tropical Atlantic Ocean. Geochim. Cosmochim. Acta 2018, 225, 36–51. [Google Scholar] [CrossRef] [Scilit]
- Komárek, M.; Ettler, V.; Chrastný, V.; Mihaljevič, M. Lead Isotopes in Environmental Sciences: A Review. Environ. Int. 2008, 34, 562–577. [Google Scholar] [CrossRef] [Scilit]

Disclaimer/Publisher’s Note: The statements, opinions and data contained in all publications are solely those of the individual author(s) and contributor(s) and not of MDPI and/or the editor(s). MDPI and/or the editor(s) disclaim responsibility for any injury to people or property resulting from any ideas, methods, instructions or products referred to in the content. |
© 2026 by the authors. Licensee MDPI, Basel, Switzerland. This article is an open access article distributed under the terms and conditions of the Creative Commons Attribution (CC BY) license.