


Abstract
Glacier mass balance and ice flow dynamics, strongly influenced by climatic variability, topography, and geological–structural controls, can be precisely characterized through in situ GPS measurements of surface ice velocity, though such data remain limited due to logistical challenges in field acquisition. This study presents direct measurements of surface ice velocity on Grey Glacier, a major outlet glacier of the Southern Patagonian Icefield (SPI) in Chile. Ice flow was monitored over a one-week period in late 2002 by tracking the displacement of six stakes installed on the glacier surface. The resulting velocity data reveal spatial patterns of surface flow that provide significant information for the comparison and validation of remote sensing observations, which is particularly relevant considering that the ice mass from which the data were collected has since disappeared due to glacier retreat. The combined use of ground-based and remote sensing methods is essential for advancing our understanding of glacier motion and behavior, particularly in the context of climate forcing.
1. Introduction
Direct methodologies, such as GPS measurements, offer high precision and temporal resolution for measuring ice velocity, enabling detailed analysis of glacier dynamics. However, due to high costs, limited accessibility, and associated risks, direct field measurements remain scarce in certain remote regions of the planet.
This study was conducted on Grey Glacier, a major outlet glacier in the Southern Patagonia Icefield (SPI). The SPI and the Northern Patagonia Icefield (NPI), located in Patagonia (40–55° S), together constitute the third-largest freshwater reserve on Earth, after Antarctica and Greenland [1,2,3,4,5].
These icefields have been identified as regions undergoing substantial mass loss, with frontal ablation representing a significant portion of total ablation [6,7,8,9]. Quantifying frontal ablation and understanding the dynamics of calving glaciers remain major uncertainties in projections of global glacier mass loss [8,10,11]. Surface ablation, driven by meteorological conditions, also plays a crucial role in glacier mass balance [8,12,13,14]. However, the lack of field observations has limited a comprehensive understanding of drivers of ablation in the SPI [13]. Studies combining remote sensing techniques with in situ measurements are essential for improving our understanding of these processes [15,16].
While most glaciers in Patagonia are rapidly retreating, there are exceptions highlighting the complex and heterogeneous nature of glaciers’ response to climate change. Pio XI Glacier (49° S), the largest in Patagonia, is also one of the very few that are currently advancing [17,18]. Some glaciers have remained relatively stable or have even advanced, suggesting the influence of local factors such as precipitation patterns, glacier geometry, and subglacial conditions [18,19].
The Patagonian Icefields, particularly the SPI, have undergone rapid retreat and significant glacier thinning in recent decades [20,21,22]. Grey Glacier, along with Tyndall and Amalia glaciers, has experienced overall negative surface elevation changes [7]. Monitoring surface velocities and ice-front positions is essential to understanding individual responses of glaciers to climate change [7,15].
In this context, the study of surface ice velocity in temperate glaciers is crucial to understanding the dynamics of ice loss and the impacts of global climate change on these sensitive environments [15].
Surface ice velocity is a key parameter for estimating ice volume variations in response to global warming and its subsequent impact on sea-level rise [15,23]. Traditional methods for measuring ice velocity fields often involve cross-correlating pairs of satellite images to track feature displacement between two acquisition dates [15]. However, direct methodologies enable detailed analysis of glacier dynamics [16]. Recent research has highlighted the heterogeneous changes occurring within the SPI, showing variability in both the magnitude and timing of individual glacier responses [9]. Understanding these variations requires detailed, site-specific studies that capture the complex interplay of climatic, topographic, and glaciological factors influencing glacier behavior [9,24].
Nevertheless, studies based on direct in situ observations that characterize ice mass movements, essential for surface mass balance and energy balance models, remain extremely limited in this region [6,11].
This study focuses on an area near the terminus of Grey Glacier to investigate its dynamic behavior using direct GPS measurements of surface ice velocity. The primary objective is to obtain empirical in situ data on glacier surface motion by measuring ice velocity from stakes installed near the glacier terminus.
The results provide valuable insights into the processes driving glacier change in the SPI and contribute to improving future projections of ice mass loss and sea-level rise. This is particularly relevant given that the ice mass where the measurements were taken has gone due to the glacier’s continued retreat [7,8].
2. Materials and Methods
To quantify short-term surface ice motion, an area of approximately 0.5 km2 was selected near the frontal zone of the westernmost terminus of Grey Glacier. A set of stakes was installed roughly perpendicular to the main flow direction, aligned transversely to the central axis of the glacier tongue. This stake deployment strategy is commonly used in glaciological studies, as it allows for monitoring ice flow across a defined transect [25,26,27,28]. Each stake was vertically drilled into the ice to a stable depth and georeferenced using a GPS device [29]. The use of GPS in stake measurements enables precise tracking of stake positions over time [30,31].
After a seven-day interval, all stakes were removed, and their positions were remeasured using the same GPS device. This temporal resolution is appropriate for capturing short-term variations in ice velocity [32,33,34]. Horizontal displacements were calculated as vector differences between initial and final stake positions in Universal Transverse Mercator (UTM) coordinates. This displacement calculation method is standard in glaciology, providing a quantitative measure of ice motion [29].
For each stake, the total displacement, average daily velocity, and direction of motion (azimuth), relative to geographic north, were derived. These parameters offer a comprehensive description of ice motion at each stake location [35].
All measurements were compiled into a geospatial dataset and visualized using vector plots. These plots are commonly used to visualize glacier surface velocities and facilitate the identification of spatial patterns in ice flow [36]. The resulting displacement vectors were interpreted in the context of the local glacier geometry and expected ice flow dynamics near the terminus. This analysis enhances our understanding of the relationship between ice flow and frontal dynamics [37,38].
2.1. Study Site
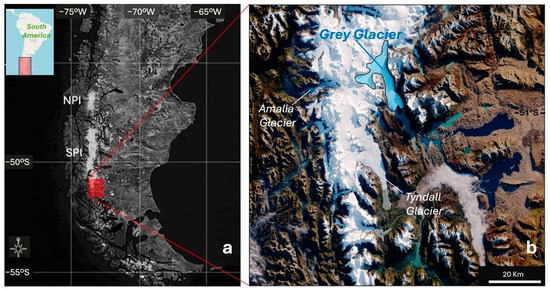
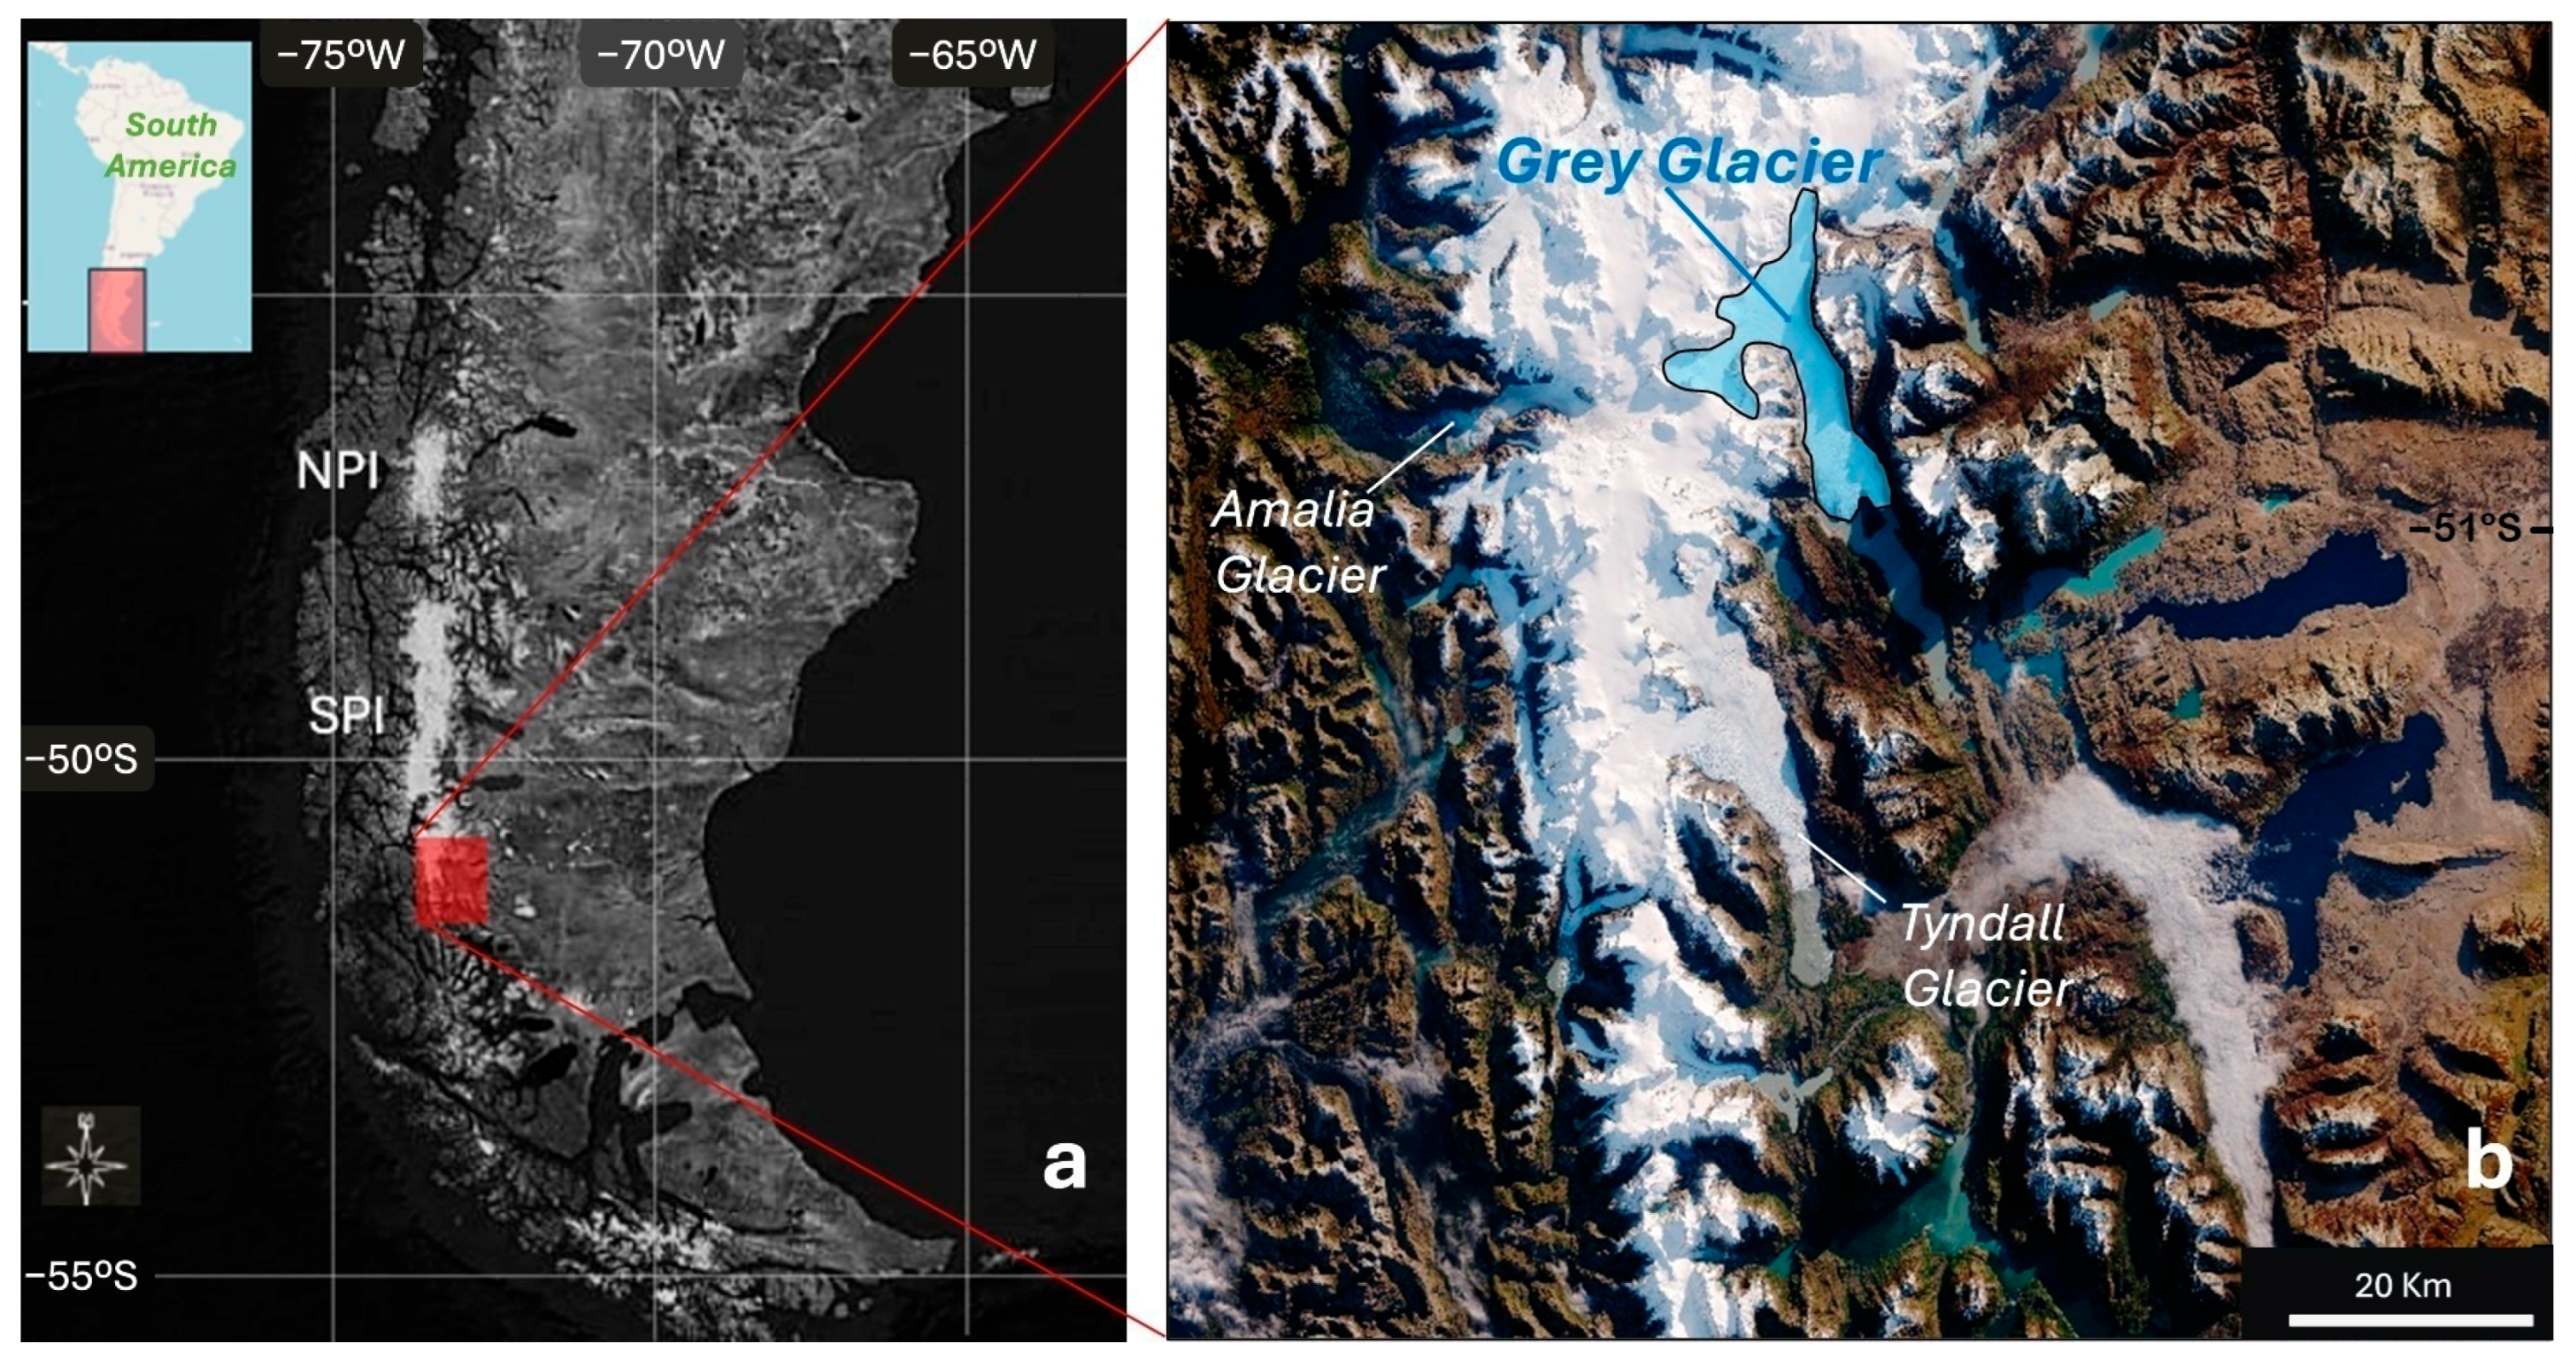
This study was conducted on Grey Glacier, one of the principal outlet glaciers of the SPI (Figure 1). This glacier flows into Lago Grey, located in Torres del Paine National Park, Chile (50°59′ S, 73°10′ W), through three distinct lobes at present (Figure 2). The terminus flows through a geologically complex area characterized by intense folding, which influences ice dynamics in this sector.
Figure 1.
Geographic location of Grey Glacier. (a) Extent of the NPI and SPI in Patagonia. The inset shows the location of Patagonia in South America. (b) Location and approximate extent of Grey Glacier in the southeastern part of the SPI. The background is a false-color mosaic from a Landsat 7 ETM+ image acquired in 2001. White areas indicate regions covered by snow or ice.
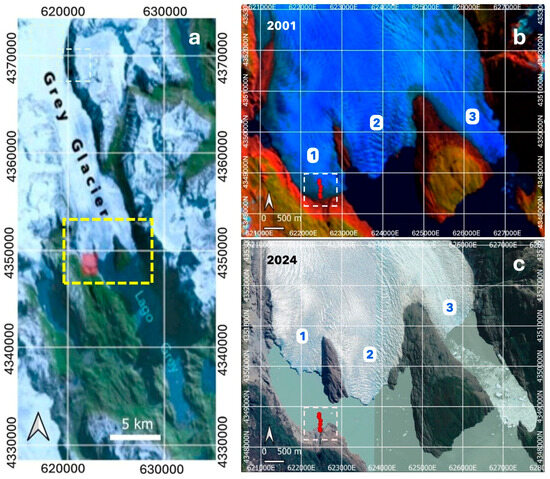
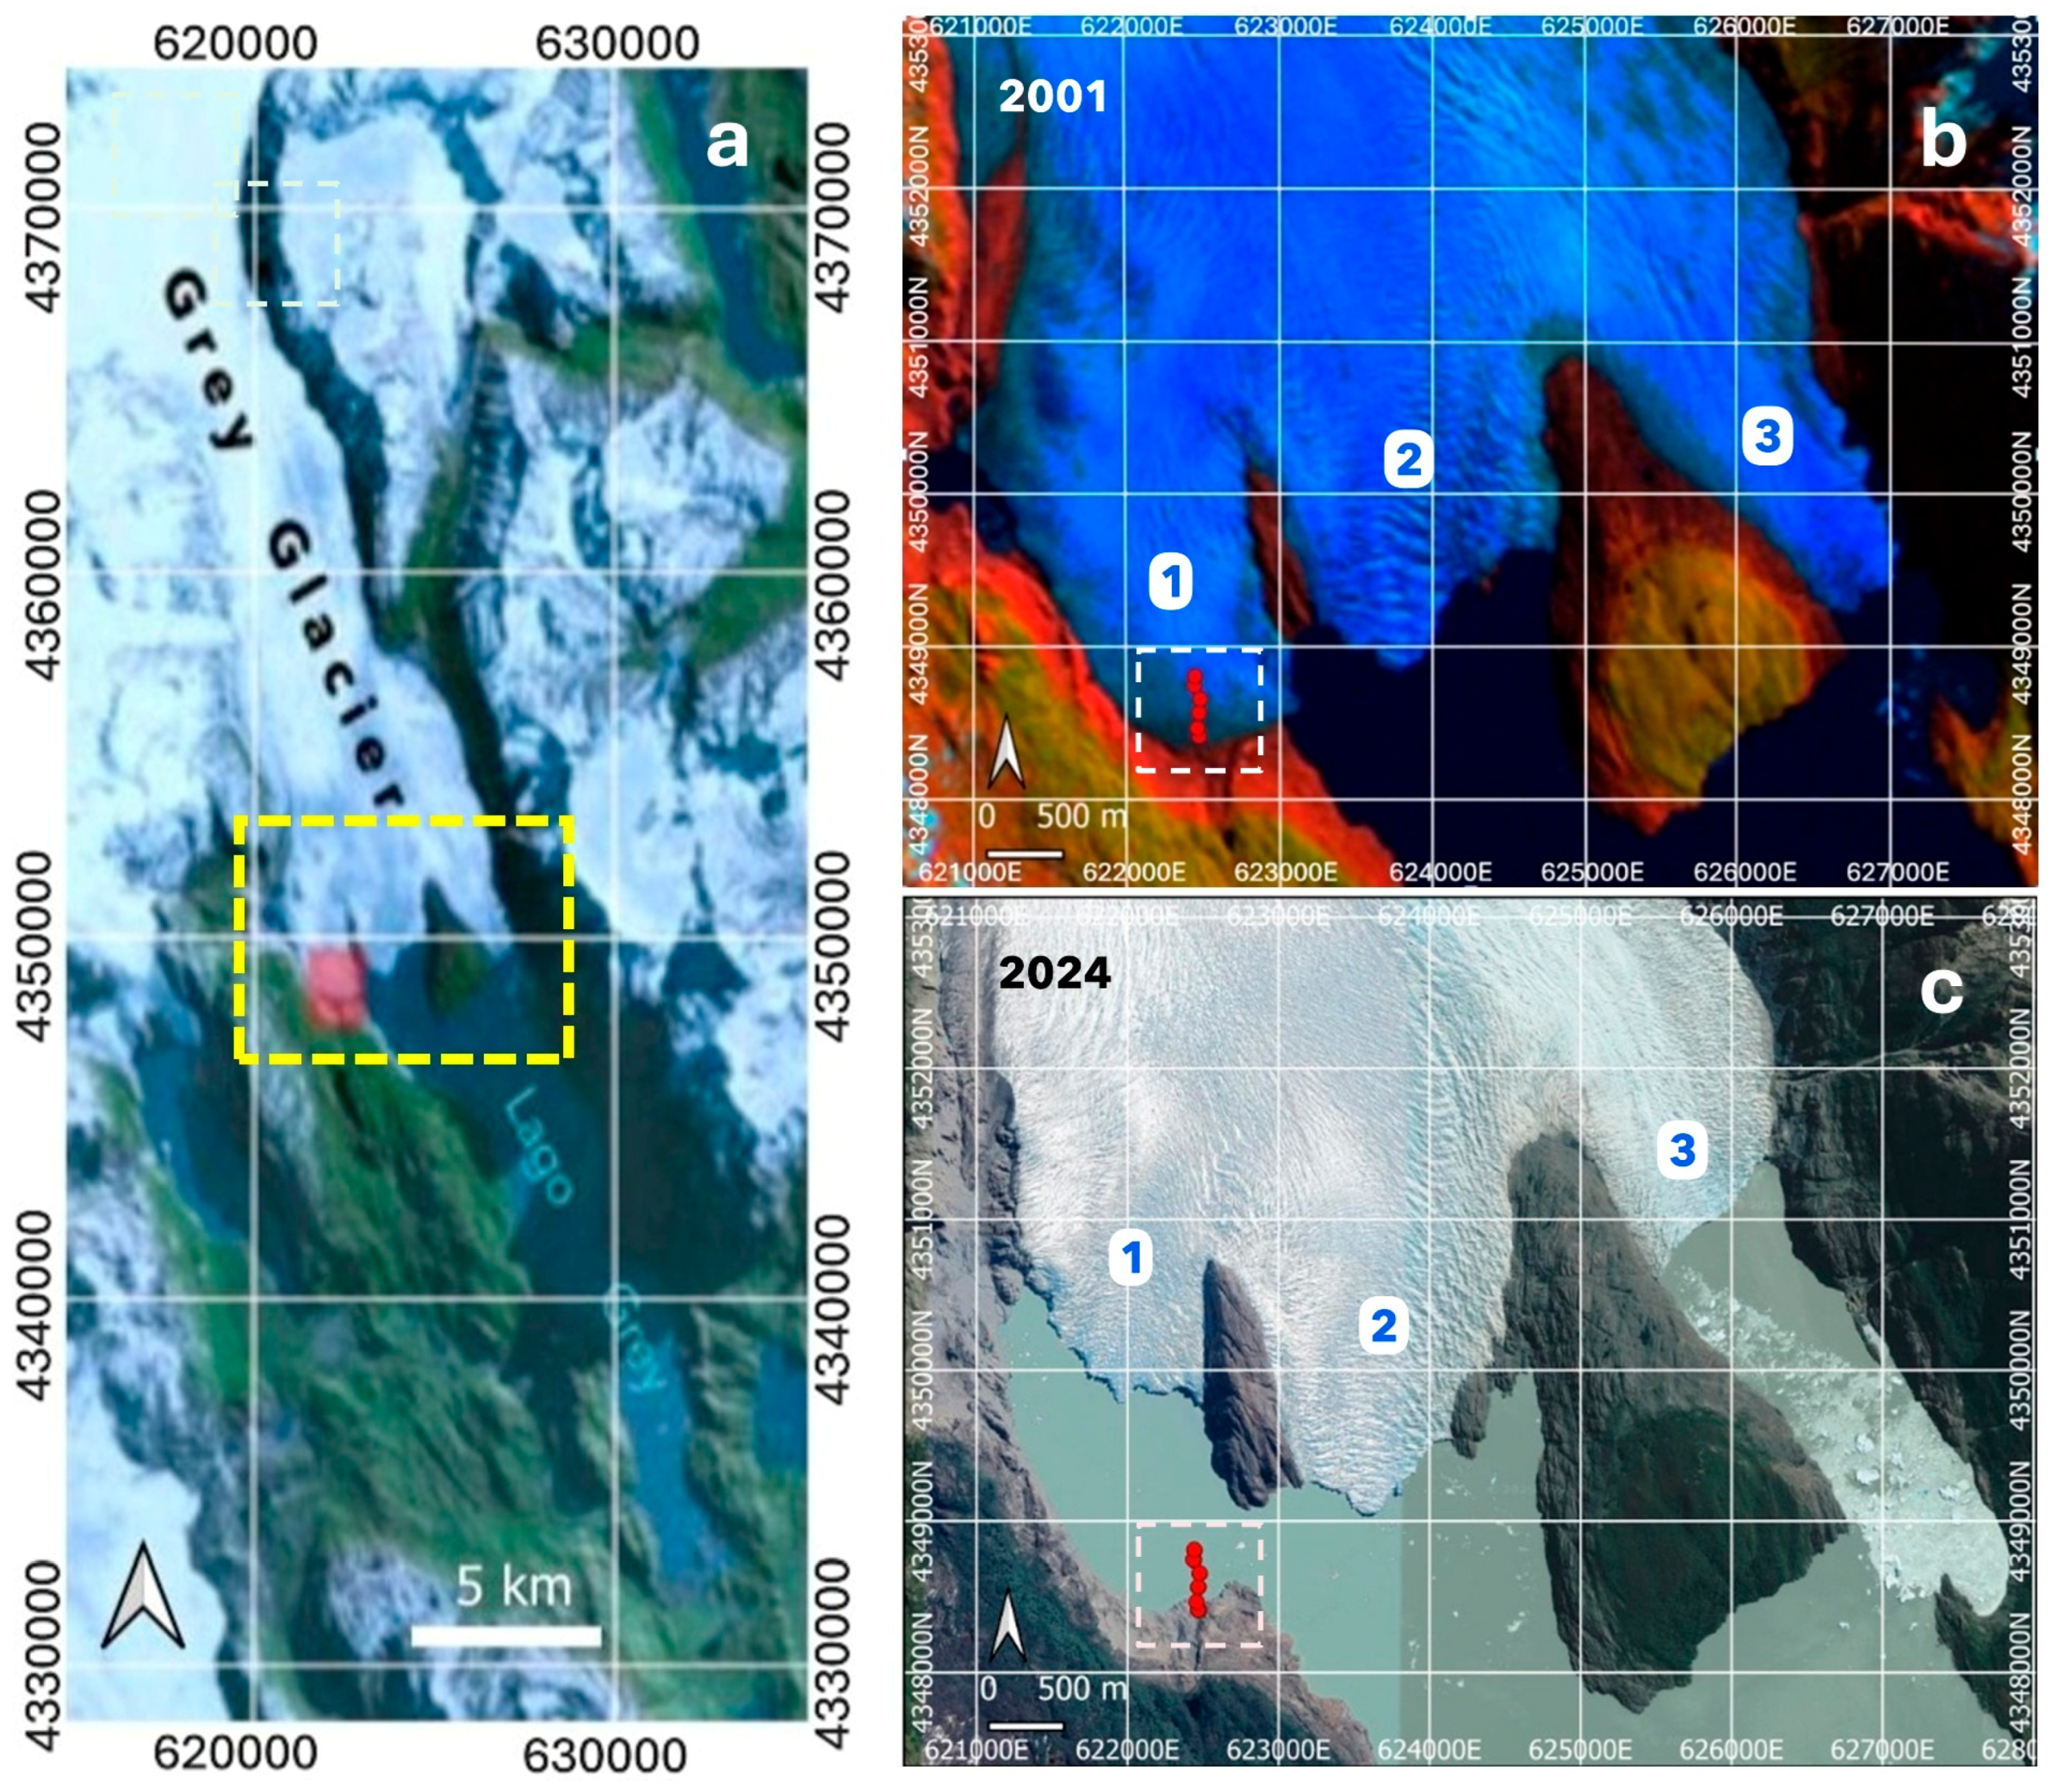
Figure 2.
Location of the study area in Grey Glacier. (a) Terminus of Grey Glacier (yellow rectangle). The data collection zone is marked in red within the rectangle. (b,c) are enlargements of the rectangle shown in (a), showing detailed Landsat satellite views of the Grey Glacier front in 2001 and 2024, respectively. The glacier flows into Lago Grey through three distinct termini: 1, 2, and 3. Stake installation was carried out at terminus 1. The red dots within the dashed white rectangle indicate the initial stake positions and the surveyed area, approximately 0.5 km2.
The study focuses on the western terminus, approximately 0.5 km from the ice front at the time of data collection (Figure 2b). Grey Glacier is a temperate, dynamic calving glacier that is highly sensitive to seasonal climatic variations [39]. Since the 1980s, the western terminus has retreated by more than 2 km, greater than the retreat observed at the other two termini, showing a trend consistent with other Patagonian glaciers [39,40,41].
As a result, the glacier ice, over which the data were collected, has since disappeared (Figure 2c). This fact is particularly relevant, as it enables a clearer examination of the underlying subglacial bedrock topography, which may help contextualize the findings of this study. According to water depth soundings conducted by Sugiyama et al. (2019) [42], the maximum depth near the eastern terminus is approximately 300 m (Figure 2c(3) and Figure 3a(3)).
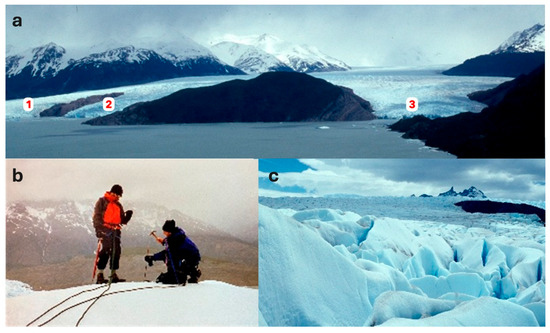
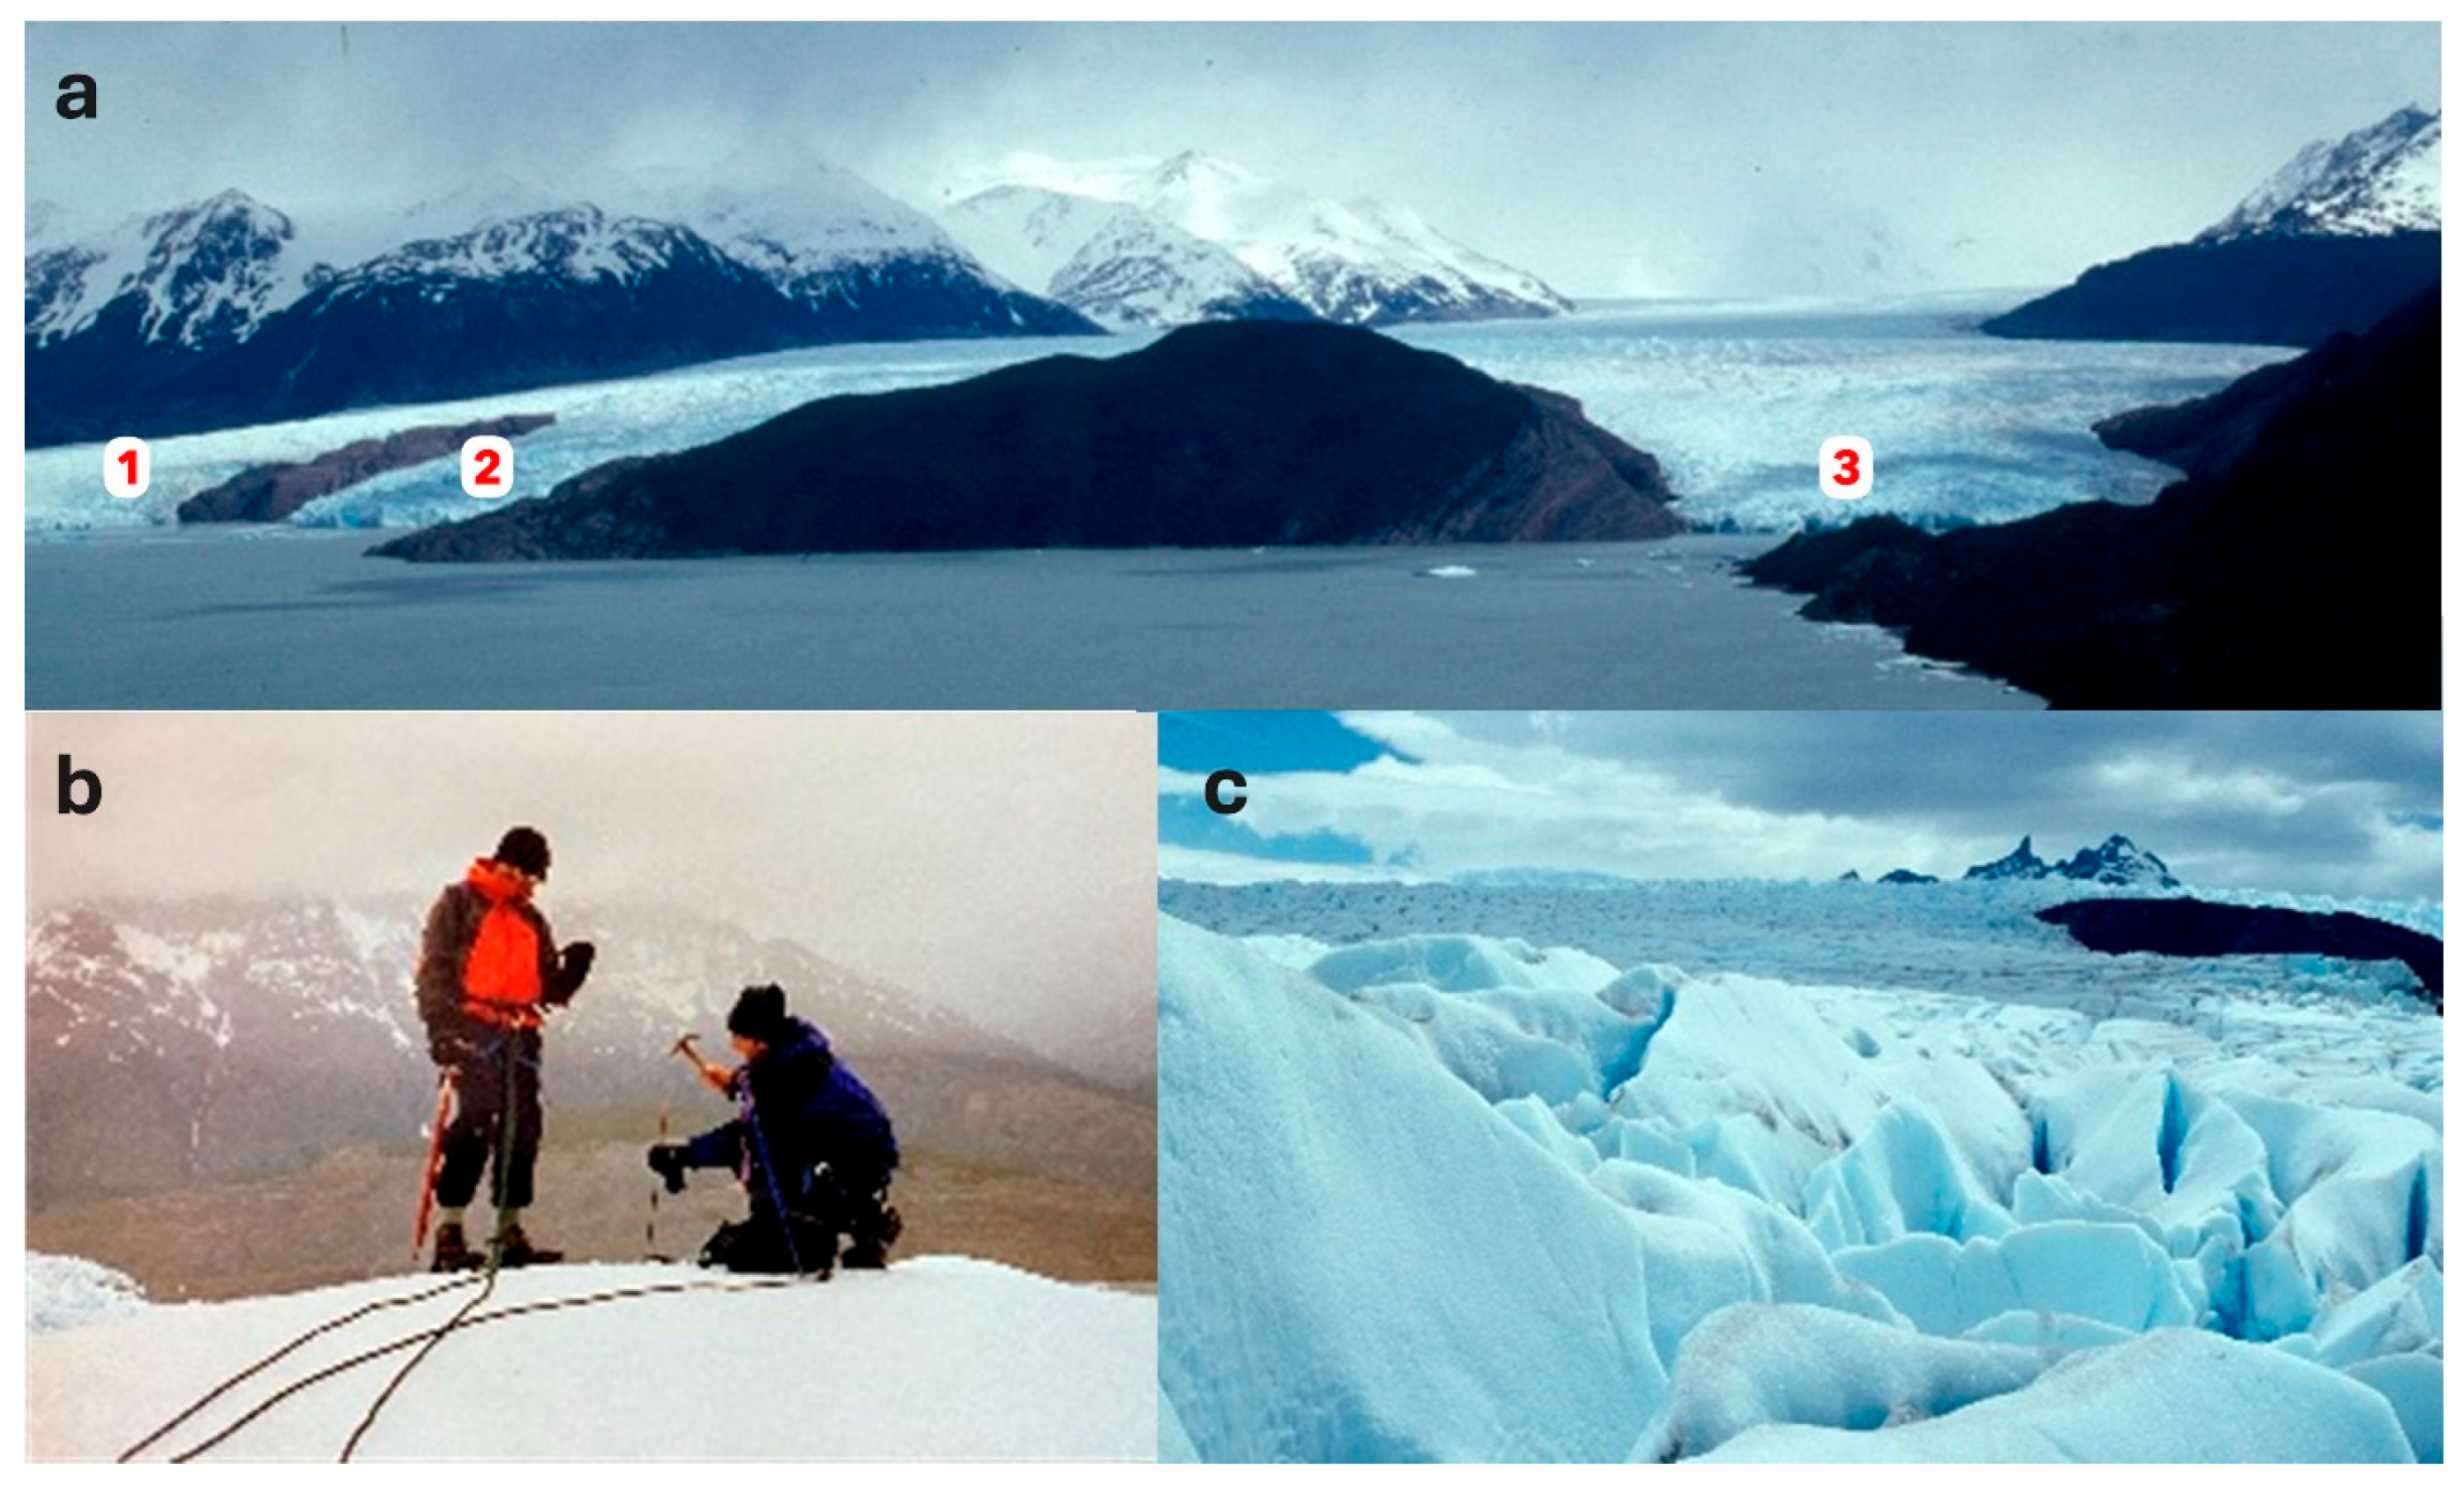
Figure 3.
Set of photographs showing characteristics of the study area and fieldwork activities. (a) Panoramic view of the Grey Glacier front in November 2002. At that time, the glacier had a discontinuous front with three main termini (1, 2, and 3), a configuration that remains today (Figure 2c). (b) Fieldwork during the installation of stakes on the glacier surface (29 November 2002). (c) Heavily crevassed glacier surface in the surveyed area.
2.2. Glacier Stake Installation and GPS Survey
To directly measure surface ice velocity, six iron stakes (120 cm in length, 14 mm in diameter) were manually installed vertically into the glacier surface along a transect perpendicular to the central flowline of the western lobe of Grey Glacier (Figure 3b). Installation was carried out ensuring adequate vertical alignment and sufficient insertion depth (40–60 cm) to minimize the risk of stake loss due to surface melting or toppling. The stakes were placed at intervals of approximately 50–100 m, extending toward the central flow axis, to capture local spatial variability while maintaining logistical feasibility for retrieval.
Each stake was surveyed using a Garmin eTrex (Camo2002 series, Garmin Ltd., Xizhi, New Taipei, Taiwan) handheld GPS device. Coordinates were recorded in UTM coordinate system (Easting [E], Northing [N], Zone 18F South, WGS84 datum). Under clear-sky conditions, the estimated horizontal positional accuracy was ±2–5 m, consistent with the device’s specifications.
Initial positions (Ei, Ni) were recorded on 29 November 2002, and final positions (Ef, Nf) were obtained exactly seven days later, on 6 December 2002, using the same observation procedure. During both surveys, weather conditions shifted quickly between clear, partly cloudy, and overcast states, and the GPS receiver was held stationary for at least 30 s to enhance accuracy through signal averaging.
2.3. Displacement and Velocity Calculation
Surface ice velocity was determined from the horizontal displacement between the initial and final positions of each stake. For each stake, the displacement vector was calculated based on the differences in the eastward (ΔE) and northward (ΔN) components in UTM coordinates between the two GPS measurements:
The total horizontal displacement (D) was calculated using the Euclidean distance formula:
Mean velocity (V) was computed as:
where ΔE and ΔN represent changes in easting and northing, respectively, and Δt is the time interval in days. Data storage and analysis were performed using spreadsheets in Microsoft Excel (Version 2510).
2.4. Flow Direction and Displacement Angle
Vector analysis of stake displacements on the glacier surface can reveal the approximate general direction of ice flow. This general flow direction is interpreted as the weighted average of the displacement vectors of all stakes.
To determine the prevailing direction of surface ice flow in the study area, we analyzed horizontal displacements and azimuthal angles (expressed in degrees clockwise from true north) of six stakes measured over a seven-day period during the summer season.
For each stake, the eastward (dx) and northward (dy) Cartesian components of displacement were calculated using the following trigonometric relationships derived from the measured displacement vectors:
where
- D is the horizontal displacement (in meters).
- θ is the azimuthal direction (in degrees).
- dx and dy represent the eastward and northward Cartesian components of displacement, respectively.
The net flow vector was obtained by summing the individual eastward and northward displacement components of all stakes:
The azimuthal direction of the resultant horizontal flow vector (θ) was calculated using the arctangent function as follows:
Angles were expressed in both radians and degrees to facilitate the geometric interpretation of ice motion.
2.5. Accuracy and Limitations
Given the use of a handheld GPS device, the absolute accuracy of individual stake positions is limited. However, relative displacements over short time intervals can still provide reasonable estimates of surface velocity, provided that consistent measurement conditions are maintained [43]. The expected uncertainty in horizontal displacement is estimated at ±5 m. This level of precision is generally sufficient for resolving bulk ice motion in small- to medium-scale field studies [44].
2.6. Data Handling
All GPS data were converted and projected into UTM coordinates using QGIS v3.40 Geographic Information System (GIS) software. Displacement vectors were then visualized and analyzed to assess spatial consistency and to detect any anomalous stake movements, such as those potentially caused by melting, tilting, burial, or stake loss. The six glacier stakes were recovered in a tilted position—some nearly lying flat—and/or partially buried but were considered potentially valid for analysis. Valid vectors were visualized and cross-verified on a satellite basemap, allowing comparison with the glacier flow patterns previously identified from satellite imagery and earlier studies. For this purpose, ASTER, Landsat, and Sentinel satellite images were used, processed and visualized with tools such as USGS Earth Explorer, Copernicus Browser, Google Earth Engine and Earth Pro (v 7.3).
3. Results
Despite the logistical challenges inherent to fieldwork in the southernmost region of Patagonia, all planned measurements were successfully carried out. Following the recovery of the stakes after a seven-day observation period, the resulting surface displacement data were obtained as follows:
3.1. Horizontal Displacement
During a short-term field campaign conducted between 29 November and 6 December 2002, six stakes (S1 to S6) were deployed near the terminus of Grey Glacier. Each stake was installed by drilling into the glacier surface, and its initial position was recorded using a GPS receiver (UTM coordinates, Zone 18F South, WGS84 datum). After a seven-day interval, all stakes were revisited and their final positions recorded, allowing for the calculation of horizontal displacement vectors (Equation (1)) and surface velocities (Table 1).
Table 1.
GPS-derived horizontal displacement and surface flow direction near the terminus of Grey Glacier over a seven-day period.
3.1.1. Magnitude of Displacement
Measured surface displacements over a seven-day period ranged from 6.08 m (S2) to 23.20 m (S5). Stake S5, positioned closer to the central flowline, exhibited the greatest displacement, suggesting a pronounced longitudinal gradient in flow velocity near the glacier terminus.
A general trend of increasing displacement toward the south is evident, consistent with the glacier’s slope and terminus morphology. This spatial pattern supports the presence of accelerated ice flow toward the calving front, a characteristic commonly observed in tidewater and lake-terminating glaciers, where basal conditions and longitudinal stress gradients play a significant role in controlling ice dynamics [39,40].
3.1.2. Stake Flow Directions
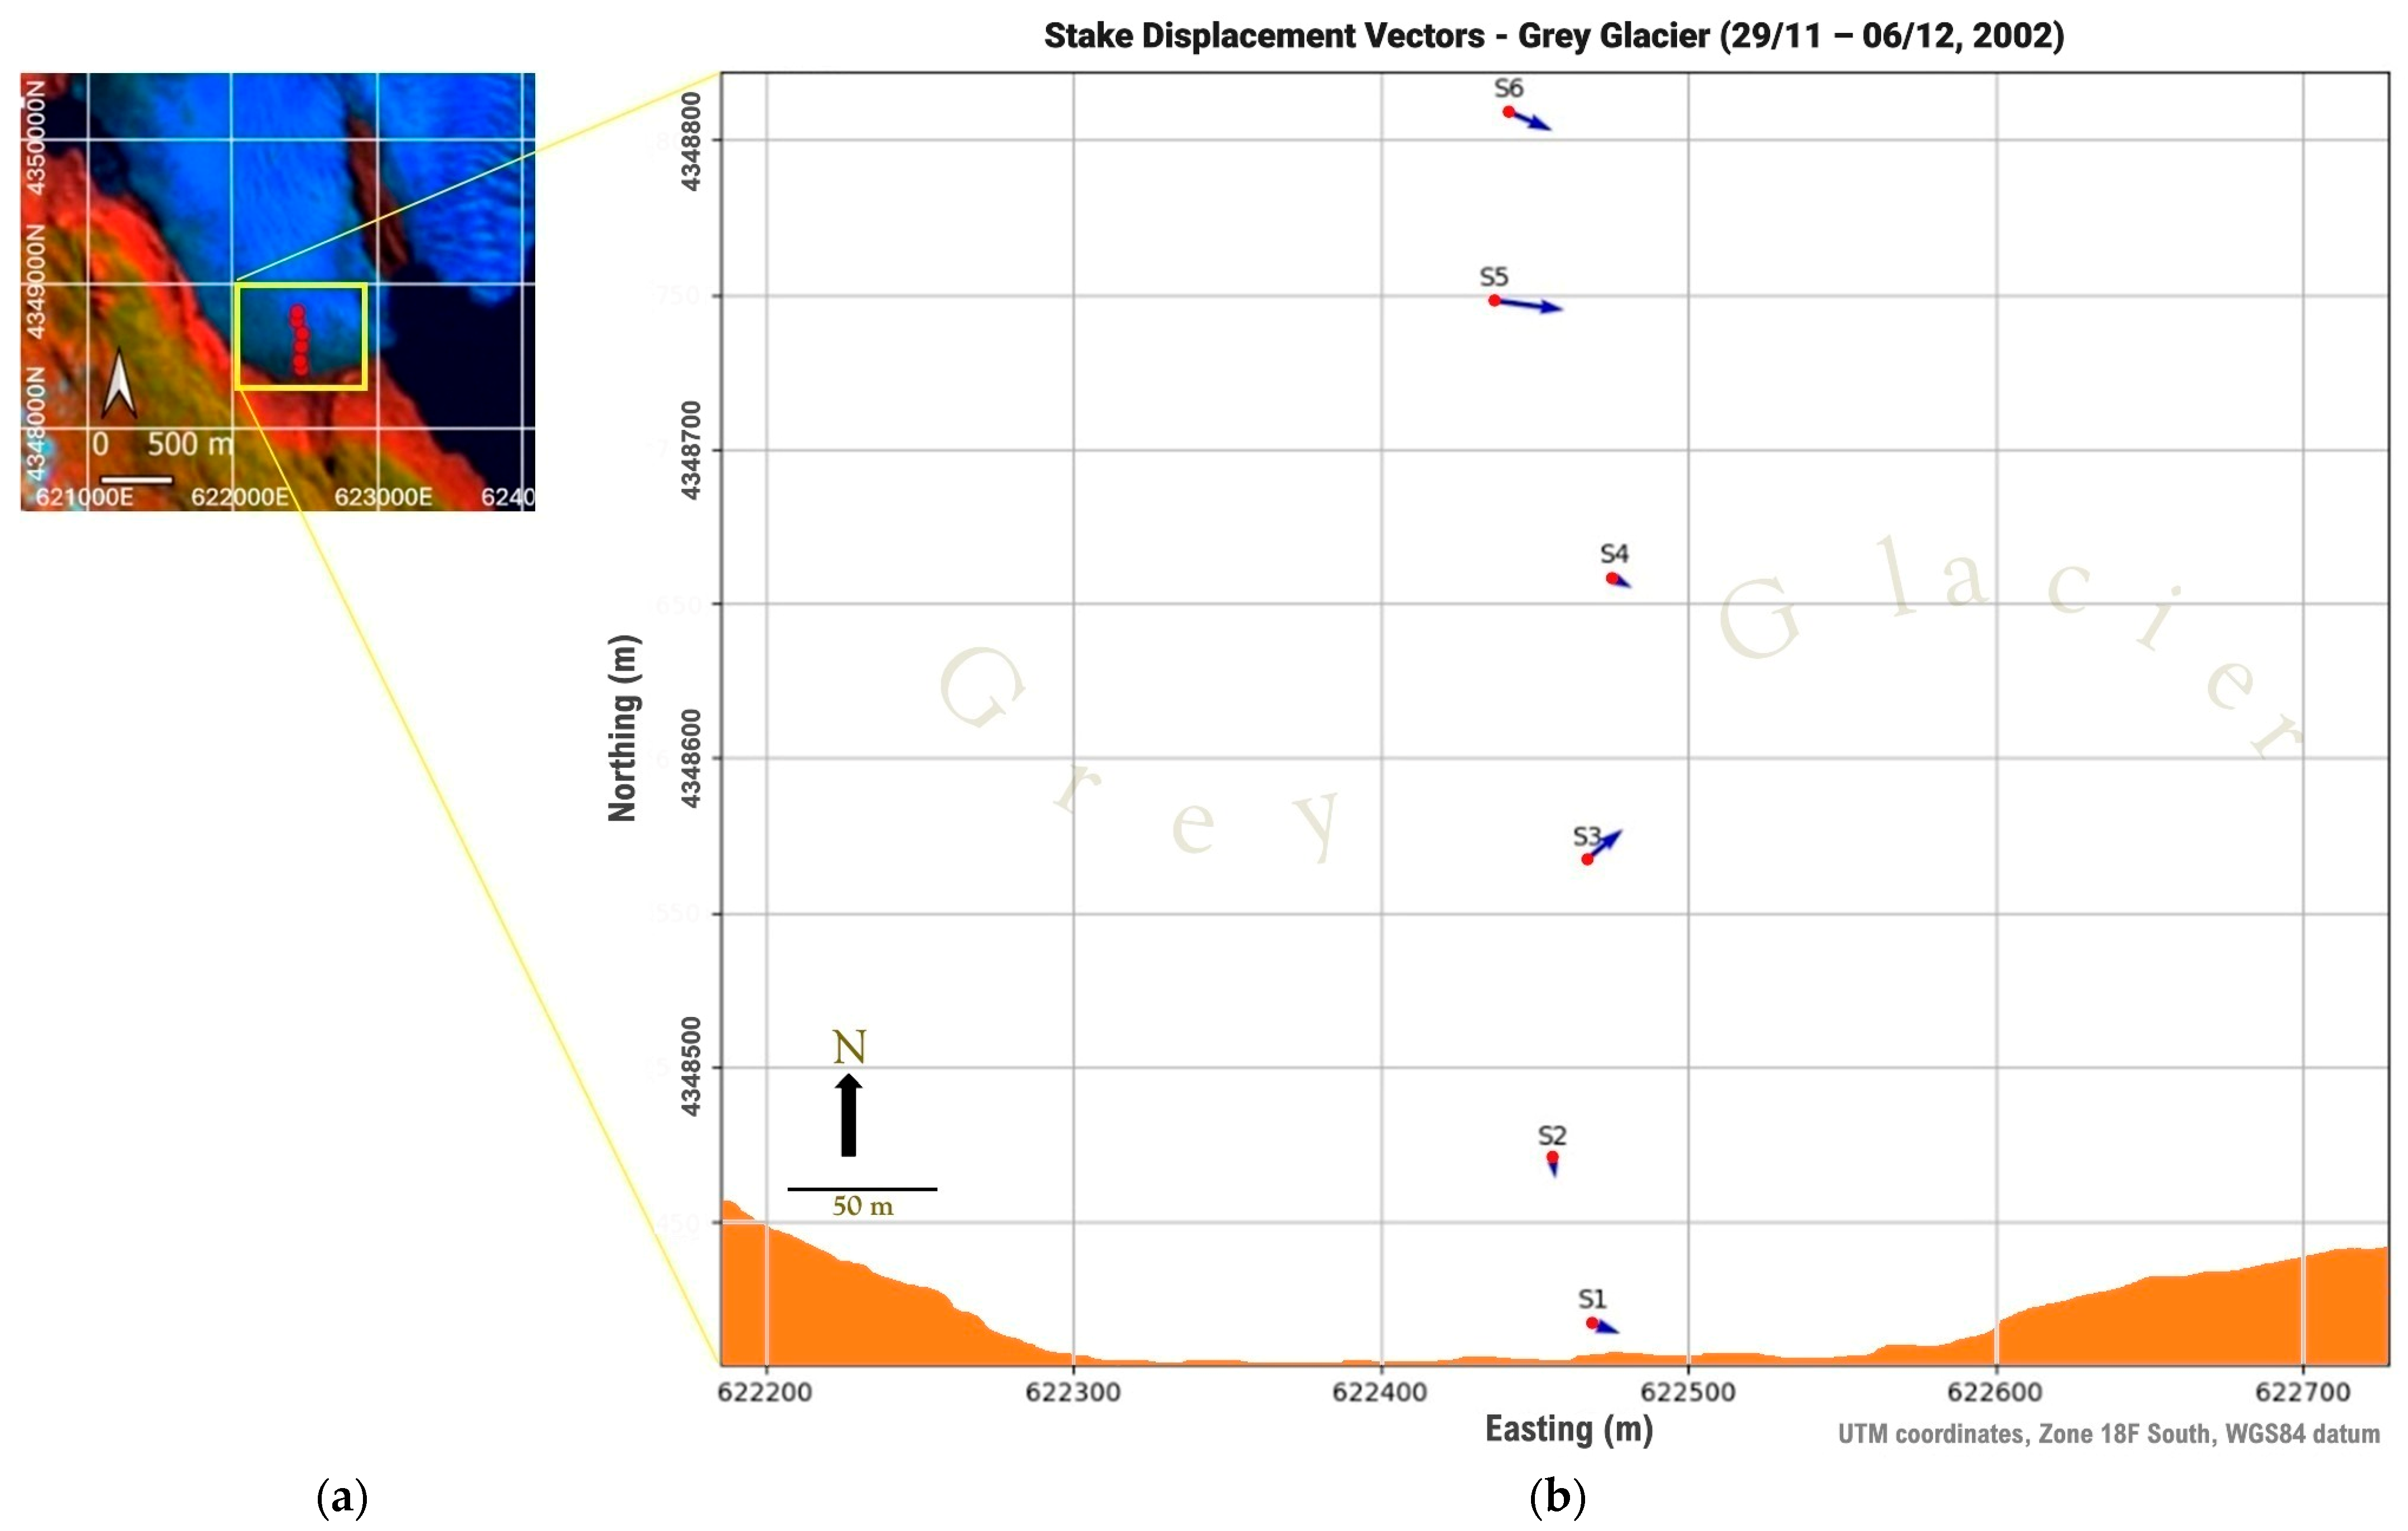
Flow directions were calculated as azimuths of the displacement vectors relative to geographic north (measured clockwise). Most vectors fall within a southeasterly quadrant (approximately 96° to 115°), consistent with the principal flow direction of Grey Glacier (Figure 1). However, significant deviations were observed at S2 (169°) and S3 (48.8°), suggesting localized variations in ice flow dynamics (Figure 4).
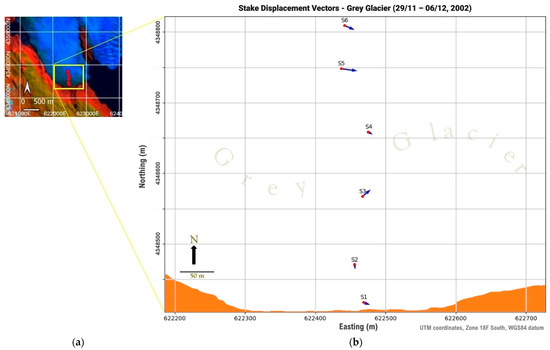
Figure 4.
(a) Study area (Figure 2b). (b) Surface ice displacement vectors near the terminus of Grey Glacier, recorded between 29 November and 6 December 2002. Red points correspond to the initial positions of the stakes. Blue arrows represent the horizontal displacement of stakes (S1 to S6), based on GPS measurements in UTM coordinates. Each vector indicates both the magnitude and direction of surface ice movement over the seven-day interval. Vector length is proportional to displacement magnitude, with a reference scale provided by the UTM grid. Ice flow is predominantly oriented southeastward, consistent with glacier surface slope and overall morphology toward Lago Grey (see Figure 2a).
These directional anomalies may be associated with lateral shear zones, subglacial topographic controls, or flowline divergence and convergence near the glacier front. Such deviations highlight the complex flow regime characteristic of fast-flowing outlet glaciers.
3.1.3. General Surface Ice Flow Direction
To estimate the overall surface ice flow direction in this sector of Grey Glacier, horizontal displacement measurements from the six stakes were analyzed. The magnitude and azimuth of each displacement vector were decomposed into Cartesian components to determine the general flow direction (Table 2).
Table 2.
General surface ice flow direction, eastward and northward vector components.
For each stake, the eastward (dx) and northward (dy) components were calculated using trigonometric decomposition of the displacement vectors, as defined by Equations (3) and (4).
The average of the eastward and northward vector components across all six stakes was used to determine the overall direction of surface ice motion:
The resultant flow vector was calculated by summing the individual eastward and northward components. Its orientation was then determined using the arctangent function (Equation (5)):
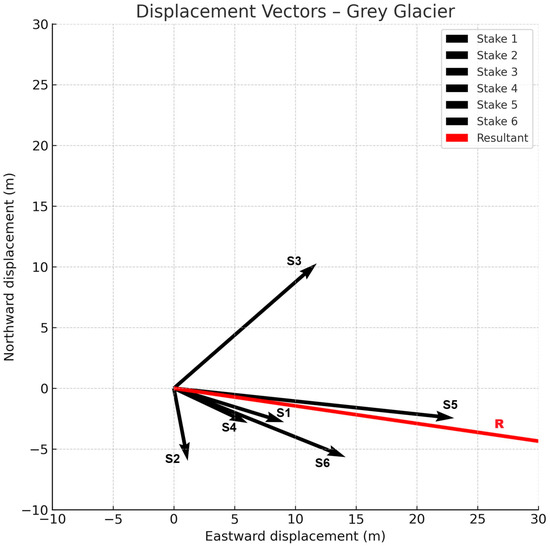
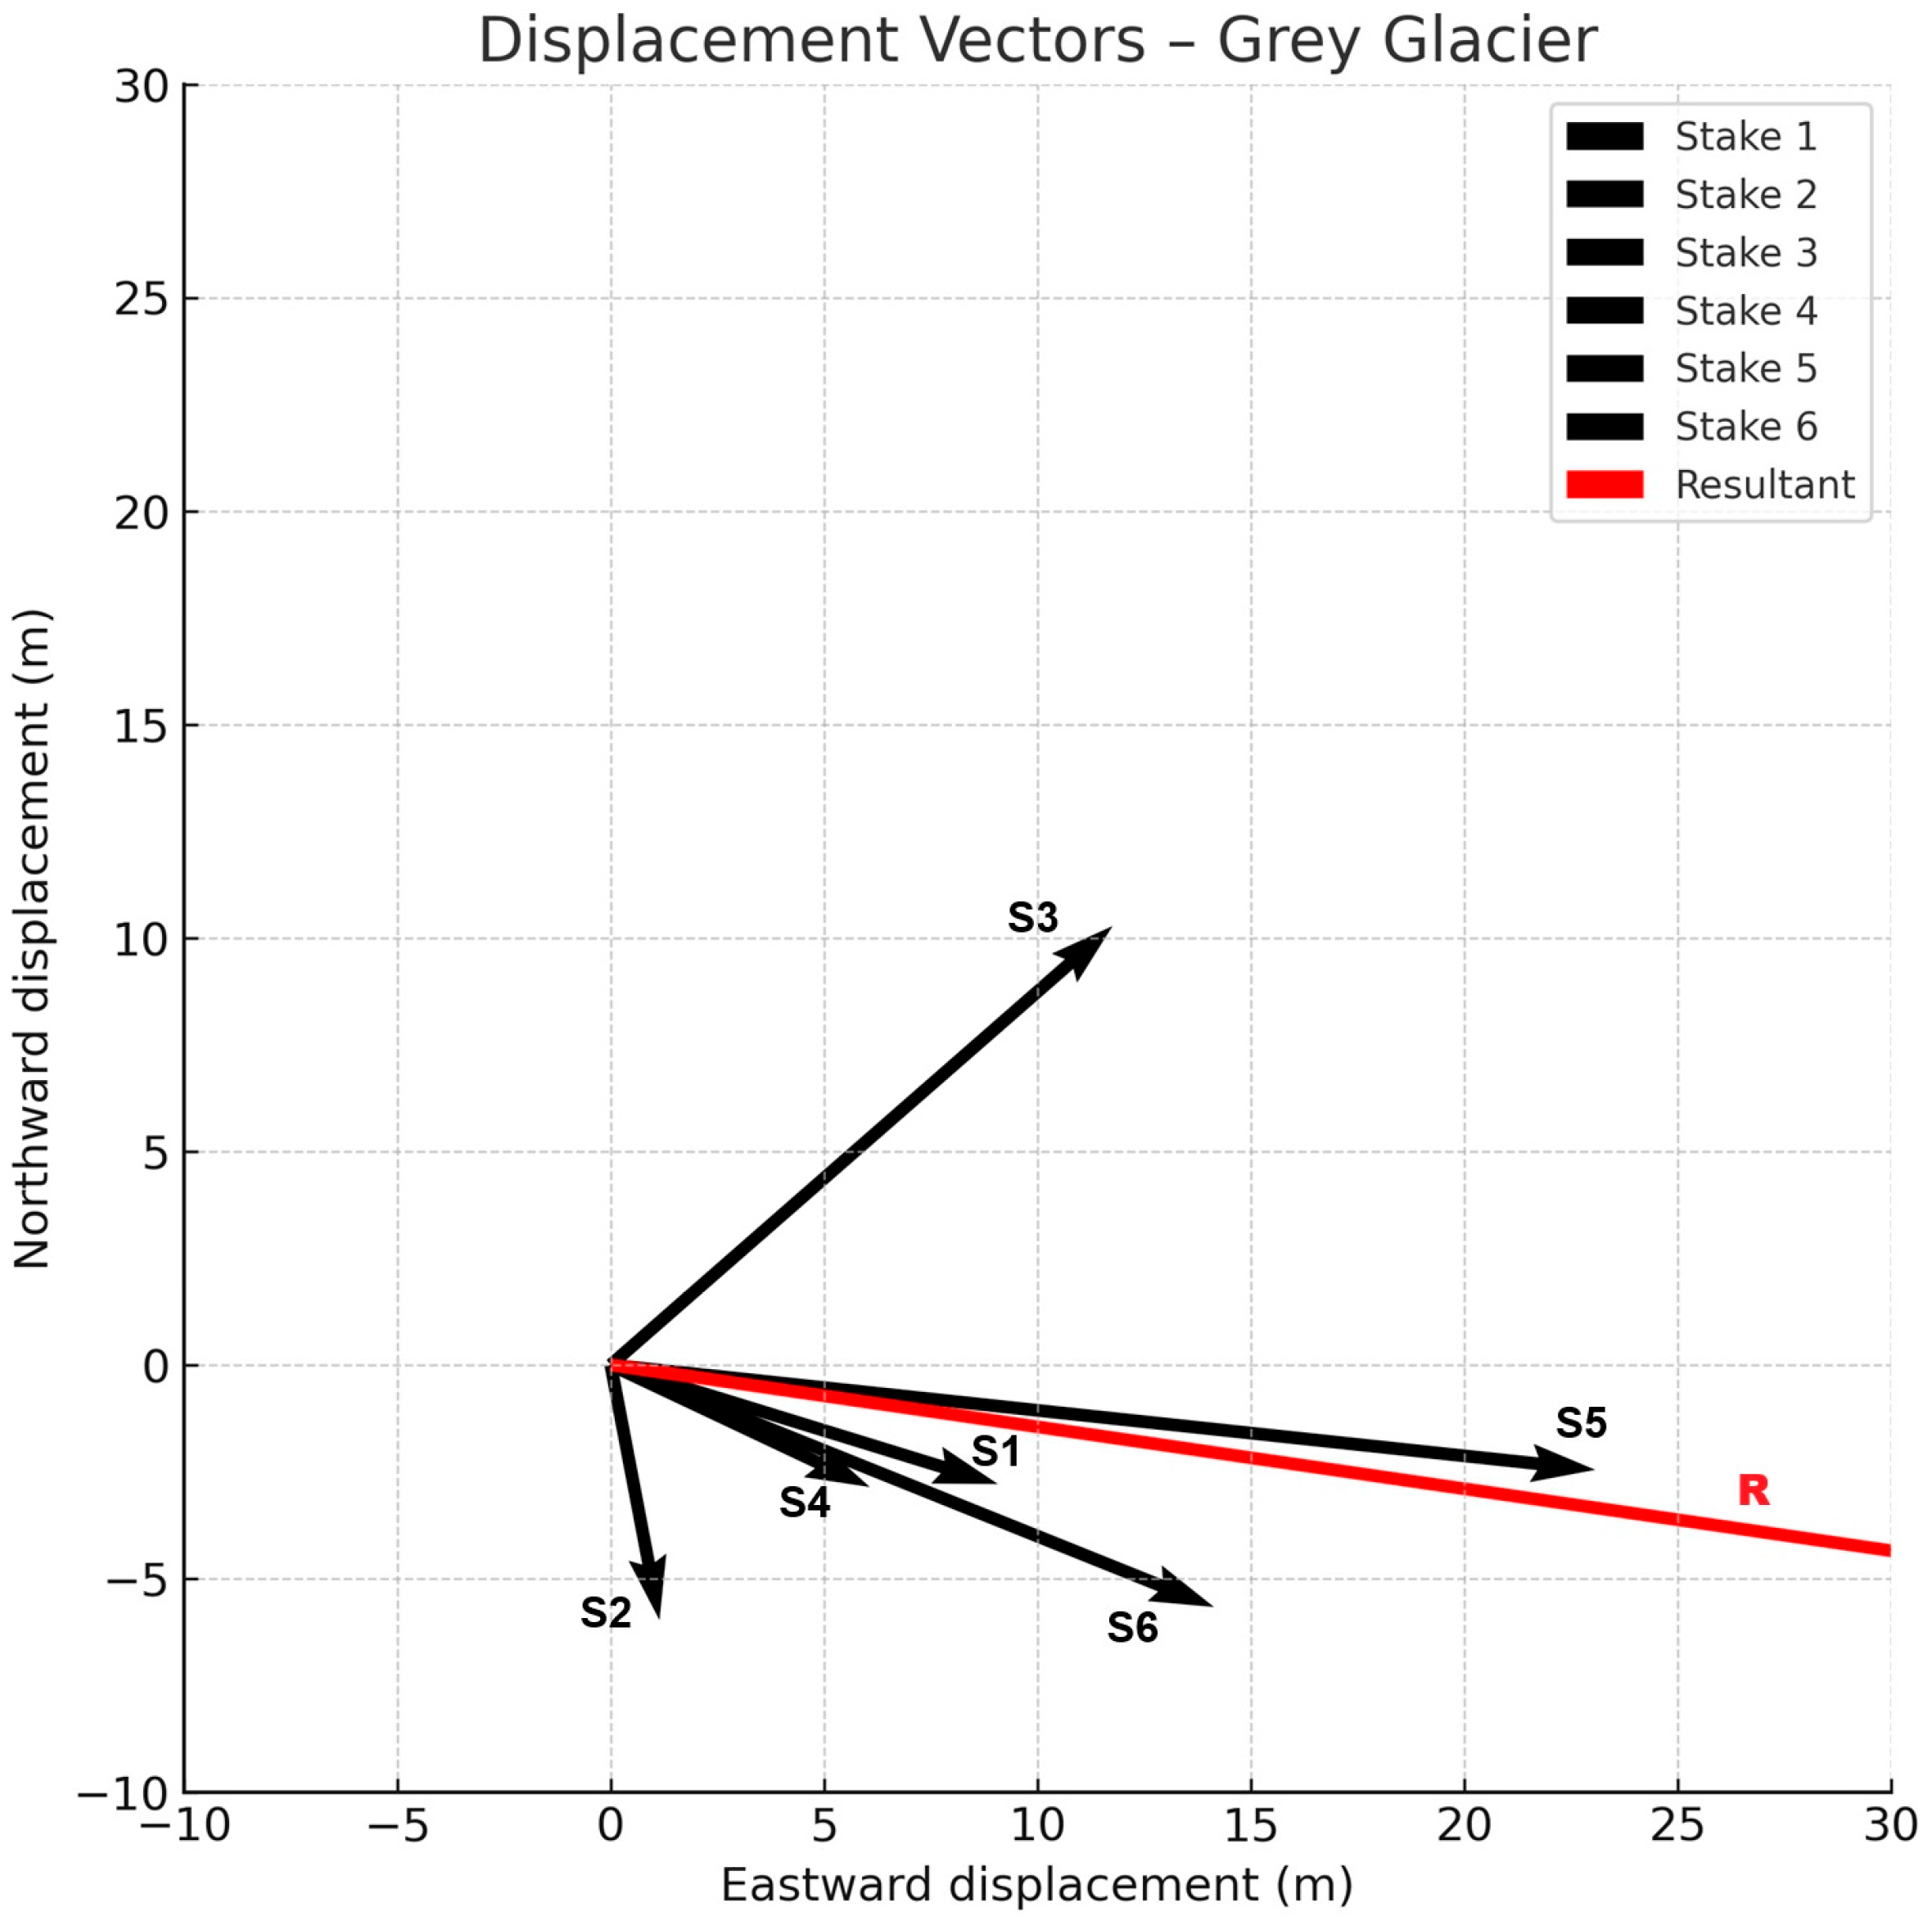
The resultant vector indicates a general ice flow direction of approximately 98.2°, corresponding to an east–southeastward movement (Figure 5). This flow orientation reflects the deflection of the ice mass in this sector, likely influenced by the underlying topography.
Figure 5.
Individual stake displacements and resultant flow vector near the terminus of Grey Glacier. The general ice surface flow direction in the surveyed area, represented by the resultant vector (R), is approximately 98.2° from east, indicating a predominant east–southeastward motion. This vector represents the average horizontal displacement over a one-week period during the summer season and can be interpreted as the dominant strain axis at this location. Directional variability observed at stakes S2 and S3 suggests localized flow complexity, likely influenced by surface topography or basal hydrological conditions. These deviations highlight the spatial variability of ice dynamics near the glacier front and may be relevant for understanding short-term changes in frontal stress regimes.
Figure 5 shows the individual displacement vectors along with the resultant flow vector.
Table 2 summarizes the measured horizontal displacements and the corresponding calculated vector components for each stake:
3.2. Surface Ice Velocity
Surface ice velocity for each stake was calculated using Equation (2). The resulting velocities reveal significant spatial variability in ice flow near the terminus of the glacier across the six sampled locations. Table 3 presents the calculated surface velocities corresponding to each stake.
Table 3.
Surface ice velocities measured at each stake near the terminus of Grey Glacier.
Although the direct measurements of surface ice velocity show some localized anomalies, a clear transverse velocity gradient was observed: minimum velocities occurred near the glacier margins, while maximum values were recorded closer to the central flowline. This pattern is consistent with laminar flow behavior, in which lateral drag reduces ice velocity near the margins.
Measured surface velocities ranged from 0.869 to 3.314 m/day, with a mean velocity of approximately 1.817 m/day. The highest velocity was recorded at stake S5 (3.314 m/day), located near the central axis, while the lowest was observed at stake S2 (0.869 m/day), situated closer to the eastern margin. Stakes positioned near the central flowline (e.g., S5, S3, S6) exhibited higher velocities, whereas lateral stakes (e.g., S2, S4) moved more slowly.
Stakes S2 and S4, which recorded significantly lower velocities, may lie within shear margins or zones of enhanced basal friction. These conditions could be influenced by subglacial topography or spatial variability in basal water pressure [28,44]. Some rocky outcrops, revealed by the glacier’s accelerated retreat since the time of data collection, provide additional support for this hypothesis.
The broader range of azimuthal directions, particularly at S2, may indicate localized flow divergence, transverse motion, or interaction with marginal pinning points. Directional data generally show eastward to east–southeastward motion, with some angular dispersion among stakes.
A weak positive relationship between elevation and velocity was noted, with slightly higher velocities at stakes located at greater elevations. This trend may reflect the influence of thicker ice or basal thermal conditions that promote basal sliding. The observed east–southeastward displacement supports convergent flow toward the terminus, potentially constrained by basal geometry, the presence of a heavily crevassed zone (Figure 3c), and lateral resistance from valley walls (Figure 3a).
4. Discussion
The observed spatial variability in surface velocity near the terminus of Grey Glacier reflects the complex dynamic regime governing this outlet glacier. The highest velocities occurred at stakes located near the presumed central flowline, consistent with predominant basal sliding attributable to increased ice thickness and reduced lateral drag. These findings align with previous satellite- and radar-based studies that have reported enhanced ice flow along central channels [16,40,45,46].
Analysis of surface ice velocity, based on direct measurements from six stakes, reveals significant variations that reflect the complex glacial dynamics near the frontal zone [40,47,48,49]. Observed velocities ranged from 0.869 to 3.314 m/day, with a mean of approximately 1.817 m/day. These values are consistent with those reported in previous remote sensing and in situ studies on Grey Glacier and other temperate outlet glaciers in Patagonia [7,16,40].
Using terrestrial image sequences and satellite interferometry, Schwalbe et al. [16] captured, during the late austral summer of 2015, an acceleration at the central terminus of the glacier tongue of Grey Glacier (Figure 2c(2) and Figure 3a(2)), with a maximum flow velocity of 2.8 m/day, which reinforces the validity of the data presented in this study despite the two-decade interval.
In a regional-scale study, Sakakibara and Sugiyama [40], based on satellite observations from 1984 to 2011, described recent frontal variations and ice velocity changes in the 28 major calving glaciers in the SPI. This study reported a general mean velocity of 820 m/year, while glaciers terminating in lakes, such as Grey Glacier, exhibited velocities ranging from 20 to 2940 m/year, with maximum speeds observed in both the accumulation and terminus zones of the glacier.
More recently, in a 2020 publication [7], also using satellite remote sensing techniques, Luzardi and Cárdenas reported a general mean velocity of 0.448 ± 0.242 m/day for Grey Glacier, with maximum values of approximately 0.7 m/day. The discrepancy between these velocities and those obtained here could be due to the offset-tracking algorithm potentially underestimating localized high-velocity values. Another possible explanation is that our dataset corresponds exclusively to the summer season, whereas their measurements represent a two-year average encompassing both summer and winter periods.
For these reasons, these observations are essential for validating remote sensing data and improving numerical models of glacier dynamics and future ice-mass changes across the SPI. The dataset presented here offers a valuable benchmark for ice flow modeling and supports further investigations into frontal dynamics, including calving processes and seasonal variability. It also underscores the importance of ground-based measurements in capturing small-scale variations that are often missed by remote sensing, particularly in fast-flowing outlet glaciers such as Grey Glacier.
Velocity differences across the stakes may result from several interacting factors. Subglacial topography plays a key role in modulating basal friction and, consequently, ice flow [28,44,50,51,52]. Elevation also appears influential: in general, stakes located at lower altitudes and closer to the glacier front exhibited higher velocities, possibly due to thinner ice and reduced basal resistance [53]. However, this trend is not uniform and is likely influenced by local factors such as surface slope, basal water pressure, and lateral drag.
The direction of displacement vectors also exhibited notable variability. Although the dominant flow was generally eastward to east–southeastward, significant directional deviations were recorded at certain stakes. For instance, stake S3 showed a direction of 48.8° E, while S2 indicated 169.2° E. These anomalies may reflect flow divergence, marginal shear zones, or interactions with local bedrock features and geological structures [51,52,54] (Figure 3a).
Additionally, the influence of surface debris cover must also be considered [55]. Although specific data on debris cover was not available for this study, the presence of supraglacial debris is known to impact glacier flow dynamics, which in turn affects flow velocity.
Temporal variability in ice velocity introduces another important factor. Previous studies have shown that Patagonian glaciers have undergone dynamic changes in recent decades, with episodes of acceleration and deceleration driven by climatic and hydrological conditions [46]. Consequently, the present measurements represent only a snapshot in time and may not fully capture long-term trends in glacier behavior [56].
Taken together, the surface velocity measurements on Grey Glacier highlight the complexity of ice flow near its terminus. Variations in both velocity and direction are likely governed by a combination of subglacial topography, elevation, surface debris cover, and temporal evolution [48]. These findings contribute to a better understanding of Grey Glacier’s dynamic behavior and its response to external forcing such as climate change [57].
For future research, it is recommended to extend velocity monitoring campaigns to capture seasonal and interannual variability [58]. Detailed mapping of subglacial topography and debris cover is also needed to better constrain their influence on ice dynamics [51,58]. Ground-based measurements could be further integrated with satellite remote sensing data, including Synthetic Aperture Radar (SAR) imagery, to develop a more comprehensive picture of glacier flow [43,59,60,61]. In addition, numerical modeling efforts can help simulate observed patterns and predict future changes under different climate scenarios [62,63].
It is important to note that Grey Glacier, like other glaciers in Patagonia, is undergoing accelerated retreat as a consequence of climate warming [49]. Rising air temperatures have increased melt rates, contributing to mass loss and global sea-level rise [64]. Therefore, continued monitoring is essential to improve our understanding of glacier–climate interactions and inform mitigation and adaptation strategies [58,59,60,61,62,63,64,65,66,67].
5. Conclusions
The results reveal pronounced differences in both flow velocity and direction over short distances, indicating complex interactions among basal geomorphological conditions, ice thickness, and flow geometry. Despite the limitations of the GPS devices used and the severe and hostile glacial environmental conditions of the study area, these in situ measurements highlight the dynamic nature of the glacier terminus and underscore the need for high-resolution observations to capture fine-scale variations in ice flow.
The highest velocities were observed at stakes S5 and S6 (up to ~3.3 m/day at S5), indicating enhanced ice flow toward the south. This localized acceleration is likely driven by gravitational stress associated with surface slope, increased basal lubrication near the lake margin, and possibly the rapid block falls commonly occurring in heavily crevassed areas.
The relatively moderate velocities observed indicate stable surface motion during the measurement period (austral summer), without indications of short-term acceleration typically associated with subglacial hydrological events. However, longer-term monitoring and repeated measurements are required to resolve potential seasonal or interannual variability in ice flow.
The recorded displacement vectors provide reliable point-scale data for calibrating and validating ice flow models, offering a baseline for predicting dynamic glacier responses under future climatic or geomorphological changes.
Although this study covers a short time period and does not capture seasonal or interannual variations, the results contribute to the expanding dataset of surface velocity measurements in Patagonia and provide a valuable reference for understanding both past and ongoing changes in the dynamic behavior of Grey Glacier in the context of regional climate change.
Funding
This research was funded by Gobierno de España/Ministerio de Educación, Cultura y Deporte (AP-2000–1152).
Data Availability Statement
The original contributions presented in this study are included in the article. Further inquiries can be directed to the corresponding author.
Acknowledgments
I thank Marco Cordero Valenzuela, of the Corporación Nacional Forestal de Chile (CONAF) in Punta Arenas, XII Región de Magallanes y Antártica Chilena, for his support and warm welcome, which enabled the successful execution of research in Torres del Paine National Park. I am especially grateful to Jovito González, for the facilities and assistance provided throughout the study. I also extend my sincere appreciation to the park rangers—Ángelo, Jorge, Alexis, and Gorka—and Bigfoot Patagonia’s team for their valuable support and companionship during the expeditions and, in particular, for their assistance with fieldwork on the National Park’s glaciers.
Conflicts of Interest
The author declares no conflicts of interest.
Correction Statement
This article has been republished with a minor correction to the Data Availability Statement. This change does not affect the scientific content of the article.
Abbreviations
The following abbreviations are used in this manuscript:
| SPI | Southern Patagonian Icefield |
| NPI | Northern Patagonian Icefield |
| UTM | Universal Transverse Mercator |
| GIS | Geographic Information System |
| GPS | Global Positioning System |
| SAR | Synthetic Aperture Radar |
References
- Warren, C.R.; Sugden, D.E. The Patagonian icefields: A glaciological review. Arct. Alp. Res. 1993, 25, 316–331. [Google Scholar] [CrossRef] [Scilit]
- Aniya, M. Glacier Inventory for the Northern Patagonia Icefield, Chile, and Variations 1944/45 to 1985/86. Arct. Alp. Res. 1988, 20, 179–187. [Google Scholar] [CrossRef] [Scilit]
- Aniya, M.; Sato, H.; Naruse, R.; Skvarca, P.; Casassa, G. The use of satellite and airborne imagery to inventory outlet glaciers of the Southern Patagonia Icefield, South America. Photogramm. Eng. Remote Sens. 1996, 62, 1361–1369. [Google Scholar]
- Rignot, E.; Rivera, A.; Casassa, G. Contribution of the Patagonia Icefields of South America to sea level rise. Science 2003, 302, 434–437. [Google Scholar] [CrossRef] [Scilit]
- Rivera, A.; Casassa, G. Ice elevation, areal, and frontal changes of glaciers from National Park Torres del Paine, Southern Patagonia Icefield. Arct. Alp. Res. 2004, 36, 379–389. [Google Scholar] [CrossRef] [Scilit]
- Aniya, M.; Sato, H.; Naruse, R.; Skvarca, P.; Casassa, G. Recent Glacier Variations in the Southern Patagonia Icefield, South America. Arct. Alp. Res. 1997, 29, 1–12. [Google Scholar] [CrossRef] [Scilit]
- Luzardi, A.C.M.; Cárdenas, C. Recent dynamical features of Tyndall and Grey Glaciers, from Southern Patagonian Icefield, by using satellite remote sensing techniques. Int. Arch. Photogramm. Remote Sens. Spat. Inf. Sci. 2020, XLII-3/W12, 453–458. [Google Scholar] [CrossRef] [Scilit]
- Minowa, M.; Sakakibara, D.; Sugiyama, S.; Skvarca, P. Frontal ablation and mass loss of the Patagonian icefields. Earth Planet. Sci. Lett. 2021, 561, 116811. [Google Scholar] [CrossRef] [Scilit]
- Lannutti, E.; Lenzano, M.G.; Vacaflor, P.; Rivera, A.; Moragues, S.; Gentile, M.; Lenzano, L. Ice thickness distribution and stability of three large freshwater calving glaciers on the eastern side of the Southern Patagonian Icefield. Cold Reg. Sci. Technol. 2024, 221, 104158. [Google Scholar] [CrossRef] [Scilit]
- Weidemann, S.S.; Sauter, T.; Malz, P.; Jaña, R.; Arigony-Neto, J.; Casassa, G.; Schneider, C. Glacier Mass Changes of Lake-Terminating Grey and Tyndall Glaciers at the Southern Patagonia Icefield Derived from Geodetic Observations and Energy and Mass Balance Modeling. Front. Earth Sci. 2018, 6, 81. [Google Scholar] [CrossRef] [Scilit]
- Dussaillant, I.; Berthier, E.; Brun, F.; Masiokas, M.M.; Hugonnet, R.; Favier, V.; Rabatel, A.; Pitte, P.; Ruiz, L. Two decades of glacier mass loss along the Andes. Nat. Geosci. 2019, 12, 802–808. [Google Scholar] [CrossRef] [Scilit]
- Carrasco, J.F.; Casassa, G.; Rivera, A. Meteorological and climatological aspects of the Southern Patagonia Icefield. In The Patagonian Icefields; Casassa, G., Sepúlveda, F.V., Sinclair, R.M., Eds.; Springer: New York, NY, USA, 2002; pp. 29–41. [Google Scholar] [CrossRef] [Scilit]
- Bravo, C.; Ross, A.N.; Quincey, D.J.; Cisternas, S.; Rivera, A. Surface ablation and its drivers along a west-east transect of the Southern Patagonia Icefield. J. Glaciol. 2021, 68, 305–318. [Google Scholar] [CrossRef] [Scilit]
- Castillo-Llarena, A.; Retamal-Ramírez, F.; Bernales, J.; Jacques-Coper, M.; Rogozhina, I. Climate and ice sheet dynamics in Patagonia during the Last Glacial Maximum. Clim. Past 2023, 19, 1105–1126. [Google Scholar] [CrossRef] [Scilit]
- Euillades, L.D.; Euillades, P.A.; Riveros, N.C.; Masiokas, M.H.; Ruiz, L.; Pitte, P.; Elefante, S.; Casu, F.; Balbarani, S. Detection of glaciers displacement time-series using SAR. Remote Sens. Environ. 2016, 184, 188–198. [Google Scholar] [CrossRef] [Scilit]
- Schwalbe, E.; Krohnert, M.; Koschitzki, R.; Johnson, E.; Cardenas, C.; Maas, H.-G. Determination of spatio-temporal velocity fields at Grey Glacier using terrestrial image sequences and optical satellite imagery. In Proceedings of the 2017 First IEEE International Symposium of Geoscience and Remote Sensing (GRSS-CHILE), Valparaíso, Chile, 21–22 March 2017; pp. 1–6. [Google Scholar] [CrossRef] [Scilit]
- Rivera, A. Pio XI glacier: The exception to the deglaciation trend in Patagonia. Rev. Geogr. Chile Terra Aust. 2018, 54, 1–12. [Google Scholar] [CrossRef] [Scilit]
- Piret, L.; Bertrand, S.; Moffat, C.; Feldens, P.; Papenmeier, S.; Arz, H. Recent ice-contact delta formation in front of Pio XI glacier controls sedimentary processes in Eyre Fjord, Patagonia. Earth Surf. Process. Landf. 2024, 49, 5054–5068. [Google Scholar] [CrossRef] [Scilit]
- Hata, S.; Sugiyama, S. Changes in the Ice-Front Position and Surface Elevation of Glaciar Pío XI, an Advancing Calving Glacier in the Southern Patagonia Icefield, From 2000–2018. Front. Earth Sci. 2021, 8, 576044. [Google Scholar] [CrossRef] [Scilit]
- Davies, B.; Darvill, C.; Glasser, N.; Hein, A.; Martin, J.; Smedley, R.; Smellie, J.; Thorndycraft, V.; Geiger, A.; Harrison, S.; et al. The Patagonian Ice Sheet from the last glacial cycle to the Present Day. In EGU General Assembly Conference Abstracts; European Geosciences Union: Munich, Germany, 2018; Volume 20, p. 4605. [Google Scholar]
- Huynh, C.; Hein, A.S.; McCulloch, R.D.; Bingham, R.G. The last glacial cycle in southernmost Patagonia: A review. Quat. Sci. Rev. 2024, 344, 108972. [Google Scholar] [CrossRef] [Scilit]
- García, J.-L.; Hall, B.L.; Kaplan, M.R.; Gómez, G.A.; De Pol-Holz, R.; García, V.J.; Schaefer, J.M.; Schwartz, R. 14C and 10Be dated Late Holocene fluctuations of Patagonian glaciers in Torres del Paine (Chile, 51°S) and connections to Antarctic climate change. Quat. Sci. Rev. 2020, 246, 106541. [Google Scholar] [CrossRef] [Scilit]
- Jiskoot, H.; DeJong, E.; Van Wychen, W.; Cooley, J. The need for global glacier speed to combine measured velocity with balance velocity. In Proceedings of the EGU General Assembly 2020, Online, 4–8 May 2020. [Google Scholar] [CrossRef] [Scilit]
- Vries, M.; Wickert, A. Glacier Image Velocimetry: An open-source toolbox for easy and rapid calculation of high-resolution glacier-velocity fields. Cryosphere 2021, 15, 2115–2132. [Google Scholar] [CrossRef] [Scilit]
- Chadwell, C.D. Reliability analysis for design of stake networks to measure glacier surface velocity. J. Glaciol. 1999, 45, 154–164. [Google Scholar] [CrossRef]
- Fountain, A.G.; Vecchia, A.V. How many stakes are required to measure glacier velocity? Geogr. Ann. Ser. A Phys. Geogr. 1999, 81, 563–573. [Google Scholar] [CrossRef]
- Cogley, J.G.; Adams, W.P.; Ecclestone, M.A.; Jung-Rothenhäusler, F.; Ommanney, C.S.L. Mass balance of White Glacier, Axel Heiberg Island, N.W.T., Canada, 1960–91. J. Glaciol. 1996, 42, 548–563. [Google Scholar] [CrossRef] [Scilit]
- Sugiyama, S.; Fukui, K.; Fujita, K.; Tone, K.; Yamaguchi, S. Changes in ice thickness and flow velocity of Yala Glacier, Langtang Himal, Nepal, from 1982 to 2009. Ann. Glaciol. 2013, 54, 157–162. [Google Scholar] [CrossRef] [Scilit]
- Sugiyama, S.; Bauder, A.; Riesen, P.; Funk, M. Surface ice motion deviating toward the margins during speed-up events at Gornergletscher, Switzerland. J. Geophys. Res. Earth Surf. 2010, 115, F03025. [Google Scholar] [CrossRef] [Scilit]
- Telling, J.; Glennie, C.; Fountain, A.; Finnegan, D. Analyzing Glacier Surface Motion Using LiDAR Data. Remote Sens. 2017, 9, 283. [Google Scholar] [CrossRef] [Scilit]
- Jansson, P. Longitudinal coupling in ice flow across a subglacial ridge. Ann. Glaciol. 1997, 24, 169–174. [Google Scholar] [CrossRef] [Scilit]
- Hubbard, B. Direct measurement of basal motion at a hard-bedded, temperate glacier: Glacier de Tsanfleuron, Switzerland. J. Glaciol. 2002, 48, 1–8. [Google Scholar] [CrossRef] [Scilit]
- Liu, L.; Jing, Z.F.; Zhang, X.J. The application of GPS in glacier flow velocity: A case study of Qiyi Glacier. Appl. Mech. Mater. 2011, 130–134, 1794–1798. [Google Scholar] [CrossRef] [Scilit]
- Chadwell, C.D.; Hardy, D.R.; Braun, C.; Brecher, H.H.; Thompson, L.G. Thinning of the Quelccaya Ice Cap over the last thirty years. Cryosphere Discuss. 2016, 2016, 1–18. [Google Scholar] [CrossRef] [Scilit]
- Bartholomaus, T.C.; Anderson, R.S.; Anderson, S.P. Response of glacier basal motion to transient water storage. Nat. Geosci. 2008, 1, 33–37. [Google Scholar] [CrossRef] [Scilit]
- Jacobel, R.W. Short-Term Variations in Velocity of South Cascade Glacier, Washington, U.S.A. J. Glaciol. 1982, 28, 325–332. [Google Scholar] [CrossRef] [Scilit]
- Singh Jasrotia, A.; Ahmad, S.; Ridwan, Q.; Ahmad Wani, Z.; Siddiqui, S.; Siddiqua, A.; Ali Morfeine aika, E. Estimation of Surface Ice Velocity of Durung Drung Glacier, Western Himalaya using COSI-Corr from Landsat images. Egypt. J. Remote Sens. Space Sci. 2024, 27, 369–381. [Google Scholar] [CrossRef] [Scilit]
- Bhattacharjee, S.; Garg, R.D.; Pandey, A.C. Monitoring glacier surface velocity in Zanskar Valley, India: Insights from DInSAR-based 2D velocity estimation. Results Earth Sci. 2025, 3, 100092. [Google Scholar] [CrossRef] [Scilit]
- Rivera, A.; Bown, F.; Castillo, A.; Oberreuter, J.; Lenzano, M.G.; Lenzano, L. Southern Patagonia Icefield freshwater calving glaciers recent collapses into deep lake waters. In Proceedings of the EGU General Assembly 2021, Online, 19–30 April 2021; EGU: Vienna, Austria, 2021. [Google Scholar] [CrossRef] [Scilit]
- Sakakibara, D.; Sugiyama, S. Ice-front variations and speed changes of calving glaciers in the Southern Patagonia Icefield from 1984 to 2011. J. Geophys. Res. Earth Surf. 2014, 119, 2541–2554. [Google Scholar] [CrossRef] [Scilit]
- Yamamoto, Y. Recent Frontal Variations and Driving Mechanisms of Glaciar Grey in the Southern Patagonia Icefield. Master’s Thesis, Hokkaido University, Sapporo, Japan, 2018. [Google Scholar]
- Sugiyama, S.; Minowa, M.; Schaefer, M. Underwater ice terrace observed at the front of Glaciar Grey, a freshwater calving glacier in Patagonia. Geophys. Res. Lett. 2019, 46, 1361–1369. [Google Scholar] [CrossRef] [Scilit]
- Heid, T.; Kääb, A. Evaluation of existing image matching methods for deriving glacier surface displacements globally from optical satellite imagery. Remote Sens. Environ. 2012, 118, 339–355. [Google Scholar] [CrossRef] [Scilit]
- Cuffey, K.M.; Paterson, W.S.B. The Physics of Glaciers, 4th ed.; Academic Press: Amsterdam, The Netherlands, 2010. [Google Scholar]
- Rivera, A.; Benham, T.; Casassa, G.; Bamber, J.; Dowdeswell, J.A. Ice elevation and areal changes of glaciers from the Northern Patagonia Icefield, Chile. Glob. Planet. Change 2007, 59, 126–137. [Google Scholar] [CrossRef] [Scilit]
- Muto, M.; Furuya, M. Surface velocities and ice-front positions of eight major glaciers in the Southern Patagonian Ice Field, South America, from 2002 to 2011. Remote Sens. Environ. 2013, 139, 50–59. [Google Scholar] [CrossRef] [Scilit]
- Naruse, R.; Aniya, M.; Skvarca, P.; Casassa, G. Recent variations of calving glaciers in Patagonia, South America, revealed by ground surveys, satellite-data analyses and numerical experiments. Ann. Glaciol. 1995, 21, 297–303. [Google Scholar] [CrossRef] [Scilit]
- Stocker-Waldhuber, M.; Fischer, A.; Helfricht, K.; Kuhn, M. Ice flow velocity as a sensitive indicator of glacier state. Cryosphere Discuss. 2018, 2018, 1–18. [Google Scholar] [CrossRef] [Scilit]
- Willis, M.J.; Melkonian, A.K.; Pritchard, M.E.; Rivera, A. Ice loss from the Southern Patagonian Ice Field, South America, between 2000 and 2012. Geophys. Res. Lett. 2012, 39, L17501. [Google Scholar] [CrossRef] [Scilit]
- Kamb, B.; Echelmeyer, K.A. Stress-gradient coupling in glacier flow: I. Longitudinal averaging of the influence of ice thickness and surface slope. J. Glaciol. 1986, 32, 267–284. [Google Scholar] [CrossRef] [Scilit]
- Paterson, W.S.B. The Physics of Glaciers, 3rd ed.; Pergamon Press: Oxford, UK, 1994. [Google Scholar]
- Mouginot, J.; Rignot, E. Ice motion of the Patagonian Icefields of South America: 1984–2014. Geophys. Res. Lett. 2015, 42, 1441–1449. [Google Scholar] [CrossRef] [Scilit]
- Mertes, J.R.; Thompson, S.S.; Booth, A.D.; Gulley, J.D.; Benn, D.I. A conceptual model of supra-glacial lake formation on debris-covered glaciers based on GPR facies analysis. Earth Surf. Process. Landf. 2016, 42, 903–914. [Google Scholar] [CrossRef] [Scilit]
- Echelmeyer, K.; Zhongxiang, W. Direct observation of basal sliding and deformation of basal drift at sub-freezing temperatures. J. Glaciol. 1987, 33, 83–98. [Google Scholar] [CrossRef] [Scilit]
- Huo, D.; Bishop, M.P.; Young, B.W.; Chi, Z.; Haritashya, U.K. Numerical modeling issues for understanding complex debris-covered glaciers. In Treatise on Geomorphology, 2nd ed.; Shroder, J.F., Ed.; Academic Press: Cambridge, MA, USA, 2022; Volume 4.08, pp. 143–168. [Google Scholar] [CrossRef] [Scilit]
- Wen, M.; Wang, T. Review of SAR imaging geodesy for glacier velocity monitoring. Geod. Geodyn. 2025, 16, 262–274. [Google Scholar] [CrossRef] [Scilit]
- Post, A.; O’Neel, S.; Motyka, R.J.; Streveler, G. A complex relationship between calving glaciers and climate. Eos Trans. Am. Geophys. Union 2011, 92, 305–306. [Google Scholar] [CrossRef] [Scilit]
- Zorzut, V.; Ruiz, L.; Rivera, A.; Pitte, P.; Villalba, R.; Medrzycka, D. Slope estimation influences on ice thickness inversion models: A case study for Monte Tronador glaciers, North Patagonian Andes. J. Glaciol. 2020, 66, 996–1005. [Google Scholar] [CrossRef] [Scilit]
- Frezzotti, M.; Capra, A.; Vittuari, L. Comparison between glacier ice velocities inferred from GPS and sequential satellite images. Ann. Glaciol. 1998, 27, 54–60. [Google Scholar] [CrossRef] [Scilit]
- Gao, J.; Liu, Y. Applications of remote sensing, GIS and GPS in glaciology: A review. Prog. Phys. Geogr. 2001, 25, 520–540. [Google Scholar] [CrossRef]
- Ahn, Y.; Howat, I.M. Efficient automated glacier surface ice speed measurement from repeat images using multi-image/multichip and null exclusion feature tracking. IEEE Trans. Geosci. Remote Sens. 2011, 49, 2838–2846. [Google Scholar] [CrossRef]
- Carturan, L.; Cazorzi, F.; Dalla Fontana, G.; Zanoner, T. Automatic measurement of glacier ice ablation using thermistor strings. J. Glaciol. 2019, 65, 219–227. [Google Scholar] [CrossRef] [Scilit]
- Fahrner, D.; Catania, G.; Shahin, M.G.; Hansen, D.D.; Löffler, K.; Abermann, J. Advances in monitoring glaciological processes in Kalallit Nunaat (Greenland) over the past decades. PLoS Clim. 2024, 3, e0000379. [Google Scholar] [CrossRef] [Scilit]
- Carrivick, J.L.; Tweed, F.S.; Sutherland, J.L.; Mallalieu, J. Toward numerical modeling of interactions between ice-marginal proglacial lakes and glaciers. Front. Earth Sci. 2020, 8, 577068. [Google Scholar] [CrossRef] [Scilit]
- Azam, M.F.; Wagnon, P.; Berthier, E.; Vincent, C.; Fujita, K.; Kargel, J.S. Review of the status and mass changes of Himalayan-Karakoram glaciers. J. Glaciol. 2018, 64, 61–74. [Google Scholar] [CrossRef] [Scilit]
- Yuan, X.; Qiao, G.; Li, Y. 57-year ice velocity dynamics in Byrd Glacier based on multisource remote sensing data. IEEE J. Sel. Top. Appl. Earth Obs. Remote Sens. 2023, 16, 2711–2727. [Google Scholar] [CrossRef] [Scilit]
- Caro, A.; Condom, T.; Rabatel, A. Climatic and morphometric explanatory variables of glacier changes in the Andes (8–55° S): New insights from machine learning approaches. Front. Earth Sci. 2021, 9, 713011. [Google Scholar] [CrossRef] [Scilit]

Disclaimer/Publisher’s Note: The statements, opinions and data contained in all publications are solely those of the individual author(s) and contributor(s) and not of MDPI and/or the editor(s). MDPI and/or the editor(s) disclaim responsibility for any injury to people or property resulting from any ideas, methods, instructions or products referred to in the content. |
© 2025 by the author. Licensee MDPI, Basel, Switzerland. This article is an open access article distributed under the terms and conditions of the Creative Commons Attribution (CC BY) license (https://creativecommons.org/licenses/by/4.0/).