Abstract
Uncertainty and variability in soil properties strongly impact slope stability under extreme rainfall. This study applies a probabilistic hydro-mechanical slope stability assessment to unsaturated volcanic hillslopes in southern Guam, covering a range of slope angles and subjected to four major 2023 typhoons. The slope scenarios analyzed include bare slopes, vegetated slopes with root water uptake, and vetiver with both uptake and root reinforcement. Laboratory-derived variability in effective cohesion, friction angle, and unit weight was incorporated via Latin hypercube sampling. Gentler slopes (≤40°) remained stable with a probability of failure (PoF) = 0%. For steep slopes (45–60°), vetiver root reinforcement improved the mean factor of safety by up to 12–15% and reduced variability in outcomes to less than 2%. Probabilistic predictions advanced failure timing compared to deterministic estimates, with differences more pronounced on steeper slopes. By integrating soil variability and vegetation effects within probabilistic frameworks, this approach provides a more accurate and comprehensive assessment of tropical slope failure risks, thereby informing more effective and resilient slope management strategies.
1. Introduction
The pronounced variability in soil properties across southern Guam’s mountainous landscapes stems from the combined influence of volcanic parent material, diverse topography, tropical climate, shifting vegetation, and land use practices that drive complex erosion processes [1,2]. Frequent landslides—triggered by intense storms and typhoons that rapidly saturate the region’s thin soils—expose subsoil and accelerate badland formation, further amplifying spatial heterogeneity in mechanical and hydrological soil characteristics [2,3].
To address uncertainties and variability, geotechnical engineers traditionally rely on factors of safety and adopt conservatively selected parameters in their calculations and analyses [4,5]. A factor of safety is essentially a dimensionless measure of how far a slope is from failure, i.e., its relative stability. However, because this metric is calculated using a single average value of each input parameter, it does not directly reflect the true probability of failure when there is uncertainty in the parameters [4]. This limitation underscores the necessity of probabilistic analysis in geotechnical engineering to adequately capture variability and risk. El-Ramly et al. [6] emphasized that uncertainty often has a significant impact on the reliability of slope design, and probabilistic techniques are needed to explicitly quantify and incorporate this uncertainty. In a probabilistic slope stability analysis, one instead evaluates measures that explicitly account for uncertainty. The two most common measures are the probability of failure (PoF) and the reliability index (β), which together quantify the slope’s failure risk under uncertain conditions. A probabilistic approach offers a broader perspective on slope stability by estimating not just the average Factor of Safety (FoS), but also the likelihood of failure (PoF) and the variability in safety margins—insights that deterministic analysis alone cannot provide [4,6,7].
Reliability-based approaches such as the First-Order Second Moment (FOSM), First-Order Reliability Method (FORM), Random Finite Element Method (RFEM) and Monte Carlo Simulation (MCS) have been employed in slope stability studies to estimate failure probability more realistically than traditional factor-of-safety methods [8,9,10,11,12]. FORMS and MCS have been shown to provide consistent reliability indices when the performance function exhibits minimal nonlinearity, whereas FOSM offers a quick but less accurate approximation, especially when variability is significant [6,13,14,15]. The Monte Carlo approach, on the other hand, accommodates complex, nonlinear slope models by sampling random soil property distributions to generate a statistical distribution of factors of safety and failure probability [15].
In extremely rainy climates (tropical monsoons, typhoons), intense storms often trigger landslides by rapidly saturating slopes. Case studies (e.g., Singapore) demonstrate that a storm delivering ∼0.095 m of rainfall in 2.5 h produced dozens of shallow slides, and that five days of antecedent wetting were critical to destabilization [16]. Rainfall infiltrating an unsaturated slope raises pore water pressures, which reduces effective cohesion and friction along potential slip surfaces [3,16]. Probabilistic slope stability models frequently integrate hydrologic infiltration algorithms (such as those based on Richards’ equation) with engineering reliability techniques—treating storm intensity and duration as random variables and using Monte Carlo or Latin hypercube sampling to propagate those uncertainties through coupled transient seepage and stability simulations [17]. Importantly, Liu and Wang [18] note that failure probabilities must be expressed on the same time scale as the triggering process: naive reliability analyses (based on a single storm event) can greatly overestimate annual risk unless they account for storm frequency and duration. Thus, incorporating antecedent rainfall is crucial in accurate predictions of slope failures.
In tropical and vegetated settings subject to rainfall or typhoon triggers, probabilistic methods have been particularly effective. For instance, a probabilistic extension of the TRIGRS model (TRIGRS-P) enables cell-level simulation of rainfall infiltration and slope failure probability across landscapes—allowing transient pore-pressure response and saturation variability to be captured in Monte Carlo frameworks [19]. Similarly, finite-element frameworks paired with stochastic sampling have enabled slope reliability evaluations under unsaturated infiltration, where the spatial variability of soil hydraulics and mechanical properties are treated as random variables [20,21].
Methodological advances have also improved computational efficiency and accuracy. Response-surface models using Gaussian Process Regression combined with Latin hypercube sampling significantly reduce computational demands, achieving accurate failure probability estimates across multiple slope geometries [22]. Spreadsheet-based implementation of subset simulation has also demonstrated that ignoring the spatial variability of soil properties can misrepresent failure probability, while computationally efficient methods can deliver reliable probabilistic results [15]. These tools are vital for slope stability engineering in regions with high hydrologic hazards and limited data.
In 2023, Guam experienced an exceptionally wet year, receiving nearly 3.556 m of rainfall—one of the highest annual totals in recent decades—largely attributed to a strong El Niño event [23,24]. This elevated precipitation, intensified by four major typhoons (Mawar, Khanun, Damrey, and Bolaven), reflects the broader climatic influence of the El Niño–Southern Oscillation, which alters atmospheric and oceanic patterns globally [25,26,27]. Bare slopes (i.e., without vegetative cover) are directly exposed to environmental boundary conditions such as solar radiation, air temperature, wind speed, relative humidity, and rainfall, which may make them vulnerable to failures. However, slopes with vegetative cover can benefit positively from hydrological and mechanical root reinforcement effects that improve their stability. Hydrological benefits arise from root water uptake (RWU) that de-saturates the root-soil zone and imparts additional apparent cohesion resulting from matric suction. The roots also act like reinforcement embedded in slopes and impart additional shear resistance to the soil-root zone [27,28]. The susceptibility of bare steep hill slopes in southern Guam to typhoon-induced extreme precipitation has been recently investigated [27,28]. However, similar investigations have not been conducted using vegetation cover and soil variability, which is quite often the real-world case in Guam. Filling this gap in the literature was the chief motivation of this research study.
Slopes with seven different slope angles varying between 35° to 60° and three case scenarios i.e., (a) bare slope, vetiver vegetated slope with (b) root water uptake (RWU), and with (c) RWU + root reinforcement (RR/F) were considered. Details of transient seepage analysis and coupled deterministic slope stability analysis for all cases and slope angles under six months of rainfall from four major typhoons during 2023 in Guam are presented elsewhere [28]. This paper focuses on the probabilistic analysis of the above cases and comparing the analysis with deterministic results in light of the soil heterogeneity and variability in soil properties obtained via lab testing of multiple samples from a wider area of the same site. In particular, the effect of hydrological benefits and mechanical benefits on slope failure and its timing under soil–vegetation–climate interactions are studied and presented after incorporating the normal probabilistic distribution of soil properties in the analysis.
2. Geotechnical Material Testing and Probabilistic Modeling for Slope Stability
The entire methodology of investigation from start to end is visualized in the form of a flowchart as shown in Figure 1.
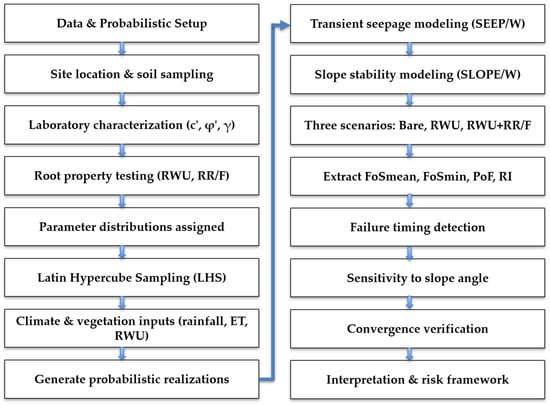
Figure 1.
Probabilistic Hydro-Mechanical Modeling and Risk Assessment Workflow. Where c′ = effective cohesion; ϕ′ = effective friction angle; Υ = unit weight; RWU = root water uptake; RR/F = root reinforcement; ET = evapotranspiration; FoSmin = minimum factor of safety; PoF = probability of failure; RI = reliability index.
2.1. Site Location and Laboratory Characterization of Soil Properties
The slope investigated is situated in the Ija watershed of Guam (13°16′04.0″ N, 144°42′44.9″ E). Field surveys confirmed that both the groundwater table and underlying sedimentary bedrock are sufficiently deep, so neither controls the potential for slope failure in the analyzed section. Therefore, the slope model considered only the tested soil profile. The soil was identified as high-plasticity silty clay (CH) by the Unified Soil Classification System (USCS), with a unit weight of 15.74 kN/m3 and a specific gravity of 2.74. Consolidated drained direct shear tests provided effective strength parameters of c′ = 7 kPa and ϕ′ = 28.8°. Soil–water retention curves were developed using a hydraulic property analyzer (HYPROP) and water potentiometer (WP4C) systems, giving an air entry value of 24 kPa, while a saturated permeability of 0.01 m/day was measured via a falling head test. These mechanical and hydraulic properties formed the basis for the input parameters in a transient seepage-coupled slope stability analysis. In addition, as slopes in Guam are covered with vegetation nearly year-round, the hydrological and mechanical influences of vegetation were explicitly incorporated into the analysis. The complete geotechnical, hydrological, and vegetation-related testing procedures and data are detailed in [28].
2.2. Methodology for Probabilistic Distribution of Soil-Root Properties and Modeling
In probabilistic analysis, input parameters such as cohesion, friction angle, and unit weight are modeled as random variables characterized by specified probability distributions. Tools in SLOPE/W GeoStudio version-2024.2.1 [29] were used to define and adjust probability density functions for three input parameters, namely the cohesion, friction angles, and unit weight, enabling the incorporation of uncertainty and the execution of probabilistic slope stability analyses. The extreme dispersion in values, i.e., maximum and minimum about the mean that was used for deterministic analysis, were obtained from lab testing on several samples from multiple locations in same area. The normal probability density function in Slope/W, which uses the mean (μ) and standard deviation (σ), was used to vary statistically the cohesion, friction, and unit weight of slope soil. Slope/W uses offset values to generate an offset probability density function (Figure 2a). This offset function is then applied to the originally defined value via a sampling function (Figure 2b) to generate the actual normal probability density function (PDF) with positive values.
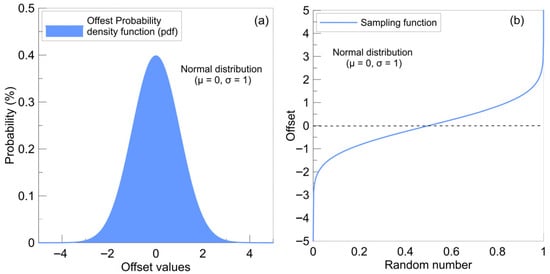
Figure 2.
(a) Offset normal probability density function, and (b) sampling function used to generate actual normal PDF for cohesion, friction angle, and unit weight parameters.
All three input parameters were assumed to be normally distributed. The range of modified cohesion from a mean of 7 kPa was 2–12 kPa; the range of modified internal friction angle from a mean of 27° was 22–32°, and the range of modified unit weight from a mean of 15.74 kN/m3 was 10.74–20.74 kN/m3. Furthermore, for the case of a vetiver with vegetated root reinforcement, the additional average root cohesion of 38.5 kPa was quantified using the protocol proposed by Patil et al. [28] which is briefly described below. The root area ratio (RAR) is the ratio of area occupied by roots on a specific plane and was calculated as RAR = (Ar/As) × 100, where Ar = sum of the root cross sectional area at a given depth and As = soil sample plan area at each 0.05 m depth of roots. The depth of vetiver roots was 1.85 m, with the root area ratio (RAR) varying nonlinearly between 0.0111 near the ground surface to 0.00127 at a depth of 1.85 m. Root tensile strength varyied nonlinearly from a maximum value of 353 MPa, corresponding to a minimum root diameter of 0.40 mm, to a value of 14.4 MPa, corresponding to a maximum root diameter of 1.66 mm. The translated average root cohesion, Cr = Tr × Ar/As × (sinθ + cosθ × tan ϕ), where Tr is the mobilized tensile strength provided by roots, ϕ is the soil friction angle (°), and θ = 45° (assumed) is the angle of shear distortion in the shear zone. The calculated average Cr varied nonlinearly between a value of ~1368 kPa (near ground surface) to ~75 kPa (@ 1.85 m depth). Finally, the weighted average root cohesion (i.e., Cravg = 0.6 × Cr × [Lr/(Lr + Ls)]) for the entire soil-root zone depth of 1.85 m was calculated as 38.5 kPa, based on the bioengineering scheme of growing vetiver as a hedge over the slope with a hedge spacing of 1.52 m (5 ft), width equal to 0.3 m (1 ft) with 60% mobilization of root cohesion. More details are explained in a deterministic analysis by Patil et al. [28], which has been adopted here to run and present the probabilistic analysis.
Variability in soil properties, including effective cohesion (c′), effective friction angle (ϕ′), and unit weight (ϒ), was incorporated as explained earlier. The Latin hypercube sampling method in Slope/W [29] was used to generate the values of normal random variables, providing a more even coverage of the possible input range than traditional Monte Carlo sampling.
The uncertainty in root cohesion, which was computed from mobilized root cohesion using the root bundle theory proposed by [30], was indirectly considered by normally distributing the root cohesion in the modified range of 80–100 kPa (±10 kPa around the mean root cohesion) based on observations from experimental data. Shear strength parameters, i.e., cohesion and friction angle, were assumed to be independent, and hence no correlation between them was considered. The PDF function in equation form is given below.
where x = the variable to be distributed, μ = the mean, and σ = the standard deviation.
The spatial variability of root strength is inherently significant due to variations in root diameter, depth distribution, and orientation, which can influence the effective reinforcement provided by roots. While the selected normal distribution range for root cohesion (38.5 kPa ± 10 kPa) in this study represents an averaged, conservative estimate based on experimental data and weighted root area ratios, it does not capture the full extent of this heterogeneity. This simplification allows for practical probabilistic modeling but may under- or overestimate localized reinforcement effects. Incorporating broader or site-specific variability ranges in future work could refine slope stability predictions by better representing spatial heterogeneity in root mechanical properties.
Furthermore, wind-induced soil deformation was not considered in this study, primarily due to the substantial stabilizing influence of vetiver roots, which extend to depths of approximately 1.85 m, providing significant mechanical reinforcement and ground cover that markedly reduce wind erosion effects. Consequently, wind effects were deemed negligible for slope stability in this context and omitted to streamline the analysis.
2.3. Soil–Climate–Vegetation Data and Methodology for Probabilistic Hydro-Mechanical Simulations
Transient seepage analysis was performed in SEEP/W [31] for slopes with seven different angles varying between 35° to 60° and three case scenarios i.e., (a) bare slope; vetiver vegetated slope with (b) root water uptake (RWU), and with (c) RWU + root reinforcement (RR/F). The resulting pore water pressures (PWP) profiles were then imported and coupled into SLOPE/W [29] to perform slope stability analyses. Details of transient seepage analysis and coupled deterministic slope stability analysis for all cases and slope angles under six months of rainfall from the four major typhoons during 2023 in Guam are presented elsewhere [28]. A representative slope model, together with the results of the probabilistic analysis, including the factor of safety and the pore pressure distribution at the time of failure for a 55° bare slope is shown in Figure 3.
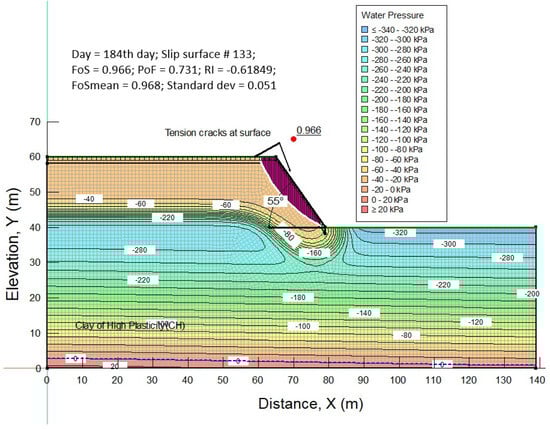
Figure 3.
Typical slope profile for probabilistic analysis of 55−degree bare slope at failure with PWP profile on 184th day.
The soil climate input data for transient seepage analysis, such as solar radiation, wind speed, rainfall (including four major typhoon events), and relative humidity were collected from an onsite weather station. The vegetation input parameters, including leaf area index, limiting factors, root depth, and the relationship between normalized root density and normalized root depth were idealized from detailed field observations. The combined soil–climate–vegetation dataset was input into GeoStudio’s SEEP/W [31] and applied as boundary conditions over the entire slope to simulate transient pore water pressure (PWP) profiles for a six-month analysis period (May–October 2023). Rainfall infiltration in GeoStudio SEEP/W [31] is modeled by applying rainfall as a transient flux boundary at the soil surface, allowing water to infiltrate into the subsurface. Evaporation is represented as an opposing flux boundary that removes water, with wind effects incorporated by increasing evaporation rates accordingly. These boundary conditions work together within SEEP/W’s unsaturated flow framework, which solves Richard’s [32] equation to simulate the dynamic balance of water entering and leaving the soil profile during rainfall events. This coupling captures realistic soil moisture changes and pore water pressures, supporting accurate transient infiltration analysis over the 6-month period of analysis. Monitoring the analysis in daily increments allows us to identify both the location and timing of the initial slope failure when the factor of safety drops below 1. Detailed descriptions of the datasets and the generated PWP profiles are provided in Patil et al. [28]. These PWP profiles were subsequently used in coupled probabilistic slope stability analyses for three scenarios: (i) bare slope, (ii) vegetated slope with root water uptake (RWU), and (iii) vegetated slope with combined RWU and root reinforcement/fiber (RR/F) as illustrated in Figure 4. The vetiver was planted as a hedge over the slope with clear spacing (Ls) = 1.52 m and width of hedge (Lr) = 0.30 m. More details can be found in Patil at al. [28].
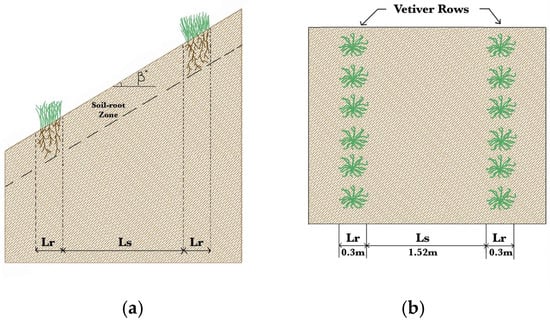
Figure 4.
Vetiver grown as a hedge over slope (a) cross-section view and (b) plan view.
2.4. Convergence Analysis
Convergence plots (Figure 5a–d) are utilized to evaluate whether the output results stabilize as the number of simulations increases. These outputs include the standard deviation (σ), minimum factor of safety (FoSₘᵢₙ), probability of failure (PoF), and mean factor of safety (FoSₘₑₐₙ). Significant fluctuations are observed in the output values during the initial 50 to 300 runs, with general stabilization occurring around 800 runs. Convergence is clearly achieved at approximately 1000 simulation runs for all key outputs. However, for cases involving RWU and RWU + RR/F, about 2000 runs were required to achieve stable results.
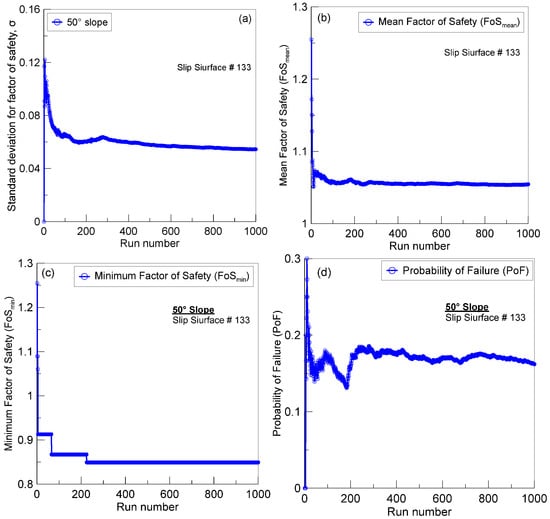
Figure 5.
Convergence plots at critical slip surface 50° bare slope (a) standard deviation of FoS (σ), (b) mean FoS, (c) minimum FoS, and (d) Probability of failure.
The convergence observed demonstrates that output parameters stabilize with an increasing number of simulations run, validating the reliability of the probabilistic slope stability results. The differences in required run lengths, notably the higher runs needed for scenarios with root water uptake and root reinforcement, arise from increased model complexity and finer discretization, which demand more iterations for stable statistical representation. Understanding and balancing these factors ensures computational efficiency without sacrificing accuracy, thereby strengthening confidence in the analysis outcomes.
3. Results of Probabilistic Slope Stability Analysis
3.1. Probabilistic Slope Stability Analysis for Bare Slope
The probability density function (PDF) of the factor of safety for bare slopes is presented in Figure 6a–g. The relationship of the maximum factor of safety (FoSmax), minimum factor of safety (FoSmin), and mean factor of safety maximum factor of safety (FoSmean) with a slope angle (β°) from probabilistic slope stability analysis are presented in Figure 7. Clearly, the factor of safety for a bare slope drops with increases in slope angle for all three cases.
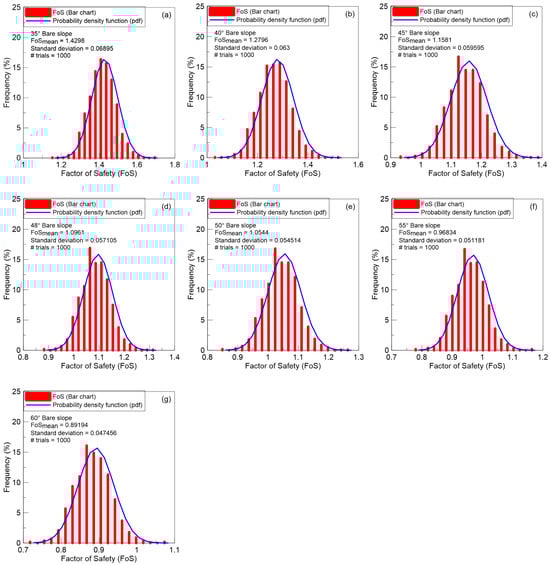
Figure 6.
(a–g) Probability density function (pdf) of the factor of safety for different slope angles for bare slopes.
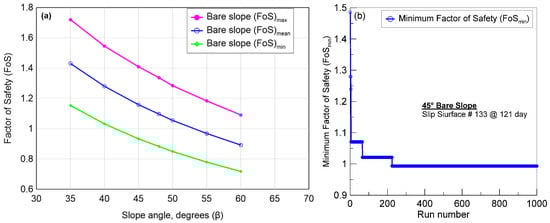
Figure 7.
(a) Variation of the probabilistic factor of safety with slope angle for bare slope, and (b) illustration of a 45° slope failure and its timing when FoSmin is considered via probabilistic analysis.
The percentage deviation of FoSmin and FoSmax from the FoSmean remained nearly consistent across all investigated slope angles, ranging from 19.3% to 19.5% for FoSmin and from 20.3% to 22.3% for FoSmax. A further deep dive into probabilistic analysis by plotting FoSmin versus run for 45° bare slope revealed that the slope became unstable at FoS < 1. The value of FoSmin was obtained on 121st day, which took 225/1000 runs to stabilize (Figure 5b). On the other hand, the same 45° slope remained stable when FoSmean (i.e., deterministic analysis) was considered for the entire analysis, including all four typhoon events. Table 1 presents the accelerated timing of slope failures (ToF) in days when the FoSmin resulting from the normal distribution of soil properties was taken into account. During the deterministic analysis, the slope remained stable up to 50°. However, it became unstable at and beyond 45°, and the timing of failure accelerated when random variability in soil properties was considered via probabilistic analysis. For 55° and 60° slopes, the slope failure accelerated from the 131st day to 102nd day (29 days faster) and the from 121st day to 101st day (20 days faster), respectively. Although cumbersome, this demonstration highlights the benefit of using probabilistic analysis when material variability is encountered.

Table 1.
Reliability Index and Failure Probability for Different Slope Conditions.
3.2. Probabilistic Slope Stability Analysis for Vegetated Slope with RWU Only
The probability density function (PDF) of the factor of safety for a vegetated slope with RWU is presented in Figure 8a–g. The relationship of the maximum factor of safety (FoSmax), minimum factor of safety (FoSmin), and mean factor of safety (FoSmean) with the slope angle (β°) determined by a probabilistic slope stability analysis on a vegetated slope with RWU are presented in Figure 9a. Clearly, the factor of safety for a vegetated slope with RWU drops with increases in slope angle for all three cases.
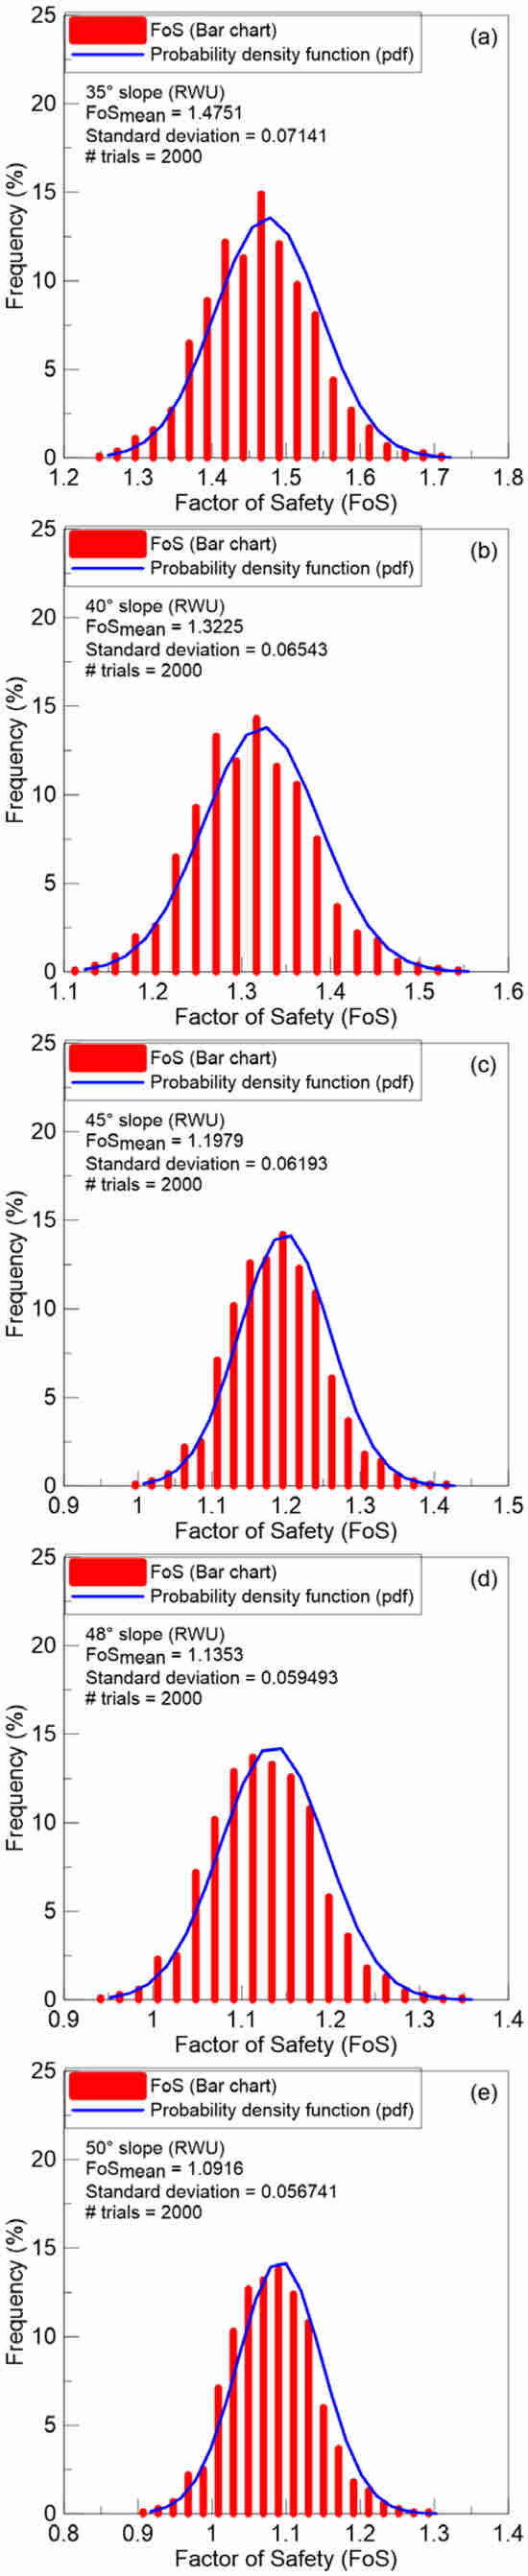
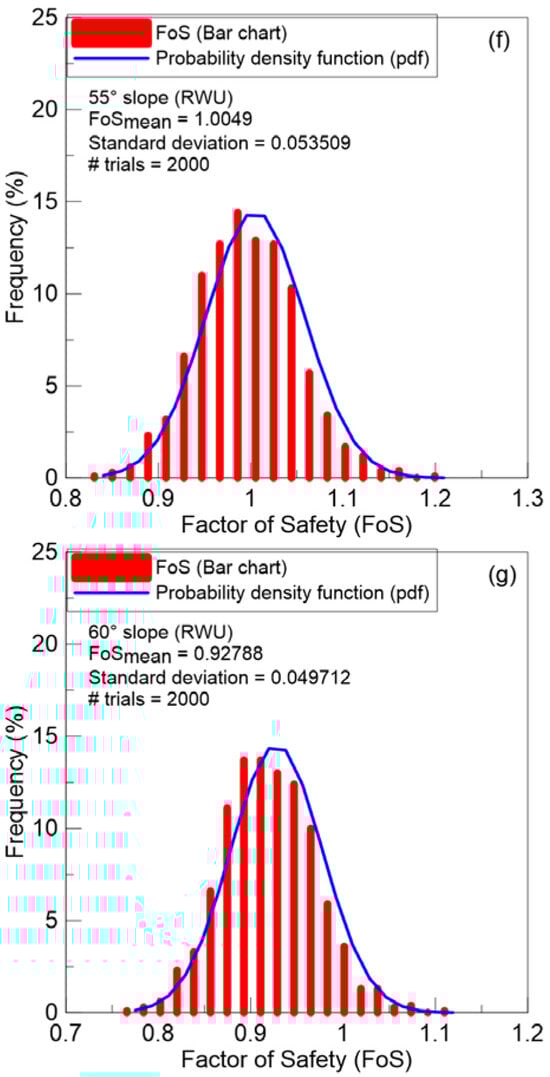
Figure 8.
(a–g) Probability density function (pdf) of factor of safety for different slope angles for vetiver vegetated slope with RWU.
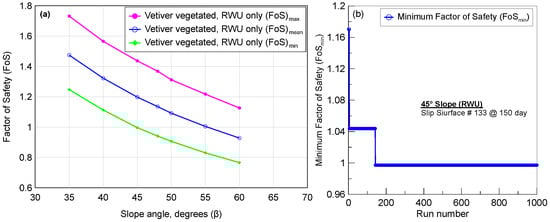
Figure 9.
(a) Variation of the probabilistic factor of safety with slope angle for vegetated slope with RWU, and (b) illustration of a 45° slope failure and its timing when FoSmin is considered via probabilistic analysis.
The percentage deviation of FoSmin and FoSmax from the FoSmean remained nearly consistent across all investigated slope angles, ranging from 15.4% to 17.5% for FoSmin and from 17.4% to 21.4% for FoSmax. A further deep dive into probabilistic analysis by plotting FoSmin versus run for a 45° bare slope revealed that the slope became unstable with FoS < 1. The value of FoSmin was obtained on 150th day, which took 143/1000 runs to stabilize (Figure 9b). On the other hand, the same 45° slope remained stable when FoSmean (i.e., deterministic analysis) was considered for the entire analysis including all four typhoon events. Table 1 presents the accelerated timing of slope failures when the FoSmin resulting from the normal distribution of soil properties was taken into account. During the deterministic analysis, the slope remained stable up to 55°. However, it became unstable at and beyond 45°, and the timing of failure accelerated when random variability in soil properties was considered via probabilistic analysis. For 45°, 48°, 50°, 55°, and 60° slopes, the slope with RWU failed on the 150, 122, 121, 105, and 104th day, respectively. Thus, the timing of the 60° slope failure with RWU accelerated from 132nd day to 104th day (28 days faster). In addition, the 45°, 48°, 50°, and 55° slopes with RWU, which were safe for FoSmean, failed when FoSmin was considered in the analysis. Once again, these observations highlight the benefit of using probabilistic analysis when material variability is encountered.
3.3. Probabilistic Slope Stability Analysis for Vegetated Slope with RWU +RR/F
The probability density function (PDF) of the factor of safety for vegetated slopes with RWU + RR/F is presented in Figure 10a–g. The relationship of the maximum factor of safety (FoSmax), minimum factor of safety (FoSmin), and mean factor of safety maximum factor of safety (FoSmean) with slope angle (β°) from a probabilistic slope stability analysis on avegetated slope with RWU + RR/F is presented in Figure 11a. Clearly, the factor of safety for a vegetated slope with RWU + RR/F drops with increases in slope angle for all three cases.
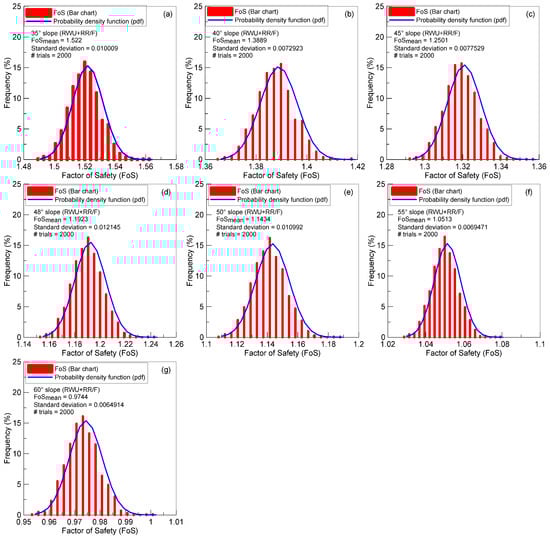
Figure 10.
(a–g) Probability density function (pdf) of factors of safety for different slope angles for vetiver vegetated slopes with RWU + RR/F.
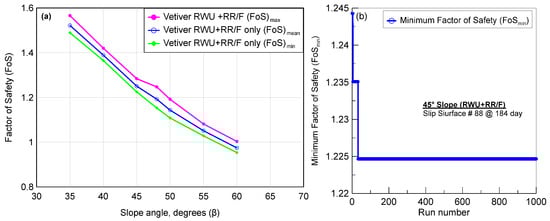
Figure 11.
(a) Variation of the probabilistic factor of safety with slope angle for vegetated slopes with RWU + RR/F, and (b) illustration of a no failure of a 45° slope when FoSmin is considered via probabilistic analysis.
The percentage deviation of FoSmin and FoSmax from the FoSmean remained nearly consistent and relatively minimal across all of the investigated slope angles, ranging from a mere 1.9% to 2.3% for FoSmin and from 2.5% to 3.2% for FoSmax. Thus, the vegetation with RWU + RR/F minimized variability (<3.5%) and prevented failure at all slopes. Furthermore, the probabilistic analysis performed by plotting FoSmin versus run revealed that the slopes remained stable irrespective of slope angles, and for a 45° slope it took only 33/1000 runs to stabilize (Figure 11b).
3.4. Risk Analysis Framework Using Probability of Failure
The factor of safety serves as an indicator of a slope’s relative stability, but it does not directly represent the actual risk level, since input parameters can vary significantly [4]. In probabilistic slope stability analysis, two additional measures are often used to evaluate stability and assess risk: the probability of failure and the reliability index [4,5,6,7,33,34].
The probability of failure (PoF) represents the likelihood that the factor of safety (FoS) is less than 1.0. This value is obtained by identifying the number of calculated safety factors below 1.0 and expressing that they count as a percentage of the total number of Monte Carlo simulations that successfully converged (Figure 12a–i). For instance, as illustrated in Figure 12d, out of 1000 Monte Carlo simulations that were performed and produced converged results, 40 values fell below 1.0, and hence the resulting probability of failure was 4%. Figure 12a–i shows the cumulative distribution function (CDF) plots along with the marked PoF for 45°, 48°, and 50° slope angles and the three cases discussed earlier.
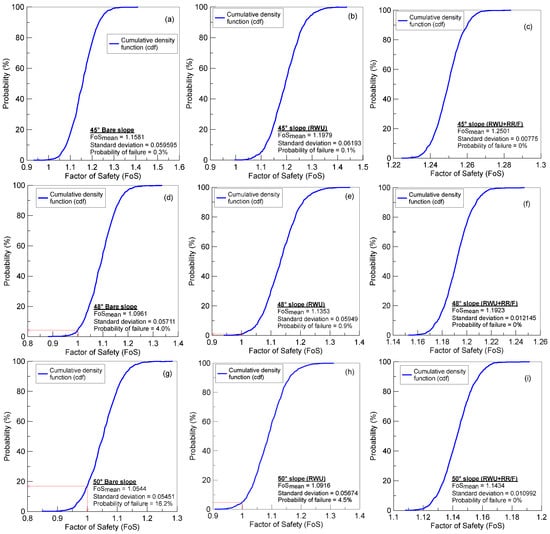
Figure 12.
Probability of failure of factor of safety for bare slope, slope with RWU, and slope with RWU + RR/F for (a–c) 45° slope; (d–f) 48° slope, and (g–i) 50° slope.
The slopes remain stable for all three cases up to an angle of 40 degrees, with the mean FoS above the failure limit of 1.0 and a manifested probability of failure equal to zero. The 45° bare slope had a mean value of FoS equal to 1.1581, which is way above the failure limit of 1.0, but manifested a PoF equal to 0.3% (Figure 12a–c). Thus, the 45° slope, which appears to be safe with deterministic analysis via its FoSmean greater than 1.0, has a 0.3% chance of failure (i.e., if 1000 slopes were constructed with randomly distributed soil properties, then 3 out of the 1000 slopes would fail). This adds value to the analysis and assists project managers in making decisions regarding the construction of slopes with soil variability. In addition, a 45° slope with the inclusion of RWU, which increases apparent cohesion from matric suction in root-soil zone with mean factor of safety equal to 1.1979 (>1), shows a relatively lower PoF equal to a mere 0.1%. On the other hand, the 45° slope with the inclusion of RWU + RR/F, which not only increases apparent cohesion from matric suction in root-soil zone but also increases the apparent root cohesion with mean factor of safety equal to 1.3207 (>1), shows a 0% PoF, which means the slope is also probabilistically safe (Figure 12a–c).
As the slope angle increases to 48°, the bare slope shows a higher PoF = 4%, which reduces to 0.9% and 0% for the RWU and RWU + RR/F cases (Figure 12d–f). This illustrates the positive hydrological impact resulting from RWU and root reinforcement (RR/F) with the inclusion of RR/F making the slope stable even when soil variability is included. The PoF for 50° for the bare slope, RWU, and RWU + RR/F cases were 16.2%, 4.5%, and 0% (Figure 12g–i). Similarly, the PoF for 55° for the bare slope, RWU, and RWU + RR/F cases were 73.1%, 46.3%, and 0%. The same numbers were 98.7%, 92.7, and 81% for a 60° slope. Clearly, the mechanical root reinforcement effect resulting from the mobilization of root tensile strength is able to keep all slopes up to 55° stable irrespective of the slope angle and soil variability. Nonetheless, the probability of failure (PoF) serves as a reliable indicator of the risk level associated with slope instability.
4. Probabilistic Slope Stability Interpretations and Discussions
4.1. Consistency of Factor of Safety Variations Across Slope Angles
Accounting for the observed variability in soil parameters, the inclusion of root water uptake (RWU) alone increased the mean factor of safety (FoSmean) by about 3–4% across slopes from 35° to 60°. Adding root reinforcement to RWU produced substantially larger gains, with FoSmean improvements on the order of 12–15%. The contrast in performance indicates that the hydrological effect of RWU (enhanced matric suction through plant water extraction) together with the mechanical contribution of roots (tensile and cohesive resistance) work in concert to improve slope stability, thereby supporting the application of vegetative root systems as an effective, sustainable bioengineering solution.
Across all slope angles, the percentage deviations of minimum and maximum Factors of Safety (FoS) from the mean remained nearly constant for the bare slope and RWU slope case scenarios (Figure 13).
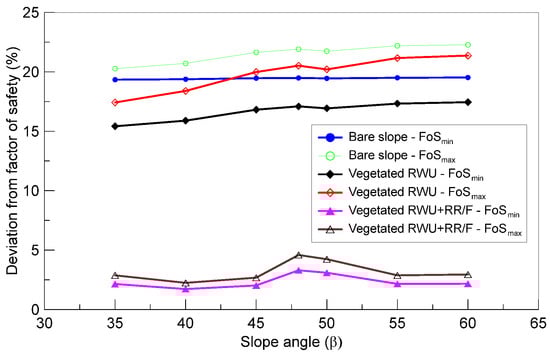
Figure 13.
Variation in FoS deviations across slope angles for different slope conditions.
For bare slopes, deviations ranged from 19.3% to 19.5% (FoSmin) and 20.3% to 22.3% (FoSmax). Slopes with RWU exhibited slightly lower variability, with ranges of 15.4% to 17.5% (FoSmin) and 17.4% to 21.4% (FoSmax), as shown in Figure 13. The lowest variability occurred in slopes with RWU + RR/F, where deviations were minimal—only 1.7% to 3.3% for FoSmin and 2.2% to 4.6% for FoSmax—indicating that vegetation with combined root water uptake and root reinforcement/fibers effectively stabilized slopes and minimized variability to less than 4.6%, preventing the failure of up to 55° slopes.
4.2. Identifying Timing of Failure Based on Probability of Failure
The PoFs for all three cases and all seven slope angles were plotted against time (Figure 14a–u). The instant when the PoF becomes positive (i.e., shows a value above zero), provides insight into identifying the time at which the slope first fails under probabilistic simulation.
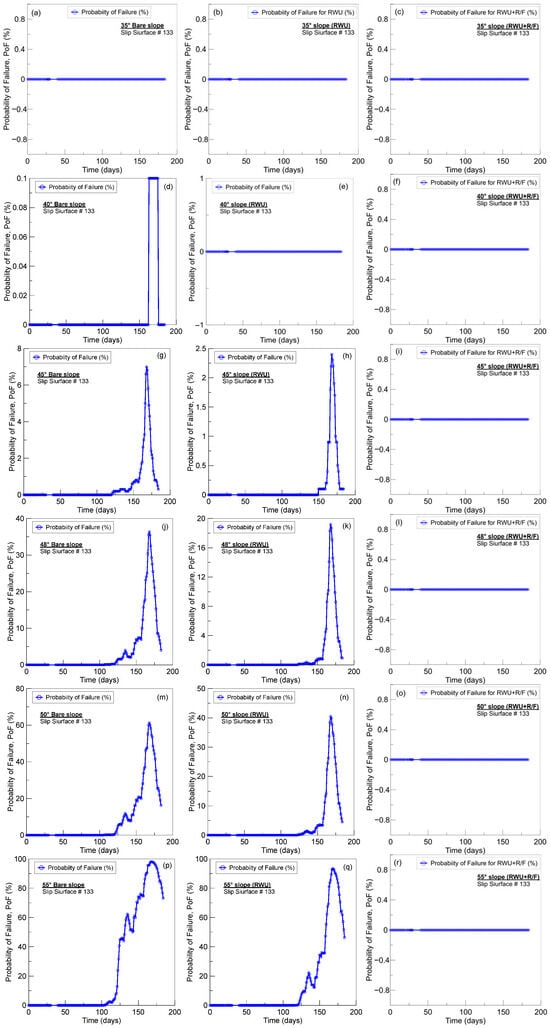
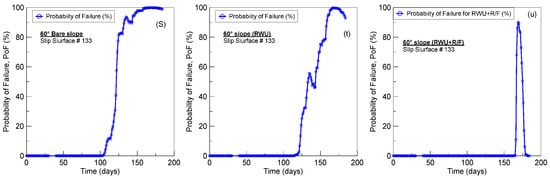
Figure 14.
Time histories of probability of failure of factor of safety for bare slope, slope with RWU, and slope with RWU + RR/F for (a–c) 35° slope; (d–f) 40° slope, (g–i) 45° slope, (j–l) 48° slope, (m–o) 50° slope, (p–r) 55° slope, and (s–u) 60° slope.
Incorporating root water uptake (RWU) into slope stability analysis reveals a clear delay in failure timing across several slope angles compared to bare slopes. Notably, the study on the 35° slope demonstrates that failure does not occur over a six-month period, with the probability of failure (PoF) remaining zero throughout (Figure 14a–c). After careful observation of the plots in Figure 14d–u, the timing of failure for the 40° bare slope, 45° bare slope, 45° RWU, 48° bare, 48° RWU, 50° bare, 50° RWU, 55° bare, 55° RWU, 60° bare, 60° RWU, and 60° RWU + RR/F was identified as 163 days, 121 days, 150 days, 104 days, 122 days, 104 days, 121 days, 102 days, 105 days, 101 days, 104 days, and 165 days, respectively (Table 1). Thus, the failure of the 45° slope is postponed from 121 days to 150 days with RWU, the 48° slope failure shifts from 104 days to 122 days, the 50° slope failure delays from 104 days to 121 days, the 55° slope failure delays from 102 days to 105 days, and for the 60° slope, failure timing extends from 101 days to 110 days with RWU. These results emphasize the hydrological role of RWU in extending slope stability duration, complementing the mechanical reinforcement effects and underscoring the importance of including RWU in probabilistic slope failure assessments. Notably, the consideration of RWU + RR/F was able to prevent slope failure in slopes of up to 55° and postpone the timing of failure from 110 days to 167 days for the 60° slope. The failure time histories consistently identify when the factor of safety (FoS) drops below unity, demonstrating that deterministic FoSmean can mask low-probability but actionable failure risks.
4.3. Reliability Index–Probability of Failure Relationship Across Slope Conditions
The reliability index (RI) quantifies stability by relating the mean (μ) and standard deviation (σ) of the calculated factors of safety, as expressed in the following equation:
In other words, the reliability index represents stability by indicating how many standard deviations the average factor of safety lies above the critical failure threshold of 1.0. In essence, it normalizes the factor of safety relative to its inherent variability or uncertainty. With the probability distribution of the factor of safety known, Figure 15a and Figure 15b illustrate the direct relationship between the reliability index and the probability of failure for bare slopes and slopes with RWU, respectively, with slope angles ranging between 45° to 60°. Specifically, Figure 15 depicts this connection for a normally distributed factor of safety. As expected, the RI increased nonlinearly as the PoF decreased, and the trend remained pretty much similar for both the bare slope and RWU cases (Figure 15). Table 1 presents the direct relationship between the reliability index and the probability of failure for each case and slope angle. On the other hand, for the RWU + RR/F case, the PoF was zero up to a 55° slope, and the RI decreased with values 55, 53, 37, 31, 28, 15, and 4.4 for 35°, 40°, 45°, 48°, 50°, 55°, and 60°, respectively (not plotted here). In general, the PoF decreased and the RI increased as the slope angle decreased for bare and RWU cases, with minimally noticeable differences in their values. However, for the case with RR/F, the PoF was zero up to 55°with relatively much higher values of RI for all slope angles, demonstrating again the importance of vetiver root reinforcement and hence the implementation of bioengineering practices, which provides enormous contributions to slope stability. For normally distributed factors of safety, the observed RI–PoF trends aligned closely with theoretical curves, confirming that probabilistic analysis can directly quantify the likelihood of failure.
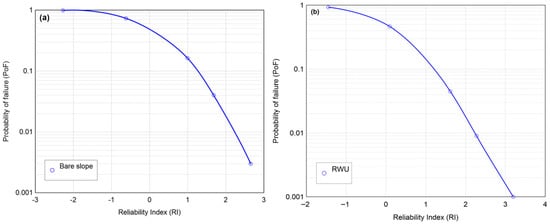
Figure 15.
Relationship between probability of failure of factor of safety versus reliability index for (a) bare slope, and (b) slope with RWU for all the slope angles under investigation.
4.4. Effect of Slope Angle on Sensitivity to Soil Property Variability
Results from Figure 7a, Figure 9a, Figure 11a, Figure 12, Figure 13 and Figure 14 show that the probabilistic variability had the greatest impact on slopes steeper than 45°, where smaller safety margins make slope stability highly sensitive to changes in soil properties. Variations in effective cohesion, friction angle, and unit weight widened the range of possible factors of safety, leading to earlier predicted failures compared to deterministic analysis. In contrast, gentler slopes retained larger stability margins, causing minimal differences between deterministic and probabilistic outcomes. This highlights the importance of incorporating soil property uncertainty into assessing steeper tropical slopes subject to extreme rainfall.
5. Conclusions
This study applied a probabilistic slope stability framework to tropical hillslopes in southern Guam under typhoon-induced infiltration, incorporating variability in soil properties via Latin hypercube sampling. The results from hydro-mechanical analysis highlight significant differences between deterministic and probabilistic predictions, particularly for steep slopes, and emphasize the stabilizing influence of vegetation and root reinforcement. Key findings include:
- 1.
- Earlier predicted failures under probabilistic analysis—For slopes ≥ 45°, probabilistic simulations predicted failure 20–29 days (for 60° and 55° slopes, respectively) earlier for bare slopes compared to deterministic predictions.
- 2.
- Detection of slope failure and its timing:
- (a)
- Bare slopes—with slope angle between 45–50°, which were otherwise safe in deterministic analysis, were found to have a probability to fail under probabilistic analysis, and it was possible to identify the timing of failure via probabilistic analysis.
- (b)
- Vegetation with root water uptake (RWU)—RWU increased stability compared to bare slopes but still resulted in failures up to 28 days earlier (for a 60° slope) under probabilistic conditions.
- (c)
- Vegetation with RWU and root reinforcement (RWU + RR/F)—This scenario did not result in slope failure in up to 50° slope angles. Also, results showed the factor of safety variability reduced to <5% and maintained stability across all slope angles, with no predicted failures.
- 3.
- Synergistic Role of RWU and Root Reinforcement in Sustainable Slope Stabilization—Even after accounting for variability in soil properties, RWU alone increased the mean factor of safety (FoSmean) by roughly 3–4% across slope angles of 35–60%. When RWU was combined with root reinforcement, the improvement was substantially greater, reaching about 7–10%. These findings highlight the combined hydrological benefits of RWU and the mechanical reinforcement provided by roots working synergistically to enhance slope stability, making this approach an effective and sustainable bioengineering practice.
- 4.
- Impact of slope angle—The influence of probabilistic variability in soil properties was most pronounced on slopes ≥ 45°, while gentler slopes showed minimal difference between deterministic and probabilistic predictions.
- 5.
- Reliability index trends—The reliability index (RI) increased nonlinearly as slope angle decreased for both bare and RWU slopes, indicating greater stability at gentler slopes. Bare slopes ranged from RI = 6.2 at 35° to −2.3 at 60°, while RWU slopes had slightly higher RI values (6.7 to −1.5). Slopes with RWU + RR/F showed consistently high RI (7 to 53) and no failures up to 55°slopes, highlighting the strong stabilizing effect of root reinforcement and bioengineering practices.
- 6.
- Probability of Failure and Reliability Index Relationship—PoF decreased as RI increased, with a clear inverse nonlinear trend for bare and RWU cases. At 45°, bare slopes had a PoF = 0.3% (RI = 2.7) and RWU slopes 0.1% (RI = 3.2). Steeper slopes (≥50°) showed sharp PoF increases, reaching nearly 99% for bare and 93% for RWU at 60°. The RWU + RR/F case maintained a zero PoF up to 55° slopes, underscoring root reinforcement’s role in eliminating failure risk. These results confirm that probabilistic PoF–RI analysis provides a more accurate assessment of slope stability than deterministic approaches.
These results demonstrate that deterministic methods can underestimate instability risk in tropical hillslopes, particularly under extreme infiltration events. A probabilistic approach provides a more realistic measure of slope reliability, integrates uncertainty in soil parameters, and better informs hazard mitigation strategies.
Author Contributions
Conceptualization, U.D.P.; methodology, U.D.P. and S.C.; software, U.D.P. and B.H.; validation, U.D.P. and B.H.; formal analysis, U.D.P.; investigation, U.D.P. and M.-H.Y.; resources, U.D.P. and B.H.; data curation, U.D.P., S.S.C.C. and M.-H.Y.; writing—original draft preparation, U.D.P.; writing—review and editing, U.D.P., M.-H.Y., S.C., S.S.C.C. and B.H.; visualization, U.D.P.; supervision, U.D.P.; project administration, U.D.P.; funding acquisition, U.D.P. All authors have read and agreed to the published version of the manuscript.
Funding
This research was supported by the U.S. Department of Interior, Office of Insular Affairs under the FY 2020 Coral Reef and Natural Resources Grant Program and administered by the Guam Bureau of Statistics and Plans (GBSP), Federal award identification number (FAIN) D20AP00092. This material was also partially supported by the National Sea Grant College Program of the United States Department of Commerce, National Oceanic and Atmospheric Administration Award No. NA18OAR-4170077 (Project No. R/UOGSG19-2) and NSF HBCU RISE grant number 2219532. This support is greatly appreciated. The views expressed herein do not necessarily reflect the views of any of these organizations.
Data Availability Statement
The data used is primarily reflected in the article. Other relevant data is available from the authors upon request.
Acknowledgments
The authors thank the staff at UOG Sea Grant, UOG EPSCOR, and RCUOG at the University of Guam (UOG) for their support in procurement of equipment and accessories and some of the project relevant office support. Also, thanks to the former research assistants John Sacayan, Edriel Aquino, and Daniel Mabagos who were students from the School of Engineering at UOG for their valuable support in conducting laboratory experiments related to this research.
Conflicts of Interest
The authors declare no conflicts of interest. The funders had no role in the design of the study; in the collection, analyses, or interpretation of data; in the writing of the manuscript; or in the decision to publish the results.
References
- Manibusan, S.; Khosrowpanah, S.; Lander, M.A.; Golabi, M.; Patil, U.D. A GIS based assessment of a dynamic watershed in Guam. Hydrology 2019, 7, 1–9. [Google Scholar] [CrossRef]
- Kottermair, M.; Golabi, M.H.; Khosrowpanah, S.; Wen, Y. Spatio-Temporal Dynamics of Badlands in Southern Guam: A Case Study of Selected Sites; Water and Environmental Research Institute of the Western Pacific, University of Guam: Mangilao, Guam, 2011. [Google Scholar]
- Patil, U.D.; Shelton, A.J.; Catahay, M.; Kim, Y.S.; Congress, S.S.C. Role of vegetation in improving the stability of a tropical hill slope in Guam. Environ. Geotech. 2022, 9, 562–581. [Google Scholar] [CrossRef]
- Duncan, J.M. Factors of safety and reliability in geotechnical engineering. J. Geotech. Geoenviron. Eng. 2000, 126, 307–316. [Google Scholar] [CrossRef]
- Morgenstern, N.R.; Price, V.E. The Analysis of the Stability of Generalised Slip Surfaces. Géotechnique 1965, 15, 79–93. [Google Scholar] [CrossRef]
- El-Ramly, H.; Morgenstern, N.R.; Cruden, D.M. Probabilistic slope stability analysis for practice. Can. Geotech. J. 2002, 39, 665–683. [Google Scholar] [CrossRef]
- Chowdhury, R.N.; Xu, D.W. Geotechnical system reliability of slopes. Re-Liabil. Eng. Syst. Saf. 1995, 47, 141–151. [Google Scholar] [CrossRef]
- Huang, J.; Griffiths, D.V.; Fenton, G.A. System reliability of slopes by RFEM. Soils Found. 2010, 50, 343–353. [Google Scholar] [CrossRef]
- Fenton, G.A.; Griffiths, D.V. Risk Assessment in Geotechnical Engineering; John Wiley & Sons: New York, NY, USA, 2008; Volume 461. [Google Scholar]
- Low, B.K. Reliability-based design applied to retaining walls. Geotechnique 2005, 55, 63–75. [Google Scholar] [CrossRef]
- Bhattacharya, G.; Jana, D.; Ojha, S.; Chakraborty, S. Direct search for minimum reliability index of earth slopes. Comput. Geotech. 2003, 30, 455–462. [Google Scholar] [CrossRef]
- Hassan, A.M.; Wolff, T.F. Search algorithm for minimum reliability index of earth slopes. J. Geotech. Geoenviron. Eng. 1999, 125, 301–308. [Google Scholar] [CrossRef]
- de Koker, N.; Day, P.; Zwiers, A. Assessment of reliability-based design of stable slopes. Can. Geotech. J. 2019, 56, 495–504. [Google Scholar] [CrossRef]
- Low, B.K.; Tang, W.H. Probabilistic slope analysis using Janbu’s generalized procedure of slices. Computers and Geotechnics. 1997, 21, 121–142. [Google Scholar] [CrossRef]
- Wang, Y.; Cao, Z.-J.; Au, S.-K. Practical reliability analysis of slope stability by advanced Monte Carlo simulations in a spreadsheet. Can. Geotech. J. 2011, 48, 162–172. [Google Scholar] [CrossRef]
- Rahardjo, H.; Li, X.W.; Toll, D.G.; Leong, E.C. The effect of antecedent rainfall on slope stability. Geotech. Geol. Eng. 2001, 19, 371–399. [Google Scholar] [CrossRef]
- Zhang, J.; Huang, H.-W.; Zhang, L.-M.; Zhu, H.-H.; Shi, B. Probabilistic pre-diction of rainfall-induced slope failure using a mechanics-based model. Eng. Geol. 2014, 168, 129–140. [Google Scholar] [CrossRef]
- Liu, X.; Wang, Y. Reliability analysis of an existing slope at a specific site considering rainfall triggering mechanism and its past performance records. Eng. Geol. 2021, 288, 106144. [Google Scholar] [CrossRef]
- Raia, S.; Alvioli, M.; Rossi, M.; Baum, R.L.; Godt, J.W.; Guzzetti, F. Improving predictive power of physically based rainfall-induced shallow landslide models: A probabilistic approach. Geosci. Model Dev. 2014, 7, 495–514. [Google Scholar] [CrossRef]
- Costa, K.R.C.B.; Dantas APdo, N.; Cavalcante, A.L.B.; de Assis, A.P. Probabilistic approach to transient unsaturated slope stability associated with precipitation event. Sustainability 2023, 15, 15260. [Google Scholar] [CrossRef]
- Xia, Y.; Mahmoodian, M.; Li, C.; Zhou, A. Stochastic method for predicting risk of slope failure subjected to unsaturated infiltration flow. Int. J. Geomech. 2017, 17, 04017037. [Google Scholar] [CrossRef]
- Kang, F.; Han, S.; Salgado, R.; Li, J. System probabilistic stability analysis of soil slopes using Gaussian process regression and Latin hypercube sampling. Comput. Geotech. 2015, 63, 13–23. [Google Scholar] [CrossRef]
- Marra, J.; Simeral, D.; National Oceanic and Atmospheric Administration (NOAA). “Highlights for Hawaii and U.S. Affiliated Pacific Islands June 2023.” Quarterly Climate Impacts and Outlooks–Significant Events–For March to May 2023. 2023. Available online: https://www.drought.gov/sites/default/files/2023-06/Pacific%20Spring%202023.pdf (accessed on 10 November 2024).
- National Weather Service Guam. Super Typhoon Mawar Meteorological Assessment (Technical Report). U.S. National Weather Service. 5 September 2023. Available online: https://www.weather.gov/media/gum/TropicalEventSummary/20230905_NWS_Guam_STY_Mawar_Meteorological_Assessment.pdf (accessed on 7 August 2025).
- Aydlett, B. “Impacts of El Niño on climate and ecosystems in Guam. Pacific Drought Knowledge Exchange.” Report Available Online from National Weather Service of Guam. 2023. Available online: https://www.soest.hawaii.edu/pdke/wp-content/uploads/2023/02/Impacts-of-El-Nino-on-Climate-and-Ecosystems-in-Guam.pdf (accessed on 10 November 2024).
- Yeo, M.H.; Patil, U.D.; Chang, A.; King, R. Changing trends in temperatures and rainfalls in the western Pacific: Guam. Climate 2023, 11, 81. [Google Scholar] [CrossRef]
- Patil, U.D.; Higgs, B.J.; Yeo, M.H.; Chakraborty, S.; Banerjee, A.; Congress, S.S.C. Tropical Hillslopes’ Stability During Heavy Rainfall from Multiple Typhoon Events. In Proceedings of the 4th Pan-American Conference on Unsaturated Soils, Ottawa, ON, Canada, 22–25 June 2025. [Google Scholar]
- Patil, U.D.; Yeo, M.H.; Chakraborty, S.; Congress, S.S.C.; Banerjee, A.; Higgs, B.J. The Resilience of Vetiver-Vegetated Tropical Hillslopes to Heavy Precipitation Events Caused by Successive Typhoon. Geotech. Geol. Eng. 2025; under review. [Google Scholar]
- GeoStudio. Slope Stability Verification Manual; Seequent Limited, the Bentley Subsurface Company: Christchurch, New Zealand, 2025; Available online: https://files.seequent.com/GeoStudio/Manuals/Slope%20Stability%20Verification%20Manual.pdf (accessed on 15 July 2025).
- Wu, T.H.; McKinnell, W.P., III; Swanston, D.N. Strength of tree roots and landslides on Prince of Wales Island, Alaska. Can. Geotech. J. 1979, 16, 19–33. [Google Scholar] [CrossRef]
- GeoStudio. Heat and Mass Transfer Modeling with GeoStudio; Seequent Limited, the Bentley Subsurface Company: Christchurch, New Zealand, 2025; Available online: https://files.seequent.com/GeoStudio/Manuals/Slope%20Stability%20Modeling.pdf (accessed on 15 July 2025).
- Richards, L.A. Capillary conduction of liquids through porous mediums. Physics 1931, 1, 318–333. [Google Scholar] [CrossRef]
- Abdulai, M.; Sharifzadeh, M. Probability methods for stability design of open pit rock slopes: An overview. Geosciences 2021, 11, 319. [Google Scholar] [CrossRef]
- Tan, X.H.; Wang, X.E.; Hu, X.J.; Shen, M.F.; Hu, N. Two methods for pre-dicting reliability index and critical probabilistic slip surface of soil slopes. Geotech. Geol. Eng. 2016, 34, 1283–1292. [Google Scholar] [CrossRef]
Disclaimer/Publisher’s Note: The statements, opinions and data contained in all publications are solely those of the individual author(s) and contributor(s) and not of MDPI and/or the editor(s). MDPI and/or the editor(s) disclaim responsibility for any injury to people or property resulting from any ideas, methods, instructions or products referred to in the content. |
© 2025 by the authors. Licensee MDPI, Basel, Switzerland. This article is an open access article distributed under the terms and conditions of the Creative Commons Attribution (CC BY) license (https://creativecommons.org/licenses/by/4.0/).