

Geomorphometric and Geophysical Constraints on Outlining Drained Shallow Mountain Mires


Abstract
1. Introduction
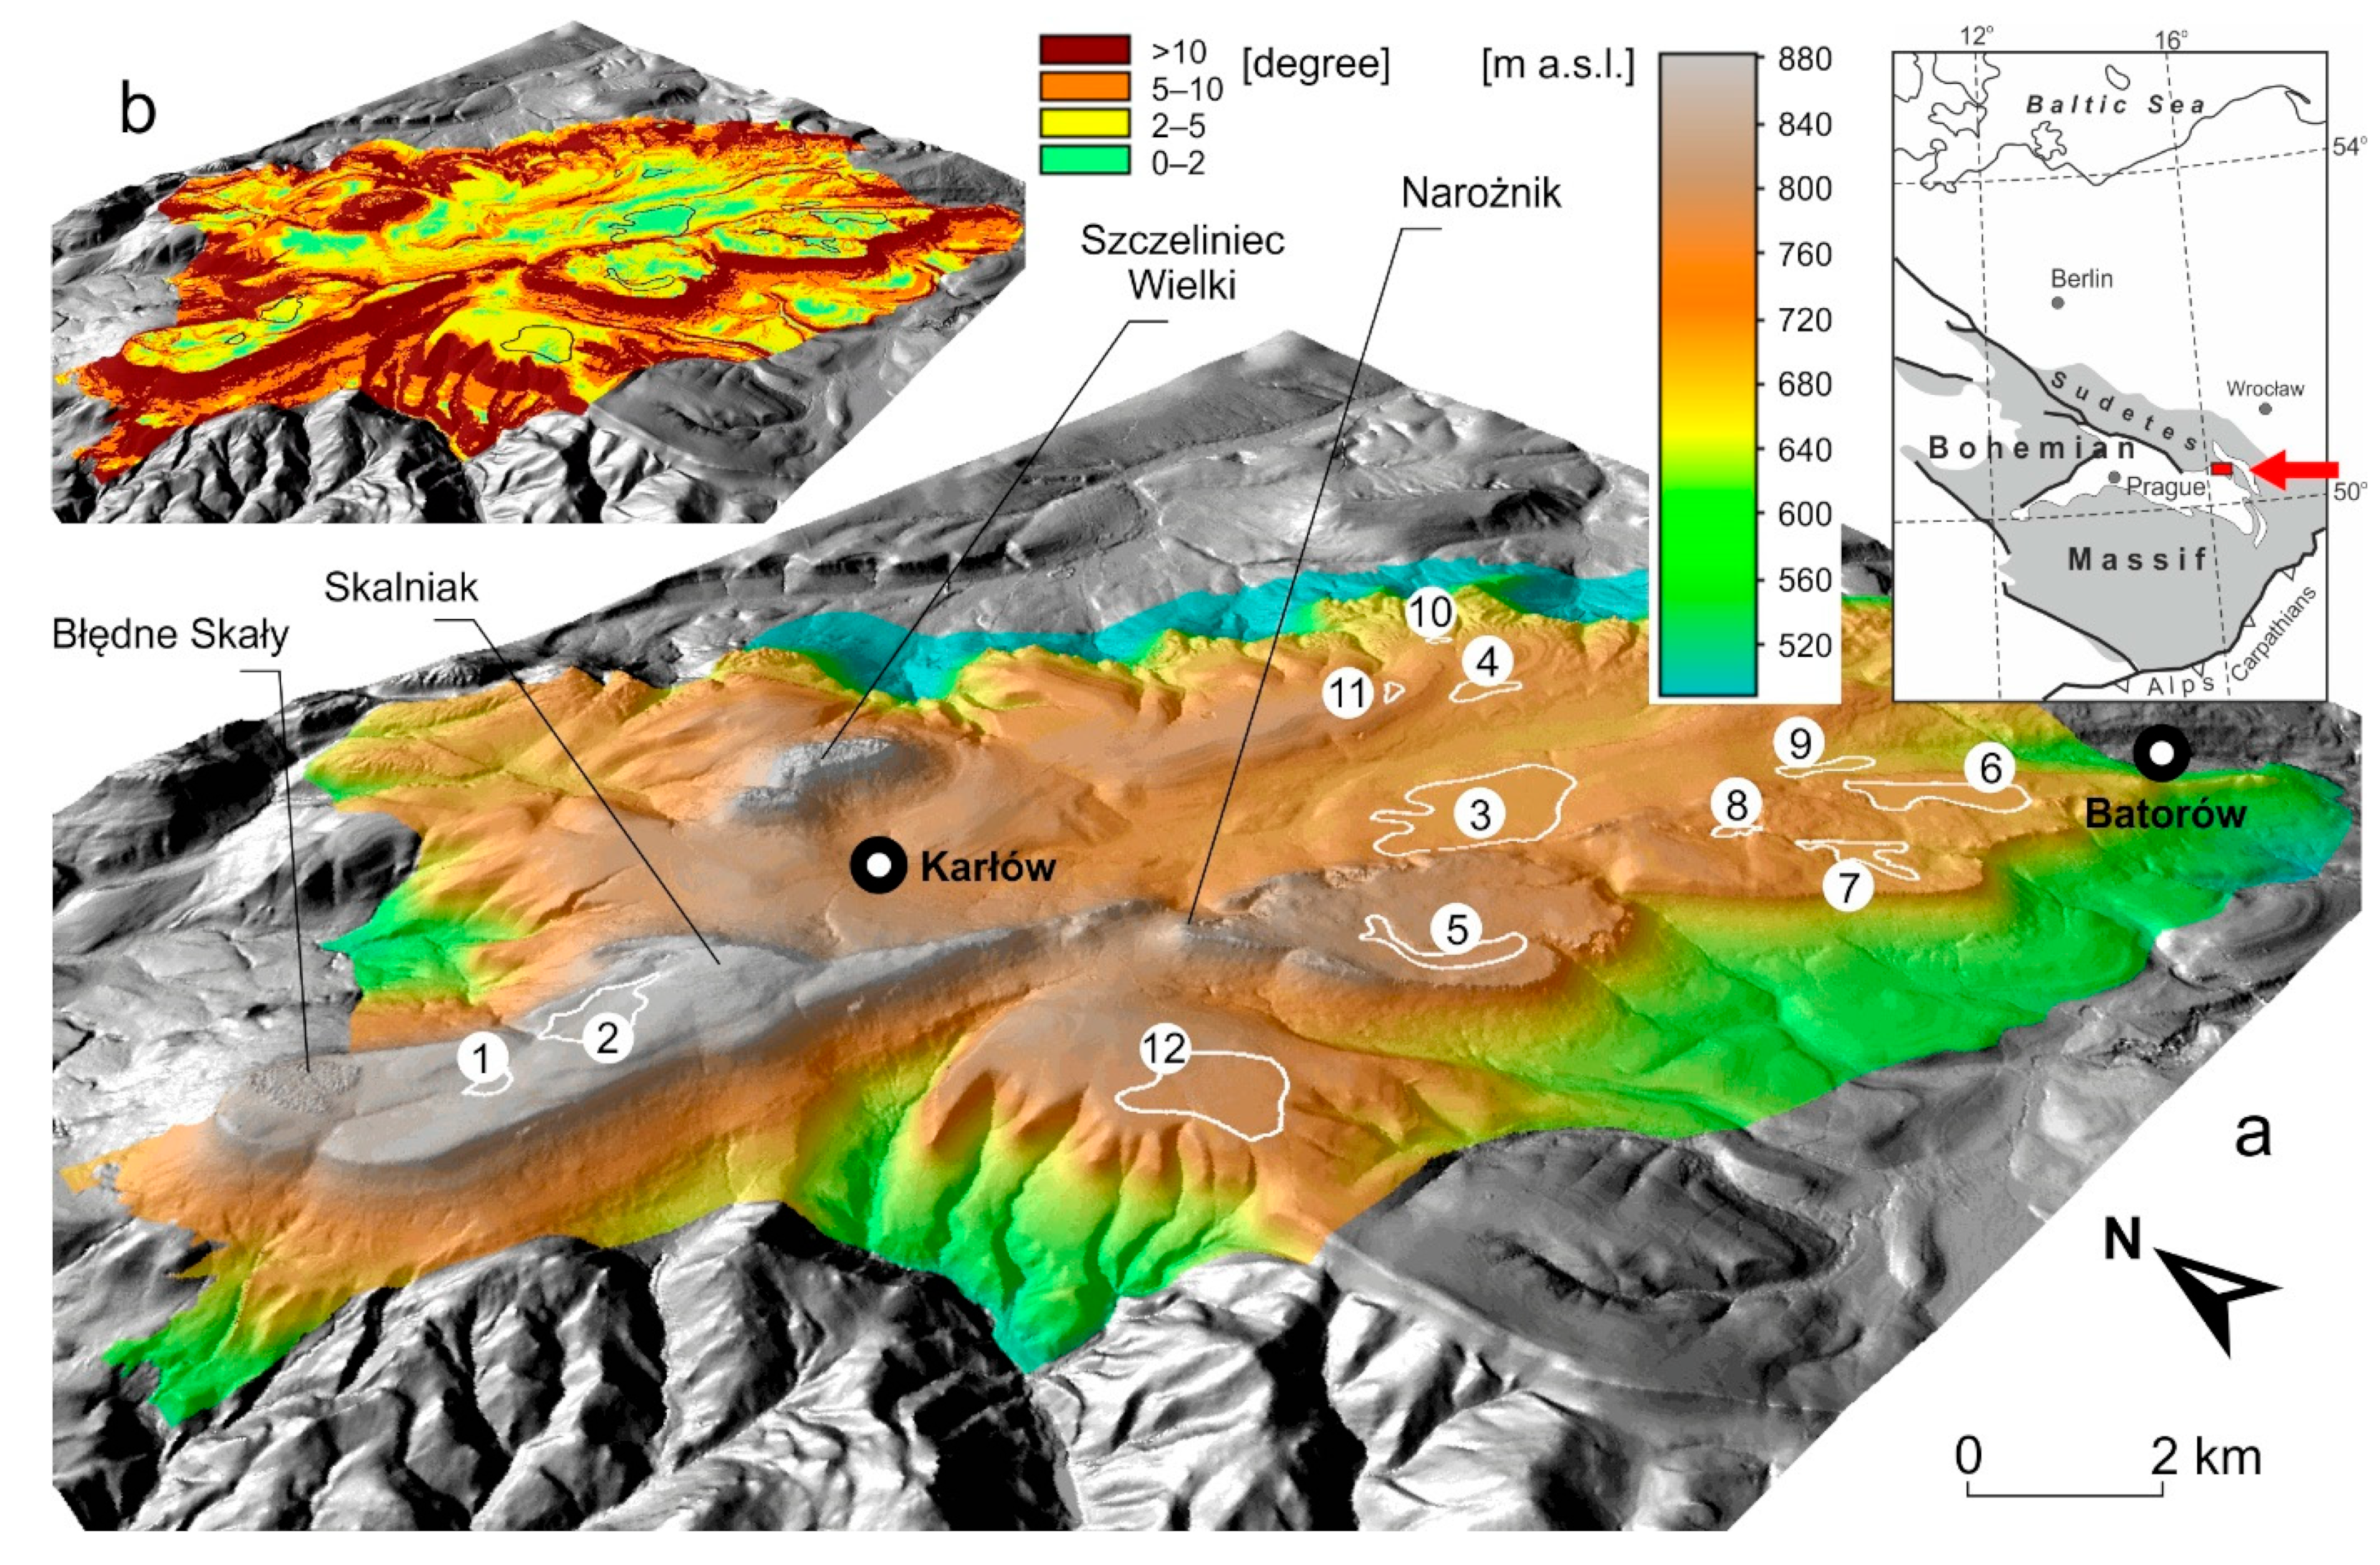
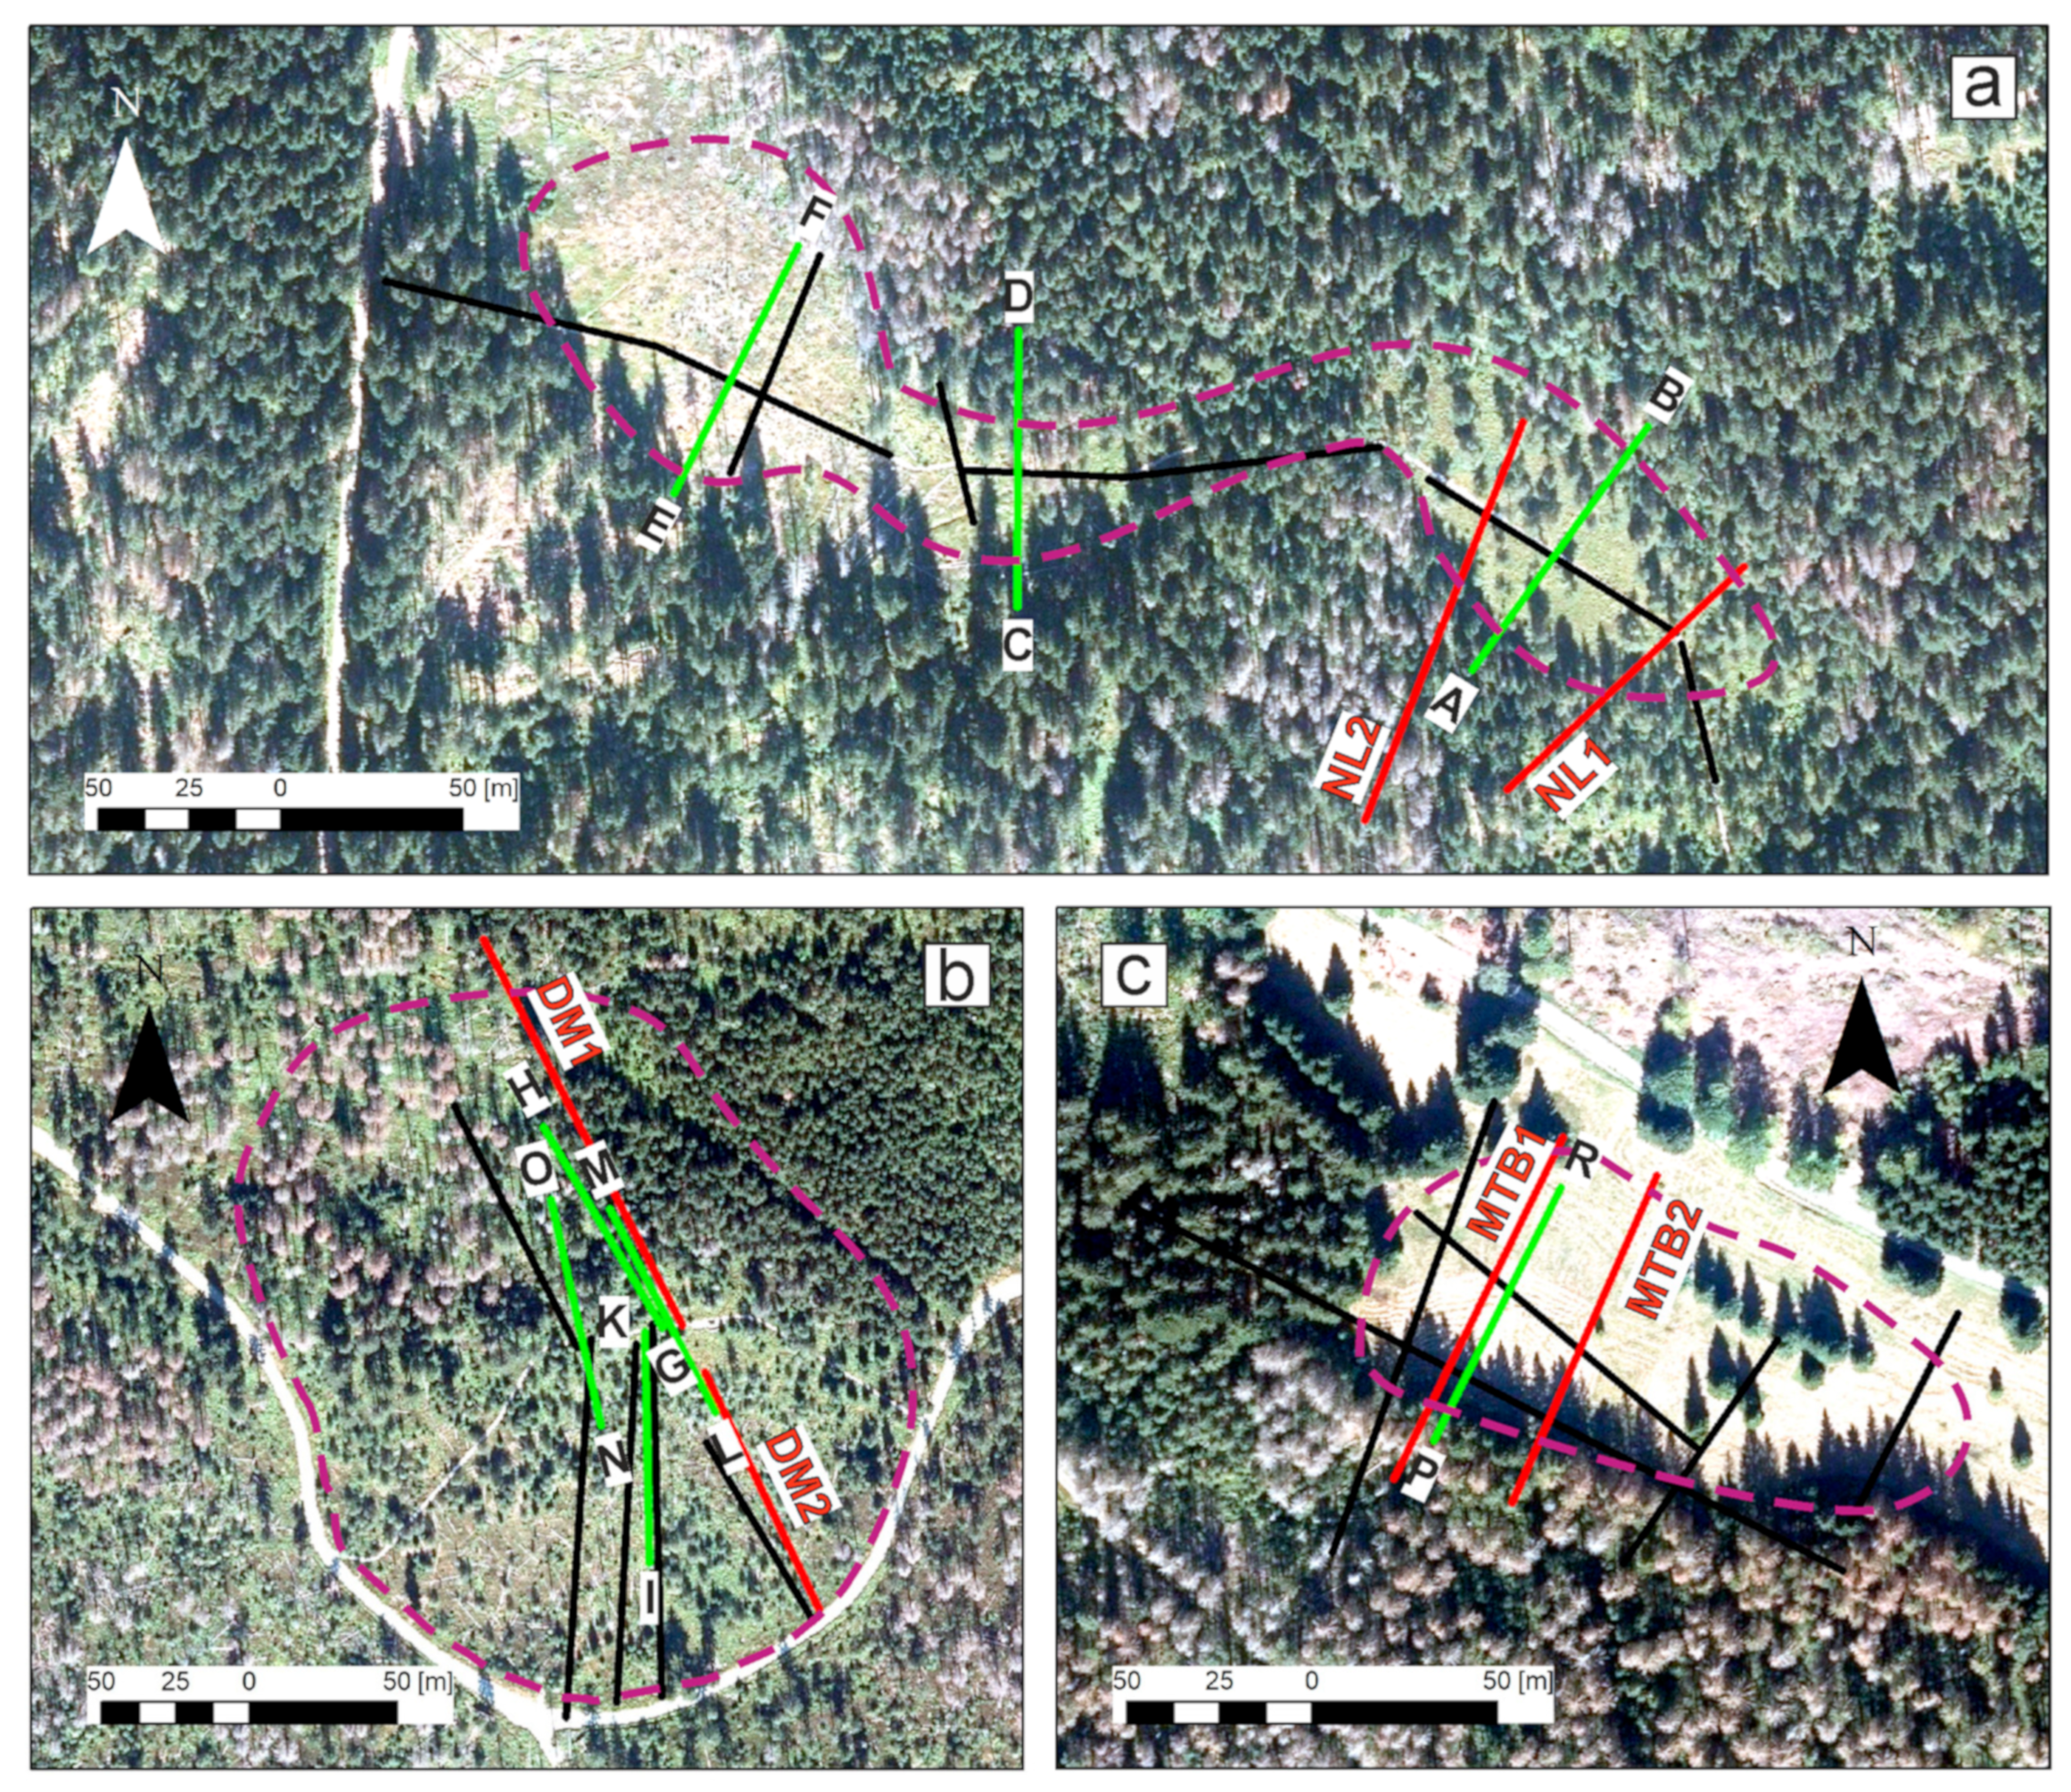
2. Study Area
3. Methods
4. Results and Interpretation
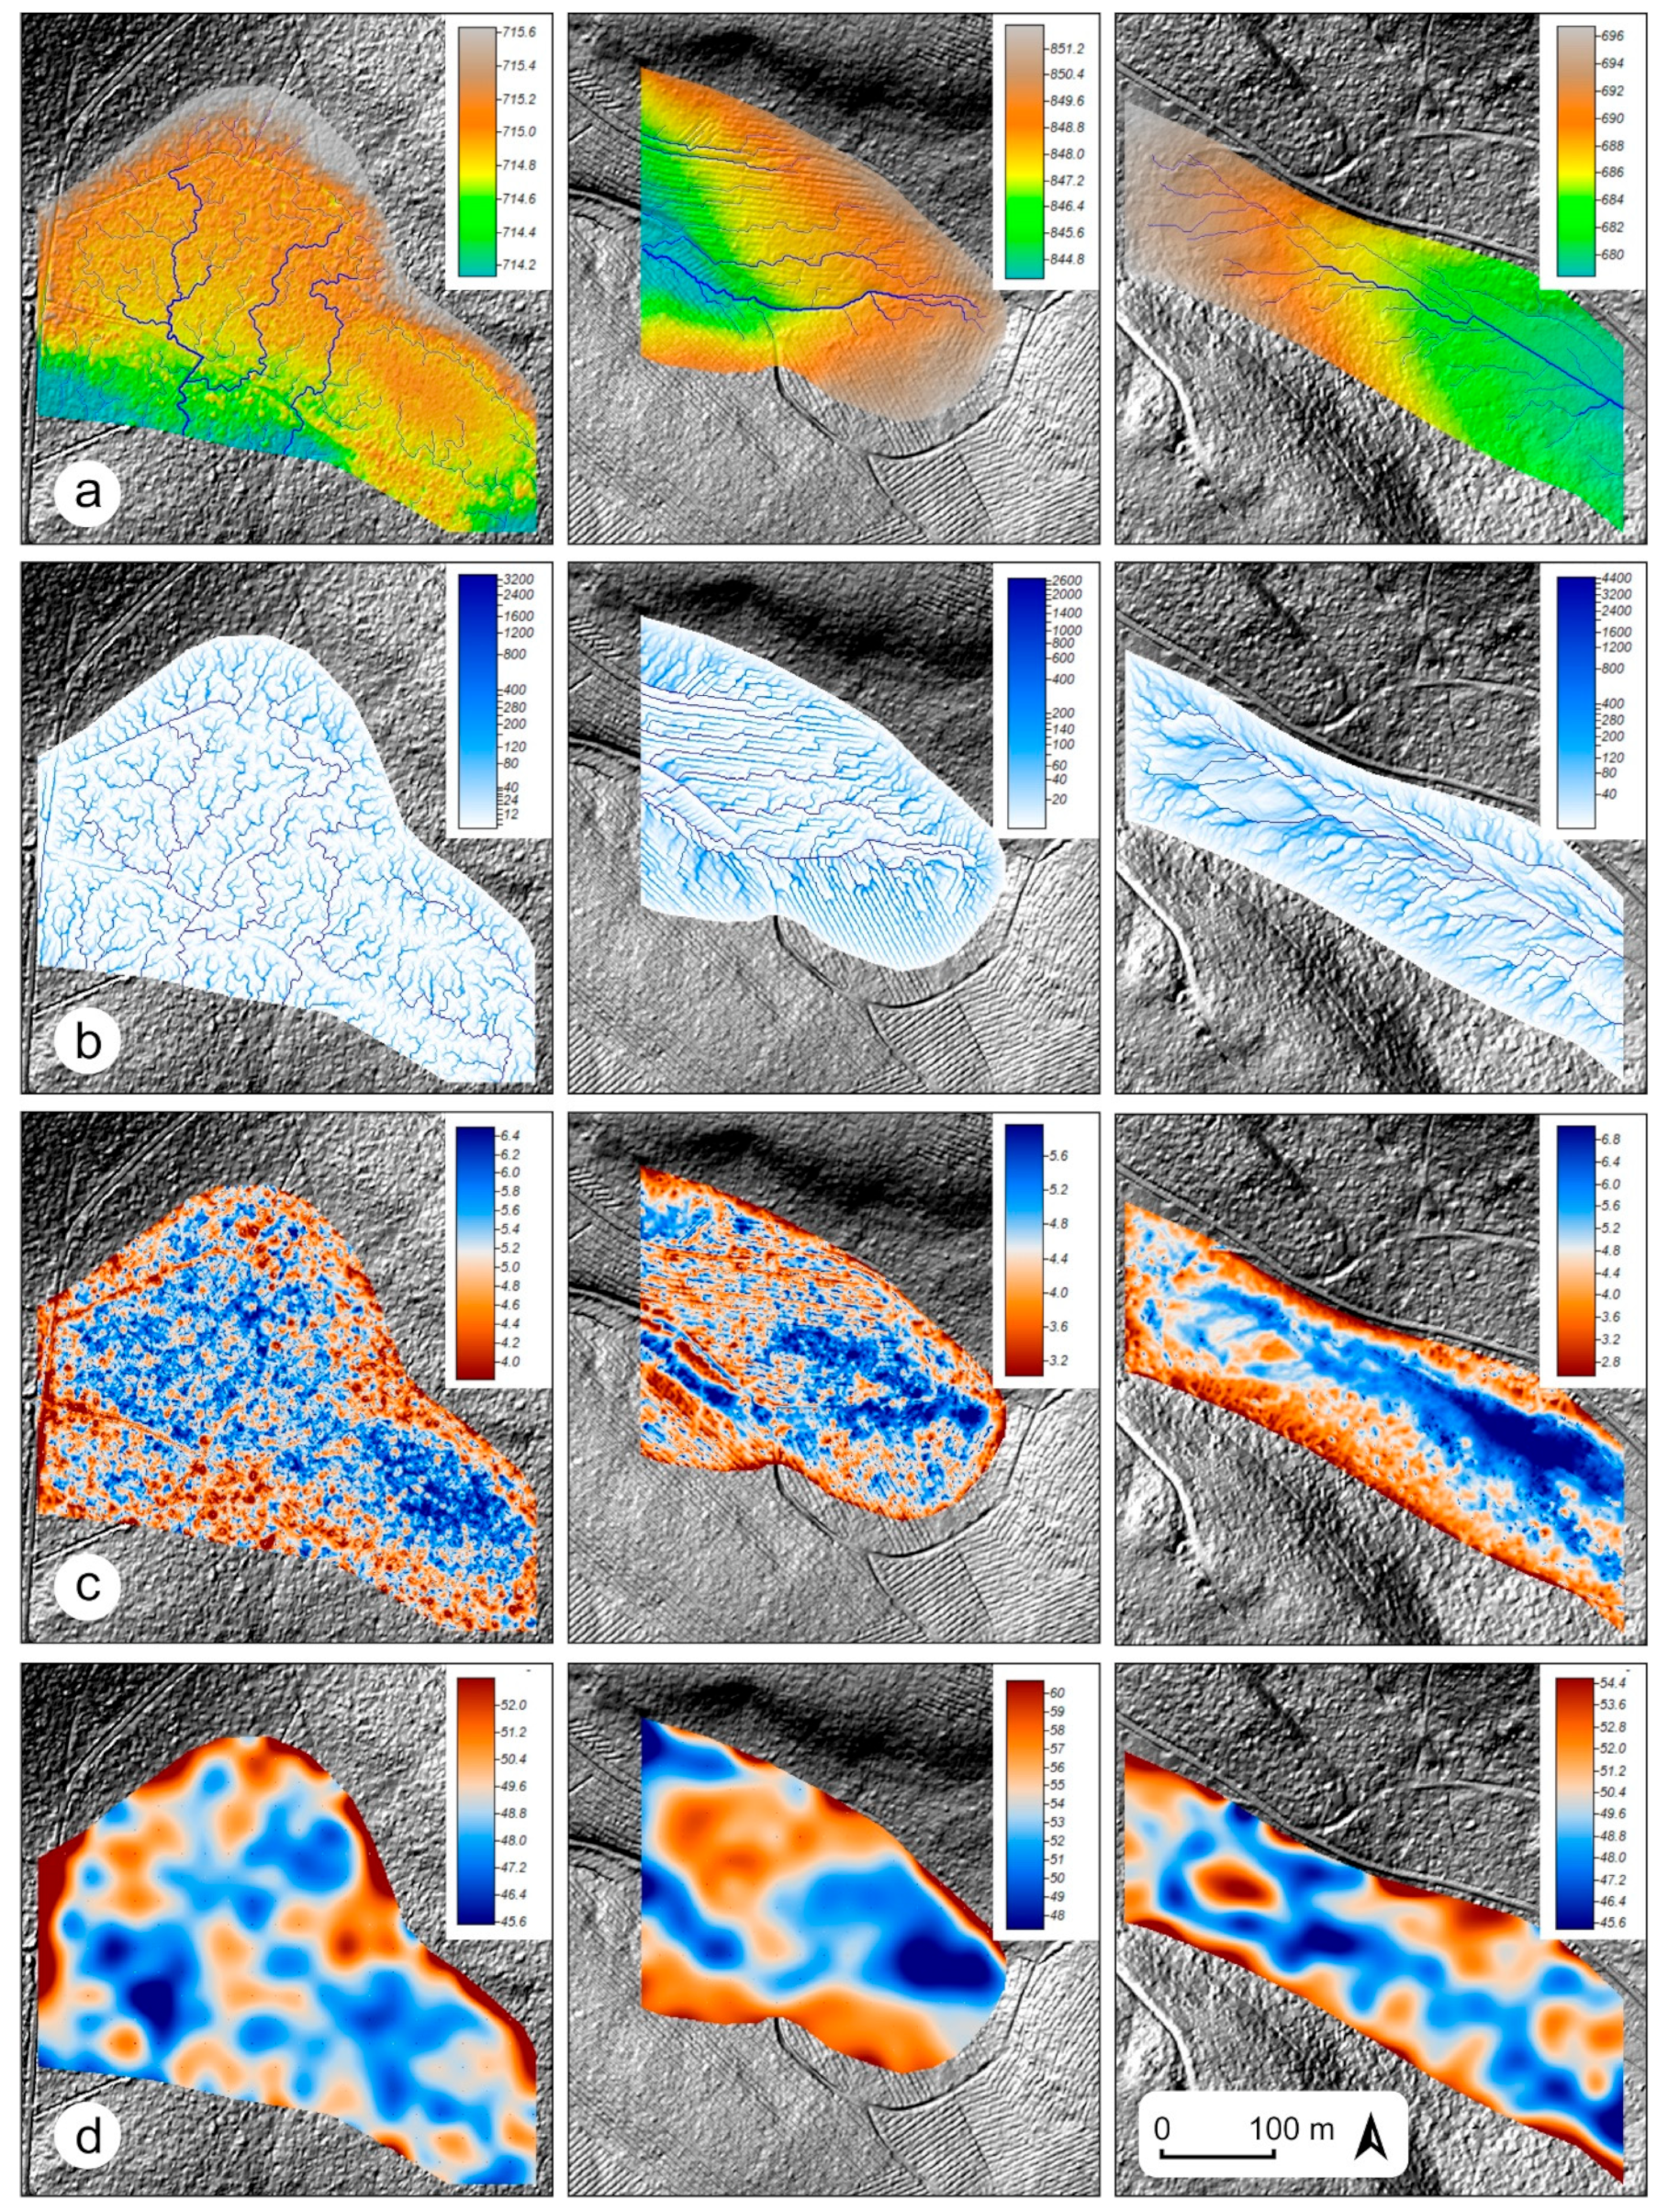
4.1. Physiography of Mires
4.1.1. DTM/LiDAR Data Analysis
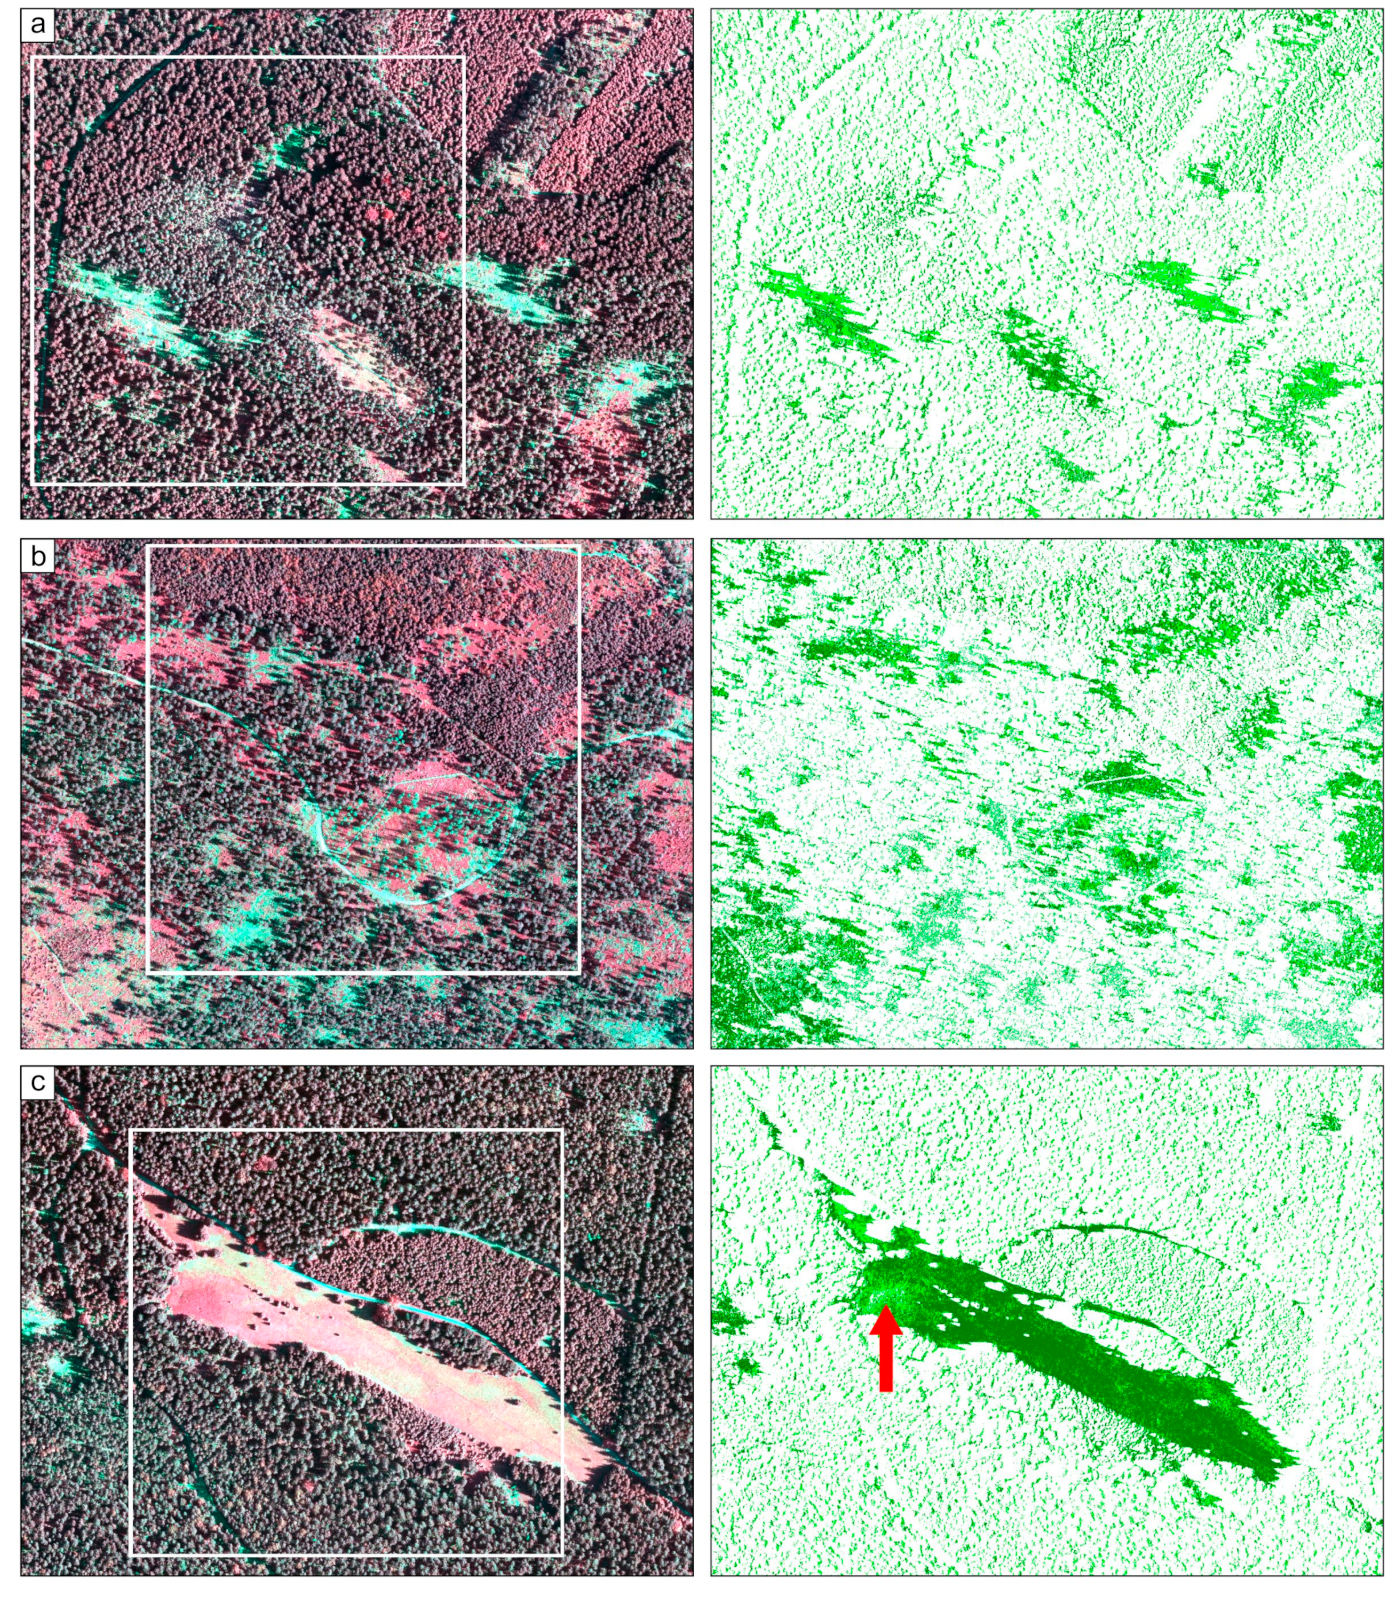
4.1.2. Colour-Infrared Imagery Processing
4.2. Subsurface Structure of Mires
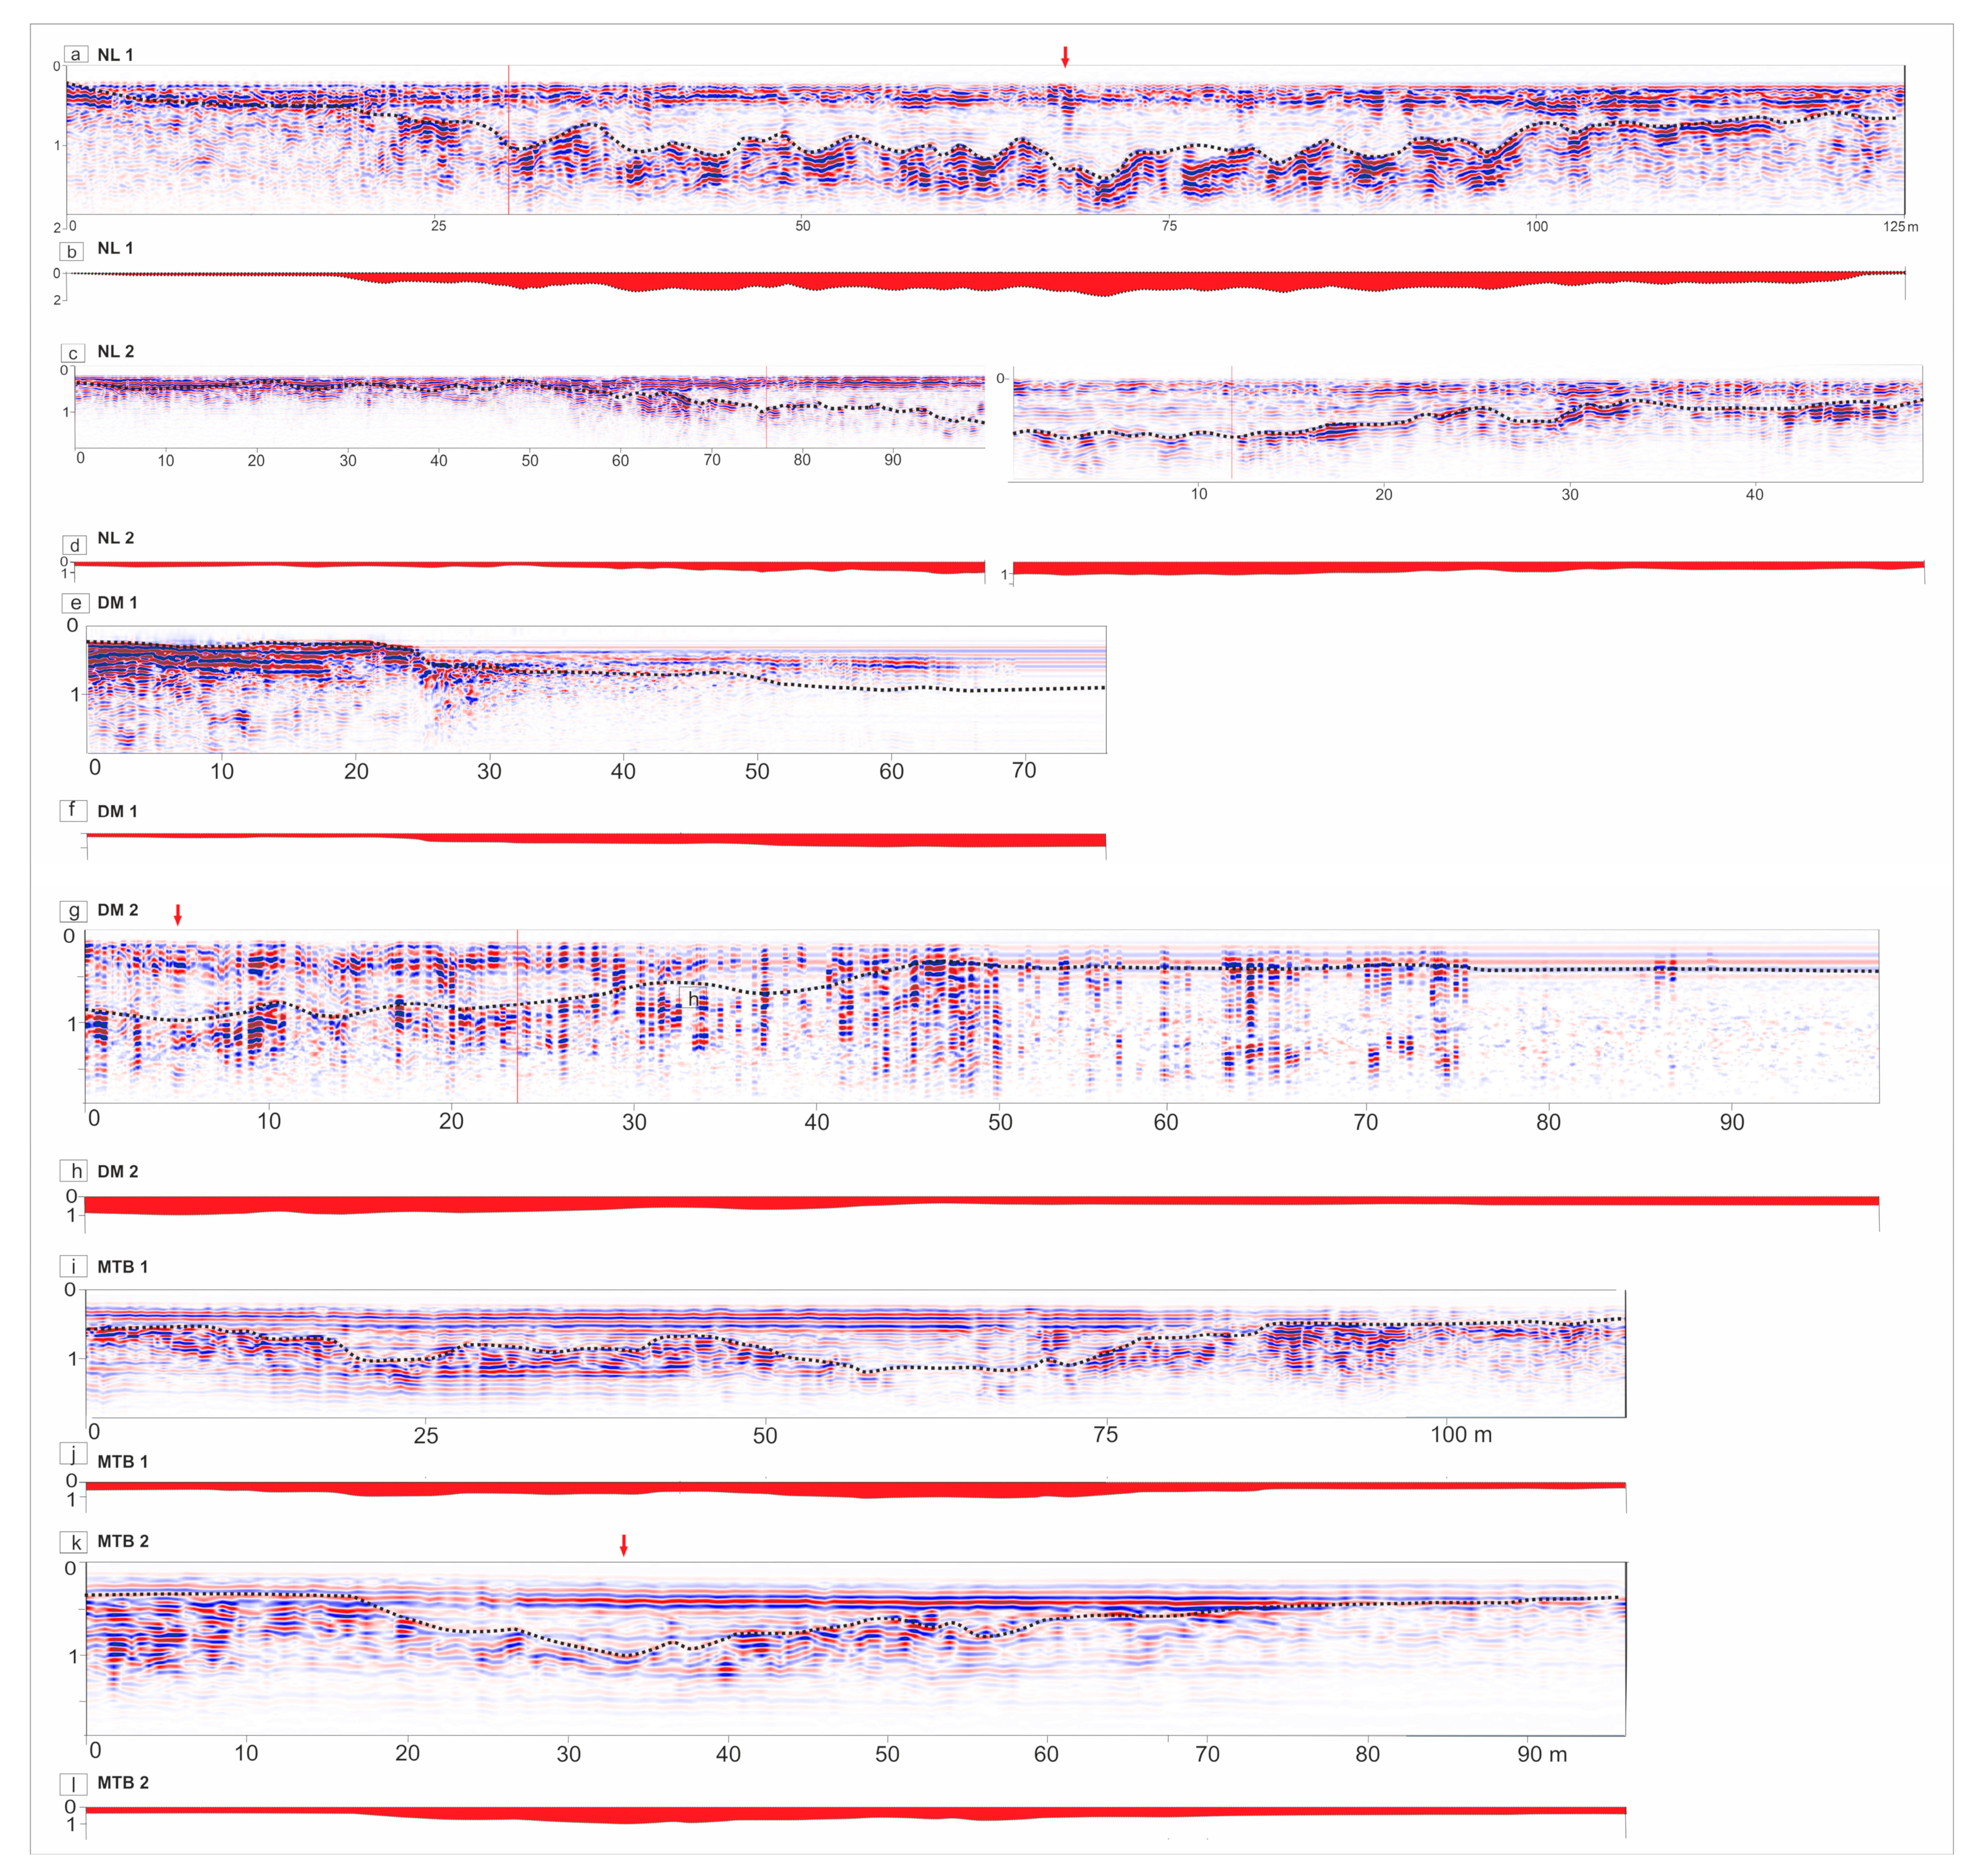
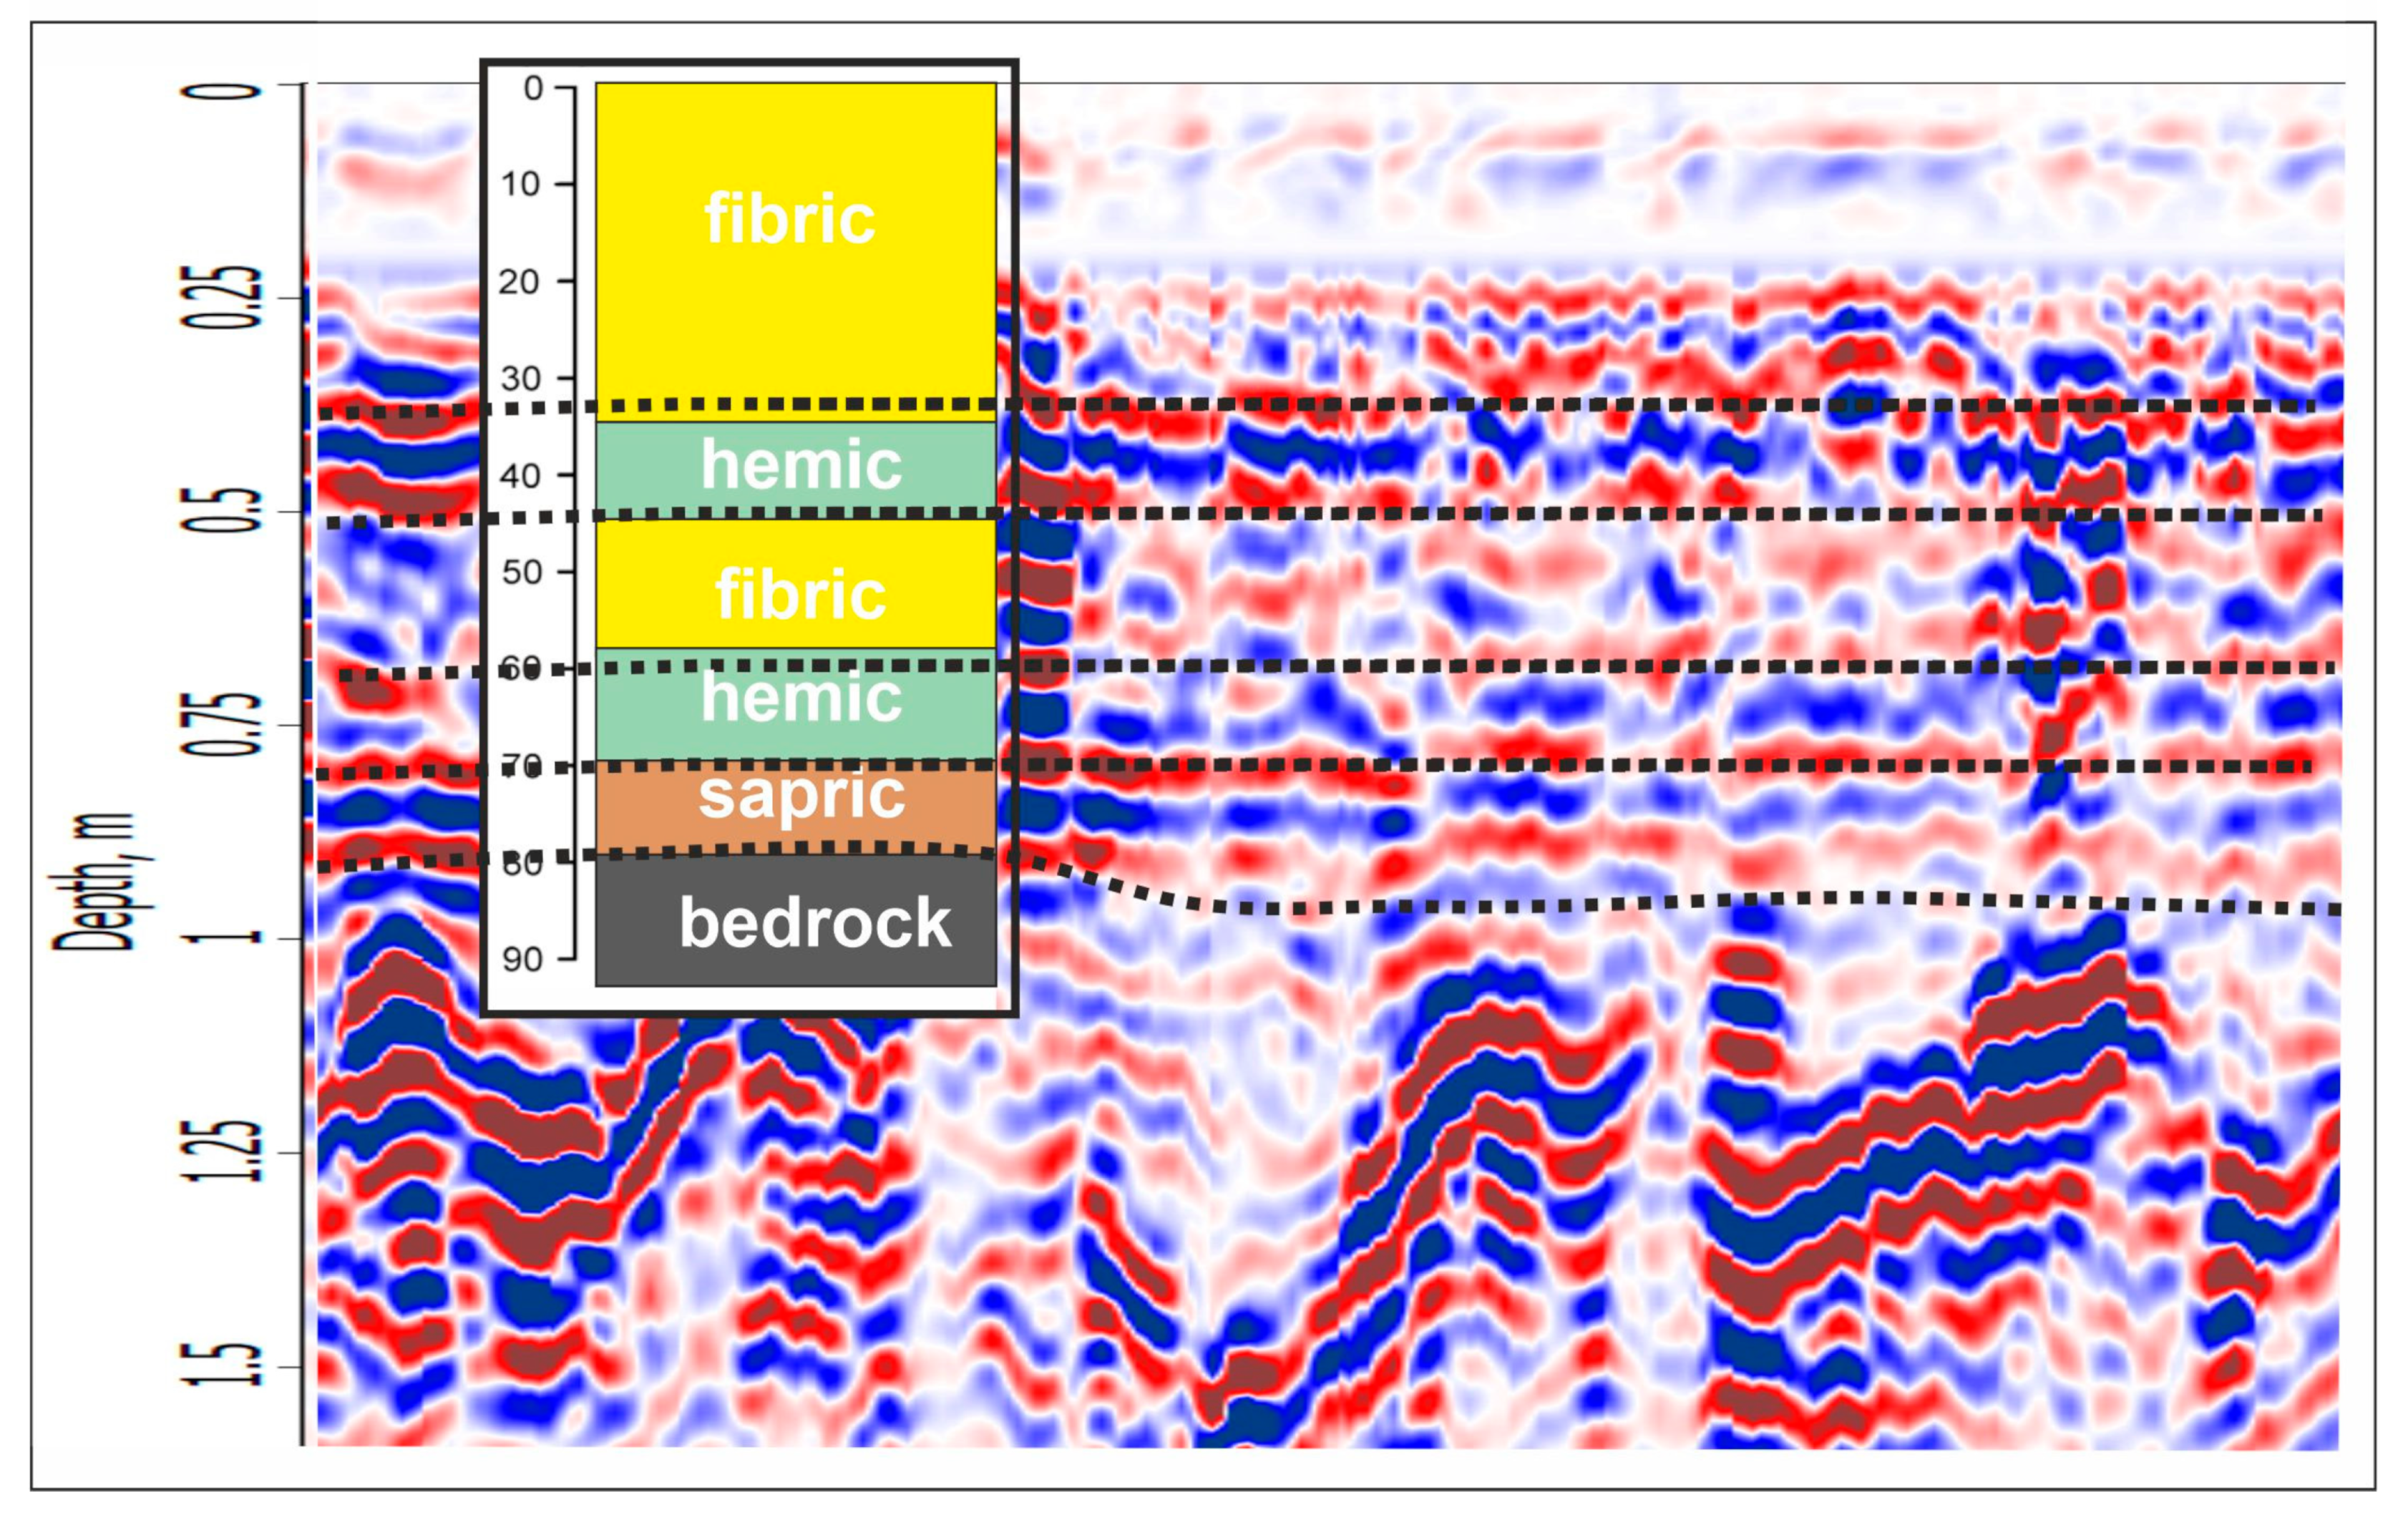
4.2.1. Ground-Penetrating Radar Data Analysis
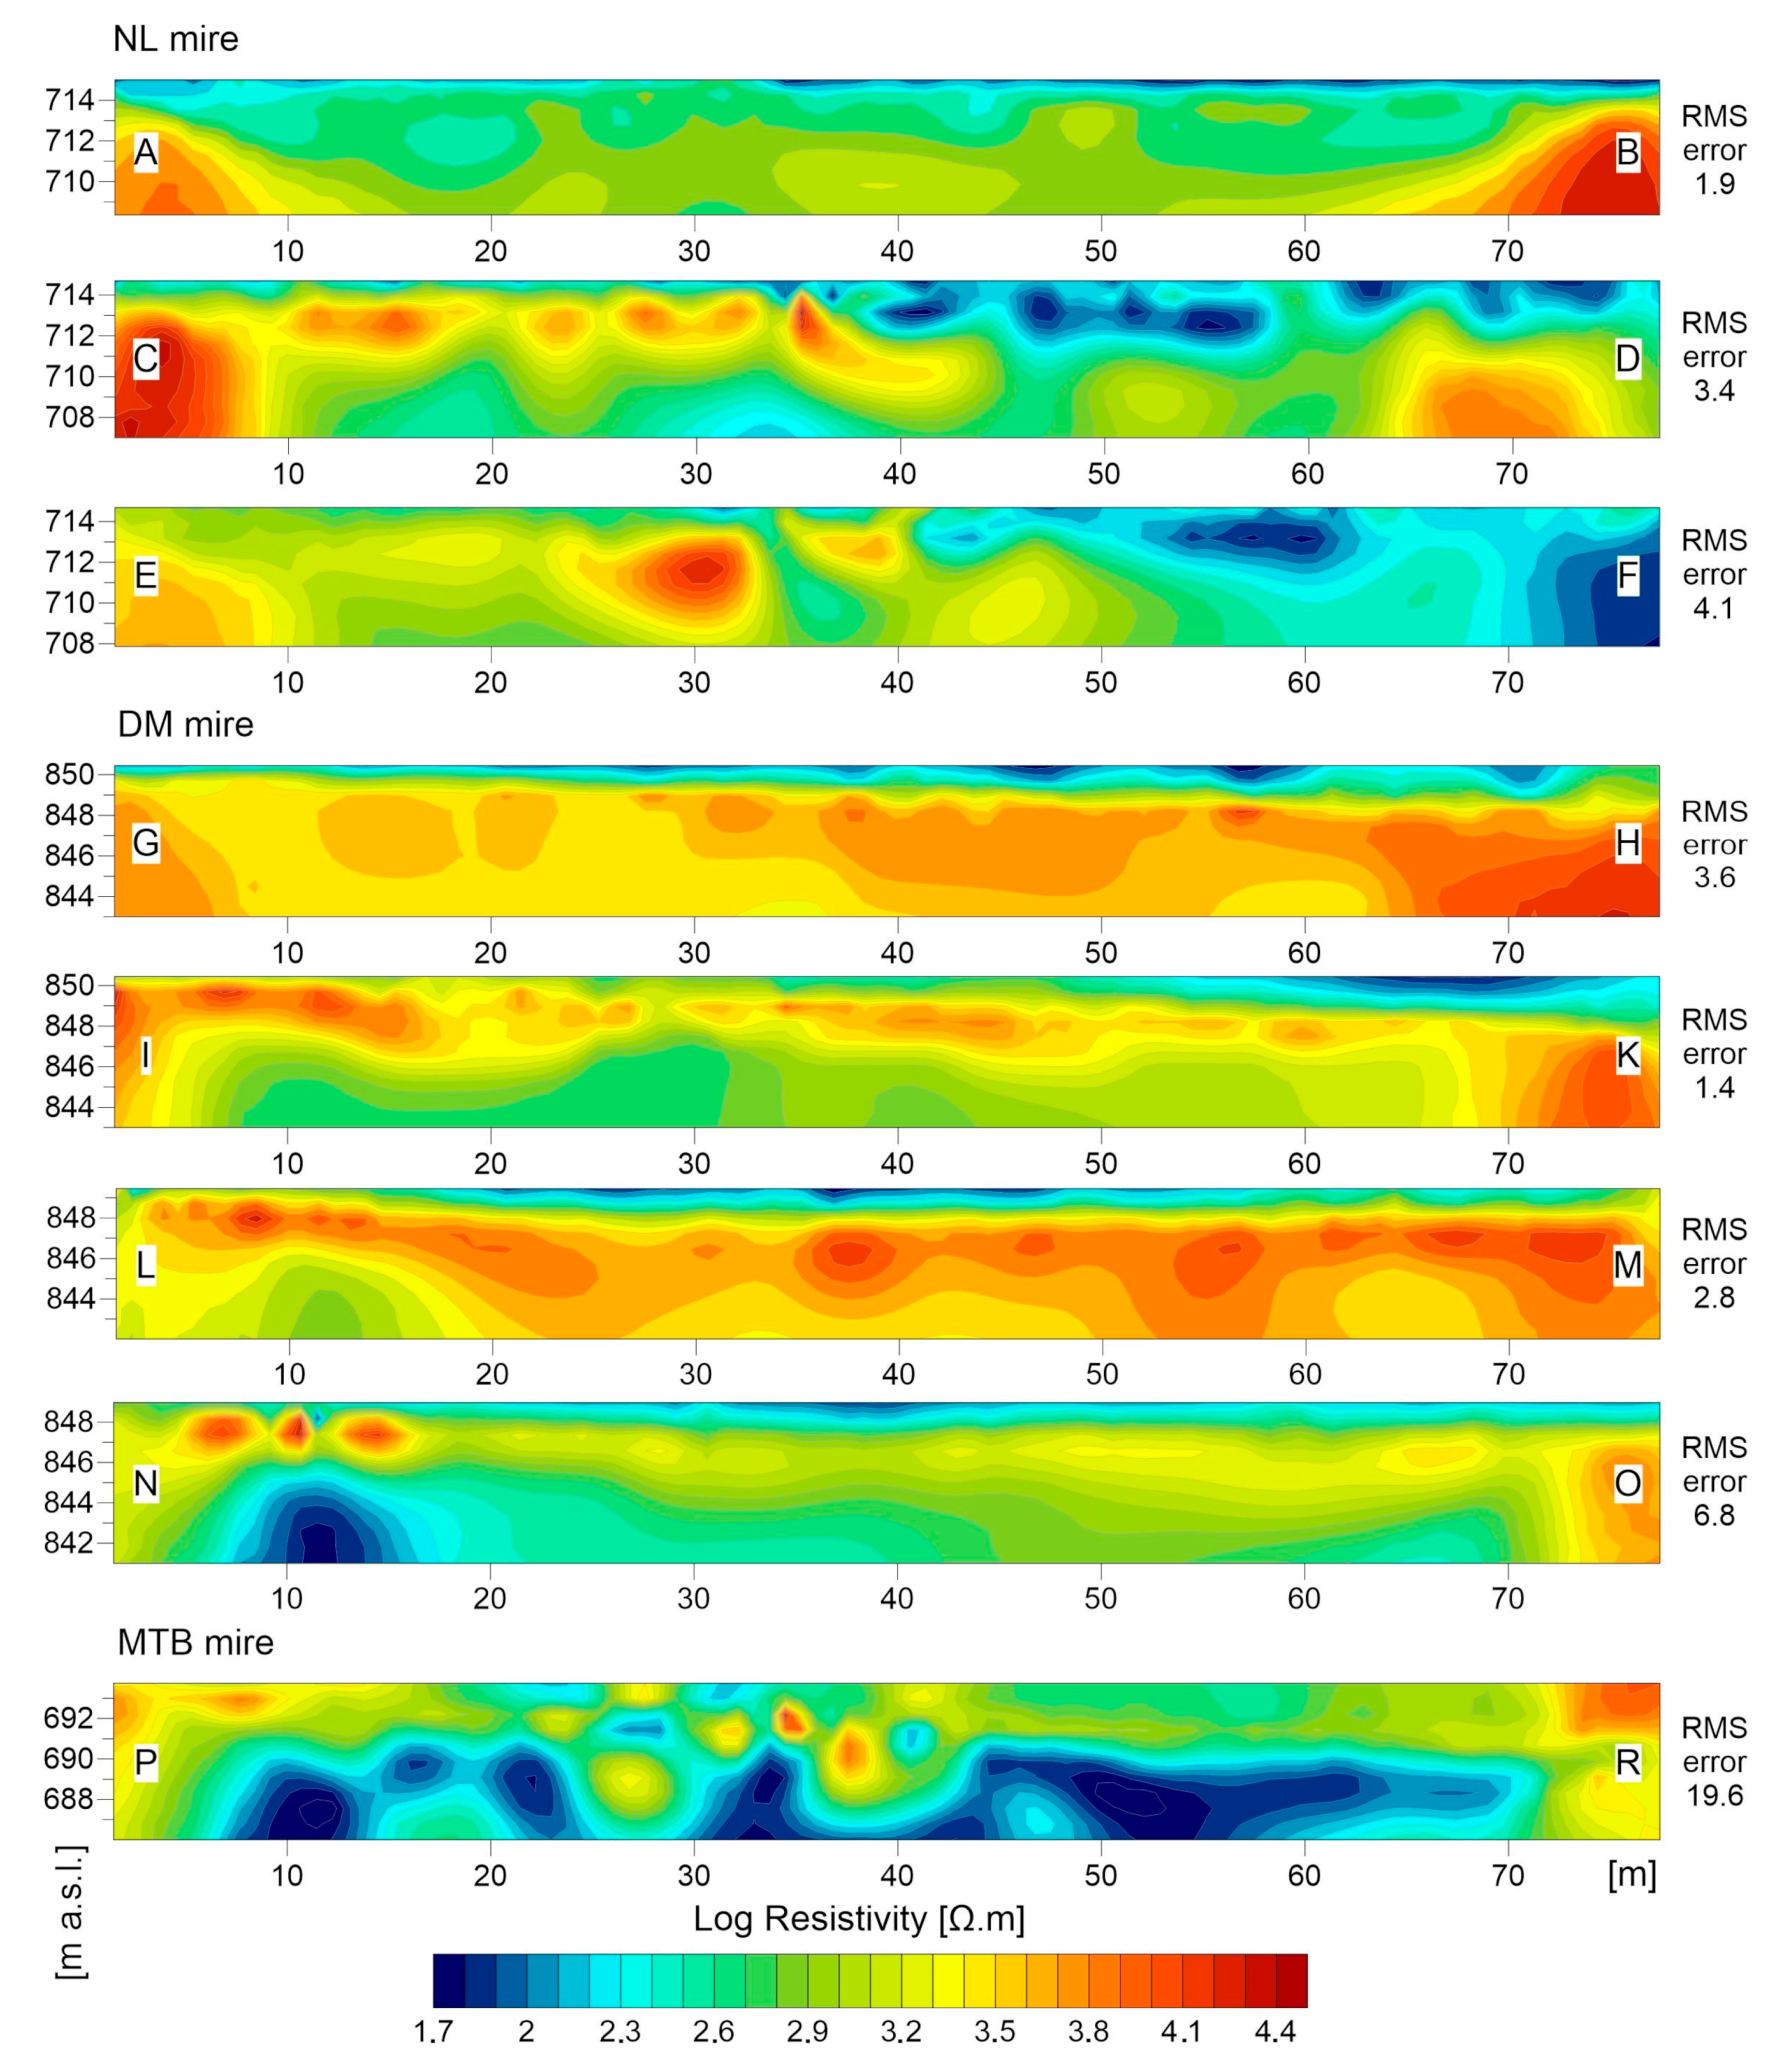
4.2.2. ERT Data Analysis
5. Discussion
5.1. Surface vs. Subsurface Boundaries of the Mires and Their Physiography
5.2. Geological and Palaeomorphological Constraints for Mire Development
5.3. Internal Structure of Mires
6. Conclusions
Author Contributions
Funding
Data Availability Statement
Acknowledgments
Conflicts of Interest
Abbreviations
| GPR | ground penetrating radar |
| ERT | electrical resistivity tomography |
| CIR | colour-infrared imagery |
| SM | Stołowe Mountains |
| NL | Niknąca Łąka mire |
| DM | Długie Mokradło mire |
| MTB | Małe Torfowisko Batorowskie mire |
References
- Botch, M.S.; Kobak, K.I.; Vinson, T.S.; Kolchugina, T.P. Carbon pools and accumulation in peatlands of the former Soviet Union. Glob. Biogeochem. Cycles 1995, 9, 37–46. [Google Scholar] [CrossRef]
- Page, S.E.; Siegert, F.; Rieley, J.O.; Boehm, H.-D.V.; Jaya, A.; Limin, S. The amount of carbon released from peat and forest fires in Indonesia during. Nature 2002, 420, 61–65. [Google Scholar] [CrossRef] [PubMed]
- Holden, J. Peatland hydrology and carbon release: why small-scale process matters. Philos. Trans. R. Soc. A: Math. Phys. Eng. Sci. 2005, 363, 2891–2913. [Google Scholar] [CrossRef] [PubMed]
- Limpens, J.; Berendse, F.; Blodau, C.; Canadell, J.G.; Freeman, C.; Holden, J.; Roulet, N.; Rydin, H.; Schaepman-Strub, G. Peatlands and the carbon cycle: from local processes to global implications—A synthesis. Biogeosciences 2008, 5, 1379–1419. [Google Scholar] [CrossRef]
- Loisel, J.; Gallego-Sala, A.V.; Amesbury, M.J.; Magnan, G.; Anshari, G.; Beilman, D.W.; Benavides, J.C.; Blewett, J.; Camill, P.; Charman, D.J.; et al. Expert assessment of future vulnerability of the global peatland carbon sink. Nat. Clim. Chang. 2020, 11, 70–77. [Google Scholar] [CrossRef]
- Watts, A.C.; Kobziar, L.N. Smoldering Combustion and Ground Fires: Ecological Effects and Multi-Scale Significance. Fire Ecol. 2013, 9, 124–132. [Google Scholar] [CrossRef]
- Sulwiński, M.; Mętrak, M.; Wilk, M.; Suska-Malawska, M. Smouldering fire in a nutrient-limited wetland ecosystem: Long-lasting changes in water and soil chemistry facilitate shrub expansion into a drained burned fen. Sci. Total. Environ. 2020, 746, 141142. [Google Scholar] [CrossRef]
- Jermaczek, A.; Wołejko, Ł.; Chapiński, P. Mokradła Sudetów Środkowych i ich Ochrona (Wetlands of the Central Sudetes and Their Conservation); Wyd. Klubu Przyrodników: Świebodzin, Poland, 2012. [Google Scholar]
- Glina, B.; Bogacz, A.; Mendyk, Ł.; Bojko, O.; Nowak, M. Effectiveness of restoration of a degraded shallow mountain fen after five years. Mires and Peat 2018, 21, 1–15. [Google Scholar] [CrossRef]
- Slater, L.D.; Reeve, A. Investigating peatland stratigraphy and hydrogeology using integrated electrical geophysics. Geophysics 2002, 67, 365–378. [Google Scholar] [CrossRef]
- Sass, O.; Friedmann, A.; Haselwanter, G.; Wetzel, K.-F. Investigating thickness and internal structure of alpine mires using conventional and geophysical techniques. Catena 2010, 80, 195–203. [Google Scholar] [CrossRef]
- Comas, X.; Terry, N.; Slater, L.; Warren, M.; Kolka, R.; Kristiyono, A.; Sudiana, N.; Nurjaman, D.; Darusman, T. Imaging tropical peat lands in Indonesia using ground-penetrating radar (GPR) and electrical resistivity imaging (ERI): implications for carbon stock estimates and peat soil characterization. Biogeosciences 2015, 12, 2995–3007. [Google Scholar] [CrossRef]
- Walter, J.; Hamann, G.; Lück, E.; Klingenfuss, C.; Zeitz, J. Stratigraphy and soil properties of fens: Geophysical case studies from northeastern Germany. Catena 2016, 142, 112–125. [Google Scholar] [CrossRef]
- Kowalczyk, S.; Żukowska, K.A.; Mendecki, M.J.; Łukasiak, D. Application of electrical resistivity imaging (ERI) for the assessment of peat properties: a case study of the Całowanie Fen, Central Poland. Acta Geophys. 2017, 65, 223–235. [Google Scholar] [CrossRef]
- Walter, J.; Lück, E.; Heller, C.; Bauriegel, A.; Zeitz, J. Relationship between electrical conductivity and water content of peat and gyttja: implications for electrical surveys of drained peatlands. Near Surf. Geophys. 2019, 17, 169–179. [Google Scholar] [CrossRef]
- Pezdir, V.; Čeru, T.; Horn, B.; Gosar, M. Investigating peatland stratigraphy and development of the Šijec bog (Slovenia) using near-surface geophysical methods. Catena 2021, 206, 105484. [Google Scholar] [CrossRef]
- Ihse, M. Colour infrared aerial photography as a tool for vegetation mapping and change detection in environmental studies of Nordic ecosystems: A review. Nor. Geogr. Tidsskr. Nor. J. Geogr. 2007, 61, 170–191. [Google Scholar] [CrossRef]
- Lehmann, J.R.K.; Münchberger, W.; Knoth, C.; Blodau, C.; Nieberding, F.; Prinz, T.; Pancotto, V.A.; Kleinebecker, T. High-Resolution Classification of South Patagonian Peat Bog Microforms Reveals Potential Gaps in Up-Scaled CH4 Fluxes by use of Unmanned Aerial System (UAS) and CIR Imagery. Remote Sens. 2016, 8, 173. [Google Scholar] [CrossRef]
- Kasprzak, M.; Migoń, P. DEM-based analysis of Geomorphology of a stepped sandstone plateau, Stołowe Mountains (SW Po-land). Z. für Geomorphol. 2015, 58 (Suppl. S4), 247–270. [Google Scholar]
- Wojewoda, J.; Białek, D.; Bucha, M.; Głuszyński, A.; Gotowała, R.; Krawczewski, J.; Schutty, B. Geology of the Góry Stołowe National Park–selected issues. In Geoekologiczne Warunki Środowiska Przyrodniczego Parku Narodowego Gór Stołowych; Chodak, T., Kabała, C., Kaszubkiewicz, J., Migoń, P., Wojewoda, J., Eds.; WIND: Wrocław, Poland; pp. 53–96. (In Polish)
- Voigt, S.; Wagreich, M.; Surlyk, F.; Walaszczyk, I.; Uličný, D.; Čech, S.; Voigt, T.; Wiese, F.; Wilmsen, M.; Niebuhr, B.; et al. The Geology of Central Europe – Mesozoic and Cenozoic; McCann, T., Ed.; Geological Society of London: London, UK, 2008; Volume 6 (2), pp. 923–997. [Google Scholar]
- Migoń, P.; Kasprzak, M. (Eds.) Góry Stołowe. Geology, Landforms, Vegetation Patterns and Human Impact; University of Wrocław: Wrocław, Poland, 2012. (In Polish) [Google Scholar]
- Woronko, D. Conditions for the occurrence and functioning of wetlands in the Stołowe Mountains National Park). Szczeliniec 1998, 2, 23–29. (In Polish) [Google Scholar]
- Dubicki, A.; Głowicki, B. Climate. In Przyroda Parku Narodowego Gór Stołowych; Witkowski, A., Pokryszko, B.M., Ciężkowski, W., Eds.; Wyd. Parku Narodowego Gór Stołowych: Kudowa-Zdrój, Poland, 2008; pp. 101–113. (In Polish) [Google Scholar]
- Bogacz, A.; Roszkowicz, M. Influence of forest management on the changes of organic soil properties in marginal part of Kragle Mokradło Peatlands (Stołowe Mountains National Park). Soil Sci. Annu. 2010, 61, 15–20. [Google Scholar]
- Glina, B.; Bogacz, A.; Pikus, H.; Pawluczuk, J. The impact of anthropopreassure and weather conditions on the mineral nitrogen content in the organic soils from fen peatlands (Stołowe Mountains, SW Poland). Polish J. Soil Sci. 2016, 49, 1. [Google Scholar] [CrossRef]
- Glina, B.; Bogacz, A.; Woźniczka, P. Nitrogen mineralization in forestry drained peatland soils in the Stolowe Mountain National Park (Central Sudetes Mts). Soil Sci. Annu. 2016, 67, 64–72. [Google Scholar] [CrossRef]
- Marek, S. Development of the Wielkie Torfowisko Batorowskie mountain mire as shown by palynological study. Szczel-iniec 1998, 2, 49–88. (In Polish) [Google Scholar]
- Glina, B.; Malkiewicz, M.; Mendyk, Ł.; Bogacz, A.; Woźniczka, P. Human-affected disturbances in vegetation cover and peatland development in the late Holocene recorded in shallow mountain peatlands (Central Sudetes, SW Poland). Boreas 2016, 46, 294–307. [Google Scholar] [CrossRef]
- Kabała, C.; Chodak, T.; Bogacz, A.; Łabaz, B.; Jezierski, P.; Galka, B.; Kaszubkiewicz, J.; Glina, B. Spatial variability of soils and habitats in the Stolowe Mountains. In Geoecological Conditions of the Stołowe Mountains National Park; Kabała, C.; Chodak, T.; Bogacz, A.; Łabaz, B.; Jezierski, P.; Galka, B.; Kaszubkiewicz, J.; Glina, B. Wind: Wroclaw, Poland, 2011; pp. 141–167. [Google Scholar]
- Glina, B. Spatial variability of the shallow organic soils in the Stołowe Mountains as a result of anthropogenic transformations. Ph.D. Thesis, Wrocław University of Environmental and Life Sciences, Wrocław, Poland, 2014; pp. 1–208. (In Polish). [Google Scholar]
- Glina, B.; Piernik, A.; Hulisz, P.; Mendyk, Ł.; Tomaszewska, K.; Podlaska, M.; Spychalski, W. Water or soil—What is the dominant driver controlling the vegetation pattern of degraded shallow mountain peatlands? Land Degrad Dev. 2019, 30, 1437–1448. [Google Scholar] [CrossRef]
- Kurczyński, Z. Airborne Laser Scanning in Poland - Between Science and Practice. Arch. Photogramm. Cartogr. Remote. Sens. 2019, 31, 105–133. [Google Scholar] [CrossRef]
- Conrad, O.; Bechtel, B.; Bock, M.; Dietrich, H.; Fischer, E.; Gerlitz, L.; Wehberg, J.; Wichmann, V.; Böhner, J. System for Automated Geoscientific Analyses (SAGA) v. 2.1. Geosci. Model Dev. 2015, 8, 1991–2007. [Google Scholar] [CrossRef]
- Samouëlian, A.; Cousin, I.; Tabbagh, A.; Bruand, A.; Richard, G. Electrical resistivity survey in soil science: A review. Soil Tillage Res. 2005, 83, 173–193. [Google Scholar] [CrossRef]
- Schrott, L.; Sass, S. Application of field geophysics in geomorphology: Advances and limitations exemplified by case studies. Geomorphology 2008, 93, 55–73. [Google Scholar] [CrossRef]
- Van Dam, R.L. Landform characterization using geophysics—Recent advances, applications, and emerging tools. Geomorphology 2012, 137, 57–73. [Google Scholar] [CrossRef]
- Loke, M.H.; Chambers, J.E.; Rucker, D.F.; Kuras, O.; Wilkinson, P.B. Recent developments in the direct-current geoelectrical imaging method. J. Appl. Geophys. 2013, 95, 135–156. [Google Scholar] [CrossRef]
- Kasprzak, M. Application of high-resolution electrical resistivity tomography to patterned ground (Wedel Jarlsberg Land, SW Spitsbergen). Polar Res. 2015, 34, 25678. [Google Scholar] [CrossRef]
- Loke, M.H. Electrical Imaging Surveys for Environmental and Engineering Studies; A practical guide to 2-D and 3-D surveys; Geotomo: Penang, Malaysia, 2000. [Google Scholar]
- Reynolds, J.M. Electrical Resistivity Methods. In An Introduction to Applied and Environmental Geophysics, 2nd ed.; Wiley: Chichester, UK, 2011; pp. 289–372. [Google Scholar]
- Daniels, D. Ground Penetrating Radar, 2nd ed.; The Institution of Electrical Engineers: London, UK, 2004; pp. 1–734. [Google Scholar]
- Utsi, E.C. Ground Penetrating Radar. In Theory and Practice; Elsevier: Kidlington, UK, 2017; pp. 1–205. [Google Scholar]
- Warner, B.G.; Nobes, D.C.; Theimer, B.D. An application of ground-penetrating radar to peat stratigraphy of Ellice Swamp, Southwest Ontario. Can. J. Earth Sci. 1990, 27, 932–938. [Google Scholar] [CrossRef]
- Theimer, B.D.; Nobes, D.C.; Warner, B.G. A study of the geoelectrical properties of peatlands and their influence on ground-penetrating radar surveying. Geophys. Prospect. 1994, 42, 179–209. [Google Scholar] [CrossRef]
- Comas, X.; Slater, L.; Reeve, A. Stratigraphic controls on pool formation in a domed bog inferred from ground penetrating radar (GPR). J. Hydrol. 2005, 315, 40–51. [Google Scholar] [CrossRef]


| Geomorphometrical Parameter | Site | ||
|---|---|---|---|
| NL Mire | DM Mire | MTB Mire | |
| Hypsometry and automatic determination of surface runoff (streams) |
|
|
|
| Total catchment area |
|
|
|
| Topographic wetness index |
|
|
|
| Convergence index |
|
|
|
Disclaimer/Publisher’s Note: The statements, opinions and data contained in all publications are solely those of the individual author(s) and contributor(s) and not of MDPI and/or the editor(s). MDPI and/or the editor(s) disclaim responsibility for any injury to people or property resulting from any ideas, methods, instructions or products referred to in the content. |
© 2023 by the authors. Licensee MDPI, Basel, Switzerland. This article is an open access article distributed under the terms and conditions of the Creative Commons Attribution (CC BY) license (https://creativecommons.org/licenses/by/4.0/).
Share and Cite
Burliga, S.; Kasprzak, M.; Sobczyk, A.; Niemczyk, W. Geomorphometric and Geophysical Constraints on Outlining Drained Shallow Mountain Mires. Geosciences 2023, 13, 43. https://doi.org/10.3390/geosciences13020043
Burliga S, Kasprzak M, Sobczyk A, Niemczyk W. Geomorphometric and Geophysical Constraints on Outlining Drained Shallow Mountain Mires. Geosciences. 2023; 13(2):43. https://doi.org/10.3390/geosciences13020043
Chicago/Turabian StyleBurliga, Stanisław, Marek Kasprzak, Artur Sobczyk, and Wioletta Niemczyk. 2023. "Geomorphometric and Geophysical Constraints on Outlining Drained Shallow Mountain Mires" Geosciences 13, no. 2: 43. https://doi.org/10.3390/geosciences13020043
APA StyleBurliga, S., Kasprzak, M., Sobczyk, A., & Niemczyk, W. (2023). Geomorphometric and Geophysical Constraints on Outlining Drained Shallow Mountain Mires. Geosciences, 13(2), 43. https://doi.org/10.3390/geosciences13020043