


Simple Summary
Young ruminants often experience weaning stress and low starter intake. Maternal nutrition may influence offspring feeding behavior through flavor cues in amniotic fluid and milk. We fed pregnant cashmere goats a basal diet or a diet supplemented with Maillard reaction products (MRPs). We analyzed volatile compounds in amniotic fluid and milk and measured offspring feed preference, growth, selected blood biomarkers, and hypothalamic appetite and olfactory receptor gene expression. Maternal MRP supplementation was associated with altered volatile profiles in both body fluids: most differential compounds were lower in amniotic fluid, whereas specific odor-active compounds, including 5-methyl-2-hexanone, were higher in milk. MFD–MFD kids showed greater preference for the MFD-flavored starter, higher starter intake, and average daily gain during late pre-weaning, along with differences in selected antioxidant, immune, and growth-related biomarkers and in appetite- and olfactory-related gene transcripts. Body weight at 56 d was numerically higher in MFD–MFD kids but did not differ significantly. Because maternal diet and starter flavor were paired, the independent contribution of prenatal flavor exposure remains unresolved. These findings support further hypothesis-driven testing of maternal flavor exposure as a potential approach to improve early starter acceptance in goat kids.
Abstract
This study investigated whether a maternal Maillard flavor diet was associated with altered volatile profiles in amniotic fluid and milk and with differences in offspring feeding preference, growth, selected blood biomarkers, and candidate appetite- and olfactory-related gene expression in cashmere goats. Forty healthy pregnant cashmere goats were randomly assigned to a control group (CON) receiving a basal diet or a Maillard reaction product group (MFD) receiving the basal diet supplemented with 1% MRPs. At kidding, 40 kids were allocated to the CON–CON and MFD–MFD groups and received the corresponding starter diets during lactation and after weaning. A representative subset of 12 dams (n = 6 per group) was used for volatile metabolomic analysis of amniotic fluid collected at 30 d prepartum and milk collected at 7 d postpartum, using headspace solid-phase microextraction coupled with gas chromatography–mass spectrometry (HS-SPME-GC-MS). Maternal MFD supplementation was associated with altered overall volatile profiles in both fluids, with fluid-specific patterns. In amniotic fluid, 64 candidate differential metabolites were identified (three higher and 61 lower in MFD), whereas in milk, 11 candidate differential metabolites were identified (eight higher and three lower in MFD). Flavoromics analyses based on relative odor activity values, sensory radar, and flavor wheel described shifts in annotated odor-active compound sets; these outputs do not measure perceived sensory intensity. Anethole in amniotic fluid and 5-methyl-2-hexanone in milk were among the changed compounds. The MFD–MFD kids showed greater preference for the MFD-flavored starter (57.0% vs. 43.0%; p < 0.001), higher starter intake during 29–56 d (158.37 vs. 147.89 g/d; p = 0.035), and higher average daily gain during the same period (143.48 vs. 126.96 g/d; p = 0.043). At 56 d of age, the MFD–MFD kids were numerically 9.8% heavier than the CON–CON kids, but the difference was not statistically significant (10.86 vs. 9.89 kg; p = 0.094). At 56 d, the MFD–MFD kids also had higher SOD, GSH-Px, and CAT activities, lower MDA concentration, and higher IgA and IGF-1 concentrations. In the hypothalamus, NPY expression was higher and CART and POMC expression tended to be lower, whereas FFAR2, OR2W1, and OR2J3-like transcripts were higher in the olfactory bulb. These findings indicate that maternal MRP supplementation was associated with altered volatile profiles in amniotic fluid and milk and with differences in offspring starter preference, late pre-weaning intake and growth, selected blood biomarkers, and candidate appetite- and olfactory-related gene transcripts. Because maternal diet and starter flavor were paired, the independent contribution of prenatal exposure and the role of olfactory signaling remain unresolved. The results provide a basis for further hypothesis-driven studies.
1. Introduction
The flavor profile of animal-derived foods and the early feeding behavior of young ruminants are increasingly recognized as being shaped by maternal nutritional environments [1,2]. In livestock production, the transition from gestation to lactation represents a critical window for fetal and neonatal developmental programming [3]. Amniotic fluid is the first body fluid environment directly contacted by the fetus, while milk is the primary flavor-bearing medium continuously exposed to the neonate during lactation [4,5]. Together, amniotic fluid and milk constitute a dual body-fluid route through which maternal dietary flavor signals may be transmitted to kid offspring [6,7]. This route could potentially influence early feed acceptance and weaning stress and be associated with long-term feeding preferences and production performance [8].
Maillard reaction products are widely generated during feed thermal processing and possess characteristic roasted, caramel-like, and nutty aromas [9]. Pyrazines, furans, and related heterocyclic compounds are typical Maillard-derived volatiles [10]. Previous studies in food science and animal nutrition have shown that dietary flavor compounds can transfer into body fluids and tissues [4,5], but whether maternal Maillard flavor intervention can systematically reshape the volatile metabolome in amniotic fluid and milk remains unclear. Importantly, the direction of such changes may not be a simple increase in flavor intensity. Maternal dietary intervention may remodel endogenous flavor precursor metabolism, including amino acid and lipid metabolism, thereby altering the composition and relative proportions of flavor-active compounds in fetal and neonatal body fluids, although the underlying mechanisms remain unclear.
The formation of offspring feeding preference involves multiple levels of regulation. Olfactory receptors in the olfactory bulb, including short-chain fatty acid receptors, aldehyde receptors, and alcohol receptors, are capable of recognizing maternal-derived flavor ligands in amniotic fluid and milk [11,12]. These olfactory signals may relay information toward the hypothalamus and modulate the expression of appetite-related genes, such as NPY, AgRP, POMC, and CART, supporting the potential existence of an “olfactory signal–hypothalamic appetite gene–feeding behavior” regulatory axis [13,14]. In addition, maternal serum exosomes and offspring liver miRNA expression may contribute to epigenetic programming of flavor preference across generations [15]. However, integrated evidence linking maternal Maillard flavor diet, amniotic fluid and milk volatile metabolomes, olfactory receptor expression, and offspring feeding preference is still lacking, especially in cashmere goats.
We hypothesized that a maternal Maillard flavor diet would alter the volatile metabolite profiles of amniotic fluid and milk, rather than merely increasing deposition of flavor compounds, and that this dual flavor imprinting could provide a plausible metabolic basis for the putative olfactory receptor-mediated regulation of hypothalamic appetite genes and concomitant shifts in offspring feeding preference. Therefore, this study used cashmere goats as a model to characterize the effects of maternal Maillard flavor diet on amniotic fluid and milk volatile metabolomes using HS-SPME-GC-MS, identify key differential metabolites and metabolic pathways, evaluate flavor-active compounds by relative odor activity value (rOAV), sensory radar, and flavor wheel, and integrate amniotic fluid and milk findings to explore this dual body-fluid flavor imprinting route.
2. Materials and Methods
2.1. Animals, Experimental Design, and Diets
All animal procedures were approved by the Animal Ethics and Welfare Committee of Inner Mongolia Academy of Agricultural and Animal Husbandry Sciences on 28 September 2026 (protocol code 2026-0074). The protocol covered dietary allocation, amniotic fluid collection, blood sampling, and euthanasia; the procedure-specific details needed to evaluate animal welfare are reported below.
Forty healthy pregnant cashmere does with similar body weight (62 ± 3.75 kg) and parity (second or third parity, predominantly second parity) were selected. All does gave birth to twins. The gestation stage was standardized by using artificial insemination, and does were randomly assigned to two dietary treatments (n = 20 per treatment, with each doe as an experimental unit): the control group (CON) received a basal diet, and the Maillard reaction product group (MFD) received the basal diet supplemented with 1% Maillard reaction products (MRPs). The MRPs were provided by a commercial company and were prepared from lysine and xylose at a 1:1 molar ratio, heated at pH 7.0 and 120 °C for 90 min to simulate roasted cereal aroma. Volatile compounds, including pyrazines and furans, were identified using GC-MS [9]. The composition and nutrient levels of the maternal diet are shown in Table 1. In the MFD diet, 1% MRPs replaced an equal amount of corn, corn germ meal, soybean meal, corn stalk, and wheat bran proportionally, so that the total inclusion remained 100%.
Table 1.
The composition and nutrient levels of the maternal diet fed to the cashmere goat does.
At kidding, to achieve a 1:1 male-to-female ratio while minimizing clustering within dams, one kid per dam was selected whenever possible. When a dam gave birth to two male kids, only one of them was selected; the remaining male-kid slots were filled by selecting one kid from other dams, so that each dam contributed at most one kid to the analysis. This gave 40 kids (20 from CON dams and 20 from MFD dams), according to a 1:1 male-to-female ratio and similar body weight. These kids were assigned to two combined feeding treatments: the CON-CON group (n = 20 kids, 10 pens), comprising kids from the CON dams fed the basal starter diet during lactation and after weaning, and the MFD-MFD group (n = 20 kids, 10 pens), comprising kids from the MFD dams fed the Maillard-flavored starter diet during lactation and after weaning. Because each dam contributed at most one kid to the analysis, the dam or litter was not included as a separate random effect. Individual measurements (e.g., body weight and ADG) were analyzed at the kid level, with pen included as a random effect, whereas feed intake, preference, and feed efficiency were analyzed at the pen level. The basal starter diet and Maillard-flavored starter diet were formulated separately; the Maillard-flavored starter diet incorporated 1% MRPs by proportional reduction in corn, soybean meal, and wheat bran, while premix, mineral, and vitamin components were held constant across the two starter diets. The 1% inclusion level was selected based on our preliminary palatability and volatile screening tests. The composition and nutrient levels of the starter diets are shown in Table 2.
Table 2.
The composition and nutrient levels of the experimental starter diet for the cashmere goat kids.
The total experimental period was 123 d, comprising 60 d prepartum to 56 d postpartum lactation and a 7 d post-weaning tracking period. Fresh water was available ad libitum throughout the trial.
For volatile metabolomic analysis, six does were randomly selected from each dietary group (CON and MFD), yielding a total of 12 animals (n = 6 per group). The CON does received the basal diet (sample IDs CON-1 to CON-6), and the MFD does received the basal diet supplemented with 1% MRPs (sample IDs MFD-1 to MFD-6). Amniotic fluid (5 mL) was collected at experimental day 31 (30 d prepartum), and milk (10 mL) was collected at experimental day 67 (7 d postpartum). All samples were snap-frozen in liquid nitrogen and stored at −80 °C prior to HS-SPME-GC-MS analysis. Volatile metabolites were compared between the MFD and CON groups.
2.2. Feeding Management
Before the trial, the feeding pens were thoroughly disinfected and air-dried. Newborn kids nursed colostrum from their own dams within 30 min after birth; colostrum quality was assessed by refractometry prior to feeding. Two kids were housed per pen with free access to clean drinking water. Each pen was equipped with two feeders and one water trough throughout the trial. Outside the preference test, both feeders in a pen contained the same assigned starter diet: both contained the basal starter in the CON–CON pens and the MFD-flavored starter in the MFD–MFD pens. Two feeders were used rather than one to avoid competition between the two kids in a pen. Starter diet was offered starting at 15 d of age.
From day 29 to day 56, a 30 min preference test was conducted at morning feeding each day. During the test, one feeder contained the basal starter, and the other contained the MFD-flavored starter, and the kids could choose freely between them. The left–right positions of the two feeders were alternated between consecutive test days to minimize positional bias. After each test, both feeders were refilled with the pen’s assigned single starter diet.
2.3. Growth Performance and Feed Preference
The feed offered and orts were recorded to calculate dry matter intake (DMI) for the does and kids. For the does, DMI was calculated individually. For the kids, each pen was equipped with two feeders and one water trough, and the two kids in a pen had free access to both feeders. Because the kids could not be restricted to a specific feeder, individual starter intake could not be measured accurately; starter intake was, therefore, recorded at the pen level.
Preference was assessed as described in Section 2.2. Feed offered and refusals in each feeder were weighed separately before and after each 30 min test, and non-test intake was recorded separately and was not included in the preference calculation. Preference (%) for each test day was calculated as (MFD starter intake/total intake from both feeders) × 100. The 28 daily preference values were averaged for each pen, and the pen mean was used as the experimental unit for preference analysis (n = 10 pens per group).
Pen-level DMI per kid was calculated as [(feed offered × DM content) − (orts × DM content)] divided by kid-days (i.e., total pen intake divided by the number of kids and days). The kids were weighed individually before morning feeding on experimental days 61, 88, 116, and 123, corresponding to 1, 28, 56, and 63 d of age. Average daily gain (ADG) was calculated for each kid as body-weight gain divided by the number of interval days. Feed efficiency was calculated for each kid as individual ADG divided by the pen-mean DMI, and then averaged within each pen. Starter intake, preference, and feed efficiency were, therefore, analyzed using the pen as the experimental unit (n = 10 pens per group). Individual measurements, including body weight, ADG, and body measurements, were analyzed at the kid level (n = 20 kids per group).
2.4. Sample Collection
2.4.1. Amniotic Fluid and Milk
Amniotic fluid (5 mL) was collected on experimental day 31 (30 d prepartum) by ultrasound-guided amniocentesis, adapted from established procedures for fetal fluid sampling in sheep and goats [16,17]. The does were sedated with xylazine (0.05–0.1 mg/kg, IV) and the puncture site was infiltrated with 2% lidocaine. Under real-time ultrasound guidance, a 21-G needle was advanced into the amniotic cavity along a path avoiding the placentomes and fetus, and fluid was aspirated slowly. The procedure was performed by a single veterinarian experienced in small-ruminant obstetrics, with aseptic preparation of the puncture site. Postoperative monitoring consisted of daily observation of appetite, rectal temperature, and signs of abortion for 3 d. Because complications, including abortion, have been reported after fetal fluid sampling in goats [16], any bloody aspirate was discarded, and the doe was monitored closely. No maternal or fetal complications related to amniocentesis were observed in the present study. The sample was aliquoted into 2 mL cryotubes, snap-frozen in liquid nitrogen, and stored at −80 °C. Milk (10 mL) was collected manually on experimental day 67 (7 d postpartum), aliquoted, and stored at −80 °C.
2.4.2. Blood Samples
Maternal blood was collected from the jugular vein before morning feeding on experimental day 31 (30 d prepartum) and experimental day 68 (7 d postpartum). Serum was separated for determination of glucose, β-hydroxybutyrate (β-HB), non-esterified fatty acids (NEFA), and triglycerides (TG) [18].
Kid blood was collected from the tail vein at 28 and 56 d of age using the same sampling schedule for all groups. All kids (n = 20 per group) were sampled at each age. Blood was collected into 5 mL plain serum tubes without anticoagulant (Liuyang Sanli Medical Instrument Co., Ltd., China). Samples were allowed to clot at room temperature for 20 min and then centrifuged at 3000 rpm for 10 min at 4 °C. After centrifugation, serum was handled on ice, aliquoted into 0.5 mL centrifuge tubes (Biosharp, Hefei, China), and immediately stored at −20 °C until analysis. Serum was separated for determination of cortisol (COR), adrenocorticotropic hormone (ACTH), immunoglobulin A (IgA), immunoglobulin M (IgM), immunoglobulin G (IgG), superoxide dismutase (SOD), glutathione peroxidase (GSH-Px), catalase (CAT), total antioxidant capacity (T-AOC), malondialdehyde (MDA), leptin, and insulin-like growth factor-1 (IGF-1).
2.4.3. Hypothalamus and Olfactory Bulb Tissues
At experimental day 117 (57 d of age), five kids per group were randomly selected and euthanized. Animal euthanasia and tissue collection were performed in accordance with the regional animal welfare standard for sheep in Inner Mongolia (DB15/T 3264—2023) [19] and the general guidelines for euthanasia of experimental animals (GB/T 39760) [20]. The kids were humanely euthanized via an intravenous overdose of pentobarbital sodium (≥100 mg/kg). The interval from euthanasia to snap-freezing was standardized at approximately 15 min per animal across all groups. Immediately after confirmation of death, the skull was opened using a rapid dissection technique to expose the brain. The arcuate nucleus (ARC) and ventromedial nucleus (VMH) of the hypothalamus and olfactory bulb tissue were carefully dissected under RNase-free conditions. Tissue pieces (~50–100 mg each) were aliquoted into 2 mL cryotubes (Corning Life Sciences, Tewksbury, MA, USA), snap-frozen in liquid nitrogen, and stored at −80 °C to limit RNA degradation. Olfactory bulb tissue was used for expression analysis of selected olfactory receptors [12]. Total RNA was extracted, and only samples with RIN ≥ 7.0, A260/280 of 1.8–2.1, and A260/230 > 1.8, as determined by capillary electrophoresis (Agilent 2100 Bioanalyzer; Agilent Technologies, Santa Clara, CA, USA), were used for downstream qRT-PCR.
2.5. Volatile Metabolomics Analysis
Amniotic fluid and milk samples were analyzed using an HS-SPME-GC-MS platform made by Metware Biotechnology Co., Ltd. (Wuhan, China) [21,22]. Briefly, frozen samples were ground in liquid nitrogen and homogenized. An aliquot of each sample was placed in a headspace vial, and a saturated NaCl solution was added to enhance the release of volatile compounds. An internal standard solution was added for subsequent quantitative correction. Volatile compounds were extracted using an automated headspace solid-phase microextraction (HS-SPME) system. The extraction conditions were as follows: extraction temperature, 60 °C; pre-equilibration time, 5 min; SPME Arrow fiber coated with 120 μm DVB/CWR/PDMS; and headspace extraction time, 15 min. The extracts were desorbed at 250 °C for 5 min. Prior to first use, the fiber was aged at 250 °C for 2 h, and a daily aging time of 5 min was applied before analysis to ensure adsorption activity and detection stability.
Chromatographic separation was performed on an Agilent DB-5MS capillary column (30 m × 0.25 mm × 0.25 μm). The carrier gas was high-purity helium (≥99.999%) at a constant flow rate of 1.2 mL/min. The injector temperature was 250 °C, and the injection mode was splitless with a solvent delay of 3.5 min. The oven temperature program was as follows: initial temperature of 40 °C held for 3.5 min; increased to 100 °C at 10 °C/min; increased to 180 °C at 7 °C/min; and finally increased to 280 °C at 25 °C/min and held for 5 min. Mass spectrometric detection was performed with electron ionization (EI) at 70 eV. The ion source temperature was 230 °C, the quadrupole temperature was 150 °C, and the interface temperature was 280 °C. The data were acquired in selected ion monitoring (SIM) mode, and characteristic ions were selected for qualitative and quantitative analysis according to the National Standard GB 23200.8—2016 [23] to improve specificity and sensitivity.
Metabolite identification was based on a self-built database (MWGC) incorporating retention time (RT), qualitative ions, and quantitative ions from multi-source plant databases, literature, and standard compounds [9]. Compounds were identified when the retention time matched the database and all characteristic ion signals were completely detected after background subtraction. Quantitative analysis was performed using the internal standard method with quantitative ion peak area integration for correction [24].
Quality control included overlapping total ion chromatograms (TICs) in the QC samples, PCA-PC1 score trend across injection order, and the coefficient of variation (CV) distribution of the QC samples. Metabolites with a CV < 0.5 were used to evaluate reproducibility. Unsupervised PCA and supervised OPLS-DA were used to visualize overall metabolic differences, followed by 200 permutation tests. Differential metabolites were screened by OPLS-DA VIP > 1 and |log2FC| ≥ 1, with p < 0.05 as a reference [25]. Differential metabolites were subjected to chemical classification, Z-score hierarchical clustering, K-means expression pattern classification, rOAV analysis, sensory flavor radar, flavor wheel, and Pearson correlation network analysis.
2.6. Blood Marker Measurement
Serum GLU (Cat. No. F006-1-1), β-HB (Cat. No. E030-1-1), NEFA (Cat. No. A042-2-1), and TG (Cat. No. A110-1-1) in the dams, together with COR (Cat. No. H094-1-2), ACTH (Cat. No. H097-1-2), IgA (Cat. No. H108-1-2), IgM (Cat. No. H109-1-2), IgG (Cat. No. H106-1-2), SOD (Cat. No. A001-1-2), GSH-Px (Cat. No. A005-1-2), CAT (Cat. No. A007-1-1), T-AOC (Cat. No. A015-1-2), and MDA (Cat. No. A003-1-2) in the lambs, were quantified using commercial kits purchased from Nanjing Jiancheng Bioengineering Institute (Nanjing, Jiangsu, China), following the manufacturer’s instructions. COR, ACTH, IgA, IgM, and IgG were measured by ELISA. SOD activity was determined using xanthine oxidase/hydroxylamine colorimetry, GSH-Px activity using colorimetry, CAT activity using ammonium molybdate colorimetry, T-AOC using colorimetry, and MDA concentration using TBA colorimetry. Absorbances were measured at the manufacturer-specified wavelengths: 550 nm for SOD, 412 nm for GSH-Px, 405 nm for CAT, 520 nm for T-AOC, and 532 nm for MDA.
2.7. qRT-PCR of Hypothalamic Appetite Genes and Olfactory Receptors
Total RNA was extracted from hypothalamic tissues using TRIzol reagent and reverse-transcribed into cDNA using the PrimeScript RT reagent kit. The expression of appetite-related genes (NPY, AgRP, POMC, and CART) was determined using qRT-PCR with β-actin and GAPDH as reference genes. The geometric mean of the two reference genes was used for normalization. Primer sequences are listed in Table A1. Olfactory bulb tissues were used to measure the expression of short-chain fatty acid receptors, aldehyde receptors, and alcohol receptors [11,12]. Gene expression was calculated using the 2^−ΔΔCt method.
2.8. Statistical Analysis
Statistical analyses were performed using SPSS 26.0 (IBM, Armonk, NY, USA). The data are presented as the mean ± SEM. The maternal and offspring datasets were analyzed separately: volatile metabolomic data were based on six dams per group, whereas growth, intake, blood, and gene expression data were based on 20 kids (10 pens) per group. The pen-level outcomes (starter intake, preference, and feed efficiency) were compared between the two treatment groups using independent-samples t-tests, with the pen as the experimental unit (n = 10 pens per group); Welch’s correction was applied when variances were unequal. The kid-level measurements (body weight, ADG, blood markers, and gene expression) were compared between the groups using independent-samples t-tests, with the kid as the experimental unit (n = 20 kids per group); Welch’s correction was applied when variances were unequal. For targeted blood and gene expression variables, no adjustment for multiple comparisons was applied because each variable was prespecified; exact p-values are reported.
3. Results
3.1. Effects of Maternal MRP Supplementation on Doe Feed Intake, Kid Starter Intake, and Feed Preference
As shown in Table 3, maternal MRP supplementation did not significantly affect doe dry matter intake (1322 vs. 1368 g/d, p = 0.451). For kid starter intake during 0–28 d, the MFD group was numerically higher than the CON group (86.91 vs. 82.28 g/d), but the difference did not reach significance (p = 0.072). During 29–56 d, the MFD kids consumed more starter than the CON kids (158.37 vs. 147.89 g/d, p = 0.035). Feed preference for the MFD starter was higher in the MFD group (57.00%) than in the CON group (43.00%; p < 0.001). Because the feeder positions were not masked for olfactory cues, this preference measure should be interpreted as a combined response to the offered feed and its sensory properties.
Table 3.
Effects of maternal MRP supplementation on feed intake (dry-matter basis) and starter preference.
3.2. Body Weight and Average Daily Gain of Goat Kids
As shown in Table 4, no significant differences were observed in birth weight, body weight at 28 d, or body weight at 56 d between groups (p > 0.05). At 56 d, the MFD kids were numerically 9.8% heavier than the CON kids (10.86 vs. 9.89 kg), but this difference was not statistically significant (p = 0.094). Average daily gain did not differ during 1–28 d (91.89 vs. 83.04 g/d, p = 0.462). During 29–56 d, the MFD kids had a higher average daily gain than the CON kids (143.48 vs. 126.96 g/d, p = 0.043).
Table 4.
Effects of maternal MRP supplementation on body weight and average daily gain of pre-weaning goat kids.
3.3. Effects of Maternal MRP Supplementation on Serum Biochemical Parameters in Does
As shown in Table 5, no significant differences were observed in doe serum biochemical parameters between CON and MFD at 30 d prepartum or 7 d postpartum (p > 0.05). At 7 d postpartum, glucose was numerically higher in the MFD does than in the CON does (2.30 vs. 1.95 mmol/L, p = 0.131). At 30 d prepartum, IgA and IgG were also numerically higher in the MFD does (96.10 vs. 87.03 microg/mL and 673.04 vs. 615.14 microg/mL, respectively; p = 0.144 and p = 0.457), without statistical evidence of a difference. Other measured parameters were similar between the groups.
Table 5.
Effects of maternal MRP supplementation on serum biochemical parameters in does.
3.4. Effects of Maternal MRP Supplementation on Serum Biochemical Parameters in Goat Kids
As shown in Table 6, no significant differences were observed in SOD, MDA, GSH-Px, T-AOC, or CAT between the groups at 28 d of age (p > 0.05). At 56 d, the MFD kids had higher SOD activity (+24.5%, p = 0.036), GSH-Px activity (+18.5%, p = 0.041), and CAT activity (+55.3%, p = 0.034), and lower MDA concentration (−16.5%, p = 0.047) than the CON kids. T-AOC tended to be higher in the MFD kids (0.62 vs. 0.55 mmol/L, p = 0.059). IgA tended to be higher in the MFD kids at 28 d (p = 0.083). At 56 d, IgA was higher in the MFD kids (+19.8%, p = 0.042), and IgG tended to be higher (p = 0.075). IGF-1 tended to be higher in the MFD kids at 28 d (p = 0.071), was higher at 56 d (+32.3%, p = 0.022), and leptin tended to be higher at 56 d (p = 0.087). Glucose, triglycerides, total protein, albumin, globulin, and the albumin/globulin ratio did not differ at either age (p > 0.05). These biomarkers do not establish resistance to disease or reduced weaning stress.
Table 6.
Effects of maternal MRP supplementation on serum biochemical parameters in goat kids at 28 and 56 d of age.
3.5. Hypothalamic Appetite and Olfactory Receptor Gene Expression
As shown in Table 7, maternal MRP supplementation was associated with higher hypothalamic NPY expression in the MFD kids (+29.0%, p = 0.043). CART and POMC expression tended to be lower in the MFD kids (−37.0%, p = 0.052 and −32.0%, p = 0.066, respectively), and AgRP did not differ (p = 0.345). In the olfactory bulb, FFAR2, OR2W1, and OR2J3-like transcripts were higher in the MFD kids by 33.0%, 50.0%, and 42.0%, respectively (p = 0.027, 0.032, and 0.015), whereas FFAR3 and OMP did not differ (p = 0.904 and p = 0.871). These measurements show differences in transcript abundance, not receptor activation, ligand specificity, or neuronal connectivity.
Table 7.
Effects of maternal MRP supplementation on hypothalamic appetite-related and olfactory-related gene expression in goat kids.
3.6. Amniotic Fluid Volatile Metabolome
3.6.1. Data Quality Assessment
For amniotic fluid volatile metabolomics, unsupervised 2D PCA showed that the QC samples were tightly clustered, supporting good analytical repeatability and data stability (Figure 1A). The 3D PCA further presented the global metabolic distribution of all amniotic fluid samples in three-dimensional space (Figure 1B). The 2D PCA plot with 95% confidence ellipses provided an intuitive view of the separation tendency between the CON and MFD groups (Figure 1C). More than 85% of metabolites exhibited CV < 0.5 in the QC samples, confirming good data reproducibility and reliability for subsequent differential analysis (Figure 1D).
Figure 1.
Data quality assessment and overall PCA profiling of the volatile metabolome in amniotic fluid. (A) A 2D PCA score plot of amniotic fluid samples; (B) a 3D PCA score plot of amniotic fluid samples; (C) a 2D PCA score plot with 95% confidence ellipses for the CON and MFD groups; and (D) the distribution of the coefficient of variation (CV) for metabolites detected in the QC samples. TIC overlap, tight QC clustering, and the high proportion of metabolites with CV < 0.5 supported the stability, repeatability, and reliability of the volatile metabolomic dataset.
3.6.2. Overall Metabolic Profile
Unsupervised PCA was used to characterize global volatile metabolic variation. PC1, PC2, and PC3 accounted for 41.07%, 17.66%, and 12.00% of the variance, respectively (cumulative 70.73%). The 2D and 3D PCA plots (Figure 1A,B) showed a tendency toward separation between the CON and MFD samples with partial overlap, and tightly clustered QC samples confirmed analytical stability.
Supervised OPLS-DA revealed apparent grouping of the two treatments (Figure 1C). A 200-permutation test (Figure 1D) returned R2Y = 0.975 and Q2 = 0.188. The high R2Y indicated good model fit, while the low Q2 suggested poor predictive performance. Thus, OPLS-DA was only used for exploratory screening of candidate differential metabolites, and these metabolites require further validation.
3.6.3. Differential Metabolites
With p < 0.05 alone, six metabolites met the significance criterion (one higher and five lower in MFD). When OPLS-DA VIP > 1 and |log2FC| ≥ 1 were also required, 64 candidate differential metabolites were identified (three higher and 61 lower in MFD). The combined screen was, therefore, dominated by lower-abundance metabolites in the MFD group (Figure 2A,B).
Figure 2.
The screening, classification, and clustering of differential volatile metabolites in amniotic fluid between the CON and MFD groups. (A) A volcano plot showing differentially expressed metabolites screened by p < 0.05; the red dots represent significantly upregulated metabolites, the green dots represent significantly downregulated metabolites, and the grey dots indicate non-significant metabolites. (B) A volcano plot based on OPLS-DA VIP > 1 and |log2FC| ≥ 1; the red dots represent upregulated metabolites, the green dots represent downregulated metabolites, and the grey dots represent metabolites without significant difference. (C) A VIP score plot of candidate differential metabolites derived from the OPLS-DA model. (D) A bar plot showing the log2FC values of differential metabolites. (E) A pie chart displaying the chemical classification of all annotated volatile metabolites. (F) A hierarchical clustering heatmap of differential metabolites based on z-score-normalized abundance. The CON and MFD groups exhibited distinguishable metabolite expression patterns, indicating that maternal Maillard flavor diet altered the volatile metabolome in amniotic fluid.
Candidate metabolites with VIP > 1 contributed strongly to the exploratory model; most were lower in MFD, consistent with the volcano plot (Figure 2C). The log2FC bar plot identified AMW2980 as the only metabolite with a positive log2FC above 1 (log2FC = 2.18; approximately 4.5-fold higher in MFD). AMW0364, AMW1079*023, and AMW1078*023 showed log2FC < −2, corresponding to less than one-quarter of the CON abundance in MFD (Figure 2D).
3.6.4. Chemical Classification and Clustering
Annotated volatile metabolites were classified by chemical structure. Aldehydes, ketones, and esters accounted for 34.24% of annotations, followed by hydrocarbons (16.47%), alcohols and amines (14.98%), heterocyclic compounds (10.46%), benzene and derivatives (8.17%), and terpenes (6.25%). Other classes accounted for smaller proportions. Pyrazines and furans are characteristic Maillard products and were, therefore, examined separately, although their presence is not equivalent to a measured sensory effect (Figure 2E).
Z-score hierarchical clustering heatmaps showed that the CON and MFD samples generally clustered into separate groups, with a few crossovers, consistent with PCA results. Differential metabolites were clearly divided into two major modules: one with high expression in CON and low expression in MFD, and another with high expression in MFD and low expression in CON, visually demonstrating that the maternal Maillard flavor diet significantly reshaped the amniotic fluid volatile metabolome (Figure 2F).
3.6.5. Flavoromics Analysis
K-means clustering analysis was performed to classify the expression patterns of differential volatile metabolites in amniotic fluid. Two distinct metabolite subclasses were identified in response to maternal Maillard flavor diet (MFD) intervention. Subclass 1 consisted of three metabolites with significantly upregulated abundance in the MFD group, whereas Subclass 2 contained 61 metabolites exhibiting downregulated expression. These divergent expression profiles strongly indicated that the MFD treatment induced an overall suppressive remodeling of the amniotic fluid volatile metabolome, with metabolite downregulation serving as the dominant regulatory pattern (Figure 3A). The LSA scoring model was further applied to quantify the biological activity signatures of candidate differential metabolites. The clear separation of metabolite activity characteristics was observed between the CON and MFD groups, verifying that maternal MFD intervention fundamentally altered the biological activity of flavor-related metabolites in amniotic fluid (Figure 3B).
Figure 3.
The flavoromic profiling of differential volatile metabolites in amniotic fluid between the CON and MFD groups. (A) K-means clustering showing two distinct expression patterns of differential volatile metabolites. (B) A relative odor activity value (rOAV) scatter plot illustrating the distribution of high odor-active volatile compounds. (C) A sensory radar plot summarizing the annotated flavor attributes of differential metabolites, where each axis represents one sensory descriptor and the axis magnitude indicates the metabolite count assigned to each flavor category. (D) A sunburst plot visualizing the hierarchical distribution of differential volatile metabolites across multiple sensory flavor categories; the inner rings denote flavor types, with metabolite numbers in parentheses, and the outer rings represent individual volatile compounds. The CON and MFD groups exhibited distinct flavoromic profiles, indicating that the maternal Maillard flavor diet altered the flavor-active volatile metabolome in amniotic fluid.
RrOAV scatter plot analysis revealed that highly odor-active metabolites were detected in both the CON and MFD groups. Nevertheless, the core flavor-contributing compounds with high rOAV values exhibited obvious non-overlapping characteristics between the two groups, demonstrating that maternal MFD intervention profoundly reshaped the compositional profile and relative abundance of key odor-active metabolites in amniotic fluid. This metabolic alteration is of critical biological significance. The fetal olfactory system undergoes rapid development during the middle and late gestational stages, and the fetus can sense and accumulate flavor information by swallowing amniotic fluid, thereby establishing intrauterine flavor memory and flavor imprinting phenotypes [1,4]. Accordingly, the MFD-induced reshaping of flavor-active metabolites in amniotic fluid may serve as a candidate maternal–fetal signaling basis for fetal flavor perception and early imprinting.
Sensory attribute classification based on flavor radar plots further systematically annotated the sensory characteristics of differential volatile metabolites. Each axis of the radar chart corresponds to an independent flavor sensory attribute, and the axis magnitude represents the number of differential metabolites assigned to each flavor category. The results showed that the differential metabolites induced by the MFD intervention were predominantly enriched in sweet, green, fruity, and roasted flavor attributes, while only a small number of metabolites were annotated to apple, celery, phenol, tropical, acetaldehyde, and acetone sensory traits (Figure 3C). Consistent with the radar chart results, the flavor sunburst plot (Figure 3D) visually and hierarchically displayed the distribution characteristics of differential metabolites across multiple sensory categories. Collectively, these intuitive visualization results comprehensively confirmed that maternal MFD intervention effectively remodels the overall flavor spectrum and sensory attribute distribution of amniotic fluid volatile metabolites.
3.6.6. Metabolite Correlation Analysis and Typical Differential Metabolite Validation
A Sankey diagram was applied to visualize the directional redistribution of differential volatile metabolites across sensory flavor categories (Figure 4B). Consistent with prior K-means clustering results, most odor-active metabolites were downregulated following the MFD intervention, while only a small subset of compounds within sweet, green, fruity, and tropical flavor categories were significantly upregulated, revealing selective remodeling of the flavor metabolome rather than non-specific perturbation of all volatile compounds. A Pearson correlation triangular heatmap was further constructed to characterize pairwise co-variation patterns among these differential metabolites (Figure 4A). Widespread strong positive correlations were observed among the majority of downregulated metabolites, implying these compounds were coordinately modulated by shared upstream regulatory cascades. By contrast, inverse correlations were predominantly detected between upregulated and downregulated metabolites, reflecting divergent regulatory responses to maternal MFD feeding. To further dissect intrinsic crosstalk among odor-active molecules, metabolite interaction network analysis was performed, with nodes colored by chemical classification (Figure 4D). Dense interconnections across the network indicated tight metabolic coupling of these volatile metabolites, where benzene and substituted derivatives, aldehydes, ketones, and esters, as well as hydrocarbons, served as the core network nodes. Collectively, the correlation and network analyses provide supporting evidence for identifying hub metabolites and for describing the metabolic associations accompanying the reshaping of the amniotic fluid flavor profile.
Figure 4.
Correlation network analysis and validation of representative differential volatile metabolites in amniotic fluid between the CON and MFD groups. (A) A Pearson triangular correlation heatmap of differential volatile metabolites; the color gradient corresponds to the Pearson correlation coefficient, red for positive correlation and green for negative correlation. (B) A Sankey diagram showing the distribution and regulatory direction (upregulated/downregulated) of differential volatile metabolites across the sensory flavor categories. The left column represents flavor attributes, and the right column represents individual differential metabolites. The red and blue flows indicate upregulated and downregulated metabolites, respectively. The height of the boxes in the left column is proportional to the number of differential metabolites shown in the right column. (C) A violin-box plot presenting raw signal intensity of anethole between the CON and MFD groups. (D) The interaction network of differential volatile metabolites; the nodes indicate individual metabolites colored by chemical classification, and the connecting lines represent pairwise metabolite interactions. The CON and MFD groups exhibited distinct correlation patterns and representative metabolite profiles, indicating that maternal Maillard flavor diet altered the volatile metabolome in amniotic fluid.
Anethole, a terpenoid metabolite characterized by sweet and anise-like sensory notes, was selected as a representative differential flavor-active compound for validation. A violin plot demonstrated that the raw signal intensity of anethole was markedly higher in the CON group relative to the MFD group, confirming that the maternal Maillard flavor diet substantially reduced the abundance of anethole in amniotic fluid (Figure 4C). As an odor-active biovolatile compound, altered anethole concentration in gestational amniotic fluid may modulate fetal olfactory sensing and mediate intrauterine flavor imprinting during mid-to-late gestation [26].
3.7. Milk Volatile Metabolome
3.7.1. Data Quality Assessment
Unsupervised 2D PCA showed that the QC samples were tightly clustered together in the score plot, supporting good analytical repeatability and data stability across the whole sequence (Figure 5A). The 3D PCA further presented the global metabolic distribution of all of the milk samples in the three-dimensional space, with the samples from the two groups showing clear directional separation (Figure 5B). The OPLS-DA score plot with 95% confidence ellipses provided an intuitive view of the distinct separation between the CON and MFD groups along the predictive component, with relatively tight within-group clustering (Figure 5C). The permutation test distribution plot demonstrated that the majority of metabolites exhibited CV < 0.5 in the QC samples, confirming good data reproducibility and reliability for subsequent differential metabolite screening and flavoromic analysis (Figure 5D).
Figure 5.
The data quality assessment and overall multivariate statistical profiling of the volatile metabolome in goat milk. (A) A 2D PCA score plot of all milk samples, with the CON, MFD, and QC samples color-coded; (B) a 3D PCA score plot of all milk samples showing global metabolic distribution; (C) the OPLS-DA score plot with 95% confidence ellipses for the CON and MFD groups; and (D) the permutation test plot of the OPLS-DA model, showing the distribution of variable importance and the permutation results. TIC overlap, tight QC clustering, and favorable model validation collectively supported the stability, repeatability, and reliability of the milk volatile metabolomic dataset.
3.7.2. Overall Metabolic Profile
Unsupervised 2D PCA showed that PC1 explained 53.86% and PC2 explained 15.79% of the total variance, with the first two principal components collectively accounting for 69.65% of total variation. Three-dimensional PCA further revealed that PC1, PC2, and PC3 explained 54.4%, 16.41%, and 7.03% of the total variance, respectively, with a cumulative explanation of 77.84%. The CON and MFD groups exhibited a clear separation trend in both 2D and 3D PCA score plots, with no obvious overlap between the group centroids, indicating that the maternal Maillard flavor diet markedly altered the overall volatile metabolic profile of goat milk (Figure 5A–C).
The OPLS-DA score plots showed a distinct separation between the CON and MFD groups along the predictive component direction, with relatively tight within-group clustering. The 200-permutation test yielded R2Y = 0.671, while Q2 was close to zero, indicating that the model explained the grouping variable well, without severe overfitting. Therefore, OPLS-DA was suitable for exploratory screening of candidate differential flavor metabolites in milk (Figure 5C,D).
3.7.3. Differential Metabolites
Based on p < 0.05, a total of seven significant differential metabolites were identified, including five upregulated and two downregulated metabolites in the MFD group. Based on OPLS-DA VIP > 1 and |log2FC| ≥ 1, 11 differential metabolites were identified, including eight upregulated and three downregulated metabolites. Both criteria consistently indicated that the maternal Maillard flavor diet mainly led to the upregulation of volatile metabolites in goat milk, with only a small subset of compounds significantly downregulated (Figure 6A,B).
Figure 6.
The screening, classification, and clustering of differential volatile metabolites in goat milk between the CON and MFD groups. (A) A volcano plot showing differentially expressed metabolites screened by p < 0.05; the red dots represent significantly upregulated metabolites, the green dots represent significantly downregulated metabolites, and the grey dots indicate non-significant metabolites. (B) A volcano plot based on OPLS-DA VIP > 1 and |log2FC| ≥ 1; the red dots represent upregulated metabolites, the green dots represent downregulated metabolites, and the grey dots represent metabolites without significant difference. (C) A VIP score plot of candidate differential metabolites derived from the OPLS-DA model. (D) A bar plot showing the log2FC values of differential metabolites. (E) A pie chart displaying the chemical classification of all annotated volatile metabolites. (F) A hierarchical clustering heatmap of differential metabolites based on z-score-normalized abundance. The CON and MFD groups exhibited highly distinguishable metabolite expression patterns, indicating that the maternal Maillard flavor diet markedly altered the volatile metabolome of goat milk.
The VIP score plots showed that all displayed candidate differential metabolites had VIP > 1, and most had VIP > 1.5, indicating important contributions to group discrimination. Most high-VIP metabolites were upregulated in the MFD group, consistent with the volcano plot results (Figure 6C). The log2FC bar plots showed that multiple upregulated metabolites had log2FC > 1, meaning their contents in the MFD group were more than twice those in the CON group, while downregulated metabolites showed moderate fold changes (Figure 6D).
3.7.4. Chemical Classification and Clustering
All annotated volatile metabolites in milk were classified by chemical structure. Aldehydes, ketones, and esters accounted for the highest proportion (30.39%), followed by hydrocarbons (16.00%), alcohols and amines (16.28%), heterocyclic compounds (10.67%), benzene and substituted derivatives (7.91%), and terpenoids (9.88%). Nitrogen-containing compounds, organic acids and derivatives, ethers, and halogenated hydrocarbons accounted for relatively low proportions. Aldehydes, ketones, and esters are major aroma contributors in ruminant milk, while heterocyclic compounds, such as pyrazines and furans, are characteristic Maillard reaction products, and terpenoids represent a major class of plant-derived bioactive volatiles (Figure 6E).
The Z-score hierarchical clustering heatmaps showed that the CON and MFD samples clustered into completely separate groups, with no obvious crossovers, consistent with the PCA and OPLS-DA results. Differential metabolites were clearly divided into two major modules: one with high expression in CON and low expression in MFD, and another with high expression in MFD and low expression in CON, visually demonstrating that the maternal Maillard flavor diet significantly reshaped the milk volatile metabolome (Figure 6F).
3.7.5. Flavoromics Analysis
The categorized log2FC scatter plot showed that differential volatile metabolites were distributed across all major chemical classes, with most upregulated metabolites belonging to aldehydes, ketones and esters, alcohols and amines, and terpenoids, while a small subset of downregulated metabolites was detected in heterocyclic compounds (Figure 7A). The rOAV scatter plot further revealed that highly odor-active metabolites were detected in both the CON and MFD groups, but the sets of core flavor-contributing compounds with high rOAV values showed partial non-overlap between the two groups, demonstrating that maternal MFD intervention altered the composition and relative contribution of key odor-active compounds in goat milk (Figure 7B).
Figure 7.
The flavoromic profiling of differential volatile metabolites in goat milk. (A) A categorized log2FC scatter plot of differential metabolites by chemical class, with point size representing the OPLS-DA VIP value. (B) A rOAV scatter plot showing the raw intensity of odor-active metabolites between the CON and MFD groups. (C) A sensory radar plot summarizing the annotated flavor attributes of differential metabolites, where each axis represents one sensory descriptor. (D) A flavor sunburst plot visualizing the hierarchical distribution of differential metabolites across sensory flavor categories.
The sensory flavor radar plots summarized the annotated sensory attributes of differential volatile metabolites. Each axis represents a distinct sensory descriptor, and the magnitude on each axis corresponds to the number of differential metabolites annotated to that flavor characteristic. The radar chart demonstrated that the annotated differential metabolites were predominantly associated with sweet sensory notes, followed by green, fruity, and roasted flavor attributes, while fewer metabolites contributed to celery, phenol, tropical, acetaldehyde, and acetone characteristics (Figure 7C). The flavor sunburst plot further visualized the hierarchical distribution of differential metabolites across multiple sensory categories, intuitively reflecting the reshaping effect of maternal MFD on the overall milk flavor profile (Figure 7D).
3.7.6. Correlation and Typical Metabolite Validation
The Pearson correlation triangular heatmap showed that most differential volatile metabolites exhibited strong positive or negative pairwise correlations. Upregulated metabolites generally showed strong positive correlations among themselves, suggesting they may be coordinately regulated by the same upstream dietary intervention, while upregulated and downregulated metabolites were mostly negatively correlated, reflecting opposite regulatory patterns in response to MFD feeding (Figure 8A). The Sankey diagram further illustrated the directional distribution of differential metabolites across sensory categories, visually showing the up/downstream flow of flavor compounds between the two groups (Figure 8B).
Figure 8.
Correlation network analysis and validation of representative differential metabolites in goat milk. (A) A Pearson triangular correlation heatmap of differential volatile metabolites. (B) A Sankey diagram showing the distribution and regulatory direction (upregulated/downregulated) of differential metabolites across the sensory flavor categories. (C) A violin-box plot presenting the raw intensity distribution of the representative metabolite 5-methyl-2-Hexanone between the CON and MFD groups. (D) The interaction network of differential volatile metabolites, with nodes colored by chemical classification and lines indicating pairwise correlations.
5-methyl-2-Hexanone, a ketone compound with fruity and sweet aroma notes, was identified as a representative differential volatile metabolite. The violin-box plot demonstrated that its raw signal intensity was markedly higher in the MFD group compared with the CON group, confirming that the maternal Maillard flavor diet significantly elevated 5-methyl-2-Hexanone content in goat milk (Figure 8C). As an odor-active compound, changes in the methyl ketone content in milk directly affect the flavor profile of dairy products. The metabolite interaction network further revealed dense crosstalk among differential volatile compounds, with nodes colored by chemical classification, indicating tight metabolic coupling among these flavor-active molecules in response to maternal dietary intervention (Figure 8D).
4. Discussion
This study examined how a maternal diet supplemented with Maillard reaction products (MFD) affected the volatile metabolite profiles of amniotic fluid and milk in Arbas White Cashmere goats. It also compared starter preference, starter intake, growth, blood biomarkers, and selected gene transcripts between kids in two combined feeding treatments. The kids in the CON–CON group were born to control-fed dams and received the control starter, whereas the kids in the MFD–MFD group were born to MFD-fed dams and received the MFD-flavored starter. The maternal diet groups differed in the volatile profiles of both fluids, and the kid groups differed in starter preference, late pre-weaning intake and average daily gain (ADG), selected blood biomarkers, and the expression of selected genes. Because maternal diet and starter treatment were paired, the offspring findings are interpreted at the level of the combined feeding treatment.
4.1. The Maternal Maillard Flavor Diet Reshapes the Amniotic Fluid Volatile Metabolome
Amniotic fluid is the first body fluid environment directly contacted by the fetus and plays a key role in early flavor perception and imprinting [1,4]. In the present study, maternal MFD supplementation significantly altered the overall volatile metabolic profile of amniotic fluid, with clear separation between the CON and MFD groups in the PCA and OPLS-DA models. A total of 64 differential metabolites were identified by VIP > 1 and |log2FC| ≥ 1, of which 61 were downregulated, and only three were upregulated. These results indicate that maternal MFD supplementation mainly led to a broad downregulation of amniotic fluid volatile metabolites, rather than a simple increase in Maillard-derived flavor compounds.
The downregulated metabolites were dominated by heterocyclic compounds, followed by terpenes, benzene derivatives, and alcohols–amines. Heterocyclic compounds, such as pyrazines and furans, are characteristic Maillard reaction products [10]. However, the detection of these compounds does not confirm their direct origin from the MFD supplement; their downregulation in amniotic fluid may reflect altered endogenous flavor precursor metabolism, rather than direct transfer of Maillard flavor compounds into the fetal environment.
Flavoromics analysis based on rOAV, sensory radar, and flavor wheel identified shifts in the sets of odor-active compounds, although these analytical outputs cannot directly confirm differences in perceived sensory intensity. Anethole, a terpenoid with a sweet and anise-like aroma, was significantly reduced in the MFD group. These changes may potentially affect fetal olfactory development and flavor perception during intrauterine development. Because the fetal olfactory system begins to develop in mid-to-late gestation and the fetus can perceive flavor compounds by swallowing amniotic fluid, the altered amniotic fluid volatile profile could serve as a candidate sensory signal for flavor imprinting [1,2]. Lévy et al. demonstrated in lambs that cumin flavor from the maternal diet transferred to amniotic fluid and drove postnatal preference for cumin-scented artificial milk [8]. Similarly, Schaal et al. reported that human fetuses learn odors from their pregnant mother’s diet through amniotic fluid exposure [26]. Our findings extend these observations by showing that a complex Maillard flavor system, rather than a single flavor compound, can reshape the entire amniotic fluid volatile metabolome, potentially providing a richer and more diverse candidate flavor signal to the fetus.
4.2. The Maternal Maillard Flavor Diet Reshapes the Milk Volatile Metabolome
Milk is the primary flavor-bearing medium continuously exposed to the neonate during lactation and is, therefore, a key source of postpartum flavor imprinting [4,6]. In the present study, maternal MFD supplementation significantly altered the overall volatile flavor composition of milk, with clear separation between the CON and MFD groups in the PCA and OPLS-DA models. A total of 11 differential metabolites were identified by VIP > 1 and |log2FC| ≥ 1, including eight upregulated and three downregulated metabolites. These results indicate that maternal MFD supplementation also mainly led to upregulation of milk volatile flavor compounds, with only a small subset of compounds significantly downregulated.
Flavoromics analysis showed that the highly odor-active compounds in the CON and MFD milk were completely differentiated, but the radar classification of annotated metabolites does not equate to measured sensory intensity for sweetness, roasted aroma, fruity aroma, and fatty aroma. 5-methyl-2-Hexanone, a ketone compound with fruity and sweet aroma notes, was identified as a representative differential volatile metabolite, and its raw signal intensity was markedly higher in the MFD group compared with the CON group. These findings support the possibility that maternal MFD supplementation does not simply increase the deposition of flavor compounds in milk, but reshapes the volatile metabolic network. Hausner et al. demonstrated that dietary flavor compounds from the maternal diet transfer to human breast milk in a time-dependent manner, and that infants can detect these transmitted flavors within hours of maternal ingestion [4]. Our results extend this concept by showing that maternal MFD supplementation alters the milk volatile metabolome in a more complex and selective manner, with upregulation of specific odor-active compounds, such as 5-methyl-2-hexanone, that may act as candidate imprinting signals.
4.3. Dual Body-Fluid Flavor Imprinting and Offspring Feeding Preference
The amniotic fluid and milk volatile metabolome results showed a highly consistent regulatory pattern. Maternal MFD supplementation significantly altered the overall volatile metabolite profiles of both body fluids, and differential metabolites were predominantly composed of heterocyclic, terpenoid, and aldehyde–ketone–ester compounds. Typical metabolites, such as anethole in amniotic fluid and 5-methyl-2-hexanone in milk, were significantly changed in the MFD group. These consistent changes suggest the possibility that maternal MFD supplementation may establish a “prenatal amniotic fluid + postnatal milk” dual flavor-imprinting environment [4,6].
Importantly, the offspring results are compatible with the biological significance of this hypothesized dual flavor imprinting. Notably, the present experimental design paired maternal MFD treatment with MFD-flavored starter for offspring; therefore, the observed feeding preference cannot be fully separated from the effect of direct postnatal exposure to the flavored starter. The MFD lambs showed a significantly higher feed preference for the MFD-flavored starter than the CON lambs (57% vs. 43%, p < 0.001). During 29–56 d, the MFD lambs had significantly higher starter intake than the CON lambs (158.37 vs. 147.89 g/d, p = 0.035). During the same period, the MFD lambs had significantly higher ADG than the CON lambs (143.48 vs. 126.96 g/d, p = 0.043), and at 56 d of age, the MFD lambs were 9.8% heavier than the CON lambs (p = 0.094). These results suggest that early flavor exposure, in combination with starter flavor matching, may improve adaptation to starter and promote growth performance. The preference threshold of 55% was exceeded in the MFD group, confirming a clear preference for the MFD-flavored starter. These findings are consistent with the concept that maternal dietary flavor signals can be transmitted to offspring through amniotic fluid and milk, which may help shape early feed acceptance and reduce weaning stress [6,8]. Hai et al. 2012 reported that goat kids from mothers fed Chromonaela odorata during pregnancy consumed significantly more of this feedstuff after weaning compared with kids from control mothers, and the effect persisted for at least 3 months [27]. Oostindjer et al. similarly demonstrated that prenatal flavor exposure in pigs affected growth, health, and behavior of newly weaned piglets [28]. Our study extends these findings by demonstrating that a Maillard flavor system, rather than a single plant-derived flavor, may program offspring feeding preference in cashmere goats, pending further validation using a factorial design.
It is noteworthy that maternal MFD supplementation mainly downregulated flavor compounds in amniotic fluid but upregulated specific volatile compounds in milk, rather than uniformly increasing or decreasing Maillard characteristic flavor compounds across both body fluids. This suggests that the flavor imprinting effect, if it occurs, is not simply dependent on flavor intensity, but rather on the composition and relative proportions of key flavor-active compounds. The few upregulated metabolites, such as AMW2980 in amniotic fluid and 5-methyl-2-hexanone in milk, may serve as candidate imprinting signals and could form specific perception in the fetal and neonatal olfactory system [29].
4.4. Olfactory Receptor and Hypothalamic Appetite Gene Regulation
The formation of offspring feeding preference involves multiple levels of regulation. In the present study, the MFD lambs showed significantly higher expression of FFAR2, OR2W1, and OR2J3-like in the olfactory bulb than the CON lambs, with increases of 33.0%, 50.0%, and 42.0%, respectively. FFAR2 is a short-chain fatty acid receptor that may sense microbial or milk-derived short-chain fatty acids [12], whereas OR2W1 and OR2J3-like are olfactory receptors that are candidate receptors potentially able to recognize key flavor ligands present in amniotic fluid and milk; the specific ligands for these receptors in cashmere goats remain unconfirmed [11]. The upregulation of these receptors raises the possibility that the olfactory system in the MFD lambs is more responsive to the flavor environment established by maternal MFDP supplementation. Recent evidence supports an additional role of olfactory receptors in the regulation of appetite and feeding efficiency in mammals, with genetic variation among individuals in specific odorant receptor genes linked to differences in feeding behaviors, food choices, and energy balance [13].
In addition, altered transcript abundance alone cannot confirm corresponding changes in receptor protein abundance or functional olfactory sensitivity; differences in starter intake and nutritional status may also contribute to the observed gene expression patterns.
At the hypothalamic level, the MFD lambs had significantly higher NPY expression (+29.0%, p = 0.043) and a tendency toward lower CART expression (−37.0%, p = 0.052) than the CON lambs, while POMC expression also tended to decrease (−32.0%, p = 0.066). NPY is an orexigenic signal that promotes feed intake, whereas CART and POMC are anorexigenic signals that inhibit feed intake [13,14]. The shift toward higher NPY and lower CART/POMC expression is consistent with the higher starter intake and feed preference observed in the MFD lambs, although the causal direction remains unresolved. Kuang et al. recently demonstrated that olfactory signals reach appetite-linked neurons in the hypothalamic arcuate nucleus, with AgRP and POMC neurons receiving indirect input from partially overlapping but distinct areas of the olfactory cortex [12]. This provides a neuroanatomical basis for our proposed “olfactory signal–hypothalamic appetite gene–feeding behavior” regulatory axis. Together, these results suggest a testable hypothesis that maternal MFDP supplementation may program offspring feeding behavior through this regulatory axis.
4.5. Growth Performance, Antioxidant Capacity, and Immune Status
The improvements in feed preference and starter intake were accompanied by enhanced growth performance in the MFD lambs. Although birth weight and body weight at 28 d did not differ significantly between the groups, the MFD lambs had numerically higher body weight at all time points and were 9.8% heavier at 56 d (p = 0.094). During 29–56 d, ADG was significantly higher in the MFD lambs than in the CON lambs, indicating that the beneficial effects associated with maternal MFD treatment on growth became more pronounced during the later pre-weaning period. These results suggest that early flavor exposure, combined with matched starter flavor, may improve adaptation to starter and increase nutrient intake, thereby supporting growth.
Antioxidant and immune parameters were also altered in the MFD lambs. At 56 d of age, the MFD lambs had significantly higher SOD, GSH-Px, and CAT activities, and significantly lower MDA content than the CON lambs. T-AOC also tended to be higher in the MFD lambs. These changes indicate that maternal MFDP supplementation was associated with enhanced antioxidant defense system and reduced lipid peroxidation in offspring. In addition, IgA was significantly higher in the MFD lambs at 56 d, and IgG tended to be higher. IGF-1 was significantly higher in the MFD lambs at 56 d, and leptin tended to be higher. IGF-1 is an important growth-promoting factor, and its increase is consistent with the improved growth performance. These biomarker differences cannot be directly extrapolated to improved disease resistance or reduced weaning stress severity without supporting clinical data. These findings are particularly relevant in the context of early weaning stress, which is a major challenge in ruminant production systems [30]. The modified antioxidant and immune profiles observed in the MFD lambs may potentially contribute to reduced morbidity and mortality during the critical pre-weaning period, which requires further verification.
4.6. Limitations and Future Perspectives
The present findings should be interpreted in light of several limitations. The relatively small sample size for volatile metabolomic analysis (n = 6 per group) and the single-breed design restrict the generalizability of our conclusions, and larger, longer-term trials across different breeds and production systems are, therefore, needed. Moreover, the proposed mechanisms are largely inferred from correlations among volatile metabolites, gene expression, and phenotypic parameters; targeted metabolomics, isotope tracing, fecal microbiota transplantation, and gene knockout or overexpression experiments will be required to establish causality [25]. Sensory evaluation was not performed in this study, and the potential roles of maternal serum exosomal miRNAs and offspring liver miRNAs in intergenerational flavor transmission remain to be elucidated [15]. In addition, the specific olfactory receptors and hypothalamic neural circuits mediating flavor imprinting, as well as the long-term persistence of feeding preference and growth advantages beyond the pre-weaning period, were not fully characterized. Future studies integrating sensory evaluation, electrophysiological and optogenetic approaches, and longer follow-up periods are warranted to confirm the causal mechanisms and practical value of maternal flavor imprinting.
5. Conclusions
In summary, this study shows that a maternal Maillard flavor diet was associated with altered volatile metabolite profiles of amniotic fluid and milk in cashmere goats, with fluid-specific patterns rather than a uniform “prenatal amniotic fluid + postnatal milk” dual flavor-imprinting environment. Under the paired maternal and starter treatments, MFD–MFD kids showed greater preference for the MFD-flavored starter, higher starter intake and average daily gain during the later pre-weaning period, differences in selected antioxidant, immune, and growth-related blood biomarkers, and altered expression of hypothalamic appetite genes and olfactory receptor genes; body weight at 56 d was numerically 9.8% higher, but not statistically significant (p = 0.094). The effects were characterized by a broad lower abundance of flavor compounds in amniotic fluid but a higher abundance of specific volatile compounds in milk, rather than uniform deposition of flavor compounds; whether key flavor-active compounds and their relative proportions are more important for flavor imprinting than overall flavor intensity remains to be tested. These findings provide a basis for further hypothesis-driven studies rather than evidence that maternal flavor exposure improves early starter intake or alleviates weaning stress in goat kids. Future studies should use factorial designs to separate prenatal from postnatal exposure, identify candidate odor-active compounds, and validate causal mechanisms using targeted and multi-omics approaches.
Author Contributions
Conceptualization, H.S.; methodology, L.J., Z.Z., M.N., D.Y., Q.W., W.L., C.F., P.C. and Y.W.; software, Y.W., Q.W., W.L. and M.N.; validation, C.F., D.Y. and M.N.; formal analysis, L.J., M.N., Y.W. and Q.W.; investigation, L.J., P.C., D.Y. and C.F.; resources, Z.Z., D.Y., and P.C.; data curation, M.N., W.L. and Y.W.; writing—original draft preparation, L.J.; writing—review and editing, Z.Z., C.F., Q.W. and H.S.; visualization, L.J., W.L. and Q.W.; supervision, Z.Z. and H.S.; project administration, H.S.; funding acquisition, H.S. All authors have read and agreed to the published version of the manuscript.
Funding
This research was funded by the Inner Mongolia Autonomous Region Science and Technology Program (2025KYPT0080); the Basic Research Business Fee Project of Inner Mongolia Academy of Agricultural and Animal Husbandry Sciences (JBYWF2025-YFGG04); the Inner Mongolia Autonomous Region “Yingcai Xingmeng” Project for Young Top-notch Talents; the Inner Mongolia Autonomous Region “Yingcai Xingmeng” Project Team (2025TEL18); and the Modern Agricultural Industry Technology System Special Fund (CARS-39-11).
Institutional Review Board Statement
The animal study protocol was approved by the Animal Ethics and Welfare Committee of Inner Mongolia Academy of Agricultural and Animal Husbandry Sciences (protocol code 2026-0074).
Informed Consent Statement
Not applicable. Our institute is a public research institution with long-term experience in animal feeding trials and maintains a well-equipped sheep facility. All experimental animals used in this study were raised at this institutional facility and were not purchased from or supplied by any commercial farm or external animal owner.
Data Availability Statement
The original contributions presented in this study are included in the article. Further inquiries can be directed to the corresponding author.
Conflicts of Interest
The author Zhijun Zhang was employed by Alxa League Mingyuan White Cashmere Goat Breeding Co., Ltd. Zhijun Zhang declares no relevant financial or non-financial competing interests. The remaining authors declare that the research was conducted in the absence of any commercial or financial relationships that could be construed as potential conflicts of interest.
Abbreviations
The following abbreviations are used in this manuscript:
| ACTH | Adrenocorticotropic hormone |
| ADG | Average daily gain |
| AgRP | Agouti-related peptide |
| ARC | Arcuate nucleus |
| CAT | Catalase |
| CART | Cocaine- and amphetamine-regulated transcript |
| CON | Control group |
| CON–CON | Kids from CON dams fed the basal starter |
| COR | Cortisol |
| CV | Coefficient of variation |
| DMI | Dry matter intake |
| EI | Electron ionization |
| ELISA | Enzyme-linked immunosorbent assay |
| FFAR2 | Free fatty acid receptor 2 |
| FFAR3 | Free fatty acid receptor 3 |
| GAPDH | Glyceraldehyde-3-phosphate dehydrogenase |
| GC-MS | Gas chromatography–mass spectrometry |
| GLU | Glucose |
| GSH-Px | Glutathione peroxidase |
| HS-SPME | Headspace solid-phase microextraction |
Appendix A
Table A1.
Primer pairs sequences for quantitative real-time PCR.
References
- Marlier, L.; Schaal, B.; Soussignan, R. Neonatal responsiveness to the odor of amniotic and lacteal fluids: A test of perinatal chemosensory continuity. Child Dev. 1998, 69, 611–623. [Google Scholar] [CrossRef]
- Zhang, Y.; Li, Y.; Zhang, Y.; Ma, Y. Maternal dietary programming in young ruminants: Developmental regulation of the gut–microbiome–immune axis. Animal 2026, 20, 101452. [Google Scholar]
- Mennella, J.A.; Jagnow, C.P.; Beauchamp, G.K. Prenatal and postnatal flavor learning by human infants. Pediatrics 2001, 107, e88. [Google Scholar] [CrossRef] [Scilit] [PubMed]
- Hausner, H.; Philipsen, M.; Skov, L.R.; Petersen, M.A.; Bredie, W.L.P.; Møller, P. Differential transfer of dietary flavour compounds into human breast milk. Physiol. Behav. 2008, 95, 118–124. [Google Scholar] [CrossRef] [Scilit] [PubMed]
- Spahn, J.M.; Callahan, E.H.; Spill, M.K.; Wong, Y.P.; Benjamin-Neelon, S.E.; Birch, L.; Black, M.M.; Cook, J.T.; Faith, M.S.; Mennella, J.A.; et al. Influence of maternal diet on flavor transfer to amniotic fluid and breast milk and children’s responses: A systematic review. Am. J. Clin. Nutr. 2019, 109, 1003S–1026S. [Google Scholar] [CrossRef] [Scilit] [PubMed]
- Beauchamp, G.K.; Mennella, J.A. Early flavor learning and its impact on later feeding behavior. J. Pediatr. Gastroenterol. Nutr. 2009, 48, S25–S30. [Google Scholar] [CrossRef] [Scilit] [PubMed]
- Mottram, D.S. Flavour formation in meat and meat products: A review. Food Chem. 1998, 62, 415–424. [Google Scholar] [CrossRef] [Scilit]
- Lévy, F.; Badonnel, K.; Bertin, A.; Cornilleau, F.; Durieux, D.; Meurisse, M.; Nowak, R.; Parias, C.; Persuy, M.A.; Baly, C. Artificial milk preference of newborn lambs is prenatally influenced by transfer of the flavor from the maternal diet to the amniotic fluid. Physiol. Behav. 2020, 227, 113166. [Google Scholar] [CrossRef] [Scilit] [PubMed]
- Van Boekel, M.A.J.S. Formation of flavour compounds in the Maillard reaction. Biotechnol. Adv. 2006, 24, 230–233. [Google Scholar] [CrossRef] [Scilit] [PubMed]
- Spanier, A.M.; Edwards, J.V.; Dupont, B. The Maillard reaction and its role in the formation of meat flavor. Food Chem. 1990, 37, 125–136. [Google Scholar]
- Brown, A.J.; Goldsworthy, S.M.; Barnes, A.A.; Eilert, M.M.; Tcheang, L.; Daniels, D.; Muir, A.I.; Wigglesworth, M.J.; Kinghorn, I.; Fraser, N.J.; et al. The orphan G protein-coupled receptors GPR41 and GPR43 are activated by propionate and other short chain carboxylic acids. J. Biol. Chem. 2003, 278, 11312–11319. [Google Scholar] [CrossRef] [Scilit] [PubMed]
- Kuang, D.; Hanchate, N.K.; Lee, C.-Y.; Heck, A.; Ye, X.; Erdenebileg, M.; Mehta, C.; Hassan, M.M.; Setty, M.; Buck, L.B. Olfactory inputs to appetite neurons in the hypothalamus. Proc. Natl. Acad. Sci. USA 2026, 123, e2524926123. [Google Scholar] [CrossRef] [Scilit] [PubMed]
- Stark, R. The olfactory bulb: A neuroendocrine spotlight on feeding and metabolism. J. Neuroendocrinol. 2024, 36, e13382. [Google Scholar] [CrossRef] [Scilit] [PubMed]
- Sohn, J.-W.; Elmquist, J.K.; Williams, K.W. Neuronal circuits that regulate feeding behavior and metabolism. Trends Neurosci. 2013, 36, 504–512. [Google Scholar] [CrossRef] [Scilit] [PubMed]
- Thomou, T.; Mori, M.A.; Dreyfuss, J.M.; Konishi, M.; Sakaguchi, M.; Wolfrum, C.; Rao, T.N.; Winnay, J.N.; Garcia-Martin, R.; Grinspoon, S.K.; et al. Adipose-derived circulating miRNAs regulate gene expression in other tissues. Nature 2017, 542, 450–455. [Google Scholar] [CrossRef] [Scilit] [PubMed]
- Lovell, K.L.; Sprecher, D.J.; Ames, N.K.; Jones, M.Z. Development and efficacy of ultrasound-guided fetal fluid aspiration techniques for prenatal diagnosis of caprine β-mannosidosis. Theriogenology 1995, 44, 517–527. [Google Scholar] [CrossRef] [Scilit] [PubMed]
- Prestes, N.C.; Chalhoub, M.C.L.; Lopes, M.D.; Takahira, R.K. Amniocentesis and biochemical evaluation of amniotic fluid in ewes at 70, 100 and 145 days of pregnancy. Small Rumin. Res. 2001, 39, 277–281. [Google Scholar] [CrossRef] [Scilit] [PubMed]
- Fernandes, S.R.; de Freitas, J.A.; de Souza, D.F.; Kowalski, L.H.; Dittrich, R.L.; Rossi Junior, P.; da Silva, C.J.A. Serum lipid profile in the assessment of energy metabolism in ruminants. Veterinária Notícias 2012, 18, 21–32. [Google Scholar]
- DB15/T 3264—2023; Animal Welfare Standard for Sheep. Inner Mongolia Autonomous Region Administration for Market Regulation: Hohhot, China, 2023.
- GB/T 39760—2021; Laboratory Animal—Guidelines for Euthanasia. Standards Press of China: Beijing, China, 2021.
- Kataoka, H.; Lord, H.L.; Pawliszyn, J. Applications of solid-phase microextraction in food analysis. J. Chromatogr. A 2000, 880, 35–62. [Google Scholar] [CrossRef] [Scilit] [PubMed]
- Pawliszyn, J. Handbook of Solid Phase Microextraction; Chemical Industry Press: Beijing, China, 2009. [Google Scholar]
- GB 23200.8—2016; National Food Safety Standards—Determination of 500 Pesticides and Related Chemicals Residues in Fruits and Vegetables—Gas Chromatography-Mass Spectrometry. Standards Press of China: Beijing, China, 2016.
- Zhang, A.; Dai, Q.; Zu, W.; Wang, H.; Lv, P.; Zhang, C.; Jia, X.; Xue, Y.; Zhao, Y.-K.; Deng, Y.; et al. Volatile metabolomics reveals the regulation mechanisms of aroma formation in Scutellaria baicalensis Georgi herbal under different roasting methods. Food Chem. X 2026, 34, 103668. [Google Scholar] [CrossRef] [Scilit] [PubMed]
- Reineccius, G. Flavoromics: A new nontargeted flavor characterization methodology. J. Agric. Food Chem. 2020, 68, 11593–11594. [Google Scholar]
- Schaal, B.; Marlier, L.; Soussignan, R. Human foetuses learn odours from their pregnant mother’s diet. Chem. Senses 2000, 25, 729–737. [Google Scholar] [CrossRef] [Scilit] [PubMed]
- Hai, P.V.; Everts, H.; Van Tien, D.; Schonewille, J.T.; Hendriks, W.H. Feeding Chromonaela odorata during pregnancy to goat dams affects acceptance of this feedstuff by their offspring. Appl. Anim. Behav. Sci. 2012, 137, 36–43. [Google Scholar] [CrossRef] [Scilit]
- Oostindjer, M.; Bolhuis, J.E.; van den Brand, H.; Roura, E.; Kemp, B. Prenatal flavor exposure affects growth, health and behavior of newly weaned piglets. Physiol. Behav. 2010, 99, 579–586. [Google Scholar] [CrossRef] [Scilit] [PubMed]
- Saito, H.; Chi, Q.; Zhuang, H.; Matsunami, H.; Mainland, J.D. Odor coding by a mammalian receptor repertoire. Sci. Signal. 2009, 2, ra9. [Google Scholar] [CrossRef] [Scilit] [PubMed]
- McGuirk, S.M. Disease management of dairy calves and heifers. Vet. Clin. North Am. Food Anim. Pract. 2008, 24, 139–153. [Google Scholar] [CrossRef] [Scilit] [PubMed]
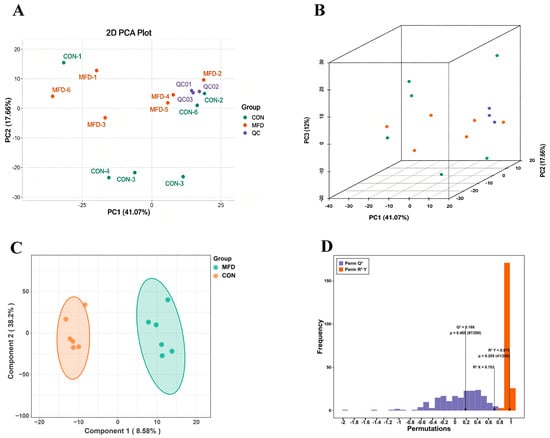
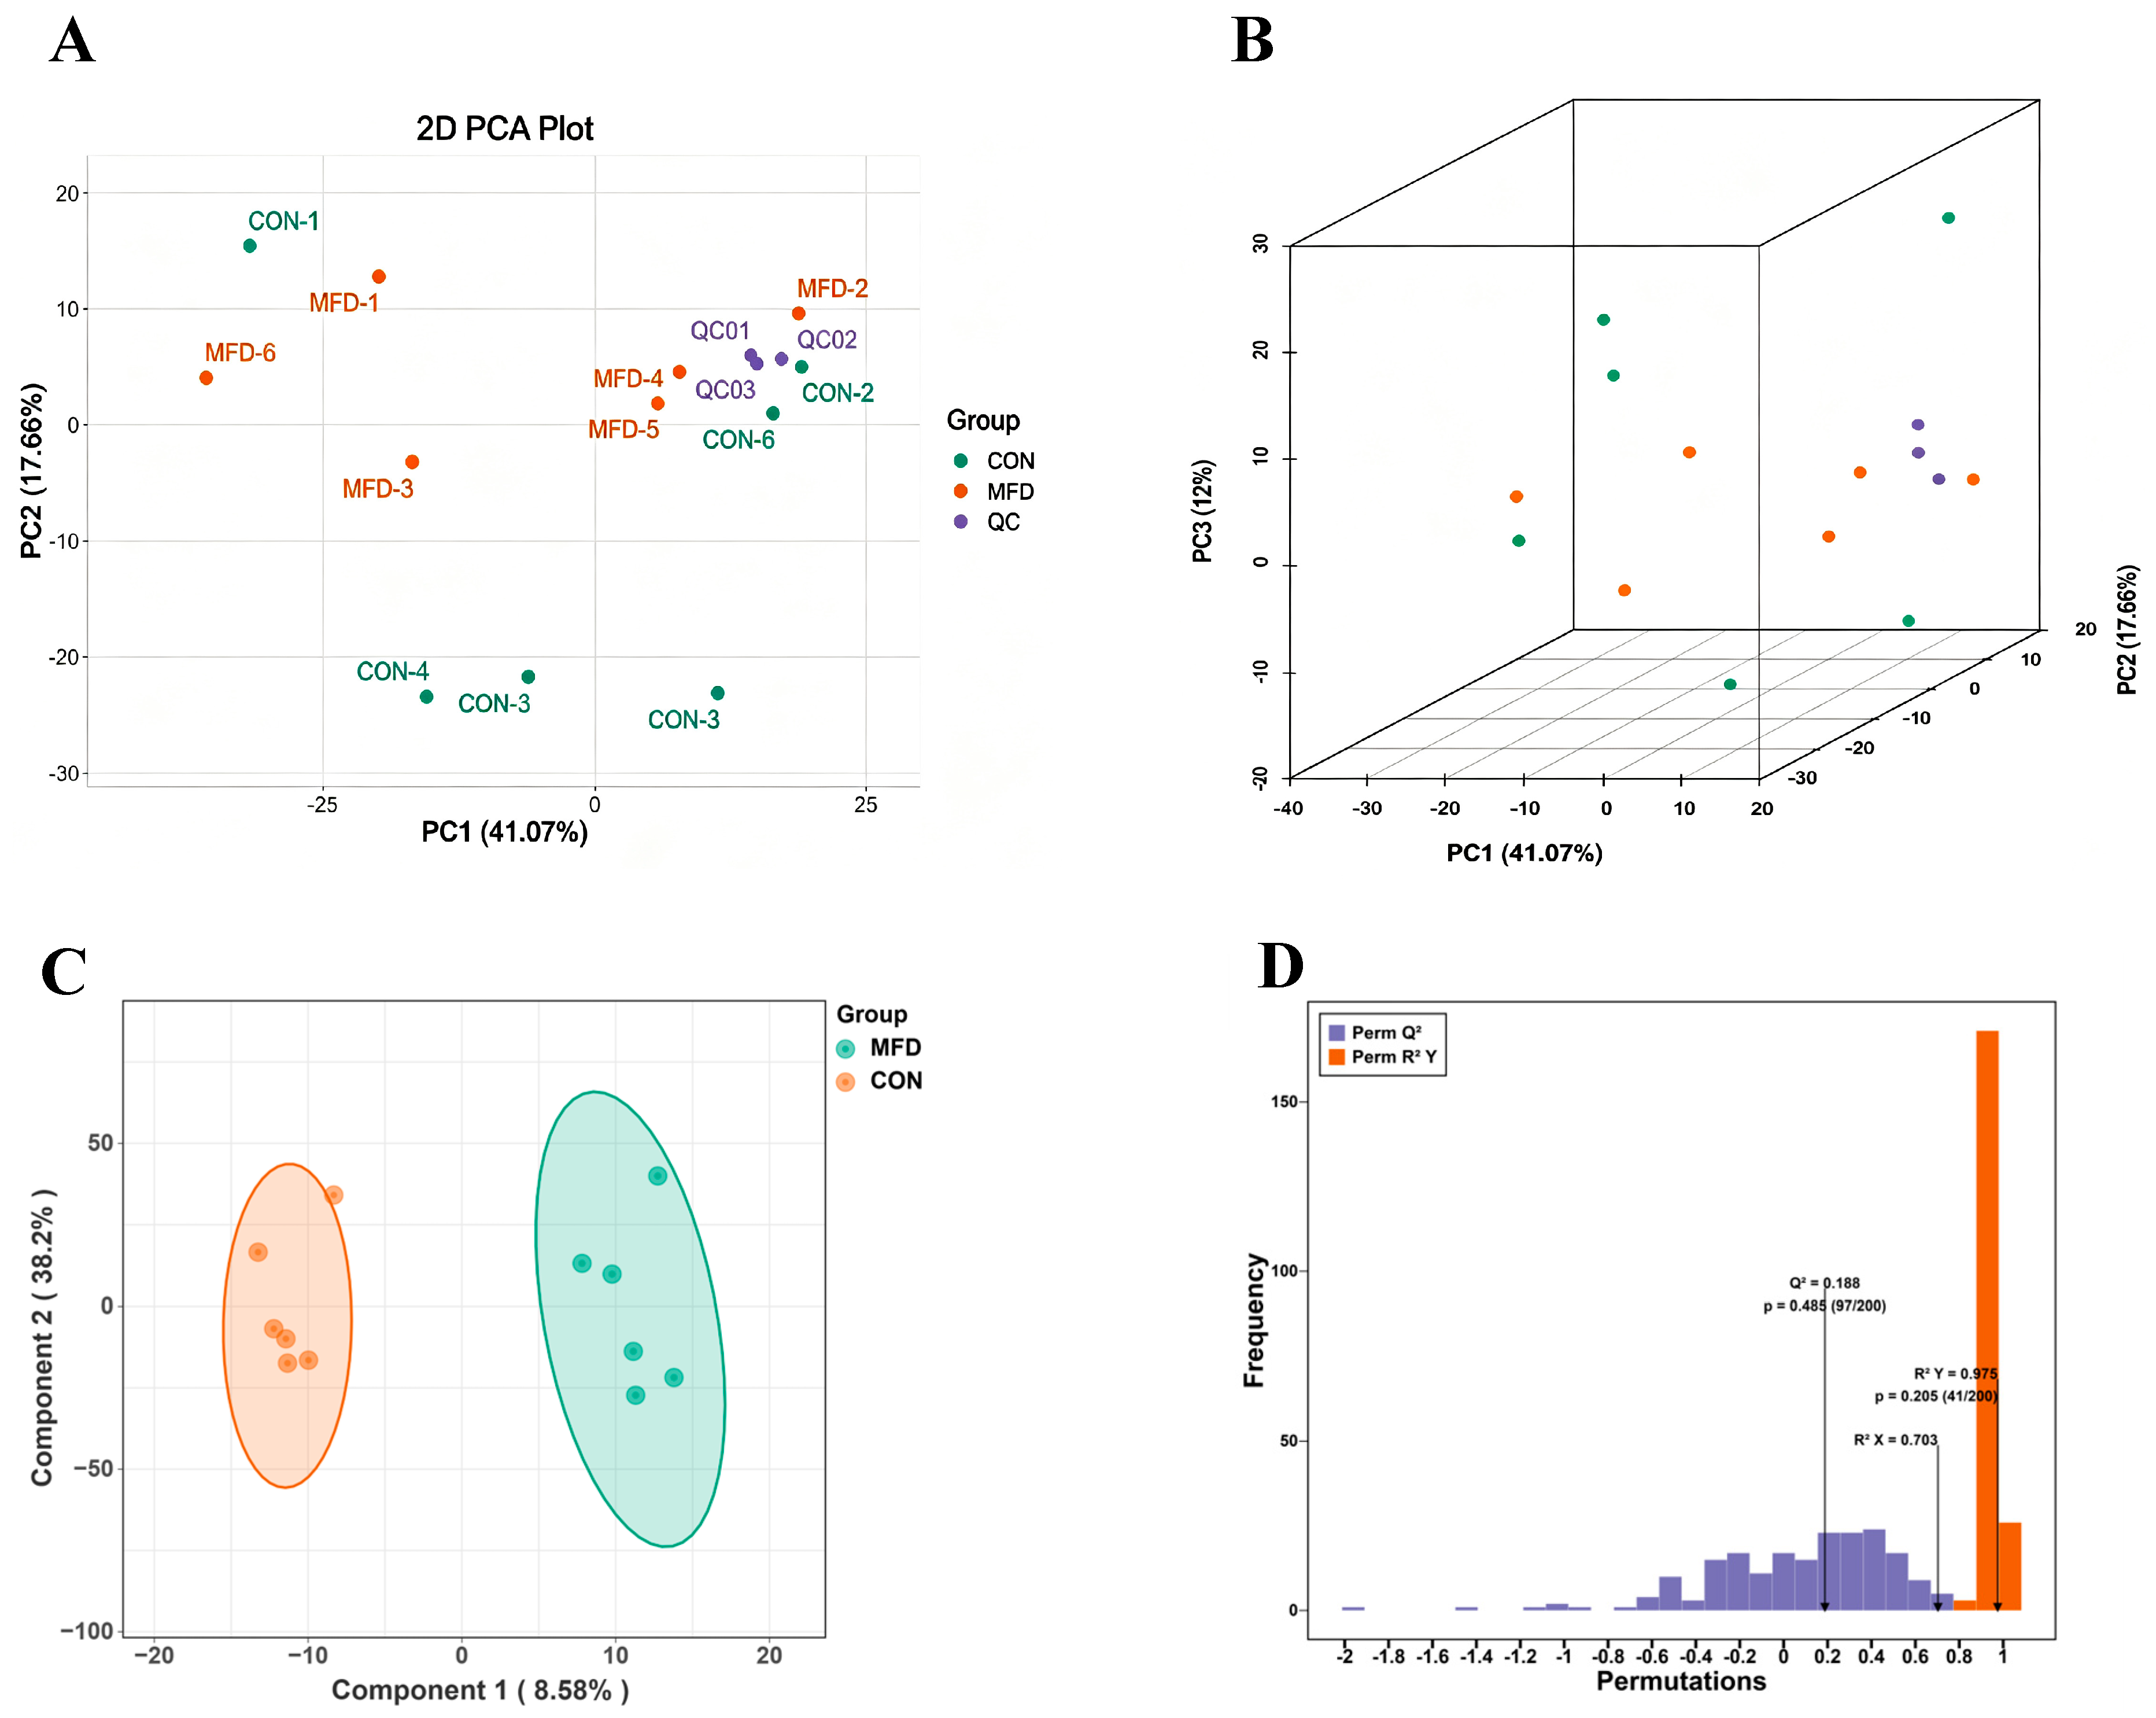
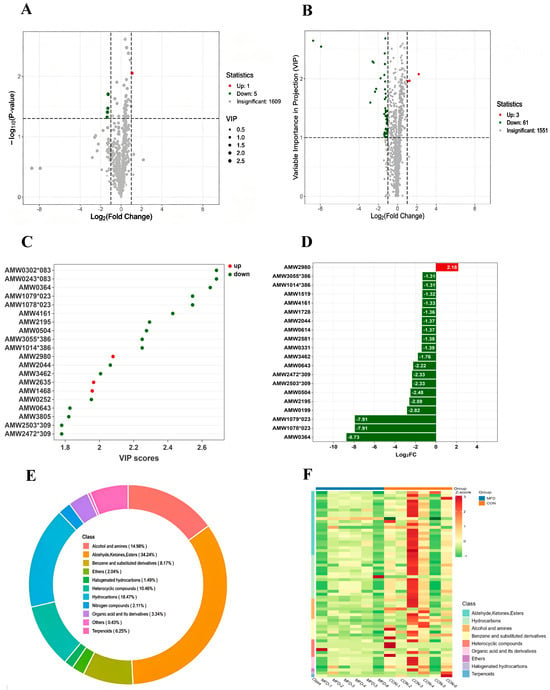
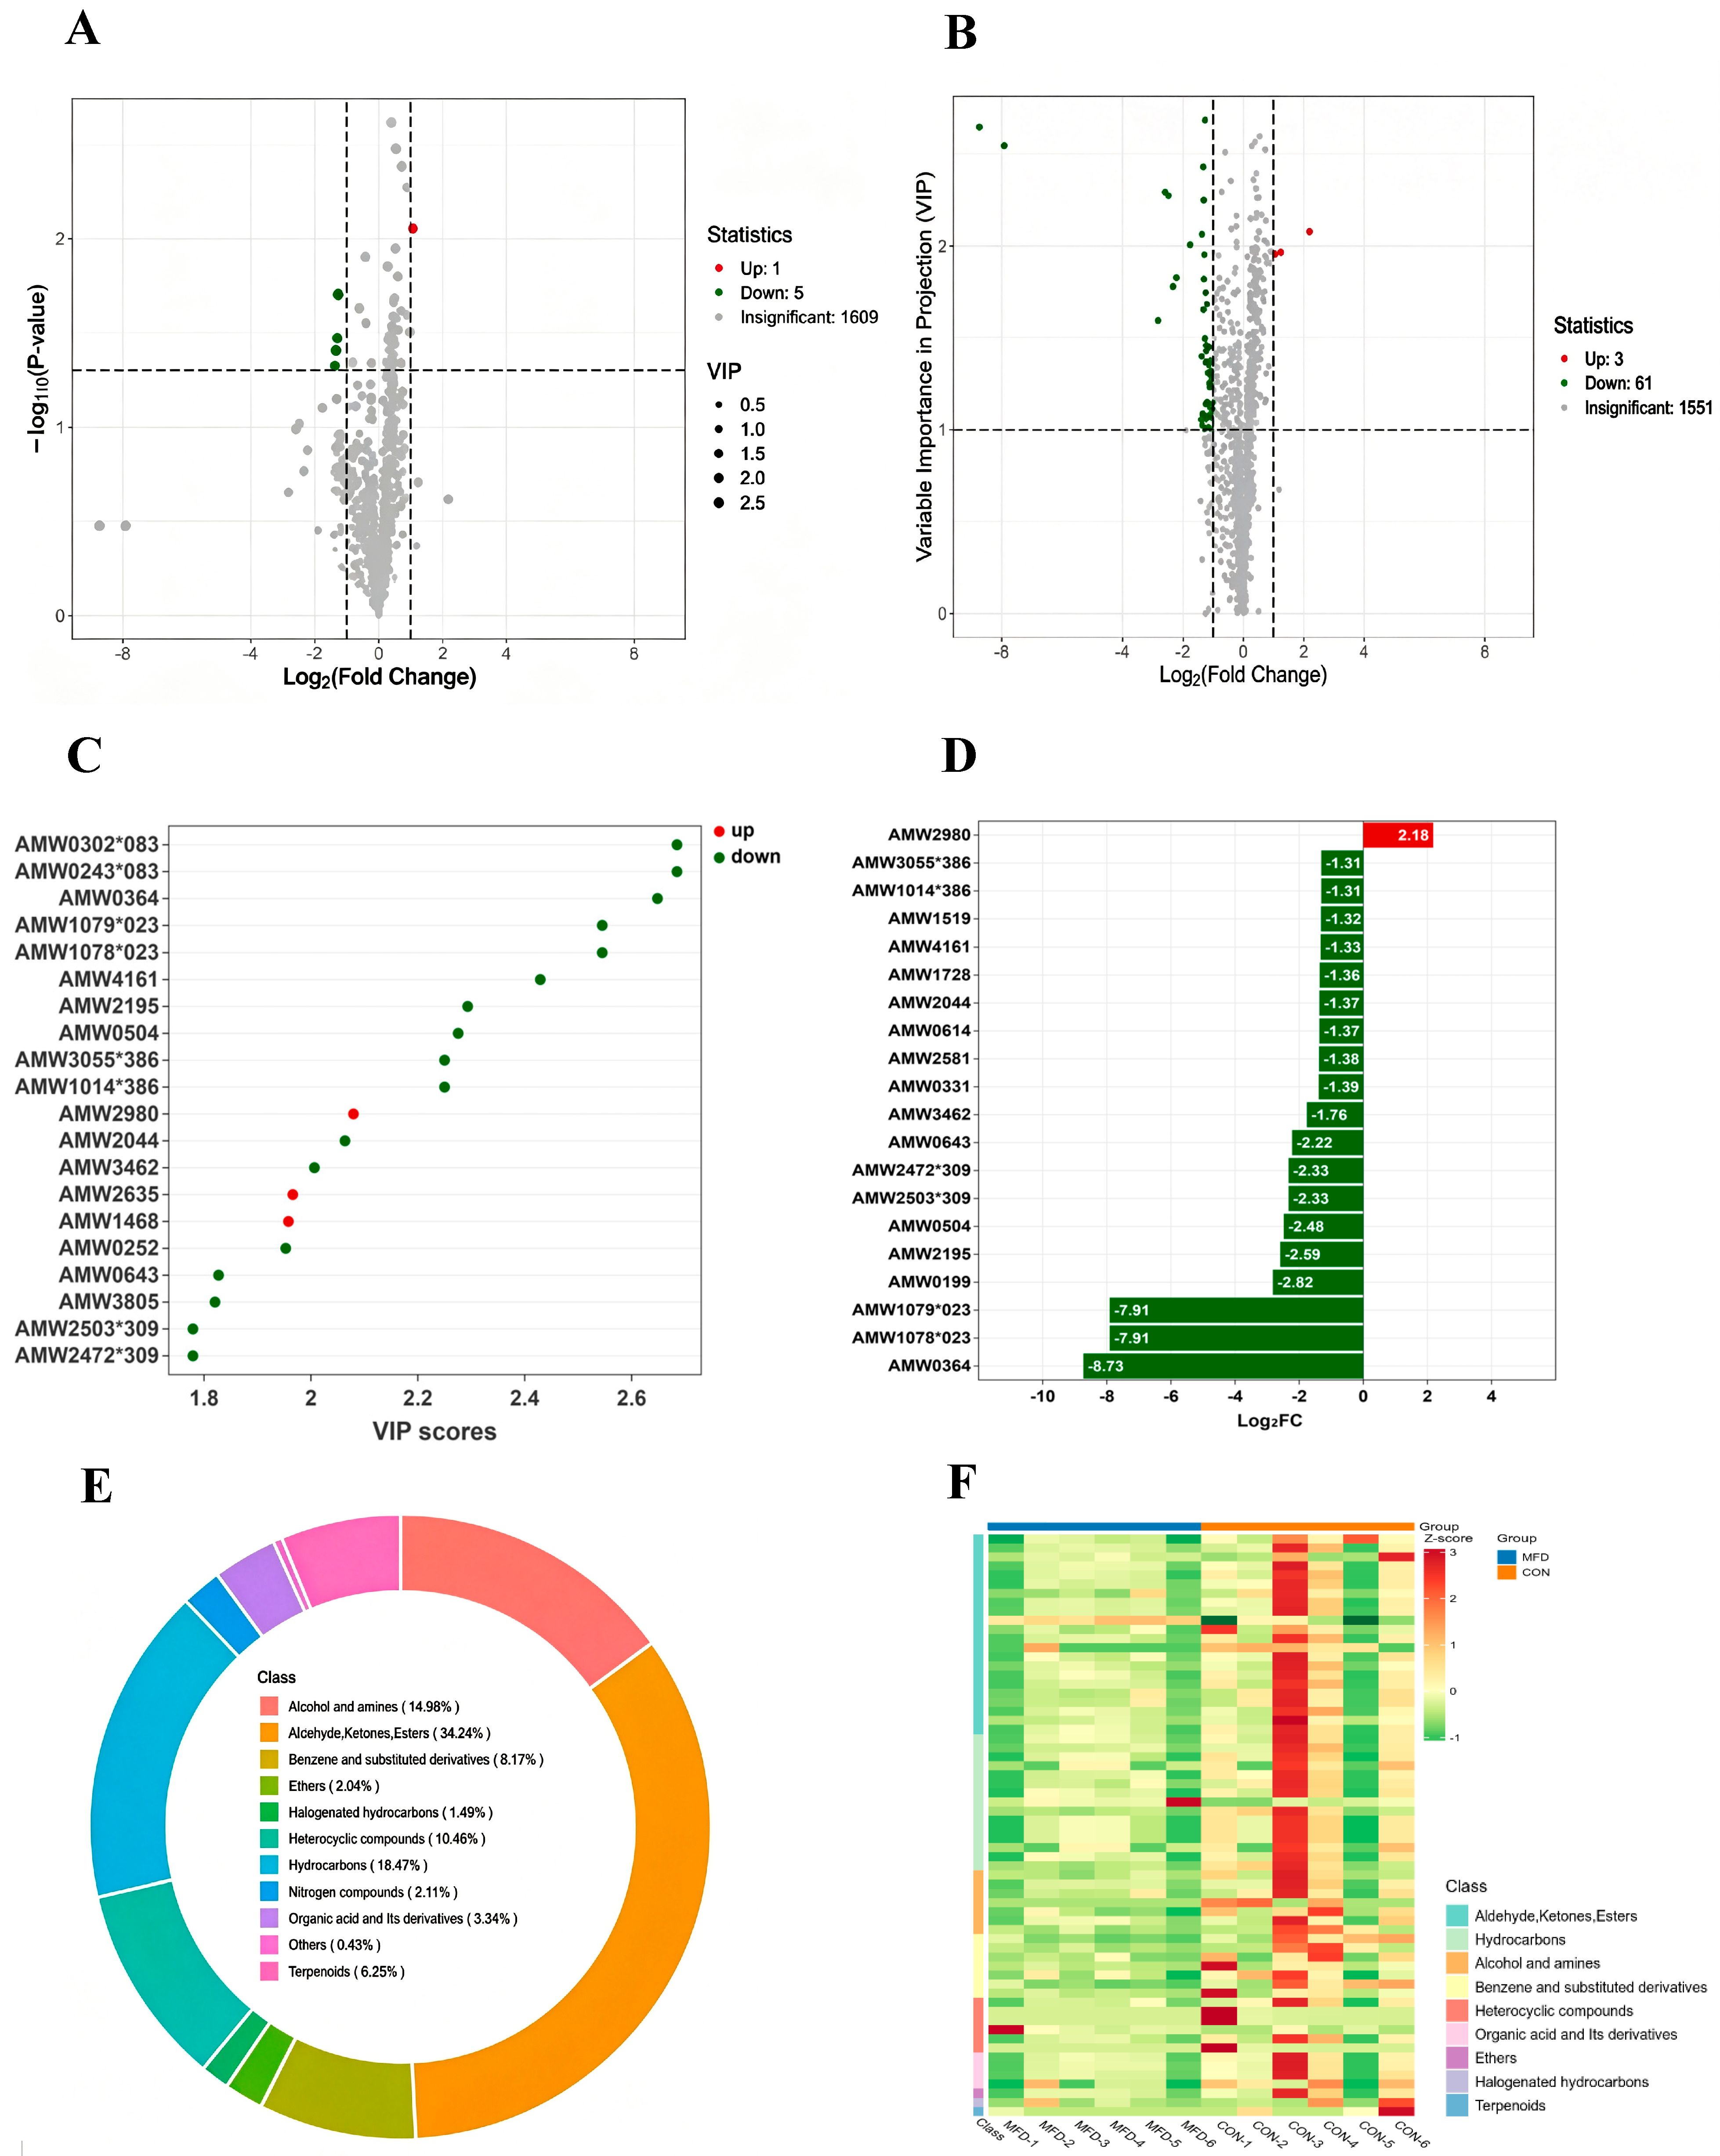
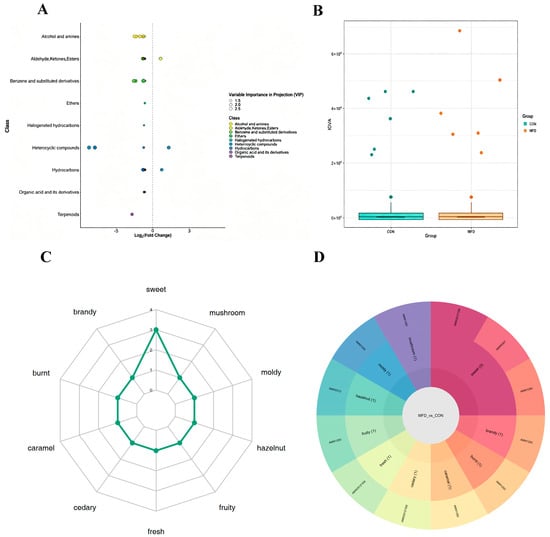
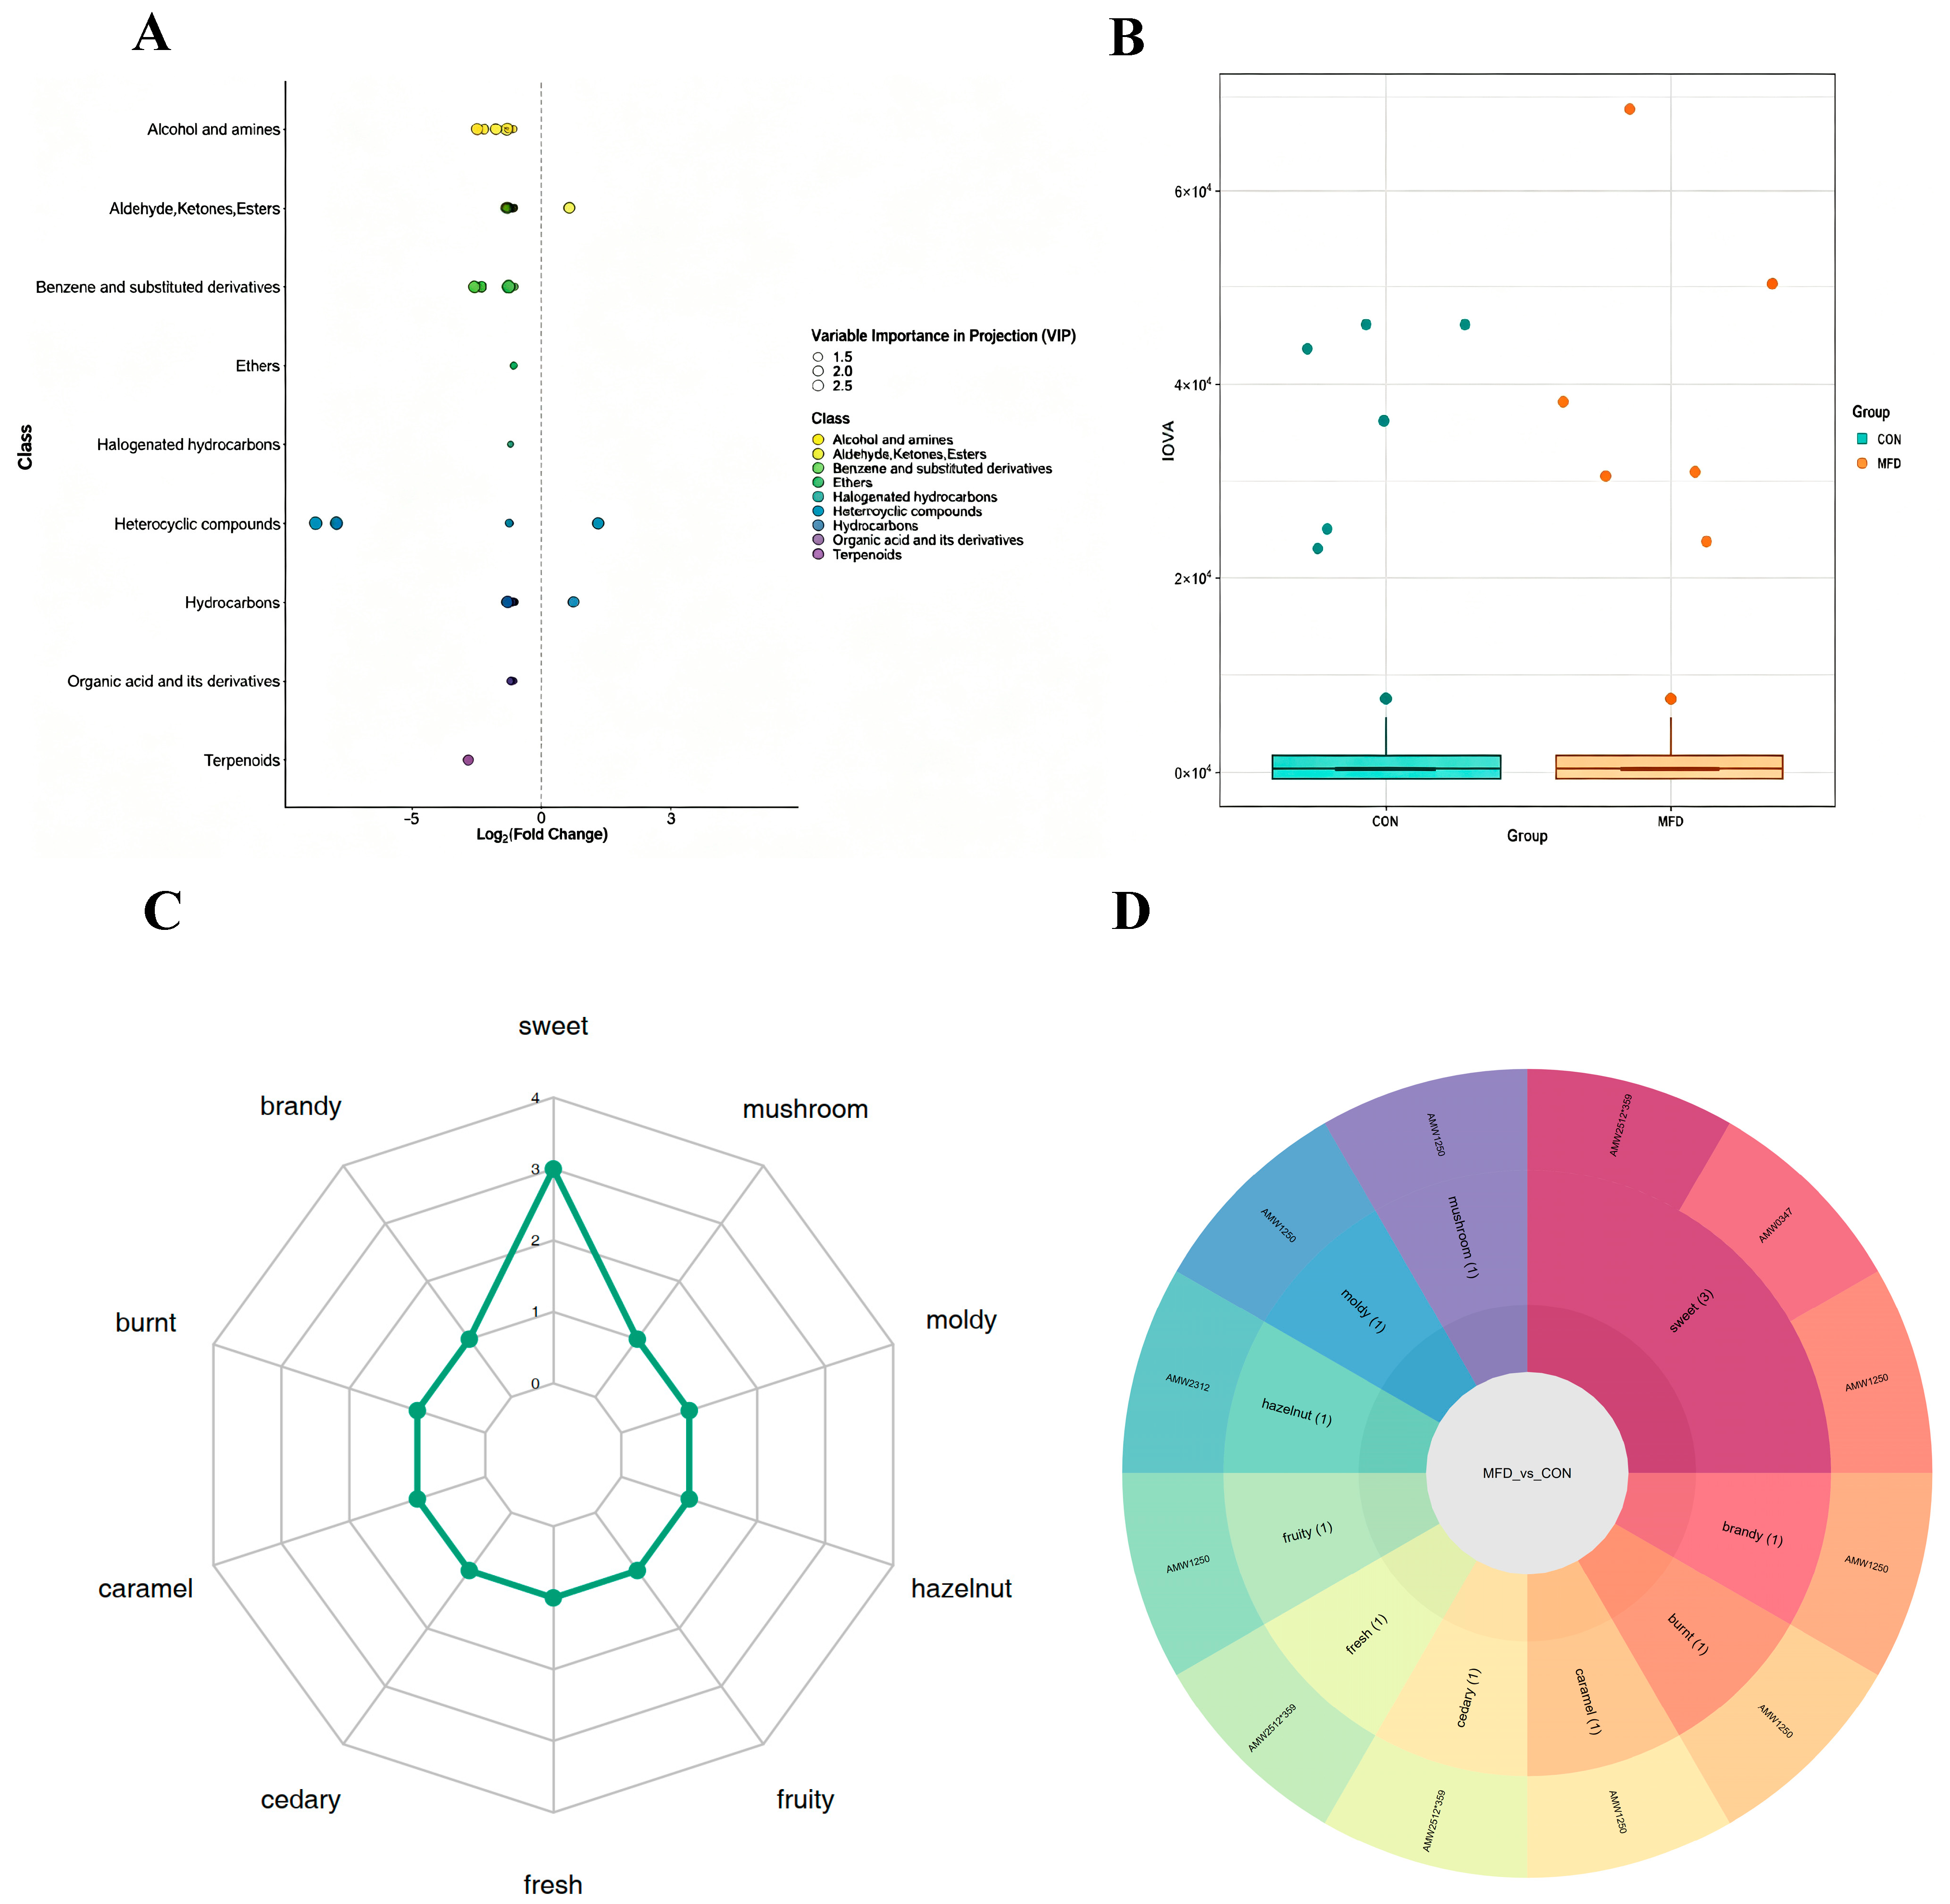
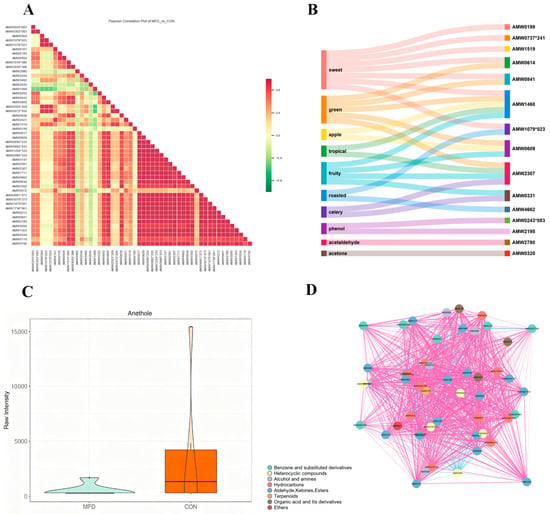
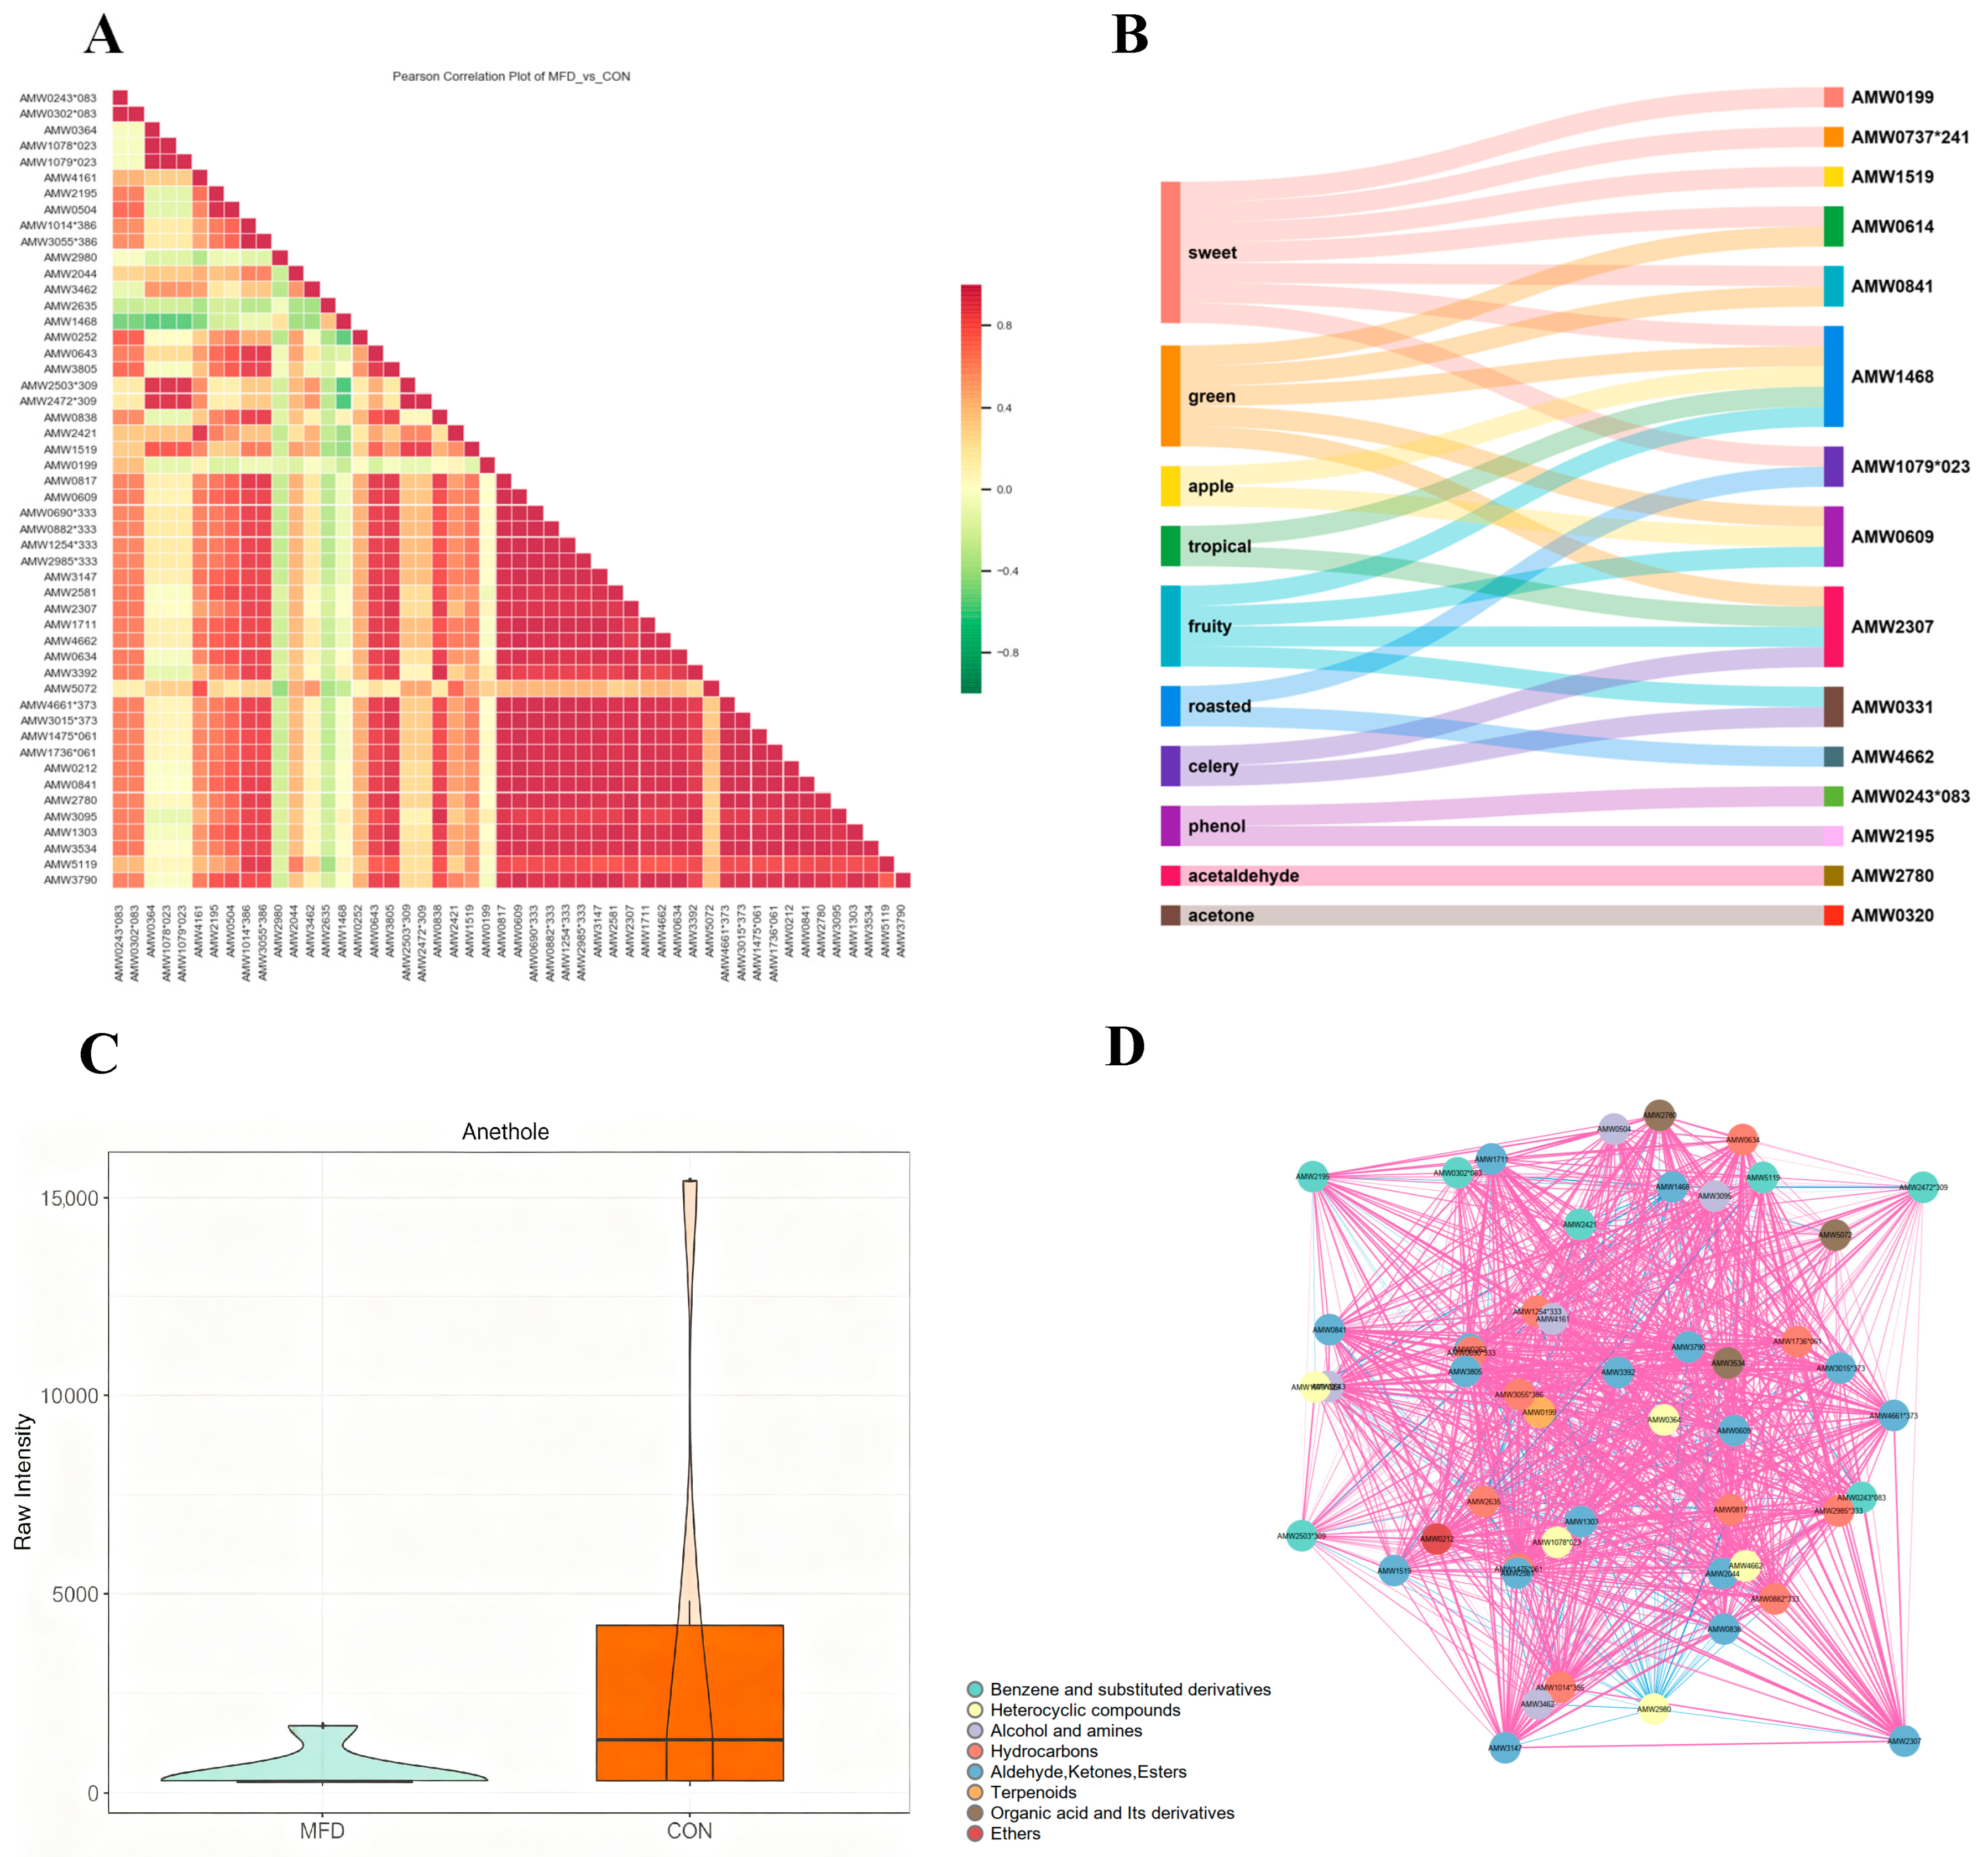
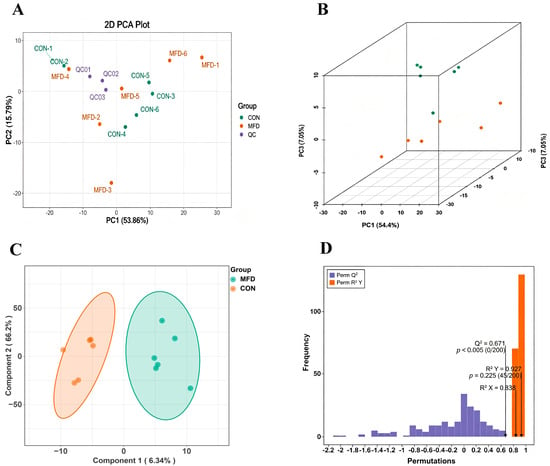
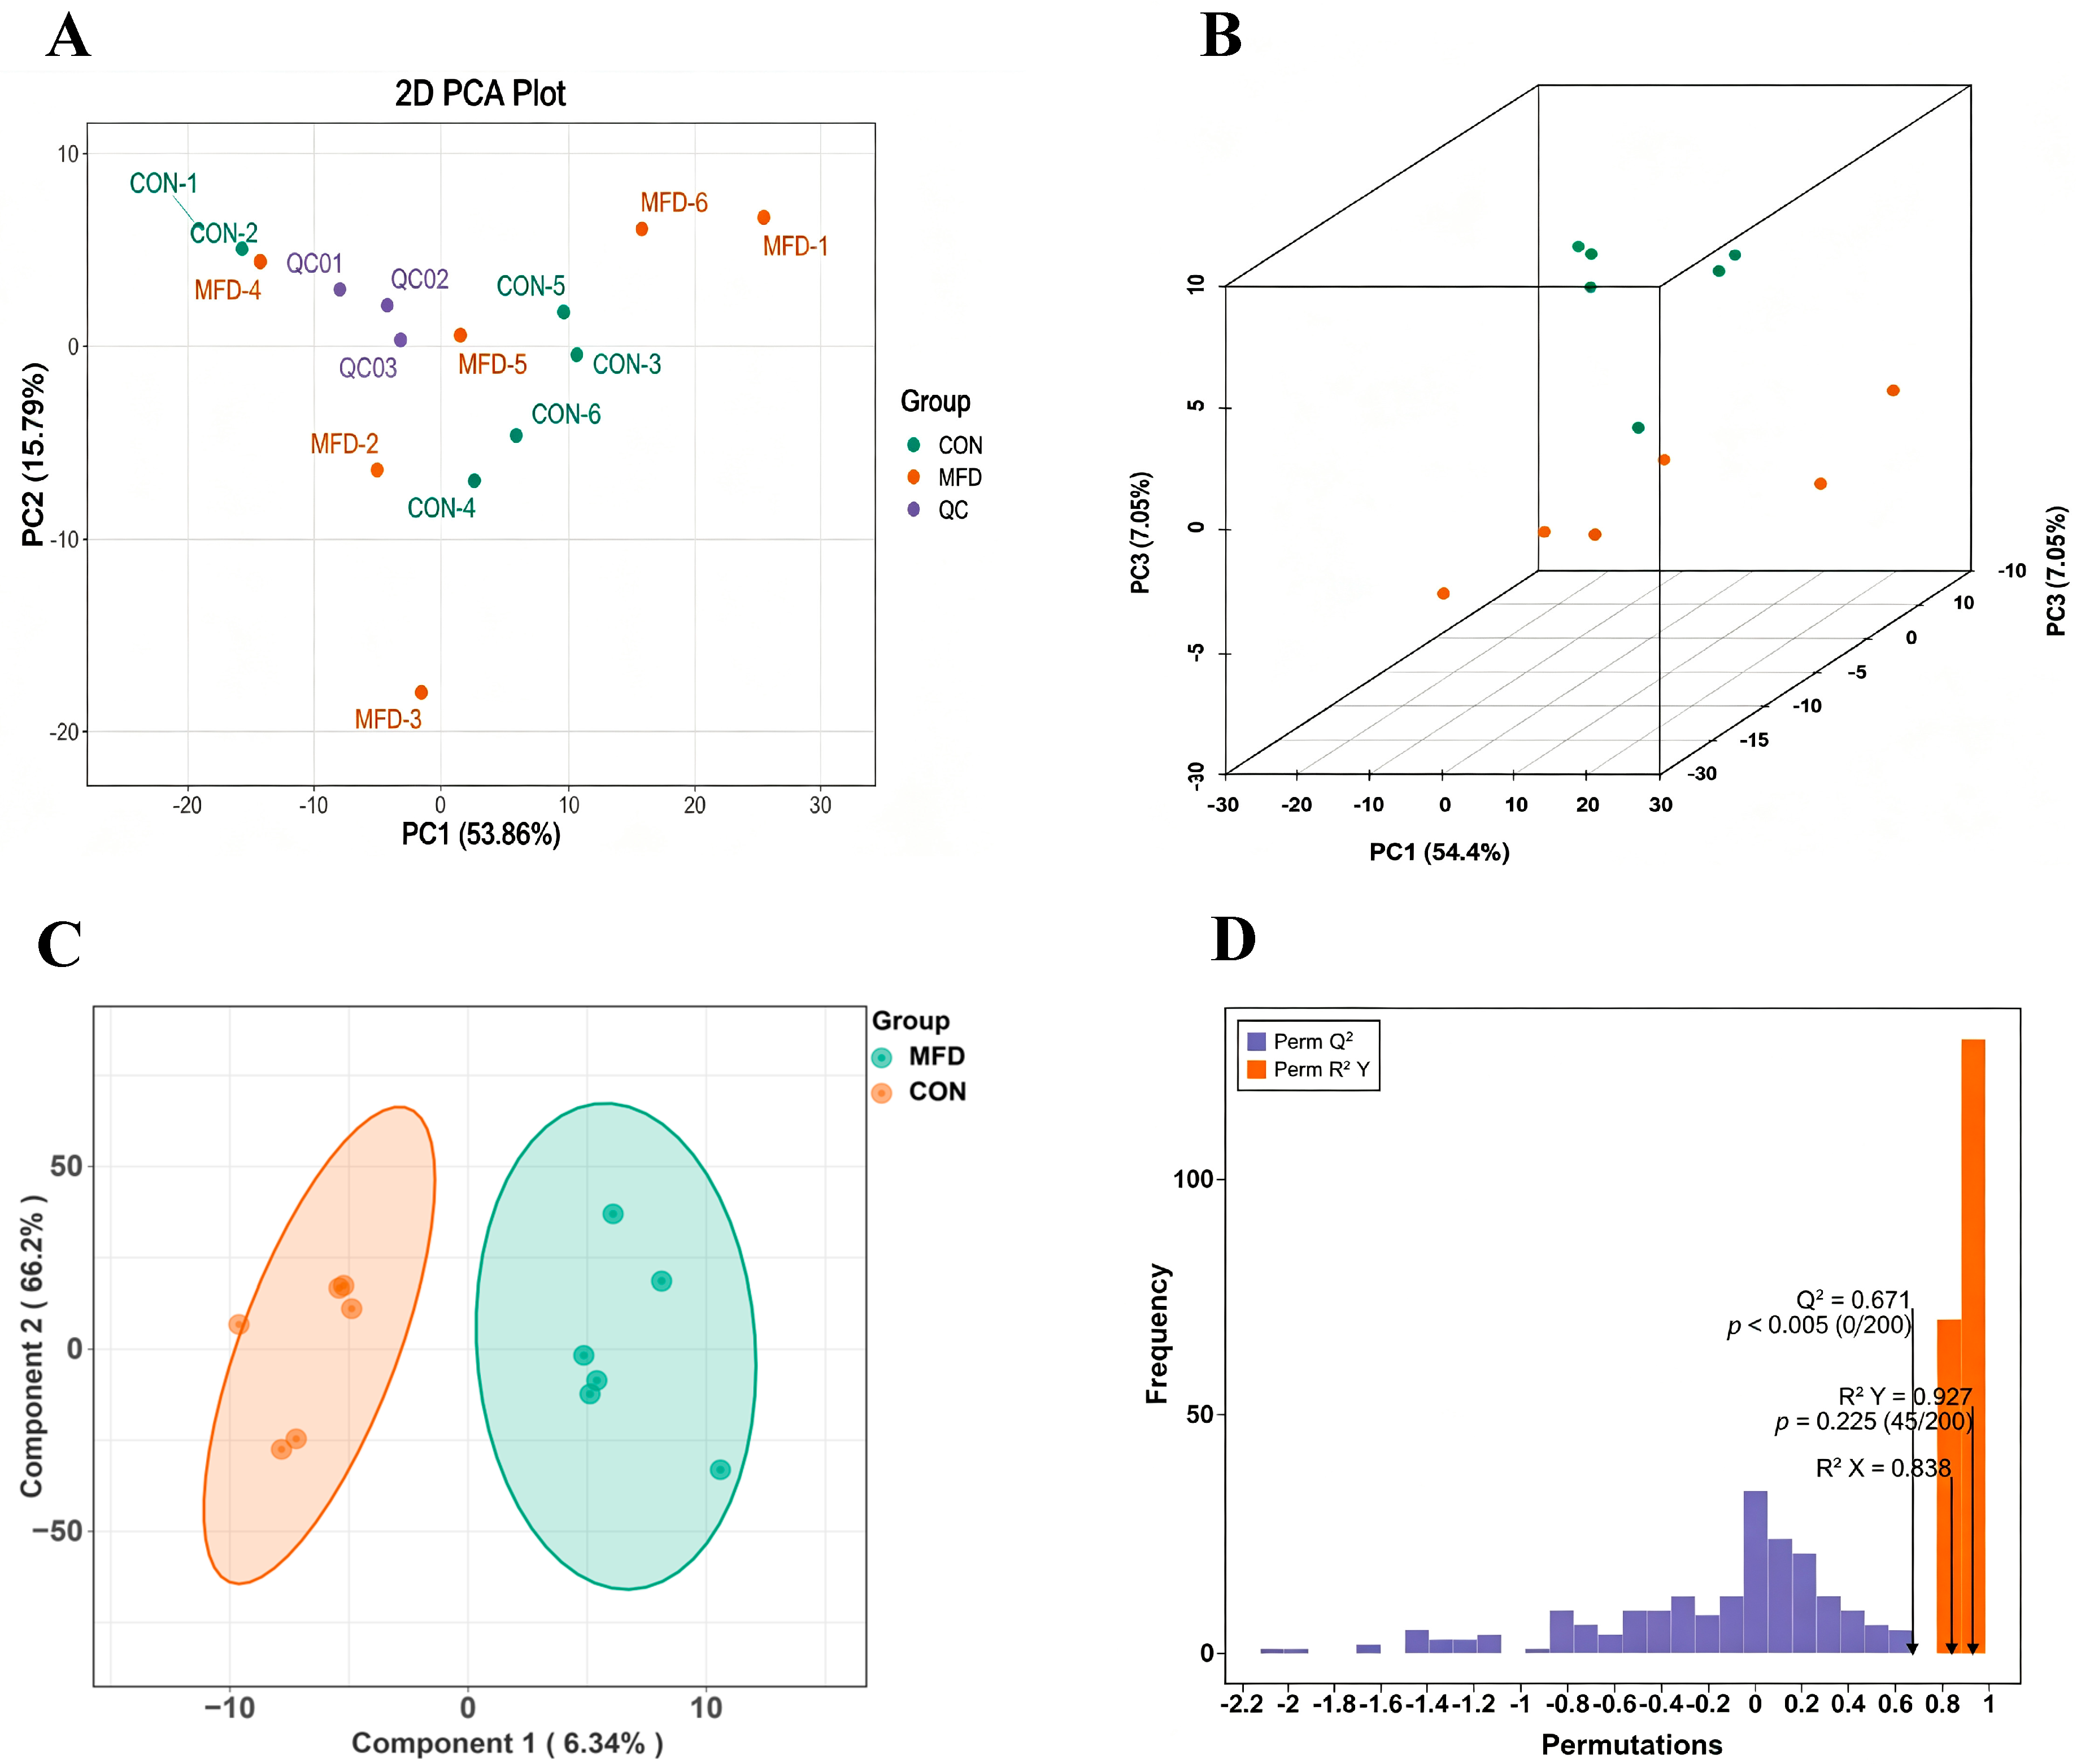
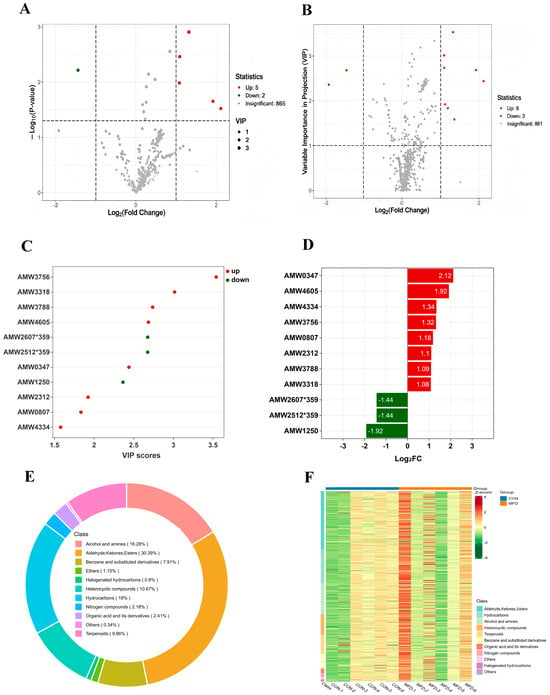
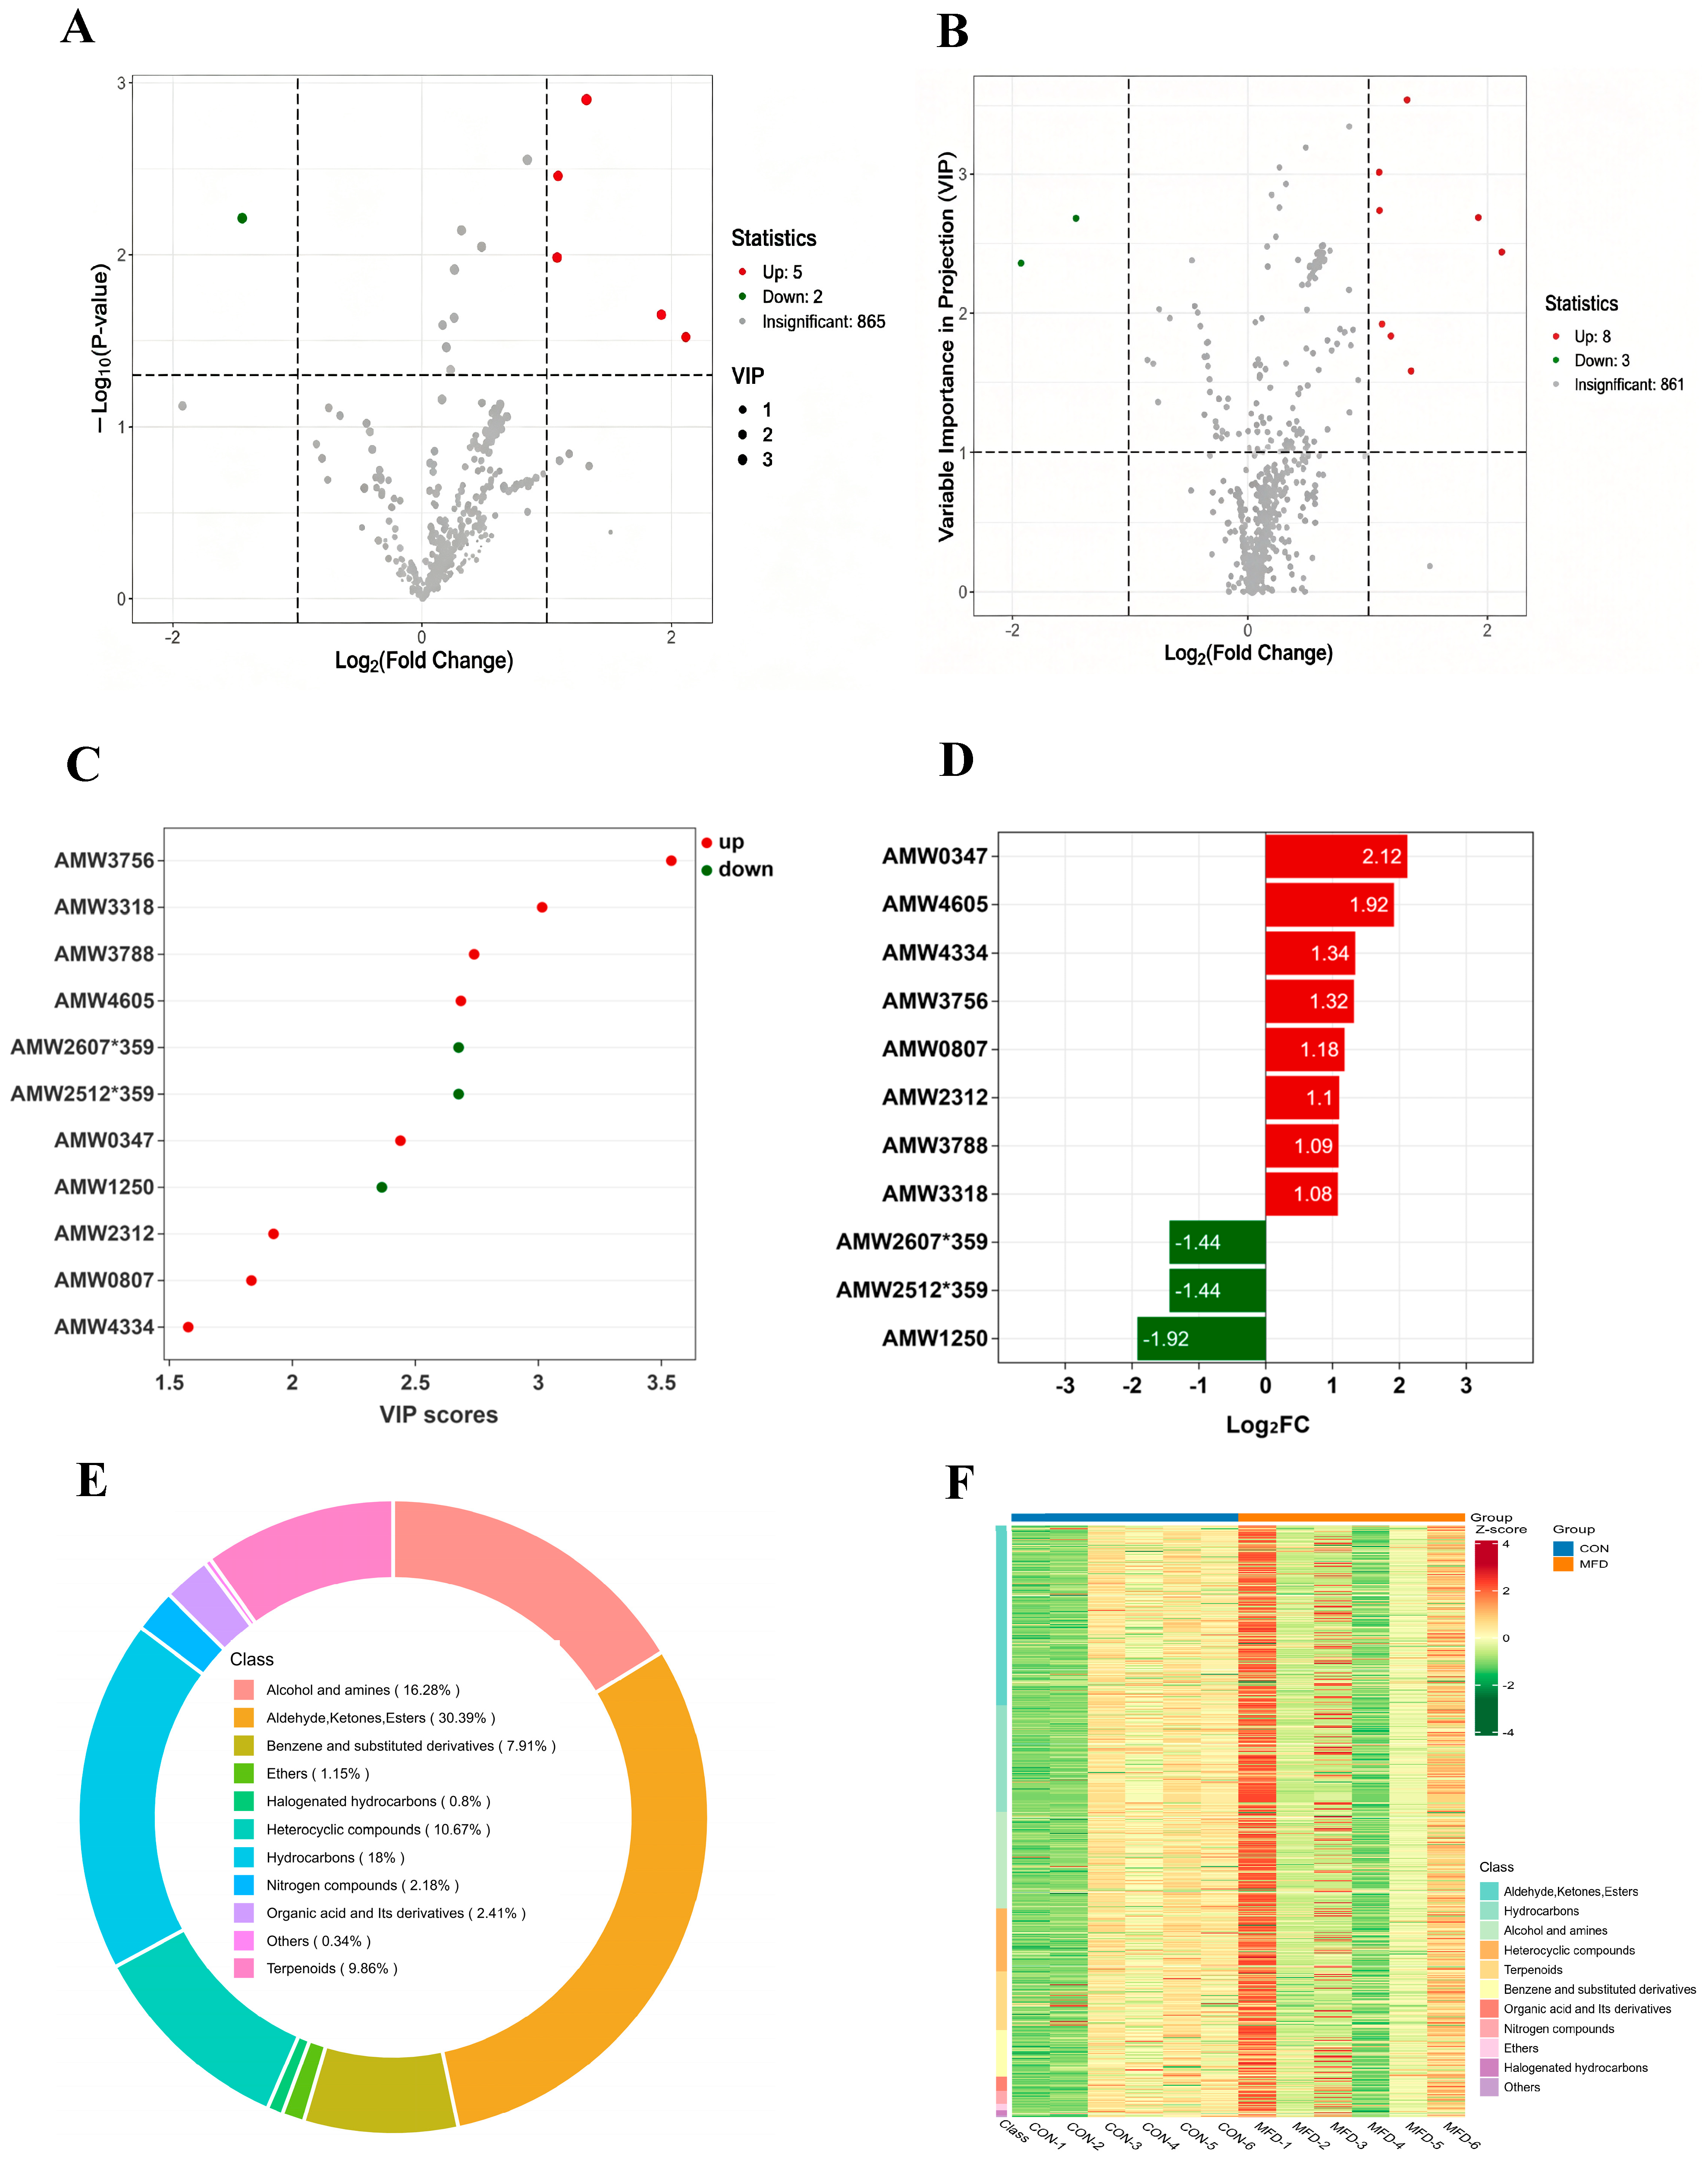
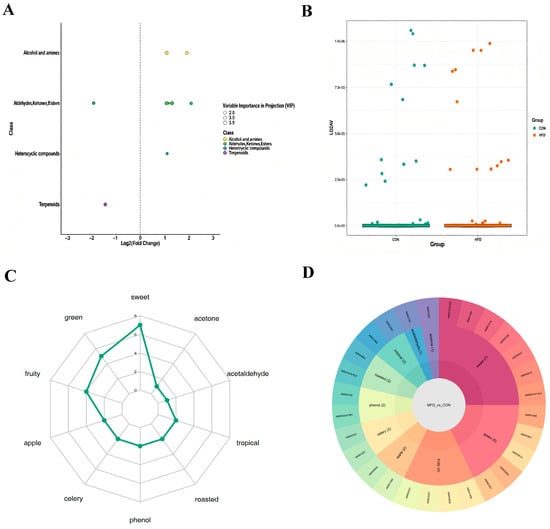
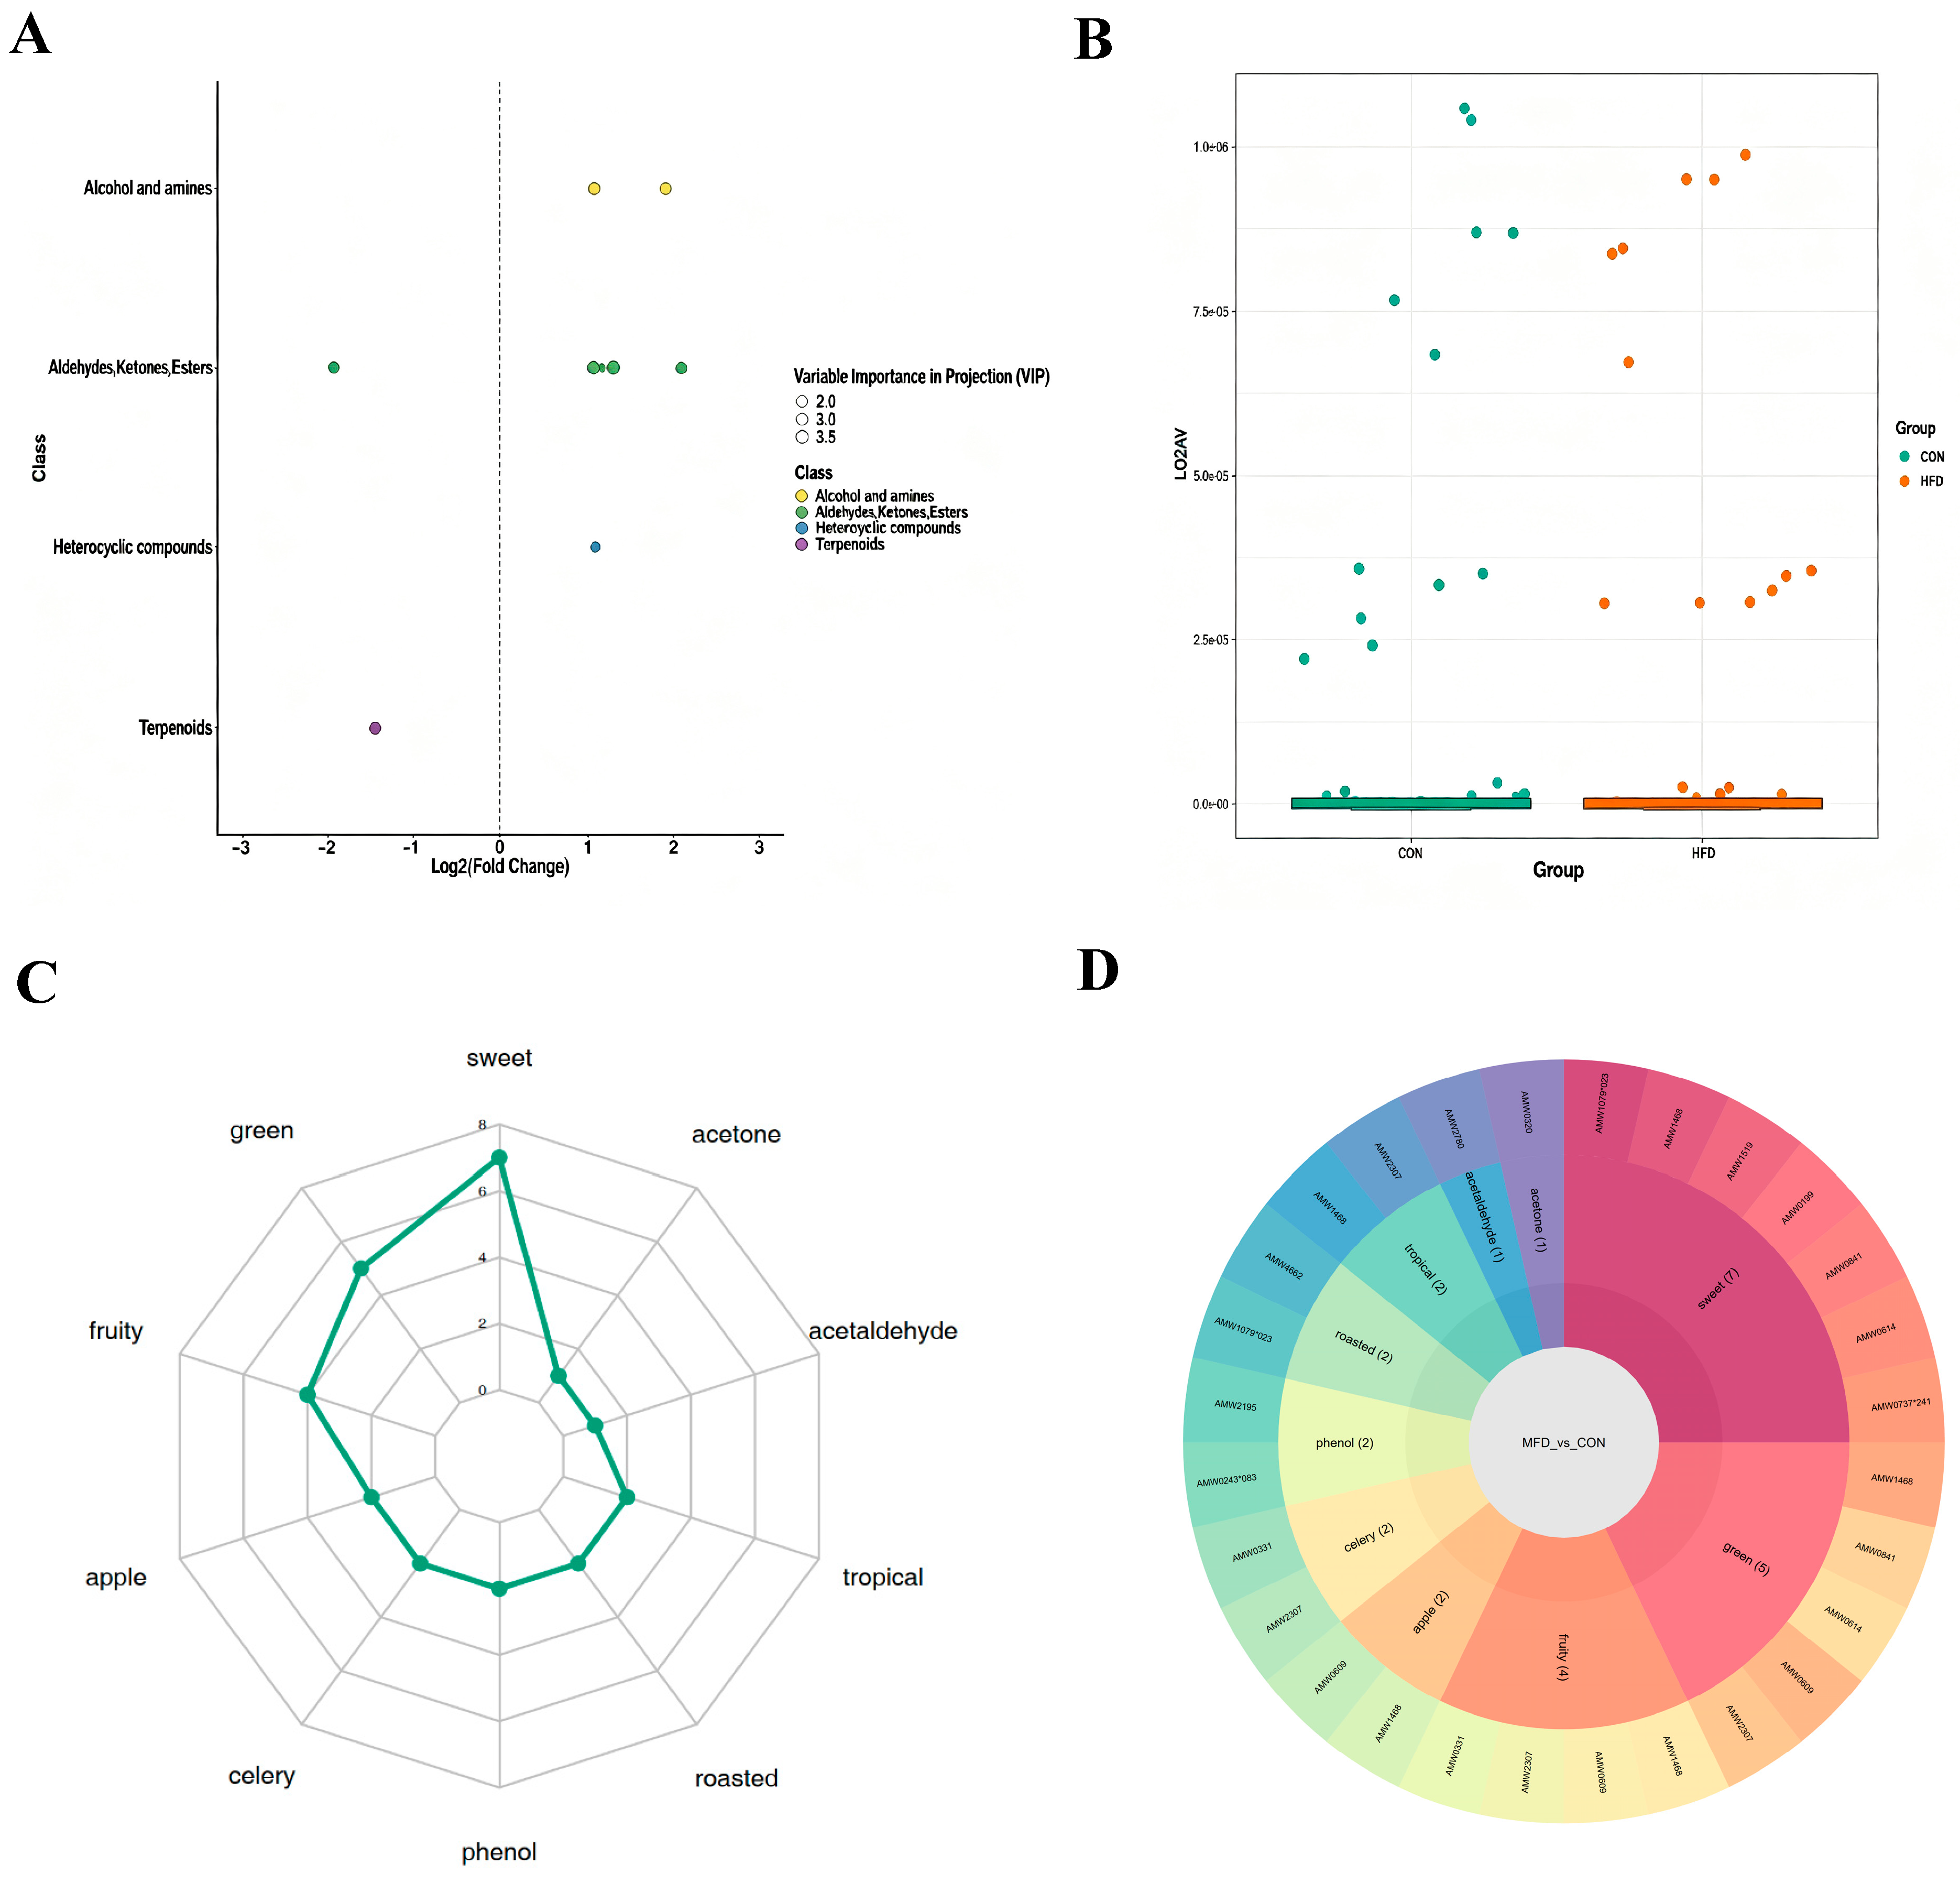
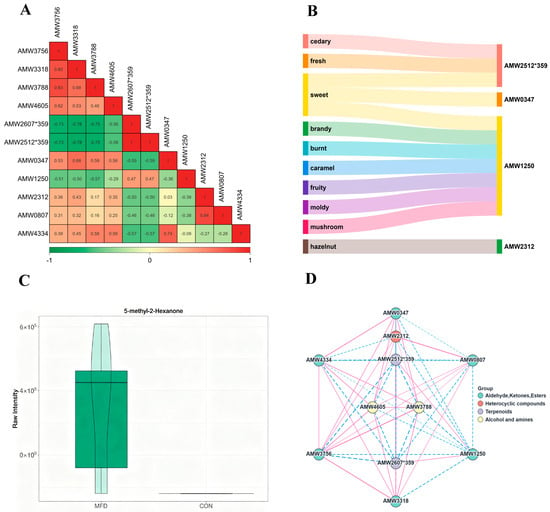
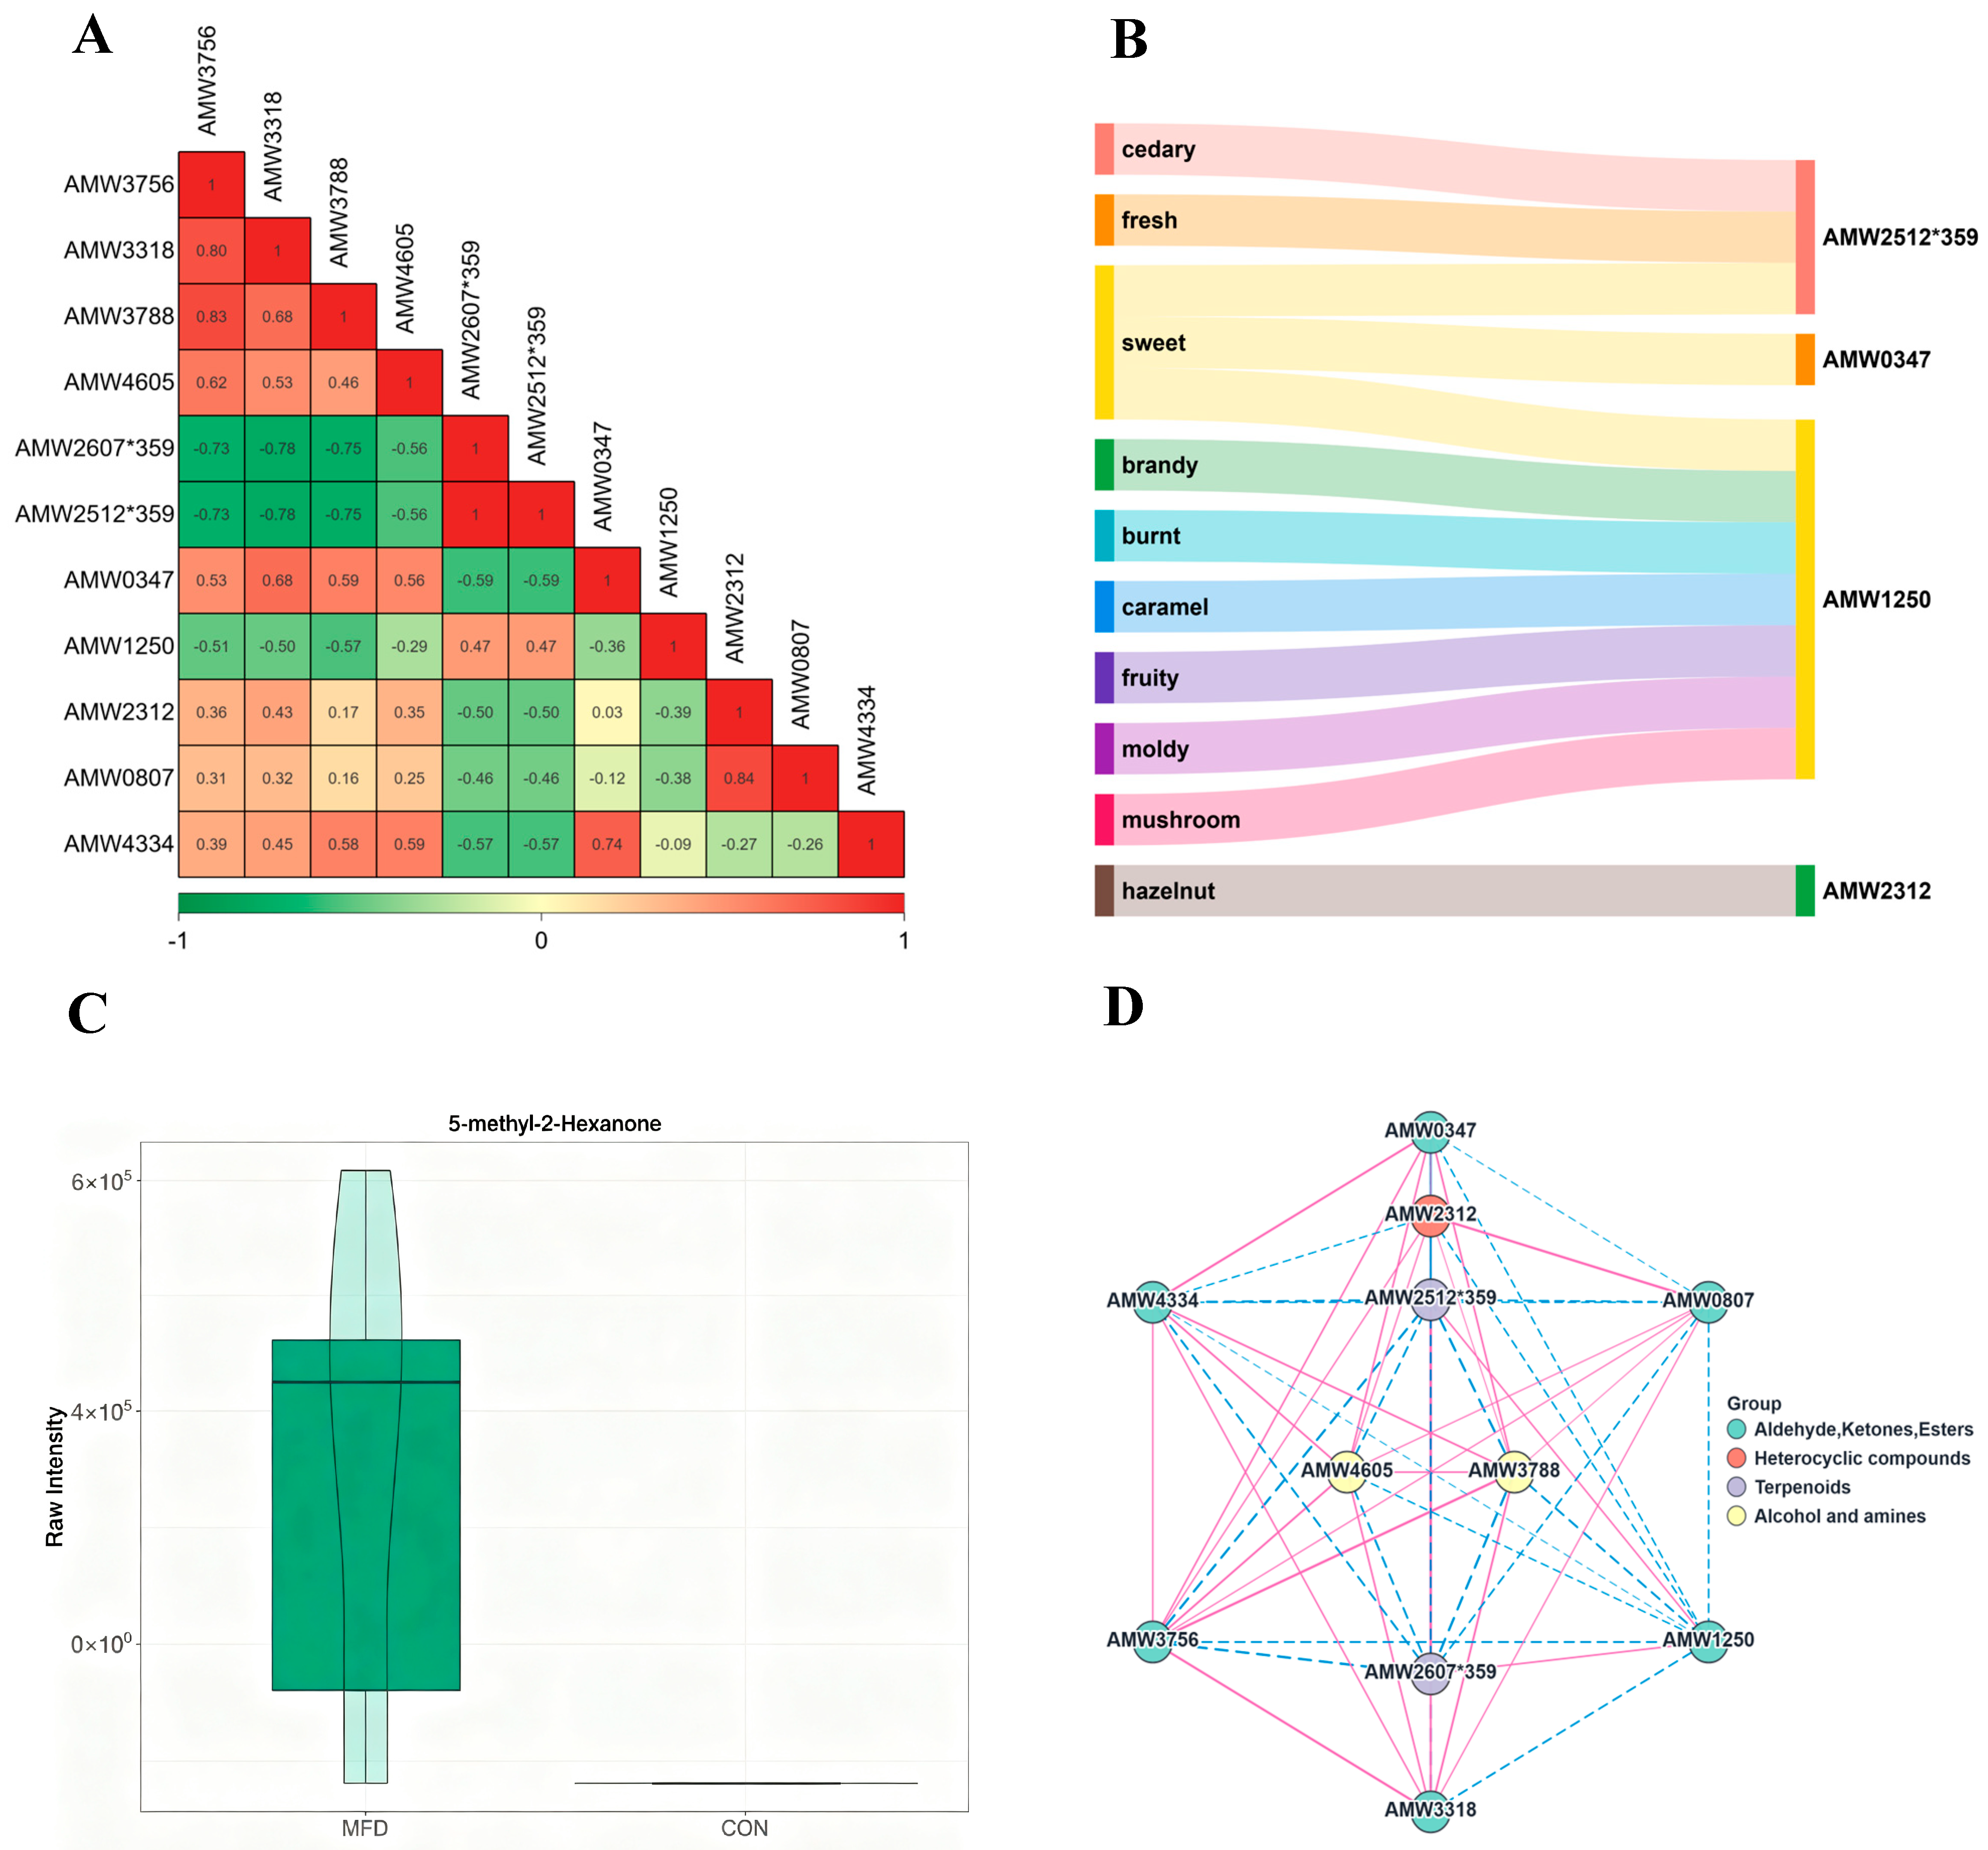

Disclaimer/Publisher’s Note: The statements, opinions and data contained in all publications are solely those of the individual author(s) and contributor(s) and not of MDPI and/or the editor(s). MDPI and/or the editor(s) disclaim responsibility for any injury to people or property resulting from any ideas, methods, instructions or products referred to in the content. |
© 2026 by the authors. Licensee MDPI, Basel, Switzerland. This article is an open access article distributed under the terms and conditions of the Creative Commons Attribution (CC BY) license.