


Simple Summary
As the climate warms, dairy cows increasingly suffer from heat, which lowers milk production. Using three years of hourly temperature and humidity data from four commercial farms in the cool, humid northwest of Spain, combined with routine monthly milk records, we measured how heat affects each cow’s own yield. Mild warmth did no harm, but once heat became intense, the losses rose sharply; the drop appeared within a few days of a hot spell and was no longer detectable after 7 to 10 days, and it was larger when three or more hot days followed one another. Cows in early lactation were the most affected. Even in this cool Atlantic region, well-timed cooling during the hottest periods would help protect milk production as summers get warmer.
Abstract
Heat stress is a growing threat to dairy production as the climate warms, yet its effects in cool, humid regions and the timing of its impact remain poorly characterized. We quantified the within-cow effect of heat load on test-day milk yield in four commercial dairy herds in northwestern Spain, linking hourly in-barn temperature–humidity index (THI) records (2023–2025) to 16,906 monthly test-day records from 1235 cows. Linear mixed models adjusted for year, season and herd-test-day isolated each cow’s own response, and a distributed-lag non-linear model described the shape and timing of the association. A day with a maximum THI of 80 was associated with a cumulative loss of 6.1 kg (95% CI: 2.8–9.3) relative to a thermoneutral day, with an empirical onset near a daily maximum THI of 77. The modeled association was greatest in the first days after exposure and was no longer detectable after 7–10 days. Mild heat (THI 68–71) was not associated with loss, whereas three or more consecutive hot days reduced yield by 1.6 kg and isolated hot days did not. Early- and mid-lactation cows were the most susceptible. Timely cooling interventions targeting persistent heat and early-lactation cows are warranted, even in temperate Atlantic climates.
1. Introduction
Climate change is projected to increase both the average ambient temperature and the frequency and intensity of extreme heat events, posing one of the most pervasive threats to the sustainability of livestock production systems worldwide [1]. Dairy cattle are particularly vulnerable because the high metabolic heat generated by lactation narrows the margin within which the animal can maintain thermal balance [2,3]. As global temperatures rise, the number of days exceeding thermal comfort thresholds is increasing not only in traditionally hot regions but also across the northern United States, Canada, and Europe, making heat stress a growing concern even in temperate dairy areas [4]. The economic dimension of this challenge is substantial: heat stress was estimated to cost the United States dairy industry between US$897 and US$1500 million annually, the largest loss among all animal industries [5].
The temperature–humidity index (THI), which combines dry-bulb temperature and relative humidity into a single value, is the most widely used tool to quantify thermal load in dairy cattle [6,7]. Because temperature and humidity contribute differently to heat load depending on climate, the index that best predicts production losses varies between humid and arid environments, with humidity-weighted indices performing better in humid climates and temperature-weighted indices in dry ones [8]. Using test-day records linked to THI, early work established that milk yield declines once THI exceeds a threshold of approximately 72, at a rate of about 0.2 kg per THI unit [6]. Subsequent studies in high-yielding herds indicated a lower onset of stress, around a daily average THI of 68, reflecting the greater heat sensitivity of modern, high-producing cows [9,10]. Reported thresholds nonetheless vary widely with breed, climate, and the production trait considered, ranging from the mid-60 s to the mid-70 s across studies [6,8,11,12,13].
Several alternative indices have been proposed to capture components of heat load that THI does not consider. The heat load index (HLI) incorporates black-globe temperature, relative humidity and wind speed and was developed for unshaded feedlot cattle exposed to solar radiation [14], and the comprehensive climate index (CCI) further adjusts ambient temperature for solar radiation and wind speed and extends the assessment to cold conditions [15]. At the cold end of the thermal range, the lower critical temperature (LCT) marks the point below which cows must increase metabolic heat production; for high-yielding Holstein cows, it has been estimated to lie below 0 °C [16], so cold stress is unlikely to limit lactating cows housed indoors in an oceanic climate. THI was chosen in the present study because (i) the cows were permanently housed in roofed free-stall barns, where direct solar radiation is negligible and air speed is low, so the additional inputs of HLI and CCI (black-globe temperature, solar radiation and wind speed) contribute little and were not measured; (ii) THI can be computed from the two variables recorded continuously by the barn loggers; (iii) humidity-weighted indices such as the one used here perform well in humid climates [8]; and (iv) THI remains the reference index in dairy cattle, allowing the thresholds obtained here to be compared directly with those reported previously [6,9,11].
The depression of milk yield is the most recognized consequence of heat stress, but it is only partly explained by the accompanying reduction in feed intake. Controlled pair-feeding experiments have shown that the decline in dry matter intake accounts for only about 35 to 50% of the loss in milk production, the remainder arising from direct effects of hyperthermia on metabolism, endocrine signaling, nutrient partitioning, and mammary function [10,17,18]. Heat stress also elicits oxidative stress [19] and alters milk composition, typically decreasing protein and lactose concentrations while leaving fat content comparatively unaffected in the short term [20,21], with a general deterioration of milk quality and its components as thermal load rises [22,23]. Beyond milk, elevated THI compromises reproductive performance [24], impairs mammary immunity and increases somatic cell counts and the risk of mastitis [25,26], and, at extreme values, raises the risk of mortality [27].
Susceptibility to heat stress is not uniform across the herd. Decades of genetic selection for higher yield have inadvertently reduced heat tolerance, so that the highest-producing cows tend to lose more milk and show less persistent production under thermal load [11,28]. Vulnerability also differs with physiological state: lactating cows have lower THI thresholds than dry cows, and the magnitude of the response varies with parity and stage of lactation [29,30]. Characterizing which animals are most at risk is therefore essential to target heat-abatement resources efficiently.
Most field studies relate a monthly test-day yield to the THI recorded on, or averaged around, the day of sampling, and describe the exposure–response with change-point, polynomial, spline, or random-regression models [6,11,12,31]. A few have begun to align production with the thermal load accumulated over a fixed window before the test day (for example, the maximum THI over the preceding days [22]), implicitly recognizing that heat stress exerts effects that are delayed in time. However, the temporal structure of the response is rarely characterized explicitly: it remains unclear how long the depression in yield persists after a hot day, which of the preceding days carry the most weight, and whether the effect is driven by moderate or only by severe heat load. Distributed-lag non-linear models (DLNM), developed in environmental epidemiology to simultaneously describe the non-linear and the delayed dimensions of an exposure–response relationship [32], are well suited to answer these questions but have rarely been applied to dairy production data. In addition, evidence from the humid, oceanic dairy systems of northwestern Spain is scarce, with most Mediterranean data coming from the warmer, drier south [11].
The research problem addressed in this study can therefore be stated explicitly. Although the negative effect of heat on milk yield is well established, three gaps limit its practical management: (i) the timing of the response (how many days after a hot day the loss is expressed and how long it persists) has rarely been estimated and is usually assumed through a fixed exposure window; (ii) it is unclear whether moderate heat load, which is common in temperate regions, is already harmful or whether losses are confined to severe heat; and (iii) information from humid Atlantic dairy regions such as northwestern Spain, traditionally regarded as low-risk but now warming, is scarce. Without this information, farmers and advisers cannot know from which THI to act, for how many days after a hot spell loss should be expected, or which cows should be prioritized.
Combining continuous hourly THI monitoring with official monthly milk-recording data from commercial herds offers an opportunity to address these gaps at the scale of everyday dairy management. By analyzing each cow as her own control, the confounding effect of permanent between-animal and between-herd differences can be removed, isolating the change in a cow’s yield when she experiences hotter versus cooler conditions. Applied within this framework, a DLNM can reveal the shape of the exposure–response relationship, the empirical THI threshold, and the number of days over which the effect of heat is expressed.
The study was designed as a retrospective observational study with repeated measures on the same cows. Hourly air temperature and relative humidity recorded inside the barns of four commercial herds located in a single municipality of Lugo (2023–2025) were converted to THI and linked to the individual monthly test-day records of all lactating cows. Thermal load before each test-day was described by (i) the daily maximum THI on each of the preceding 21 days and (ii) the hours spent in three THI severity bands during the preceding 7 days. Linear mixed models in which each cow acted as her own control were then used to estimate the exposure–response shape and threshold and its lag structure (DLNM), the dose–response across severity bands and its modification by lactation stage, followed by sensitivity analyses addressing temporal confounding, clustering and model specification.
Accordingly, the general objective of this study was to quantify the acute, within-cow effect of heat load on the test-day milk yield of dairy cows in commercial herds of northwestern Spain, determining from which level of heat load milk is lost and over how many days this loss is expressed. To achieve it, the following specific objectives were set:
Scientific objectives:
- To characterize the exposure–response relationship between daily maximum THI and milk yield and to identify the empirical THI threshold at which yield begins to decline;
- To describe the lag structure of the response, that is, how the association of a hot day with milk yield is distributed over the following days;
- To compare the effect of moderate (THI 72–79) and severe (THI ≥ 80) heat load;
- To assess whether susceptibility to heat load differs with stage of lactation.
Practical objectives:
- To provide THI thresholds and time windows that dairy farmers, veterinarians and herd advisers can use as on-farm alert criteria for heat-abatement measures;
- To identify the groups of cows that should be prioritized when heat-abatement resources are limited;
- To supply regional evidence for milk-recording organizations, nutritionists, barn designers and equipment suppliers, and policymakers planning the adaptation of Atlantic dairy systems to a warming climate.
2. Materials and Methods
2.1. Animals, Herds, and Study Design
This retrospective observational study used records collected between January 2023 and October 2025 from 4 commercial dairy herds (labeled A–D) located in the municipality of Castro de Rei (A Terra Chá district, province of Lugo), Galicia, northwest Spain. Herds were eligible when they combined continuous on-farm environmental monitoring with participation in the official monthly milk-recording scheme. Cows were Holstein–Friesian and were housed in free-stall barns. No active heat-abatement equipment (fans or sprinklers) was installed, removed, or modified in any herd during the study period; consequently, any temporal association between thermal load and milk yield was not confounded by changes in cooling management. Because the study relied exclusively on pre-existing production and environmental records and involved no experimental procedures on animals, it did not require formal approval by an animal-care committee. Herd B joined the official milk-recording scheme in January 2024, so its test-day records cover January 2024 to October 2025.
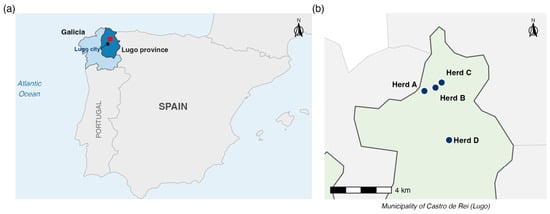
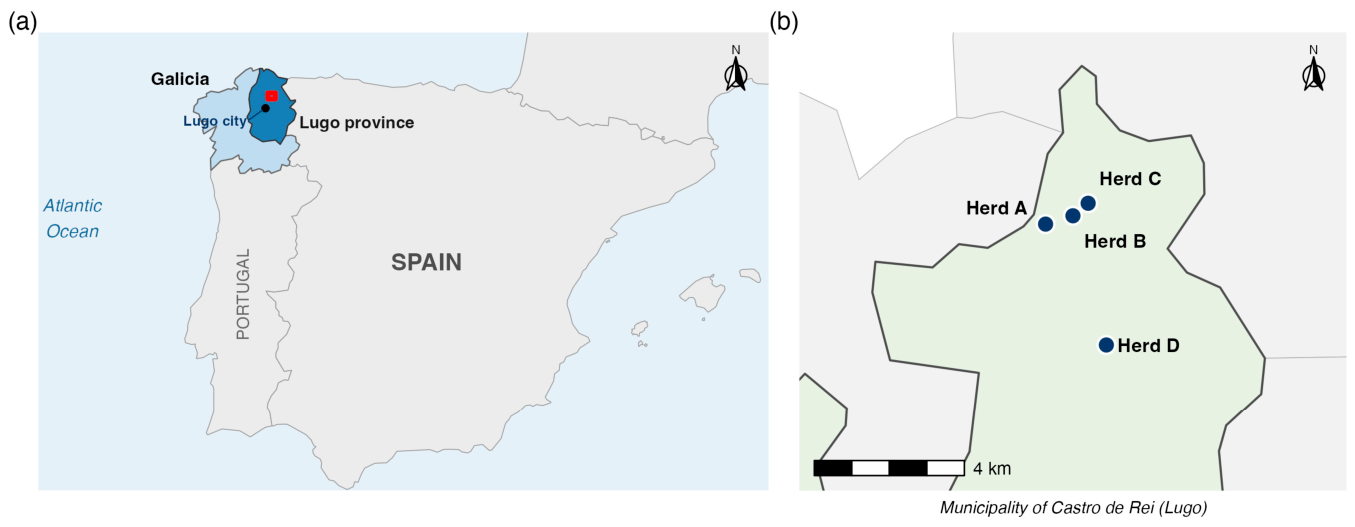
Herds A, B and C were located in the parish of Santa María de Outeiro and herd D in the parish of Santa Locaia, between 0.6 and 3.9 km from each other (Figure 1), at approximately 43.22–43.25° N and 7.40–7.42° W. The area has a humid oceanic climate; the mean air temperature and relative humidity recorded in each barn during the study period are summarized in Table S1. Because all herds shared the same regional climate, the differences in THI between herds (Table 1) reflect barn-level microclimate; for this reason, each herd was monitored with its own logger placed inside the barn (Section 2.2).
Figure 1.
Location of the study area (red rectangle) in the province of Lugo, Galicia, northwest Spain (a), and of the four study herds (A–D) in the municipality of Castro de Rei (b). The black dot in (a) marks the city of Lugo. Administrative boundaries: © EuroGeographics (Eurostat-GISCO).
Table 1.
Environmental (THI) descriptive statistics by herd, 2023–2025.
All herds followed a similar management system. Lactating cows were kept in free-stall barns with cubicles bedded with sand and calcium carbonate, and alleys were cleaned by automatic manure scrapers whose frequency was programmed by each farmer. Cows were fed a partial mixed ration (PMR) offered ad libitum at the feed bunk, complemented with concentrate supplied at the milking robot, and had free access to water from constant-level waterers.
All herds were milked exclusively by automatic milking systems (AMSs) with free cow traffic: herds A and B with GEA robots (GEA Farm Technologies, Bönen, Germany), herd C with Lely robots (Lely Industries N.V., Maassluis, The Netherlands) and herd D with DeLaval robots (DeLaval International AB, Tumba, Sweden). Herds A and D had four robots, two per lactating group (approximately 62 ± 5 cows per robot), whereas herds B and C had two robots serving a single lactating group. Cows were granted milking permission when at least 6 h had elapsed since the previous milking, which resulted in approximately two (occasionally three) milkings per cow per day; cows overdue for milking were fetched to the robot by farm staff. (Section 2.3).
2.2. Meteorological Data and Temperature–Humidity Index
Air temperature (°C) and relative humidity (%) were logged hourly by a Multi-Use Compact PDF Temperature and Humidity USB Data Logger device (Multicomp Pro, Farnell Components SL, Madrid, Spain). The device was installed at a height of two meters on a pillar over the feed alley at the center of the barn in all herds (between the two lactating pens in herds A and D), sufficient to keep it out of cows’ reach. Each herd had its own logger. The loggers have an internal memory of 35,000 records (approximately 4 years of hourly data), and data were downloaded monthly. These devices are capable of measuring temperatures (T) from −30 °C to +70 °C with an accuracy of ±0.5 °C and relative humidity (RH) from 0 to 100% with an accuracy of ±3%. For every hourly observation, the temperature–humidity index (THI) was calculated as [7]:
where T is air temperature (°C), and RH is relative humidity (%). Hourly observations were aggregated to farm-days; farm-days with fewer than 20 hourly observations were discarded to guarantee reliable daily statistics. For each farm-day, we computed the daily mean, maximum, and minimum THI; the number of hours in the ranges 68–71 (mild), 72–79 (moderate), and ≥80 (severe heat load); and the number of days on which the daily maximum THI reached 68, 72, and 80, corresponding to the onset of heat stress in high-producing dairy cows [9], moderate, and severe thermal conditions, respectively.
THI = 0.8 × T + (RH/100) × (T − 14.4) + 46.4
2.3. Milk Production Data
Individual test-day records were obtained from the official monthly milk-recording scheme for the same herds and period. Each record comprised test-day milk yield (kg), fat, protein and lactose (%), somatic cell count, days in milk (DIM), parity, and calving date. Test-day milk yield was the 24 h yield recorded on the test day by the ICAR-approved milk meter of each AMS, and an individual 12 mL milk sample was collected from each cow for compositional analysis. These were determined using standardized analytical procedures in a Galician Interprofessional Laboratory for Milk Analysis (LIGAL, https://ligal.gal/en/ Accesed on 6 October 2026) according to UNE-EN ISO/IEC 17025 [33]. Records with DIM outside the 5–500 d range, or with missing yield, DIM, or parity, were excluded. Parity was categorized as 1, 2, and ≥3. The analytical dataset comprised 16,906 test-day records from 1235 cows. Only test days falling within the period of THI monitoring of each herd were retained. All lactating cows present in each herd on each test day were recorded, without selection; cows that had not visited the robot were fetched by the staff so that every cow was milked during the 24 h recording period. Overall, 35.3% of records corresponded to first-parity, 28.7% to second-parity and 36.0% to third- or later-parity cows (Table 2).
Table 2.
Production descriptive statistics by herd (official monthly milk recording).
Data quality was assessed before analysis. Records were screened for biologically implausible yields (<2 or >80 kg/day), for large deviations from the expected lactation curve (standardized residual |z| > 4 from a mixed model of yield on DIM, parity and herd with a random cow effect) and for abrupt changes between consecutive test days of the same cow (>20 kg). These screens identified 6, 46 and 647 records, respectively. Because abrupt drops in yield can be a genuine consequence of heat stress, flagged records were not removed from the main analysis; instead, their influence was assessed in a sensitivity analysis excluding records with |z| > 4 (Section 2.5).
2.4. Heat-Stress Exposure Assessment
Because milk was recorded once monthly whereas THI was measured continuously, each test day was linked to the thermal load accumulated over the days preceding the recording, through two complementary representations:
Severity bands. The number of hours in the 68–71, 72–79, and ≥ 80 THI bands accumulated over the 7 d before each test-day, used to quantify the dose–response to thermal severity.
Distributed-lag exposure histories. The daily maximum THI on each of the days preceding the test day, assembled as an exposure-history matrix and modeled with a distributed-lag non-linear model (DLNM). The main model used lags 1 to 21 d; alternative horizons of 7 and 14 d were examined in sensitivity analyses (Section 2.5).
2.5. Statistical Analysis
All analyses were linear mixed models with test-day milk yield as the response and a random intercept for cow to account for repeated measurements (R version 4.4, R Foundation for Statistical Computing, Vienna, Austria; packages lme4, lmerTest, dlnm). Fixed effects common to every model were the lactation curve (third-degree polynomial of DIM), parity class (1, 2, ≥3), and herd. Significance was declared at p < 0.05. To account for the fact that all cows tested on the same day in the same herd share the same exposure history, every model also included a random intercept for herd-test-day (the combination of herd and test date; 109 herd-test-days, with a mean of 155 cows each). To control for long-term and seasonal trends unrelated to heat (for example, changes in diet or herd composition), year (2023, 2024, 2025) and season (winter, December–February; spring, March–May; summer, June–August; autumn, September–November) were included as fixed effects. Estimates are reported with their 95% confidence intervals (CI).
To separate the effect of thermal load experienced within a cow from stable between-cow differences, exposure variables were decomposed following Mundlak: each cow’s mean exposure (between-cow) and the deviation from that mean (within-cow) were entered simultaneously, so that the within-cow coefficient (reported throughout as the effect of heat) estimates the change in a cow’s yield when she experiences a hotter versus a cooler period, and is algebraically equivalent to a cow fixed-effects estimator.
The severity gradient was estimated from a single model containing the within-cow hours in the three THI bands (7 d window). The exposure–response shape and temporal structure were characterized with a DLNM cross-basis for daily maximum THI (natural cubic spline, 4 df, in the exposure dimension; natural cubic spline, 3 df, in the lag dimension), started at lag 1 d to avoid same-day boundary artifacts and centered at a daily maximum THI of 64 (thermoneutral reference). Robustness of the exposure–response to residual between-cow confounding was verified by refitting the cross-basis under the within-between (Mundlak) decomposition. Effect modification by lactation stage was assessed by adding an interaction between within-cow heat-stress hours (THI ≥ 72; 7 d window) and lactation stage (early, ≤100 DIM; mid, 101–200 DIM; late, >200 DIM).
In sensitivity analyses, the influence of the herd-test-day, year and season adjustments was assessed by refitting the models (i) with the original specification (random intercept for cow only, without year and season), (ii) adding herd-test-day, (iii) adding year and (iv) adding year-by-herd and calendar month as the most conservative specification, and (v) excluding records with |z| > 4. The DLNM was also refitted with maximum lags of 7, 14 and 21 d, with 3, 4 and 5 df in the exposure dimension and with 3, 4 and 5 df in the lag dimension. The lag of maximal association was defined as the lag with the most negative estimate at a daily maximum THI of 80, and dissipation as the first lag after it whose 95% CI included zero; these are model-based estimates of the timing of the association, not an observed recovery of individual cows.
To assess whether sustained heat had a greater effect than isolated hot days, each test day was classified according to the longest run of consecutive days with daily maximum THI ≥ 72 within the preceding 7 d (none; isolated hot days only; 2 consecutive days; ≥3 consecutive days), and this pattern was entered as a fixed effect. In a second model, the number of hot days and an indicator of a run of ≥3 consecutive hot days were entered simultaneously, so that the latter estimated the additional effect of persistence for the same number of hot days.
3. Results
3.1. Descriptive Characteristics
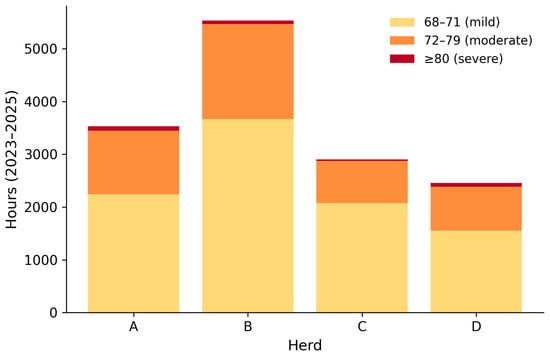
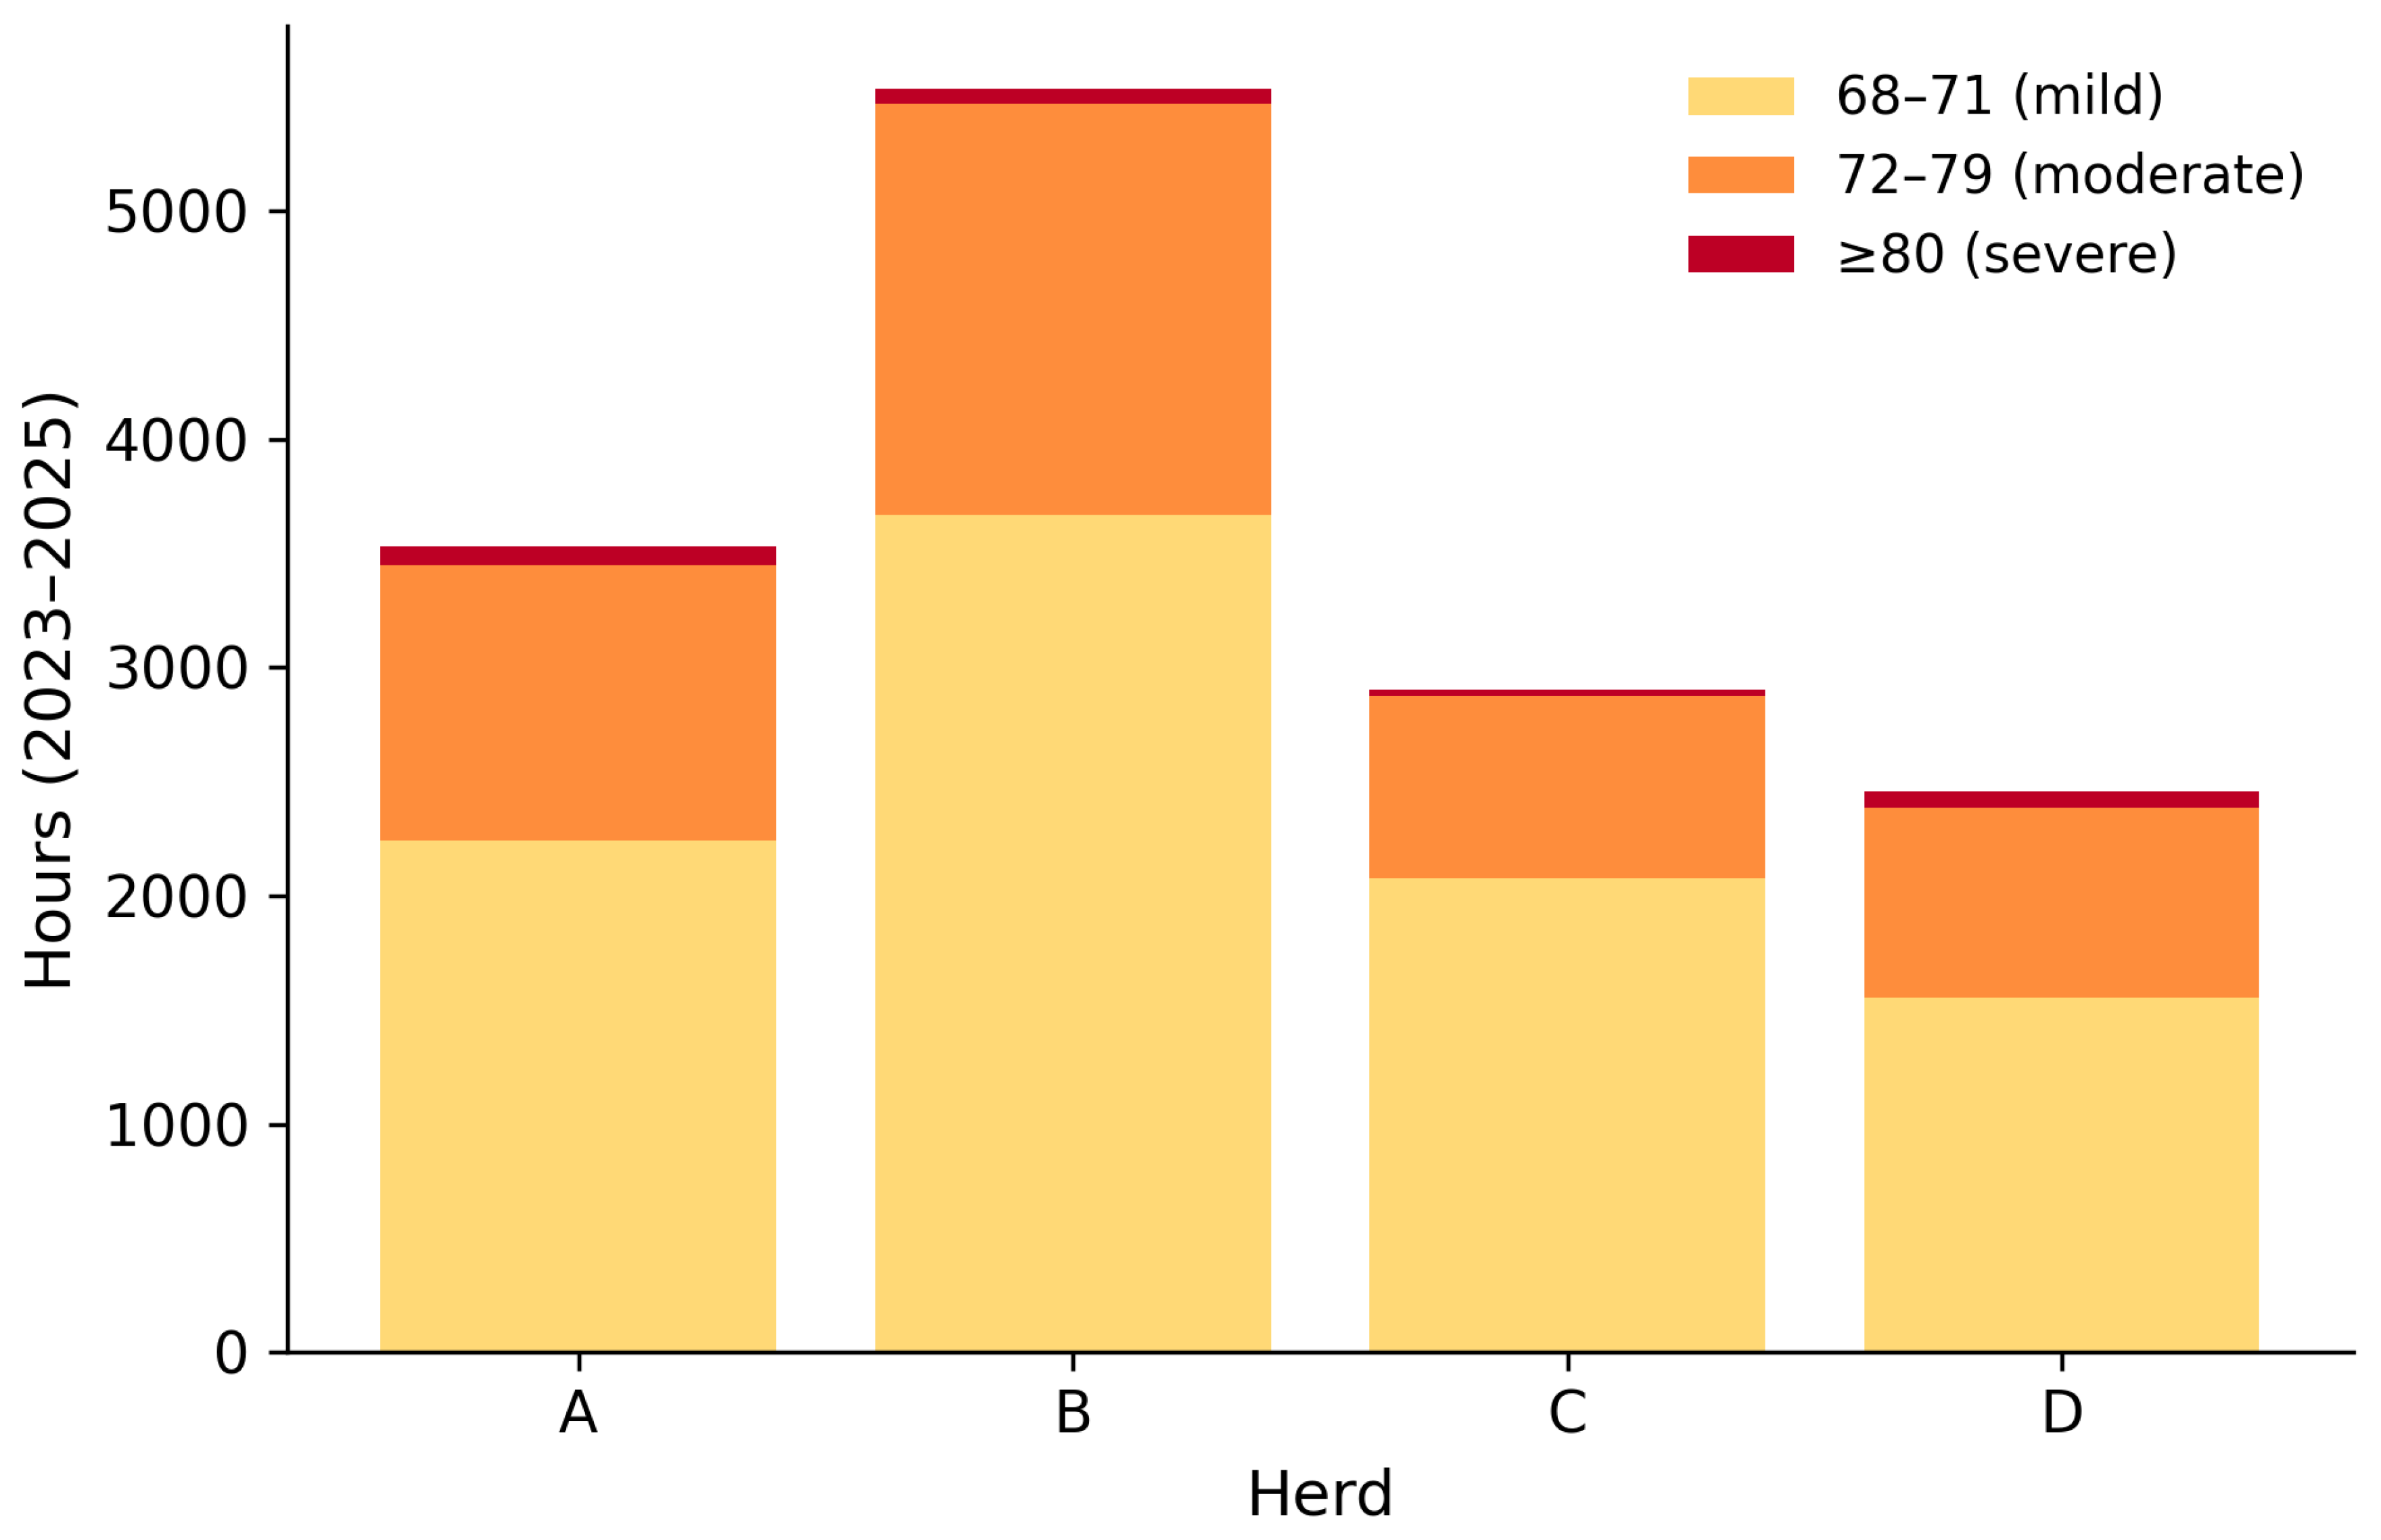
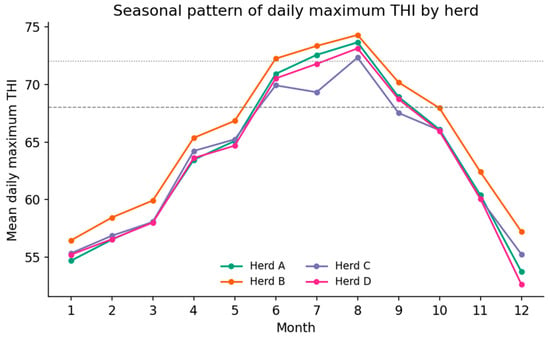
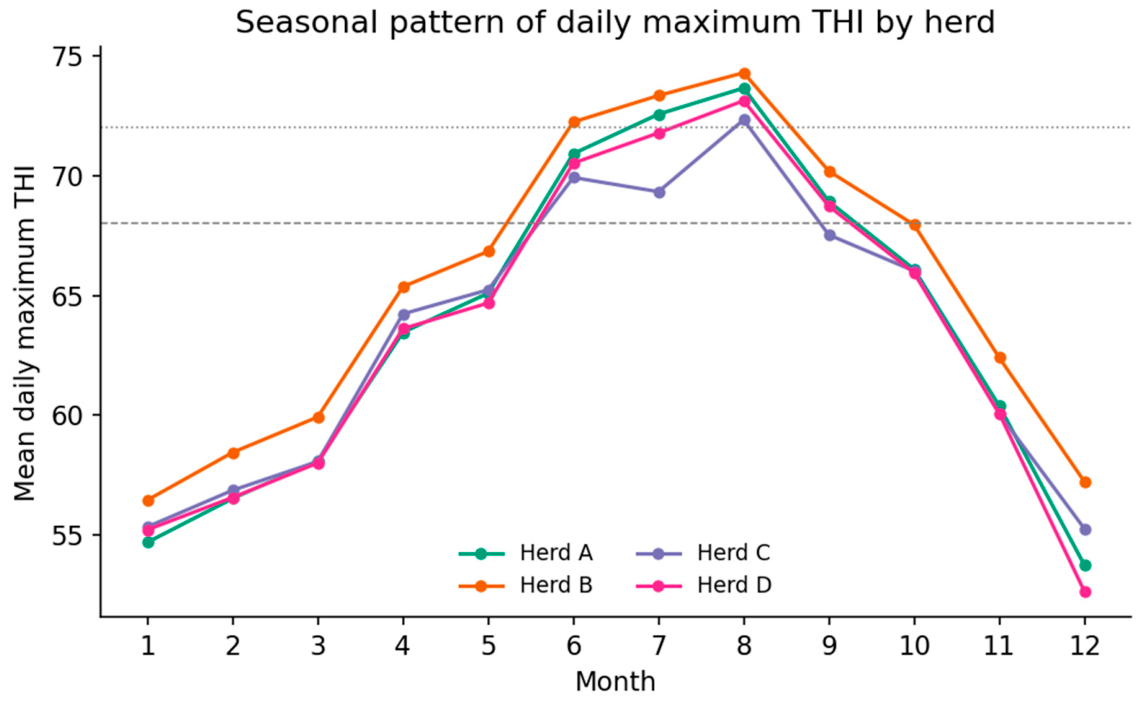
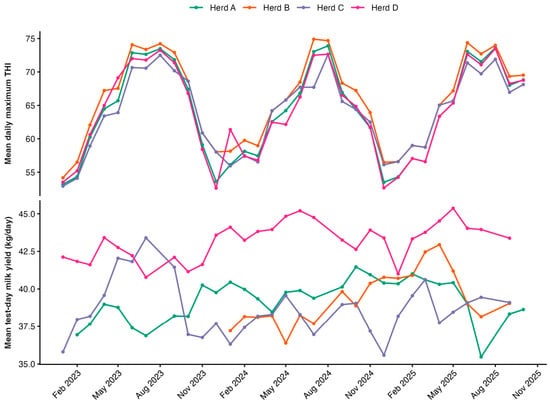
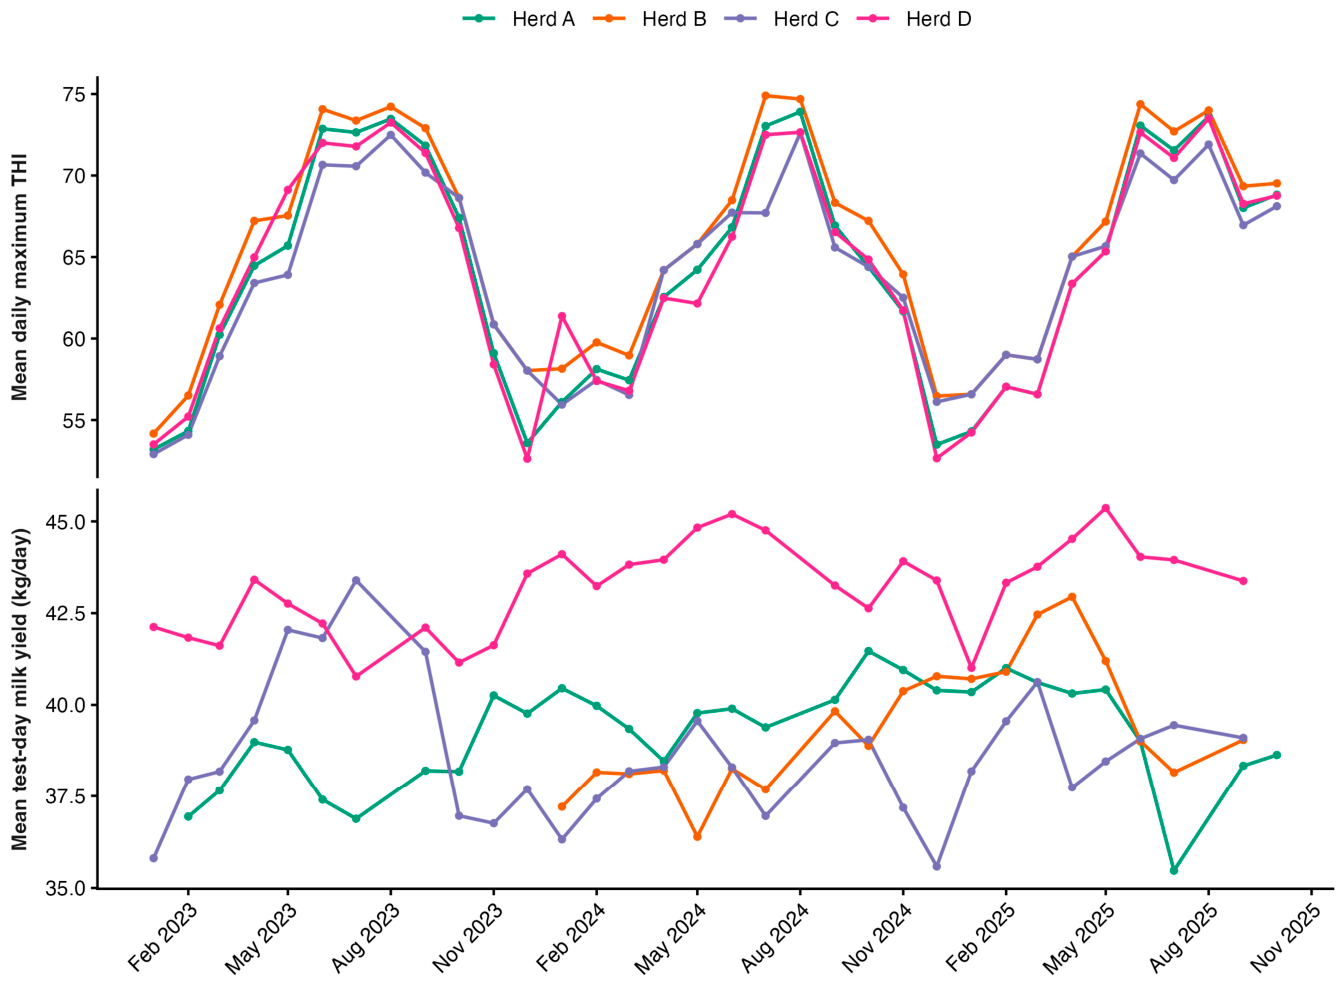
Over the 3 yr period, daily mean THI ranged from 57.7 to 61.7 among herds, and the absolute maximum hourly THI reached 85.2 (Table 1). Thermal load was unevenly distributed: herd B was consistently the hottest (240 d with daily maximum THI ≥ 72 and 5533 h of moderate-to-severe heat load), whereas herd C was the mildest (136 d ≥ 72; Table 1, Figure 2). Severe heat load (THI ≥ 80) was infrequent but present in every herd (29–78 h over 3 yr). The seasonal pattern was pronounced, with daily maximum THI crossing the 68 and 72 thresholds mainly between June and September (Figure 3). Test-day milk yield averaged 38.7 to 43.2 kg/day across herds, with a median of 172 DIM and a median parity of 2 (Table 2). Year-by-year environmental statistics for each herd are given in Table 3. THI records covered 93.9–98.3% of the days between January 2023 and October 2025, depending on the herd. Mean air temperature in the barns ranged from 14.3 °C (herd D) to 16.8 °C (herd B) and mean relative humidity from 77.3% (herd C) to 84.1% (herd D) (Table S1). The number of cows recorded per test-day was stable within each herd (Table 2), and the monthly evolution of daily maximum THI and test-day milk yield in each herd over the study period is shown in Figure 4.
Figure 2.
Accumulated hours of heat load (2023–2025) by herd and THI severity band.
Figure 3.
Seasonal pattern of mean daily maximum THI by herd; dashed and dotted lines mark the 68 and 72 thresholds.
Figure 4.
Monthly mean daily maximum THI and mean test-day milk yield by herd, 2023–2025.
Table 3.
Environmental (THI) statistics by herd and year.
3.2. Exposure–Response Shape and Temporal Structure
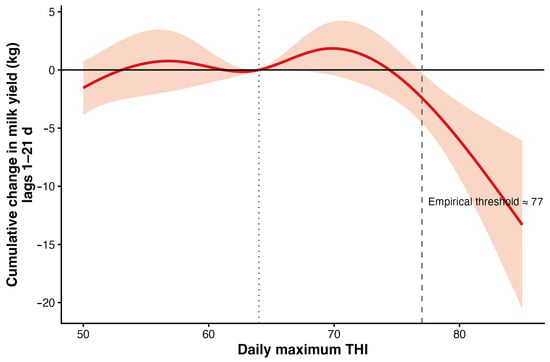
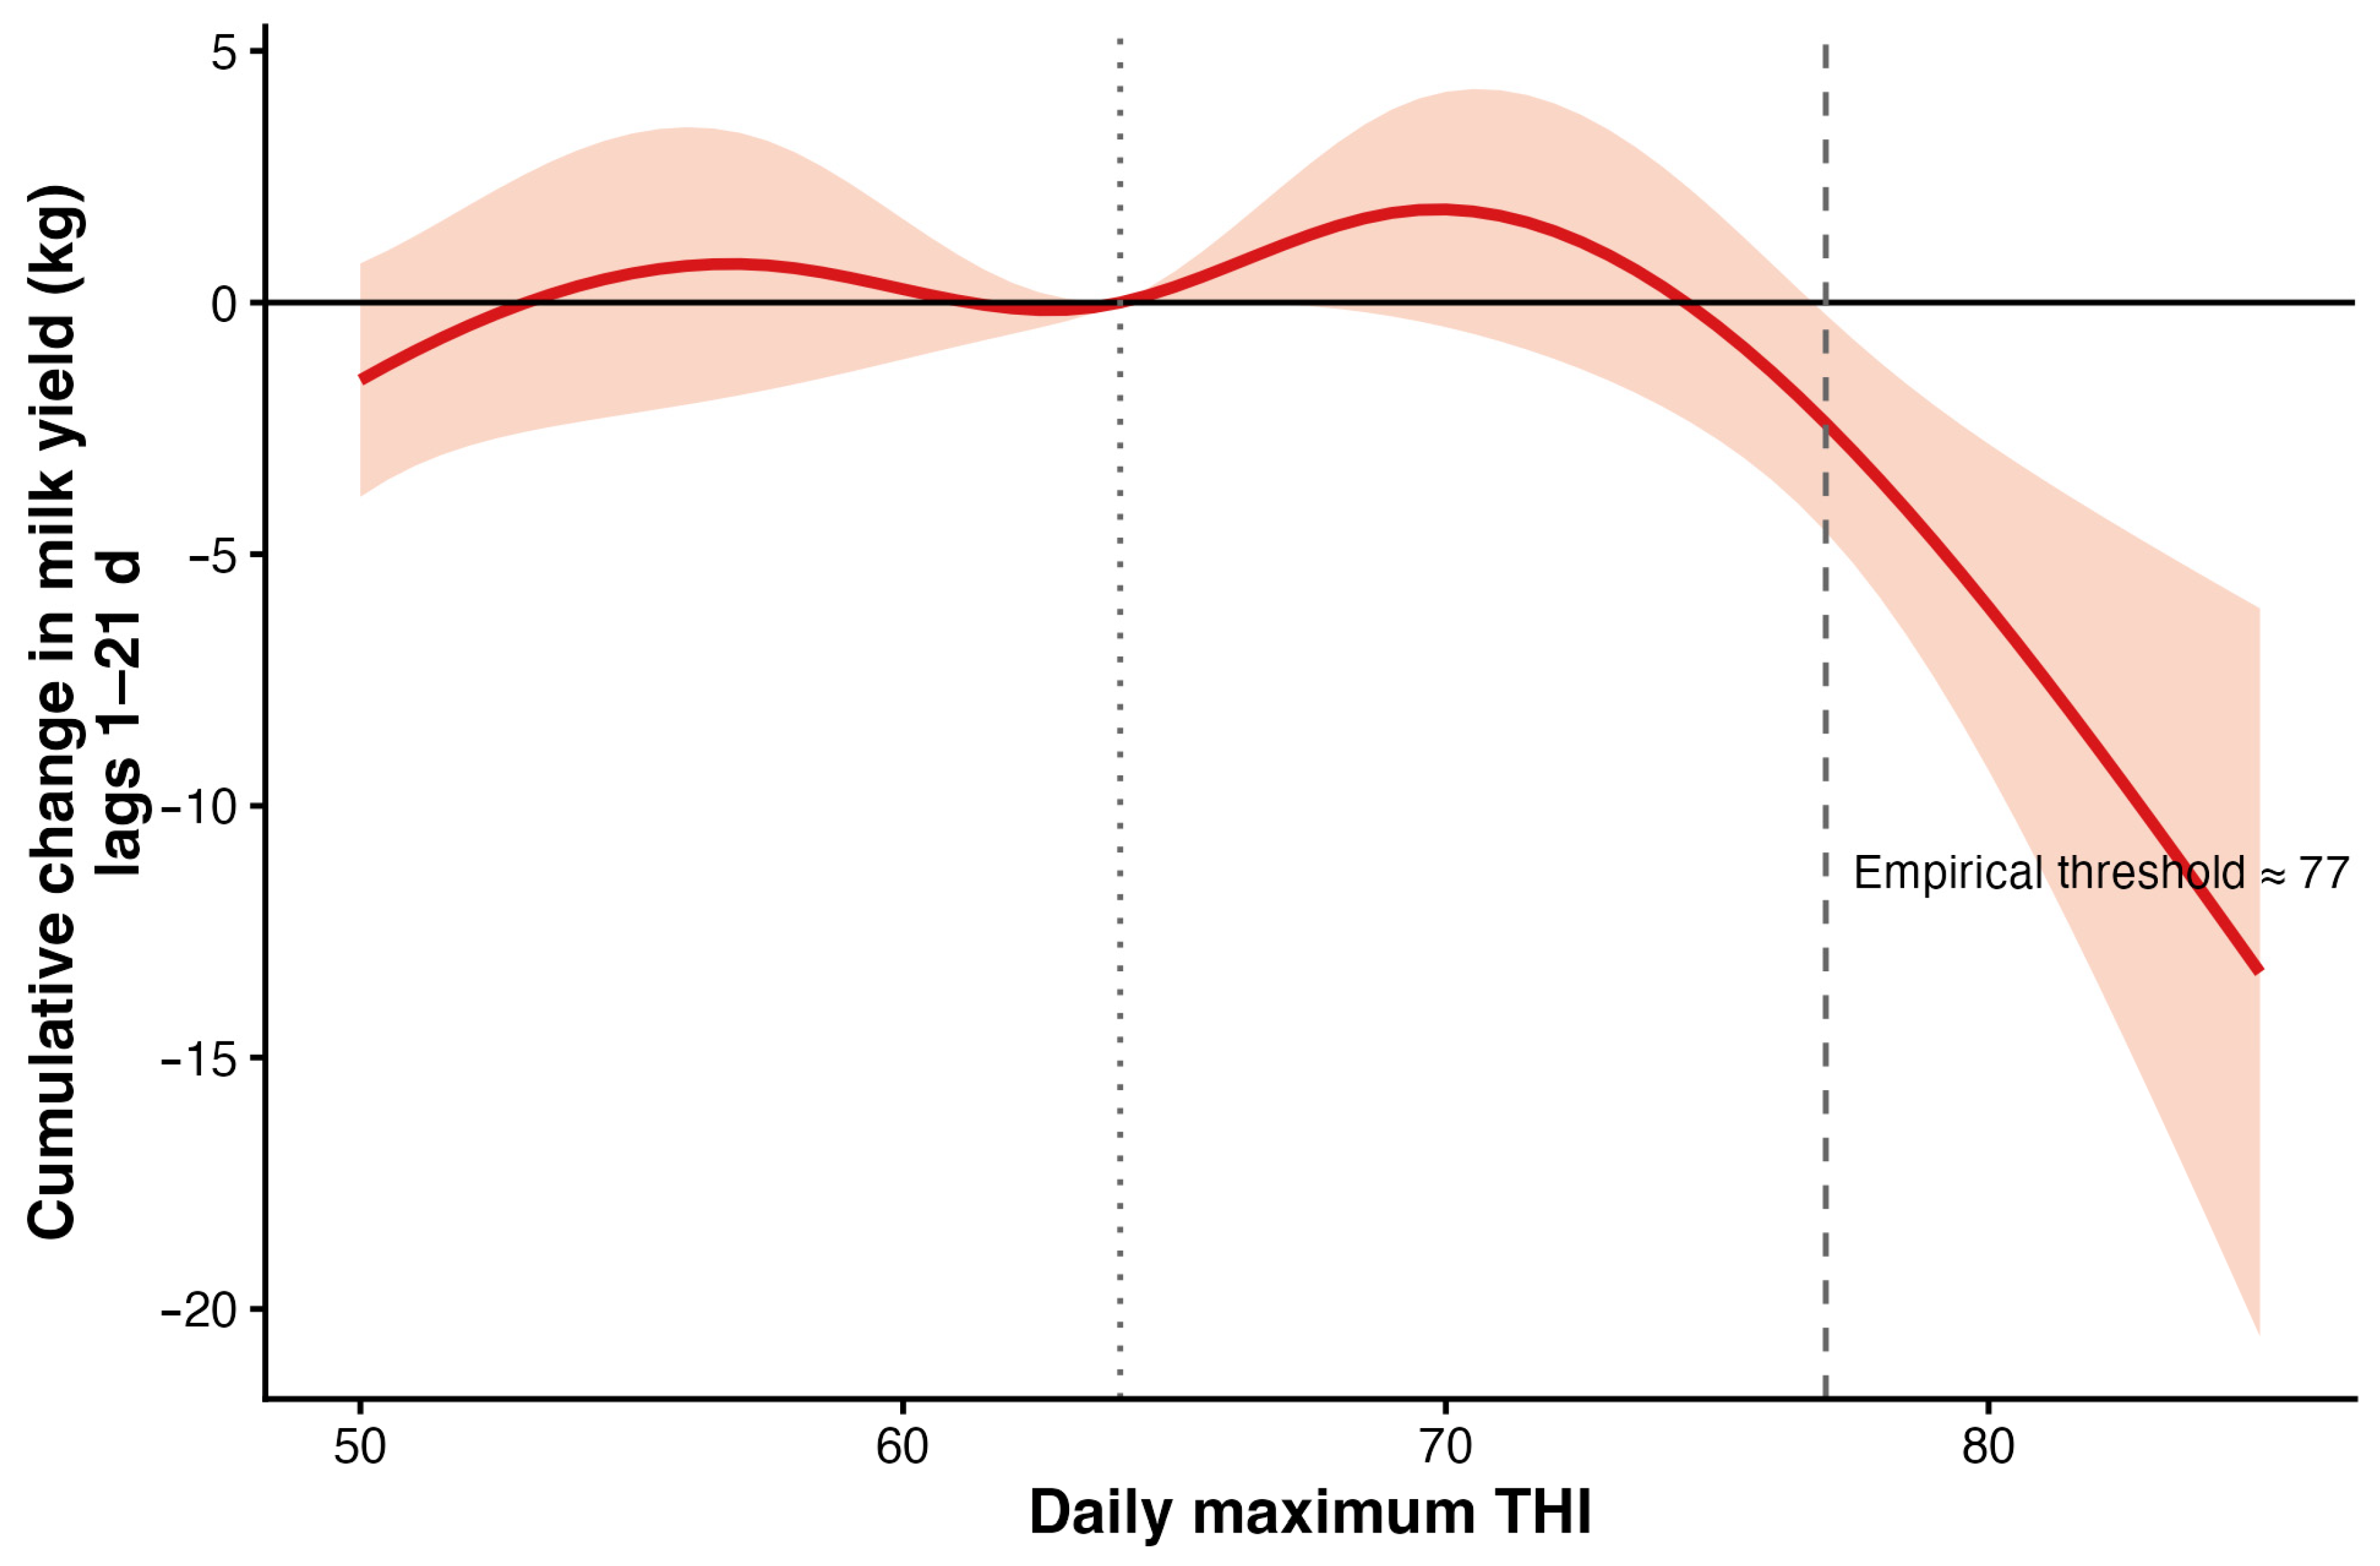
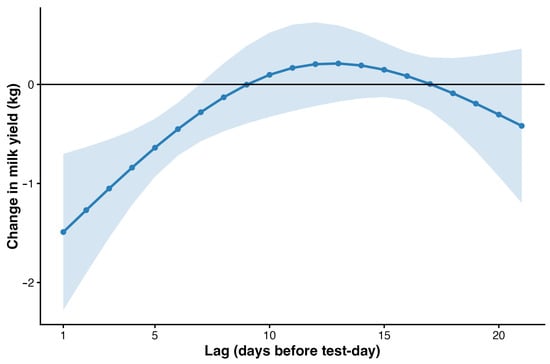
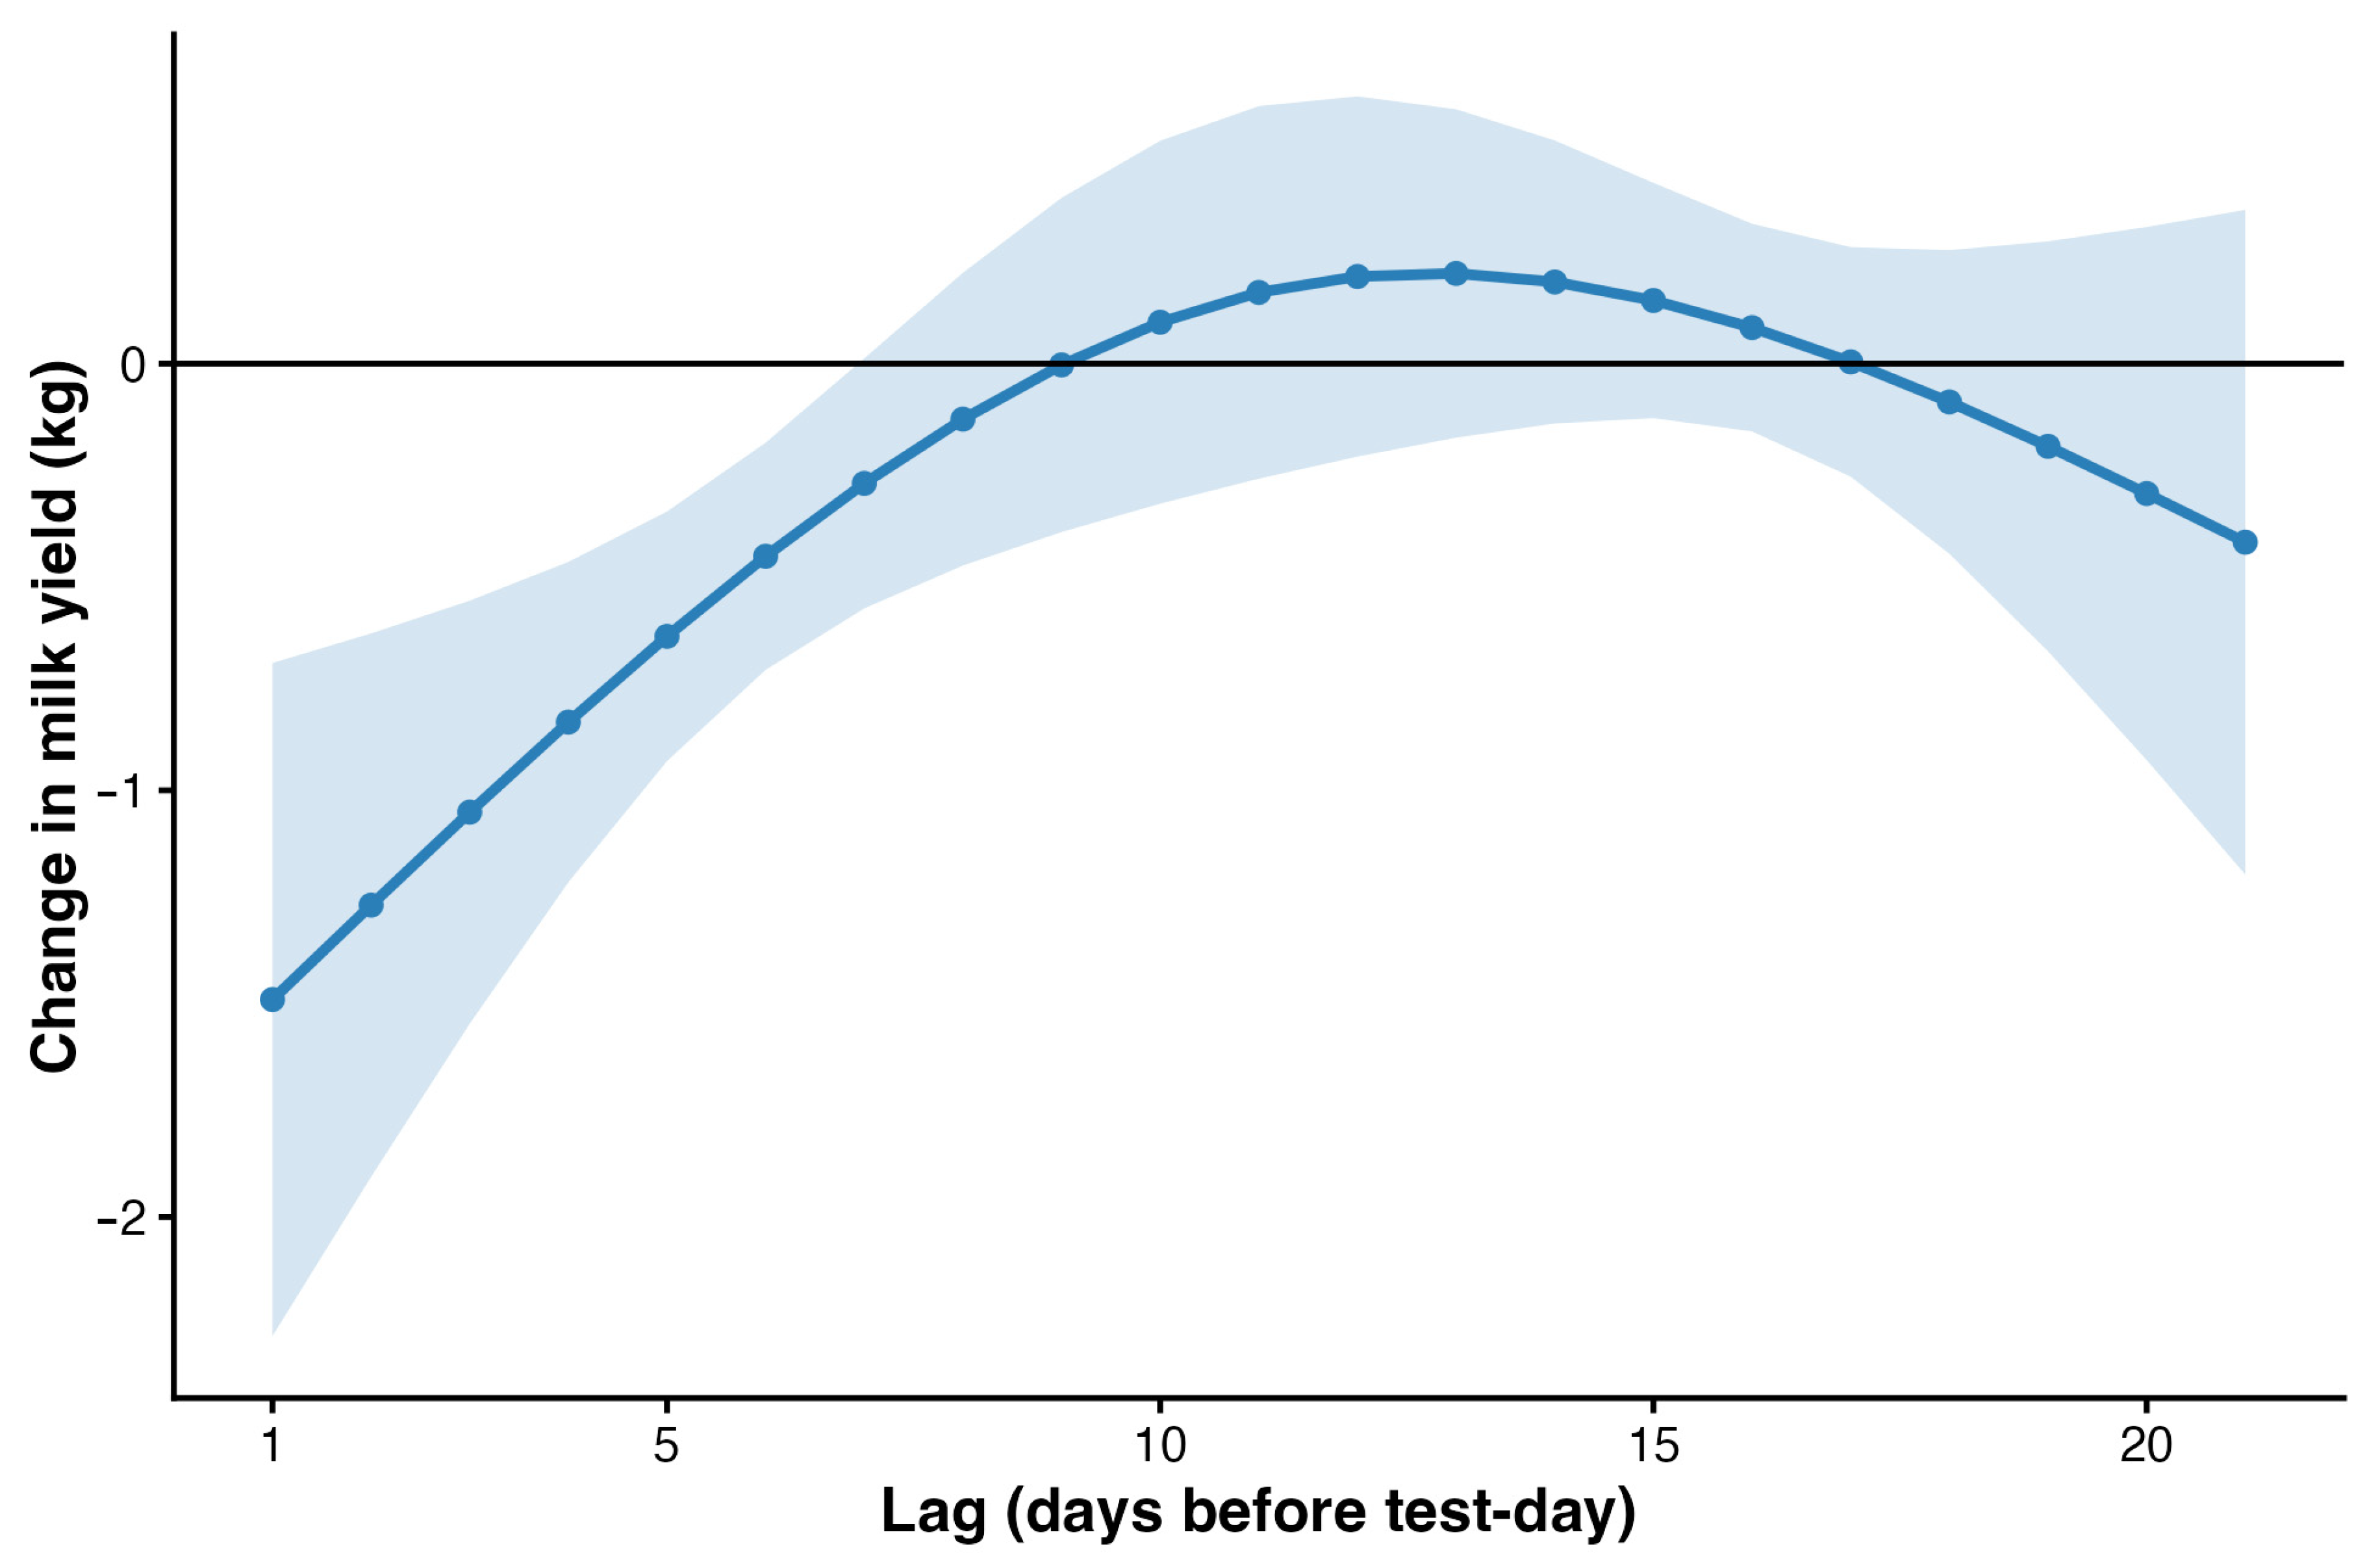
The distributed-lag model of daily maximum THI (lags 1–21 d; 14,693 test-day records from 1223 cows in 92 herd-test-days) described a slightly positive association, significant only between THI 64.5 and 66, up to approximately THI 74 and a steep decline thereafter (Figure 5). Relative to a thermoneutral day (daily maximum THI of 64), the cumulative change in yield attributable to a single day was +1.52 kg at THI 68 (95% CI: −0.12 to +3.17), +1.42 kg at THI 72 (95% CI: −1.12 to +3.96), −1.37 kg at THI 76 (95% CI: −3.52 to +0.78), −6.05 kg at THI 80 (95% CI: −9.30 to −2.81) and −11.80 kg at THI 84 (95% CI: −18.15 to −5.46). The upper confidence limit first fell below zero at a daily maximum THI of 77 (−2.40 kg; 95% CI: −4.56 to −0.24), which was taken as the empirical onset of production loss. For a day with a maximum THI of 80, the lag-specific association was largest at lag 1 (−1.49 kg; 95% CI: −2.28 to −0.70), decreased steadily thereafter, remained significant up to lag 6 and was no longer significant from lag 7 onward (Figure 6). Because milk was recorded only once per month, this profile is a model-based estimate of how strongly the THI of each preceding day is associated with test-day yield, not an observed day-by-day recovery of individual cows.
Figure 5.
DLNM cumulative exposure–response for daily maximum THI (lags 1–21 d), centered at THI 64. Shaded band = 95% CI. Estimates from the main model, adjusted for year, season and herd-test-day.
Figure 6.
DLNM lag-response profile for a day at daily maximum THI = 80; the association is largest in the first days and is no longer significant from lag 7 onward. Estimates from the main model, adjusted for year, season and herd-test-day.
3.3. Severity Gradient
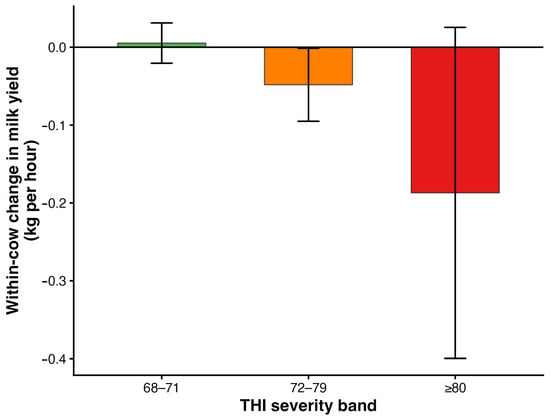
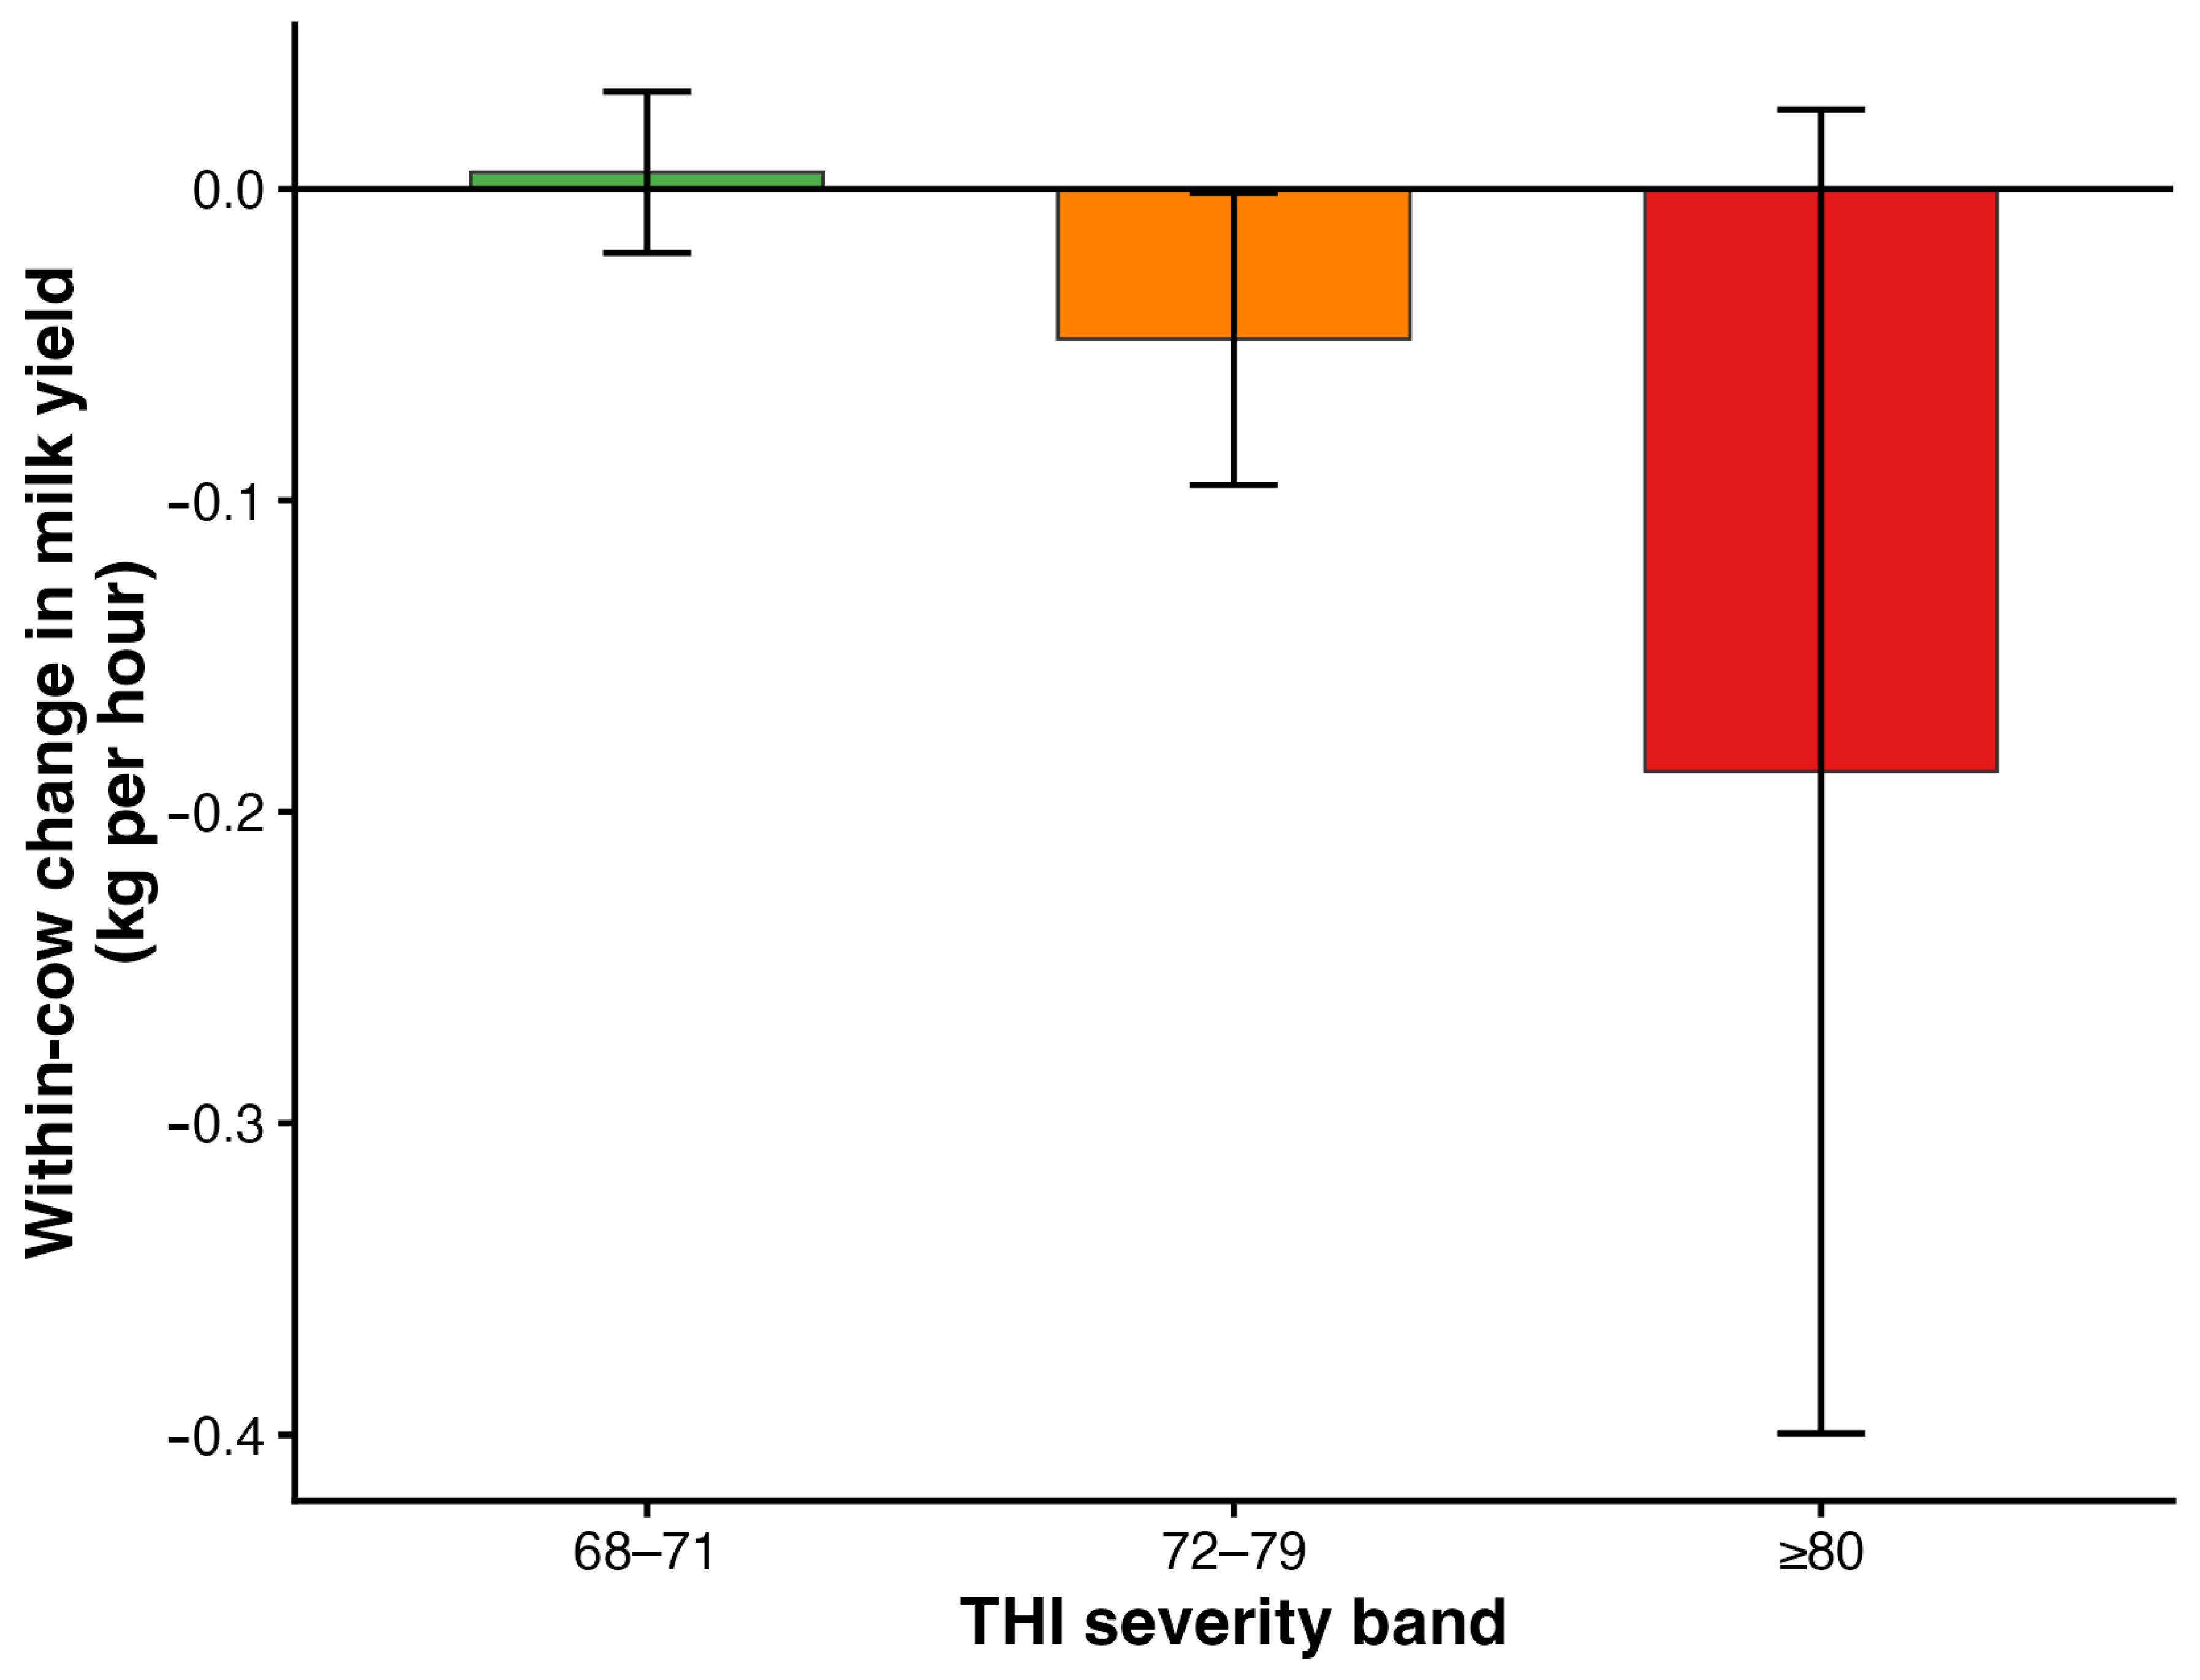
In the severity-band model (16,157 records from 1234 cows in 104 herd-test-days), hours in the 68–71 band were not associated with yield (+0.005 kg/h; 95% CI: −0.021 to +0.031; p = 0.69). Each hour in the 72–79 band was associated with a reduction in yield of 0.048 kg (95% CI: 0.001 to 0.095; p = 0.047), whereas the estimate for each hour at THI ≥ 80, although larger (−0.187 kg/h; 95% CI: −0.400 to +0.025), was not significant (p = 0.089). The point estimate for severe heat was therefore about four times that for moderate heat, but it was estimated with wide uncertainty because severe heat was infrequent (Figure 7).
Figure 7.
Within-cow dose–response of milk yield to hours in each THI severity band (7 d window). Error bars = 95% CI. Estimates from the main model, adjusted for year, season and herd-test-day.
3.4. Robustness to Between-Cow Confounding
Refitting the adjusted distributed-lag model under the Mundlak within–between decomposition yielded virtually identical estimates (cumulative change at THI 80: −6.20 kg, 95% CI: −9.52 to −2.88, for the within-cow model vs. −6.05 kg for the random-intercept model; empirical threshold, 77 in both), indicating that the exposure–response reflected variation experienced within individual cows rather than differences between cows.
3.5. Effect Modification by Lactation Stage
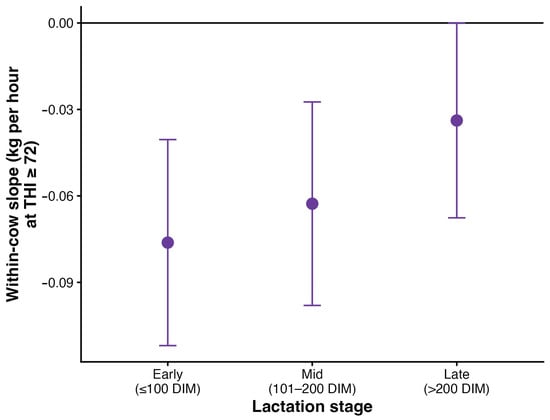
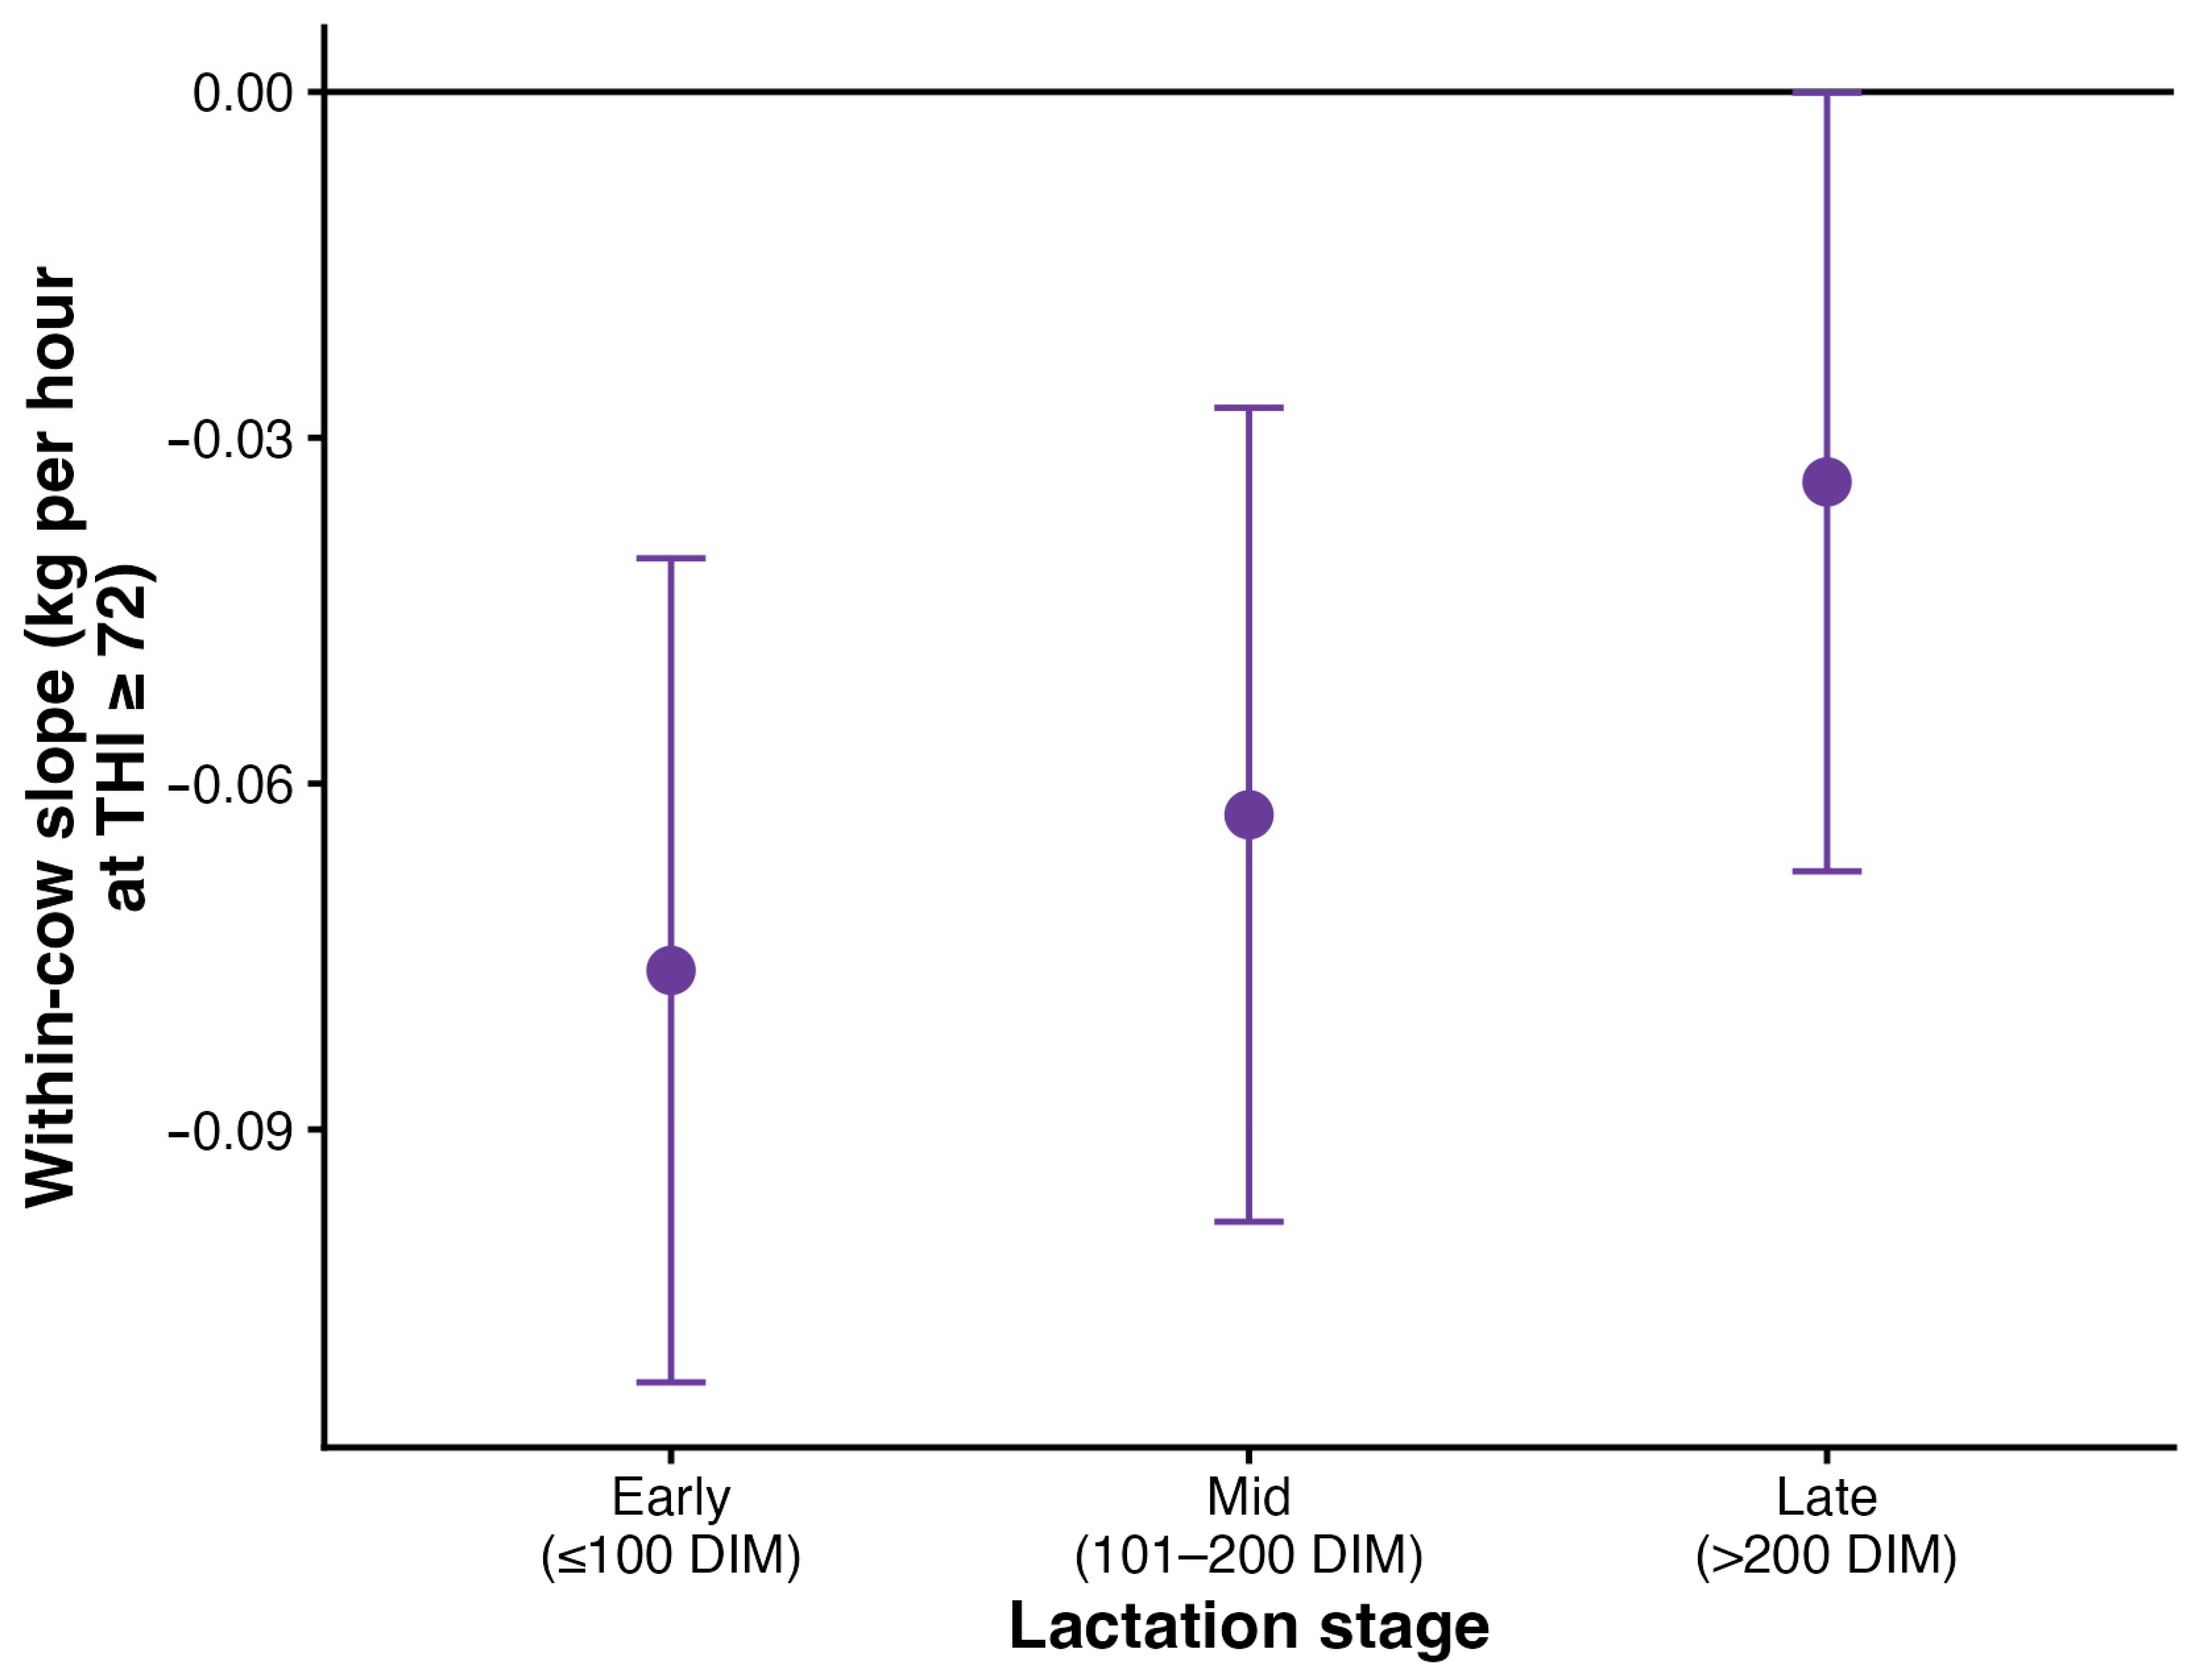
The effect of heat load varied with lactation stage (interaction p < 0.001; Figure 8). Within-cow slopes for hours at THI ≥ 72 (7 d window) were −0.076 kg/h in early lactation (≤100 DIM; 95% CI: −0.112 to −0.041), −0.063 kg/h in mid lactation (101–200 DIM; 95% CI: −0.098 to −0.027) and −0.034 kg/h in late lactation (>200 DIM; 95% CI: −0.067 to −0.000), so that the slope in late lactation was less than half that in early lactation (p < 0.001 for the difference).
Figure 8.
Within-cow susceptibility to heat (slope of milk yield on hours at THI ≥ 72) by lactation stage. Error bars = 95% CI. Estimates from the main model, adjusted for year, season and herd-test-day.
3.6. Sensitivity Analyses
Of the 16,906 records, 6 had yields outside the 2–80 kg/day range, 46 (0.27%) had standardized residuals |z| > 4 and 647 differed by more than 20 kg from the previous test day of the same cow (including changes between consecutive lactations). Accounting for clustering within herd-test-day was the adjustment with the largest influence on the severity-band model (Table S2): compared with the original specification (cow random effect only), the estimates kept a similar magnitude but their standard errors approximately tripled (72–79 band: −0.040 kg/h, SE 0.008, vs. −0.048 kg/h, SE 0.025; ≥80 band: −0.180 kg/h, SE 0.035, vs. −0.168 kg/h, SE 0.110). Further adjustment for year and season removed the positive association of the 68–71 band (from +0.015 to +0.005 kg/h) and hardly changed the other two bands. In the most conservative specification (year-by-herd and calendar month), the estimates for the 72–79 (−0.021 kg/h; p = 0.28) and ≥80 bands (−0.170 kg/h; p = 0.062) were attenuated and not significant. Excluding the records with |z| > 4 did not modify the results (−0.046 and −0.195 kg/h for the 72–79 and ≥80 bands).
In the DLNM, the cumulative change at a daily maximum THI of 80 was significantly negative in all nine specifications examined, ranging from −4.96 to −7.19 kg (Table S2), and the association dissipated (first lag whose 95% CI included zero) between lags 7 and 10 in all of them. In contrast, the lag of maximal association was not stable: it was lag 1 in five specifications, including the main model, but lag 6 or 7 when the horizon was shortened to 7 or 14 d or when 4 or 5 df were used in the lag dimension. The daily maximum THI of consecutive days was highly correlated (mean r = 0.89), which limits the ability of the model to apportion the effect among adjacent lags.
3.7. Consecutive Versus Isolated Hot Days
Of the 14,693 test-day records with complete exposure histories, 9246 had no day with a maximum THI ≥ 72 in the preceding 7 d, 2229 had only isolated hot days, 1607 had a longest run of 2 consecutive hot days and 1611 had a run of ≥3 consecutive hot days. Compared with records without hot days, isolated hot days (+0.14 kg; p = 0.79) and runs of 2 days (+0.83 kg; p = 0.16) were not associated with yield, whereas runs of ≥3 consecutive hot days reduced yield by 1.57 kg (95% CI: 0.41 to 2.72; p = 0.009). For the same number of hot days, a run of ≥3 consecutive days was associated with an additional loss of 1.89 kg (95% CI: 0.31 to 3.47; p = 0.021), whereas the number of hot days itself was not (+0.02 kg per day; p = 0.91).
4. Discussion
Using three years of continuous hourly THI monitoring linked to official monthly milk recording in four commercial herds, this study quantified the effect of heat load on test-day milk yield within individual cows and characterized, for the first time in the humid oceanic dairy region of northwestern Spain, both the shape of the exposure–response relationship and its temporal structure. Three findings stand out: the association between heat load and milk loss was acute and concentrated in the days immediately preceding the test day; it was non-linear, with an empirical onset close to a daily maximum THI of 77, and greater when hot days occurred consecutively; and susceptibility was greatest in early and mid-lactation cows. Because exposure and production were decomposed into within- and between-cow components, the estimates reported here reflect the change in a cow’s own yield when she experiences hotter versus cooler conditions, rather than permanent differences between animals or herds; the virtual identity between the random-intercept and the Mundlak within-cow models indicates that residual between-cow confounding was not driving the association.
The study was not designed to compare herds. The four herds shared the same municipality and regional climate, breed, housing type (sand-bedded free stalls), feeding system (PMR) and milking system (AMS), but they differed in size and number of robots and may have differed in diet composition and age structure. These stable differences were absorbed by the herd fixed effect and, above all, by the within-cow decomposition, in which each cow is compared with herself at hotter and cooler test days; the estimates therefore do not require the herds to be identical. Likewise, the different size of the herds does not prevent pooling: herd B contributed fewer cows (168) and fewer recording dates (19 versus 30 in the other herds) because it joined the official milk-recording scheme only in January 2024, but a similar number of monitored days (958 d versus 947–991 d), and each herd contributed to the estimates in proportion to its number of records. The small differences in the number of monitored days among herds resulted from occasional interruptions of the logger records (for example, battery failures that required replacement) and from the exclusion of days with fewer than 20 hourly readings, not from different study periods.
The empirical threshold identified here is broadly consistent with the dairy literature once the index scale is taken into account. Early test-day analyses placed the onset of milk loss at a daily average THI of about 72 [6], whereas work in high-yielding herds lowered this value to approximately 68 for daily average THI [9,10]. Our threshold is expressed on a daily maximum THI scale, which runs several units above the daily average, and the value of 77 obtained from the distributed-lag model (together with the severity-band model, in which losses became evident only from the 72–79 band onward) agrees closely with the maximum-THI threshold of around 73 reported for European Holsteins, including herds in southern Spain [11], and with maximum-THI thresholds of 74–75 for milk components in Brown Swiss [22]. The wide range of thresholds across the literature, from the mid-60 s in tropical and crossbred populations [12,13,31] to higher values in more thermotolerant breeds, underlines that thresholds are specific to breed, climate, index and trait, and supports the practice of estimating them empirically within each population rather than importing a universal cut-off [8].
The severity gradient is a central and practically relevant result. Hours of mild heat (THI 68–71) were not associated with any loss of milk. Moderate heat (72–79) did reduce yield, and the point estimate for severe heat (≥80) was about four times larger per hour. This steep, non-linear escalation is consistent with the curvilinear and accelerating declines in production above threshold described with change-point, polynomial and random-regression models [6,11,12,31] and reinforces the idea that the biological cost of heat is not merely a function of time spent warm but of the intensity of the thermal load. It also cautions against exposure metrics based on average THI, which dilute short, intense peaks, in line with the observation that the most appropriate index depends on how temperature and humidity combine in a given climate [8]. Nevertheless, once the clustering of cows within herd-test-day was taken into account, the estimate for severe heat had a wide confidence interval, so the size of this difference should be interpreted with caution.
Perhaps the most novel contribution is the explicit description of the temporal structure of the response. Most field studies relate production to the THI of the test-day itself or to an average over the test-day and a few preceding days (for example, the day of test plus the four previous days used in Australian genetic evaluations [34] or the maximum THI over the 15 days before sampling in Brown Swiss [22]), thereby assuming, rather than estimating, the relevant exposure window. By borrowing the distributed-lag non-linear modeling framework from environmental epidemiology [32], we were able to estimate how the effect of a single hot day is distributed over subsequent days. The depression in yield was greatest in the first days after exposure and was no longer detectable after 7 to 10 days. This acute, short-lived pattern provides an empirical justification for the short exposure windows used implicitly in previous work and suggests that averaging heat load over long periods, or over the whole lactation, obscures the biologically active interval. This timing should nevertheless be interpreted as a model-based description of the association rather than as an observed recovery: test-day yields were recorded monthly, so the lag profile was estimated from differences in the exposure histories preceding each test day, and the THI of consecutive days is strongly correlated (r = 0.89). Accordingly, the sensitivity analyses showed that the dissipation of the association between 7 and 10 days was robust, whereas the exact lag of maximal association was not and should not be over-interpreted.
Because the DLNM is additive, its lag profile describes the response to a single hot day and does not imply that cows recover when heat persists. The comparison of exposure patterns addressed this directly: isolated hot days, or two consecutive ones, were not associated with lower yield, whereas runs of three or more consecutive hot days reduced it by about 1.6 kg, and this persistence carried an additional loss even for the same number of hot days. This is consistent with the progressive accumulation of heat load when night-time conditions do not allow cows to dissipate the heat gained during the day, and it indicates that heat waves are more harmful than the sum of their individual days would suggest.
The acute timescale observed here should be distinguished from the well-documented carryover of heat stress experienced during the dry period and late gestation, which impairs mammary development and depresses yield throughout the following lactation [35]. The two phenomena operate over different windows and through different mechanisms: our findings concern the transient response of a lactating cow to recent thermal load, whereas prepartum heat stress programs the productive capacity of the next lactation. That the association of a hot day with yield extends over several days is nonetheless consistent with the understanding that heat-induced milk loss is not explained by reduced feed intake alone. Controlled pair-feeding studies attribute only about one-third to one-half of the decline to lower dry matter intake, the remainder arising from direct effects of hyperthermia on metabolism, endocrine signaling and nutrient partitioning [10,17], accompanied by oxidative stress [19]. These direct effects plausibly explain why the association extends over several days rather than being confined to the day of exposure.
The greater vulnerability of early and mid-lactation cows aligns with their higher metabolic heat production and milk output, which narrow their thermal safety margin, and with reports that lactating cows have lower THI thresholds than dry cows and that responses vary with stage of lactation and parity [29,30]. It also connects to the broader observation that decades of selection for yield have inadvertently reduced heat tolerance, so that the highest-producing animals lose more and show less persistent production under heat [11,28]. From a management perspective, these results argue for prioritizing heat-abatement resources (shade, ventilation and evaporative cooling [2,3]) toward early-lactation, high-producing cows and toward periods of severe or persistent heat load, and for acting promptly, given that the production cost is incurred within days. In the longer term, genetic and genomic selection for heat tolerance offers a complementary strategy, with breeding values already implemented in some countries [34,36].
That measurable, acute milk losses were detectable in the cool, humid, Atlantic climate of northwestern Spain is itself noteworthy. Although severe heat load (THI ≥ 80) was infrequent in these herds, it occurred every year, and moderate heat was common during summer. As average temperatures and the frequency of extreme events continue to rise [1,4], heat stress is likely to become a more prominent constraint even in temperate dairy regions traditionally considered low-risk, with the attendant economic consequences documented for warmer areas [5]. Beyond the yield losses examined here, elevated THI also compromises milk composition and quality [20,21,22,23], udder health and somatic cell counts [25,26], reproduction [24] and, at extreme values, survival [27], so the production effects reported here represent only part of the total burden.
Several limitations warrant caution in interpreting these findings. The study was observational, and thermal conditions were recorded by a single logger per herd rather than at the level of the individual animal’s microenvironment; although the within-cow design removes stable confounders, residual exposure misclassification cannot be excluded. Feed intake, body condition, specific cooling interventions and health events were not available, so the mechanisms underlying the losses are inferred from the literature rather than measured directly; we did, however, verify that no heat-abatement equipment was installed or modified during the study, limiting that source of confounding. Production was recorded monthly while exposure was continuous, so the distributed-lag relationship is identified from variation across monthly test-days and does not capture daily within-cow yield dynamics directly. The apparent positive association between mild warmth and yield below the threshold should not be read as a benefit of heat; it most likely reflects the coincidence of mild conditions with favorable spring feeding and management, and is treated here only as the reference portion of the exposure–response curve. Indeed, this positive association disappeared after adjustment for season. Moreover, the analysis involved four herds in a single region and one breed context; the lag profile became imprecise at the longest lags of the 21-day window, and milk composition, somatic cell count and reproductive outcomes were outside the present scope. Finally, the severity bands accumulate hours irrespective of whether they occur on consecutive or separate days, and the analysis of consecutive hot days used a simple classification within a 7-day window. These issues define clear avenues for future work: incorporating animal-level thermal sensors and feed-intake data, extending the distributed-lag approach to milk components, somatic cell count and fertility, and validating the exposure–response and lag structure across additional regions and production systems. In particular, the AMSs of these herds record the yield of each cow at every milking, so future studies using these daily data could validate the lag structure estimated here from monthly test days against observed day-to-day yield dynamics.
5. Conclusions
Heat load reduced the milk yield of individual cows in four commercial dairy herds of the humid Atlantic region of northwestern Spain, and this loss was acute, non-linear, greater when heat persisted and dependent on lactation stage. Mild heat (THI 68–71) was not associated with milk loss; losses appeared from a daily maximum THI of about 77, and the loss per hour of severe heat (THI ≥ 80) was about four times that of moderate heat (THI 72–79), although imprecisely estimated. According to the distributed-lag model, the association of a hot day with test-day yield was greatest in the first days after exposure and was no longer detectable after 7 to 10 days; because yield was recorded monthly, this timing is a model-based estimate rather than an observed recovery. Three or more consecutive hot days reduced yield by about 1.6 kg, whereas isolated hot days did not. Cows in early and mid-lactation were the most susceptible.
These results are useful for several groups. Dairy farmers, veterinarians and herd advisers can use a daily maximum THI of about 77, and especially forecasts of three or more consecutive hot days, as practical alert criteria to activate heat-abatement measures promptly, giving priority to early- and mid-lactation cows. Nutritionists can use the same criteria to anticipate dietary adjustments during hot spells, and barn designers and equipment suppliers can use them to plan ventilation and cooling in Atlantic barns. Milk-recording organizations and policymakers can use the evidence that heat-related losses already occur in this temperate region to support monitoring and climate-adaptation strategies. Scientifically, the study shows that distributed-lag non-linear models applied to routine test-day records can estimate the threshold and timing of the milk-yield response to heat, provided that the clustering of cows within test-days is taken into account.
Supplementary Materials
The following supporting information can be downloaded at: https://www.mdpi.com/article/10.3390/ani16223664/s1, Table S1: Climatic conditions recorded inside the barn of each herd (hourly loggers), January 2023 to October 2025. Table S2. Sensitivity of the main estimates to model specification.
Author Contributions
Conceptualization, E.N.M.D., R.M.O.; methodology, E.N.M.D., C.C.; formal analysis, E.N.M.D.; investigation, E.N.M.D., J.H.; data curation, E.N.M.D.; writing—original draft preparation, E.N.M.D.; writing—review and editing, C.C., J.H., R.M.O.; supervision, R.M.O., C.C. All authors have read and agreed to the published version of the manuscript.
Funding
This research received no external funding.
Institutional Review Board Statement
Ethical review and approval were waived for this study because it was based exclusively on pre-existing environmental records and routine official milk-recording data, and no experimental procedures were performed on the animals.
Informed Consent Statement
Informed consent was obtained from the owners of the four herds for the use of their records.
Data Availability Statement
The data presented in this study are available on request from the corresponding author, subject to the permission of the participating farms.
Acknowledgments
The authors thank the owners and staff of the four participating herds and the Galician Interprofessional Laboratory for Milk Analysis (LIGAL) for their collaboration. During the preparation of this manuscript, the authors used ClaudeClaude Opus 5.5 (Anthropic, 2026) to assist in writing the R code for the statistical analyses and figures and in drafting and editing the text, and ChatGPT-6.1 (OpenAI, image generation tool; accessed on 18 November 2026) to generate the Graphical Abstract. The authors have reviewed and edited the output and take full responsibility for the content of this publication.
Conflicts of Interest
The authors declare no conflicts of interest.
References
- Nardone, A.; Ronchi, B.; Lacetera, N.; Ranieri, M.S.; Bernabucci, U. Effects of Climate Changes on Animal Production and Sustainability of Livestock Systems. Livest. Sci. 2010, 130, 57–69. [Google Scholar] [CrossRef] [Scilit]
- Kadzere, C.T.; Murphy, M.R.; Silanikove, N.; Maltz, E. Heat Stress in Lactating Dairy Cows: A Review. Livest. Prod. Sci. 2002, 77, 59–91. [Google Scholar] [CrossRef] [Scilit]
- West, J.W. Effects of Heat-Stress on Production in Dairy Cattle. J. Dairy Sci. 2003, 86, 2131–2144. [Google Scholar] [CrossRef] [Scilit] [PubMed]
- Polsky, L.; von Keyserlingk, M.A. Invited Review: Effects of Heat Stress on Dairy Cattle Welfare. J. Dairy Sci. 2017, 100, 8645–8657. [Google Scholar] [CrossRef] [Scilit] [PubMed]
- St-Pierre, N.R.; Cobanov, B.; Schnitkey, G. Economic Losses from Heat Stress by US Livestock Industries. J. Dairy Sci. 2003, 86, E52–E77. [Google Scholar] [CrossRef] [Scilit]
- Ravagnolo, O.; Misztal, I.; Hoogenboom, G. Genetic Component of Heat Stress in Dairy Cattle, Development of Heat Index Function. J. Dairy Sci. 2000, 83, 2120–2125. [Google Scholar] [CrossRef] [Scilit] [PubMed]
- Mader, T.L.; Davis, M.S.; Brown-Brandl, T. Environmental Factors Influencing Heat Stress in Feedlot Cattle1,2. J. Anim. Sci. 2006, 84, 712–719. [Google Scholar] [CrossRef] [Scilit] [PubMed]
- Bohmanova, J.; Misztal, I.; Cole, J.B. Temperature-Humidity Indices as Indicators of Milk Production Losses Due to Heat Stress. J. Dairy Sci. 2007, 90, 1947–1956. [Google Scholar] [CrossRef] [Scilit] [PubMed]
- Zimbelman, R.; Rhoads, R.; Rhoads, M.; Duff, G.; Baumgard, L.; Collier, R. A Re-Evaluation of the Impact of Temperature Humidity Index (THI) and Black Globe Humidity Index (BGHI) on Milk Production in High Producing Dairy Cows. In Proceedings of the 24th Annual Southwest Nutrition and Management Conference, Tempe, AZ, USA, 26–27 February 2009. [Google Scholar]
- Tao, S.; Orellana Rivas, R.M.; Marins, T.N.; Chen, Y.C.; Gao, J.; Bernard, J.K. Impact of Heat Stress on Lactational Performance of Dairy Cows. Theriogenology 2020, 150, 437–444. [Google Scholar] [CrossRef] [Scilit] [PubMed]
- Carabano, M.J.; Logar, B.; Bormann, J.; Minet, J.; Vanrobays, M.L.; Diaz, C.; Tychon, B.; Gengler, N.; Hammami, H. Modeling Heat Stress under Different Environmental Conditions. J. Dairy Sci. 2016, 99, 3798–3814. [Google Scholar] [CrossRef] [Scilit] [PubMed]
- Ekine-Dzivenu, C.C.; Mrode, R.; Oyieng, E.; Komwihangilo, D.; Lyatuu, E.; Msuta, G.; Ojango, J.M.K.; Okeyo, A. Evaluating the Impact of Heat Stress as Measured by Temperature-Humidity Index (THI) on Test-Day Milk Yield of Small Holder Dairy Cattle in a Sub-Sahara African Climate. Livest. Sci. 2020, 242, 104314. [Google Scholar] [CrossRef] [Scilit] [PubMed]
- Niyonzima, Y.B.; Strandberg, E.; Hirwa, C.D.; Manzi, M.; Ntawubizi, M.; Rydhmer, L. The Effect of High Temperature and Humidity on Milk Yield in Ankole and Crossbred Cows. Trop. Anim. Health Prod. 2022, 54, 85. [Google Scholar] [CrossRef] [Scilit] [PubMed]
- Gaughan, J.B.; Mader, T.L.; Holt, S.M.; Lisle, A. A New Heat Load Index for Feedlot Cattle. J. Anim. Sci. 2008, 86, 226–234. [Google Scholar] [CrossRef] [Scilit] [PubMed]
- Mader, T.L.; Johnson, L.J.; Gaughan, J.B. A Comprehensive Index for Assessing Environmental Stress in Animals. J. Anim. Sci. 2010, 88, 2153–2165. [Google Scholar] [CrossRef] [Scilit] [PubMed]
- Berman, A. Effects of Body Surface Area Estimates on Predicted Energy Requirements and Heat Stress. J. Dairy Sci. 2003, 86, 3605–3610. [Google Scholar] [CrossRef] [Scilit] [PubMed]
- Rhoads, M.L.; Rhoads, R.P.; VanBaale, M.J.; Collier, R.J.; Sanders, S.R.; Weber, W.J.; Crooker, B.A.; Baumgard, L.H. Effects of Heat Stress and Plane of Nutrition on Lactating Holstein Cows: I. Production, Metabolism, and Aspects of Circulating Somatotropin1. J. Dairy Sci. 2009, 92, 1986–1997. [Google Scholar] [CrossRef] [Scilit] [PubMed]
- Rungruang, S.; Collier, J.L.; Rhoads, R.P.; Baumgard, L.H.; de Veth, M.J.; Collier, R.J. A Dose-Response Evaluation of Rumen-Protected Niacin in Thermoneutral or Heat-Stressed Lactating Holstein Cows. J. Dairy Sci. 2014, 97, 5023–5034. [Google Scholar] [CrossRef] [Scilit] [PubMed]
- Bernabucci, U.; Ronchi, B.; Lacetera, N.; Nardone, A. Markers of Oxidative Status in Plasma and Erythrocytes of Transition Dairy Cows during Hot Season. J. Dairy Sci. 2002, 85, 2173–2179. [Google Scholar] [CrossRef] [Scilit] [PubMed]
- Shwartz, G.; Rhoads, M.L.; VanBaale, M.J.; Rhoads, R.P.; Baumgard, L.H. Effects of a Supplemental Yeast Culture on Heat-Stressed Lactating Holstein Cows. J. Dairy Sci. 2009, 92, 935–942. [Google Scholar] [CrossRef] [Scilit] [PubMed]
- Choi, W.T.; Ghassemi Nejad, J.; Moon, J.O.; Lee, H.G. Dietary Supplementation of Acetate-Conjugated Tryptophan Alters Feed Intake, Milk Yield and Composition, Blood Profile, Physiological Variables, and Heat Shock Protein Gene Expression in Heat-Stressed Dairy Cows. J. Therm. Biol. 2021, 98, 102949. [Google Scholar] [CrossRef] [Scilit] [PubMed]
- Maggiolino, A.; Dahl, G.E.; Bartolomeo, N.; Bernabucci, U.; Vitali, A.; Serio, G.; Cassandro, M.; Centoducati, G.; Santus, E.; De Palo, P. Estimation of Maximum Thermo-Hygrometric Index Thresholds Affecting Milk Production in Italian Brown Swiss Cattle. J. Dairy Sci. 2020, 103, 8541–8553. [Google Scholar] [CrossRef] [Scilit] [PubMed]
- Habimana, V.; Nguluma, A.S.; Nziku, Z.C.; Ekine-Dzivenu, C.C.; Morota, G.; Mrode, R.; Chenyambuga, S.W. Heat Stress Effects on Milk Yield Traits and Metabolites and Mitigation Strategies for Dairy Cattle Breeds Reared in Tropical and Sub-Tropical Countries. Front. Vet. Sci. 2023, 10, 1121499. [Google Scholar] [CrossRef] [Scilit] [PubMed]
- De Rensis, F.; Scaramuzzi, R. Heat Stress and Seasonal Effects on Reproduction in the Dairy Cow-A Review. Theriogenology 2003, 60, 1139–1151. [Google Scholar] [CrossRef] [Scilit] [PubMed]
- Hamel, J.; Zhang, Y.; Wente, N.; Kromker, V. Heat Stress and Cow Factors Affect Bacteria Shedding Pattern from Naturally Infected Mammary Gland Quarters in Dairy Cattle. J. Dairy Sci. 2021, 104, 786–794. [Google Scholar] [CrossRef] [Scilit] [PubMed]
- Dahl, G.E.; McFadden, T.B. Symposium Review: Environmental Effects on Mammary Immunity and Health. J. Dairy Sci. 2022, 105, 8586–8589. [Google Scholar] [CrossRef] [Scilit] [PubMed]
- Vitali, A.; Segnalini, M.; Bertocchi, L.; Bernabucci, U.; Nardone, A. Lacetera N Seasonal Pattern of Mortality and Relationships between Mortality and Temperature-Humidity Index in Dairy Cows. J. Dairy Sci. 2009, 92, 3781–3790. [Google Scholar] [CrossRef] [Scilit] [PubMed]
- Ravagnolo, O.; Misztal, I. Genetic Component of Heat Stress in Dairy Cattle, Parameter Estimation. J. Dairy Sci. 2000, 83, 2126–2130. [Google Scholar] [CrossRef] [Scilit] [PubMed]
- Menendez-Buxadera, A.; Pereira, R.J.; El Faro, L.; Santana, M. Genotype by Environment Interaction Due to Heat Stress during Gestation and Postpartum for Milk Production of Holstein Cattle. Animal 2020, 14, 2014–2022. [Google Scholar] [CrossRef] [Scilit] [PubMed]
- Tu, P.A.; Yeh, Y.H.; Chen, Y.H.; Shiau, J.W.; Lin, T.Y.; Banhazi, T.; Yang, M.K. Stage-Specific Milk Yield Losses and Associated Sweating, Respiration, and Rectal Temperature Responses under Varying Temperature-Humidity Index Thresholds in Lactating and Dry Cows. J. Dairy Sci. 2024, 108, 2023–2035. [Google Scholar] [CrossRef] [Scilit] [PubMed]
- Soumri, N.; Carabano, M.J.; Gonzalez-Recio, O.; Bedhiaf-Romdhani, S. Modelling Heat Stress Effects on Milk Production Traits in Tunisian Holsteins Using a Random Regression Approach. J. Anim. Breed. Genet. 2024, 142, 155–169. [Google Scholar] [CrossRef] [Scilit] [PubMed]
- Gasparrini, A. Distributed Lag Linear and Non-Linear Models in R: The Package Dlnm. J. Stat. Softw. 2011, 43, 1–20. [Google Scholar] [CrossRef] [Scilit]
- Standard’s UNE-EN ISO/IEC 17025:2017; Requisitos Generales para la Competencia de los Laboratorios de Ensayo y Calibración (ISO/IEC 17025:2017). AENOR: Madrid, Spain, 2017.
- Nguyen, T.T.T.; Bowman, P.J.; Haile-Mariam, M.; Pryce, J.E.; Hayes, B.J. Genomic Selection for Tolerance to Heat Stress in Australian Dairy Cattle. J. Dairy Sci. 2016, 99, 2849–2862. [Google Scholar] [CrossRef] [Scilit] [PubMed]
- Tao, S.; Dahl, G. Invited Review: Heat Stress Effects during Late Gestation on Dry Cows and Their Calves. J. Dairy Sci. 2013, 96, 4079–4093. [Google Scholar] [CrossRef] [Scilit] [PubMed]
- Pryce, J.E.; Haile-Mariam, M. Symposium Review: Genomic Selection for Reducing Environmental Impact and Adapting to Climate Change. J. Dairy Sci. 2020, 103, 5366–5375. [Google Scholar] [CrossRef] [Scilit] [PubMed]

Disclaimer/Publisher’s Note: The statements, opinions and data contained in all publications are solely those of the individual author(s) and contributor(s) and not of MDPI and/or the editor(s). MDPI and/or the editor(s) disclaim responsibility for any injury to people or property resulting from any ideas, methods, instructions or products referred to in the content. |
© 2026 by the authors. Licensee MDPI, Basel, Switzerland. This article is an open access article distributed under the terms and conditions of the Creative Commons Attribution (CC BY) license.