


Abstract
Understanding how rhizosphere microbial communities and root-associated metabolites respond to nitrate-to-ammonium nitrogen ratios is critical for optimizing sesame nitrogen management. Three NO3−-N:NH4+-N ratios (NB1 = 10:0, NB2 = 6:4, and NB4 = 0:10) were applied to assess their effects on sesame agronomic traits, yield, microbial community structure, functional profiles, and metabolomic profiles via metagenomic sequencing and untargeted metabolomics. Samples were collected from four compartments: rhizosphere (H0 and D0) and bulk soils (H1 and D1) of both healthy (H) and diseased (D) plants. The results showed that the NB2 treatment (6:4) achieved the highest seed yield (923.43 kg·ha−1), representing a 7.04% increase compared to NB1 (10:0). The LEfSe analysis identified significantly differential taxa across treatments, with NB2RH0 harboring eight differential bacterial taxa (s_Methylobacterium radiodurans, s_Flavisolibacter ginsenosidimutans, s_Sphingomonas sp_LK11, etc.) and 3 differential fungal taxa (g_Cercospora, o_Mycosphaerellales, and f_Mycosphaerellaceae). Functional annotation via KEGG, CAZy, eggNOG, and GO revealed treatment-specific enrichment of pathways related to Peroxisome (map04146), Biosynthesis of various plant secondary metabolites (map00999), EC 4.1.1.48, GH78, and M00848. PLS-DA and univariate analyses identified multiple metabolites closely associated with disease resistance, including Hamaudol, Nodakenin, Psoralenoside, Rhapontigenin, and Columbianetin acetate in positive ion mode, which were significantly more abundant in healthy-plant rhizosphere soils. In negative ion mode, Pyranonigrin A, Pteroic acid, and Botryaloic acid acetate showed significantly lower abundances in rhizosphere soils of healthy plants than in those of diseased plants. Overall, these findings demonstrate that they significantly shaped rhizosphere microbial communities, functional profiles, and metabolomic profiles. This study provides valuable insights into nitrogen form management for improving soil health in sesame cultivation.
1. Introduction
The ratio of nitrate (NO3−) to ammonium (NH4+) nitrogen serves as a critical regulator of soil microbial communities, with profound implications for ecosystem functioning and agricultural productivity. Research demonstrates that balanced NO3−:NH4+ ratios (typically 50:50) optimize microbial diversity and function through multiple mechanisms. In tobacco systems, a 50:50 ratio reduced nitrogen runoff by 27.32% [1], which could effectively reduce the morbidity and disease index of tobacco bacterial wilt and increase the relative abundance of Bacillus and Flavobacterium in the soil [2]. Moreover, biochar co-applied with NH4NO3 reshaped the microbial community composition, increasing the relative abundances of AOA-Nitrososphaera and AOB-norank_d_Bacteria; in contrast, NH4NO3 alone decreased those of AOA-norank_d_Archaea and AOB-Nitrosomonadaceae [3]. These effects were mediated through pH modulation, as evidenced by maize rhizosphere studies where NH4+ favored acidophiles (Acidibacter) and NO3− enriched bacteria preferring higher pH (Sphingomonas) [4]. In rice, combined ammonium–nitrate application increased NUE by 10% and 19% over sole ammonium and sole nitrate, respectively, enriched more high-LDA bacterial biomarkers (six vs. four), and enhanced N-metabolism gene expression and enzyme activities [5]. These findings collectively indicated that optimal NO3−:NH4+ ratios maintained a more balanced microbial community—reflected in taxonomic composition, functional potential and pathogen suppression—while improving crop yield and nitrogen use efficiency.
Sesame (Sesamum indicum L.) is a major specialty oilseed crop cultivated worldwide, with primary production concentrated in China, Myanmar, Ethiopia, Sudan, and India [6,7]. Sesame is also a crop that suffers from severe continuous cropping obstacles [8,9]. Its primary diseases are stem blight and bacterial wilt, both of which are soil-borne diseases with no specific chemical agents available for effective control [8,9]. Farmers are accustomed to continuous sesame cropping, which has led to increasingly severe disease outbreaks [8,9]. Current management strategies for alleviating continuous cropping obstacles primarily include reduced nitrogen fertilizer application [10], biochar amendment [7,11], and optimization of the nitrate-to-ammonium nitrogen ratio [12]. In particular, the effects of this nitrogen form ratio on the occurrence of crop diseases have received considerable research attention. For example, the agricultural benefits of tailored NO3−:NH4+ ratios extended beyond microbial ecology to encompass disease management and crop performance. Disease-suppressive soils consistently emerge under specific nitrogen regimes: sesame grown with 5:5 ratios showed 98 unique OTUs of beneficial Proteobacteria and reduced bacterial wilt incidence through enhanced stress-response pathways [12], and evidence from the banana system suggests that NH4+-induced acidification and the associated microbial community shifts might aggravate Fusarium wilt, consistent with the negative association between ammonium rate and host defense signaling (e.g., PR1 expression) reported in that study [13]. Crop-specific optimization was evident in tea (75:25 ratio associated with altered theanine/glutamine synthesis rather than maximal theanine accumulation) [14] and maize (3:1 ratio for 9.30–32.82% higher nitrate reductase activity) [15], reflecting how plants and their microbiomes co-evolve with nitrogen forms. These outcomes underscore a central paradigm: microbial communities act as biological integrators of nitrogen form effects, translating chemical inputs into ecosystem services.
The microbial community structure in soil played a pivotal role in determining plant health, with significant differences observed between healthy and diseased plants across various agricultural systems. For instance, the microbial diversity and abundance in the roots of diseased Yuanyang Nanqi plants were markedly lower than in healthy specimens, accompanied by increased proportions of Pseudomonas and Fusarium [16]. Similarly, in Lycium barbarum, fungal richness in the rhizoplane and root zone and bacterial richness in the rhizosphere and root zone were significantly higher in healthy plants than in diseased plants, and Fusarium was more abundant in the rhizoplane and rhizosphere soil of diseased plants [17]. This trend is consistent with findings in clubroot-diseased soils, where healthy soils exhibited higher fungal diversity and a greater abundance of beneficial microorganisms like Chaetomium and Sphingomonas [18]. In contrast, diseased soils often harbor higher levels of antibiotic resistance genes (ARGs), as seen in Fusarium wilt-affected soils, where the tetracycline resistance gene tetX was significantly more abundant [19]. Functional analyses further highlight these disparities, with healthy soils supporting metabolic and saprophytic functions, while diseased soils display a higher prevalence of pathogenic traits [16,17].
Although our research group published a paper in 2022 on the effects of the nitrate-to-ammonium nitrogen ratio on the bacterial community and functional profiles in the rhizosphere soil of continuously cropped sesame [12], the underlying mechanisms at the metagenomic and metabolomic levels remain largely unclear. Therefore, we hypothesized that an optimal nitrate/ammonium ratio alleviated sesame continuous cropping obstacles by restructuring rhizosphere microbiota, shifting the microbial balance from pathogenic to beneficial taxa and altering key soil metabolic profiles. The integrated microbiome-metabolome correlations, rather than individual independent factors, drive effective disease suppression via complex multi-kingdom interaction networks. This work provides a fundamental basis for targeted continuous cropping obstacle mitigation strategies.
2. Materials and Methods
2.1. Experimental Design and Field Implementation
The field study was conducted during the 2024 growing season (from 10 June to 11 September) in Luoxi Town, Jinxian County, Nanchang City, Jiangxi Province of China (28.37° N, 116.27° E), a region characterized by a subtropical monsoon climate with distinct wet and dry seasons. The experimental site received an average annual precipitation of 1720 mm, with approximately 60% occurring during the trial period. The soil was classified as red soil upland with acidic pH (5.8 in 0.01 M CaCl2), moderate organic carbon content (1.8% by Walkley–Black method), and a cation exchange capacity of 12.4 cmol (+) kg−1. Initial soil analysis revealed mineral nitrogen levels of 32.5 kg ha−1.
A randomized complete block design with three nitrogen form ratio treatments and four independent biological replicates (12 plots in total) was implemented in the field. Each individual plot was sized at 2 m × 6 m (12 m2), with a 0.5 m wide non-fertilized buffer zone set between adjacent plots to avoid cross-contamination of different nitrogen sources. The three treatments were specifically designed to cover the full gradient of nitrate to ammonium ratios, with a consistent total nitrogen application rate of 75 kg N ha−1 across all groups to eliminate nitrogen input quantity as a confounding variable. The three treatments were set as follows: NB1, 100% NO3−-N, applied as calcium magnesium nitrate (CaMg(NO3)4·4H2O); NB2, 60% NO3−-N + 40% NH4+-N, co-applied with calcium magnesium nitrate and ammonium chloride (NH4Cl); NB4, 100% NH4+-N, applied as ammonium chloride (NH4Cl). All the stated nitrate/ammonium ratios in this study refer explicitly to the applied nitrogen fertilizer proportions, rather than the in-situ soil inorganic nitrogen ratios after fertilization. Counter-ions (Ca2+, Mg2+, Cl−) introduced by different fertilizers were pre-balanced across all treatments with corresponding non-nitrogen salts to exclude non-target ion effects on soil properties and plant performance. No additional nitrogen topdressing was performed, and 100% of the total nitrogen fertilizer for each plot was incorporated into the 0–15 cm topsoil layer as basal fertilization before sowing. A Supplementary Table (Table S1) was provided to clearly document the full nitrogen fertilizer application scheme for each treatment.
Sesame (Sesamum indicum L. cv. Yuzhi No. ND837, non-wild species) was grown under continuous monocropping for two years to induce natural bacterial wilt incidence. In the third year, soil samples were collected at maturity stage. Each of the three nitrogen treatments comprised four independent field plots, and within each plot four sample categories were collected: rhizosphere soil of healthy plants (RH0, disease severity grade 0 indicates no visible lesions on the leaves [9]), bulk soil of healthy areas (RH1), rhizosphere soil of diseased plants (RD0, disease severity grade 9 indicates whole-plant wilt and death [9]), and bulk soil of diseased areas (RD1). For RH0 and RD0, rhizosphere soil was collected from five healthy and five diseased plants, respectively, within each plot and composited into a single plot-level sample; for RH1 and RD1, bulk soil was collected at five points approximately 10 cm from the main root of healthy and diseased plants, respectively, within each plot and composited into a single plot-level sample. Compositing was performed strictly within each plot, and samples from different plots were never pooled. Samples were flash-frozen in liquid nitrogen and stored at −80 °C. Two different analytical structures were used depending on the variable. For yield, the three nitrogen treatments were compared by one-way ANOVA with the four independent field plots per treatment as replicates (n = 4), followed by LSD post hoc tests. For soil nutrients, soil microbial communities and metabolites, the two soil positions (rhizosphere vs. bulk) and the two plant health statuses (healthy vs. diseased) within each nitrogen treatment were treated as separate groups, 12 groups in total (3 nitrogen treatments × 2 positions × 2 health statuses); these groups were compared by one-way ANOVA followed by LSD post hoc tests. Because each group was represented by a single within-plot composite per plot and samples from different plots were never pooled, each sample entering the analysis traced to a single independent field plot.
2.2. Metagenomic Sequencing and Analysis
2.2.1. DNA Extraction and Quality Control
Total genomic DNA was extracted from soil samples using the Soil Genomic DNA Extraction Kit (Spin Column Type, Catalog No. DP336; Tiangen Biotech, Beijing, China). The concentration, integrity, and purity of the extracted DNA were assessed using an Agilent 5400 system (Agilent Technologies, Santa Clara, CA, USA). Only DNA samples meeting the quality criteria were subjected to subsequent metagenomic library construction and high-throughput sequencing. We submitted the DNA sequences to the NCBI-SRA under the accession number PRJNA1521067 (https://dataview.ncbi.nlm.nih.gov/object/PRJNA1521067, accessed on 29 September 2026).
2.2.2. Library Construction and Sequencing
Sequencing libraries were constructed using the NEBNext® Ultra™ DNA Library Prep Kit for Illumina (NEB, Massachusetts, USA, Catalog#: E7370L) in accordance with the manufacturer’s recommended protocol, with distinct index codes incorporated for each sample. Briefly, genomic DNA was sheared via sonication to approximately 350 bp fragments. The fragmented DNA then underwent end-repair, A-tailing, and ligation with the full-length Illumina-compatible adapters, followed by PCR enrichment. The resulting PCR products were purified using the AMPure XP system (Beckman Coulter, Beverly, CA, USA). Library quality was subsequently evaluated on the Agilent 5400 system (Agilent, CA, USA), and the library concentration was determined via QPCR at 1.5 nM. Finally, qualified libraries were pooled and subjected to paired-end 150 bp (PE150) sequencing on Illumina platforms (Novogene, Tianjin, China), with pooling volumes adjusted according to the effective library concentration and the required data yield per sample.
2.2.3. Bioinformatic Processing
Raw metagenomic reads from soil samples (bacteria, fungi, viruses) generated on Illumina NovaSeq (Novogene, Tianjin, China)were preprocessed using Kneaddata (https://huttenhower.sph.harvard.edu/kneaddata, accessed on 25 November 2024), wherein Trimmomatic removed adapters (ILLUMINACLIP:adapters_path:2:30:10) [20], low-quality bases (SLIDINGWINDOW:4:20, quality ≤ 20), and reads < 50 bp (MINLEN:50), followed by Bowtie2 (very sensitive) alignment against host database to filter host-origin sequences [21], with FastQC (http://www.bioinformatics.babraham.ac.uk/projects/fastqc/, accessed on 25 November 2024) validating QC efficacy. Species identification was performed using Kraken2 with a custom microbial database (bacteria, fungi, archaea, viruses from NCBI NT and RefSeq) [22], followed by Bracken for relative abundance estimation [23], where the local Kraken2 database contained 16,799 known bacterial genomes. Clean reads were aligned to UniRef90 via Humann2 (DIAMOND-based) [24], yielding functional annotations and relative abundance tables through UniRef90 ID-to-database mapping, enabling downstream analyses including abundance clustering, PCoA [25] and NMDS [26] (species only), sample clustering, and LEfSe test for group comparisons [27]. Additionally, DIAMOND [28] aligned clean reads against CARD database [29] (parameters: -e 0.001, -i 80) to obtain relative abundance of potential antibiotic resistance genes per sample. A one-way analysis of variance (ANOVA) was conducted to test the effect of the single factor on the measured variables, following the procedures described by Bewick et al. [30]. A three-way analysis of variance (ANOVA) was performed to test the main effects and interaction effects of the three factors, following the procedures described by Bethea et al. [31].
2.2.4. Statistical Analysis
Microbial β-diversity (Bray–Curtis dissimilarity) was visualized via PCoA (PERMANOVA, 999 permutations) [32]. Differential taxa/genes were identified with DESeq2 (FDR < 0.05, |log2FC| ≥ 1) [33]. Differential abundance analysis of microbial genes was performed using the Wekemo Bioincloud platform [34]. The input data was the UniRef90 protein abundance table derived from HUMAnN3 (3.6) analysis. The DESeq2 method was utilized to identify differentially abundant genes between groups. Genes with an adjusted p-value (padj) < 0.05 and an absolute Log2 Fold Change (|log2FC|) ≥ 1 were considered statistically significant. The analysis was performed using the Wekemo Bioincloud platform [34], specifically the “Gene Enrichment → Clustering Heatmap” module within the “Reads-based (reference) metagenomic analysis” workflow. Differential gene abundance was evaluated, and the top 20 most significant genes were visualized using a clustered heatmap with row and column dendrograms. The over-representation analysis (ORA) of KEGG pathways was performed using the clusterProfiler package in R, implemented on the Wekemo Bioincloud platform [34]. A full factorial model testing interaction terms was not performed because the analysis platform used for these datasets does not support factorial interaction testing; therefore, differences were interpreted at the level of the 12 jointly defined groups. Redundancy analysis (RDA) was used to resolve the effects of environmental factors on variation in community structure (or species composition), and permutation tests were applied to assess the significance of each environmental variable [35]. Spearman‘s rank correlation was used to assess the monotonic associations between environmental factors and species abundance, as well as between environmental factors and functional gene abundance [36]. Linear discriminant analysis effect size (LEfSe) was employed to identify biomarker features that significantly differed among nitrate-to-ammonium ratio treatments at both microbial community structure and functional prediction levels [27]. Expression patterns of differentially expressed genes (DEGs) were visualized using a cluster heatmap [37].
2.3. Metabolomic Profiling and Data Processing
2.3.1. Metabolite Extraction
Soil samples (1.0 g each) were transferred into EP tubes and thoroughly vortexed with prechilled 80% methanol for resuspension. Following a 5-min incubation on ice, the mixtures were centrifuged at 15,000× g and 4 °C for 15 min. The resulting supernatants were collected and subjected to a second centrifugation step at the same temperature at 15,000× g for 20 min. The final clear solutions were then introduced into the LC-MS/MS system for analysis.
2.3.2. UPLC-QTOF-MS Analysis
UHPLC-MS/MS analysis was carried out on a Vanquish UHPLC system (Thermo Fisher, Langenselbold, Germany) coupled to either an Orbitrap Q Exactive™ HF or Q Exactive™ HF-X mass spectrometer (Thermo Fisher, Langenselbold, Germany). Chromatographic separation was achieved on a Hypersil Gold column (100 × 2.1 mm, 1.9 μm) at a flow rate of 0.2 mL/min over a 12-min linear gradient elution program. Mobile phases consisted of eluent A (0.1% FA in water) and eluent B (methanol) for both positive and negative ionization modes. The gradient profile was programmed as follows: 2% B at 0–1.5 min; ramped to 85% B at 3 min; further increased to 100% B at 10 min; returned to 2% B at 10.1 min; and maintained at 2% B until 12 min. Mass spectrometric detection was performed in both positive and negative ion modes using the Q Exactive™ HF platform, with parameters set as: spray voltage 3.5 kV, capillary temperature 320 °C, sheath gas 35 psi, auxiliary gas 10 L/min, S-lens RF level 60, and auxiliary gas heater temperature 350 °C.
2.3.3. Data Processing
Raw data acquired from UHPLC-MS/MS were processed using the XCMS software (4.5.1) package for peak alignment, peak detection, and quantification of individual metabolites [38]. Subsequently, peak intensities were normalized against the total spectral intensity using the first sample as the reference. Metabolite identification was carried out by matching the acquired data against a high-quality secondary spectral database, with mass tolerance set at 10 ppm and adduct ion information taken into consideration, thereby yielding both accurate qualitative assignments and relative quantitative measurements. The specific QC measures are as follows: Pooled QC samples: We prepared pooled QC samples by mixing equal aliquots from all biological samples. These QC samples were injected periodically throughout the analytical run to monitor instrument stability and reproducibility. Extraction blanks: Extraction blanks (53% methanol–water solution) were prepared and processed identically to the biological samples. These blanks were used to identify and subtract background ions during data preprocessing (using XCMS) to eliminate background contamination. Instrument drift and batch effects: All samples were analyzed in a single analytical batch, thereby inherently avoiding inter-batch effects. Instrument drift was evaluated by calculating the Pearson correlation between QC samples in positive and negative ion modes (Figure S1). The high mutual correlation among QC samples demonstrated high analytical stability.
2.3.4. Statistical Analysis
These metabolites were annotated using the KEGG database (https://www.genome.jp/kegg/pathway.html, accessed on 29 November 2024), HMDB database (https://hmdb.ca/metabolites, accessed on 29 November 2024) and LIPIDMaps database (http://www.lipidmaps.org/, accessed on 29 November 2024). The metabolomics data were analyzed using a multi-tiered statistical approach. First, multivariate pattern recognition was performed through partial least squares discriminant analysis (PLS-DA) using MetaboAnalystR with unit variance scaling, where variables with variable importance in projection (VIP) scores > 1.0 were considered biologically relevant. For univariate analysis, Student’s t-tests (p < 0.05) combined with fold-change thresholds (>2) were applied to identify significantly altered metabolites between experimental groups. Finally, metabolic pathway analysis was conducted in MetaboAnalystR using a hypergeometric test, with pathways showing impact values >0.1 deemed statistically significant. Unless otherwise indicated, all analytical procedures described in this report were conducted using the MetaboAnalystR (2.0.1) package within the R environment [39]. Random Forest analysis was performed to evaluate variable importance [40]. The Mean Decrease Accuracy was calculated to rank the top differential metabolites (biomarkers), and the results were presented in a variable importance plot.
3. Results
3.1. Effects on Agronomic Traits and Seed Yield in Sesame
The variation in the NO3−-N/NH4+-N ratio had a relatively minor influence on the agronomic traits of sesame. Specifically, the fruiting spike length under the NB4 treatment exhibited an increase of 3.4 cm compared to that under NB2. Furthermore, the effects on yield-contributing components were also minimal, as no significant differences were detected among the treatments (p > 0.05). In terms of seed yield, the NB2 treatment produced the highest yield at 923.43 kg·ha−1, although this was only 7.04% higher than that of NB1 (Table S2). Hence, this study further focused on changes in the soil nutrients, soil microbial community, and metabolites to reveal the early effects of the treatment on soil ecological functions.
Analysis of variance (ANOVA) revealed that among the soil chemical properties measured, only pH, available phosphorus (AP), and available potassium (AK) exhibited significant differences among treatments, whereas soil organic matter (OM), available nitrogen (AN), and available boron (AB) showed no significant treatment effects. Under the NB2 and NB4 treatments, no significant differences in pH were observed across the four sampling positions (RD0, RD1, RH0, and RH1). In contrast, under the NB1 treatment, pH varied significantly among positions, with the NB1RD0 treatment showing increases of 5.68% and 4.85% compared to NB1RD1 and NB1RH1, respectively. For AP, the NB1RD1 treatment recorded significantly higher values than NB1RH0 and NB1RH1, with increases of 64.32% and 62.64%, respectively. Additionally, both NB1RD0 and NB4RD0 significantly increased AP by 46.16% and 46.19%, respectively, relative to NB2RH0 (Table S3).
3.2. Effects on Microbial Community Structure
Based on the analysis and statistics of the obtained samples, the numbers of reads and relative abundances of these taxa were as follows: Archaea (2,404,309 and 1.93%), Bacteria (120,787,670 and 97.08%), Bamfordvirae (155 and 0.00%), Fungi (1,218,569 and 0.98%), Heunggongvirae (11,876 and 0.01%), Loebvirae (115 and 0.00%), Orthornavirae (52 and 0.00%), Pararnavirae (13 and 0.00%), Sangervirae (10 and 0.00%), Shotokuvirae (14 and 0.00%), and Viruses (3036 and 0.00%). Among the bacterial community, the top five most abundant taxa (species level) were uncultured_bacterium, uncultured_Actinomycetes bacterium, Sinomonas atrocyanea, Bradyrhizobium guangdongense, and uncultured_Acidobacteriota bacterium (Figure 1a). Regarding the fungal community, the top five most abundant taxa (genus level) were Aspergillus, Fusarium, unclassified, Rhizophagus, and Penicillium (Figure 1b).
Figure 1.
Relative abundance of microbial groups under different nitrate-to-ammonium ratios. (a) Relative abundance of bacterial species under different nitrate-to-ammonium ratio treatments. (b) Relative abundance of fungal genera under different nitrate-to-ammonium ratio treatments. Note: Bar charts show the relative abundance of the top taxa at the species level for each microbial group. Each bar represents one treatment with a specific nitrate-to-ammonium ratio, and different colors indicate different species. Treatments include varying proportions of NO3−-N to NH4+-N (e.g., 10:0, 6:4, 0:10).
Non-metric multidimensional scaling (NMDS) analysis was performed to visualize the microbial community structures among treatments. For bacteria, the NMDS stress value was 0.175, and PERMANOVA revealed a significant effect of treatment on community composition (F = 1.481, p = 0.001) (Figure S1a). For fungi, the stress value was 0.305, and PERMANOVA indicated a significant difference among treatments (F = 1.241, p = 0.034) (Figure S1b). For archaea, the stress value was 0.266, with no significant treatment effect detected by PERMANOVA (F = 0.805, p = 0.734) (Figure S1c). For viruses, the stress value was 0, and PERMANOVA showed no significant difference among treatments (F = 0.835, p = 0.781) (Figure S1d).
LEfSe (Linear Discriminant Analysis Effect Size) analysis revealed the presence of significantly differential bacterial taxa across the 12 treatments. Among these, the NB2RD0 treatment harbored the highest number of differential bacterial species (27 taxa), comprising s_Paenibacillus mucilaginosus, g_Chenggangzhangella, s_Chenggangzhangella methanolivorans, g_Sphingopyxis, s_Shinella sp HZN7, g_Shinella, s_Sphingobium xenophagum, g_Paenibacillus, s_Rhizobium pseudoryzae, s_Pseudomonas aeruginosa, s_Acinetobacter junii, g_Acinetobacter, f_Moraxellaceae, s_Sphingobium yanoikuyae, o_Moraxellales, g_Pseudomonas, g_Sphingobium, g_Comamonas, s_Comamonas aquatica, f_Comamonadaceae, o_Sphingomonadales, f_Sphingomonadaceae, s_Stutzerimonas stutzeri, g_Stutzerimonas, f_Pseudomonadaceae, o_Pseudomonadales, and c_Gammaproteobacteria (Figure S2). The NB2RH0 treatment exhibited eight differentially abundant bacterial taxa, namely s_Methylobacterium radiodurans, g_Flavisolibacter, s_Flavisolibacter_ginsenosidimutans, f_Chitinophagaceae, s_Sphingomonas ginsengisoli_An_et_al_2013, c_Chitinophagia, o_Chitinophagales, and s_Sphingomonas sp LK11 (Figure S2). The remaining ten treatments each contained a small number of differential bacterial taxa (Figure S2). Three-way ANOVA showed that only three species were significantly affected by the experimental factors, each by a single factor: Sphingomonas_sp._LK11 by nitrogen, and s_Methylobacterium radiodurans and s_Sphingomonas sp._LK11 by Status (p < 0.05) (Table S5).
For the fungal community, LEfSe analysis identified significantly differential taxa in seven of the 8 treatments (NB1RD0, NB1RD1, NB1RH0, NB2RD1, NB2RH0, NB4RD0, NB4RH0, and NB4RH1). The NB4RH0 treatment showed the highest number of differential fungal taxa (6 taxa), including f_Ustilaginaceae, p_Basidiomycota, o_Ustilaginales, c_Ustilaginomycetes, g_Bipolaris, and g_Pseudozyma (Figure 2). The NB2RH0 treatment had three differential fungal taxa (g_Cercospora, o_Mycosphaerellales, f_Mycosphaerellaceae), while the NB2RD1 treatment contained two differential fungal taxa (g_Chaetomium and o_Sordariales) (Figure 2). The other five treatments (NB1RD0, NB1RD1, NB1RH0, NB4RD0, and NB4RH1) each contained a small number (1–4) of differential fungal taxa, specifically: NB1RD0 (c_Leotiomycetes, f_Sclerotiniaceae, o_Helotiales, and g_Botrytis) (Figure 2). For the fungal genus g_Cercospora, three-way ANOVA revealed no significant effects of Nitrogen ratios, Location, Status, or any of their interactions (p ≥ 0.05) (Table S5).
Figure 2.
LEfSe analysis of fungal taxa (genus level) under different nitrate-to-ammonium ratios (LDA score ≥ 3.0). Note: The LEfSe (Linear discriminant analysis Effect Size) analysis identifies differentially abundant taxa among treatments with varying NO3−-N/NH4+-N ratios. The bar length represents the LDA (Linear Discriminant Analysis) score, indicating the effect size of each taxon’s abundance difference. Only taxa with LDA ≥ 3.0 are shown. Different colors represent different treatment groups in which the taxa are enriched.
3.3. Effects on Bacterial Community Functions
KEGG (Kyoto Encyclopedia of Genes and Genomes) functional annotation revealed significant differences in pathway abundance across multiple treatments at different hierarchical levels. At Level 2, four treatments (NB1RD1, NB2RD0, NB2RH0, and NB4RH0) exhibited significantly different functions, which were categorized into Cell growth and death, Amino acid metabolism, and Transport and catabolism (Figure 3a). At Level 3, significant differential functions were identified in eight treatments, including NB1RD0 (map02024), NB1RD1 (map00624, map04112), NB1RH1 (map00130), NB2RD0 (map00290), NB2RD1 (map00760), NB2RH0 (map04146, map00999), NB4RD1 (map00040, map00310, map04122), and NB4RH1 (map00900) (Figure 3b). At the Module level, five treatments showed significant differences in functional modules, namely NB1RD1 (M00159 and M00570), NB1RH1 (M00696, M00697, M00575, and M00046), NB2RD0 (M00174, M00031, M00804, M00528, and M00019), NB2RH0 (M00345, M00848, M00344, and M00052), and NB4RH1 (M00142, M00133, M00641, M00930, M00931, and M00155) (Figure 3c). At Level 4, significant differences in enzyme commission (EC) numbers were observed in ten treatments, as follows: NB1RD0 (EC:2.1.1.74, EC:2.4.2.29, EC:7.1.1.1, EC:6.1.1.22, EC:1.1.1.35, EC:2.1.3.15), NB1RD1 (EC:1.1.1.22, EC:3.4.21.53), NB1RH0 (EC:6.1.1.19, EC:2.3.1.35, EC:5.4.2.11, EC:1.4.1.1, EC:2.7.4.3), NB1RH1 (EC:2.1.1.148, EC:7.1.3.1), NB2RD0 (EC:1.7.1.13, EC:2.8.1.7, EC:2.4.2.8), NB2RH0 (EC:1.1.5.3, EC:1.1.1.3, EC:4.1.1.48, EC:1.3.5.1, EC:3.6.1.1, EC:2.1.2.1), NB2RH1 (EC:2.4.2.14), NB4RD1 (EC:4.1.99.22), NB4RH0 (EC:3.2.1.141, EC:4.3.2.1), and NB4RH1 (EC:2.3.1.129, EC:1.21.98.1, EC:3.6.3.12) (Figure S3a).
Annotation of resistance genes revealed that significantly different resistance genes were detected in four treatments, including NB1RD1 (ARO:3000118), NB1RH0 (ARO:3003318 and ARO:3000816), NB1RH1 (ARO:3000412), and NB2RD0 (ARO:3002927) (Figure 3d). CAZy (Carbohydrate-Active enZymes) annotation identified significantly differential functions in eight treatments, namely NB1RD0 (GH67), NB1RH0 (GH2), NB2RD0 (CE15), NB2RD1 (GH11, GH57, GH177, CBM2, and GH51), NB2RH0 (GH78 and GH140), NB4RD0 (GH38), NB4RD1 (CBM13), and NB4RH0 (GH54) (Figure S3b). EGGNOG functional annotation revealed significant differences in seven treatments, including NB1RD0 (ENOG41082BR), NB1RH0 (ENOG4105P3U), NB2RD0 (ENOG410XTSN and ENOG41066BD), NB2RD1 (COG1961), NB2RH0 (COG0129, ENOG410XPTE, and ENOG4105DVV), NB4RD0 (COG1143), and NB4RH1 (ENOG4105C4P, ENOG4105DT6, COG0258, ENOG4105D5G, COG0262, and COG0542) (Figure S3c). GO (Gene Ontology) annotation showed significantly differential terms in six treatments: NB1RD1 (GO:0016616), NB2RD0 (GO:0006353, GO:0008134, and GO:0009055), NB2RD1 (GO:0004553, GO:0016020, and GO:0003824), NB2RH0 (GO:0015986, GO:0004386, GO:0048037, GO:0016301, GO:0006310, GO:0000287, GO:0006355, GO:0003677, and GO:0005737), NB4RD0 (GO:0016740), and NB4RD1 (GO:0008168, GO:0004803, GO:0003676, GO:0006313, and GO:0050660) (Figure S3d).
A total of 537,096 functional potentials were analyzed. As illustrated in the volcano plot (Figure 4a), the differential analysis identified 380 significantly differentially abundant functional potentials. Notably, the number of decreased functional potentials (320 functional potentials, shown in green) was substantially higher than that of increased functional potentials (60 functional potentials, shown in red). The most significantly decreased functional potential was identified as UniRef90_A0A366U8W6, which exhibited a log2FC of approximately −5 and a highly significant padj value (–log10 padj = 5). The majority of functional potentials showed no significant difference (gray points), indicating that the observed changes were specific to certain functional pathways. The heatmap displays the relative abundance of 20 differentially abundant UniRef90 across two groups: NB2RD0 (n = 4) and NB2RH0 (n = 4). Visual inspection reveals a clear separation between the two groups, with the majority of functional potentials showing higher abundance in the NB2RH0 group compared to the NB2RD0 group. Notably, functional potentials such as UniRef90_A0A2S6NHL9, UniRef90_A0A2S6MUA3, and UniRef90_UPI000C06968C exhibited a marked increase in red intensity in the NB2RH0 samples (Figure 4b). The circular cnetplot illustrated the enrichment of three KEGG pathways: Ribosome, Longevity regulating pathway—worm, and RNA degradation. The Ribosome pathway contained the largest number of enriched functional potentials (n = 6), including K02879, K02884, K02911, K02963, K02982, and K02996, among others. Notably, most of these functional potentials exhibited a negative fold change (blue coloration), indicating a decrease, except for K02996 which showed a positive fold change (red). The Longevity regulating pathway and RNA degradation pathway each harbored fewer functional potentials, with mixed fold change directions (Figure 4c). Topological analysis revealed a distinct “core-periphery” structure, with tight interactive coupling between increased and decreased functional potentials. The core region contains several highly connected hub proteins, primarily including COG0459, COG0443, COG0468, and COG0726. Among them, COG0726 was a significantly up-regulated node that showed dense interactions with multiple decreased core proteins (such as COG0459, COG0443, and COG0468). Additionally, COG0086, COG0103, and COG0553 were identified as other important increased functional potentials (Figure 4d).
3.4. Effects on Metabolomic Profiles
Principal component analysis (PCA) of the soil metabolomic data was performed under both positive and negative ion modes. In positive ion mode, the first three principal components accounted for 27.4%, 10.7%, and 7.6% of the total variance, respectively, with a cumulative variance of 45.7% (Figure S4a). In negative ion mode, the first three principal components explained 30.3%, 7.5%, and 6.5% of the variance, respectively, with a cumulative variance of 44.3% (Figure S4c). Permutation tests yielded R2Y = 0.005, Q2 = 0.005, and p = 0.005 for both ion modes. The Q2 regression intercepts were −0.0803 and −0.07024 for positive and negative ion modes, respectively, indicating no overfitting (Figure S4b,d).
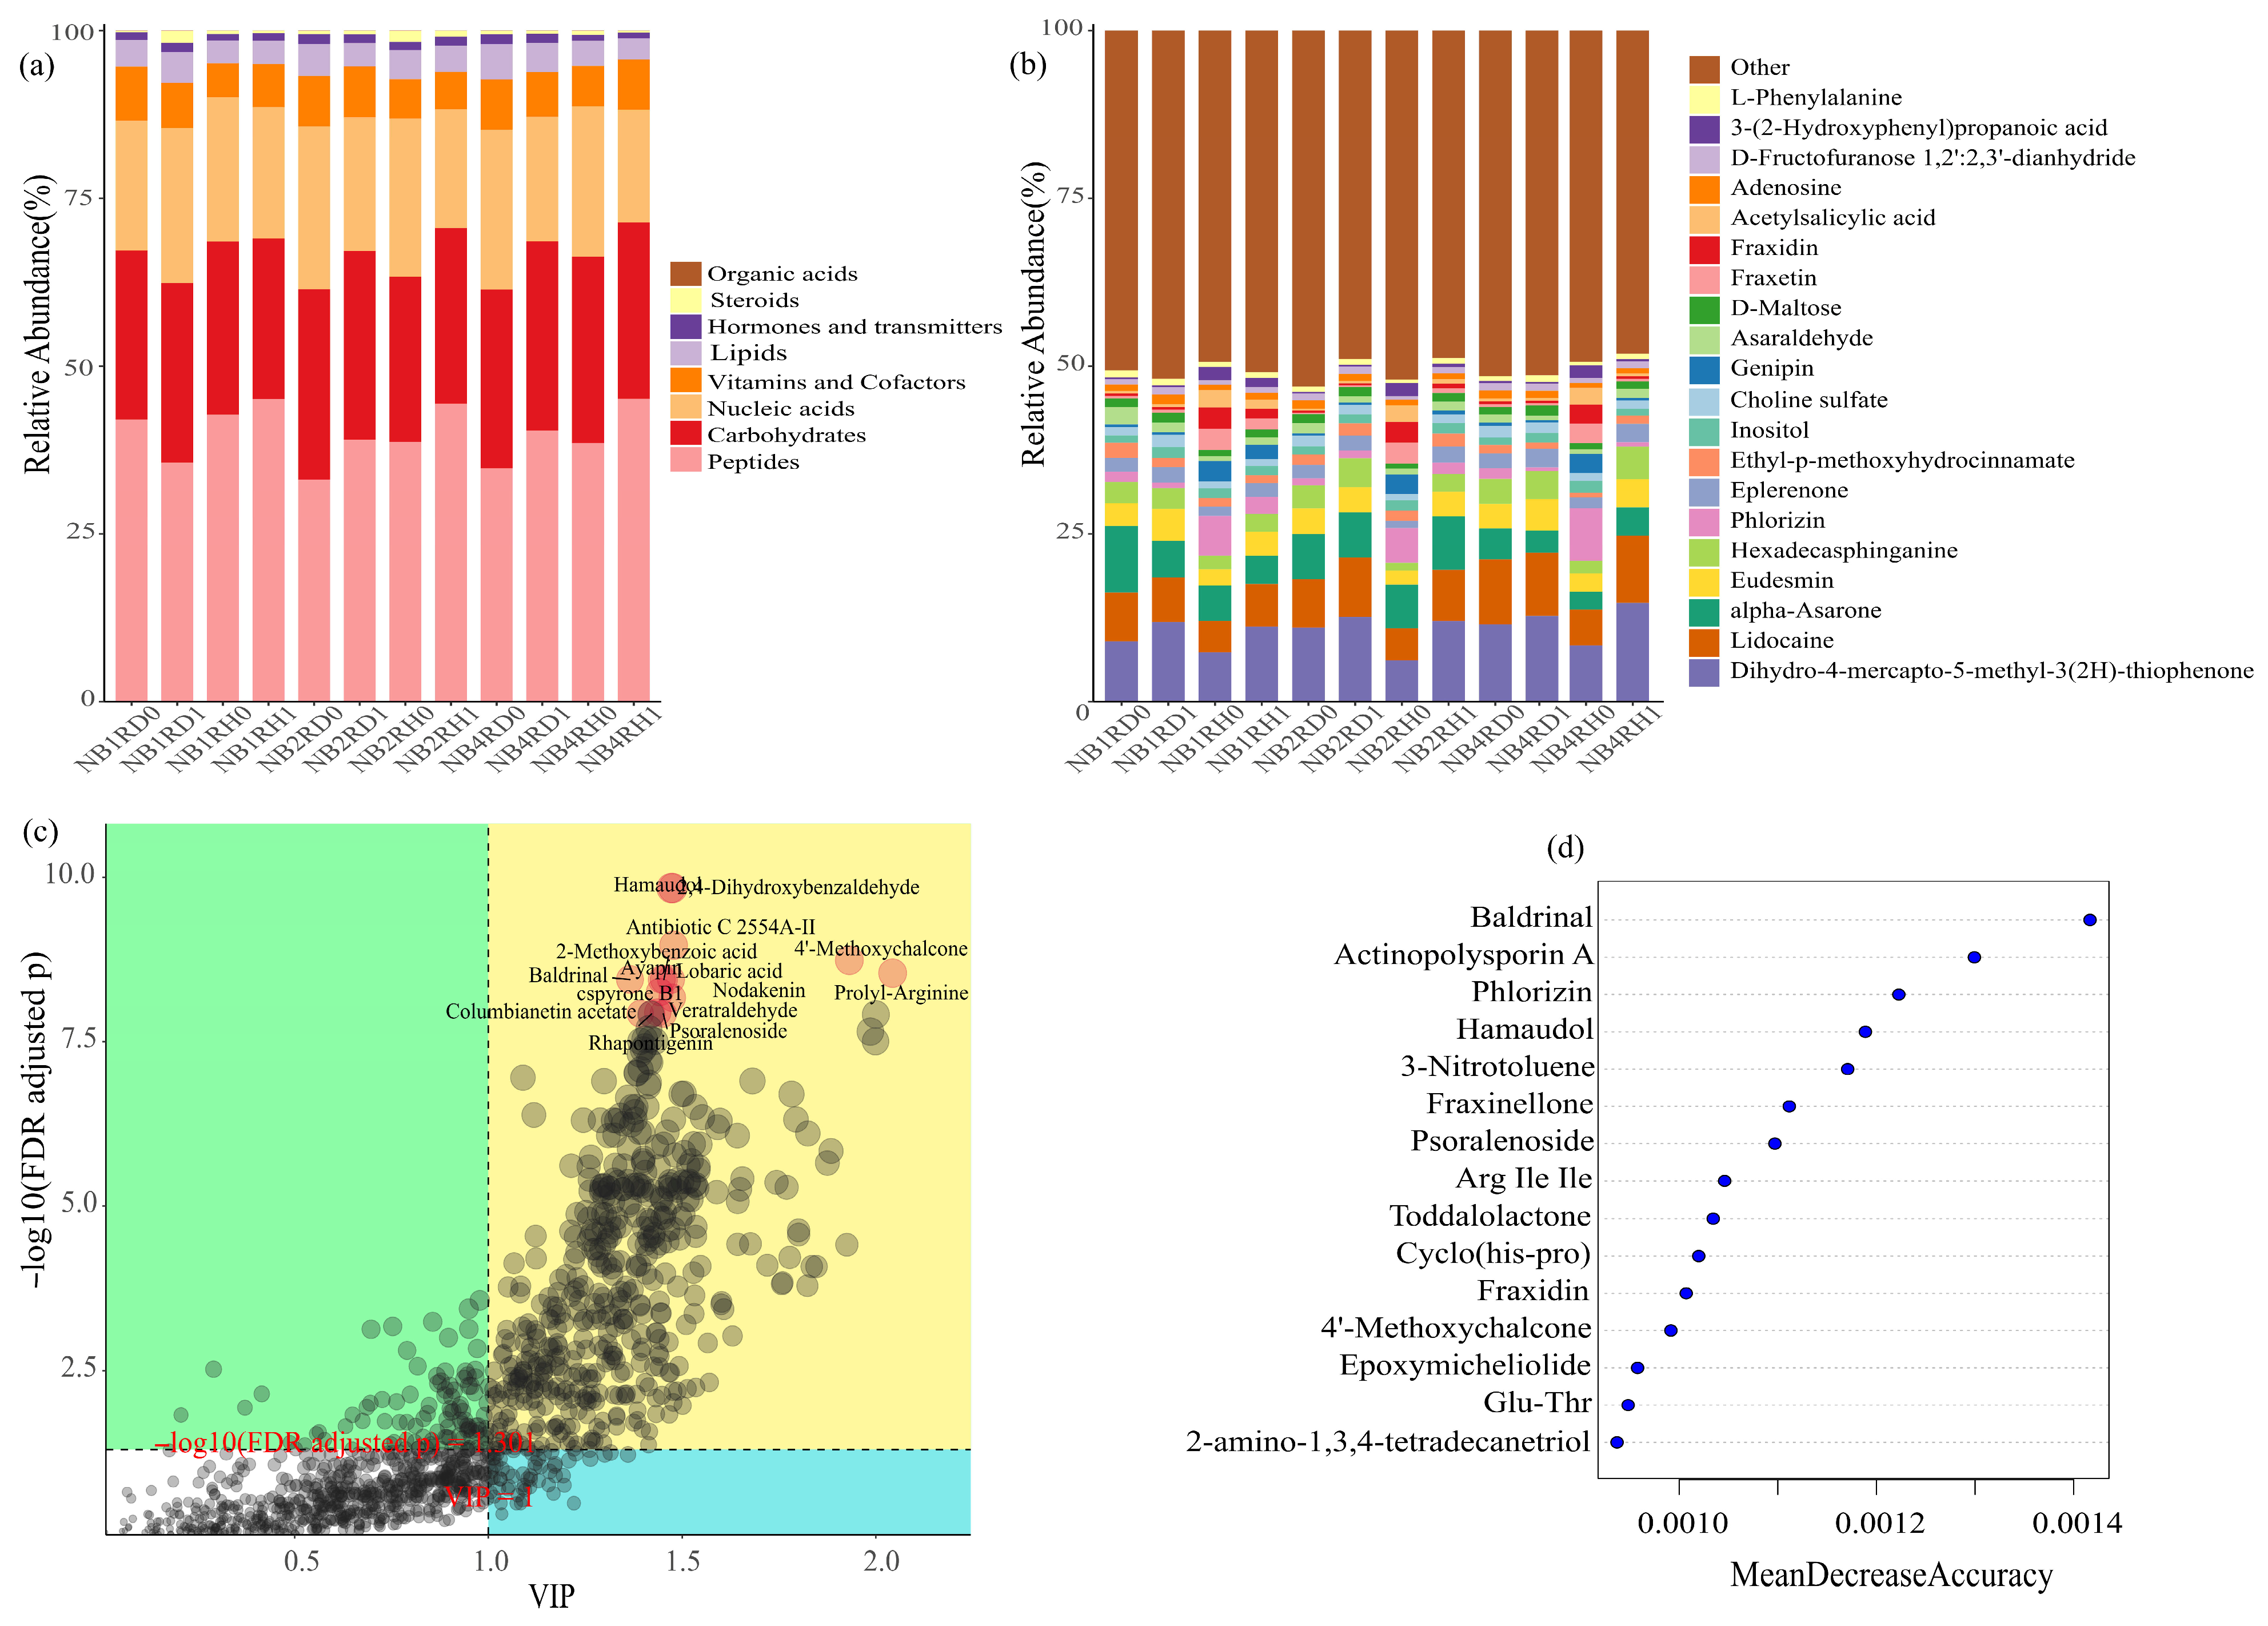
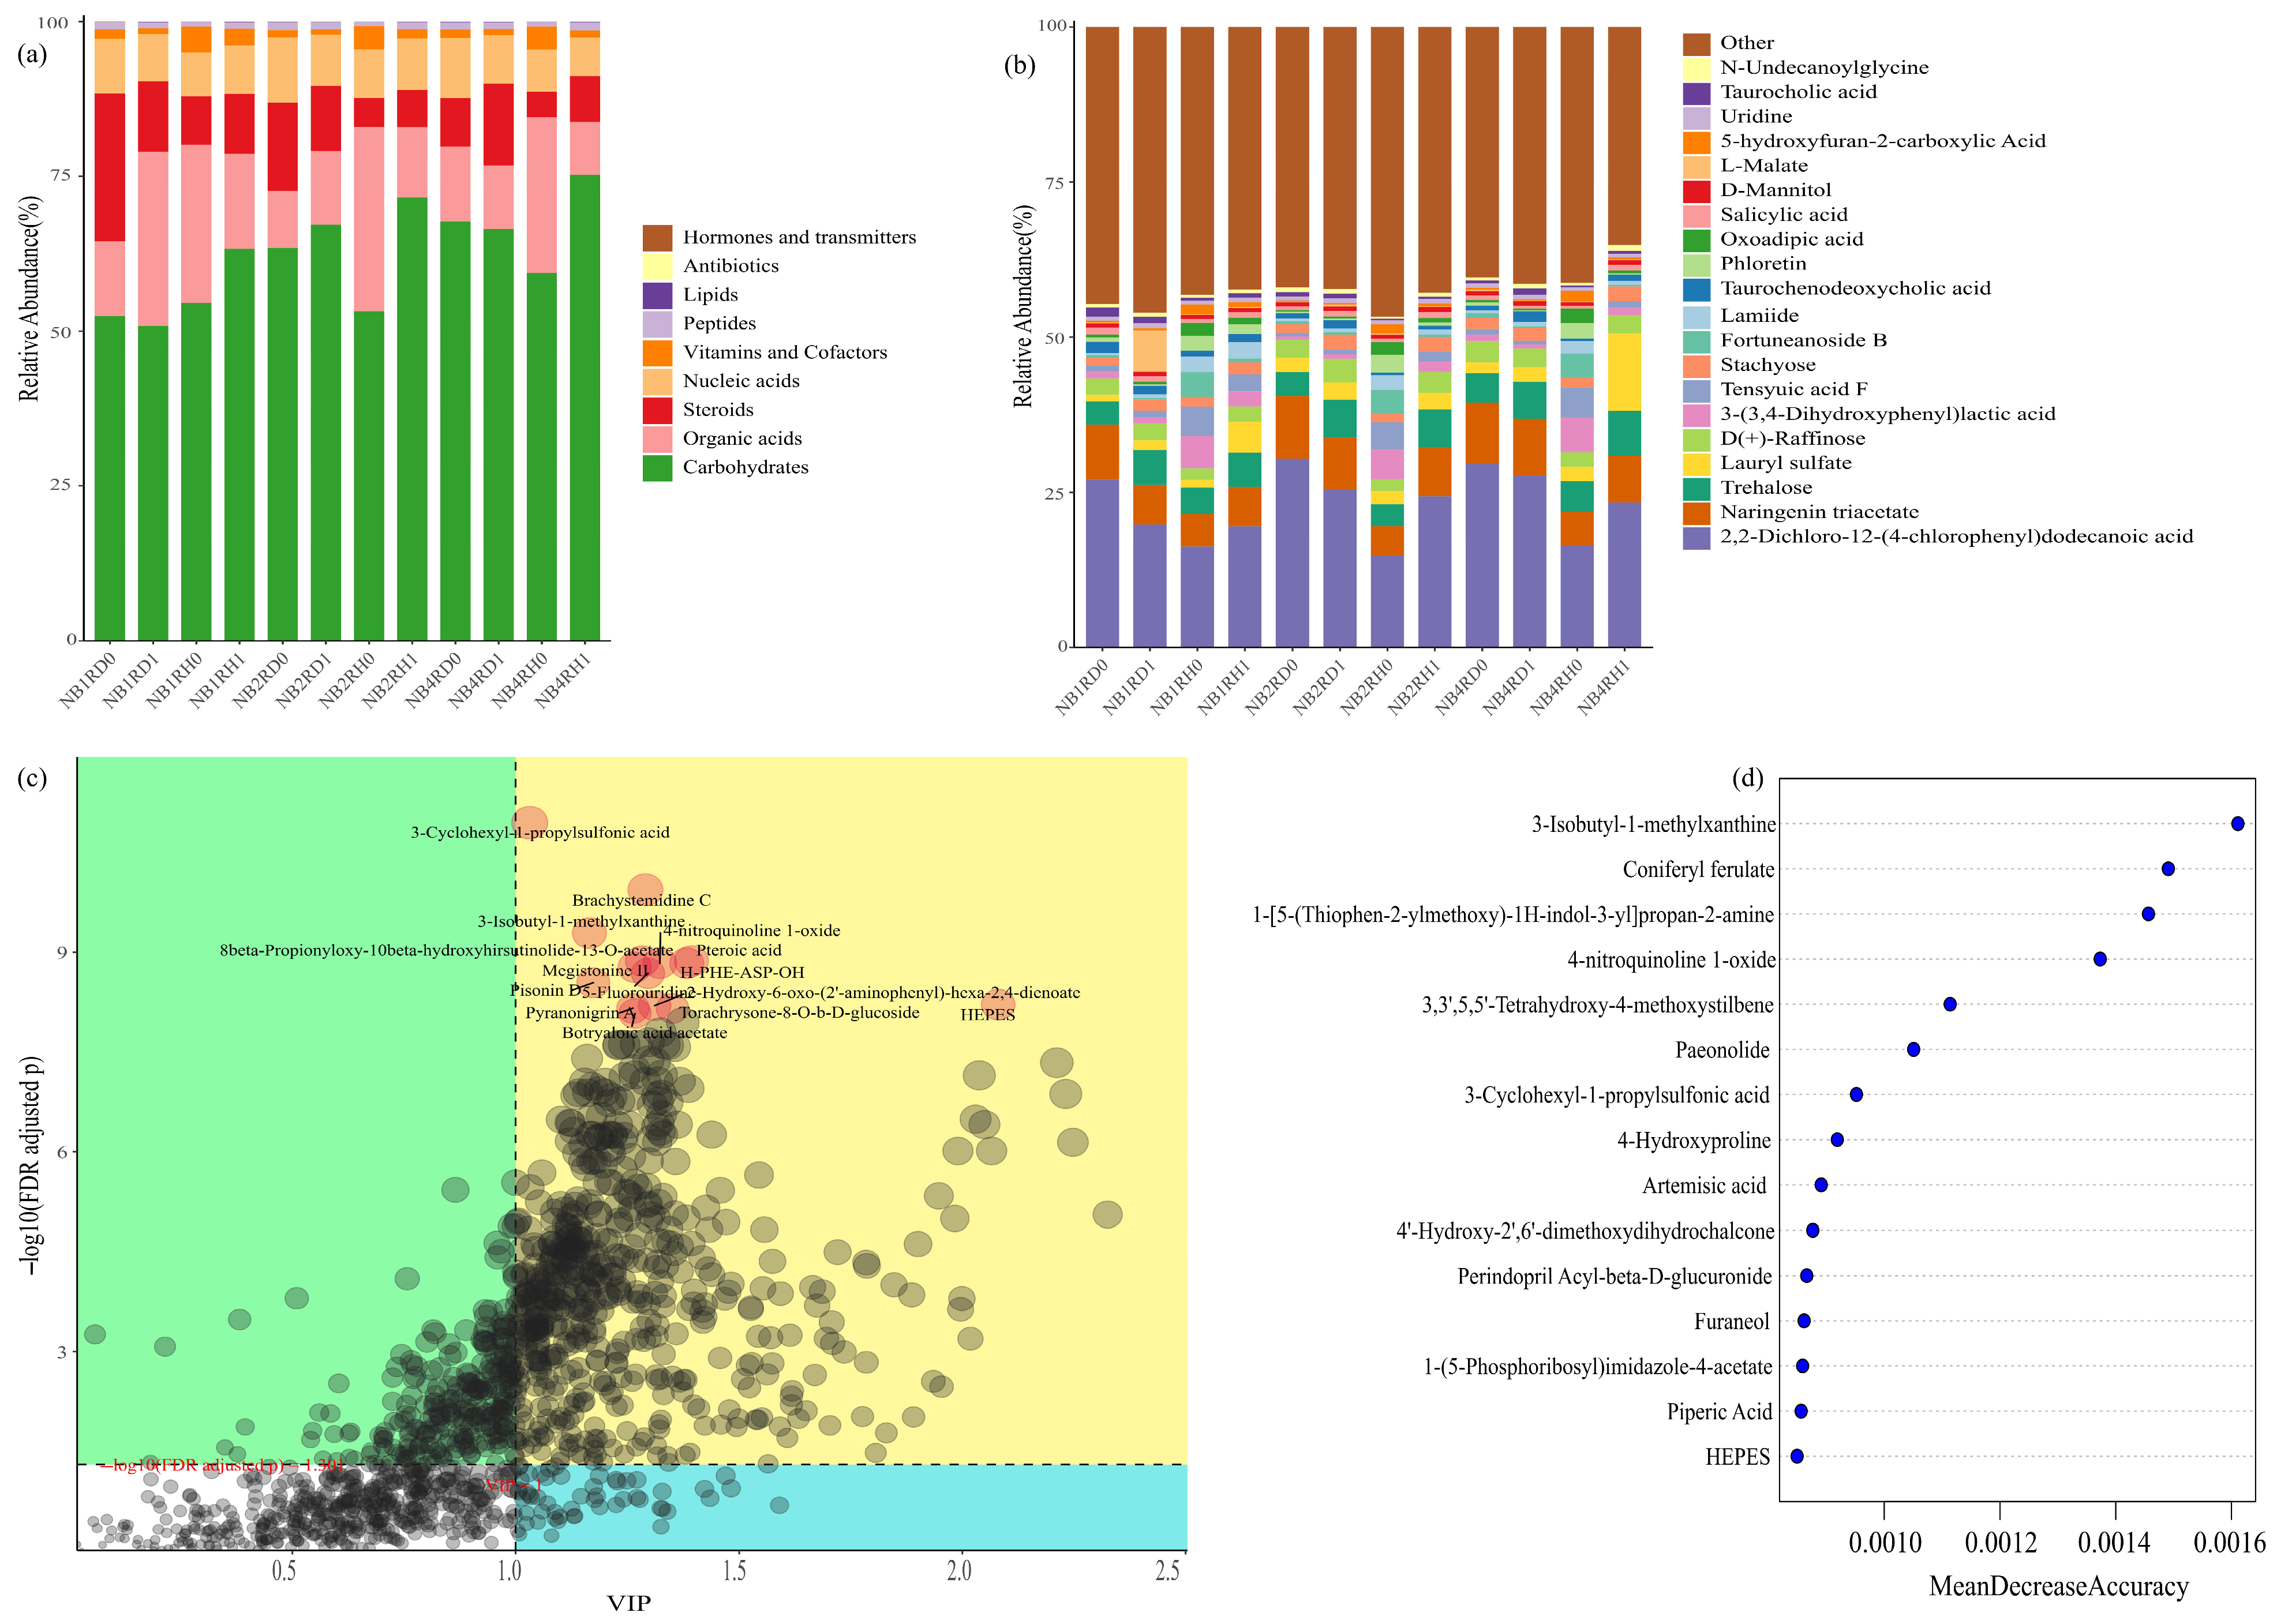
Under positive ion mode, the top three most abundant classes of metabolites were Nucleic acids, Carbohydrates, and Peptides, collectively accounting for more than 85% of the total metabolites (Figure 5a). At the individual metabolite level, excluding laboratory reagents, carcinogens, and surfactants, the top three most abundant metabolites were alpha-Asarone, Eudesmin, and Hexadecasphinganine, which together represented over 10% of the total (Figure 5b). PLS-DA (Partial Least Squares Discriminant Analysis) identified 14 significantly differential metabolites, including 2,4-Dihydroxybenzaldehyde, Hamaudol, 4’-Methoxychalcone, Prolyl-Arginine, Lobaric acid, 2-Methoxybenzoic acid, Ayapin, Baldrinal, cspyrone B1, Nodakenin, Veratraldehyde, Psoralenoside, Rhapontigenin, and Columbianetin acetate (Figure 5c). Enrichment analysis revealed that the top three enriched metabolites were Hamaudol, Phlorizin, and Baldrinal (Figure 5d). Univariate analysis indicated that 15 metabolites showed significant differences among treatments. Notably, seven of these metabolites—Hamaudol, Nodakenin, Psoralenoside, 4’-Methoxychalcone, Rhapontigenin, Lobaric acid, and Columbianetin acetate—were closely associated with plant disease resistance. Except for 4’-Methoxychalcone and Lobaric acid, the other five metabolites exhibited significantly higher abundances in rhizosphere soils of healthy plants compared to those of diseased plants (Figure 6). In positive ion mode, the identification confidence of the key differential metabolites (Hamaudol, Nodakenin, and Psoralenoside) was detailed in Table S2 and Figure S5. In positive ion mode, three metabolites were significantly affected by the experimental factors, though the significant terms differed among them. Hamaudol was significantly affected only by Status and Location × Status (p < 0.05). Nodakenin showed the most significant terms, including the main effects of Location and Status and the interactions Nitrogen × Location and Location × Status (p < 0.05). Psoralenoside was significantly affected by Location, Status, and Location × Status (p < 0.05) (Table S6).
Figure 3.
LEfSe analysis of functional annotations under different nitrate-to-ammonium ratios. (a) LEfSe analysis of functional annotations at KEGG Level 2 under different NO3−-N/NH4+-N ratio treatments (LDA score ≥ 2.0). (b) LEfSe analysis of functional annotations at KEGG Level 3 under different NO3−-N/NH4+-N ratio treatments (LDA score ≥ 2.0). (c) LEfSe analysis of functional annotations at KEGG Module level under different NO3−-N/NH4+-N ratio treatments (LDA score ≥ 2.0). (d) LEfSe analysis of antimicrobial resistance genes (AMRs) under different NO3−-N/NH4+-N ratio treatments (LDA score ≥ 2.0). Note: The LEfSe (Linear discriminant analysis Effect Size) analysis identifies differentially abundant functional features among treatments with varying NO3−-N/NH4+-N ratios. The bar length represents the LDA score, indicating the effect size of each functional feature’s abundance difference. Only features with LDA ≥ 2.0 are shown. Different colors represent different treatment groups in which the features are enriched.
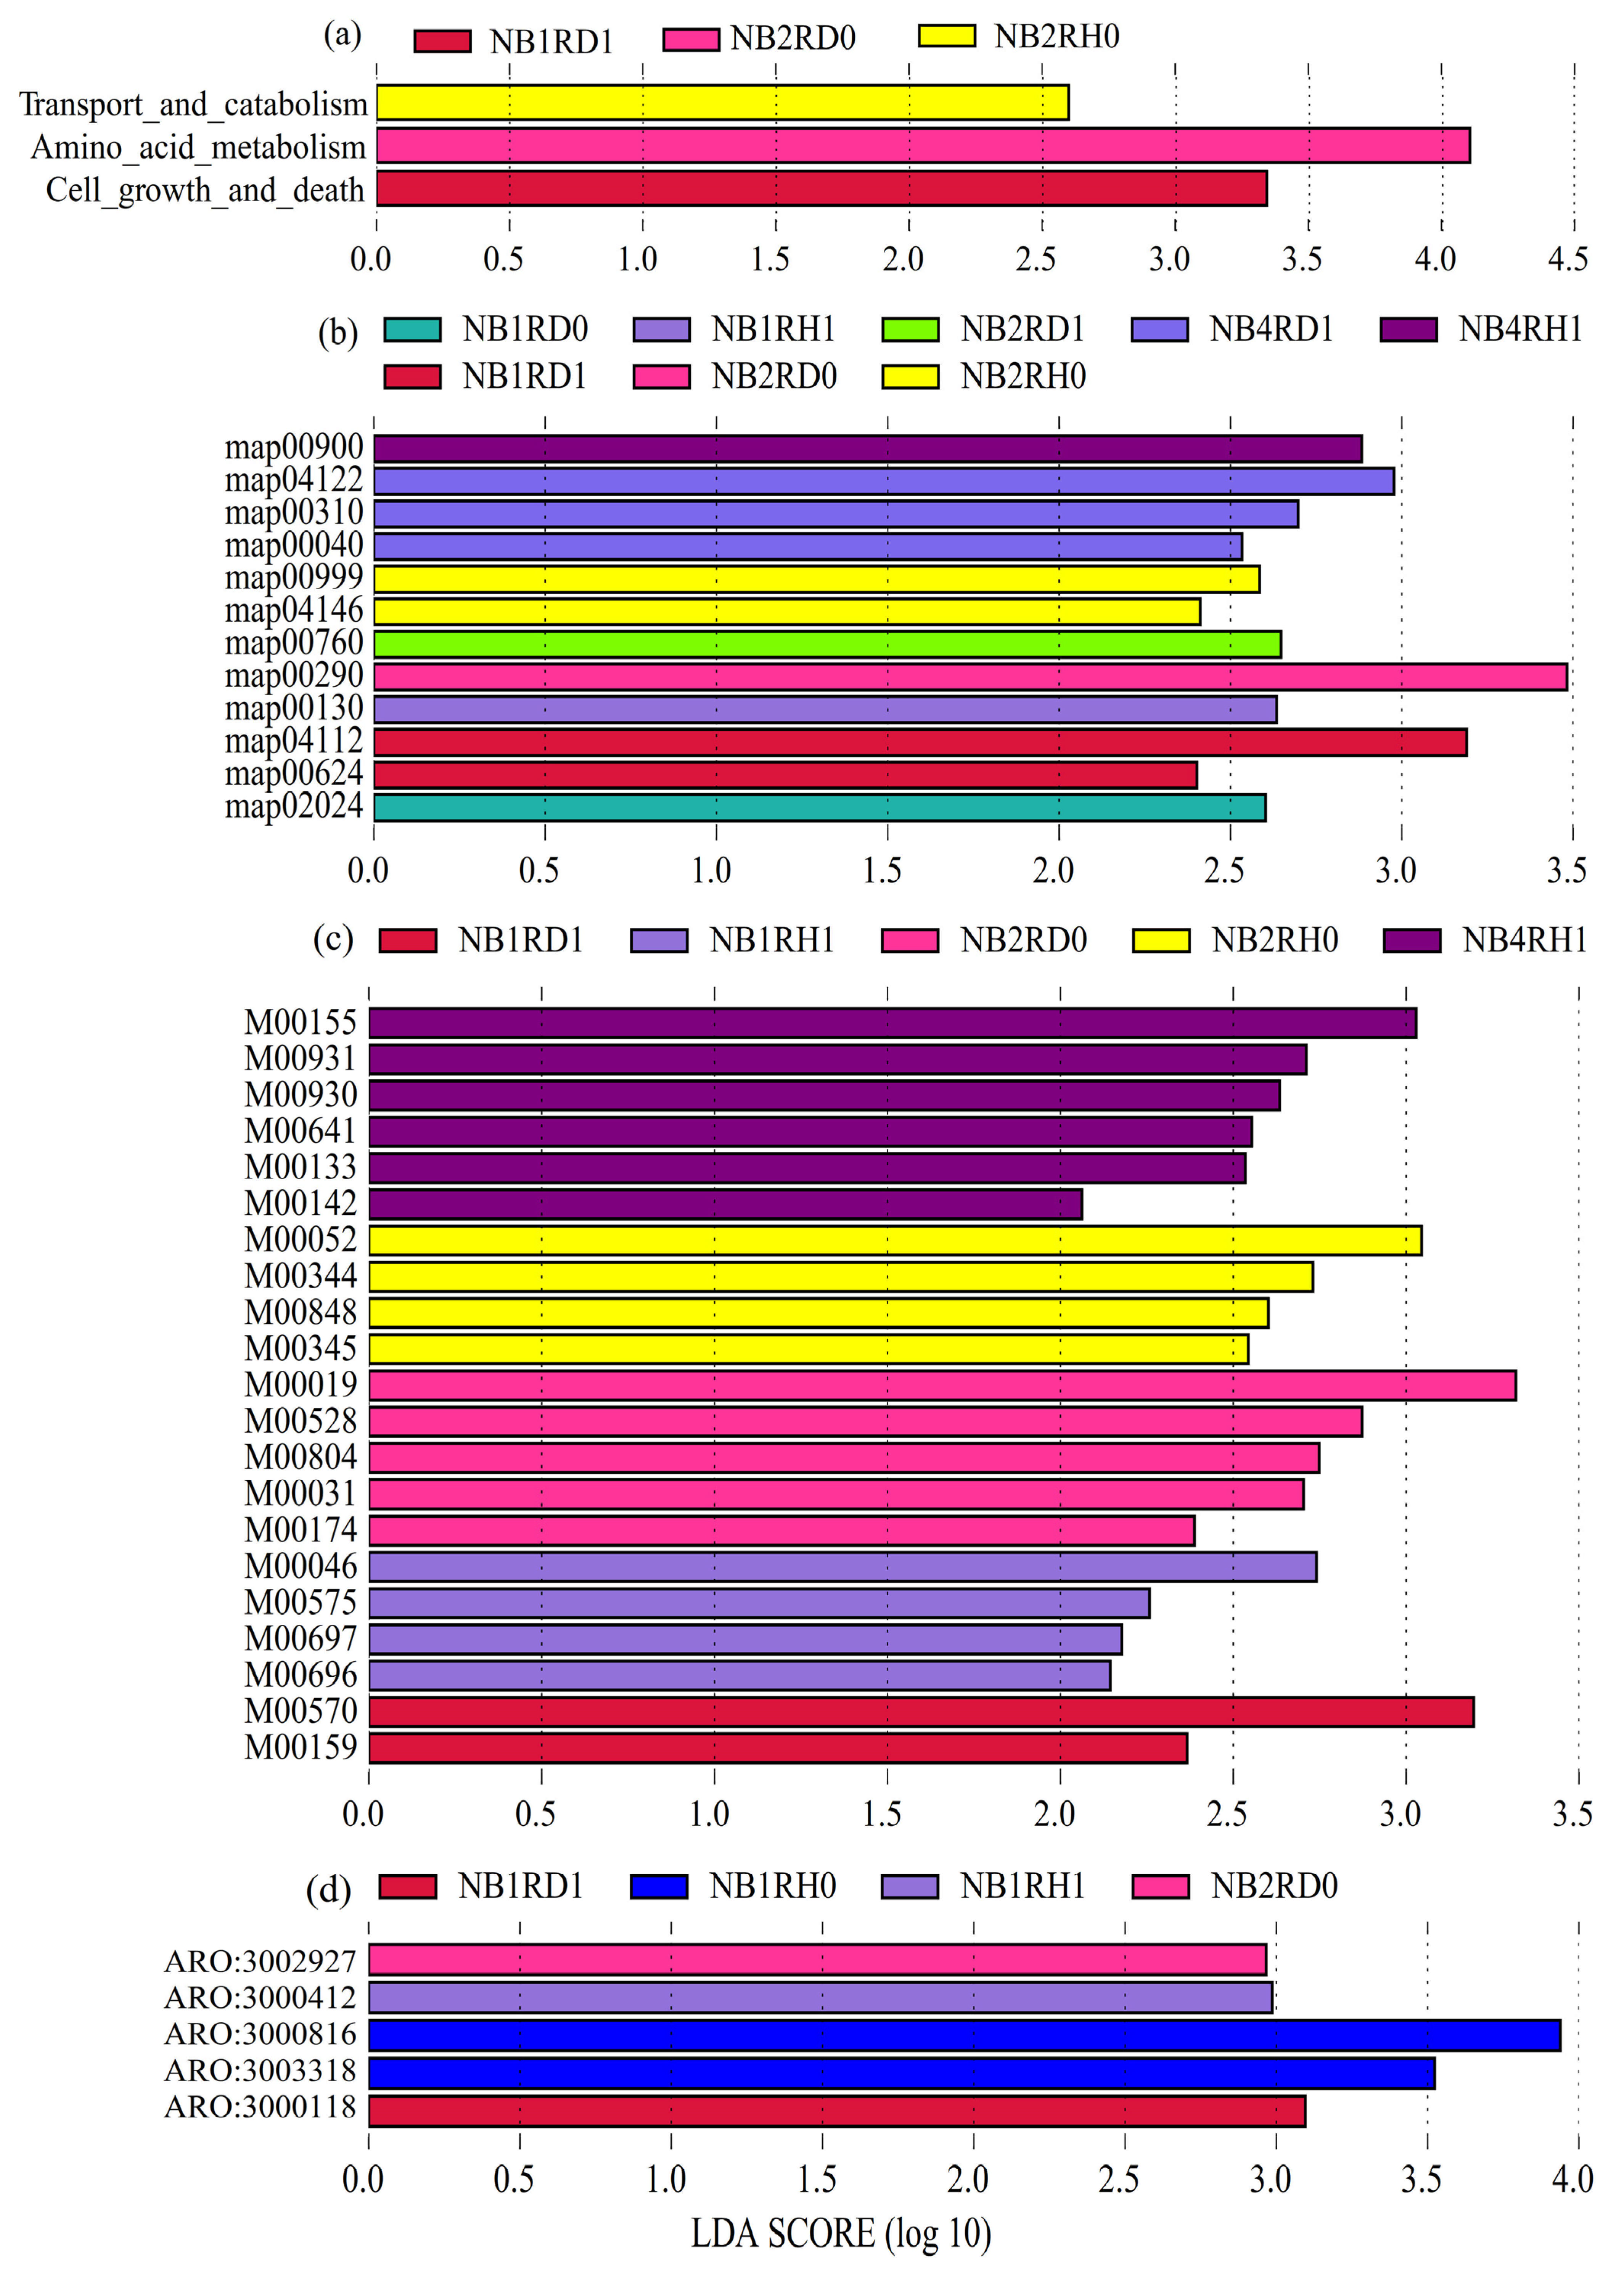
Figure 4.
Screening of differentially functional potential enrichment analysis based on edgeR/DESeq2. (a) Volcano plot of DEGs. Samples were grouped by MyCategory (NB2RD0 vs. NB2RH0). Total genes: 537,096. Green: significantly decreased; red: significantly increased; gray: non-significant. Threshold: padj < 0.05 and |log2FC| ≥ 1.0. (b) Heatmap of DEG expression patterns. The color scale ranges from red (high abundance) to blue (low abundance), with white representing intermediate abundance. Clustering trees are shown on the left and top. (c) KEGG pathway enrichment network. Nodes represent KO terms (size: gene count; color: fold change). Lines connect KO terms to enriched pathways, including “Longevity regulating pathway—worm”, “Ribosome”, and “RNA degradation”. (d) PPI network. Nodes represent proteins (size: abundance/connectivity). Triangles: increased; circles: decreased. Line thickness: interaction strength; line color: correlation level (green: low; pink/magenta: high).
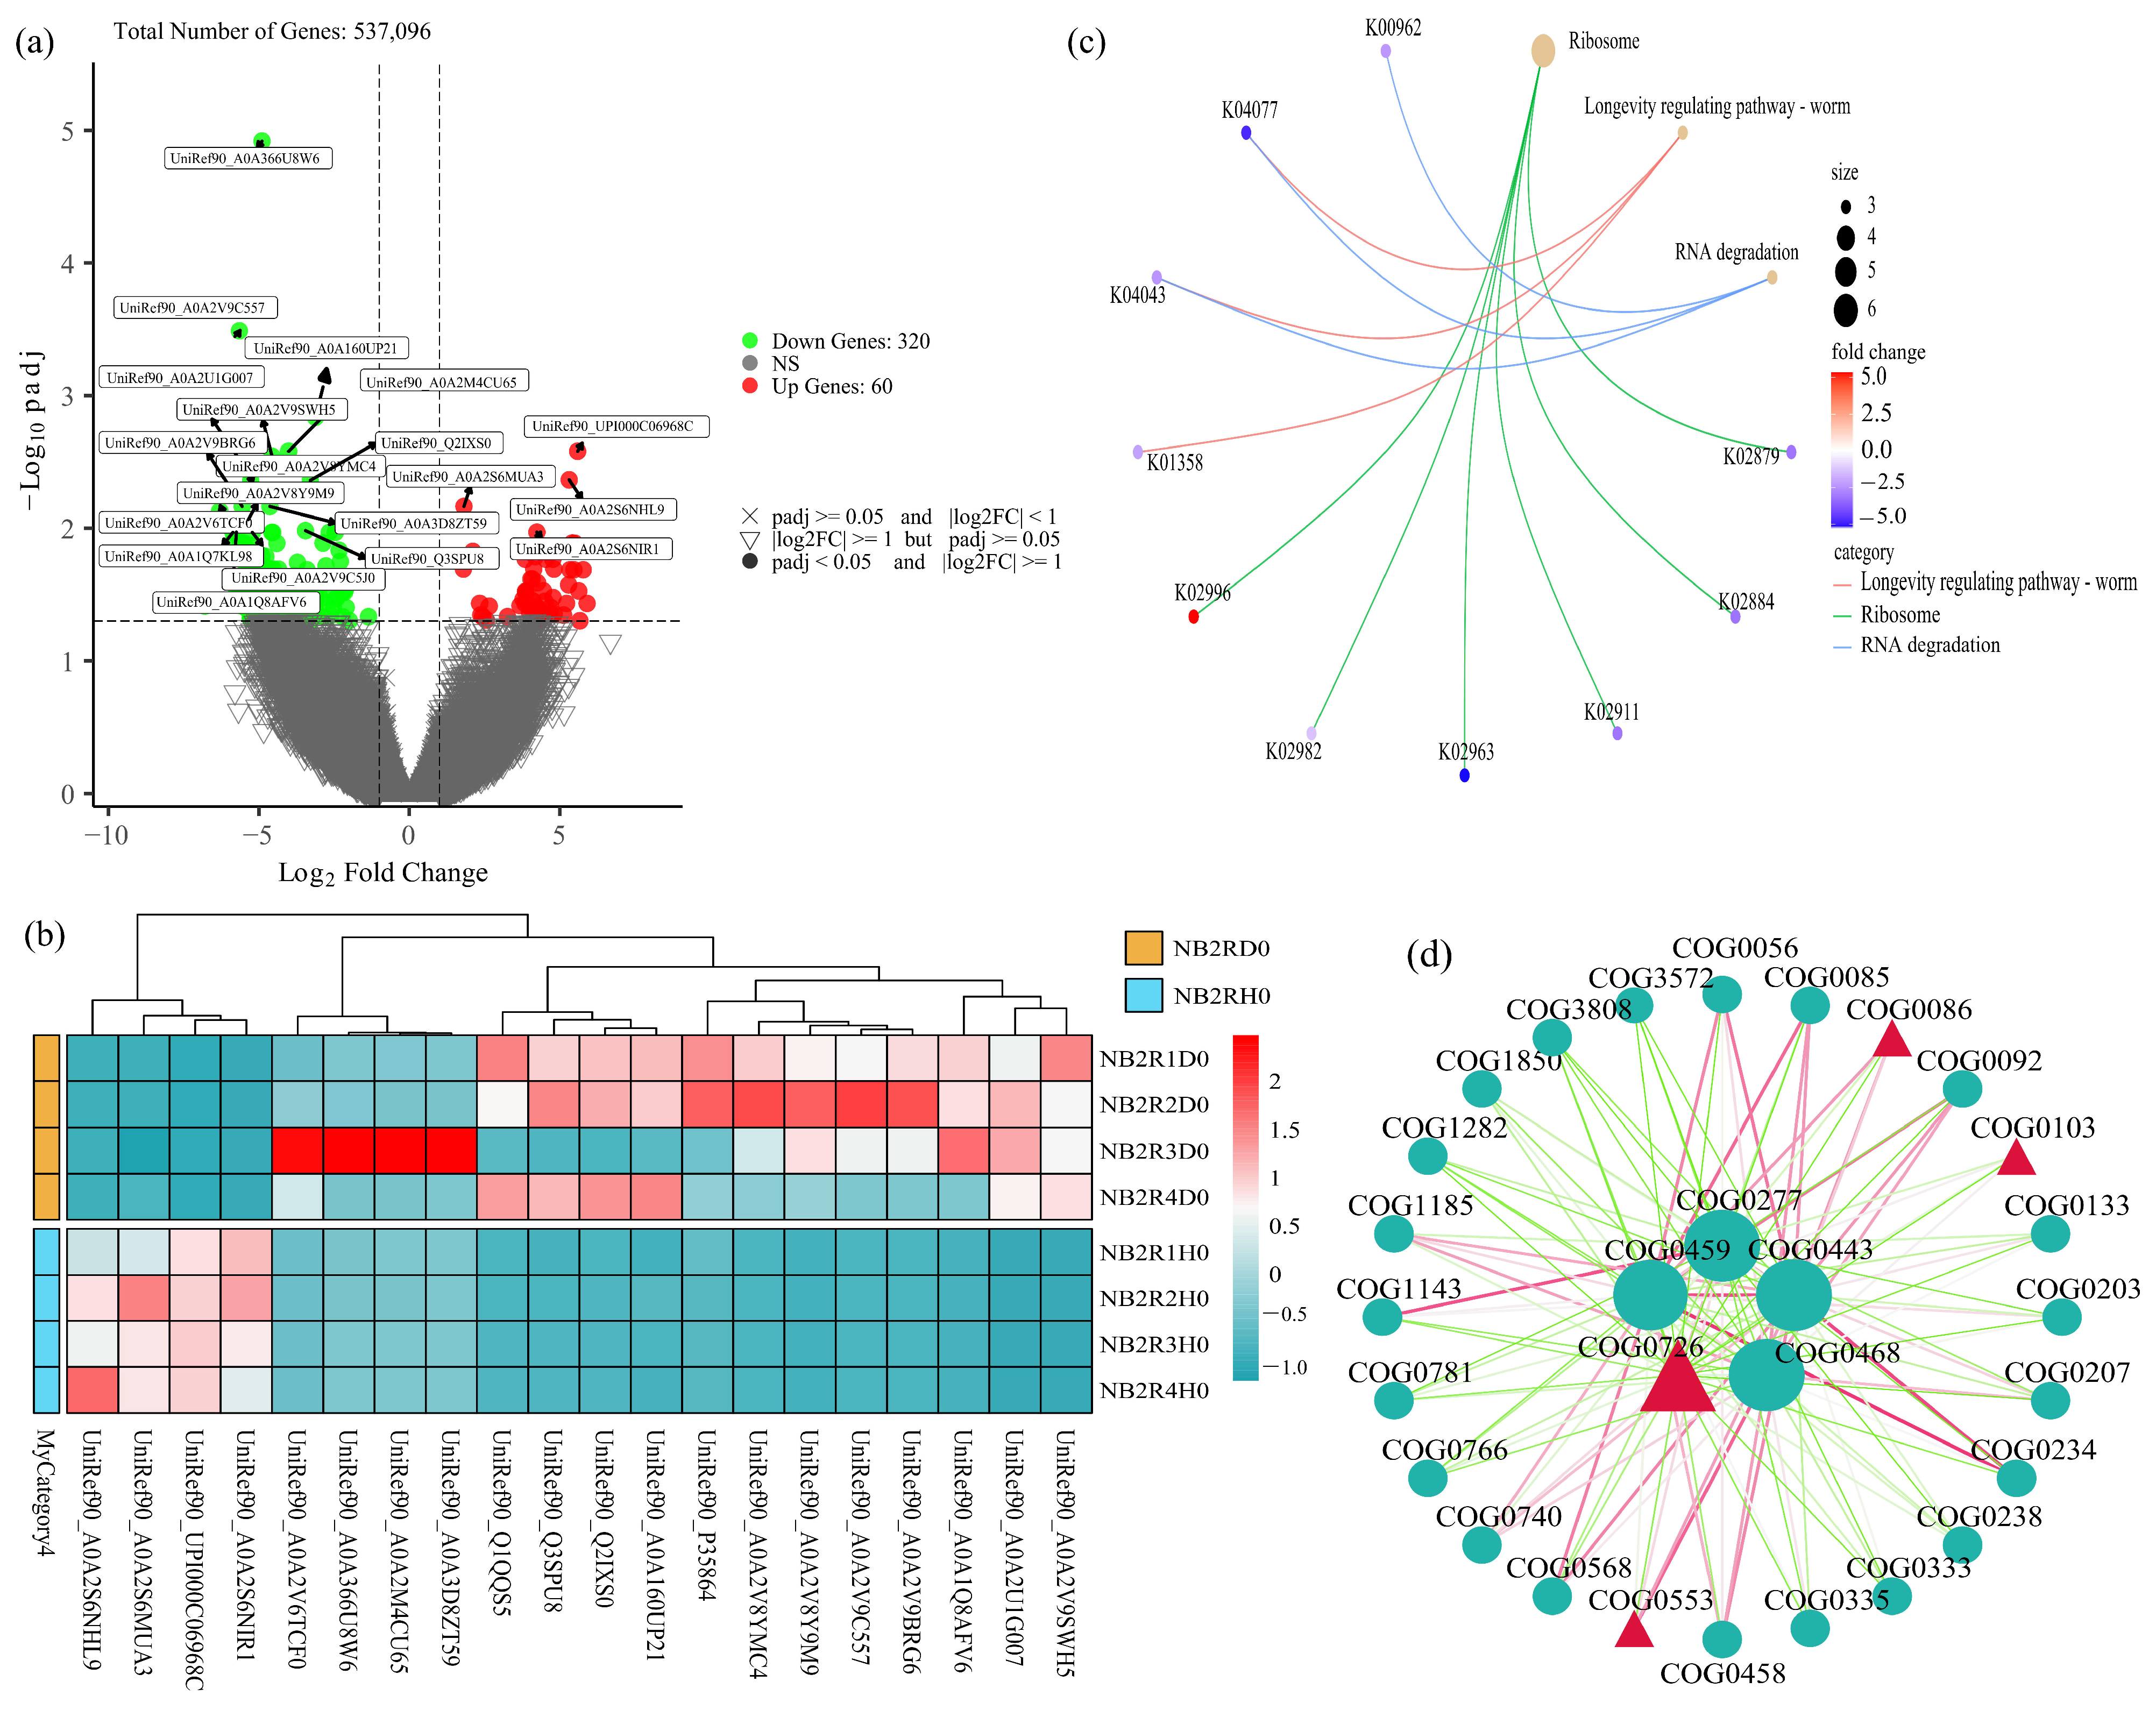
Figure 5.
Metabolomic profiling and identification of key differential metabolites in positive ion mode (ESI+). (a) Stacked bar chart showing the relative abundance of different metabolite categories (e.g., peptides, carbohydrates, lipids, organic acids) across different NO3−-N/NH4+-N ratio samples. (b) Stacked bar chart showing the relative abundance of the top specific metabolites across different NO3−-N/NH4+-N ratio samples. (c) Scatter plot of Variable Importance in Projection (VIP) values versus −log10(FDR-adjusted p-values) for metabolite screening. The vertical dashed line indicates VIP = 1, and the horizontal dashed line indicates −log10(FDR-adjusted p) = 1.301 (p = 0.05). Metabolites located in the yellow region (VIP > 1 and p < 0.05) were identified as significant differential metabolites (where the background color is yellow). (d) Variable importance plot based on Random Forest analysis, displaying the Mean Decrease Accuracy for the top-ranked differential metabolites (biomarkers).
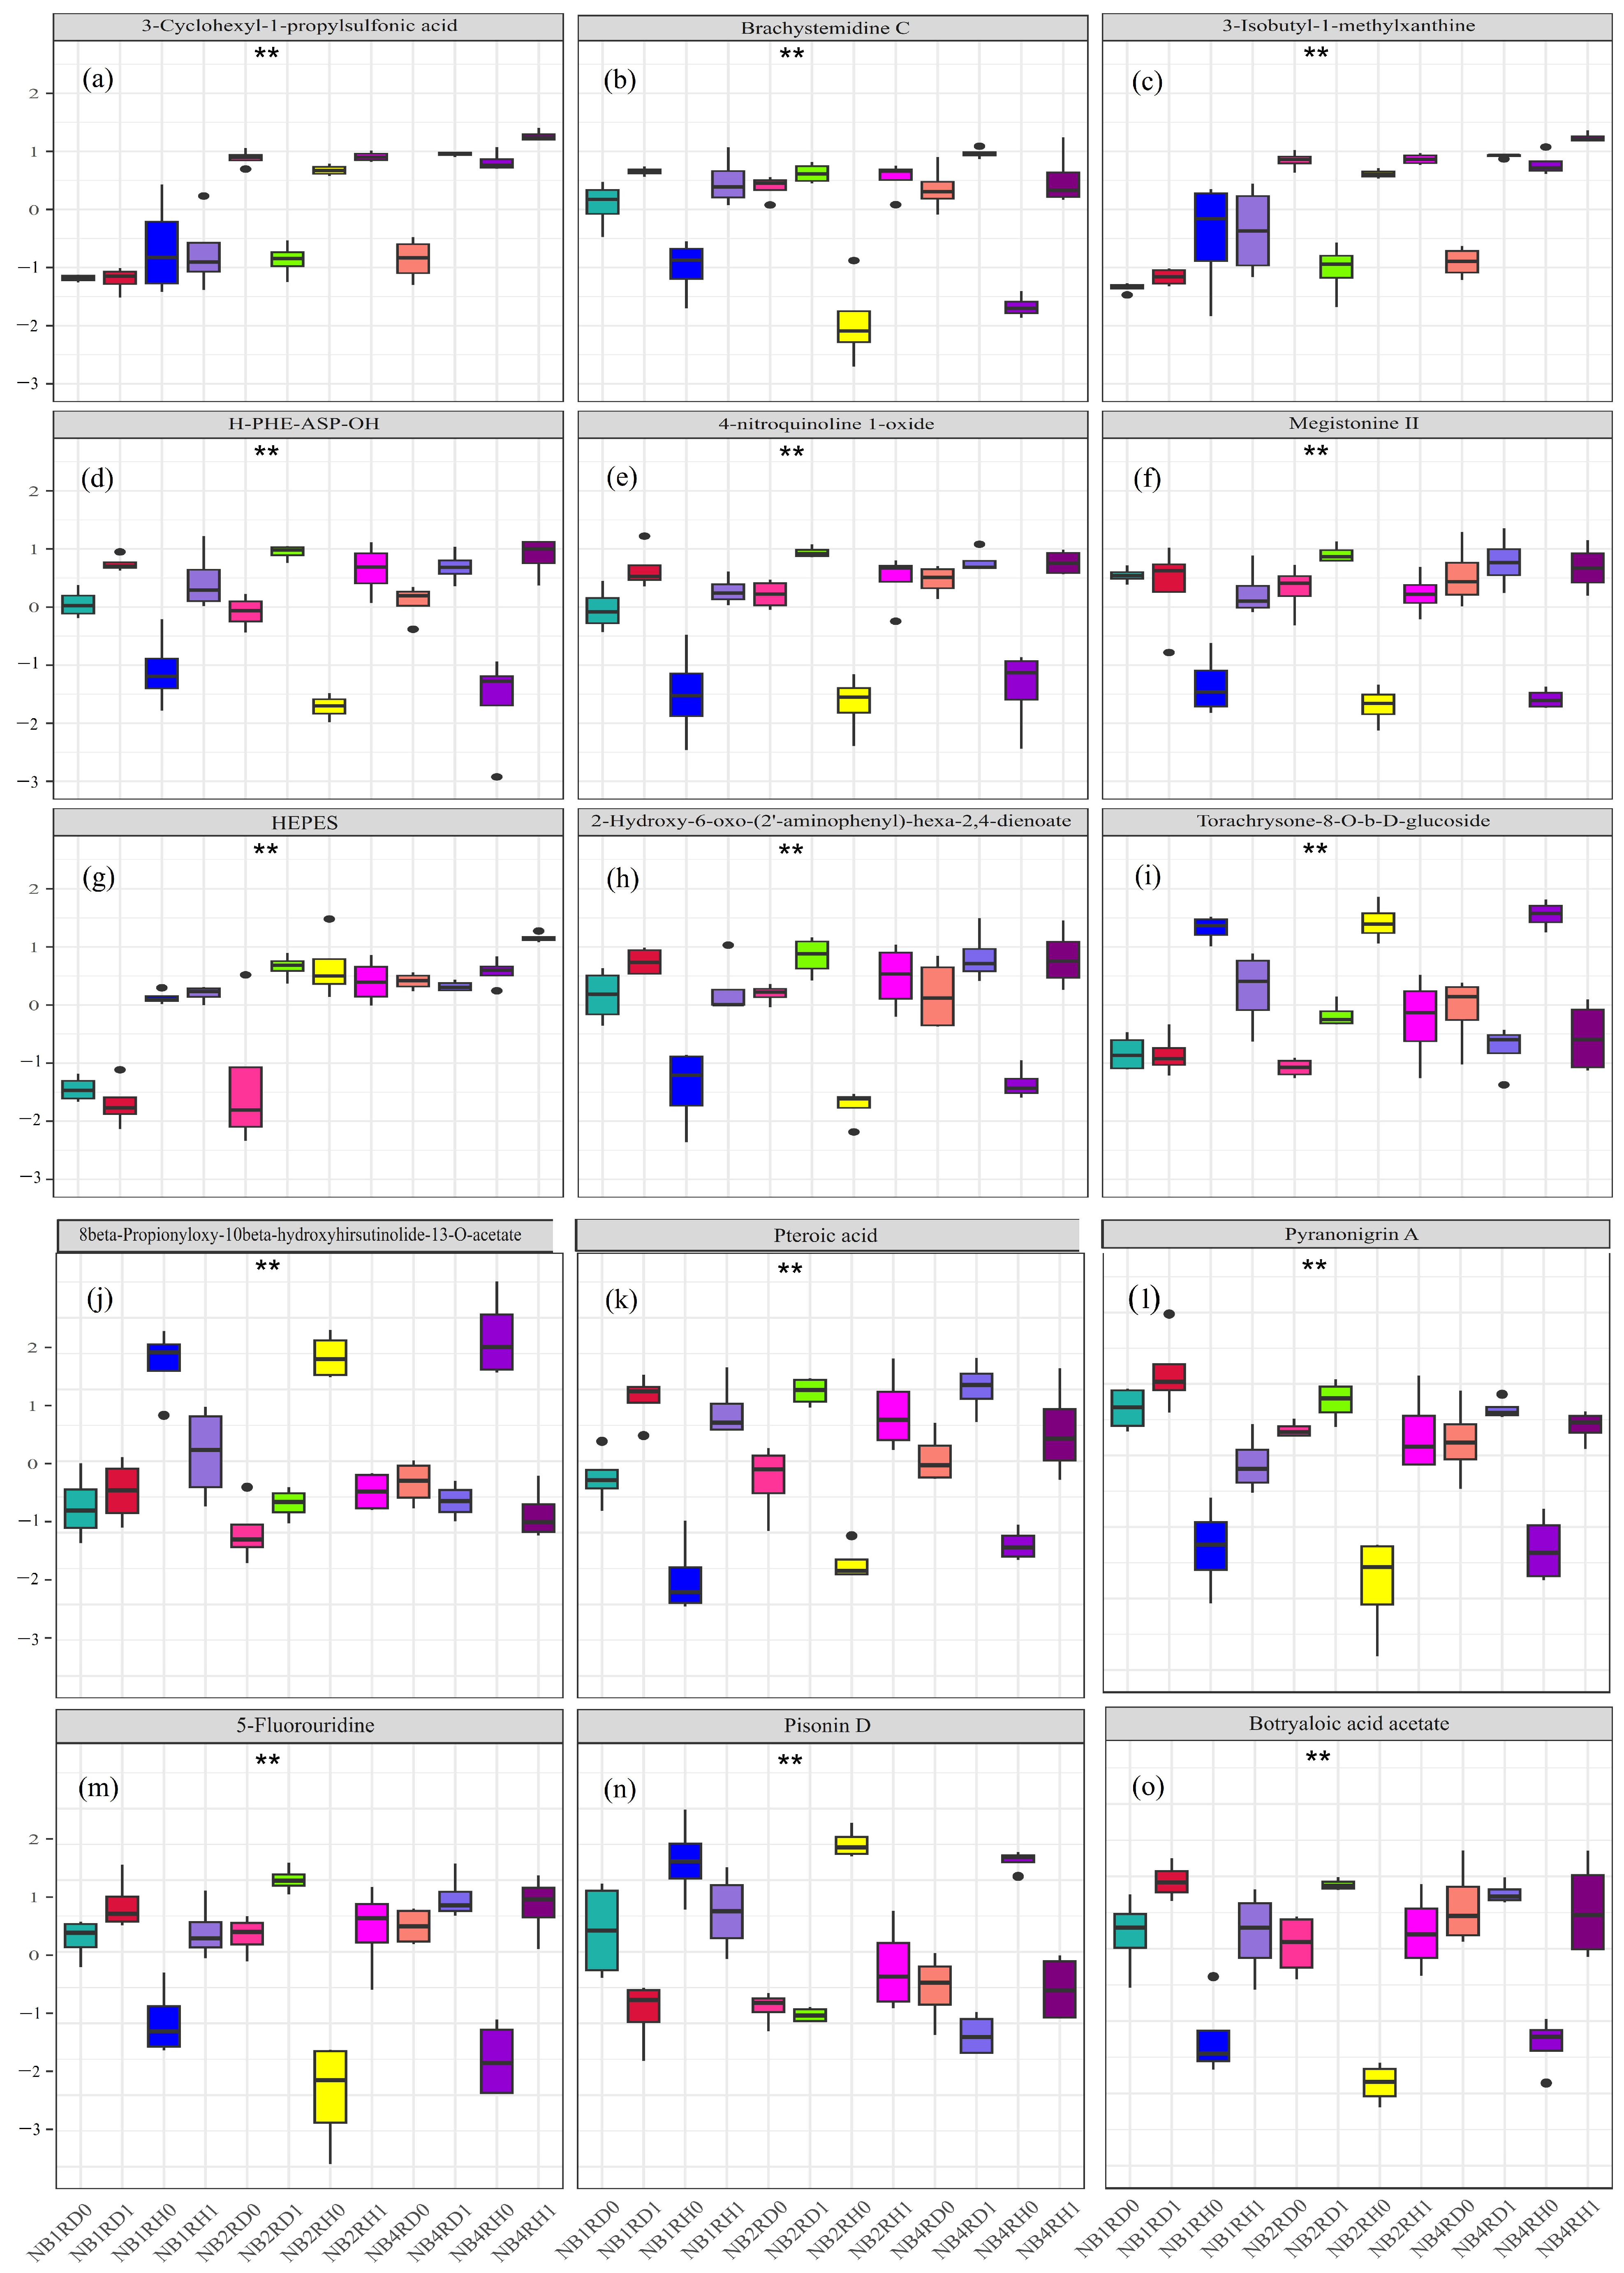
Under negative ion mode, the top three most abundant classes of metabolites were Steroids, Organic acids, and Carbohydrates, which collectively accounted for more than 85% of the total metabolites (Figure 7a). At the individual metabolite level, excluding laboratory reagents, carcinogens, and surfactants, the top three most abundant metabolites were D (+)-Raffinose, Trehalose, and Naringenin triacetate, together representing over 5% of the total (Figure 7b). PLS-DA identified 11 significantly differential metabolites, including 3-Cyclohexyl-1-propylsulfonic acid, Brachystemidine C, Pteroic acid, 8beta-Propionyloxy-10beta-hydroxyhirsutinolide-13-O-acetate, H-PHE-ASP-OH, Megistonine II, Pisonin D, 2-Hydroxy-6-oxo-(2’-aminophenyl)-hexa-2,4-dienoate, Torachrysone-8-O-beta-D-glucoside, Pyranonigrin A, and Botryaloic acid acetate(Figure 7c). Enrichment analysis showed that the top three enriched metabolites were 3,3’,5,5’-Tetrahydroxy-4-methoxystilbene, 1-[5-(Thiophen-2-ylmethoxy)-1H-indol-3-yl] propan-2-amine, and Coniferyl ferulate (Figure 7d). Univariate analysis revealed that 15 metabolites exhibited significant differences among treatments. Among them, Torachrysone-8-O-beta-D-glucoside, Pyranonigrin A, 8beta-Propionyloxy-10beta-hydroxyhirsutinolide-13-O-acetate, Pteroic acid, Botryaloic acid acetate, and Pisonin D were closely associated with plant disease resistance. Specifically, Pyranonigrin A, Pteroic acid, and Botryaloic acid acetate showed significantly lower abundances in rhizosphere soils of healthy plants than in those of diseased plants, whereas the other three metabolites exhibited the opposite trend (Figure 8). In negative ion mode, the identification confidence of the key differential metabolites (Pyranonigrin A, Pteroic acid, and Botryaloic acid acetate) was detailed in Table S2 and Figure S5. In negative ion mode, all three metabolites (Pyranonigrin A, Pteroic acid, and Botryaloic acid acetate) showed highly consistent responses: each was significantly affected by Status and the Location × Status interaction (p < 0.001 for Status; p < 0.01 for Location × Status), whereas Nitrogen, Location, and the other interaction terms were not significant (Table S6).
Figure 6.
Boxplots of differential metabolites showing significant differences among treatment groups in positive ion mode (ESI+). Note: The boxplots illustrate the distribution of relative abundance for each significantly different metabolite across various treatments. The central horizontal line within each box represents the median, the box boundaries indicate the 25th and 75th percentiles (interquartile range, IQR), and the whiskers extend to 1.5 times the IQR. Black dots represent outliers. The double asterisks (**) above each panel indicate a highly significant difference (p < 0.01) among the treatment groups based on statistical analysis (e.g., one-way ANOVA).The 12 colors represent different treatments, and the same treatment is shown in the same color across different figures.
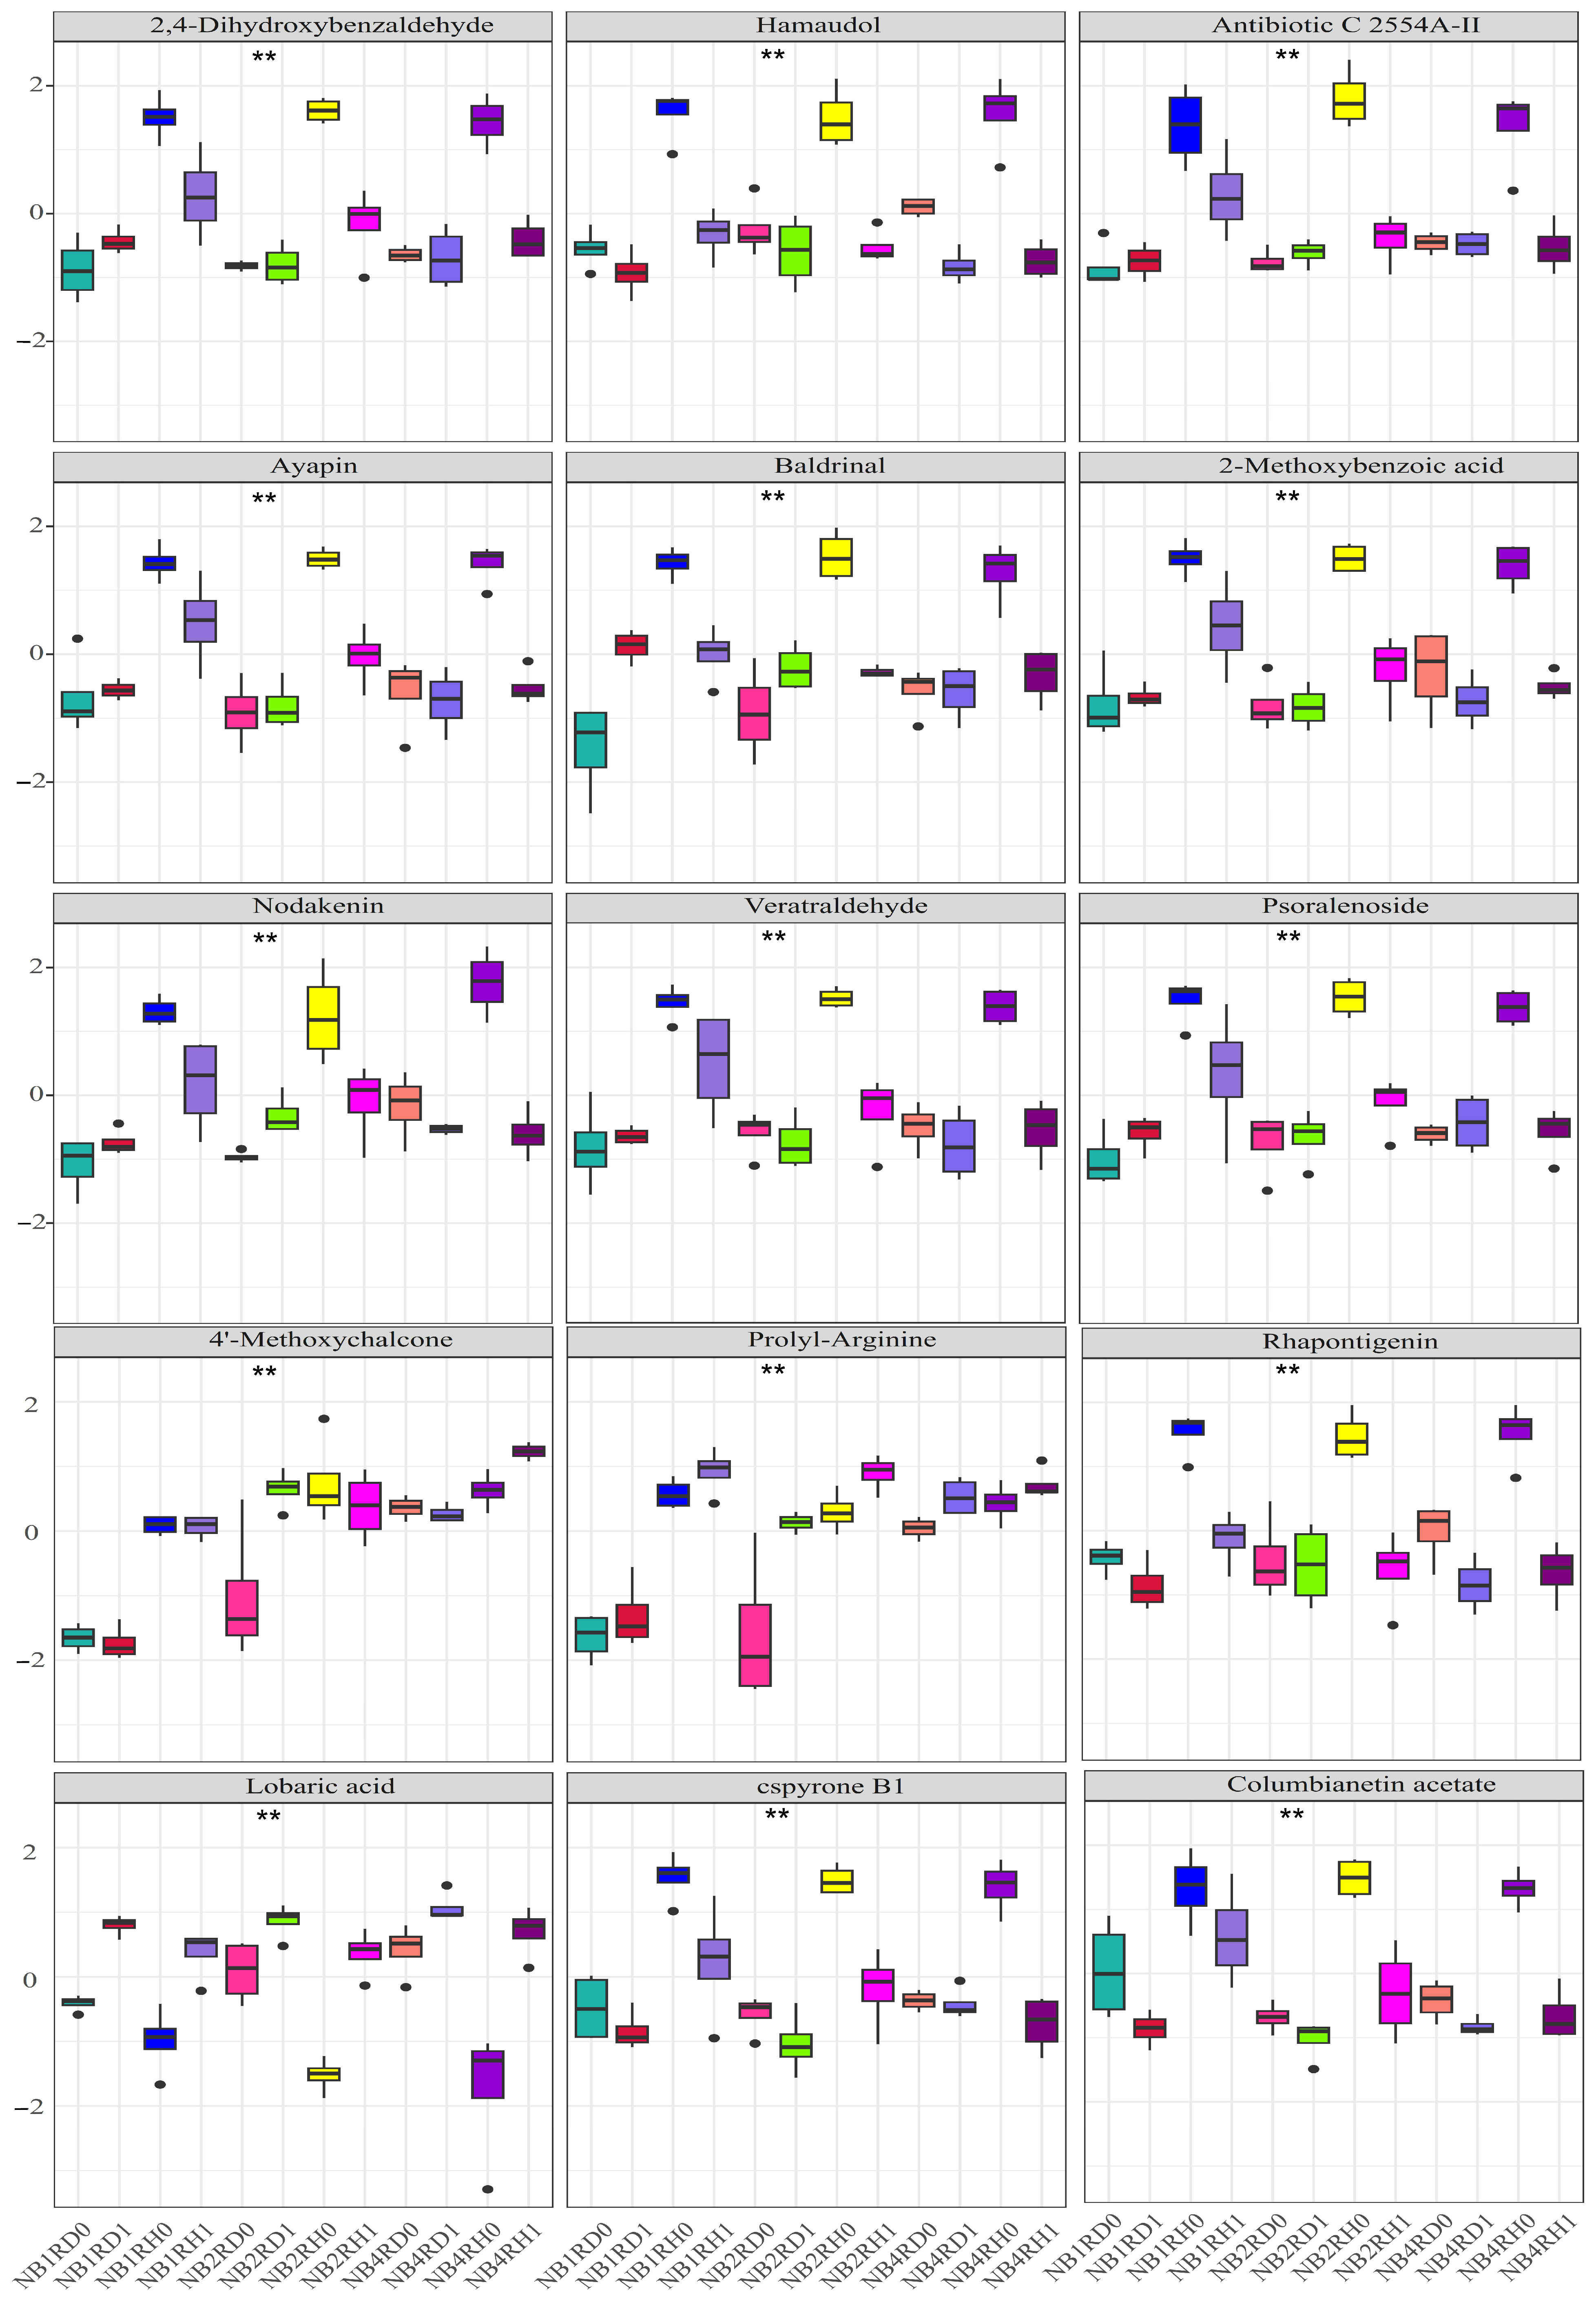
Figure 7.
Metabolomic profiling and identification of key differential metabolites in negative ion mode (ESI-). (a) Stacked bar chart showing the relative abundance of different metabolite categories (e.g., Carbohydrates, Organic acids, Steroids) across different NO3−-N/NH4+-N ratio samples. (b) Stacked bar chart showing the relative abundance of the top specific metabolites across different NO3−-N/NH4+-N ratio samples. (c) Scatter plot of Variable Importance in Projection (VIP) values versus −log10(FDR-adjusted p-values) for metabolite screening. The vertical dashed line indicates VIP = 1, and the horizontal dashed line indicates −log10(FDR-adjusted p) = 1.301 (p = 0.05). Metabolites located in the yellow region (VIP > 1 and p < 0.05) were identified as significant differential metabolites (where the background color is yellow). (d) Variable importance plot based on Random Forest analysis, displaying the Mean Decrease Accuracy for the top-ranked differential metabolites (biomarkers).
3.5. Responses of Microbial Taxa and Functional Pathways to Environmental Variables
The RDA results indicated that environmental factors significantly shaped both the microbial community structure (Permutation test: p = 0.001, Figure S6a) and functional composition (Permutation test: p = 0.015, Figure S6b). Notably, environmental factors explained a substantial proportion of the functional variance, with RDA1 alone accounting for 78.77% (Figure S6b), compared to 27.14% for the community structure (Figure S6a). In both plots, pH and AK (available potassium) emerged as the primary driving factors along the RDA1 axis, while AN and AB were associated with the RDA2 axis. Most bacterial genera (e.g., Methylocaldum, Pseudaminobacter, and Paucibacter) showed significant positive correlations with AK, pH, and AP (available phosphorus) (p < 0.001, indicated by red color and asterisks). In contrast, OM, AN, and AB showed weak or non-significant correlations (Figure S6c). Similarly, pH, AP, and AK were strongly and positively correlated with the majority of metabolic functions (p < 0.001). These functions were primarily enriched in energy metabolism pathways (e.g., F-type ATPase, Cytochrome oxidase, NADH-quinone oxidoreductase) and secretion systems (Type I–VI Secretion, Flagellum assembly) (Figure S6d).
Figure 8.
Boxplots of differential metabolites showing significant differences among treatment groups in negative ion mode (ESI-). Note: The boxplots illustrate the distribution of relative abundance for each significantly different metabolite across various treatments. The central horizontal line within each box represents the median, the box boundaries indicate the 25th and 75th percentiles (interquartile range, IQR), and the whiskers extend to 1.5 times the IQR. Black dots represent outliers. The double asterisks (**) above each panel indicate a highly significant difference (p < 0.01) among the treatment groups based on statistical analysis (e.g., one-way ANOVA).(a) 3-Cyclohexyl-1-propylsulfonic acid; (b) Brachystemidine C; (c) 3-Isobutyl-1-methylxanthine; (d) H-PHE-ASP-OH; (e) 4-nitroquinoline 1-oxide; (f) Megistonine II; (g) HEPES; (h) 2-Hydroxy-6-oxo-(2′-aminophenyl)-hexa-2,4-dienoate; (i) Torachrysone-8-O-b-D-glucoside; (j) 8beta-Propionyloxy-10beta-hydroxyhirsutinolide-13-O-acetate; (k) Pteroic acid; (l) Pyranonigrin A; (m) 5-Fluorouridine; (n) Pisonin D; (o) Botryaloic acid acetate.The 12 colors represent different treatments, and the same treatment is shown in the same color across different figures.
4. Discussion
4.1. Effects of Optimal Nitrate-to-Ammonium Ratio on Seed Yield of Continuously Cropped Sesame
Our results demonstrated that the NO3−/NH4+ ratio of 6:4 increased seed yield of continuously cropped sesame compared with other treatments. This finding was broadly consistent with the general pattern reported in the literature that balanced or moderately nitrate-dominant nitrogen nutrition favors yield improvement across multiple crop species [15,41]. Mixed nitrogen supplies (e.g., NO3−/NH4+ ratios of 75:25, 3:7, and 3:1) had been documented to exert significant yield-enhancing effects in tomato, flowering Chinese cabbage, maize and strawberry [41,42,43,44]. The optimal 6:4 ratio obtained in our study numerically falls within this “moderately nitrate-preferred” range, further validating the universal productivity benefits of mixed nitrogen sources. More importantly, continuous cropping conditions may have amplified the yield advantage of the 6:4 ratio. Continuous cropping soils commonly suffer from aggravated acidification and autotoxin enrichment, imposing multiple stresses on root growth and nutrient acquisition. Nitrogen forms often exert opposite effects on rhizosphere pH, although the magnitude and direction can vary with plant species and environmental conditions: NO3− uptake generally induces rhizosphere alkalinization, whereas NH4+ uptake typically causes intense rhizosphere acidification [5,45,46]. In the context of the acidic continuous cropping soil used in this study, excessively high NH4+ proportions (e.g., 0:10) likely further exacerbated rhizosphere acidification, disturbed the uptake of cations such as Ca2+, Mg2+ and K+, and induced ammonium toxicity [43,46]. In the 6:4 treatment, by contrast, the 60% NO3− supply effectively buffered rhizosphere acidification, maintaining pH within a range suitable for sesame root physiological activity, while the 40% NH4+ moderately stimulated root proliferation in localized zones [47], thereby helping sesame roots partially circumvent the stress conditions in the topsoil layer under continuous cropping. From the perspective of carbon–nitrogen metabolism, NO3− assimilation is closely coupled with photosynthetic carbon fixation, favoring the maintenance of leaf photosynthetic function and dry matter accumulation [15], whereas NH4+ assimilation occurs predominantly in roots, and excessive NH4+ may cause over-consumption of photosynthates belowground. The 6:4 ratio likely achieved an optimal balance between “above-ground photosynthetic maintenance” and “moderate below-ground carbohydrate consumption”, resulting in coordinated improvements in both 1000-seed weight and capsule number per plant. This interpretation was corroborated by reports that the 3:1 ratio enhanced photosynthetic rate and grain filling efficiency in maize [15,41], as well as the finding that mixed nitrogen supply improved nitrogen use efficiency in flowering Chinese cabbage [43]. In summary, we propose that the 6:4 NO3−/NH4+ ratio represents not only an optimal yield-enhancing nitrogen regime for continuously cropped sesame, but also an effective nitrogen management strategy to mitigate continuous cropping obstacles through the triple mechanisms of rhizosphere pH regulation, root activity optimization, and carbon–nitrogen metabolic synergy. These findings provide a direct scientific basis for selecting N-form combinations in continuous sesame-cropping regions; nevertheless, the stability of this optimal ratio across different cropping years and soil types warrants further investigation.
4.2. Effects of Optimal Nitrate-to-Ammonium Ratio on Keystone Microbial Taxa in the Rhizosphere Community
The 6:4 NO3−/NH4+ ratio induced significant remodeling of the rhizosphere microbial community, with our interpretation focusing on s_Methylobacterium radiodurans, g_Flavisolibacter, and s_Sphingomonas ginsengisol because these taxa offer comparatively clearer ecological and functional signals than the other differentially abundant members. Recent microbiome studies increasingly indicate that low-abundance taxa can contribute disproportionately to community stability and stress responsiveness, suggesting that biological relevance should not be inferred from abundance alone [48,49]. In this context, the three focal taxa are best understood as potential indicators of N-form-driven niche selection rather than as direct causal mediators of phenotype [50,51]. For Methylobacterium, the current evidence supports interpretation at the genus level rather than the exact species level. Recent studies consistently described Methylobacterium as a methylotrophic, plant- and surface-associated lineage whose distribution was shaped by environmental conditions such as season, temperature, and geography [52,53]. These characteristics suggest that the altered abundance of s_Methylobacterium radiodurans under the 6:4 ratio may reflect changes in resource availability or microenvironmental stress that favor facultative methylotrophs and environmentally resilient colonizers, rather than a direct link to a defined host pathway [54,55]. Because direct recent intervention-based evidence for M. radiodurans itself remains lacking in the supplied literature, this interpretation should remain conservative [55,56]. The shift in Flavisolibacter may indicate restructuring of nutrient cycling functions within the community. Recent work has linked this genus to rhizosphere adaptation, nitrogen conversion, phosphate solubilization, heavy-metal mobilization, and oxidative protection, while metagenomic analysis has also suggested notable CAZyme potential [57,58,59]. These observations support the possibility that the 6:4 ratio altered the metabolic landscape in a way that selected for taxa involved in polysaccharide turnover, nutrient scavenging, or stress buffering. However, because Flavisolibacter is genus-level heterogeneous and not uniformly associated with beneficial outcomes, its biological significance should be interpreted as context-dependent rather than intrinsically favorable [60,61].
Among the three taxa, Sphingomonas had the strongest recent mechanistic support. Multiple studies have reported its enrichment and beneficial functions in the rhizosphere, primarily attributed to its capacity for plant growth promotion and disease suppression. For instance, Sphingomonas sediminicola Dae20 promotes root and shoot growth in Brassicaceae plants by producing auxin, siderophores, and exhibiting ACC deaminase activity [62]. Additionally, root exudate succinic acid can recruit Sphingomonas sp. WX113, which enhances tomato resistance against bacterial wilt, achieving 100% biocontrol efficiency when combined [63]. Additional genomic evidence points to stress tolerance, biofilm formation, and broad environmental resilience, which may enhance persistence under chemically altered conditions [64,65]. More importantly, Sphingomonas has emerged as a key biocontrol agent against multiple phytopathogens. For instance, Sphingomonas inhibits Pseudomonas syringae by disrupting pathogen chemotaxis and virulence, while also activating plant defenses through upregulation of pathogenesis-related genes via abscisic acid, ethylene, jasmonate, and salicylic acid signaling pathways [66]. Similarly, a novel Sphingomonas sp. A58 has been shown to significantly reduce disease symptoms and disease index of citrus canker, while efficiently producing siderophores and IAA to promote crop iron absorption and growth [67]. Furthermore, succinic acid in tomato root exudates selectively enriches Sphingomonas sp. WX113, achieving complete suppression (100% biocontrol efficiency) of bacterial wilt caused by Ralstonia solanacearum [63]. Therefore, the differential abundance of s_Sphingomonas ginsengisol under the 6:4 ratio plausibly reflects selection for disease-suppressive or colonization traits. Nevertheless, because recent studies rarely resolve this signal specifically to S. ginsengisol, species-level claims should be avoided [64]. Overall, the three focal taxa converge on a common ecological interpretation: the 6:4 NO3−/NH4+ ratio may favor community members with strong adaptive capacity, specialized carbon or xenobiotic utilization, and persistence under altered niche conditions. Compared with direct associations to SCFA signaling, bile acid metabolism, or inflammatory regulation, this ecological interpretation has stronger literature support, as the available studies do not explicitly connect these host pathways to the abundance changes in the focal taxa.
In addition to bacterial responses, the 6:4 ratio-associated enrichment of Cercospora was best interpreted as a shift in fungal community function and habitat filtering rather than a simple change in abundance alone. This aligns with the broader pattern where the most defensible discussion was ecological selection for functionally distinct taxa rather than species-level causality [68,69]. Cercospora should be discussed primarily as a pathogenic signal rather than a direct proxy for reduced disease risk. Recent literature shows that Cercospora species drive foliar disease through the toxin cercosporin, which disrupts photosynthesis, damages membranes, and induces oxidative injury in host tissues [70]. Advanced imaging has revealed that active cercosporin is specifically sequestered in lipid droplets of secondary hyphae, laying a foundation for understanding pathogenicity and symptomology [70]. In sugar beet systems, resistant varieties have been shown to reduce Cercospora leaf spot severity and yield loss, supporting integrated management strategies [71]. In the context of the 6:4 ratio discussion, the observed enrichment of Cercospora can therefore be framed as a nitrogen-driven habitat filtering outcome for saprotrophic occupation in the rhizosphere, rather than a neutral taxonomic fluctuation or a direct indicator of elevated pathogenic infection risk.
4.3. Effects of Optimal Nitrate-to-Ammonium Ratio on Key Function Pathway
In this study, the rhizosphere pathways associated with “Peroxisome” (map04146, https://www.kegg.jp/entry/map04146, accessed on 30 November 2024) and “Biosynthesis of various plant secondary metabolites” (map00999, https://www.kegg.jp/entry/map00999, accessed on 30 November 2024) were significantly altered under the NO3−:NH4+ = 6:4 treatment, suggesting that a specific nitrogen form ratio can profoundly reshape the metabolic landscape of the rhizosphere microenvironment from both redox homeostasis and chemical defense perspectives. Peroxisomes (map04146) are central organelles governing reactive oxygen species (ROS) metabolism, lipid β-oxidation, and redox signal transduction [72]. Moreover, Sandalio and Romero-Puertas [73] demonstrated that peroxisomes could sense environmental cues and initiate rapid responses through modulating ROS and reactive nitrogen species (RNS) signaling networks. Accordingly, the activation of the peroxisomal pathway observed in this study likely indicates that rhizosphere microorganisms or plant roots initiated a peroxisome-centered redox defense mechanism under the 6:4 nitrogen ratio to maintain ROS homeostasis in the rhizosphere.
The other significantly enriched pathway, map00999, corresponds to the “Biosynthesis of various plant secondary metabolites” (https://www.kegg.jp/entry/map00999, accessed on 30 November 2024), which, according to the KEGG database, encompasses the biosynthetic routes of multiple plant defense-related secondary metabolites, including coumarins, furanocoumarins, benzoxazinoids, and mugineic acids. Previous studies have provided clues regarding how nitrogen form influences secondary metabolism: for instance, the key methyltransferase involved in furanocoumarin biosynthesis has been successfully cloned [74], suggesting that this pathway possesses a genetic basis for responding to environmental signals. Furthermore, plant secondary metabolite synthesis is tightly linked to the phenylpropanoid and shikimate pathways, the carbon flux allocation of which is strongly influenced by the carbon–nitrogen metabolic balance. Thus, the activation of map00999 under the NO3−:NH4+ = 6:4 treatment may reflect a reallocation of carbon and nitrogen metabolism, directing more carbon skeletons and energy toward the production of defensive secondary metabolites. Collectively, the coordinated changes in map04146 (Peroxisome) and map00999 (Secondary metabolite biosynthesis) reveal an integrated rhizosphere adaptation logic, wherein the peroxisomal pathway addresses redox perturbations induced by ammonium metabolism, while the secondary metabolic pathway reinforces chemical defense barriers. Together, they constitute a multifaceted response network of the rhizosphere ecosystem to the specific NO3−:NH4+ = 6:4 nitrogen ratio. These findings not only deepen our understanding of the metabolic mechanisms by which nitrogen form regulates rhizosphere functions but also identify potential metabolic targets for optimizing the rhizosphere microecology through the manipulation of nitrogen form ratios.
Among the functional annotations of NB2RH0, two enzymatic components stood out as directly relevant to plant disease resistance and host–pathogen interactions, providing a mechanistic basis for the observed metabolic shifts under the NO3−:NH4+ = 6:4 treatment. Additionally, one module-level function was identified with documented associations to secondary metabolite-mediated microbial competition. The most prominent defense-related function identified was EC 4.1.1.48 (indole-3-glycerol phosphate synthase, IGPS, https://www.kegg.jp/entry/ec:4.1.1.48, accessed on 30 November 2024). This enzyme catalyzes the conversion of 1-(2-carboxyphenylamino)-1-deoxyribulose-5-phosphate to indole-3-glycerol phosphate (IGP), a critical branchpoint metabolite in the tryptophan biosynthetic pathway. The significance of IGPS in plant defense has been definitively established by Richter et al. [75], who demonstrated that the maize genome encodes three IGPS isoforms (IGPS1, IGPS2, and IGPS3). Importantly, IGPS1 and IGPS3 are insect-feeding-induced and interact with BX1/IGL to direct IGP flux toward defense-related benzoxazinoids, whereas IGPS2 interacts with TSA for primary tryptophan biosynthesis [75]. The presence of this enzyme in the NB2RH0 metagenome therefore suggested that the 6:4 nitrogen ratio might modulate the plant–microbe interface by influencing the biosynthesis of these indole-derived defense compounds.
The GH78 (glycoside hydrolase family 78, α-L-rhamnosidase, http://www.cazy.org/GH78.html, accessed on 30 November 2024) family is also of significant interest from a plant-pathogen interaction perspective. Comparative genomic analysis of cotton pathogens revealed that GH78, along with other pectin-degrading subfamilies (GH35, GH105, PL1, PL3, and PL4), was significantly expanded in the pathogen genome compared to endophytes, suggesting that these subfamilies played important roles in plant cell wall degradation and pathogenicity [76]. The presence of GH78 in the NB2RH0 dataset therefore implied that the nitrogen treatment might influence the virulence potential of the rhizosphere microbial community, possibly through modulation of cell wall degradation capacity. At the module level, the presence of M00848 (Aurachin biosynthesis, anthranilate → aurachin A, https://www.kegg.jp/entry/M00848, accessed on 30 November 2024) provided additional evidence for the involvement of secondary metabolite production in the rhizosphere response. According to the KEGG database, M00848 is classified under “Biosynthesis of other antibiotics” and is functionally linked to secondary metabolism. Aurachins are antimicrobial alkaloids produced by certain bacteria, and their biosynthesis originates from anthranilate—a key intermediate in the tryptophan and secondary metabolite pathways. Pistorius et al. [77] and Sandmann et al. [78] elucidated the enzymatic machinery of aurachin biosynthesis, demonstrating the involvement of a type II polyketide synthase and unique acyl-adenylating enzymes in the production of these compounds. The presence of this module in the NB2RH0 metagenome suggested that the rhizosphere microbial community might actively produce antibiotic compounds as part of the chemical defense response under the 6:4 nitrogen regime, complementing the plant-derived indole metabolites from the IGPS pathway. This module-level finding reinforced the interpretation that the nitrogen treatment triggered a global reprogramming of secondary metabolism in both the plant host and its associated microbiome. Collectively, the combined presence of the secondary metabolite-producing IGPS (EC 4.1.1.48), the secreted cell wall-degrading enzyme GH78, and the aurachin biosynthetic module (M00848) indicated that the NB2RH0 metagenome was equipped with a sophisticated repertoire for both plant defense induction (via indole-derived metabolites and microbial antibiotics) and microbial virulence (via pectin/rhamnoside modification). The differential regulation of these defense-related functions under the NO3−:NH4+ = 6:4 treatment suggested a shift in the metabolic and genetic landscape of the rhizosphere, potentially toward enhanced chemical defense and altered microbial pathogenesis, which warrants further investigation.
4.4. Effects of Optimal Nitrate-to-Ammonium Ratio on Key Rhizosphere Metabolites
Under positive ion mode, the identification of seven resistance-associated metabolites in this study points toward a coordinated defense module rather than isolated compounds with independent activities, consistent with the emerging understanding that root exudates and rhizosphere metabolites actively shape microbiome assembly, suppress pathogens, and promote plant health [79,80,81]. Within this framework, the coumarin-related metabolites—Nodakenin, Psoralenoside, and Columbianetin acetate—align well with the broader literature demonstrating that coumarins facilitate disease suppression by modulating rhizosphere community composition and function [80,81,82]. Especially, columbianetin acetate, a furanocoumarin phytoalexin naturally produced in celery (Apium graveolens), has been directly implicated in resistance to postharvest pathogens, with its accumulation in resistant cultivars correlating with inhibited growth of Botrytis cinerea, Fusarium oxysporum, and Rhizoctonia solani in a concentration-dependent manner [83]; this compound also exerts anti-inflammatory effects by suppressing mast cell degranulation and reducing histamine and pro-inflammatory cytokine (TNF-α, IL-6, IL-8) release in a dose-dependent fashion [84]. Among the flavonoid and phenylpropanoid metabolites, 4’-methoxychalcone and rhapontigenin likely reinforce resistance through complementary mechanisms—chalcones and their derivatives are well-recognized for antimicrobial activity, with structure–activity relationship studies demonstrating that the position and number of methoxy groups critically influence both the antimicrobial spectrum and potency [85]. The phenylpropanoid pathway, as a central stress-response metabolic route, supports defense and tissue resilience under biotic challenge [86]. Importantly, rhapontigenin has been demonstrated to function as a novel quorum-sensing inhibitor against Pectobacterium carotovorum subsp. carotovorum, significantly inhibiting bacterial motility, exopolysaccharide production, biofilm formation, and virulence-associated exoenzyme synthesis by suppressing acyl-homoserine lactone signal molecule production; direct-inoculation assays further confirmed that rhapontigenin treatment effectively extended shelf life and prevented quality loss of Chinese cabbage and lettuce by controlling soft-rot symptom spread [87]. Collectively, the co-occurrence of these three classes of metabolites under the 6:4 NO3−/NH4+ ratio treatment constitutes a multi-layered defense strategy. Coumarins function as the frontline troops, acting through both rhizosphere microbiome modulation and direct pathogen inhibition.
The fact that five of the seven resistance-associated metabolites were higher in healthy than diseased rhizosphere soil under the 6:4 ratio is consistent with the idea that healthy soils maintain a larger pool of defense-related metabolites that help prevent pathogen establishment [88]. Recent rhizosphere studies demonstrated that root-secreted secondary metabolites can shape microbial community composition in a concentration-dependent manner, and that defensive compounds such as benzoxazinoids and saponins can alter root-associated fungal and bacterial communities, thereby influencing plant performance and disease resistance in subsequent generations [88,89]. In that context, higher abundance in healthy soil is best interpreted as an active protective state, not just a passive consequence of plant health [88]. The exception of 4’-methoxychalcone and lobaric acid suggests that not all resistance-linked metabolites follow the same spatial pattern. A reasonable inference is that these two compounds may be locally enriched in diseased rhizospheres as stress-induced responses, even if they still participate in defense [85,90]. Recent evidence shows that root specialized metabolites can undergo dynamic remodeling through microbial transformation [91]. Thus, their higher level in diseased soil may reflect compensatory induction, altered turnover, or microbial transformation rather than reduced defensive relevance [90,91].
In negative ion mode, the opposite abundance patterns of six additional metabolites—three elevated in healthy soil (Torachrysone-8-O-β-D-glucoside, 8β-Propionyloxy-10β-hydroxyhirsutinolide-13-O-acetate, and Pisonin D) and three decreased in healthy soil (Pyranonigrin A, Pteroic acid, and Botryaloic acid acetate)—suggested a disease-linked reprogramming of rhizosphere chemistry rather than isolated metabolic fluctuations. Among the disease metabolites, the lower abundance of Pyranonigrin A in healthy plant soil may reflect reduced accumulation of a fungal stress-associated antioxidant. In Aspergillus niger, Pyranonigrin A functions as an antioxidant linked to adaptive responses under extreme conditions, including irradiation and oxidative stress [92,93]. Its higher abundance in diseased soil thus likely indicates stronger oxidative or ecological stress in the rhizosphere, potentially associated with pathogen pressure or a stress-tolerant fungal community [92,94]. By contrast, pteroic acid and botryaloic acid acetate lack direct rhizosphere-specific functional validation in the current evidence. The most defensible interpretation is that they should be treated as candidate disease-associated metabolites whose abundance tracks broader shifts in fungal metabolism and soil disturbance, rather than proven causal agents in disease development [95,96]. The three metabolites (Pyranonigrin A, Pteroic acid, and Botryaloic acid acetate) were less abundant in healthy soil, a pattern consistent with their association with pathogen activity or disease-conducive processes rather than with protection. Their reduction in healthy soil therefore reflects the suppression of the pathogen/metabolic processes that produce them, which aligns with the protective rhizosphere state. Recent studies consistently show that healthy or disease-suppressive soils are enriched in metabolites that recruit beneficial microbes, strengthen microbial networks, and suppress pathogen expansion [47,97,98]. In particular, metabolite-mediated enrichment of beneficial taxa—including Bacillus, Pseudomonas, Streptomyces, and Sphingomonas—is repeatedly associated with improved plant resistance [97,98,99]. Taken together, the overall pattern is most consistent with a healthy-soil metabolome biased toward microbiome support and disease suppression, whereas diseased soil appears to accumulate metabolites associated with stress adaptation, fungal persistence, or dysbiosis [94,99,100]. Thus, these metabolites may serve as useful ecological markers of rhizosphere status, with Pyranonigrin A being especially suggestive of stress-related fungal activity [92,93].
Integrated across the three perspectives, the 6:4 NO3−/NH4+ ratio promotes yield improvement in continuously cropped sesame through a multi-layered mechanism. While our previous work identified the 5:5 ratio as optimal in terms of microbial community modulation [12], that study was limited to 16S rDNA amplicon sequencing and did not examine rhizosphere metabolomics. The present study extends this line of inquiry by integrating microbiome and metabolome analyses, revealing that a slightly nitrate-enriched 6:4 ratio confers superior yield benefits under continuous cropping stress. Specifically, this ratio optimizes carbon–nitrogen metabolic balance and rhizosphere pH conditions to directly enhance plant growth and yield components. Simultaneously, it reshapes the rhizosphere microbial community by selecting for stress-tolerant and metabolically versatile bacterial taxa while suppressing pathogenic fungi and promoting resilient fungal associates. Furthermore, it drives the accumulation of phenylpropanoid- and coumarin-linked defensive metabolites that reinforce rhizosphere chemical defense. This coordinated response—encompassing plant physiology, microbial ecology, and metabolomic reprogramming—provides a holistic framework for understanding how balanced nitrogen nutrition alleviates continuous cropping obstacles. Because interaction terms were not explicitly tested, the reported differences should be interpreted as group-level associations rather than as evidence of independent main effects or interactions. Future work should employ shotgun metagenomics, strain-level annotation, and functional assays to validate these taxa and determine whether the observed shifts reflect true mechanistic contributions or broader community reassembly. Likewise, the stability of this optimal ratio across different cropping years and soil types warrants further investigation before widespread agronomic application.
5. Conclusions
In this study, we investigated the effects of nitrate-to-ammonium ratios on sesame rhizosphere microbiota and metabolites. The 6:4 ratio gave the highest seed yield. Nitrogen form ratios distinctly shaped microbial community structure, functional profiles, and metabolite networks, with several disease-resistance-related metabolites enriched in healthy-plant rhizosphere under positive ion mode; however, the opposite was true in negative ion mode. These findings highlight that nitrogen form management plays a greater role in modulating rhizosphere ecology than in directly promoting yield. Future research should focus on validating the functional roles of key differential metabolites and key taxa through synthetic community (SynCom) experiments and genetic knockout approaches, as well as evaluating the long-term effects of optimized nitrogen ratios on soil health and disease suppression across different field conditions and sesame varieties.
Supplementary Materials
The following supporting information can be downloaded at: https://www.mdpi.com/article/10.3390/microorganisms14112539/s1, Table S1. Detailed nitrogen fertilizer application scheme for different experimental treatments. Table S2. Effects of different nitrate to ammonium nitrogen ratios on yield and yield components of sesame. Table S3. Effects of different treatments on chemical properties of rhizosphere and non-rhizosphere soils. Table S4. Identification of key metabolites by UPLC-MS/MS, including mass accuracy, MS/MS spectral matching, and database matching scores. Table S5. Three-way ANOVA of four bacterial species and one fungal species under different nitrogen ratio, location, and status treatments. Table S6. Three-way ANOVA of metabolite concentrations detected in positive (ESI+) and negative (ESI−) ion modes as affected by nitrogen ratio (Nitrogen), sampling location (Location), and sample status (Status), and their interactions. Figure S1. Non-metric multidimensional scaling (NMDS) analysis of microbial community structures in response to different nitrate-to-ammonium ratio treatments. Figure S2. LEfSe analysis of bacterial taxa under different nitrate-to-ammonium ratios (LDA score ≥ 2.5). Figure S3. LEfSe analysis of functional prediction results from different databases under different nitrate-to-ammonium ratio treatments. Figure S4. Principal component analysis (PCA) and model permutation tests of soil metabolomics under different modes. Figure S5. Instrument drift was evaluated by calculating the Pearson correlation between QC samples in positive and negative ion modes. Figure S6. Relationships between environmental factors, community composition, and functional profiles.
Author Contributions
R.W.: Writing—original draft. R.L.: Writing—review & editing. F.L.: Visualization, Investigation. J.Y.: Data curation. J.H.: Conceptualization. Z.Z.: Validation. H.L.: Software. All authors have read and agreed to the published version of the manuscript.
Funding
This research was funded by the Natural Science Foundation of China [grant number 32260537] and the China Agricultrual Research System [grant number CARS-14-2-15].
Institutional Review Board Statement
Not applicable.
Informed Consent Statement
Not applicable.
Data Availability Statement
The data presented in this study are openly available in NCBI at [https://dataview.ncbi.nlm.nih.gov/object/PRJNA1521067, accessed on 29 September 2026] [PRJNA1521067].
Acknowledgments
We thank the Sesame Research Center, Henan Academy of Agricultural Sciences, China, for providing the sesame variety Yuzhi ND837.
Conflicts of Interest
The authors declare no conflicts of interest.
References
- Ouyang, C.; Yang, K.; Zhao, Z. Application of Nitrate–Ammonium Nitrogen Fertilization Reduced Nitrogen Loss in Surface Runoff and Infiltration by Improving Root Morphology of Flue-Cured Tobacco. Agronomy 2024, 14, 2532. [Google Scholar] [CrossRef] [Scilit]
- Bao, T.; Gao, Z.; Xu, S.; Li, X.; Huang, R.; Zou, Y.; Zhou, Q.; Lyu, M.; Bai, Y.; Lyu, F. Effects of different nitrogen form ratios on the occurrence of tobacco bacterial wilt and soil bacterial community. J. South. Agric. 2023, 54, 2207–2217. [Google Scholar] [CrossRef]
- Li, Y.; El-Desouki, Z.; Riaz, M.; Abd-Elkader, A.M.; Babar, S.; Wang, X.; Wang, J.; Xia, X.; Jiang, C. Ammonia-oxidizing microorganisms and microbial respiration: Biochar ammonium/nitrate-based fertilizer effects on soil nitrification and crop performance. Soil Use Manag. 2025, 41, 70019. [Google Scholar] [CrossRef] [Scilit]
- Zhang, H.Q.; Zhao, X.Q.; Shi, Y.; Liang, Y.; Shen, R.F. Changes in soil bacterial communities with increasing distance from maize roots affected by ammonium and nitrate additions. Geoderma 2021, 398, 115102. [Google Scholar] [CrossRef] [Scilit]
- Khan, Z.; Yang, X.; Fan, X.; Duan, S.; Yang, C.; Khan, M.N.; Iqbal, A.; Shen, H.; Fu, Y. Integrated ammonium and nitrate nitrogen supply alters the composition and functionalities of rice rhizosphere bacterial communities and enhances nitrogen use efficiency. Pedosphere 2025, 35, 914–930. [Google Scholar] [CrossRef] [Scilit]
- Qin, L.; Miao, H.; Zhang, Z.; Duan, Y.; Zhang, H. Production status of the world sesame and development trend of sesame production in China. China Oils Fats 2024, 49, 1–5. [Google Scholar]
- Wang, R.; Lyu, F.; Lyu, R.; He, J.; Wei, L. Mechanisms of furrow-applied biochar in enhancing rhizosphere soil microbiota and metabolites in continuous sesame cropping. Eur. J. Soil Biol. 2025, 126, 103763. [Google Scholar] [CrossRef] [Scilit]
- Xiao, H.; Chen, H.; Wang, L.; Yin, C.; Lan, B.; Huang, J.; Yang, Y. Research Progress on Comprehensive Prevention and Control Techniques of Sesame Stem Spot Blight. Chin. Agric. Sci. Bull. 2024, 40, 119–125. [Google Scholar]
- Li, X.; Xiao, Y.; Huang, R.; Wei, L.; Wang, R.; Hua, J. Effects of bacterial wilt on the growth and yield traits of sesame. J. Plant Prot. 2019, 46, 762–769. [Google Scholar] [CrossRef]
- Wang, R.; Zhang, Z.; Lyu, F.; Lin, H.; Wei, L.; Xiao, Y. Impact analysis of nitrogen fertilizer reduction on bacterial community structure and function in rhizosphere soil of continuous cropping sesame. Chin. J. Oil Crop Sci. 2022, 44, 1307–1319. [Google Scholar] [CrossRef]
- Wang, R.; Lyu, F.; Lyu, R.; He, J.; Wei, L. Applying an appropriate rate of rice husk biochar improves the microbial community structure of rhizosphere soil in continuously cropped sesame. Sci. Rep. 2025, 15, 35115. [Google Scholar] [CrossRef] [Scilit]
- Wang, R.; Zhang, Z.; Lv, F.; Lin, H.; Wei, L.; Xiao, Y. Optimizing the bacterial community structure and function in rhizosphere soil of sesame continuous cropping by the appropriate nitrate ammonium ratio. Rhizosphere 2022, 23, 100550. [Google Scholar] [CrossRef] [Scilit]
- Orr, R.; Dennis, P.G.; Wong, Y.; Browne, D.J.; Cooper, M.; Birt, H.W.G.; Lapis-Gaza, H.R.; Pattison, A.B.; Nelson, P.N. Nitrogen fertilizer rate but not form affects the severity of Fusarium wilt in banana. Front. Plant Sci. 2022, 13, 907819. [Google Scholar] [CrossRef] [Scilit]
- Enomoto, T.; Tone, N.; Ishii, T.; Hirono, H.; Oi, A.; Hirono, Y.; Ikka, T.; Yamashita, H. Effect of Ammonium:Nitrate Application Ratios on Growth and Nitrogen Metabolism of Tea Plants (Camellia sinensis L.). Plant Direct 2025, 9, e70084. [Google Scholar] [CrossRef] [Scilit]
- Wu, B.; Cui, Z.; Zechariah, E.; Guo, L.; Gao, Y.; Yan, B.; Liu, H.; Wang, Y.; Wang, H.; Li, L. Post-anthesis dry matter and nitrogen accumulation, partitioning, and translocation in maize under different nitrate–ammonium ratios in Northwestern China. Front. Plant Sci. 2024, 15, 1257882. [Google Scholar] [CrossRef] [Scilit]
- Chen, C.; Cheng, Y.; Zhang, F.; Yu, S.; Cui, X.; Wu, Y. A Comparative Analysis of Microbial Communities in the Rhizosphere Soil and Plant Roots of Healthy and Diseased Yuanyang Nanqi (Panax vietnamensis) with Root Rot. Agriculture 2024, 14, 719. [Google Scholar] [CrossRef] [Scilit]
- Jia, C.; An, Y.; Du, Z.; Gao, H.; Su, J.; Xu, C. Differences in Soil Microbial Communities between Healthy and Diseased Lycium barbarum cv. Ningqi-5 Plants with Root Rot. Microorganisms 2023, 11, 694. [Google Scholar] [CrossRef] [Scilit]
- Kang, H.; Chai, A.; Lin, Z.; Shi, Y.; Xie, X.; Li, L.; Fan, T.; Xiang, S.; Xie, J.; Li, B. Deciphering Differences in Microbial Community Diversity between Clubroot-Diseased and Healthy Soils. Microorganisms 2024, 12, 251. [Google Scholar] [CrossRef] [Scilit]
- Wu, H.; Chen, S.; Zhu, L.; Xu, Y.; Li, J.; Ling, N.; Yuan, J.; Xue, C.; Shen, Q. Identification of antibiotic resistant bacteria communities and a GeoChip based study of resistome in Fusarium wilt diseased and healthy soil. Appl. Soil Ecol. 2024, 193, 105103. [Google Scholar] [CrossRef] [Scilit]
- Bolger, A.M.; Lohse, M.; Usadel, B. Trimmomatic: A flexible trimmer for Illumina sequence data. Bioinformatics 2014, 30, 2114–2120. [Google Scholar] [CrossRef] [Scilit]
- Langmead, B.; Salzberg, S.L. Fast gapped-read alignment with Bowtie 2. Nat. Methods 2012, 9, 357–359. [Google Scholar] [CrossRef] [Scilit]
- Wood, D.E.; Lu, J.; Langmead, B. Improved metagenomic analysis with Kraken 2. Genome Biol. 2019, 20, 257. [Google Scholar] [CrossRef] [Scilit]
- Lu, J.; Breitwieser, F.P.; Thielen, P.; Salzberg, S.L. Bracken: Estimating species abundance in metagenomics data. PeerJ Comput. Sci. 2017, 3, e104. [Google Scholar] [CrossRef] [Scilit]
- Franzosa, E.A.; McIver, L.J.; Rahnavard, G.; Thompson, L.R.; Schirmer, M.; Weingart, G.; Lipson, K.S.; Knight, R.; Caporaso, J.G.; Segata, N.; et al. Species-level functional profiling of metagenomes and metatranscriptomes. Nat. Methods 2018, 15, 962–968. [Google Scholar] [CrossRef] [Scilit]
- Gower, J. Some distance properties of latent root and vector methods used in multivariate analysis. Biometrika 1966, 53, 325–338. [Google Scholar] [CrossRef] [Scilit]
- Kruskal, J. Multidimensional Scaling by Optimizing Goodness of Fit to A Nonmetric Hypothesis. Psychometrika 1964, 29, 1–27. [Google Scholar] [CrossRef] [Scilit]
- Segata, N.; Izard, J.; Waldron, L.; Gevers, D.; Miropolsky, L.; Garrett, W.S.; Huttenhower, C. Metagenomic biomarker discovery and explanation. Genome Biol. 2011, 12, R60. [Google Scholar] [CrossRef] [Scilit]
- Buchfink, B.; Xie, C.; Huson, D.H. Fast and sensitive protein alignment using DIAMOND. Nat. Methods 2015, 12, 59–60. [Google Scholar] [CrossRef] [Scilit]
- McArthur, A.G.; Waglechner, N.; Nizam, F.; Yan, A.; Azad, M.A.; Baylay, A.J.; Bhullar, K.; Canova, M.J.; De Pascale, G.; Ejim, L.; et al. The Comprehensive Antibiotic Resistance Database. Antimicrob. Agents Chemother. 2013, 57, 3348–3357. [Google Scholar] [CrossRef] [Scilit]
- Bewick, V.; Cheek, L.; Ball, J. Statistics review 9: One-way analysis of variance. Crit. Care 2004, 8, 130–136. [Google Scholar] [CrossRef] [Scilit]
- Bethea, R.M.; Duran, B.S.; Boullion, T.L. Statistical Methods for Engineers and Scientists, 3rd ed.; rev. and expanded; M. Dekker: New York, NY, USA, 1995. [Google Scholar]
- Anderson, M.J. A new method for non-parametric multivariate analysis of variance. Austral Ecol. 2001, 26, 32–46. [Google Scholar] [CrossRef]
- Love, M.I.; Huber, W.; Anders, S. Moderated estimation of fold change and dispersion for RNA-seq data with DESeq2. Genome Biol. 2014, 15, 550. [Google Scholar] [CrossRef] [Scilit]
- Gao, Y.; Zhang, G.; Jiang, S.; Liu, Y.X. Wekemo Bioincloud: A user-friendly platform for meta-omics data analyses. iMeta 2024, 3, e175. [Google Scholar] [CrossRef] [Scilit]
- Van den Wollenberg, A.L. Redundancy analysis an alternative for canonical correlation analysis. Psychometrika 1977, 42, 207–219. [Google Scholar] [CrossRef] [Scilit]
- Spearman, C. The proof and measurement of association between two things. Am. J. Psychol. 1904, 15, 72–101. [Google Scholar] [CrossRef] [Scilit]
- Eisen, M.B.; Spellman, P.T.; Brown, P.O.; Botstein, D. Cluster analysis and display of genome-wide expression patterns. Proc. Natl. Acad. Sci. USA 1998, 95, 14863–14868. [Google Scholar] [CrossRef] [Scilit]
- Smith, C.A.; Want, E.J.; O’Maille, G.; Abagyan, R.; Siuzdak, G. XCMS_ Processing Mass Spectrometry Data for Metabolite Profiling Using Nonlinear Peak Alignment, Matching, and Identification. Anal. Chem. 2006, 78, 779–787. [Google Scholar] [CrossRef] [Scilit]
- Chong, J.; Xia, J. MetaboAnalystR: An R package for flexible and reproducible analysis of metabolomics data. Bioinformatics 2018, 34, 4313–4314. [Google Scholar] [CrossRef] [Scilit]
- Breiman, L. Random Forests. Mach. Learn. 2001, 45, 5–32. [Google Scholar] [CrossRef] [Scilit]
- Li, C.C.; Gao, Y.H.; Guo, L.Z.; Liu, H.S.; Lu, Y.D.; Yang, P.; Yang, T.Q. Effects of different ratios of nitrate to ammonium on dry matter accumulation and yield of maize planting in furrows under alternating narrow and wide ridges completely mulched. Agric. Res. Arid. Areas 2017, 35, 198–203. [Google Scholar]
- Liu, G.; Du, Q.; Li, J. Interactive effects of nitrate-ammonium ratios and temperatures on growth, photosynthesis, and nitrogen metabolism of tomato seedlings. Sci. Hortic. 2017, 214, 41–50. [Google Scholar] [CrossRef] [Scilit]
- Zhu, Y.; Qi, B.; Hao, Y.; Liu, H.; Sun, G.; Chen, R.; Song, S. Appropriate NH4+/NO3– Ratio Triggers Plant Growth and Nutrient Uptake of Flowering Chinese Cabbage by Optimizing the pH Value of Nutrient Solution. Front. Plant Sci. 2021, 12, 656144. [Google Scholar] [CrossRef] [Scilit]
- Chen, S.; Gao, H.; Sheng, Y.; Cheng, Y.; Hua, J.; Wu, W.; Ma, H.; Chen, Q.; Gao, H. Physiological and transcriptomic analyses elucidate the effects of nitrogen form ratios on strawberry growth and development. BMC Plant Biol. 2026, 26, 1535. [Google Scholar] [CrossRef] [Scilit]
- Jing, J.; Zhang, F.; Rengel, Z.; Shen, J. Localized fertilization with P plus N elicits an ammonium-dependent enhancement of maize root growth and nutrient uptake. Field Crops Res. 2012, 133, 176–185. [Google Scholar] [CrossRef] [Scilit]
- Bonomelli, C.; de Freitas, S.T.; Aguilera, C.; Palma, C.; Garay, R.; Dides, M.; Brossard, N.; O’Brien, J.A. Ammonium Excess Leads to Ca Restrictions, Morphological Changes, and Nutritional Imbalances in Tomato Plants, Which Can Be Monitored by the N/Ca Ratio. Agronomy 2021, 11, 1437. [Google Scholar] [CrossRef] [Scilit]
- Rivero-Marcos, M.; Calleja-Satrustegui, A.; Ariz, I. The counteracting role of nitrate during ammonium toxicity in plants. Hortic. Plant J. 2026, 12, 49–61. [Google Scholar] [CrossRef] [Scilit]
- Shi, S.; Nuccio, E.E.; Shi, Z.J.; He, Z.; Zhou, J.; Firestone, M.K. The interconnected rhizosphere: High network complexity dominates rhizosphere assemblages. Ecol. Lett. 2016, 19, 926–936. [Google Scholar] [CrossRef] [Scilit]
- Kwak, M.J.; Kong, H.G.; Choi, K.; Kwon, S.K.; Song, J.Y.; Lee, J.; Lee, P.A.; Choi, S.Y.; Seo, M.; Lee, H.J.; et al. Rhizosphere microbiome structure alters to enable wilt resistance in tomato. Nat. Biotechnol. 2018, 36, 1100–1109, Erratum in Nat. Biotechnol. 2018, 36, 1117. https://doi.org/10.1038/nbt1118-1117. [Google Scholar] [CrossRef] [Scilit]
- Yuan, M.M.; Guo, X.; Wu, L.; Zhang, Y.; Xiao, N.; Ning, D.; Shi, Z.; Zhou, X.; Wu, L.; Yang, Y.; et al. Climate warming enhances microbial network complexity and stability. Nat. Clim. Change 2021, 11, 343–348. [Google Scholar] [CrossRef] [Scilit]
- Zhalnina, K.; Louie, K.B.; Hao, Z.; Mansoori, N.; da Rocha, U.N.; Shi, S.; Cho, H.; Karaoz, U.; Loqué, D.; Bowen, B.P.; et al. Dynamic root exudate chemistry and microbial substrate preferences drive patterns in rhizosphere microbial community assembly. Nat. Microbiol. 2018, 3, 470–480. [Google Scholar] [CrossRef] [Scilit]
- Jahan, R.; McDonald, I.R. Diversity of Methylobacterium species associated with New Zealand native plants. FEMS Microbiol. Lett. 2023, 370, fnad124. [Google Scholar] [CrossRef] [Scilit]
- Leducq, J.B.; Seyer Lamontagne, É.; Condrain Morel, D.; Bourret, G.; Sneddon, D.; Foster, J.A.; Marx, C.J.; Sullivan, J.M.; Shapiro, B.J.; Kembel, S.W. Fine-Scale Adaptations to Environmental Variation and Growth Strategies Drive Phyllosphere Methylobacterium Diversity. mBio 2022, 13, e0317521. [Google Scholar] [CrossRef] [Scilit]
- Palberg, D.; Kisiała, A.; Jorge, G.L.; Emery, R.J.N. A survey of Methylobacterium species and strains reveals widespread production and varying profiles of cytokinin phytohormones. BMC Microbiol. 2022, 22, 49. [Google Scholar] [CrossRef] [Scilit]
- Alleman, A.B.; Stolyar, S.; Marx, C.J.; Leducq, J.-B. Led astray by 16S rRNA: Phylogenomics reaffirms the monophyly of Methylobacterium and lack of support for Methylorubrum as a genus. ISME J. 2025, 19, wraf011. [Google Scholar] [CrossRef] [Scilit]
- Leducq, J.B.; Sneddon, D.; Santos, M.; Condrain Morel, D.; Bourret, G.; Martinez Gomez, N.C.; Lee, J.A.; Foster, J.A.; Stolyar, S.; Shapiro, B.J.; et al. Comprehensive Phylogenomics of Methylobacterium Reveals Four Evolutionary Distinct Groups and Underappreciated Phyllosphere Diversity. Genome Biol. Evol. 2022, 14, evac123. [Google Scholar] [CrossRef] [Scilit]
- Han, X.; Liu, H.; Bai, X.; Li, D.; Wang, T.; Zhong, H.; Yao, Y.; Sun, J. Insights into antibiotic resistomes from metagenome-assembled genomes and gene catalogs of soil microbiota across environments. Peer J. 2025, 13, e20348. [Google Scholar] [CrossRef] [Scilit]
- Lv, H.; Ji, C.; Ding, J.; Yu, L.; Cai, H. High Levels of Zinc Affect Nitrogen and Phosphorus Transformation in Rice Rhizosphere Soil by Modifying Microbial Communities. Plants 2022, 11, 2271. [Google Scholar] [CrossRef] [Scilit]
- Zhou, X.; Zhang, X.; Ma, C.; Wu, F.; Jin, X.; Dini-Andreote, F.; Wei, Z. Biochar amendment reduces cadmium uptake by stimulating cadmium-resistant PGPR in tomato rhizosphere. Chemosphere 2022, 307, 136138. [Google Scholar] [CrossRef] [Scilit]
- Liu, S.; Huang, J.; He, W.; Shi, L.; Zhang, W.; Li, E.; Hu, J.; Zhang, C.; Pang, H. Effects of microplastics on microbial community structure and wheatgrass traits in Pb-contaminated riparian sediments under flood-drainage-planting conditions. J. Hazard. Mater. 2024, 470, 134283. [Google Scholar] [CrossRef] [Scilit]
- Yang, J.; Lu, X.; Hao, B.; Wang, S.; Kong, L.; Shao, Q.; Li, W.; Wang, X.; Xu, Y.; Wu, W.; et al. Bio-organic fertilizers reshape rhizosphere bacterial community and enhance crop productivity in reclaimed soil. Front. Microbiol. 2025, 16, 1713125. [Google Scholar] [CrossRef] [Scilit]
- Mazoyon, C.; Catterou, M.; Alahmad, A.; Mongelard, G.; Guénin, S.; Sarazin, V.; Dubois, F.; Duclercq, J. Sphingomonas sediminicola Dae20 Is a Highly Promising Beneficial Bacteria for Crop Biostimulation Due to Its Positive Effects on Plant Growth and Development. Microorganisms 2023, 11, 2061. [Google Scholar] [CrossRef] [Scilit]
- Wang, N.; Ping, L.; Mei, X.; Zhang, Y.; Zhang, Y.; Yang, X.; Guo, Y.; Gao, Y.; Xu, Y.; Shen, Q.; et al. Succinic acid reduces tomato bacterial wilt disease by recruiting Sphingomonas sp. Environ. Microbiome 2025, 20, 85. [Google Scholar] [CrossRef] [Scilit]
- Sorouri, B.; Scales, N.C.; Gaut, B.S.; Allison, S.D. Sphingomonas clade and functional distribution with simulated climate change. Microbiol. Spectr. 2024, 12, e0023624. [Google Scholar] [CrossRef] [Scilit]
- Kaur, J.; Verma, H.; Kaur, J.; Lata, P.; Dhingra, G.G.; Lal, R. In Silico Analysis of the Phylogenetic and Physiological Characteristics of Sphingobium indicum B90A: A Hexachlorocyclohexane-Degrading Bacterium. Curr. Microbiol. 2024, 81, 233. [Google Scholar] [CrossRef] [Scilit]
- Yang, Z.; Liu, T.; Fan, J.; Chen, Y.; Wu, S.; Li, J.; Liu, Z.; Yang, Z.; Li, L.; Liu, S.; et al. Biocontrol agents modulate phyllosphere microbiota interactions against pathogen Pseudomonas syringae. Environ. Sci. Ecotechnol. 2024, 21, 100431. [Google Scholar] [CrossRef] [Scilit]
- Yao, Q.; Yuan, W.; Zhu, F.; Zhang, X.; Zhu, H. Novel Sphingomonas Strain and Application Thereof in Preventing and Treating Citrus Canker. CN Patent No. 119432641-A, 14 February 2025. [Google Scholar]
- Chen, C.; Keunecke, H.; Bemm, F.; Gyetvai, G.; Neu, E.; Kopisch-Obuch, F.J.; McDonald, B.A.; Stapley, J. GWAS reveals a rapidly evolving candidate avirulence effector in the Cercospora leaf spot pathogen. Mol. Plant Pathol. 2023, 25, e13407. [Google Scholar] [CrossRef] [Scilit]
- Chen, P.; Li, J.; Wei, D.; Chen, Y.; He, C.; Bao, H.; Jia, Z.; Ruan, Y.; Fan, P. Soil fungal networks exhibit sparser interactions than bacterial networks in diseased banana plantations. Appl. Environ. Microbiol. 2024, 90, e0157224. [Google Scholar] [CrossRef] [Scilit]
- de Novaes, M.I.C.; Robertson, C.; Doyle, V.P.; Burk, D.; Thomas-Sharma, S. Distribution and Sequestration of Cercosporin by Cercospora cf. flagellaris. Phytopathology® 2024, 114, 1822–1831. [Google Scholar] [CrossRef] [Scilit]
- Borgolte, S.; Laufer, D.; Liebe, S.; Seebode, S.; Kenter, C. Improved integrated management of Cercospora leaf spot (Cercospora beticola) with a new-type resistant sugar beet (Beta vulgaris L.) variety. Eur. J. Plant Pathol. 2025, 172, 747–760. [Google Scholar] [CrossRef] [Scilit]
- Charton, L.; Plett, A.; Linka, N. Plant peroxisomal solute transporter proteins. J. Integr. Plant Biol. 2019, 61, 817–835. [Google Scholar] [CrossRef] [Scilit]
- Sandalio, L.M.; Romero-Puertas, M.C. Peroxisomes sense and respond to environmental cues by regulating ROS and RNS signalling networks. Ann. Bot. 2015, 116, 475–485. [Google Scholar] [CrossRef] [Scilit]
- Hehmann, M.; Lukačin, R.; Ekiert, H.; Matern, U. Furanocoumarin biosynthesis in Ammi majus L. Eur. J. Biochem. 2004, 271, 932–940. [Google Scholar] [CrossRef] [Scilit]
- Richter, A.; Powell, A.F.; Mirzaei, M.; Wang, L.J.; Movahed, N.; Miller, J.K.; Piñeros, M.A.; Jander, G. Indole-3-glycerolphosphate synthase, a branchpoint for the biosynthesis of tryptophan, indole, and benzoxazinoids in maize. Plant J. 2021, 106, 245–257. [Google Scholar] [CrossRef] [Scilit]
- Chen, J.Y.; Liu, S.Y.; Li, L.; Dai, X.F. Annotation and Comparative Analysis of the Carbohydrate-Active Enzymes in Cotton Pathogen. Sci. Agric. Sin. 2013, 46, 496–506. [Google Scholar] [CrossRef]
- Pistorius, D.; Li, Y.; Sandmann, A.; Müller, R. Completing the puzzle of aurachinbiosynthesis in Stigmatella aurantiacaSg a15. Mol. Biosyst. 2011, 7, 3308–3315. [Google Scholar] [CrossRef] [Scilit]
- Sandmann, A.; Dickschat, J.; Jenke-Kodama, H.; Kunze, B.; Dittmann, E.; Müller, R. A Type II Polyketide Synthase from the Gram-Negative Bacterium Stigmatella aurantiaca Is Involved in Aurachin Alkaloid Biosynthesis. Angew. Chem. Int. Ed. 2007, 46, 2712–2716. [Google Scholar] [CrossRef] [Scilit]
- Sasse, J.; Martinoia, E.; Northen, T. Feed Your Friends: Do Plant Exudates Shape the Root Microbiome? Trends Plant Sci. 2018, 23, 25–41. [Google Scholar] [CrossRef] [Scilit]
- Stringlis, I.A.; Yu, K.; Feussner, K.; de Jonge, R.; Van Bentum, S.; Van Verk, M.C.; Berendsen, R.L.; Bakker, P.A.H.M.; Feussner, I.; Pieterse, C.M.J. MYB72-dependent coumarin exudation shapes root microbiome assembly to promote plant health. Proc. Natl. Acad. Sci. USA 2018, 115, E5213–E5222. [Google Scholar] [CrossRef] [Scilit]
- Stassen, M.J.J.; Hsu, S.-H.; Pieterse, C.M.J.; Stringlis, I.A. Coumarin Communication Along the Microbiome–Root–Shoot Axis. Trends Plant Sci. 2021, 26, 169–183. [Google Scholar] [CrossRef] [Scilit]
- Voges, M.J.E.E.E.; Bai, Y.; Schulze-Lefert, P.; Sattely, E.S. Plant-derived coumarins shape the composition of an Arabidopsis synthetic root microbiome. Proc. Natl. Acad. Sci. USA 2019, 116, 12558–12565. [Google Scholar] [CrossRef] [Scilit]
- Afek, U.; Carmeli, S.; Aharoni, N. Columbianetin, a phytoalexin associated with celery resistance to pathogens during storage. Phytochemistry 1995, 39, 1347–1350. [Google Scholar] [CrossRef] [Scilit]
- Jeong, H.J.; Na, H.J.; Kim, S.J.; Rim, H.K.; Myung, N.Y.; Moon, P.D.; Han, N.R.; Seo, J.U.; Kang, T.H.; Kim, J.J.; et al. Anti-inflammatory Effect of Columbianetin on Activated Human Mast Cells. Biol. Pharm. Bull. 2009, 32, 1027–1031. [Google Scholar] [CrossRef] [Scilit]
- Stompor, M.; Żarowska, B. Antimicrobial Activity of Xanthohumol and Its Selected Structural Analogues. Molecules 2016, 21, 608. [Google Scholar] [CrossRef] [Scilit]
- Ninkuu, V.; Aluko, O.O.; Yan, J.; Zeng, H.; Liu, G.; Zhao, J.; Li, H.; Chen, S.; Dakora, F.D. Phenylpropanoids metabolism: Recent insight into stress tolerance and plant development cues. Front. Plant Sci. 2025, 16, 1571825. [Google Scholar] [CrossRef] [Scilit]
- Li, B.; Huang, J.; Yi, Y.; Liu, S.; Liu, R.; Xiao, Z.; Li, C. Effects of Rhapontigenin as a Novel Quorum-Sensing Inhibitor on Exoenzymes and Biofilm Formation of Pectobacterium carotovorum subsp. carotovorum and Its Application in Vegetables. Molecules 2022, 27, 8878. [Google Scholar] [CrossRef] [Scilit]
- Hu, L.; Robert, C.A.M.; Cadot, S.; Zhang, X.; Ye, M.; Li, B.; Manzo, D.; Chervet, N.; Steinger, T.; van der Heijden, M.G.A.; et al. Root exudate metabolites drive plant-soil feedbacks on growth and defense by shaping the rhizosphere microbiota. Nat. Commun. 2018, 9, 2738. [Google Scholar] [CrossRef] [Scilit]
- Nakayasu, M.; Ohno, K.; Takamatsu, K.; Aoki, Y.; Yamazaki, S.; Takase, H.; Shoji, T.; Yazaki, K.; Sugiyama, A. Tomato roots secrete tomatine to modulate the bacterial assemblage of the rhizosphere. Plant Physiol. 2021, 186, 270–284. [Google Scholar] [CrossRef] [Scilit]
- Ureña-Vacas, I.; González-Burgos, E.; Divakar, P.K.; Gómez-Serranillos, M.P. Lichen Depsidones with Biological Interest. Planta Medica 2022, 88, 855–880. [Google Scholar] [CrossRef] [Scilit]
- Maitra, P.; Hrynkiewicz, K.; Szuba, A.; Jagodziński, A.M.; Al-Rashid, J.; Mandal, D.; Mucha, J. Metabolic niches in the rhizosphere microbiome: Dependence on soil horizons, root traits and climate variables in forest ecosystems. Front. Plant Sci. 2024, 15, 1344205. [Google Scholar] [CrossRef] [Scilit]
- Romsdahl, J.; Blachowicz, A.; Chiang, Y.-M.; Venkateswaran, K.; Wang, C.C.C. Metabolomic Analysis of Aspergillus niger Isolated From the International Space Station Reveals Enhanced Production Levels of the Antioxidant Pyranonigrin A. Front. Microbiol. 2020, 11, 931. [Google Scholar] [CrossRef] [Scilit]
- Blachowicz, A.; Romsdahl, J.; Chiang, A.J.; Masonjones, S.; Kalkum, M.; Stajich, J.E.; Torok, T.; Wang, C.C.C.; Venkateswaran, K. The International Space Station Environment Triggers Molecular Responses in Aspergillus niger. Front. Microbiol. 2022, 13, 893071. [Google Scholar] [CrossRef] [Scilit]
- Alfaro-García, R.G.; Méndez-Bravo, A.; Reverchon, F. Modulation of the rhizosphere microbiome by soil-borne pathogens: Digging into the pathobiome concept. Ann. Appl. Biol. 2026, 188, 22–33. [Google Scholar] [CrossRef] [Scilit]
- Zhuang, Y.; Wang, H.; Tan, F.; Wu, B.; Liu, L.; Qin, H.; Yang, Z.; He, M. Rhizosphere metabolic cross-talk from plant-soil-microbe tapping into agricultural sustainability: Current advance and perspectives. Plant Physiol. Biochem. 2024, 210, 108619. [Google Scholar] [CrossRef] [Scilit]
- Fan, X.; Ge, A.-H.; Qi, S.; Guan, Y.; Wang, R.; Yu, N.; Wang, E. Root exudates and microbial metabolites: Signals and nutrients in plant-microbe interactions. Sci. China Life Sci. 2025, 68, 2290–2302. [Google Scholar] [CrossRef] [Scilit]
- Adeniji, A.; Liu, Q.; Huang, X.; Lu, X.; Li, S.; Guo, R. Correlation between root exudate composition and beneficial bacteria underlies Fusarium wilt resistance in cucumber. Microbiol. Res. 2026, 309, 128512. [Google Scholar] [CrossRef] [Scilit]
- Liu, H.; Zhang, Z.; Xu, Y.; Wen, J. Soybean roots recruit plant-beneficial Pseudomonas via secreting 3,4-dihydroxybenzaldehyde. Plant Physiol. 2026, 200, kiag075. [Google Scholar] [CrossRef] [Scilit]
- Chen, X.; Zhang, N.; Zheng, Z.; Yu, H.; Wu, Y.; Shi, F. Effects of root rot disease on the microbiome and metabolites in roots and rhizosphere soil of sweet cherry. Sci. Hortic. 2024, 338, 113734. [Google Scholar] [CrossRef] [Scilit]
- Liu, H.; Dong, Y.; Shen, M.; Sun, F.; Wang, X.; Liu, J.; Li, J. Characteristics of Rhizosphere Microbial Communities in a Disease-suppressive Soil of Tomato Bacterial Wilt and Its Disease-suppressive Transmission Mechanism. ACTA Pedol. Sin. 2022, 59, 1125–1135. [Google Scholar] [CrossRef]
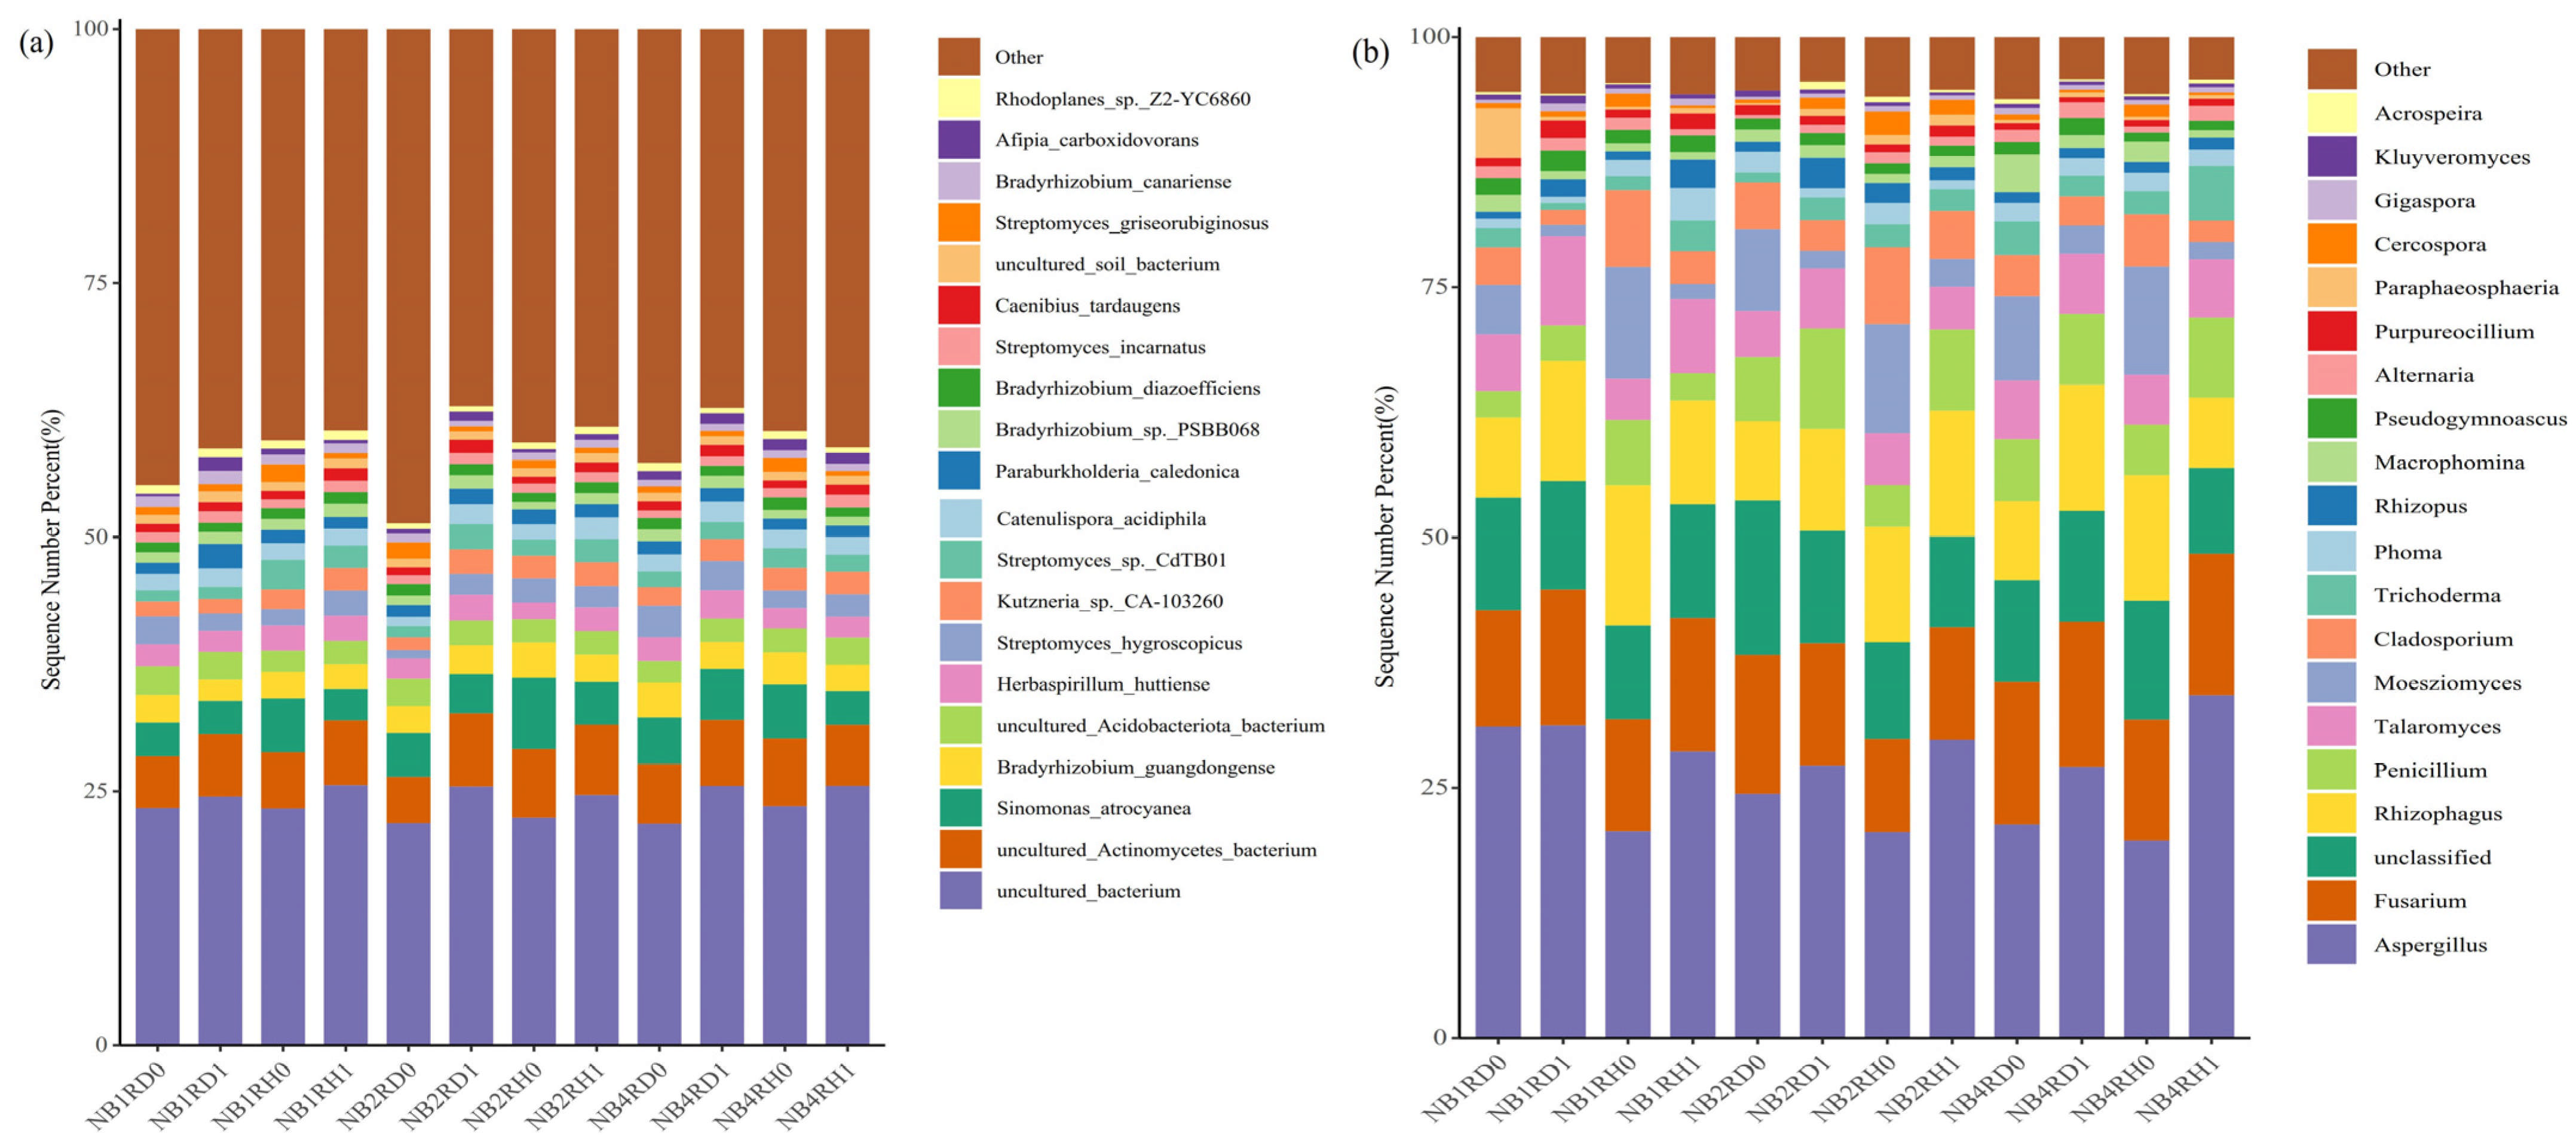
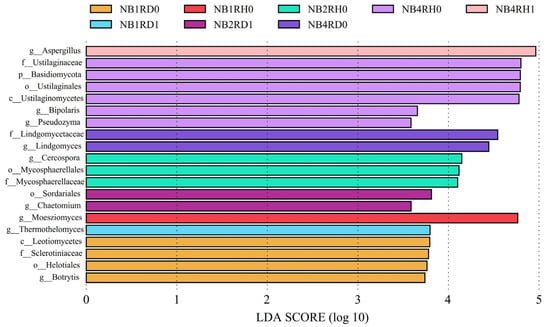
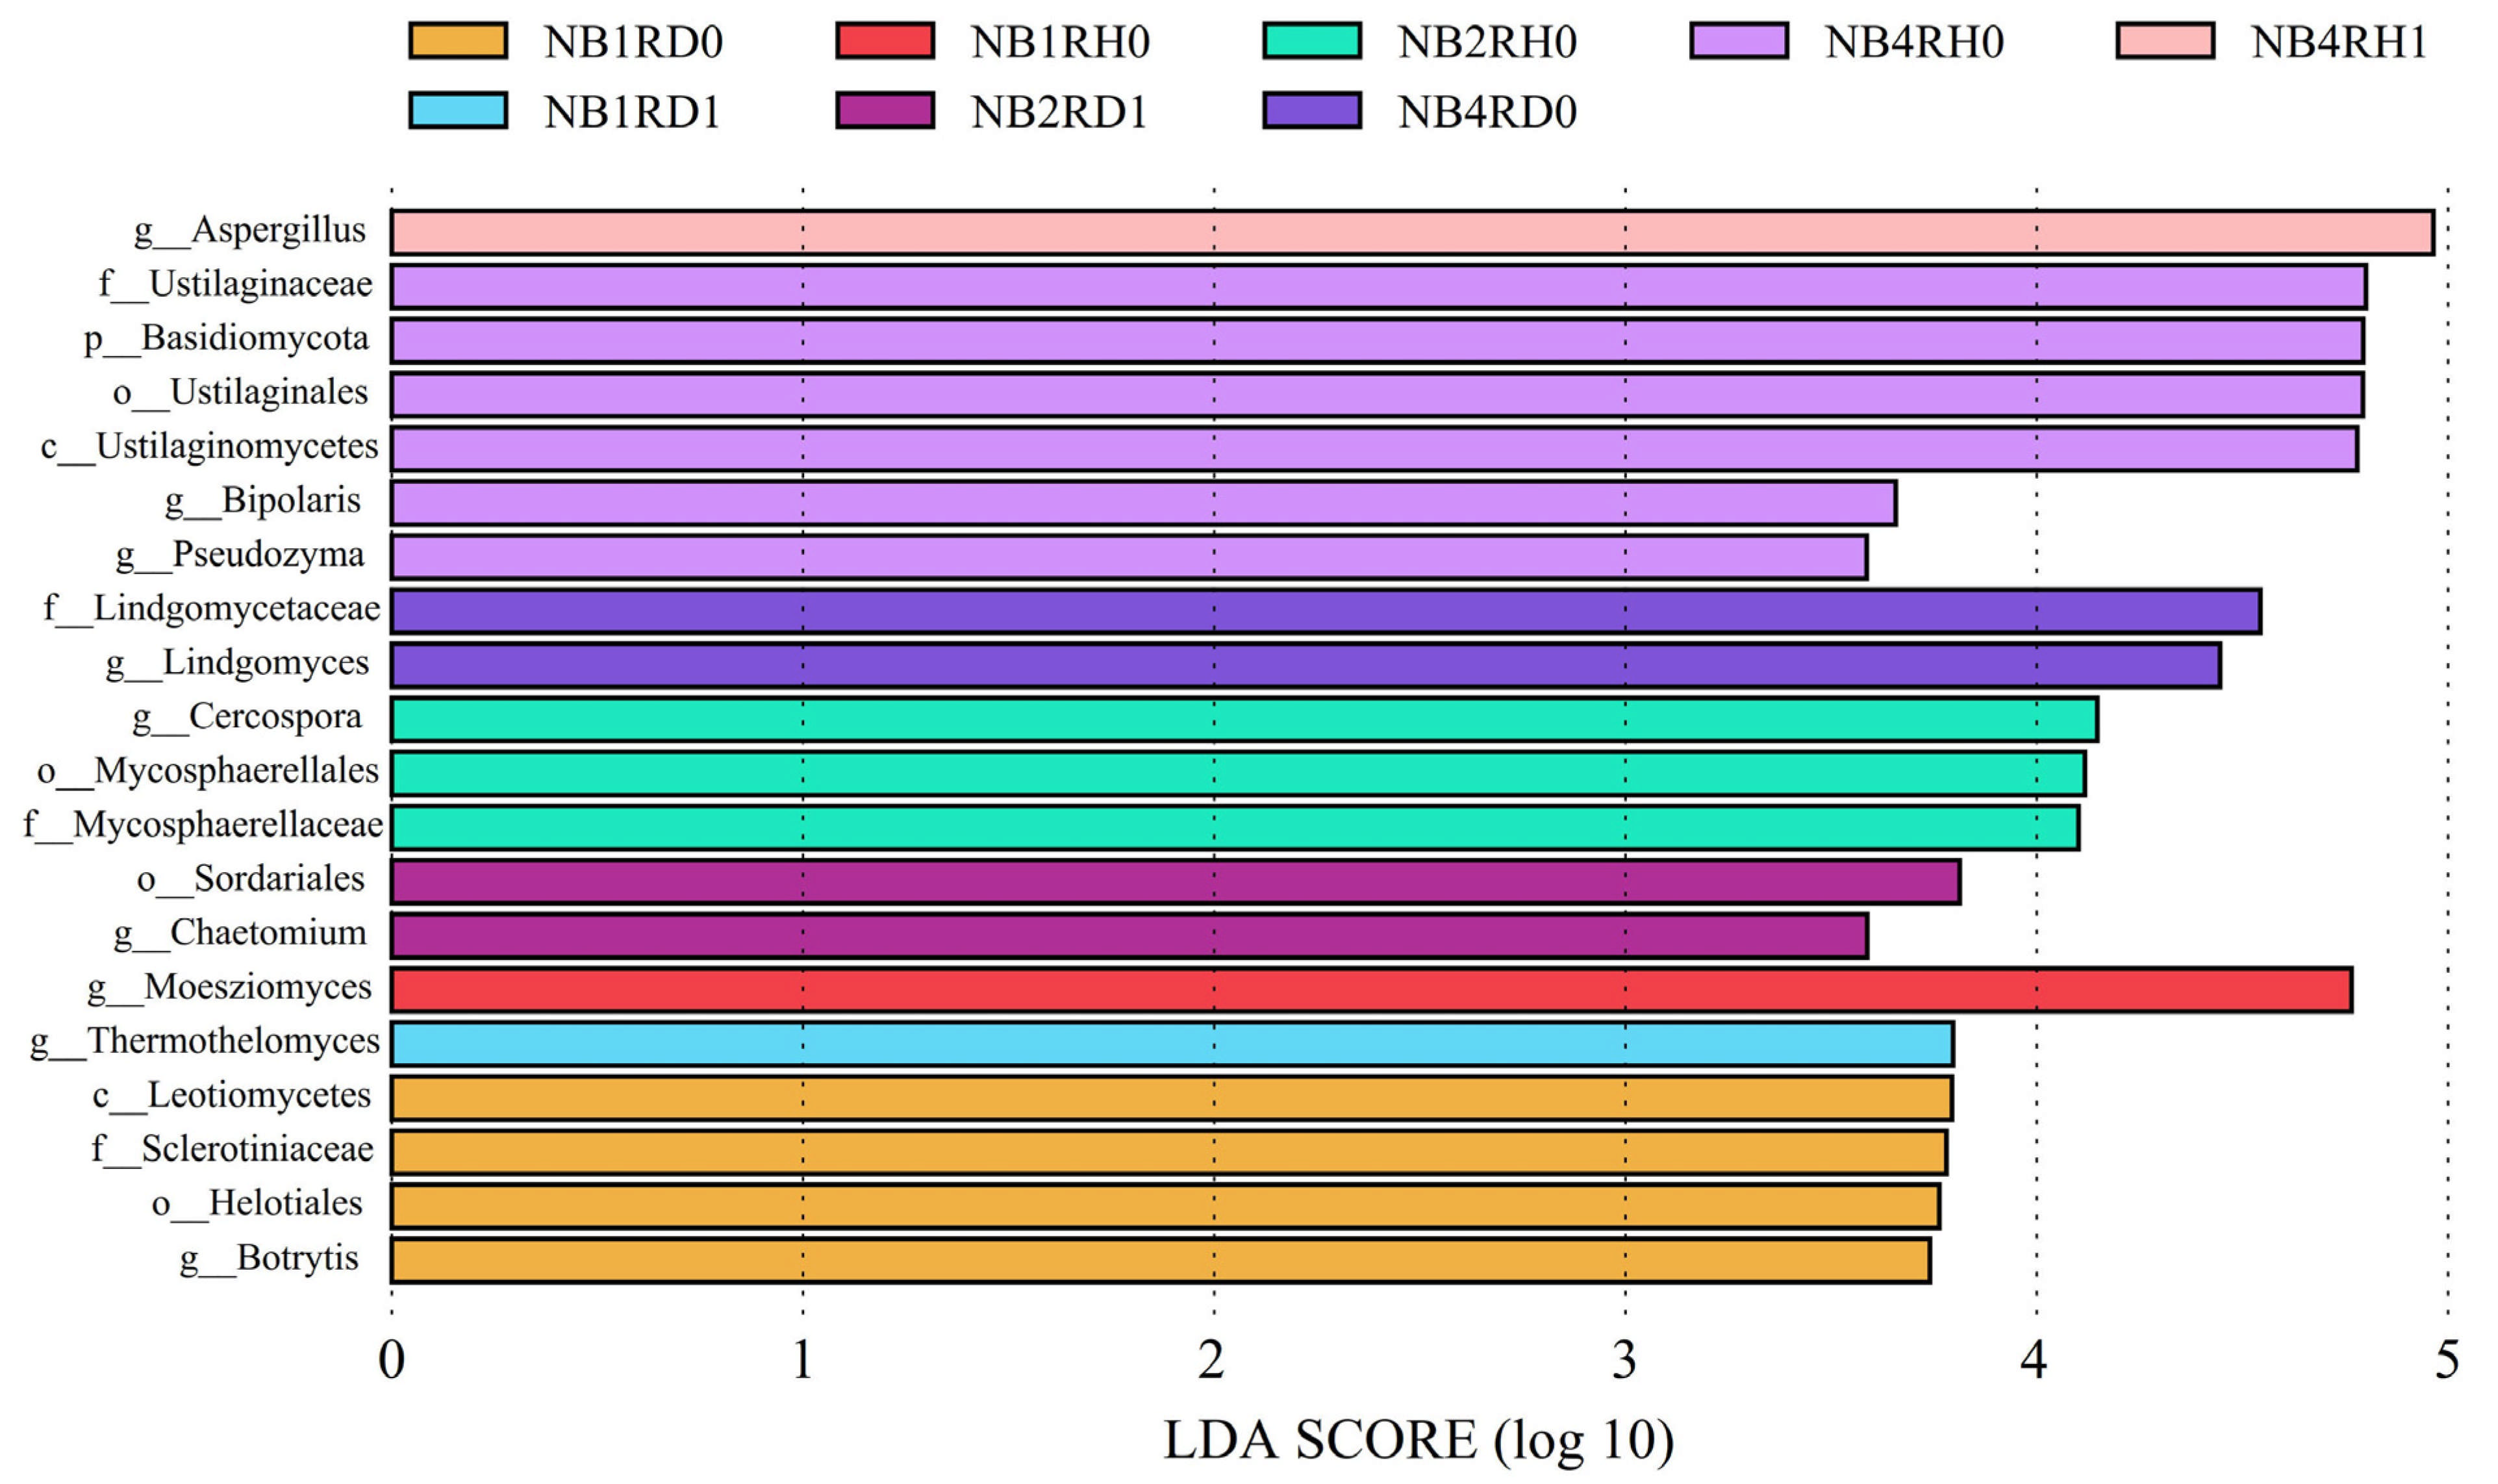
Disclaimer/Publisher’s Note: The statements, opinions and data contained in all publications are solely those of the individual author(s) and contributor(s) and not of MDPI and/or the editor(s). MDPI and/or the editor(s) disclaim responsibility for any injury to people or property resulting from any ideas, methods, instructions or products referred to in the content. |
© 2026 by the authors. Licensee MDPI, Basel, Switzerland. This article is an open access article distributed under the terms and conditions of the Creative Commons Attribution (CC BY) license.