


Abstract
Microbial communities associated with aquatic macrophytes participate in lake biogeochemical cycling, but how macrophyte habitat and nutrient level impact their functional differentiation and metabolic interactions remains unclear. Metagenomics and genome-scale metabolic modeling were used to characterize these communities on submerged (Vallisneria natans and Hydrilla verticillata) and emergent (Phragmites australis and Zizania latifolia) macrophytes across nutrient levels in Xuanwu Lake. Communities associated with macrophytes harbored more abundant carbon (C) and nitrogen (N) metabolic genes than planktonic communities, particularly in the rhizosphere. Metabolic interaction modules (MIMs) centered on hub taxa differed in structure and predicted function between the rhizosphere and phyllosphere of submerged macrophytes. In the rhizosphere, a Halobacteriota hub was predicted to receive carbohydrates and nitrogen compounds mainly from Burkholderiales, and its MIM showed predicted carbon degradation and denitrification potential, which was greater under higher nutrient levels. In the phyllosphere, a Thermoproteota hub was predicted to receive ammonium and urea from, and supply urea to, its partners, and its MIM showed predicted nitrification and nitrogen reduction potential; under higher nutrient levels, a Pseudomonadota hub showed lower predicted nitrogen transfer potential. Overall, macrophyte habitat and nutrient level were both associated with microbial metabolic interactions and predicted C and N cycling potential, providing new insights into biogeochemical cycling in freshwater lakes.
1. Introduction
Aquatic macrophytes are important components of lake ecosystems, maintaining the clear-water state, improving water quality, supporting biodiversity, and providing a range of other ecosystem services [1,2]. Submerged and emergent macrophytes play distinct ecological roles: submerged macrophytes take up water-column nutrients and suppress algae, whereas rooted emergent macrophytes stabilize banks, attenuate waves, and create structurally complex environments, jointly sustaining ecosystem purification and stability [3]. Macrophyte roots and leaves provide surfaces for microbial colonization and release exudates that supply nutrients and organic carbon. These support rhizosphere and phyllosphere microbial communities, which participate in the cycling of carbon (C), nitrogen (N), and other elements in freshwater lakes [4,5,6,7]. Multiple factors can influence the compositional and functional differentiation of microbial communities associated with submerged and emergent macrophytes [8,9]. Understanding how these factors impact this differentiation is important for clarifying the role of these communities in biogeochemical cycling in freshwater lakes and guiding aquatic ecological restoration.
Macrophyte habitat, which encompasses the rhizosphere and phyllosphere, is associated with the structure of microbial communities [5,8,9,10]. For example, the phyllosphere and rhizosphere of submerged macrophytes were initially colonized by microorganisms from the surrounding water column and from the sediment, respectively [4]. Root and leaf traits of macrophytes also influence these communities. More extensive root systems and greater leaf complexity are associated with more diverse microbial communities [8], and chemical traits, such as the leaf phenolic content of submerged macrophytes, are correlated with community composition [10]. Beyond macrophyte habitat, environmental factors, particularly ambient nutrient level, also influence these communities. Nitrogen concentration has been linked to changes in community composition and in the diversity and activity of denitrifiers [11,12,13]. Such changes in community structure across macrophyte habitats and nutrient levels are often accompanied by shifts in microbial function. For example, the relative abundances of taxa and predicted functions involved in C and N metabolism differed among microbial communities on the leaves of different submerged macrophyte species [5,14]. However, how macrophyte habitat and ambient nutrient level jointly impact the functional differentiation of microbial communities associated with submerged and emergent macrophytes remains largely unexplored.
Interactions among microbial taxa also influence the structure and function of microbial communities [8,15]. Co-occurrence network analyses have been used to capture such interactions [7,16,17]. These studies showed that the networks were more complex in macrophyte rhizospheres than in bulk sediments [7], and that nitrogen deposition increased network complexity [17]. However, co-occurrence networks are typically inferred from correlations in 16S rRNA gene amplicon abundance data, and thus capture only statistical associations rather than metabolic dependencies [8,15]. Such dependencies involve the exchange of secreted metabolites, such as vitamins and amino acids, that microorganisms require for growth [18]. Because individual taxa typically encode only a subset of a given metabolic pathway, such exchanges also enable different taxa to cooperatively complete the pathway, thereby contributing to biogeochemical cycling at the community level [19]. Most microorganisms, however, cannot be isolated and tested individually, making it difficult to identify the metabolites they exchange [15]. To address this limitation, genome-scale metabolic models (GSMMs), which reconstruct metabolic networks from genome sequences, can be used to simulate nutrient utilization and growth [20]. Tools such as SMETANA can integrate the GSMMs of multiple taxa to predict interspecies metabolic interactions, including the metabolites exchanged and the direction and strength of the exchange [21,22]. Such modeling has been applied in mangrove sediments [23], hot spring sediments [24], and arid soils [25], suggesting that metabolic interactions among specialized taxa may contribute to biogeochemical cycling. GSMM-based approaches have also been applied in aquatic and plant-associated systems, including epipelagic marine bacterioplankton communities [26], freshwater river sediments [27], and the terrestrial phyllosphere [28], indicating that predicted metabolic complementarity between taxa may help shape microbial community structure and function in these systems. Nevertheless, whether comparable metabolic interactions impact the functional differentiation of microbial communities associated with submerged and emergent macrophytes has not been examined.
In this study, metagenomic sequencing was used to investigate microbial communities in different habitats of submerged and emergent macrophytes under varying ambient nutrient levels in Xuanwu Lake, Nanjing, China. Combining functional gene annotation, analysis of metagenome-assembled genomes (MAGs), and prediction of metabolic interactions, this study aimed to (i) determine how macrophyte habitat impacts the compositional and functional differentiation of these communities, (ii) examine how ambient nutrient level further impacts their composition and function across macrophyte habitats, and (iii) characterize the structure of metabolic interaction networks predicted among MAGs and their potential roles in biogeochemical cycling.
2. Materials and Methods
2.1. Sampling Site Description
Xuanwu Lake (32°04′ N, 118°48′ E) is a shallow urban lake in Nanjing, Jiangsu Province, China [29]. It covers approximately 3.7 km2 with an average water depth of 1.2 m [30]. The lake has historically experienced severe eutrophication and cyanobacterial blooms [29,30]. In 2019, impermeable enclosures were established and planted with submerged macrophytes, primarily Vallisneria natans (Vn) and Hydrilla verticillata (Hv) [30]. Submerged macrophytes, mainly Vn, also grew naturally but sparsely outside the enclosures, where nutrient levels were higher than those inside [31]. Emergent macrophytes, typically Phragmites australis (Pa) and Zizania latifolia (Zl), form stable natural communities in the littoral zone [32]. Based on the distribution of submerged and emergent macrophytes in Xuanwu Lake, four sampling zones were established to investigate how macrophyte habitat and nutrient level impact the functional differentiation and metabolic interactions of microbial communities. The zones were the emergent macrophyte zone (E), the submerged macrophyte zone (S), including areas inside (SI) and outside (SO) the enclosures, and an unvegetated control zone (N).
2.2. Sample Collection and Processing
In September 2024, samples were collected from zones E, SI, SO, and N, which were 500 to 1000 m apart. In each vegetated zone (E, SI, SO), three replicate sites were established for each macrophyte species: Pa and Zl in zone E, Vn and Hv in zone SI, and Vn in zone SO. Three replicate sites were also established in the unvegetated control zone (N). Environmental and macrophyte samples were collected simultaneously. At each site, 1.5 L of water was collected at 0.5 m depth using a water sampler, and 200 g of surface sediment was collected using a grab sampler. Emergent macrophytes were collected using a sterile stainless-steel spade, and submerged macrophytes were retrieved using retractable plant tongs. All samples were kept on ice and transported to the laboratory within 2 to 4 h.
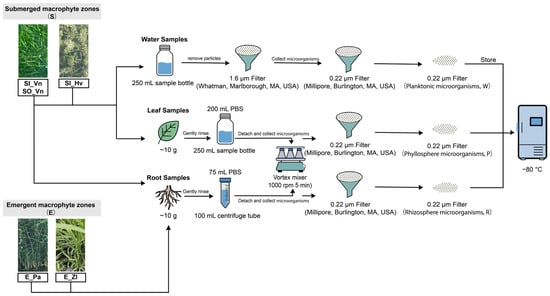
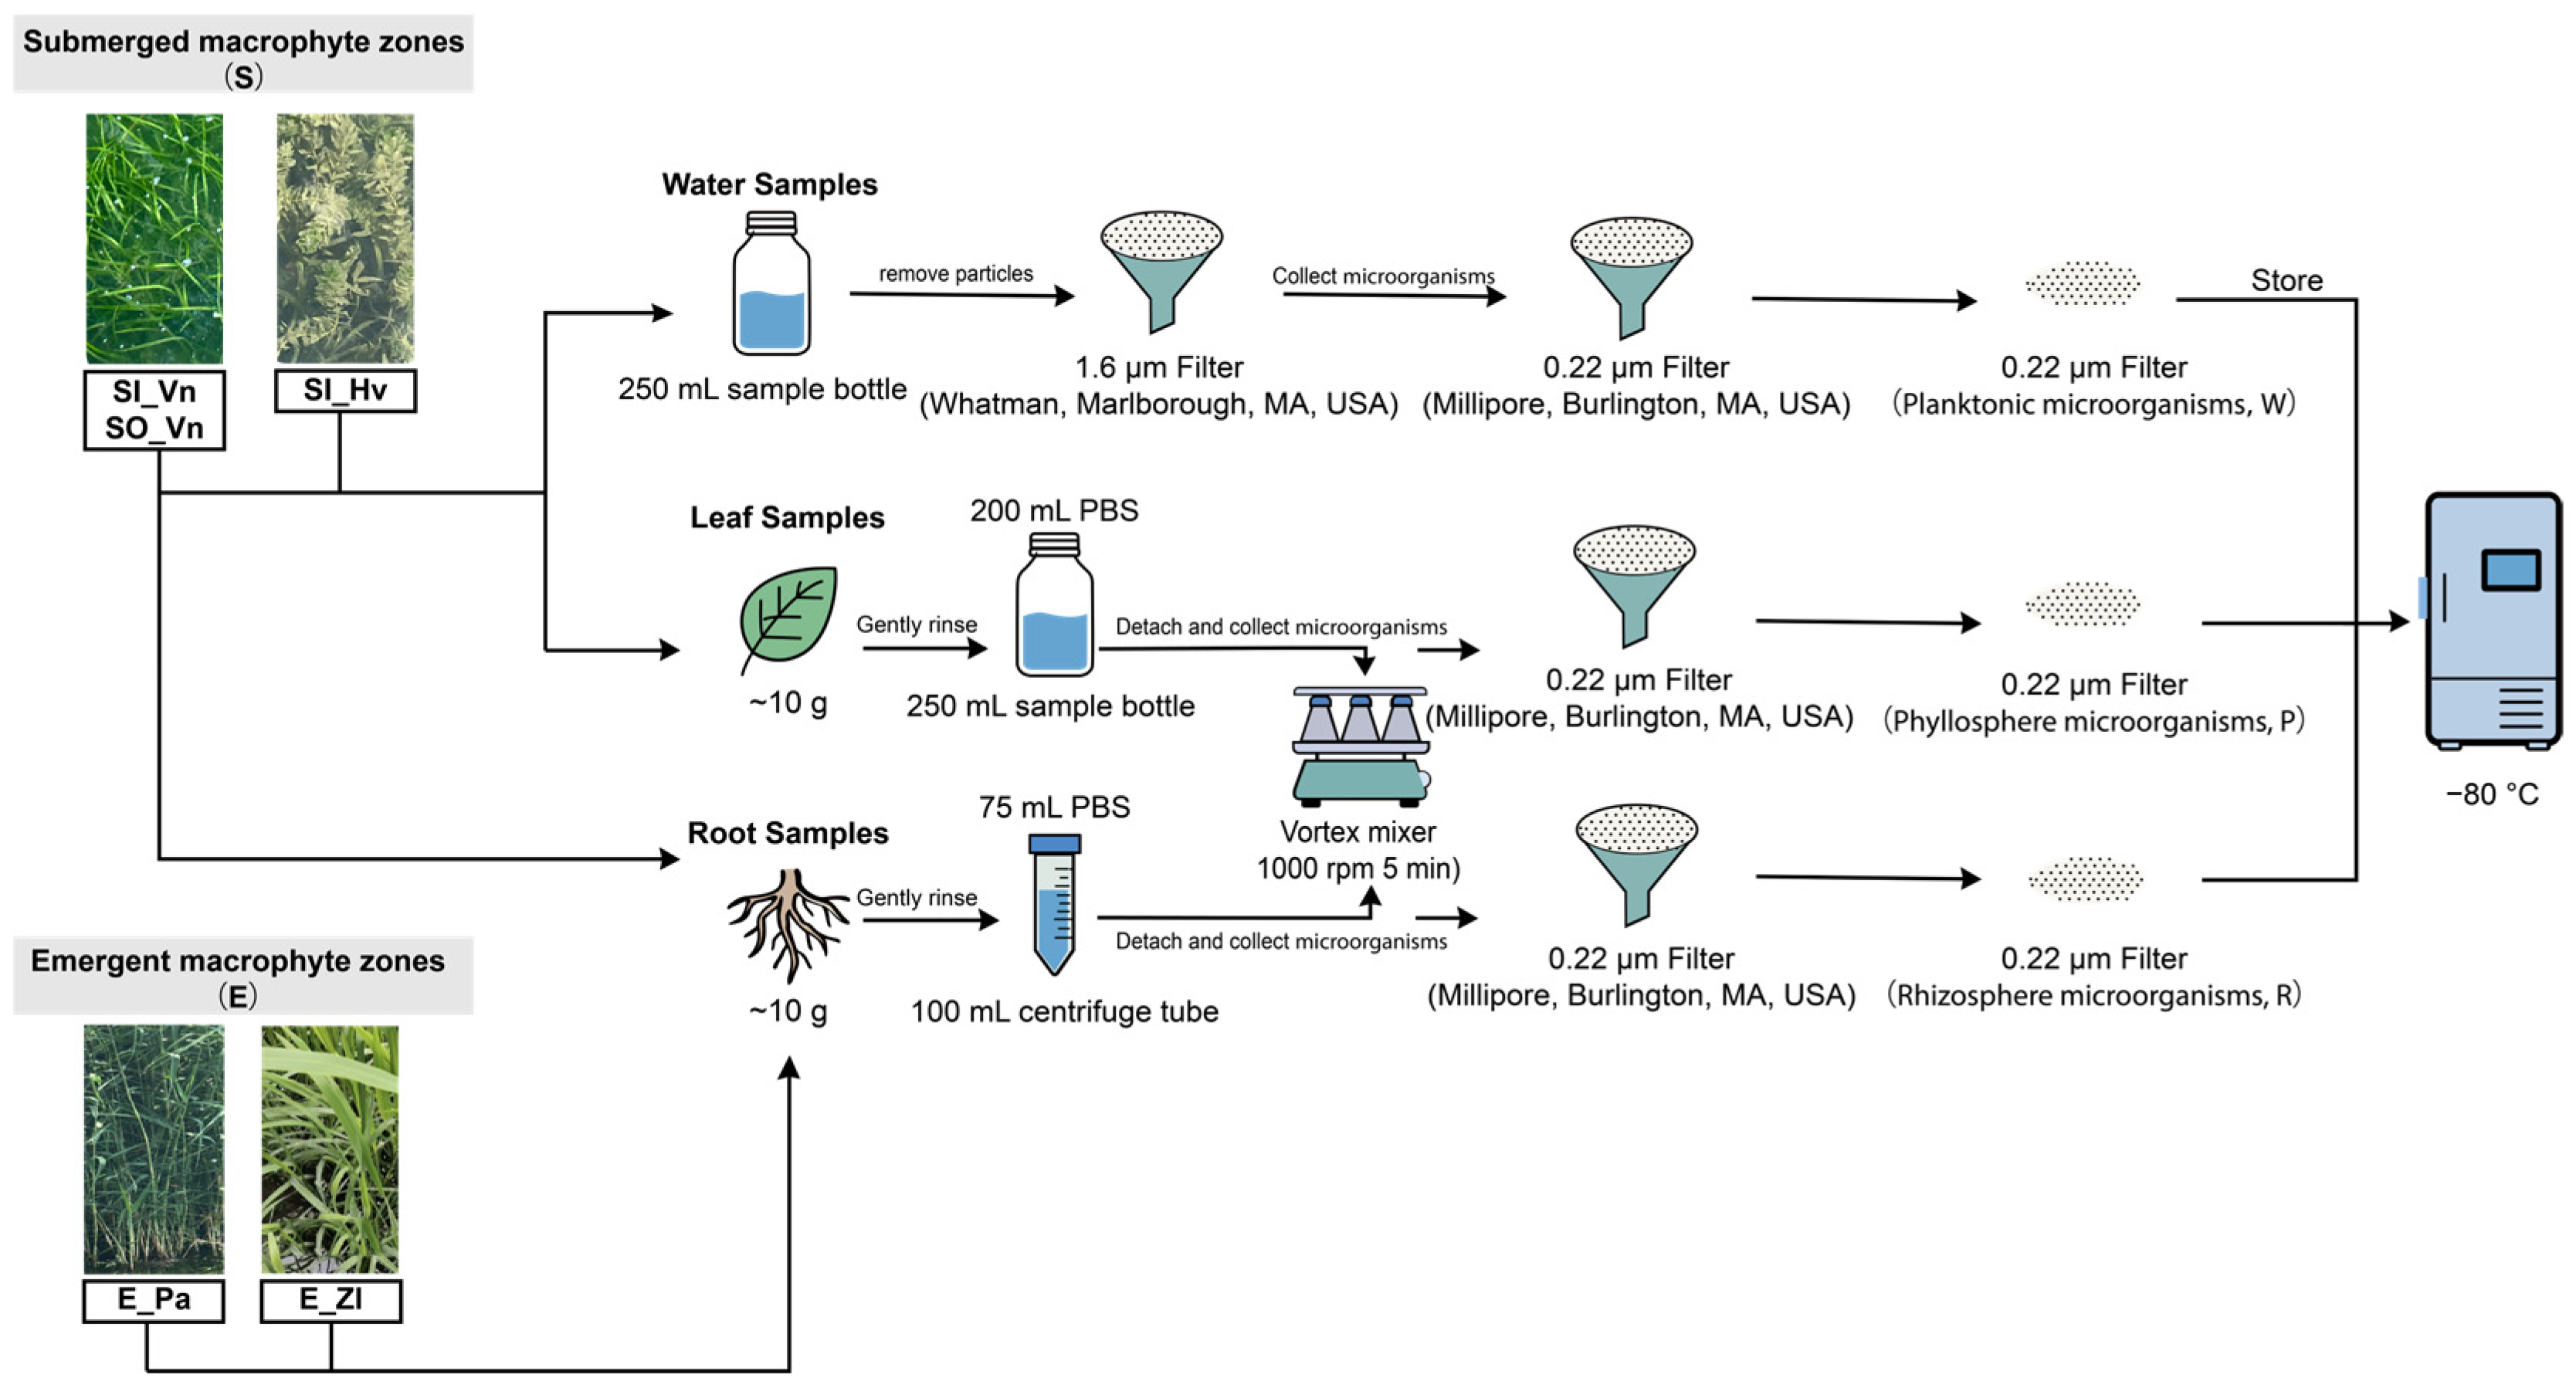
Water and macrophyte samples were then processed to collect microorganisms from three habitat types (Figure 1): the rhizosphere (R), phyllosphere (P), and surrounding water column (W). Four sample types were defined: R_E, the rhizosphere of emergent macrophytes; and R_S, P_S, and W_S, the rhizosphere, phyllosphere, and surrounding water column of submerged macrophytes, respectively. R_S, P_S, and W_S samples were further divided into those from inside (R_SI, P_SI, and W_SI) and outside (R_SO, P_SO, and W_SO) the enclosures. Submerged macrophytes were divided into root and leaf tissues, from which rhizosphere and phyllosphere microorganisms were collected by elution, respectively. Root tissue was collected from Vn only, because Hv has a much less developed root system. Roots were rinsed with distilled water, and approximately 10 g of roots was vortexed in 75 mL phosphate-buffered saline (PBS, 50 mM, pH 7.4) at 1000 rpm for 5 min. Leaves of Vn and Hv were gently rinsed with distilled water and processed in the same way, except that approximately 10 g of leaves was vortexed in 200 mL PBS. The suspensions were then filtered through 0.22 μm polycarbonate membranes to collect the microorganisms. For emergent macrophytes, only rhizosphere microorganisms were collected using the same procedure [4,13]. To collect planktonic microorganisms, approximately 250 mL of water was prefiltered through GF/C filters (1.6 μm, Whatman, Marlborough, MA, USA) to remove large particles, and the filtrate was then collected on 0.22 μm polycarbonate membranes (Millipore, Burlington, MA, USA). In addition, bulk sediment from zone N was also included for DNA extraction and metagenomic sequencing. All membranes retaining microorganisms, together with the sediment samples, were stored at −80 °C until DNA extraction.
Figure 1.
Sampling design and workflow for the collection of rhizosphere, phyllosphere, and planktonic microorganisms in Xuanwu Lake. Representative photographs show the four macrophyte species (Phragmites australis, Pa; Zizania latifolia, Zl; Vallisneria natans, Vn; Hydrilla verticillata, Hv) and their corresponding sampling zones (E, emergent macrophyte zone; S, submerged macrophyte zone, comprising SI inside and SO outside the enclosures). Labels indicate zone_species, for example SI_Vn. Root, leaf, and water samples were processed as illustrated to obtain rhizosphere microorganisms (R), phyllosphere microorganisms (P), and planktonic microorganisms in the surrounding water column (W), respectively, which were subsequently used for DNA extraction and metagenomic sequencing.
2.3. Measurement of Environmental Parameters
Temperature, pH, dissolved oxygen (DO), and turbidity of the water were measured in situ at each site (0.5 m depth) using a multiparameter water quality probe (YSI 6600, Yellow Springs, OH, USA). In the laboratory, water samples were analyzed for total nitrogen (TN) and total phosphorus (TP) according to the standard methods of the State Environmental Protection Administration of China [33], and for ammonium (NH4+) and nitrate (NO3−) using a flow analyzer (SAN++, SKALAR, Breda, Netherlands). Sediment samples were first freeze-dried, ground, and passed through a 100-mesh sieve. TN and TP were then determined as described above, and sediment pH, NH4+, and NO3− were measured in 2 mol/L KCl extracts [11,32].
2.4. DNA Extraction and Sequencing
Total DNA was extracted from the microbial biomass retained on the membranes using the E.Z.N.A.® Water DNA Isolation Kit (Omega Biotek, Doraville, GA, USA) and from the bulk sediment samples using the DNeasy PowerSoil Kit (Qiagen, Hilden, Germany), following the manufacturers’ instructions. DNA concentration and purity (260/280 nm and 260/230 nm absorbance ratios) were assessed with a NanoDrop 2000 spectrophotometer (Thermo Fisher Scientific, Waltham, MA, USA). A blank membrane processed in parallel as a negative control yielded no detectable DNA. The extracted DNA was stored at −80 °C until metagenomic sequencing [4,13].
Metagenomic sequencing was conducted by Shanghai Lingen Biotechnology Co., Ltd. (Shanghai, China). Shotgun libraries were constructed with the Nextera XT kit (Illumina, San Diego, CA, USA) and quantified using a Qubit 3.0 fluorometer (Invitrogen, Carlsbad, CA, USA). Libraries were pooled, diluted, denatured, and spiked with PhiX control before sequencing on the Illumina NovaSeq 6000 platform (paired-end 2 × 150 bp), generating at least 10 Gb of raw data per sample.
2.5. Metagenomic Data Processing, Functional Annotation, and Metabolic Network Analysis
Raw Illumina metagenomic reads were quality trimmed using Trimmomatic (v0.39) [34]. The clean reads from the three replicates of each sample group (the same species, zone, and habitat) were pooled and co-assembled using MEGAHIT (v1.2.9) [35] to improve assembly and recover more genomes, including those from low-abundance taxa. The assembled contigs were binned and refined into draft MAGs using MetaWRAP (v1.3.2) [36]. These MAGs were then dereplicated using dRep (v2.6.2) [37] and assessed with CheckM (v1.0.2) [38], yielding a final non-redundant set of 400 MAGs, including 84 high-quality (completeness ≥ 90% and contamination < 5%) and 316 medium-quality (completeness ≥ 50% and contamination < 10%) MAGs (Table S1). MAG relative abundance was estimated by mapping the clean reads of each replicate to the dereplicated MAG catalog using CoverM (v0.7.0) [39]. For taxonomic analysis, contigs were classified using Kraken2 (v2.1.3) [40] with the NCBI database, and MAGs were classified using GTDB-Tk (v2.4.0) [41] with the GTDB R220 database. The correspondence between NCBI and GTDB taxonomic names is provided in Table S2. For functional analysis, genes were predicted from contigs and MAGs using Prodigal (v2.6.3) [42]. The genes from contigs were clustered into a non-redundant gene set using CD-HIT (v4.8.1) [43] and annotated using eggNOG-mapper (v2.1.6) [44]. The abundance of these genes in each sample was then estimated using Salmon (v1.4.0) [45] and normalized to transcripts per million (TPM). Key functional genes involved in C and N metabolism were identified from the Kyoto Encyclopedia of Genes and Genomes (KEGG) Orthology (KO) annotations (Table S3). The biogeochemical functions of MAGs were also assessed using METABOLIC (v4.0) [46] (Table S4).
GSMMs were constructed for each MAG using CarveMe (v1.5.1) [20], with separate templates applied for bacteria and archaea. Pairwise metabolic interaction potential (MIP), which estimates the number of essential nutritional components that can be exchanged between a pair of organisms, was assessed using SMETANA (v1.2.1) [21] in global mode. For each sample group (R_E, R_SI, R_SO, P_SI, and P_SO), a network was built in which nodes represented MAGs and edges represented MAG pairs meeting an MIP threshold, which was applied to focus on pairs with greater potential for metabolite exchange. To select the threshold, the number of edges, the number of connected MAGs, and the clustering coefficient were evaluated at MIP values of 0 to 6 (Figure S1). MIP ≥ 3 was therefore used as an empirical criterion, being the highest threshold that kept most MAGs connected, while the number of edges and the clustering coefficient had already declined to near their minimum. Module detection was performed on these networks using the Louvain algorithm implemented in the igraph R package. Node roles were classified as network hubs (Zi > 2.5, Pi > 0.62), module hubs (Zi > 2.5, Pi ≤ 0.62), connectors (Zi ≤ 2.5, Pi > 0.62), or peripheral nodes (Zi ≤ 2.5, Pi ≤ 0.62) based on within-module connectivity (Zi) and participation coefficient (Pi) [25]. Within each sample group, the network hub with the highest Zi, together with its directly connected neighbors with a mean relative abundance above 0.01% across the replicates, was defined as one metabolic interaction module (MIM) to extract key metabolic interactions and characterize the biogeochemical functions they support [23]. The detailed mode of SMETANA was then run on the MAG pairs retained in the networks to identify the metabolites exchanged and the direction of exchange, with metabolites annotated using the MetaNetX [47] and MetaCyc [48] databases.
2.6. Statistical Analysis
Environmental parameters were compared among zones by Welch’s one-way analysis of variance (ANOVA) with the Games–Howell post hoc test, which does not assume equal variances. Taxonomic and functional beta diversity were assessed by non-metric multidimensional scaling (NMDS) based on Bray–Curtis dissimilarity of Hellinger-transformed abundances of prokaryotic species and of TPM-normalized KOs in the KEGG category Metabolism. Differences among sample types were tested by permutational multivariate analysis of variance (PERMANOVA; 999 permutations). To separate species effects from zone and habitat effects, pairwise Bray–Curtis dissimilarities were grouped as comparisons between replicates, zones, species, and habitats, and compared by sample-label permutation tests with Holm correction (Figure S2). Because differences between species were smaller than those between habitats, values for Pa and Zl were averaged to represent sample type R_E. To compare the rhizosphere and phyllosphere within the same species, and to examine the effect of nutrient level (zones SI versus SO) without interference from species, only Vn samples were used for sample types R_S and P_S in subsequent analyses. Mantel tests (Pearson correlation; 9999 permutations) were used to examine correlations between taxonomic and functional dissimilarity matrices and between species-level and MAG-level dissimilarity matrices. Environmental factors associated with community structure were examined by distance-based redundancy analysis (db-RDA) on Bray–Curtis dissimilarities of taxonomic and functional profiles. All variables were z-score standardized and had variance inflation factors (VIF) below 5 (maximum 4.36; Table S5). The overall model and each variable were tested using sequential (Type I) and marginal (Type III) permutation tests (999 unrestricted permutations; marginal tests, which do not depend on the order of entry, were used to evaluate individual variables), and unique contributions were quantified by variance partitioning based on adjusted R2. Functional differentiation was assessed by silhouette analysis on Bray–Curtis dissimilarities of KO profiles within each KEGG Level 3 pathway of carbohydrate, amino acid, and energy metabolism, with habitat as the grouping variable. All statistical analyses were conducted in R v4.5.2, using the vegan package for NMDS, PERMANOVA, Mantel tests, and db-RDA, the car package for VIF, and the cluster package for silhouette analysis [4,13].
3. Results
3.1. Physicochemical Conditions Across Sampling Zones
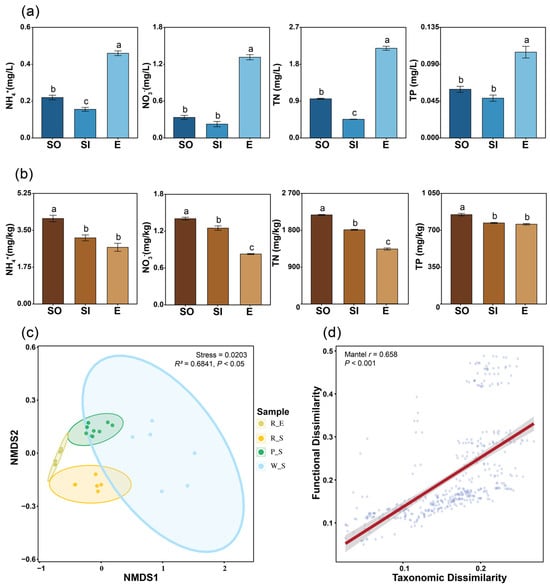
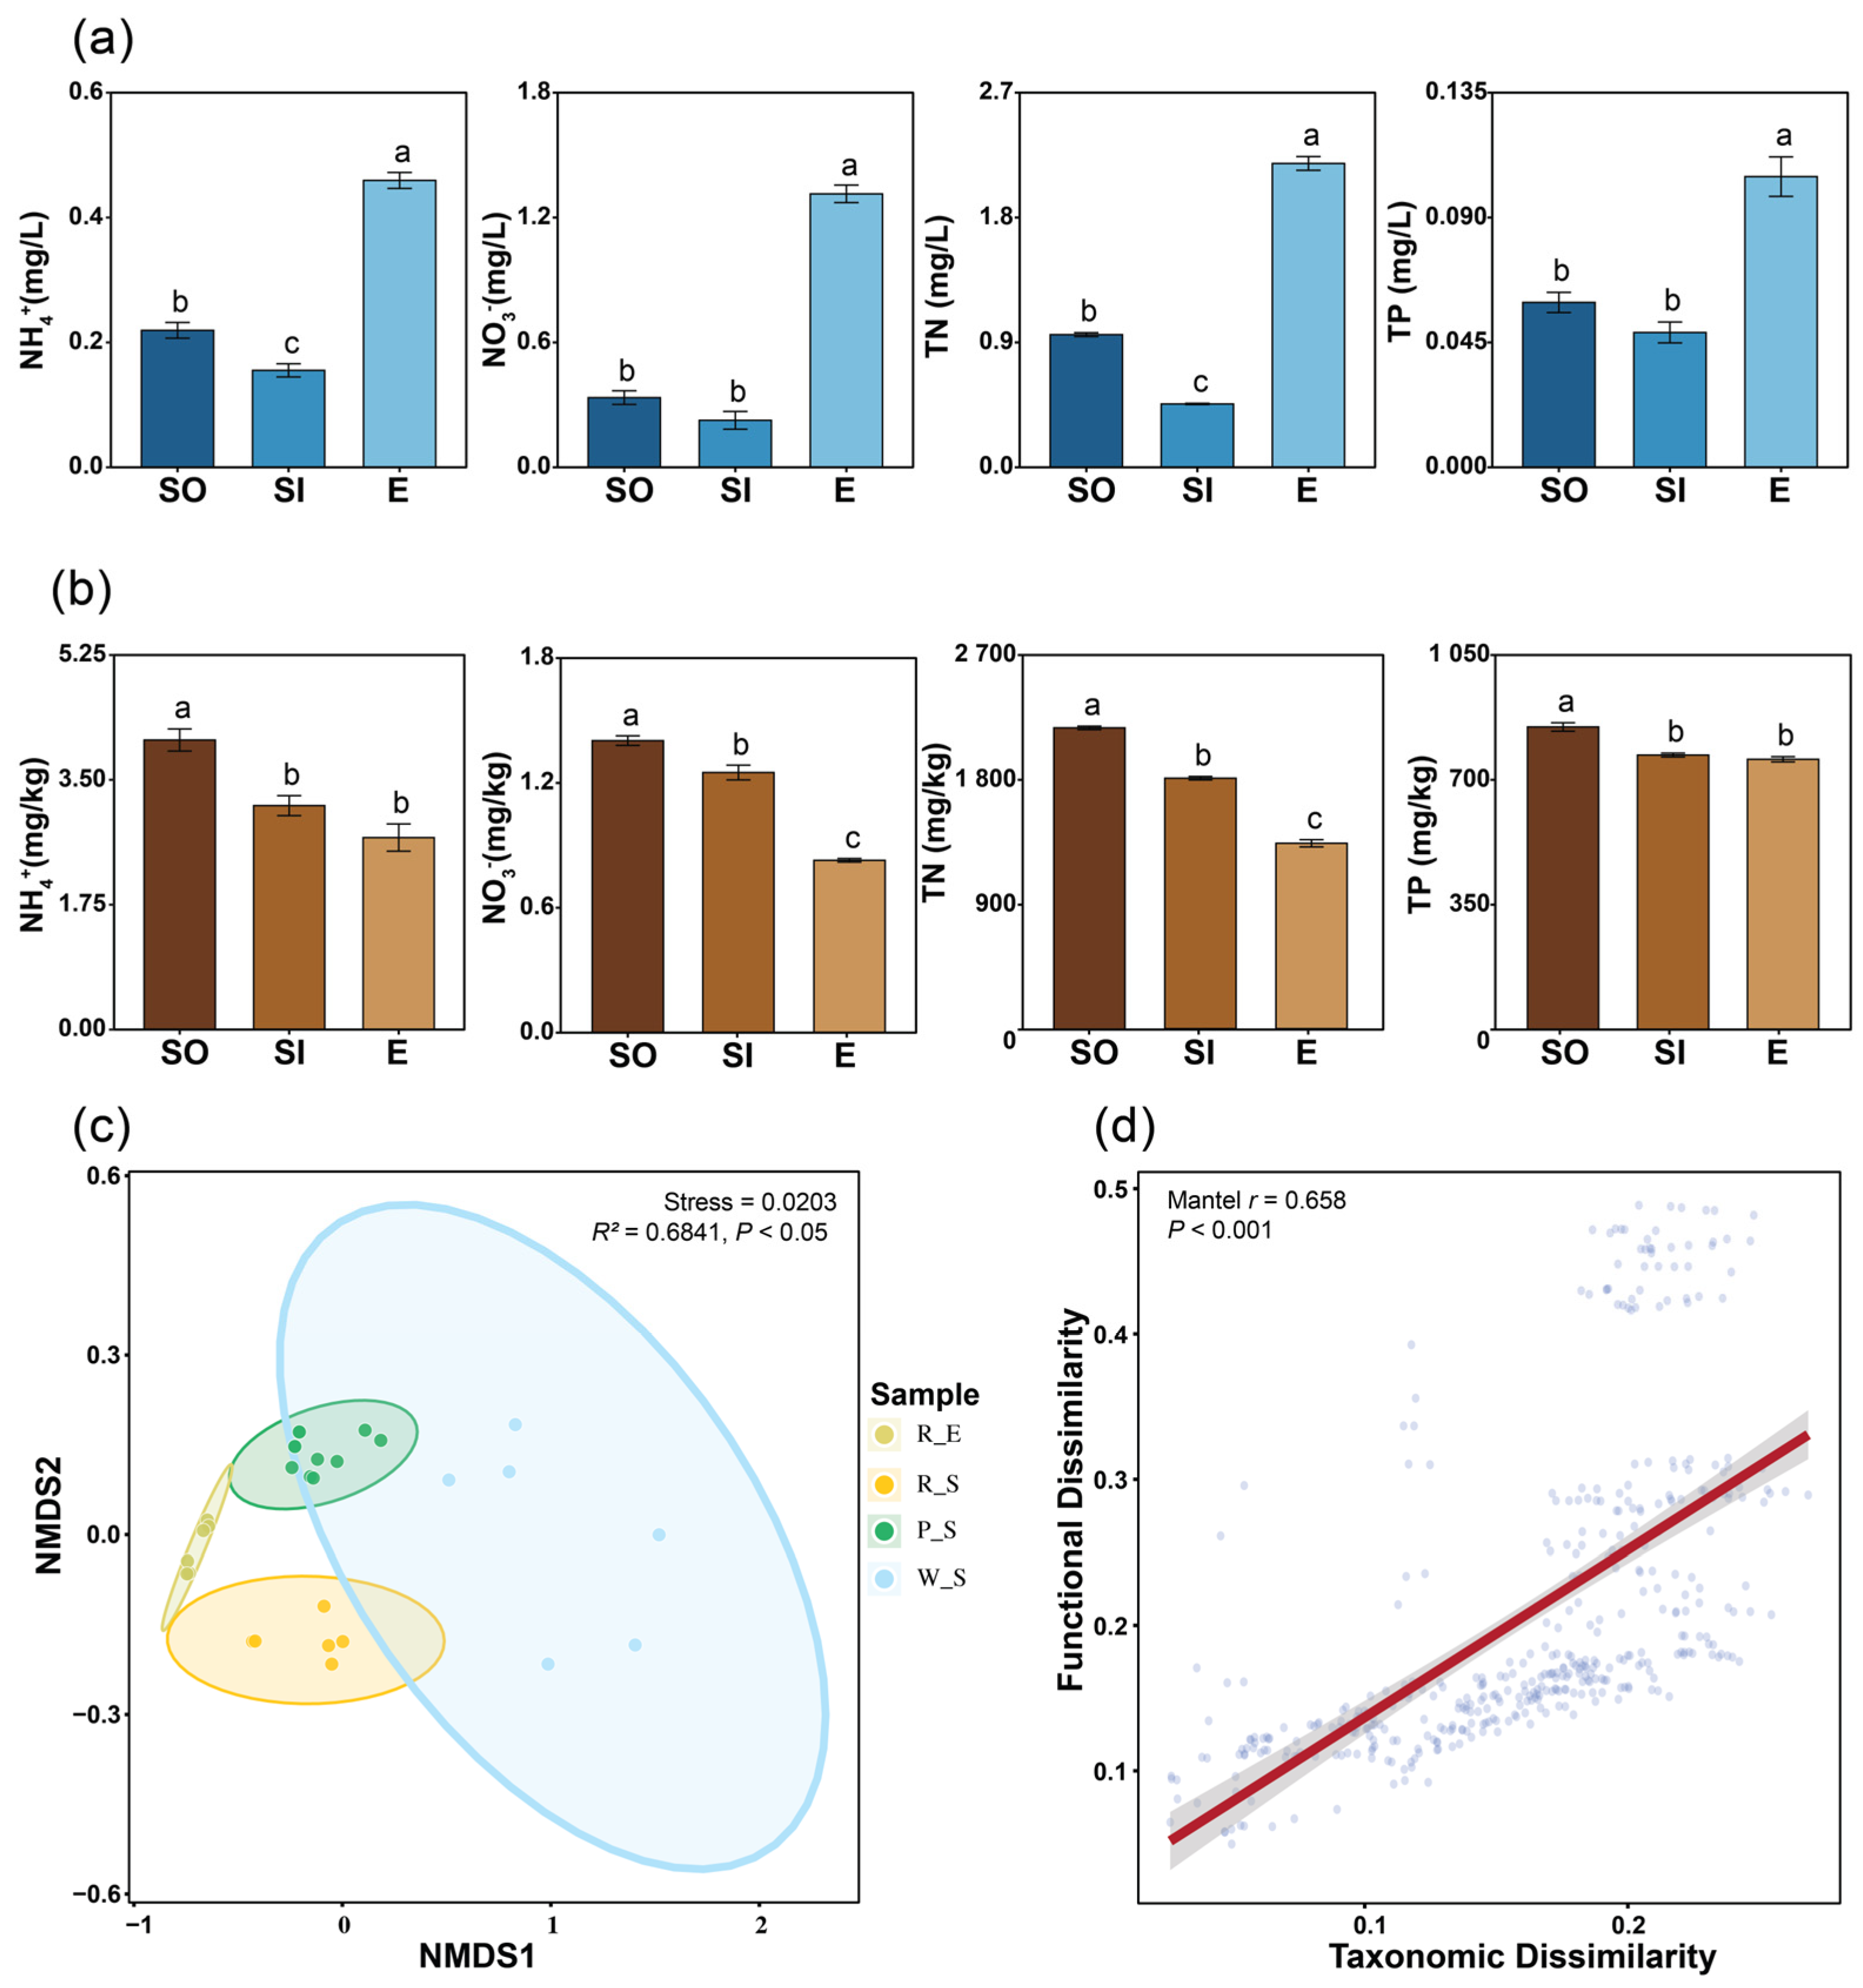
Temperature and pH were relatively stable across the sampling zones (E, SI, SO, and N), at approximately 30.6 ± 1.7 °C and 7.4 ± 0.2, respectively. In contrast, the other water physicochemical parameters differed among the sampling zones (Figure S3). DO was highest in zone SI and lowest in zone N, with intermediate levels in zones SO and E (Figure S3a; p < 0.05). Turbidity was lower in zone S than in zones E and N, with the lowest values observed in zone SI (Figure S3b; p < 0.05), suggesting clearer water in zones with submerged macrophytes. Within vegetated zones, water nutrient levels were higher in zone E than in zone S (comprising SI and SO), with zone SO higher than zone SI for NH4+ and TN (Figure 2a; p < 0.05). In sediment, nutrient concentrations were highest in zone SO and lowest in zone E for NO3− and TN (Figure 2b; p < 0.05), whereas zone SI did not differ from zone E for NH4+ and TP. Within each zone, environmental parameters were generally comparable among different macrophyte species (Figures S3 and S4).
Figure 2.
Nutrient levels and microbial community functional structure in Xuanwu Lake. Water (a) and sediment (b) nutrient concentrations of ammonium (NH4+), nitrate (NO3−), total nitrogen (TN), and total phosphorus (TP) across vegetated zones: the emergent macrophyte zone (E) and the submerged macrophyte zone inside (SI) and outside (SO) the enclosures. Different lowercase letters indicate significant differences among zones (Welch’s ANOVA with Games–Howell test, p < 0.05). (c) Non-metric multidimensional scaling (NMDS) ordination of metabolism-related KEGG Orthology (KO) profiles, with samples grouped into four sample types (SI and SO zones combined for submerged macrophytes): rhizosphere of emergent macrophytes (R_E), rhizosphere of submerged macrophytes (R_S), phyllosphere of submerged macrophytes (P_S), and surrounding water column (W_S) (Stress = 0.0203; PERMANOVA: R2 = 0.6841, p < 0.05). (d) Correlation between taxonomic and metabolic functional Bray–Curtis dissimilarity matrices across all sample pairs (Mantel test, Pearson r = 0.658, p < 0.001).
3.2. Taxonomic and Functional Structure of the Microbial Communities
After quality control, 2.09 billion high-quality reads were co-assembled into 13.60 Gb of contigs (mean N50 = 2224 bp), from which 21.23 million non-redundant genes were obtained after gene prediction and clustering. The rarefaction curves of observed species richness approached a plateau, suggesting that the sequencing depth may have captured most of the species detected in the samples (Figure S5). NMDS ordination showed that the microbial communities clustered by sample type (R_E, R_S, P_S, and W_S) based on functional profiles (Figure 2c), and taxonomic dissimilarity was significantly correlated with functional dissimilarity (Mantel r = 0.658, p < 0.001; Figure 2d). Compared with the widely dispersed communities in the surrounding water column (W_S), those in the rhizosphere and phyllosphere (R_E, R_S, and P_S) were more tightly clustered. Furthermore, dissimilarities between species within the same zone were significantly lower than those between habitats (p < 0.05; Figure S2). db-RDA identified the sediment NO3− and water TN as the environmental factors most strongly associated with taxonomic and functional differentiation of the rhizosphere and phyllosphere communities, respectively (adjusted R2 = 0.43 to 0.57; Figure S6; Table S5). In the rhizosphere, NO3− accounted for 87.9% and 51.1% of the partitioned functional and taxonomic variance, respectively (Figure S6a,c), and remained significant in marginal tests (p = 0.001 and 0.015, respectively). In the phyllosphere, TN accounted for 22.4% and 49.4% of the partitioned functional and taxonomic variance, respectively (Figure S6b,d). Its marginal effect was significant for the taxonomic profile (p = 0.023) but not for the functional profile (p = 0.086; Table S5).
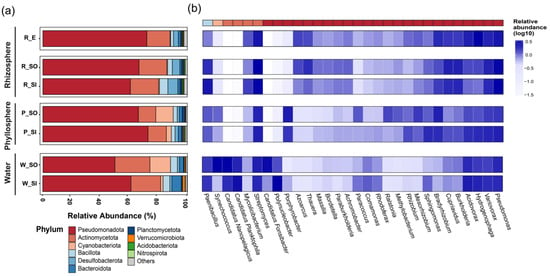
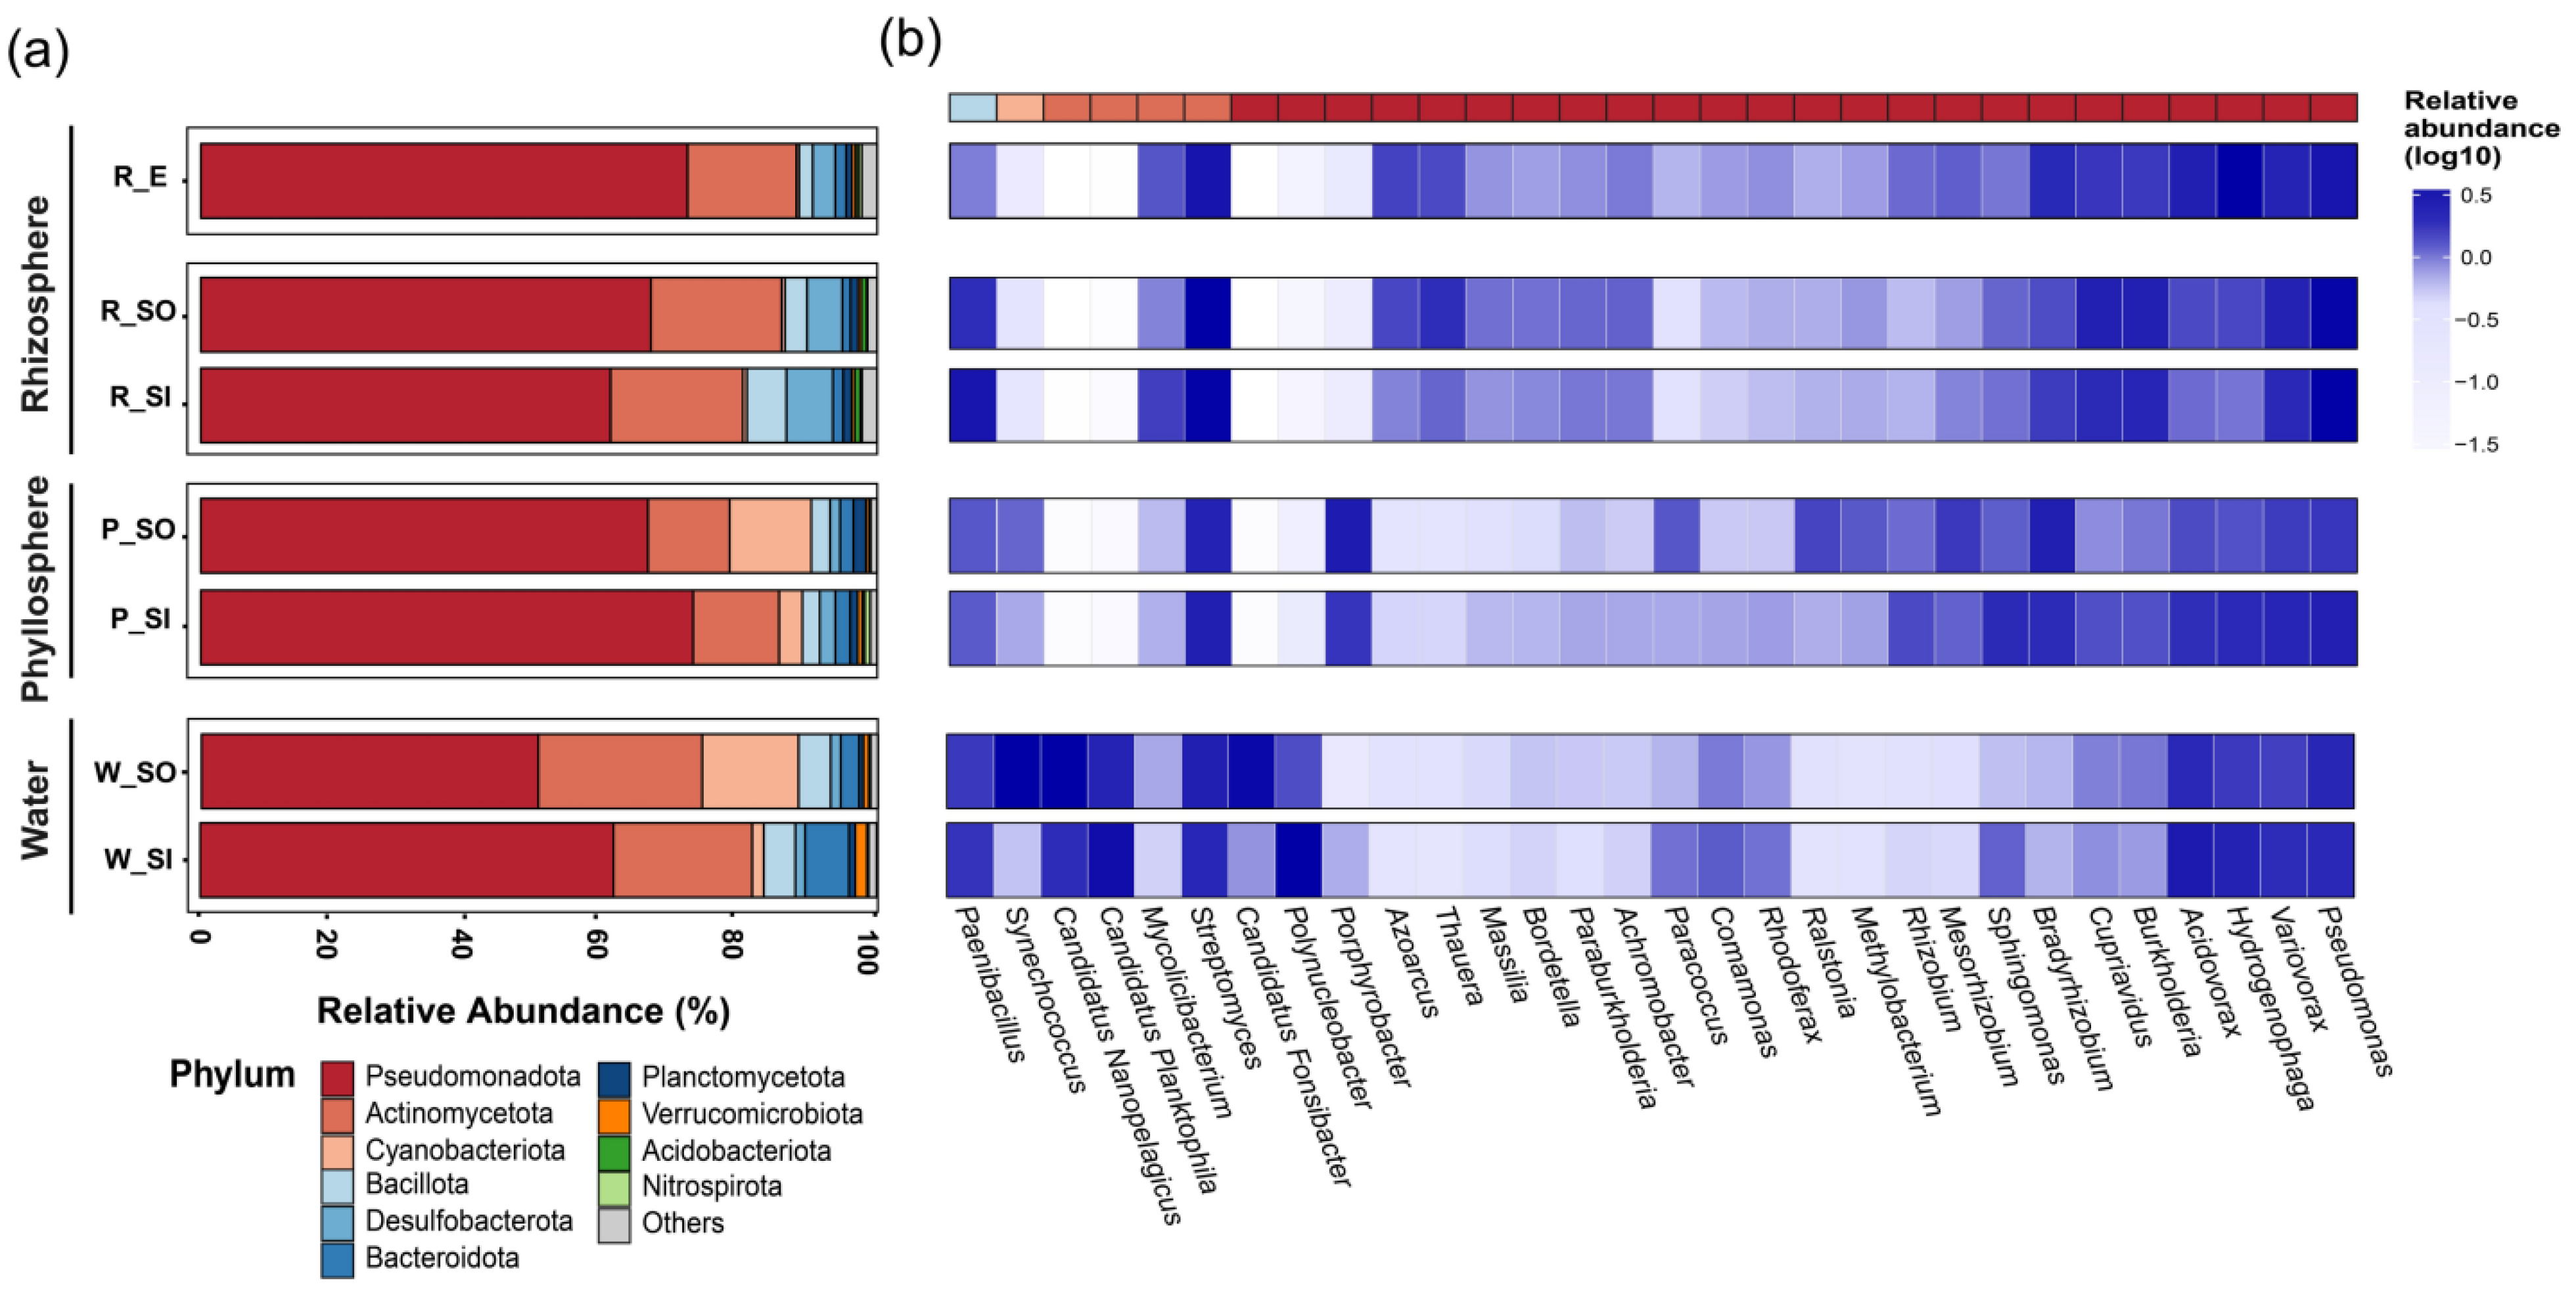
Carbohydrate metabolism was the most abundant functional category in the microbial communities of all samples, followed by amino acid and energy metabolism (Figure S7). Functional profiles within these categories differed among the communities, for example in amino acid degradation, nitrogen metabolism, methane metabolism, and carbon fixation pathways (Figure S8). Taxonomic composition also differed among samples. At the phylum level, Pseudomonadota and Actinomycetota dominated all samples, whereas Cyanobacteriota was more abundant in the phyllosphere and surrounding water column (P_S and W_S), especially in zones outside the enclosures (P_SO and W_SO) (Figure 3a). At the genus level, Burkholderia, Cupriavidus, and Bradyrhizobium were more abundant in the rhizosphere and phyllosphere, whereas Candidatus Planktophila and Candidatus Nanopelagicus were more abundant in the surrounding water column (Figure 3b). Thauera and Azoarcus were abundant in the rhizosphere (R_E and R_S), particularly in R_SO samples. In the phyllosphere (P_S), Porphyrobacter was relatively abundant, whereas Synechococcus was relatively abundant in both P_S and W_S samples, particularly in P_SO and W_SO samples (Figure 3b).
Figure 3.
Taxonomic composition of microbial communities across samples in Xuanwu Lake. (a) Relative abundance of major phyla in the rhizosphere of emergent macrophytes (R_E), the rhizosphere of submerged macrophytes outside (R_SO) and inside (R_SI) enclosures, the phyllosphere of submerged macrophytes outside (P_SO) and inside (P_SI) enclosures, and the surrounding water column of submerged macrophyte zones outside (W_SO) and inside (W_SI) enclosures; phylum-level classification follows the Genome Taxonomy Database (GTDB) taxonomy. (b) Log10-transformed relative abundance of dominant prokaryotic genera across the same samples, with color intensity representing relative abundance and the color bar above the heatmap indicating the phylum of each genus (colors as in panel (a)).
3.3. C and N Metabolic Genes of the Microbial Communities
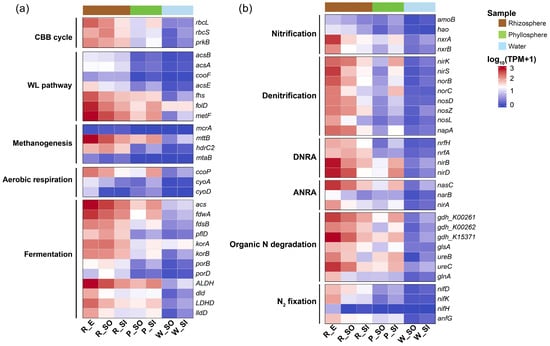
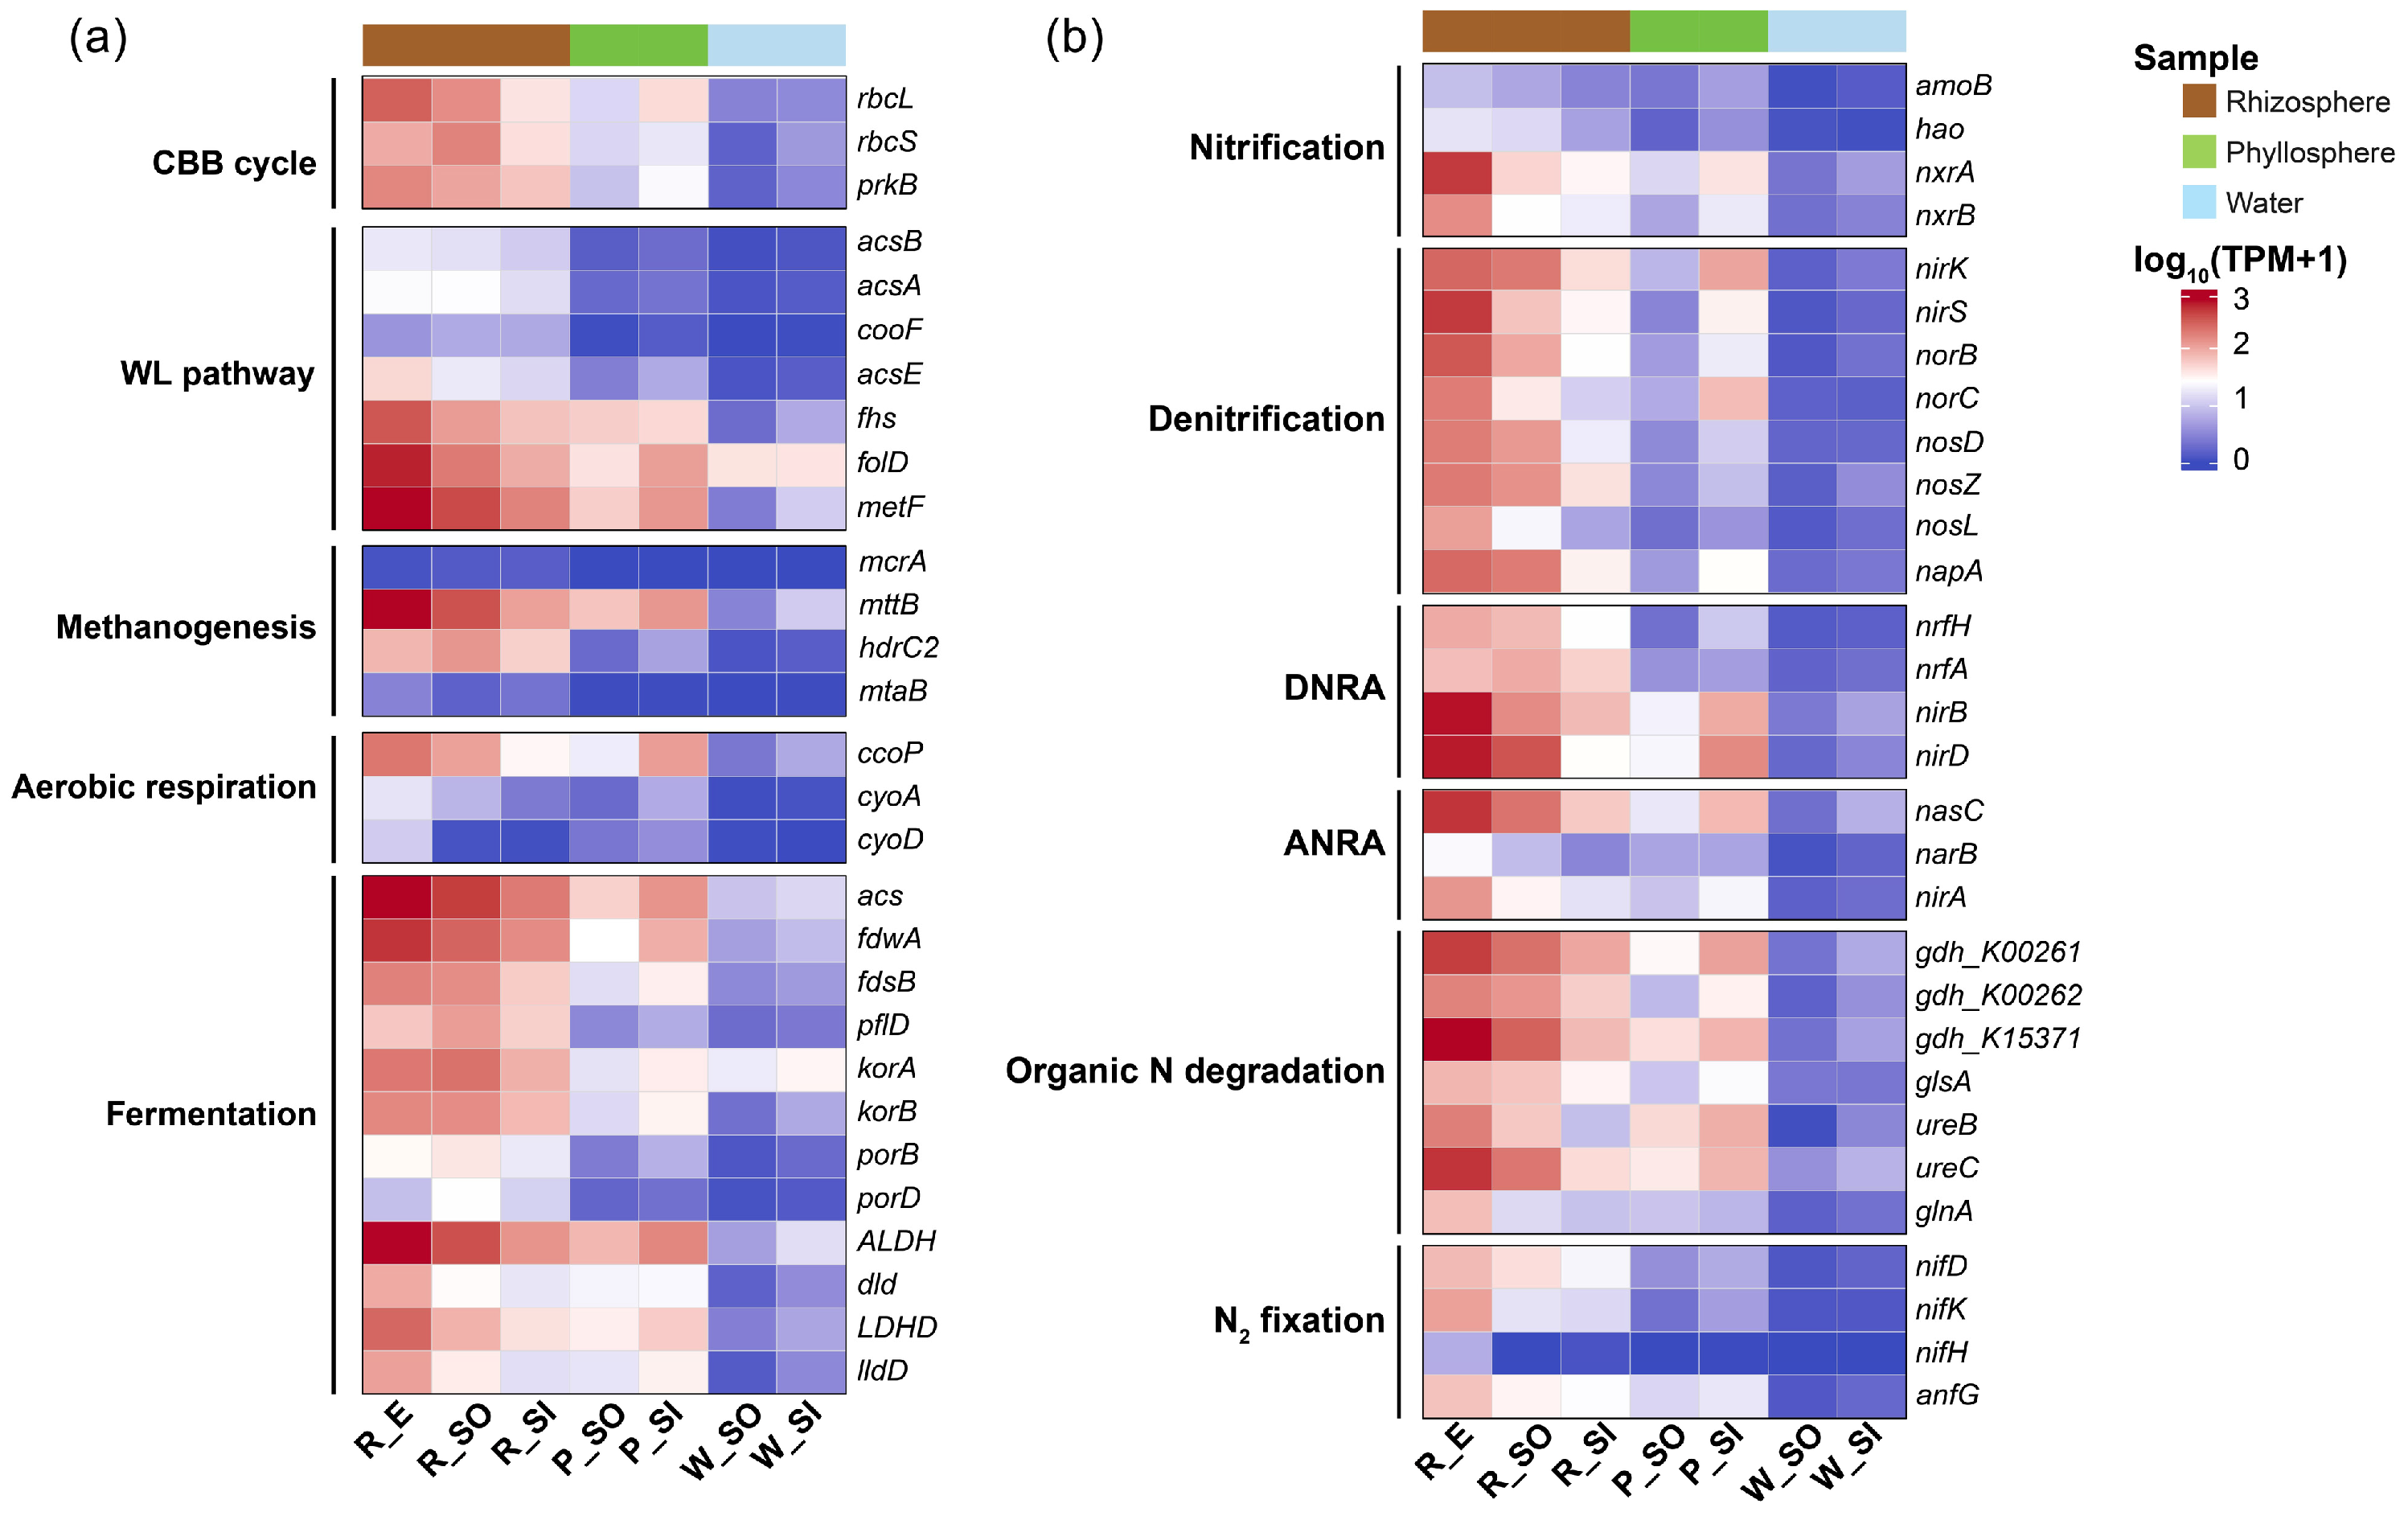
To characterize the predicted C and N metabolic potential of the microbial communities, the abundance of key functional genes was examined based on relevant KOs (Table S3). C and N metabolic genes were more abundant in the rhizosphere and phyllosphere than in the surrounding water column (Figure 4). Among the rhizosphere and phyllosphere samples, these genes were more abundant in R_E samples than in R_S and P_S samples. However, the difference in gene abundance between R_S and P_S samples varied between zones. In zone SI, these genes had comparable abundances in R_SI and P_SI samples, although genes involved in several pathways were more abundant in R_SI samples. In zone SO, by contrast, these genes were more abundant in R_SO samples than in P_SO samples, with P_SO samples approaching the levels in the surrounding water column.
Figure 4.
Relative abundance of key functional genes involved in carbon (a) and nitrogen (b) metabolism across samples. Color indicates log10(TPM + 1). Samples are grouped by habitat as rhizosphere (R_E, R_SO, R_SI), phyllosphere (P_SO, P_SI), and surrounding water column (W_SO, W_SI), as indicated by the color bars at the top. Functional gene groups are labeled on the left and individual genes on the right. CBB, Calvin–Benson–Bassham; WL, Wood–Ljungdahl; DNRA, dissimilatory nitrate reduction to ammonium; ANRA, assimilatory nitrate reduction to ammonium; TPM, transcripts per million.
Three broad carbon metabolic categories were identified: carbon degradation, carbon fixation, and methanogenesis (Figure 4a). Genes involved in carbon degradation, particularly fermentation genes (e.g., acs, fdwA, and ALDH), were generally more abundant in the rhizosphere than in the phyllosphere, whereas only the aerobic respiration gene ccoP was prominent in R_E, R_SO, and P_SI samples. Within carbon fixation, five pathways were identified (Figure S9). The Calvin–Benson–Bassham (CBB) cycle genes rbcL, rbcS, and prkB were generally more abundant in the rhizosphere, particularly in R_E and R_SO samples. Genes involved in the other carbon fixation pathways were mostly low in abundance, except fhs, folD, and metF of the Wood–Ljungdahl (WL) pathway, which were relatively abundant in the rhizosphere, particularly in R_E samples. Within methanogenesis, the marker gene mcrA had low abundances in all samples, whereas mttB and hdrC2 were more abundant in the rhizosphere, particularly in R_E and R_SO samples.
Six nitrogen metabolic pathways were identified: nitrification, denitrification, dissimilatory nitrate reduction to ammonium (DNRA), assimilatory nitrate reduction to ammonium (ANRA), organic nitrogen degradation, and N2 fixation (Figure 4b). Genes involved in denitrification (nirK, nirS, norB, norC, nosD, nosZ, and napA), DNRA (nirB and nirD), and organic nitrogen degradation (gdh and ureC) were relatively abundant in the rhizosphere, particularly in R_E and R_SO samples. For nitrification, the gene nxrA was relatively abundant in the rhizosphere, and also in the phyllosphere, particularly in P_SI samples. The genes amoB and hao had low abundances across all samples. Genes involved in N2 fixation (nifD, nifK, and anfG) were relatively abundant in R_E samples.
3.4. Predicted Functional Potential of MAGs
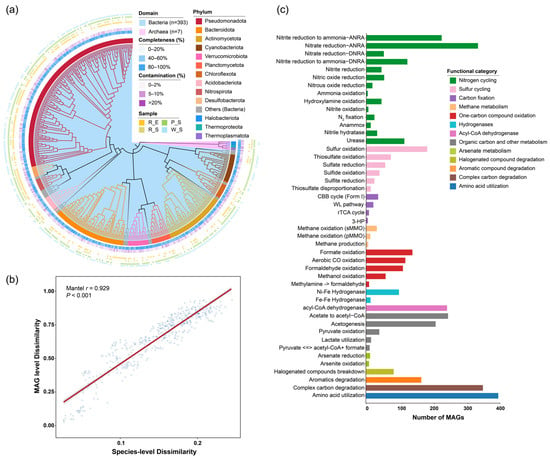
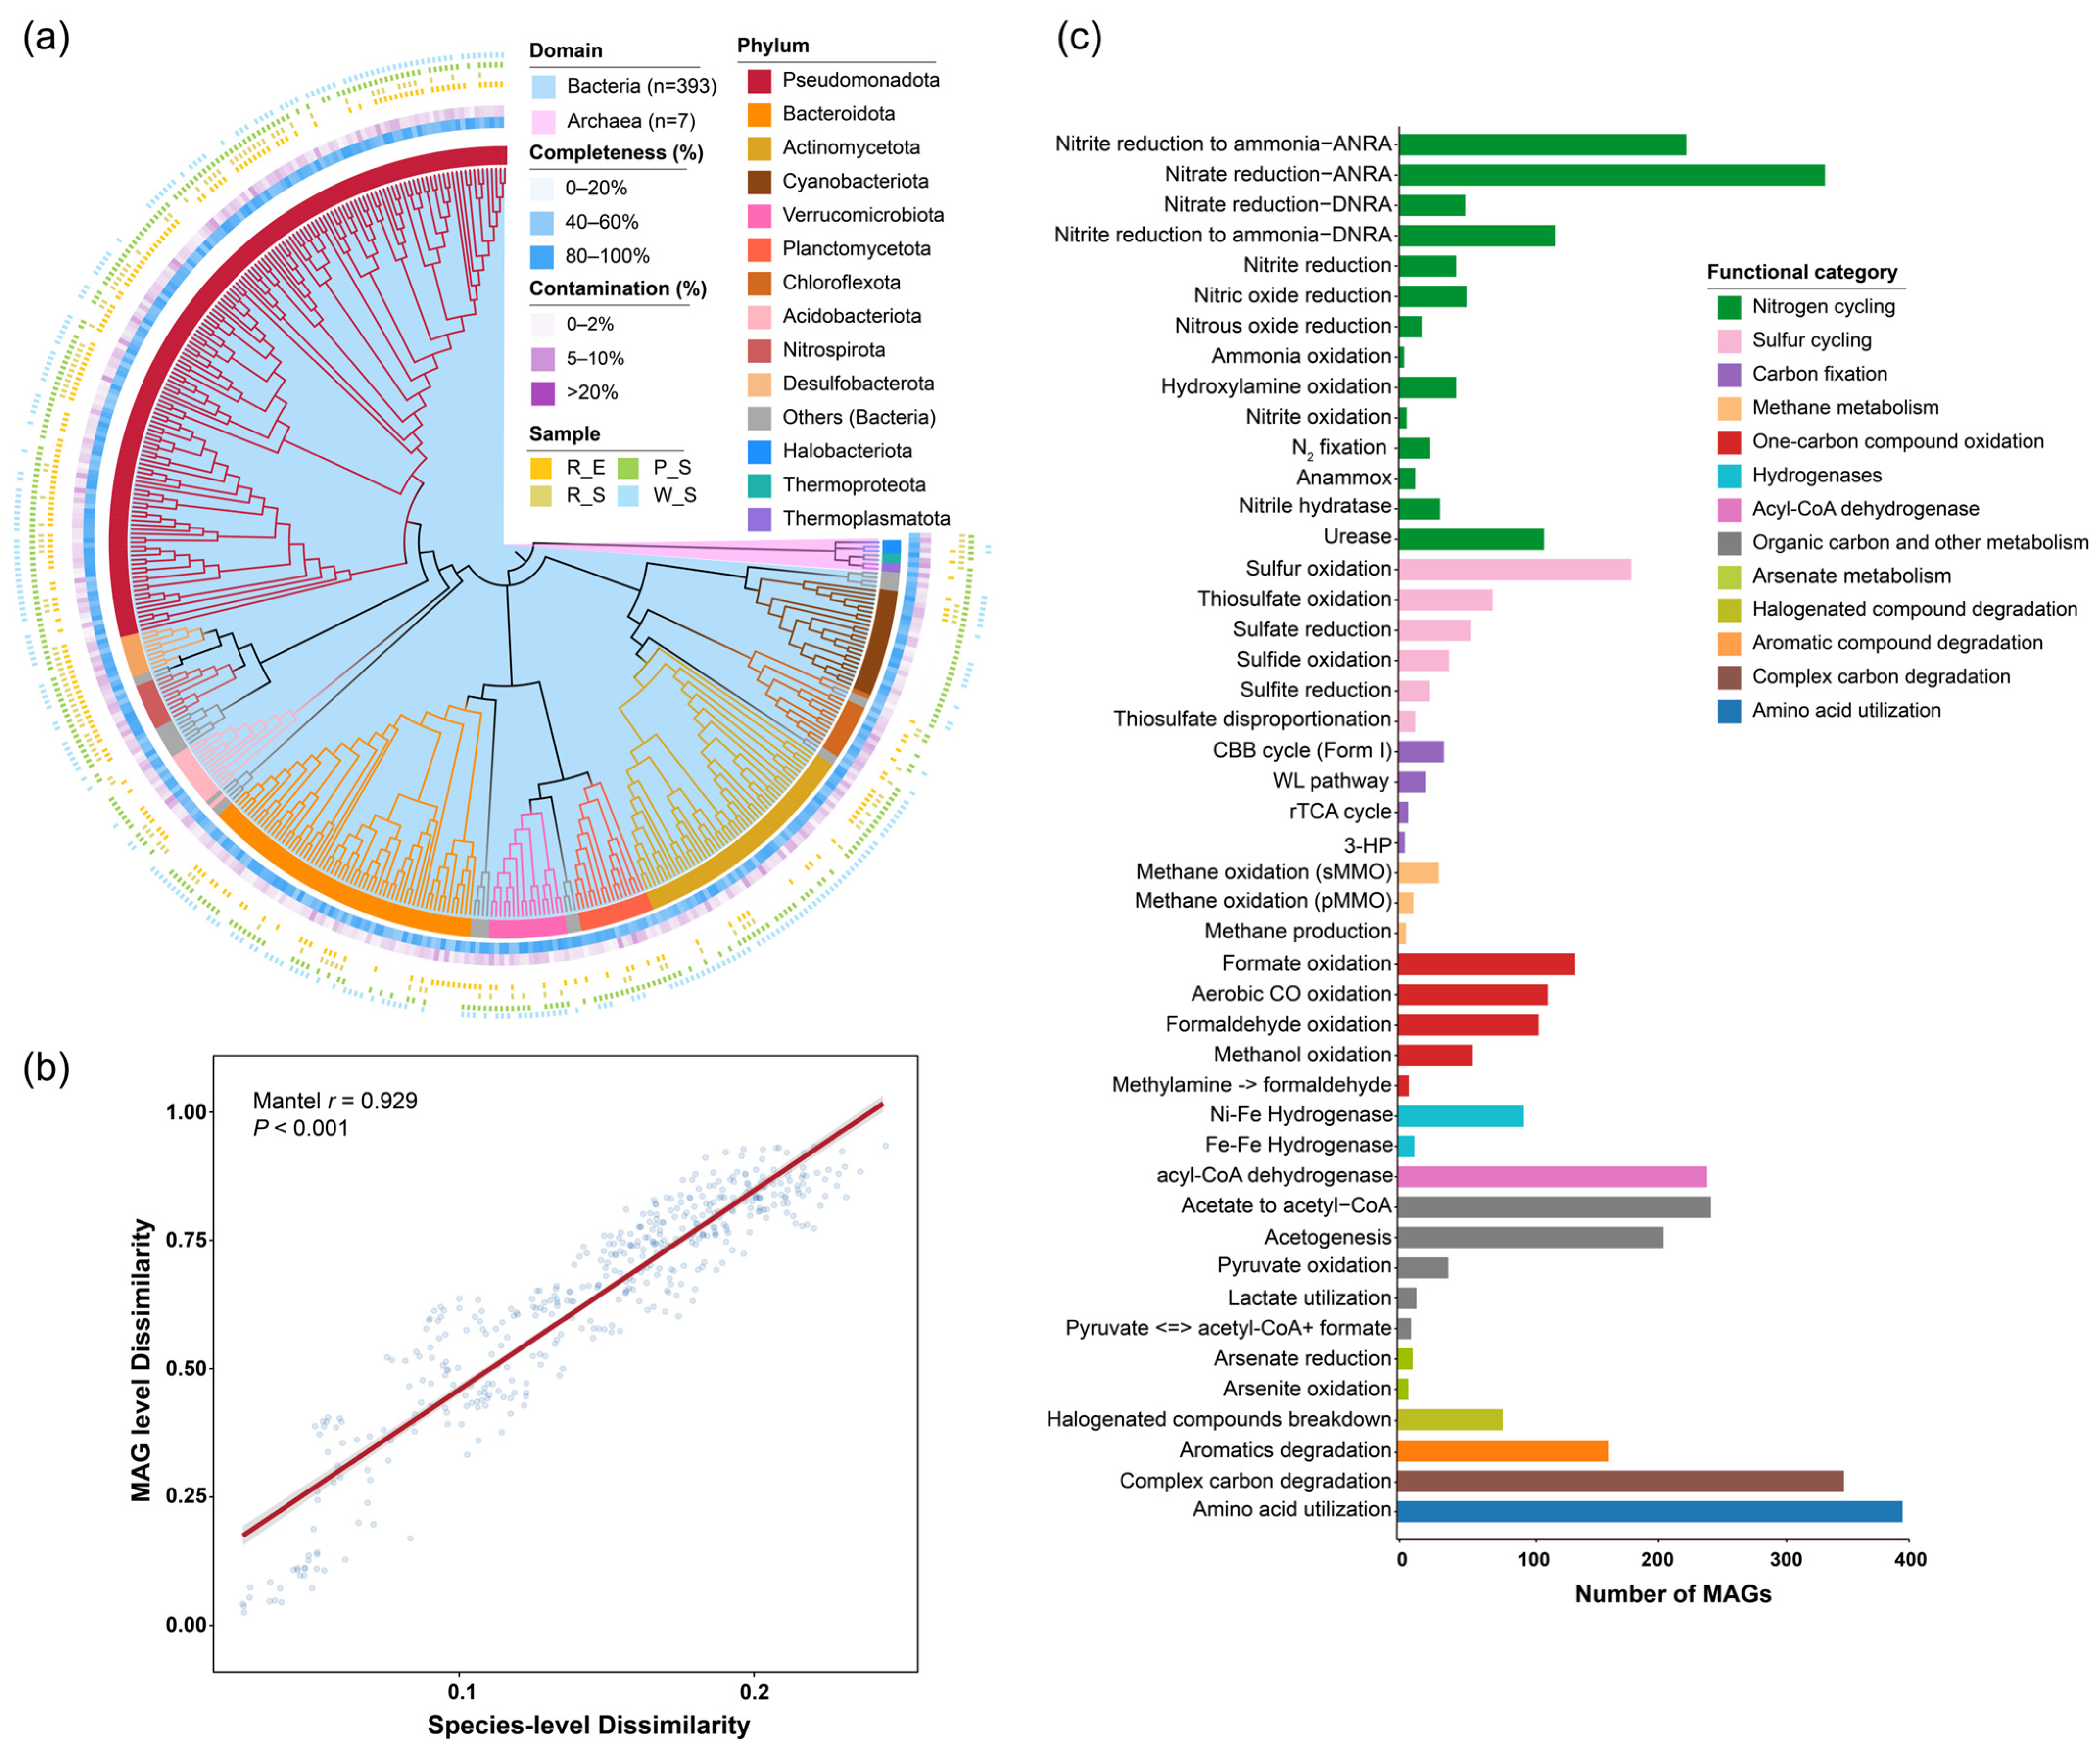
Metagenomic binning recovered 400 medium- to high-quality MAGs (completeness 50.12–100%, contamination 0–9.79%; Table S1) representing 21 bacterial phyla and 3 archaeal phyla, dominated by Pseudomonadota (n = 154), Bacteroidota (n = 61), and Actinomycetota (n = 50) (Figure 5a). MAG-level dissimilarity was significantly correlated with species-level dissimilarity across samples (Mantel r = 0.929, p < 0.001; Figure 5b), indicating that the recovered MAGs captured the overall taxonomic structure of the communities. Most MAGs encoded genes for amino acid utilization, ANRA, acyl-CoA dehydrogenase, acetate-to-acetyl-CoA conversion, and acetogenesis, suggesting broad predicted metabolic capabilities (Figure 5c; Table S4).
Figure 5.
Taxonomic and functional characterization of metagenome-assembled genomes (MAGs) recovered from microbial communities associated with submerged and emergent macrophytes. (a) Phylogenetic tree of 400 medium- to high-quality MAGs spanning 21 bacterial phyla and 3 archaeal phyla, with branches colored by phylum and background shading indicating domain (Bacteria or Archaea); outer rings indicate, from inside to outside, phylum, completeness, contamination, and sample type distribution (rhizosphere of emergent macrophytes, R_E; rhizosphere of submerged macrophytes, R_S; phyllosphere of submerged macrophytes, P_S; surrounding water column of submerged macrophytes, W_S). (b) Correlation between species-level and MAG-level Bray–Curtis dissimilarity matrices (Mantel test, r = 0.929, p < 0.001). (c) Number of MAGs encoding each biogeochemical cycling function, colored by functional category.
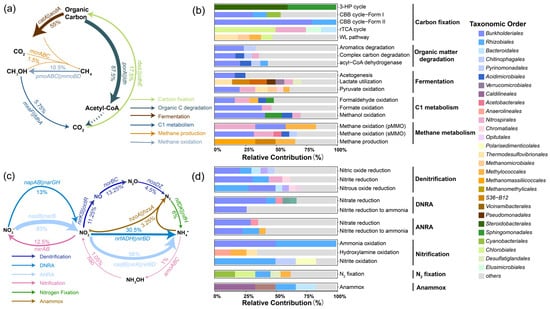
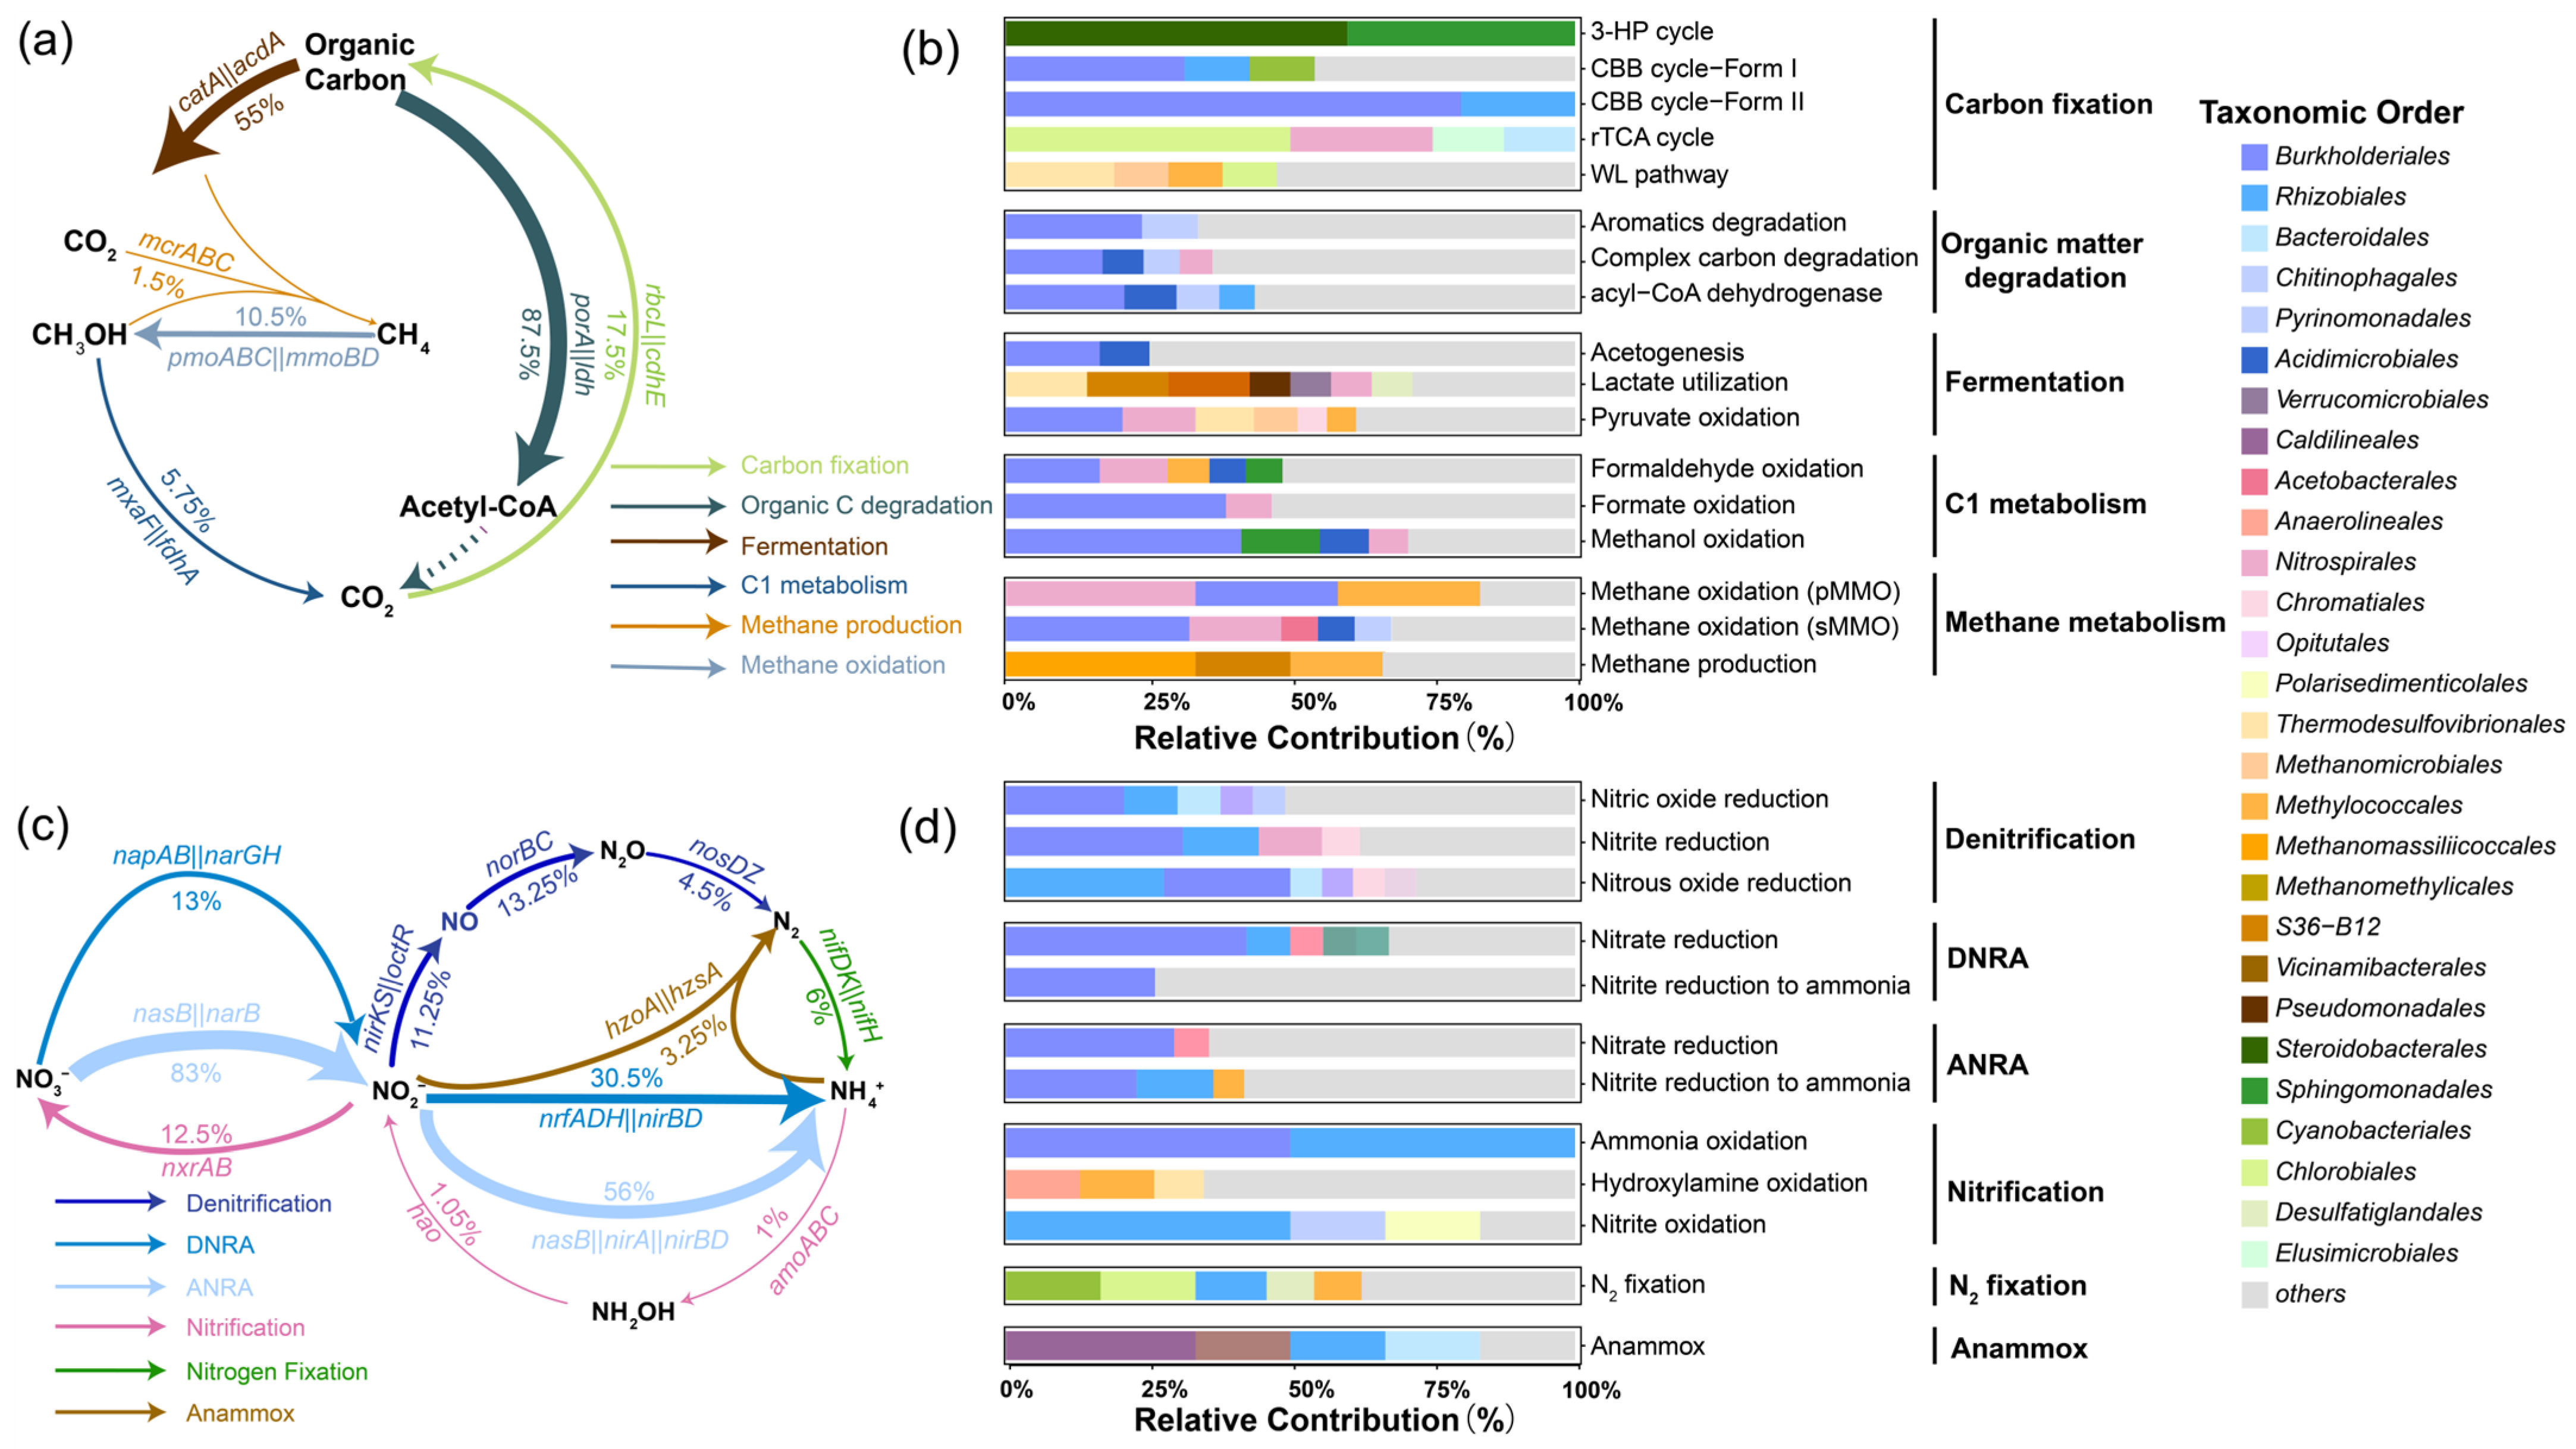
Carbon degradation was the most prevalent carbon metabolic pathway (87.5% of MAGs; Figure 6a,b). Carbon fixation was encoded in only 17.5% of MAGs, within which the CBB cycle was mainly attributed to Burkholderiales and Rhizobiales, whereas the WL pathway was mainly attributed to Thermodesulfovibrionales and archaea (Methanomassiliicoccales and Methanomicrobiales). Methanogenesis was the least prevalent carbon metabolic pathway (1.5% of MAGs), mainly attributed to archaea (Methanomassiliicoccales, Methanomicrobiales, and Methanomethylicales). Among nitrogen metabolic pathways, ANRA was the most prevalent, occurring in 83% of MAGs (Figure 6c,d). Denitrification and DNRA were primarily attributed to Burkholderiales, Rhizobiales, and Bacteroidales, with Burkholderiales contributing most to nitric oxide and nitrite reduction and Rhizobiales to nitrous oxide reduction. Nitrification steps were relatively rare: ammonia oxidation was assigned to Burkholderiales and Rhizobiales, and most nitrite oxidation steps were also assigned to Rhizobiales. N2 fixation was distributed across Chlorobiales, Cyanobacteriales, and Rhizobiales.
Figure 6.
Carbon and nitrogen metabolic pathway prevalence and taxonomic contributions of MAGs recovered from microbial communities associated with submerged and emergent macrophytes. Pathway diagram showing the proportion of MAGs encoding each carbon (a) and nitrogen (c) metabolic step, with arrow width proportional to pathway prevalence and key functional genes labeled. Relative taxonomic contribution at order level to each carbon (b) and nitrogen (d) metabolic pathway step; colors indicate order-level taxonomic affiliations as shown in the legend, and groups contributing less than 5% are merged into “others”. CBB, Calvin–Benson–Bassham; 3-HP, 3-hydroxypropionate; rTCA, reductive tricarboxylic acid; WL, Wood–Ljungdahl; DNRA, dissimilatory nitrate reduction to ammonium; ANRA, assimilatory nitrate reduction to ammonium.
3.5. Metabolic Interaction Networks of the Microbial Communities
GSMMs were reconstructed for each MAG, and over 60% of MAG pairs were predicted to have metabolic exchange potential (MIP > 0; Figure S10a). A total of 1967 MAG pairs with MIP ≥ 3 were identified. Among these pairs, ions, acids, and amino acids were predicted to be the most broadly exchanged metabolites (Figure S10b). These interactions were further organized into metabolic interaction networks for R_E, R_SO, R_SI, P_SO, and P_SI samples (Table S6), among which the networks of R_SI and R_SO samples showed the highest connectivity density. Furthermore, the networks in the rhizosphere and phyllosphere of zone SO (R_SO and P_SO) differed from those in zone SI (R_SI and P_SI): the R_SO network was larger (108 vs. 78 nodes and 250 vs. 181 edges) and less dense (density 0.043 vs. 0.060) than the R_SI network, whereas the P_SO network was smaller (121 vs. 185 nodes and 188 vs. 454 edges) and less connected (mean degree 3.11 vs. 4.91) than the P_SI network. The taxonomic composition of networks varied among samples, with Pseudomonadota as the predominant phylum. Cyanobacteriota was relatively more abundant in the phyllosphere networks, accounting for 27.7% and 9.3% of the relative abundance in the P_SO and P_SI networks, respectively. Hub MAGs identified through network analysis were mainly affiliated with the archaeal phyla Thermoproteota and Halobacteriota and the bacterial phyla Bacteroidota and Pseudomonadota, and participated in more than 40% of all MAG pairs with MIP ≥ 3 across networks (Table S6).
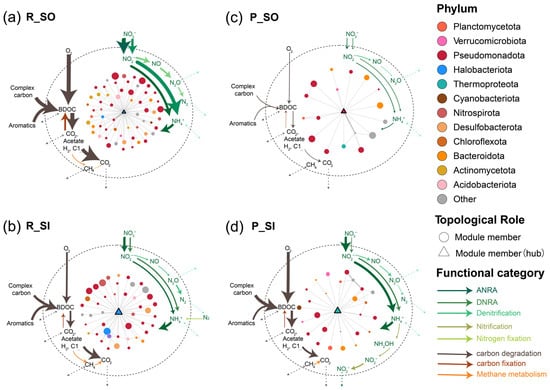
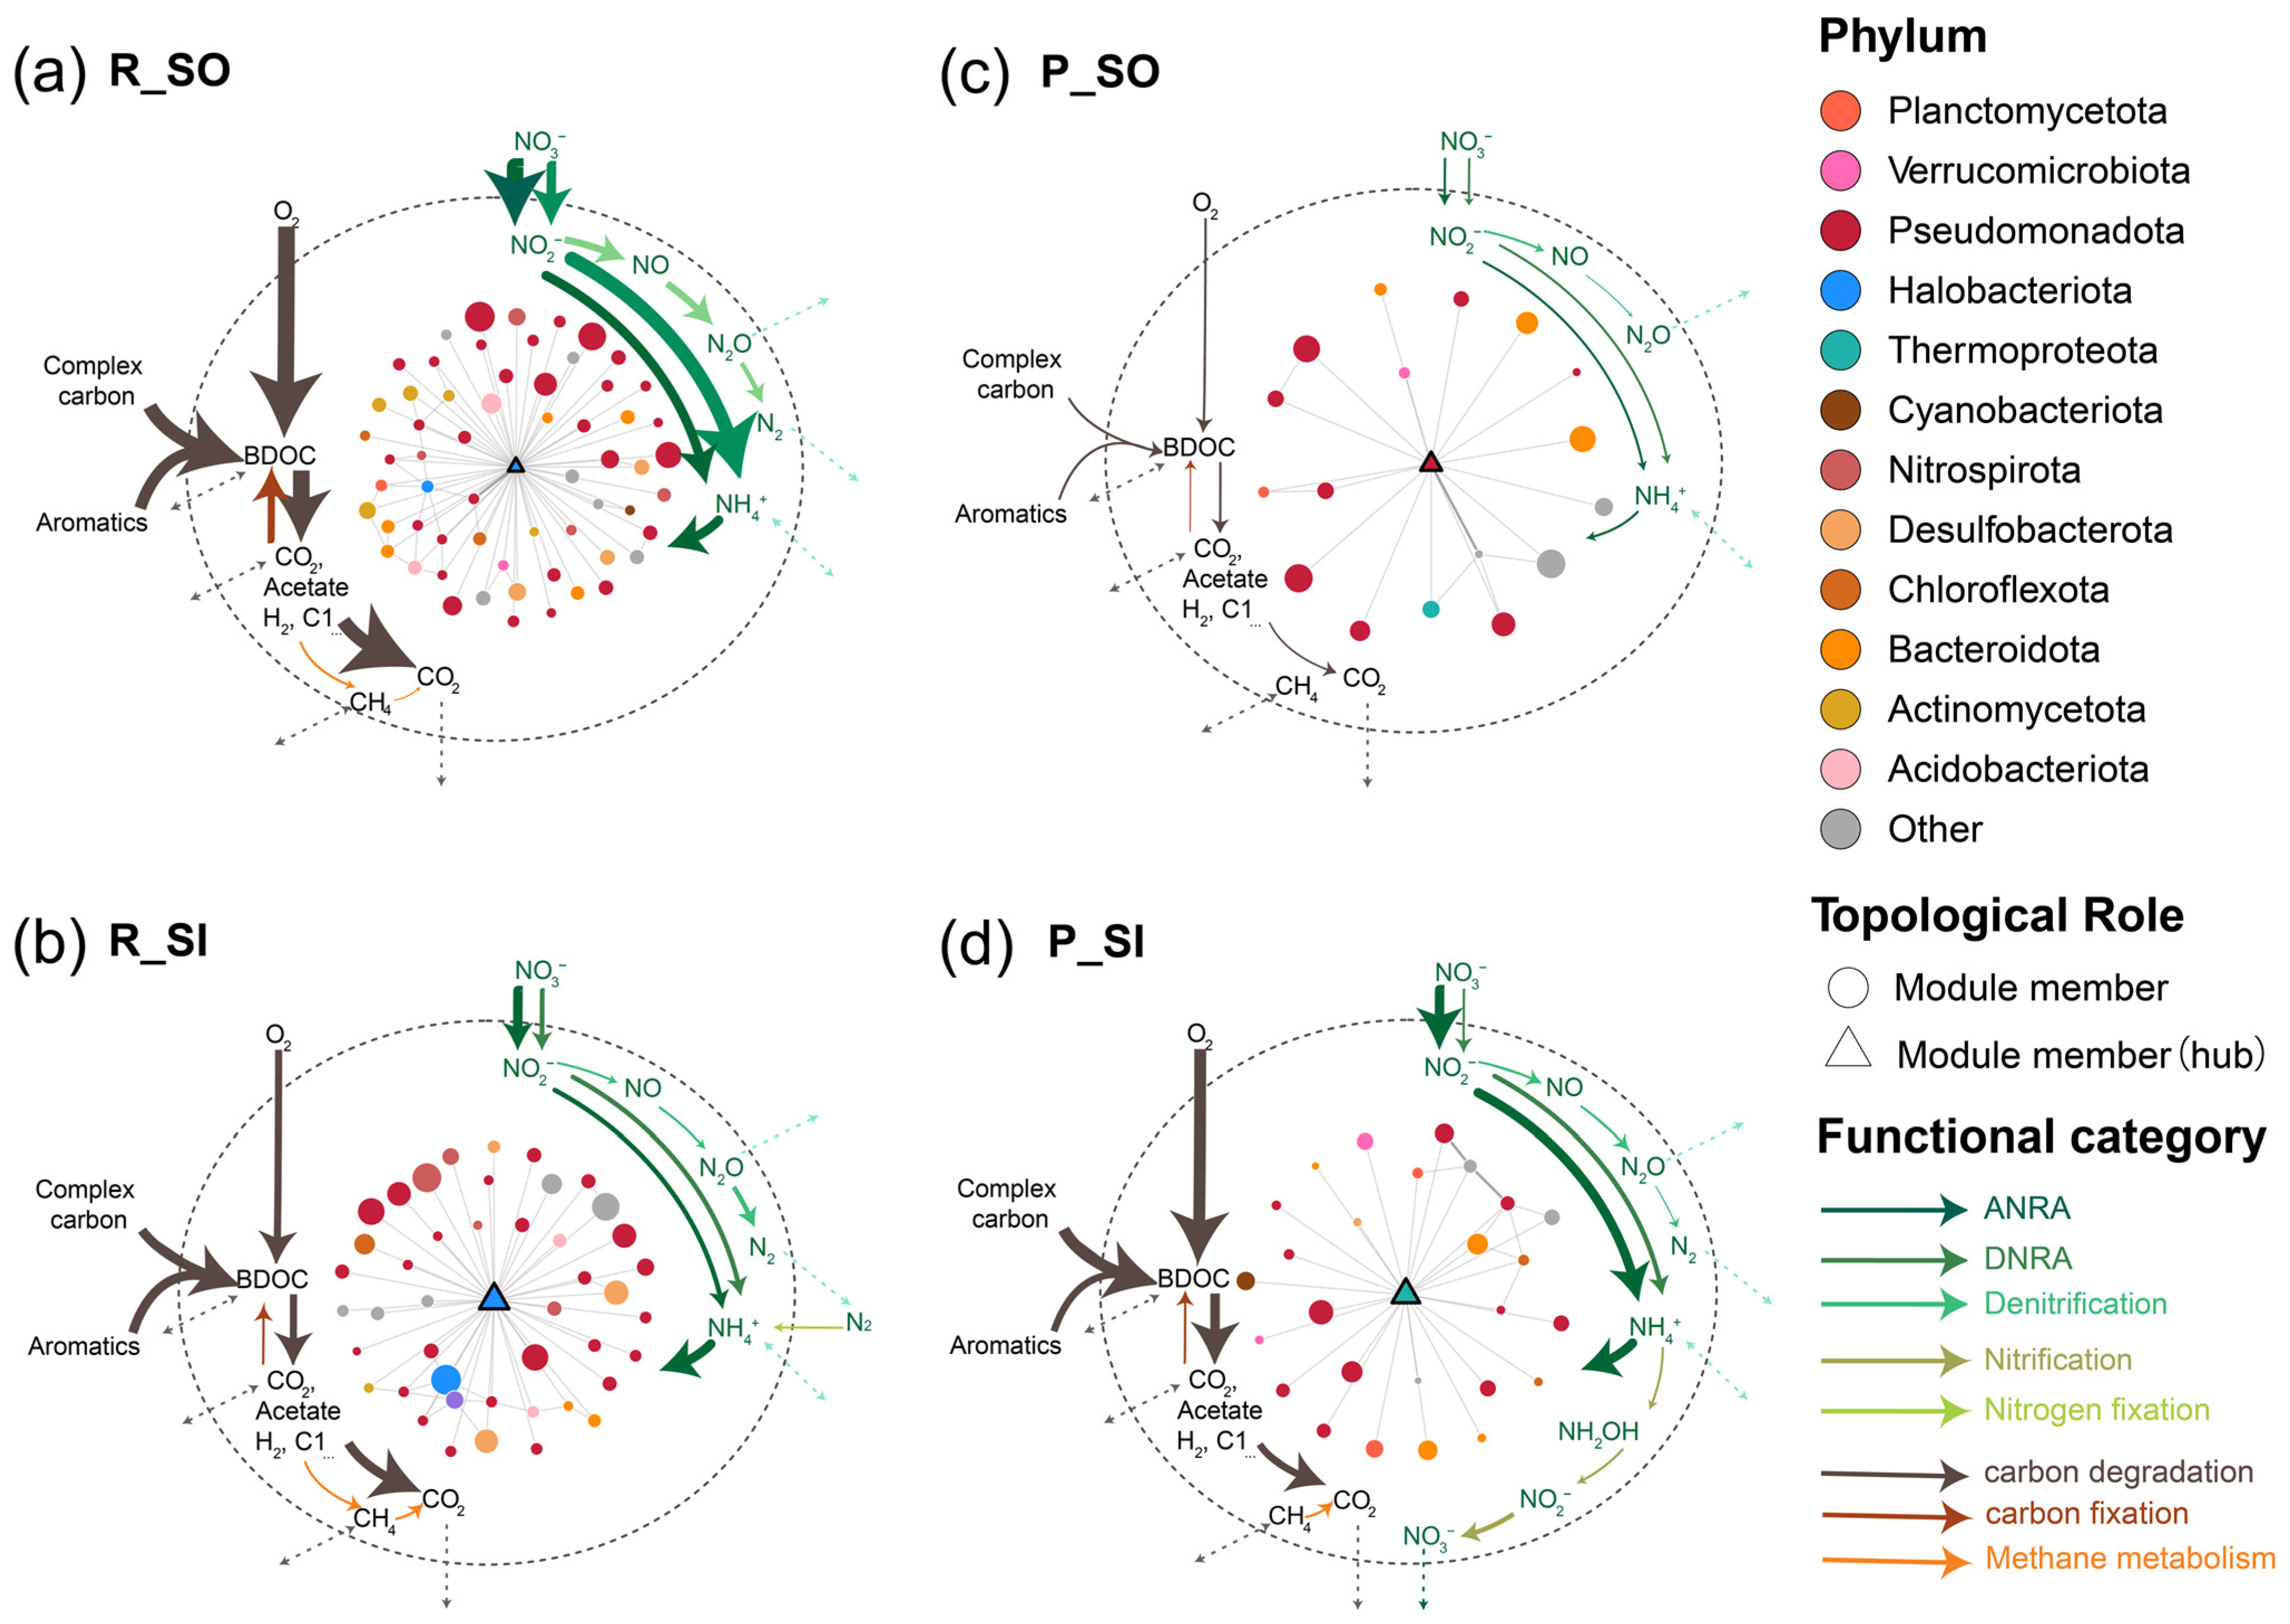
Four MIMs were then selected to analyze predicted C and N metabolic potential in the samples associated with submerged macrophytes (R_SI, R_SO, P_SI, and P_SO), each centered on the hub MAG with the highest Zi (Figure 7; Tables S6 and S7). The Halobacteriota hub MAG shared by R_SO and R_SI and the Pseudomonadota hub MAG of P_SO were of medium quality (completeness 57.51% and 83.96%, respectively), whereas the Thermoproteota hub MAG of P_SI was of high quality (completeness 100%; Table S1). In the rhizosphere of submerged macrophytes (R_SI and R_SO), Halobacteriota hub MAGs (Methanomicrobiales) were predicted to interact primarily with Burkholderiales (Azonexus and Rubrivivax) (Table S7). The MIMs formed by these interactions were predicted to support denitrification, DNRA, carbon degradation, and methane metabolism, with higher predicted C and N transformation potential in zone SO than in zone SI (Figure 7a,b). In the phyllosphere of submerged macrophytes (P_SI and P_SO), the MIM in zone SI was centered on a Thermoproteota hub MAG (Methanomethylicales) interacting primarily with Burkholderiales and also with Cyanobacteriota (Table S7), and was predicted to support denitrification, DNRA, and nitrification (Figure 7d). In contrast, in zone SO, the MIM of P_SO samples was centered on a Pseudomonadota hub MAG (Burkholderiales) and showed more limited predicted C and N transformation potential (Figure 7c).
Figure 7.
Metabolic interaction modules (MIMs) of microbial communities in the rhizosphere and phyllosphere of submerged macrophytes. MIMs are shown for the submerged rhizosphere (R_S), represented by zones outside (R_SO) (a) and inside (R_SI) (b) the enclosures, and for the submerged phyllosphere (P_S), represented by zones outside (P_SO) (c) and inside (P_SI) (d) the enclosures. In each panel, the inner network shows predicted MAG-level metabolic interactions, with nodes colored by phylum and sized by relative abundance; triangles indicate hub MAGs and circles indicate MIM members. The outer diagram shows the overall predicted carbon and nitrogen transformation potential of the MIM, with arrows colored by functional category as shown in the legend and arrow width proportional to the relative prevalence of each metabolic step among MIM members. Dashed ellipses indicate the boundary of each MIM, and dashed arrows indicate the predicted release of metabolites to, or uptake from, the surrounding environment; double-headed dashed arrows indicate both release and uptake. BDOC, biodegradable dissolved organic carbon.
Within the MIMs, metabolite exchange patterns between hub MAGs and their interacting taxa further differed among samples associated with submerged macrophytes (Figure S11; Table S8). In the rhizosphere (R_S), hub MAGs were predicted to receive mainly carbohydrates, amino acids, and NH4+ from community members, predominantly Burkholderiales, and to supply amino acids in return. This exchange involved a greater number of interactions and partner MAGs in zone SO (Figure S11a). In the phyllosphere of submerged macrophytes, the hub MAG in zone SI (P_SI) was predicted to exchange nitrogen compounds (NH4+ and urea) bidirectionally with other community members: it mainly received these compounds from Burkholderiales and Sphingomonadales and supplied urea to Cyanobacteriota, Pseudomonadota, Bacteroidota, and Armatimonadota. In zone SO, the exchange was more limited: the Pseudomonadota hub was predicted to supply amino acids, nitrogen compounds, and glycerol to community members and to receive amino acids, ammonium, and glycerol from them in return (Figure S11b).
4. Discussion
4.1. Compositional and Functional Differentiation of Microbial Communities Associated with Aquatic Macrophytes Across Habitats and Nutrient Levels
The compositional and functional structures of microbial communities differed among aquatic macrophyte habitats (rhizosphere, phyllosphere, and surrounding water column; Figure 2c and Figure S2). Previous studies have shown that submerged macrophytes selectively recruit niche-specific microbial communities from the surrounding water and sediment [6], likely because their surfaces create distinct physicochemical conditions through organic exudates and oxygen-related redox gradients [49]. In particular, genera such as Burkholderia and Bradyrhizobium, as well as genes involved in C and N metabolism, were relatively more abundant in microbial communities associated with aquatic macrophytes than in planktonic communities in the surrounding water column.
Within macrophyte-associated microbial communities, compositional and functional differentiation was further linked to habitats (rhizosphere vs. phyllosphere, compared within Vallisneria natans) and to macrophyte types (emergent vs. submerged, compared in the rhizosphere and confounded with species and zone) (Figure 3 and Figure 4). Previous work on Vallisneria natans showed that the phyllosphere and rhizosphere were enriched in different indicator taxa, which was attributed to the selective recruitment of functionally distinct taxa by the plant [4], with the two habitats differing in light availability, oxygen conditions, and macrophyte exudates [49,50]. Thauera and Azoarcus were relatively more abundant in the rhizosphere, whereas Porphyrobacter showed a higher relative abundance in the phyllosphere (Figure 3b). Thauera and Azoarcus are capable of nitrogen transformation through denitrification [51], and Porphyrobacter can supplement organic carbon metabolism with light energy [52]. Genes involved in carbon degradation (e.g., fermentation), carbon fixation, denitrification, and DNRA were also generally more abundant in the rhizosphere than in the phyllosphere communities (Figure 4 and Figure S9), which may be related to the more reducing conditions and the supply of root exudates in rhizosphere sediments [50]. In contrast, the nitrification gene nxrA showed comparable abundances in the two habitats (Figure 4b), and phyllosphere communities of submerged macrophytes have been shown to play an active role in nitrification [49]. Rhizosphere communities can differ among macrophyte types. In this study, genes involved in C and N metabolism were more abundant in the rhizosphere of emergent than of submerged macrophytes (Figure 4 and Figure S9), possibly owing to differences in belowground structure, oxygenation, and root exudation [53], although this comparison is confounded with species and zone.
Beyond macrophyte habitat, nutrient level, particularly nitrogen, may further impact the compositional and functional differentiation of microbial communities associated with aquatic macrophytes, and its effects may differ between the rhizosphere and phyllosphere communities. For example, elevated NH4+ increased the diversity and predicted nitrification potential of rhizosphere communities, whereas the diversity of phyllosphere communities declined and denitrifying taxa became relatively more abundant [13]. In this study, the compositional and functional differentiation of the rhizosphere and phyllosphere communities of submerged macrophytes was also associated with NO3− in the rhizosphere and with TN in the phyllosphere, although the marginal effect of TN on the phyllosphere functional profile was not significant (Figure S6; Table S5). Elevated sediment NO3− (Figure 2b) may have favored nitrogen-assimilating and nitrogen-cycling taxa, potentially contributing to the higher relative abundances of Burkholderiales (Thauera and Azoarcus) in the rhizosphere (Figure 3b). NO3− supply has also been reported to enrich Burkholderiales in the rhizosphere of terrestrial plants, as members of this order are involved in nitrogen assimilation and cycling [54]. NO3− is also the terminal electron acceptor for denitrification and DNRA, and root exudates and decaying plant tissue may supply carbon in vegetated sediments [55], which may support higher predicted denitrification and DNRA potential in the rhizosphere under high concentration of NO3− in this study (Figure 4). In contrast, in the phyllosphere under higher nutrient levels, Synechococcus, a cyanobacterium capable of C fixation and N assimilation [56], was relatively more abundant (Figure 3b), whereas the abundances of genes involved in C and N metabolism decreased in the phyllosphere communities. This taxon–function mismatch suggests that shifts in community composition can be decoupled from changes in functional gene profiles [57].
4.2. Predicted Metabolic Interactions in Microbial Communities Associated with Aquatic Macrophytes
According to the Black Queen Hypothesis [58], microorganisms rely on leaky public goods released by co-occurring members, forming cross-feeding interactions that reduce individual metabolic burden [18,59]. Dense biofilms on macrophyte surfaces may provide the close physical proximity that facilitates cross-feeding among diverse microorganisms and supports the formation of metabolic interaction networks (Figure 7) [18,19]. Within these networks, individual MAGs were predicted to be linked through metabolite exchange (Figure 7 and Figure S11), which may contribute to C and N metabolic pathway potential at the community level [19]. Among these taxa, archaea such as Halobacteriota (Methanomicrobiales) and Thermoproteota (Methanomethylicales), which have previously been detected in freshwater ecosystems [60,61], occupied disproportionate hub roles despite their low abundance (Table S6). These hub roles may be related to their streamlined genomes, which can arise through adaptive gene loss [58], and their dependence on metabolically richer bacterial partners [62].
Macrophyte habitat and nutrient level may further impact the function of microbial metabolic interaction networks, as the MIMs identified in different samples differed in their structure and predicted functional potential (Figure 7). In the rhizosphere of submerged macrophytes, the modules centered on a Halobacteriota hub were predicted to receive carbohydrates, amino acids, and NH4+ from Burkholderiales and Thermodesulfovibrionales and to supply amino acids in return. A comparable amino acid exchange between hub MAGs, in which one hub primarily donated amino acids and the other absorbed them, has been reported in arid soil microbial networks and was suggested to optimize resource utilization [25]. The Burkholderiales and Thermodesulfovibrionales also encoded genes for denitrification, DNRA, and carbon degradation (Figure 6), and these functions may contribute to the community-level C and N metabolic potential [19,23]. Under higher nutrient levels, Burkholderiales in the rhizosphere were relatively more abundant, accompanied by more extensive predicted metabolic interactions and a higher predicted denitrification potential of the microbial community (Figure 7a). The Thermoproteota hub in the MIM of the phyllosphere under lower nutrient levels (P_SI) was predicted to receive NH4+ and urea from Burkholderiales and to supply urea to Cyanobacteriota, and its module was predicted to harbor coupled nitrification and dissimilatory nitrogen reduction potential (Figure 7d). Thermoproteota have been reported to sustain nitrification through urea hydrolysis in acid soils [63] and to foster cross-feeding networks in arid soils [25]. In the phyllosphere under higher nutrient levels, the MIM was instead centered on a Pseudomonadota hub within a network with a higher proportion of Cyanobacteriota (27.7% versus 9.3%; Table S6) and had a simpler structure (Figure 7c). The hub in this MIM was predicted to receive fewer nitrogen compounds from community members (Figure S11b), which may limit its N metabolic potential. Dominance of a single algal taxon, such as cyanobacteria, under high nutrient levels has been reported to reduce community resilience in the phyllosphere of submerged macrophytes [64], and the greater presence of Cyanobacteriota may therefore have reduced the complexity and stability of the phyllosphere network.
Together, these findings suggest that microbial communities associated with aquatic macrophytes are predicted to support metabolic exchange related to C and N cycling, and that macrophyte habitat and ambient nutrient level are both associated with these predicted metabolic interaction networks and community metabolic potential. This study inferred metabolic interactions and functional differentiation from metagenomes of a single sampling campaign. Because sequencing depth limited the completeness of some MAGs, and MAG quality affects annotation and metabolic model reconstruction, the predicted interactions need to be confirmed experimentally. To avoid interference from species differences, the effects of habitat and nutrient level were examined within Vallisneria natans among the submerged macrophytes, whereas the comparison between emergent and submerged macrophytes remained confounded with species and zone. Future studies should increase sequencing depth to recover more complete MAGs and annotations, integrate transcriptomic or proteomic data, process rate measurements, and multi-season sampling, and include several species of emergent and submerged macrophytes under comparable nutrient conditions, so as to obtain more reliable results and to separate the two groups from species identity.
5. Conclusions
This study shows that the community composition and functional gene profiles of microbial communities associated with aquatic macrophytes differ among habitats, with higher abundances of C and N metabolic genes in the rhizosphere. For submerged macrophytes under low nutrient levels, the abundances of C and N metabolic genes were generally comparable between the rhizosphere and phyllosphere, although genes involved in fermentation were more abundant in the rhizosphere. Metabolic interaction predictions indicated that, in the rhizosphere, the MIMs centered on Halobacteriota hubs, which received carbohydrates and nitrogen compounds mainly from Burkholderiales, showed predicted C and N transformation potential. Furthermore, under higher nutrient levels, the rhizosphere MIM showed more extensive metabolic interactions between its hub and Burkholderiales and was predicted to have higher denitrification and DNRA potential. In the phyllosphere, the MIM centered on a Thermoproteota hub was predicted to exchange nitrogen compounds bidirectionally and showed predicted nitrification and nitrogen reduction potential, whereas under higher nutrient levels, the MIM was centered on a Pseudomonadota hub and showed lower predicted C and N transformation potential than that at lower nutrient levels. Overall, these findings indicate that macrophyte habitat and nutrient level are both associated with microbial metabolic interactions and predicted C and N cycling potential, providing new insights into biogeochemical cycling in freshwater lakes.
Supplementary Materials
The following supporting information can be downloaded at https://www.mdpi.com/article/10.3390/microorganisms14112498/s1, Figure S1: Sensitivity of the metabolic interaction networks to the MIP threshold in each sample; Figure S2: Non-metric multidimensional scaling (NMDS) ordination and pairwise dissimilarity of samples based on functional and taxonomic profiles; Figure S3: Dissolved oxygen and turbidity of water across all sampling sites; Figure S4: Water (a) and sediment (b) nutrient concentrations across all sampling sites; Figure S5: Rarefaction curves of observed species richness for each sample; Figure S6: Distance-based redundancy analysis (db-RDA) of rhizosphere and phyllosphere microbial community composition in relation to environmental variables, showing rhizosphere taxonomic (a) and functional (c) and phyllosphere taxonomic (b) and functional (d) profiles; Figure S7: Relative abundance of Kyoto Encyclopedia of Genes and Genomes (KEGG) Level 2 metabolic functional categories across all samples; Figure S8: Functional variation of metabolic modules among sample types, showing (a) NMDS ordination of carbohydrate, amino acid, and energy metabolism and (b) silhouette scores of top-ranked KEGG Level 3 modules; Figure S9: Log10(TPM + 1)-normalized abundance of genes involved in carbon fixation pathways across samples; Figure S10: Metabolic interaction potential and exchange characteristics among MAG pairs, showing (a) MIP score distribution and (b) metabolite class exchange patterns; Figure S11: Directionality and intensity of metabolite exchanges between hub MAGs and interacting partners in the metabolic interaction modules (MIMs) of the submerged rhizosphere (R_SO and R_SI, (a)) and phyllosphere (P_SO and P_SI, (b)); Table S1: Taxonomic classification, completeness, contamination, quality class, and genome size of the 400 MAGs; Table S2: Correspondence between NCBI and GTDB taxonomic nomenclature for the taxa whose names differ between the two classification systems; Table S3: Key functional genes and pathway categories (KEGG Orthologs) involved in carbon and nitrogen metabolism; Table S4: Presence of biogeochemical functions in each MAG annotated with METABOLIC; Table S5: Statistics of distance-based redundancy analysis (db-RDA) of rhizosphere and phyllosphere communities in relation to environmental variables (the “Water” and “Sediment” datasets correspond to the phyllosphere and rhizosphere communities, respectively; the table lists the VIF and the sequential and marginal permutation tests of each variable); Table S6: Topological properties, taxonomic composition, and hub taxa of the metabolic interaction networks of the R_E, R_SO, R_SI, P_SO, and P_SI samples; Table S7: Taxonomic composition and metabolic interaction statistics of the four metabolic interaction modules (MIMs) at the phylum, class, order, family, and genus levels; Table S8: Hub taxa, partner taxa, and exchanged compounds of the metabolic interaction modules (MIMs), summarized by exchange direction and metabolite category.
Author Contributions
Conceptualization, J.Z. and Q.L.W.; methodology, Z.Z., X.W. and J.Z.; software, Z.Z.; validation, X.W., H.W. and J.Z.; formal analysis, Z.Z., X.W. and H.W.; investigation, Z.Z., X.W. and H.W.; resources, Q.L.W. and J.Z.; data curation, Z.Z.; writing—original draft preparation, Z.Z.; writing—review and editing, Z.Z., X.W., H.W., Q.L.W. and J.Z.; visualization, Z.Z. and H.W.; supervision, Q.L.W. and J.Z.; project administration, J.Z.; funding acquisition, Q.L.W. and J.Z. All authors have read and agreed to the published version of the manuscript.
Funding
This research was funded by Jiangsu Provincial Innovation Research Program on Carbon Peaking and Carbon Neutrality (BT2024012) and the National Natural Science Foundation of China (U23A20153 and U25A20639).
Institutional Review Board Statement
Not applicable.
Informed Consent Statement
Not applicable.
Data Availability Statement
The raw sequencing data generated in this study have been deposited in the NCBI Sequence Read Archive (SRA) under BioProject accession number PRJNA1469911.
Acknowledgments
We thank the Nanjing Xuanwu Lake Park Management Office for granting permission for field sampling within the lake area. We also thank Shanghai Lingen Biotechnology Co., Ltd. for technical support with metagenomic sequencing.
Conflicts of Interest
The authors declare no conflicts of interest.
Abbreviations
The following abbreviations are used in this manuscript:
| ANOVA | Analysis of variance |
| ANRA | Assimilatory nitrate reduction to ammonium |
| BDOC | Biodegradable dissolved organic carbon |
| CBB | Calvin–Benson–Bassham (cycle) |
| db-RDA | Distance-based redundancy analysis |
| DNRA | Dissimilatory nitrate reduction to ammonium |
| DO | Dissolved oxygen |
| GSMM | Genome-scale metabolic model |
| GTDB | Genome Taxonomy Database |
| KEGG | Kyoto Encyclopedia of Genes and Genomes |
| KO | KEGG Orthology |
| MAG | Metagenome-assembled genome |
| MIM | Metabolic interaction module |
| MIP | Metabolic interaction potential |
| NCBI | National Center for Biotechnology Information |
| NMDS | Non-metric multidimensional scaling |
| PBS | Phosphate-buffered saline |
| PERMANOVA | Permutational multivariate analysis of variance |
| Pi | Participation coefficient |
| TN | Total nitrogen |
| TP | Total phosphorus |
| TPM | Transcripts per million |
| VIF | Variance inflation factor |
| WL | Wood–Ljungdahl (pathway) |
| Zi | Within-module connectivity |
References
- Thomaz, S.M. Ecosystem services provided by freshwater macrophytes. Hydrobiologia 2023, 850, 2757–2777. [Google Scholar] [CrossRef] [Scilit]
- Cheng, Y.; Jiao, L.; Cheng, Q.; He, J.; Zhang, Y.; Ding, S. The evolution of a typical plateau lake from macrophyte to algae leads to the imbalance of nutrient retention. Water Res. 2023, 236, 119937. [Google Scholar] [CrossRef] [Scilit] [PubMed]
- Schneider, B.; Cunha, E.R.; Marchese, M.; Thomaz, S.M. Associations between Macrophyte Life Forms and Environmental and Morphometric Factors in a Large Sub-tropical Floodplain. Front. Plant Sci. 2018, 9, 195. [Google Scholar] [CrossRef] [Scilit] [PubMed]
- He, R.; Hu, S.; Li, Q.; Zhao, D.; Wu, Q.L.; Zeng, J. Greater transmission capacities and small-world characteristics of bacterial communities in the above- than those in the below-ground niches of a typical submerged macrophyte, Vallisneria natans. Sci. Total Environ. 2023, 903, 166229. [Google Scholar] [CrossRef] [Scilit] [PubMed]
- Wang, X.; Liu, Y.; Qing, C.; Zeng, J.; Dong, J.; Xia, P. Analysis of diversity and function of epiphytic bacterial communities associated with macrophytes using a metagenomic approach. Microb. Ecol. 2024, 87, 37. [Google Scholar] [CrossRef] [Scilit] [PubMed]
- Zhu, H.-Z.; Jiang, M.-Z.; Zhou, N.; Jiang, C.-Y.; Liu, S.-J. Submerged macrophytes recruit unique microbial communities and drive functional zonation in an aquatic system. Appl. Microbiol. Biotechnol. 2021, 105, 7517–7528. [Google Scholar] [CrossRef] [Scilit] [PubMed]
- Huang, R.; Zeng, J.; Zhao, D.; Cook, K.V.; Hambright, K.D.; Yu, Z. Sediment microbiomes associated with the rhizosphere of emergent macrophytes in a shallow, subtropical lake. Limnol. Oceanogr. 2020, 65, S38–S48. [Google Scholar] [CrossRef] [Scilit]
- Hu, S.; He, R.; Su, R.; Zhao, D.; Wu, Q.; Zeng, J. Research progress on community composition and assembly mechanism of epiphytic bacterial community associated with aquatic macrophytes. J. Lake Sci. 2024, 36, 1303–1322. [Google Scholar] [CrossRef] [Scilit]
- Xue, Q.; Liu, J.; Cao, Y.; Wei, Y. Host Lifeform Shapes Phyllospheric Microbiome Assembly in Mountain Lake: Deterministic Selection and Stochastic Colonization Dynamics. Microorganisms 2025, 13, 960. [Google Scholar] [CrossRef] [Scilit] [PubMed]
- Hempel, M.; Blume, M.; Blindow, I.; Gross, E.M. Epiphytic bacterial community composition on two common submerged macrophytes in brackish water and freshwater. BMC Microbiol. 2008, 8, 58. [Google Scholar] [CrossRef] [Scilit] [PubMed]
- Deng, H.; Li, Q.; Li, M.; Sun, L.; Li, B.; Wang, Y.; Wu, Q.L.; Zeng, J. Epiphytic microorganisms of submerged macrophytes effectively contribute to nitrogen removal. Environ. Res. 2024, 242, 117754. [Google Scholar] [CrossRef] [Scilit] [PubMed]
- Yan, L.; Zhang, S.; Lin, D.; Guo, C.; Yan, L.; Wang, S.; He, Z. Nitrogen loading affects microbes, nitrifiers and denitrifiers attached to submerged macrophyte in constructed wetlands. Sci. Total Environ. 2018, 622–623, 121–126. [Google Scholar] [CrossRef] [Scilit] [PubMed]
- Hu, S.; He, R.; He, X.; Zeng, J.; Zhao, D. Niche-Specific Restructuring of Bacterial Communities Associated with Submerged Macrophyte under Ammonium Stress. Appl. Environ. Microbiol. 2023, 89, e00717-23. [Google Scholar] [CrossRef] [Scilit] [PubMed]
- Wang, H.; Chen, K.; Jin, H.; Hu, R. Interspecific Differences in Carbon and Nitrogen Metabolism and Leaf Epiphytic Bacteria among Three Submerged Macrophytes in Response to Elevated Ammonia Nitrogen Concentrations. Plants 2024, 13, 1427. [Google Scholar] [CrossRef] [Scilit] [PubMed]
- Oña, L.; Shreekar, S.K.; Kost, C. Disentangling microbial interaction networks. Trends Microbiol. 2025, 33, 619–634. [Google Scholar] [CrossRef] [Scilit] [PubMed]
- Hu, S.; He, R.; Zeng, J.; Zhao, D.; Wang, S.; He, F.; Yu, Z.; Wu, Q.L. Lower compositional variation and higher network complexity of rhizosphere bacterial community in constructed wetland compared to natural wetland. Microb. Ecol. 2023, 85, 965–979. [Google Scholar] [CrossRef] [Scilit] [PubMed]
- Sun, M.; Li, M.; Zhou, Y.; Liu, J.; Shi, W.; Wu, X.; Xie, B.; Deng, Y.; Gao, Z. Nitrogen deposition enhances the deterministic process of the prokaryotic community and increases the complexity of the microbial co-network in coastal wetlands. Sci. Total Environ. 2023, 856, 158939. [Google Scholar] [CrossRef] [Scilit] [PubMed]
- Kost, C.; Patil, K.R.; Friedman, J.; Garcia, S.L.; Ralser, M. Metabolic exchanges are ubiquitous in natural microbial communities. Nat. Microbiol. 2023, 8, 2244–2252. [Google Scholar] [CrossRef] [Scilit] [PubMed]
- Klier, K.M.; Anantharaman, K. An updated view of metabolic handoffs in microbiomes. Trends Microbiol. 2026, 34, 98–112. [Google Scholar] [CrossRef] [Scilit] [PubMed]
- Machado, D.; Andrejev, S.; Tramontano, M.; Patil, K.R. Fast automated reconstruction of genome-scale metabolic models for microbial species and communities. Nucleic Acids Res. 2018, 46, 7542–7553. [Google Scholar] [CrossRef] [Scilit] [PubMed]
- Machado, D.; Maistrenko, O.M.; Andrejev, S.; Kim, Y.; Bork, P.; Patil, K.R. Polarization of microbial communities between competitive and cooperative metabolism. Nat. Ecol. Evol. 2021, 5, 195–203. [Google Scholar] [CrossRef] [Scilit] [PubMed]
- Zelezniak, A.; Andrejev, S.; Ponomarova, O.; Mende, D.R.; Bork, P.; Patil, K.R. Metabolic dependencies drive species co-occurrence in diverse microbial communities. Proc. Natl. Acad. Sci. USA 2015, 112, 6449–6454, Erratum in Proc. Natl. Acad. Sci. USA 2015, 112, E7156. https://doi.org/10.1073/pnas.1522642113. [Google Scholar] [CrossRef] [Scilit] [PubMed]
- Du, H.; Pan, J.; Zou, D.; Huang, Y.; Liu, Y.; Li, M. Microbial active functional modules derived from network analysis and metabolic interactions decipher the complex microbiome assembly in mangrove sediments. Microbiome 2022, 10, 224, Erratum in Microbiome 2022, 10, 244. https://doi.org/10.1186/s40168-022-01455-0. [Google Scholar] [CrossRef] [Scilit] [PubMed]
- Peng, X.; Wang, S.; Wang, M.; Feng, K.; He, Q.; Yang, X.; Hou, W.; Li, F.; Zhao, Y.; Hu, B.; et al. Metabolic interdependencies in thermophilic communities are revealed using co-occurrence and complementarity networks. Nat. Commun. 2024, 15, 8166. [Google Scholar] [CrossRef] [Scilit] [PubMed]
- Ayala-Ortiz, C.; Freire-Zapata, V.; Tfaily, M.M. Stochastic assembly and metabolic network reorganization drive microbial resilience in arid soils. Commun. Earth Environ. 2025, 6, 647. [Google Scholar] [CrossRef] [Scilit]
- Giordano, N.; Gaudin, M.; Trottier, C.; Delage, E.; Nef, C.; Bowler, C.; Chaffron, S. Genome-scale community modelling reveals conserved metabolic cross-feedings in epipelagic bacterioplankton communities. Nat. Commun. 2024, 15, 2721. [Google Scholar] [CrossRef] [Scilit] [PubMed]
- Feng, Y.; Zhao, Y.; Wu, X.; Pan, J.; Zhu, G.; Liu, S. Adjustable Microbial Cross-feedings Adapt to Landforms in the Yangtze River. Water Ecol. 2025, 1, 100004. [Google Scholar] [CrossRef] [Scilit]
- Schäfer, M.; Pacheco, A.R.; Künzler, R.; Bortfeld-Miller, M.; Field, C.M.; Vayena, E.; Hatzimanikatis, V.; Vorholt, J.A. Metabolic interaction models recapitulate leaf microbiota ecology. Science 2023, 381, eadf5121. [Google Scholar] [CrossRef] [Scilit] [PubMed]
- Shen, F.; Zhao, D.; Huang, R.; Wang, S.; Cao, X.; Xu, H.; Zeng, J.; Yu, Z. Seasonal variation of bacterioplankton community structure in Xuanwu Lake, Nanjing and its relationship with environmental factors. J. Lake Sci. 2017, 29, 662–669. [Google Scholar] [CrossRef] [Scilit][Green Version]
- Yin, Y.; Ci, Z.; Qin, M.; Lin, H.; Zhang, Y.; Xun, F.; Xie, A.; Xing, P.; Chen, X.; Su, Y.; et al. Potential of submerged macrophytes restoration for reducing CH4 and CO2 emissions in a typical urban lake. J. Environ. Manag. 2025, 380, 124919. [Google Scholar] [CrossRef] [Scilit] [PubMed]
- Sun, X.; Hu, S.; He, R.; Zeng, J.; Zhao, D. Ecological restoration enhanced the stability of epiphytic microbial food webs of submerged macrophytes: Insights from predation characteristics of epiphytic predators. Sci. Total Environ. 2024, 948, 174547. [Google Scholar] [CrossRef] [Scilit] [PubMed]
- Li, Q.; Deng, H.; He, R.; Hu, S.; Sun, L.; Li, M.; Wu, Q.L.; Zeng, J. Effects of different emergent macrophytes on methane flux and rhizosphere microbial communities in wetlands. Sci. Total Environ. 2024, 932, 172565. [Google Scholar] [CrossRef] [Scilit] [PubMed]
- State Environmental Protection Administration of China. Monitoring and Analysis Methods for the Water and Wastewater, 4th ed.; China Environmental Science Press: Beijing, China, 2002. (In Chinese) [Google Scholar]
- Bolger, A.M.; Lohse, M.; Usadel, B. Trimmomatic: A flexible trimmer for Illumina sequence data. Bioinformatics 2014, 30, 2114–2120. [Google Scholar] [CrossRef] [Scilit] [PubMed]
- Li, D.; Liu, C.-M.; Luo, R.; Sadakane, K.; Lam, T.-W. MEGAHIT: An ultra-fast single-node solution for large and complex metagenomics assembly via succinct de Bruijn graph. Bioinformatics 2015, 31, 1674–1676. [Google Scholar] [CrossRef] [Scilit] [PubMed]
- Uritskiy, G.V.; DiRuggiero, J.; Taylor, J. MetaWRAP-a flexible pipeline for genome-resolved metagenomic data analysis. Microbiome 2018, 6, 158. [Google Scholar] [CrossRef] [Scilit] [PubMed]
- Olm, M.R.; Brown, C.T.; Brooks, B.; Banfield, J.F. dRep: A tool for fast and accurate genomic comparisons that enables improved genome recovery from metagenomes through de-replication. ISME J. 2017, 11, 2864–2868. [Google Scholar] [CrossRef] [Scilit] [PubMed]
- Parks, D.H.; Imelfort, M.; Skennerton, C.T.; Hugenholtz, P.; Tyson, G.W. CheckM: Assessing the Quality of Microbial Genomes Recovered from Isolates, Single Cells, and Metagenomes. Genome Res. 2015, 25, 1043–1055. [Google Scholar] [CrossRef] [Scilit] [PubMed]
- Aroney, S.T.N.; Newell, R.J.P.; Nissen, J.N.; Camargo, A.P.; Tyson, G.W.; Woodcroft, B.J. CoverM: Read alignment statistics for metagenomics. Bioinformatics 2025, 41, btaf147. [Google Scholar] [CrossRef] [Scilit] [PubMed]
- Wood, D.E.; Lu, J.; Langmead, B. Improved metagenomic analysis with Kraken 2. Genome Biol. 2019, 20, 257. [Google Scholar] [CrossRef] [Scilit] [PubMed]
- Chaumeil, P.-A.; Mussig, A.J.; Hugenholtz, P.; Parks, D.H. GTDB-Tk v2: Memory friendly classification with the genome taxonomy database. Bioinformatics 2022, 38, 5315–5316. [Google Scholar] [CrossRef] [Scilit] [PubMed]
- Hyatt, D.; Chen, G.-L.; LoCascio, P.F.; Land, M.L.; Larimer, F.W.; Hauser, L.J. Prodigal: Prokaryotic gene recognition and translation initiation site identification. BMC Bioinform. 2010, 11, 119. [Google Scholar] [CrossRef] [Scilit] [PubMed]
- Fu, L.; Niu, B.; Zhu, Z.; Wu, S.; Li, W. CD-HIT: Accelerated for clustering the next-generation sequencing data. Bioinformatics 2012, 28, 3150–3152. [Google Scholar] [CrossRef] [Scilit] [PubMed]
- Cantalapiedra, C.P.; Hernández-Plaza, A.; Letunic, I.; Bork, P.; Huerta-Cepas, J. eggNOG-mapper v2: Functional annotation, orthology assignments, and domain prediction at the metagenomic scale. Mol. Biol. Evol. 2021, 38, 5825–5829. [Google Scholar] [CrossRef] [Scilit] [PubMed]
- Patro, R.; Duggal, G.; Love, M.I.; Irizarry, R.A.; Kingsford, C. Salmon provides fast and bias-aware quantification of transcript expression. Nat. Methods 2017, 14, 417–419. [Google Scholar] [CrossRef] [Scilit] [PubMed]
- Zhou, Z.; Tran, P.Q.; Breister, A.M.; Liu, Y.; Kieft, K.; Cowley, E.S.; Karaoz, U.; Anantharaman, K. METABOLIC: High-throughput profiling of microbial genomes for functional traits, metabolism, biogeochemistry, and community-scale functional networks. Microbiome 2022, 10, 33. [Google Scholar] [CrossRef] [Scilit] [PubMed]
- Moretti, S.; Tran, V.D.T.; Mehl, F.; Ibberson, M.; Pagni, M. MetaNetX/MNXref: Unified namespace for metabolites and biochemical reactions in the context of metabolic models. Nucleic Acids Res. 2021, 49, D570–D574. [Google Scholar] [CrossRef] [Scilit] [PubMed]
- Caspi, R.; Billington, R.; Ferrer, L.; Foerster, H.; Fulcher, C.A.; Keseler, I.M.; Kothari, A.; Krummenacker, M.; Latendresse, M.; Mueller, L.A.; et al. The MetaCyc database of metabolic pathways and enzymes and the BioCyc collection of pathway/genome databases. Nucleic Acids Res. 2016, 44, D471–D480. [Google Scholar] [CrossRef] [Scilit] [PubMed]
- Wijewardene, L.; Wu, N.; Fohrer, N.; Riis, T. Epiphytic biofilms in freshwater and interactions with macrophytes: Current understanding and future directions. Aquat. Bot. 2022, 176, 103467. [Google Scholar] [CrossRef] [Scilit]
- Krüger, N.; Subrahmaniam, H.J.; Mueller, P. Root exudate profiles of wetland plants—A quantitative synthesis of secretion rates. Rhizosphere 2026, 37, 101292. [Google Scholar] [CrossRef] [Scilit]
- Rabus, R. Functional genomics of an anaerobic aromatic-degrading denitrifying bacterium, strain EbN1. Appl. Microbiol. Biotechnol. 2005, 68, 580–587. [Google Scholar] [CrossRef] [Scilit] [PubMed]
- Liu, Q.; Wu, Y.-H.; Cheng, H.; Xu, L.; Wang, C.-S.; Xu, X.-W. Complete genome sequence of bacteriochlorophyll-synthesizing bacterium Porphyrobacter neustonensis DSM 9434. Stand. Genom. Sci. 2017, 12, 32. [Google Scholar] [CrossRef] [Scilit] [PubMed]
- Ma, X.; Yu, W.; Guo, W.; Xiong, W.; Li, F.; Deng, Z.; Xie, Y. Plant Life Forms Shape Phosphorus Dynamics and Rhizosphere Microbial Communities under Gradient Nutrient Loadings. Ecol. Indic. 2026, 182, 114558. [Google Scholar] [CrossRef] [Scilit]
- Sun, Y.; Yue, Y.; Qian, J.; Gu, Z.; Yang, Y.; Guo, S.; Yuan, H.; Fernie, A.R. Linking Nitrate-Modulated Plant Growth and Metabolic Reprogramming to Rhizobacterial Recruitment: Insights from the Plant Metabolome and Rhizosphere Microbiome. J. Agric. Food Chem. 2025, 73, 27272–27287. [Google Scholar] [CrossRef] [Scilit] [PubMed]
- Maurer, D.; Malique, F.; Alfarraj, S.; Albasher, G.; Horn, M.A.; Butterbach-Bahl, K.; Dannenmann, M.; Rennenberg, H. Interactive regulation of root exudation and rhizosphere denitrification by plant metabolite content and soil properties. Plant Soil 2021, 467, 107–127. [Google Scholar] [CrossRef] [Scilit]
- Cabello-Yeves, P.J.; Haro-Moreno, J.M.; Martin-Cuadrado, A.-B.; Ghai, R.; Picazo, A.; Camacho, A.; Rodriguez-Valera, F. Novel Synechococcus genomes reconstructed from freshwater reservoirs. Front. Microbiol. 2017, 8, 1151. [Google Scholar] [CrossRef] [Scilit] [PubMed]
- Burke, C.; Steinberg, P.; Rusch, D.; Kjelleberg, S.; Thomas, T. Bacterial community assembly based on functional genes rather than species. Proc. Natl. Acad. Sci. USA 2011, 108, 14288–14293. [Google Scholar] [CrossRef] [Scilit] [PubMed]
- Morris, J.J.; Lenski, R.E.; Zinser, E.R. The Black Queen Hypothesis: Evolution of dependencies through adaptive gene loss. mBio 2012, 3, e00036-12. [Google Scholar] [CrossRef] [Scilit] [PubMed]
- D’Souza, G.; Shitut, S.; Preussger, D.; Yousif, G.; Waschina, S.; Kost, C. Ecology and evolution of metabolic cross-feeding interactions in bacteria. Nat. Prod. Rep. 2018, 35, 455–488. [Google Scholar] [CrossRef] [Scilit] [PubMed]
- Wang, B.; Zheng, X.; Zhang, H.; Yu, X.; Lian, Y.; Yang, X.; Yu, H.; Hu, R.; He, Z.; Xiao, F.; et al. Metagenomic Insights into the Effects of Submerged Plants on Functional Potential of Microbial Communities in Wetland Sediments. Mar. Life Sci. Technol. 2021, 3, 405–415. [Google Scholar] [CrossRef] [Scilit] [PubMed]
- Biderre-Petit, C.; Jézéquel, D.; Dugat-Bony, E.; Lopes, F.; Kuever, J.; Borrel, G.; Viollier, E.; Fonty, G.; Peyret, P. Identification of microbial communities involved in the methane cycle of a freshwater meromictic lake. FEMS Microbiol. Ecol. 2011, 77, 533–545. [Google Scholar] [CrossRef] [Scilit] [PubMed]
- Medina-Chávez, N.O.; Torres-Cerda, A.; Chacón, J.M.; Harcombe, W.R.; De la Torre-Zavala, S.; Travisano, M. Disentangling a metabolic cross-feeding in a halophilic archaea-bacteria consortium. Front. Microbiol. 2023, 14, 1276438. [Google Scholar] [CrossRef] [Scilit] [PubMed]
- Lu, L.; Han, W.; Zhang, J.; Wu, Y.; Wang, B.; Lin, X.; Zhu, J.; Cai, Z.; Jia, Z. Nitrification of archaeal ammonia oxidizers in acid soils is supported by hydrolysis of urea. ISME J. 2012, 6, 1978–1984. [Google Scholar] [CrossRef] [Scilit] [PubMed]
- Hao, B.; Chou, Q.; He, B.; Yao, Z.; Zhang, S.; Wu, H. Scale-Dependent Heterogeneity Drives Microbial Insurance in Phyllosphere Algal-Bacterial Networks during Lake Eutrophication. Environ. Sci. Technol. 2026, 60, 7912–7925. [Google Scholar] [CrossRef] [Scilit] [PubMed]
Disclaimer/Publisher’s Note: The statements, opinions and data contained in all publications are solely those of the individual author(s) and contributor(s) and not of MDPI and/or the editor(s). MDPI and/or the editor(s) disclaim responsibility for any injury to people or property resulting from any ideas, methods, instructions or products referred to in the content. |
© 2026 by the authors. Licensee MDPI, Basel, Switzerland. This article is an open access article distributed under the terms and conditions of the Creative Commons Attribution (CC BY) license.