


Abstract
Vibrotactile interfaces commonly encode information using changes in stimulus amplitude and frequency, yet it remains unclear how reliably these parameters can be distinguished when spatial cues are unavailable. The present study examined discrimination of vibrotactile signals that differed in amplitude, frequency, or both, with sequential stimulation delivered to a single location on the wrist. Vibrotactile stimuli were presented through a wearable actuator, and participants judged whether pairs of signals were the same or different. Discrimination performance was high when stimuli differed in amplitude, whereas signals differing only in frequency were difficult to distinguish and often produced performance near chance. Importantly, adding frequency differences to amplitude differences did not improve discrimination beyond amplitude differences alone. These findings indicate that, under non-spatial and sequential presentation conditions, amplitude provides a robust cue for vibrotactile signal discrimination, whereas frequency modulations on their own offer limited benefits for perceptual discrimination. The results highlight basic constraints on vibrotactile perception that are relevant for the design of wearable tactile interfaces and sensory substitution devices.
1. Introduction
Vibrotactile signals are widely used in wearable interfaces and sensory substitution devices to convey information through tactile modality. The aim of such devices is to transmit information about the environment when another sensory modality is unavailable or impaired [1,2,3]. Vibrotactile displays have become a central component in human–computer interaction, mobile devices, and assistive technologies, with amplitude and frequency modulation representing the primary encoding dimensions [4]. Such tactile stimulation can be applied to different body locations, including the hands, wrists, forearms, torso, or back, depending on the intended function and design constraints [3,5,6]. Across these applications, information is commonly encoded using basic vibration parameters such as amplitude and frequency.
Mountcastle and his colleagues have demonstrated that discrimination of flutter frequency depends on temporally patterned activity in somatosensory cortex and is modulated by stimulus amplitude and task context [7]. Recent work further demonstrates that vibrotactile frequency discrimination is strongly modulated by spatial separation and task difficulty, highlighting the context-dependent nature of tactile decision processes [8]. Frequency judgments also engage distributed cortical mechanisms linking sensory encoding with working memory and decision processes [9].
Despite this extensive work, the perceptual reliability of amplitude and frequency as independent coding dimensions under non-spatial, device-relevant stimulation conditions remains insufficiently characterized. More broadly, perceptual systems do not treat stimulus dimensions symmetrically. Findings from whole-body vibration demonstrate that some attributes, such as perceived intensity, follow relatively stable discrimination thresholds, whereas frequency- and modulation-based attributes show reference-dependent and asymmetric sensitivity patterns [10]. Moreover, signals carried by distinct mechanoreceptor channels can interact in an inhibitory manner, challenging classical assumptions of independent tactile submodalities [11]. Electrophysiological result of Tung’s and his colleagues’ study suggests that sensory processing may exhibit temporally asymmetric dynamics, with early stimulus-driven suppression preceding later goal-dependent facilitation in cross-modal contexts [12].
Compared to vision and audition, the tactile modality can convey only a limited amount of information and has relatively low spatial resolution. How well tactile signals are perceived depends strongly on factors such as where on the body stimulation is applied, which receptors are involved, and the specific stimulus parameters that are used [13,14]. Because of this, changes in physical properties like amplitude or frequency do not always lead to clear perceptual differences. These constraints make it important to empirically test which tactile signal properties can be reliably distinguished, especially in the context of tactile interfaces and sensory substitution devices [3].
From a psychological perspective, the present study falls within experimental research on tactile perception and psychophysics, examining how physical properties of vibrotactile stimulation influence perceptual discrimination under controlled conditions. The present study focuses on basic stimulus parameters that may support tactile discrimination. By systematically manipulating amplitude and frequency while removing spatial cues, we examine how these parameters contribute to tactile perception and perceptual decision-making.
Among the parameters used in vibrotactile displays, amplitude and frequency are the most common candidates for encoding differential information. Both dimensions are known to influence tactile perception, but whether their perceptual roles can be equated is unknown. Previous work has shown that sensitivity to vibrotactile frequency depends strongly on stimulation site and intensity, and that frequency differences can be difficult to discriminate under certain conditions [14,15]. In contrast, amplitude differences are often perceived more robustly and have been shown to dominate tactile judgments in a range of tasks, including studies using wearable vibrotactile stimulation [16,17]. Pressure and vibration are processed by different but interacting mechanoreceptors: Merkel receptors respond to sustained skin deformation, Meissner corpuscles are sensitive to motion and low-frequency vibration, and Pacinian corpuscles respond most strongly to high-frequency vibration [13,18]. Because vibrotactile stimulation can recruit these receptors simultaneously, amplitude and frequency are not encoded independently in the tactile system [3].
A potential problem in existing work on tactile perception and vibrotactile interfaces is that many studies change several stimulus properties at the same time, such as spatial location, timing, and intensity. This makes it difficult to understand which specific stimulus parameters support perceptual discrimination. In particular, little work has focused on situations where vibrotactile signals are presented sequentially at the same location, removing spatial cues altogether. In these cases, any perceptual difference must be based only on basic stimulus properties such as amplitude and frequency.
Importantly, changes in these basic parameters do not always lead to clearer perception. Previous research has shown that variations in timing or intensity can systematically bias tactile perception, producing mislocalization, illusory motion, or distorted judgments of stimulus order [19]. More recent work has demonstrated that increasing stimulus intensity can also bias perceived spatial order, as the intensity order illusion demonstrates [20]. Together, these findings indicate that tactile perception does not always reflect physical stimulus properties directly; perception is a creation of our neural mechanisms, highlighting the need to empirically test how reliably amplitude and frequency differences can be distinguished under controlled, non-spatial conditions [3].
Current Aims
To address this question, in the present study we examined whether differences in amplitude and frequency provide reliable cues for distinguishing vibrotactile signals when spatial information is unavailable. We also address whether there are any interactions or additive effects between the two types of variation. Vibrotactile stimuli were presented sequentially at the same skin location (the wrist) with Lofelt L5 actuators, using forced choice discrimination. We chose to stimulate a single site to exclusively test the basic stimulus parameters of amplitude and frequency independently of any influences from spatial separation. If amplitude and frequency contribute equally to tactile signal discrimination, then differences along either dimension should support accurate same–different judgments. Alternatively, if one parameter dominates tactile discrimination performance, participant’s performance should depend primarily on that dimension, with little added benefit from changes in the other. By using a same–different two-alternative forced-choice task, this design allows the direct assessment of perceptual separability and potential biases without requiring explicit identification or labeling of signals.
2. Materials and Methods
2.1. Participants
Twelve participants (6 female; age range: 23–46 years, M = 32.2) took part in the experiment. Previous studies have shown that around 12 participants are sufficient for reliable results on vibrotactile perception, in particular when multiple trials are used for each experimental condition. All participants reported normal tactile sensitivity and no known neurological conditions. Participants gave informed consent prior to participation and were naive to the purpose of the study. The study was conducted in accordance with the Declaration of Helsinki and the requirements of the relevant institutional ethics committee.
2.2. Apparatus
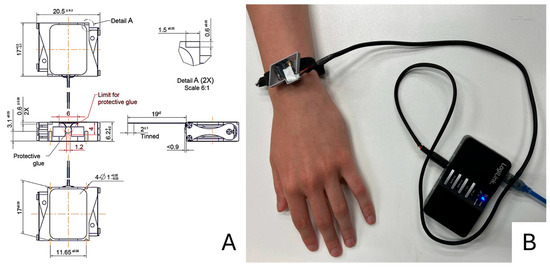
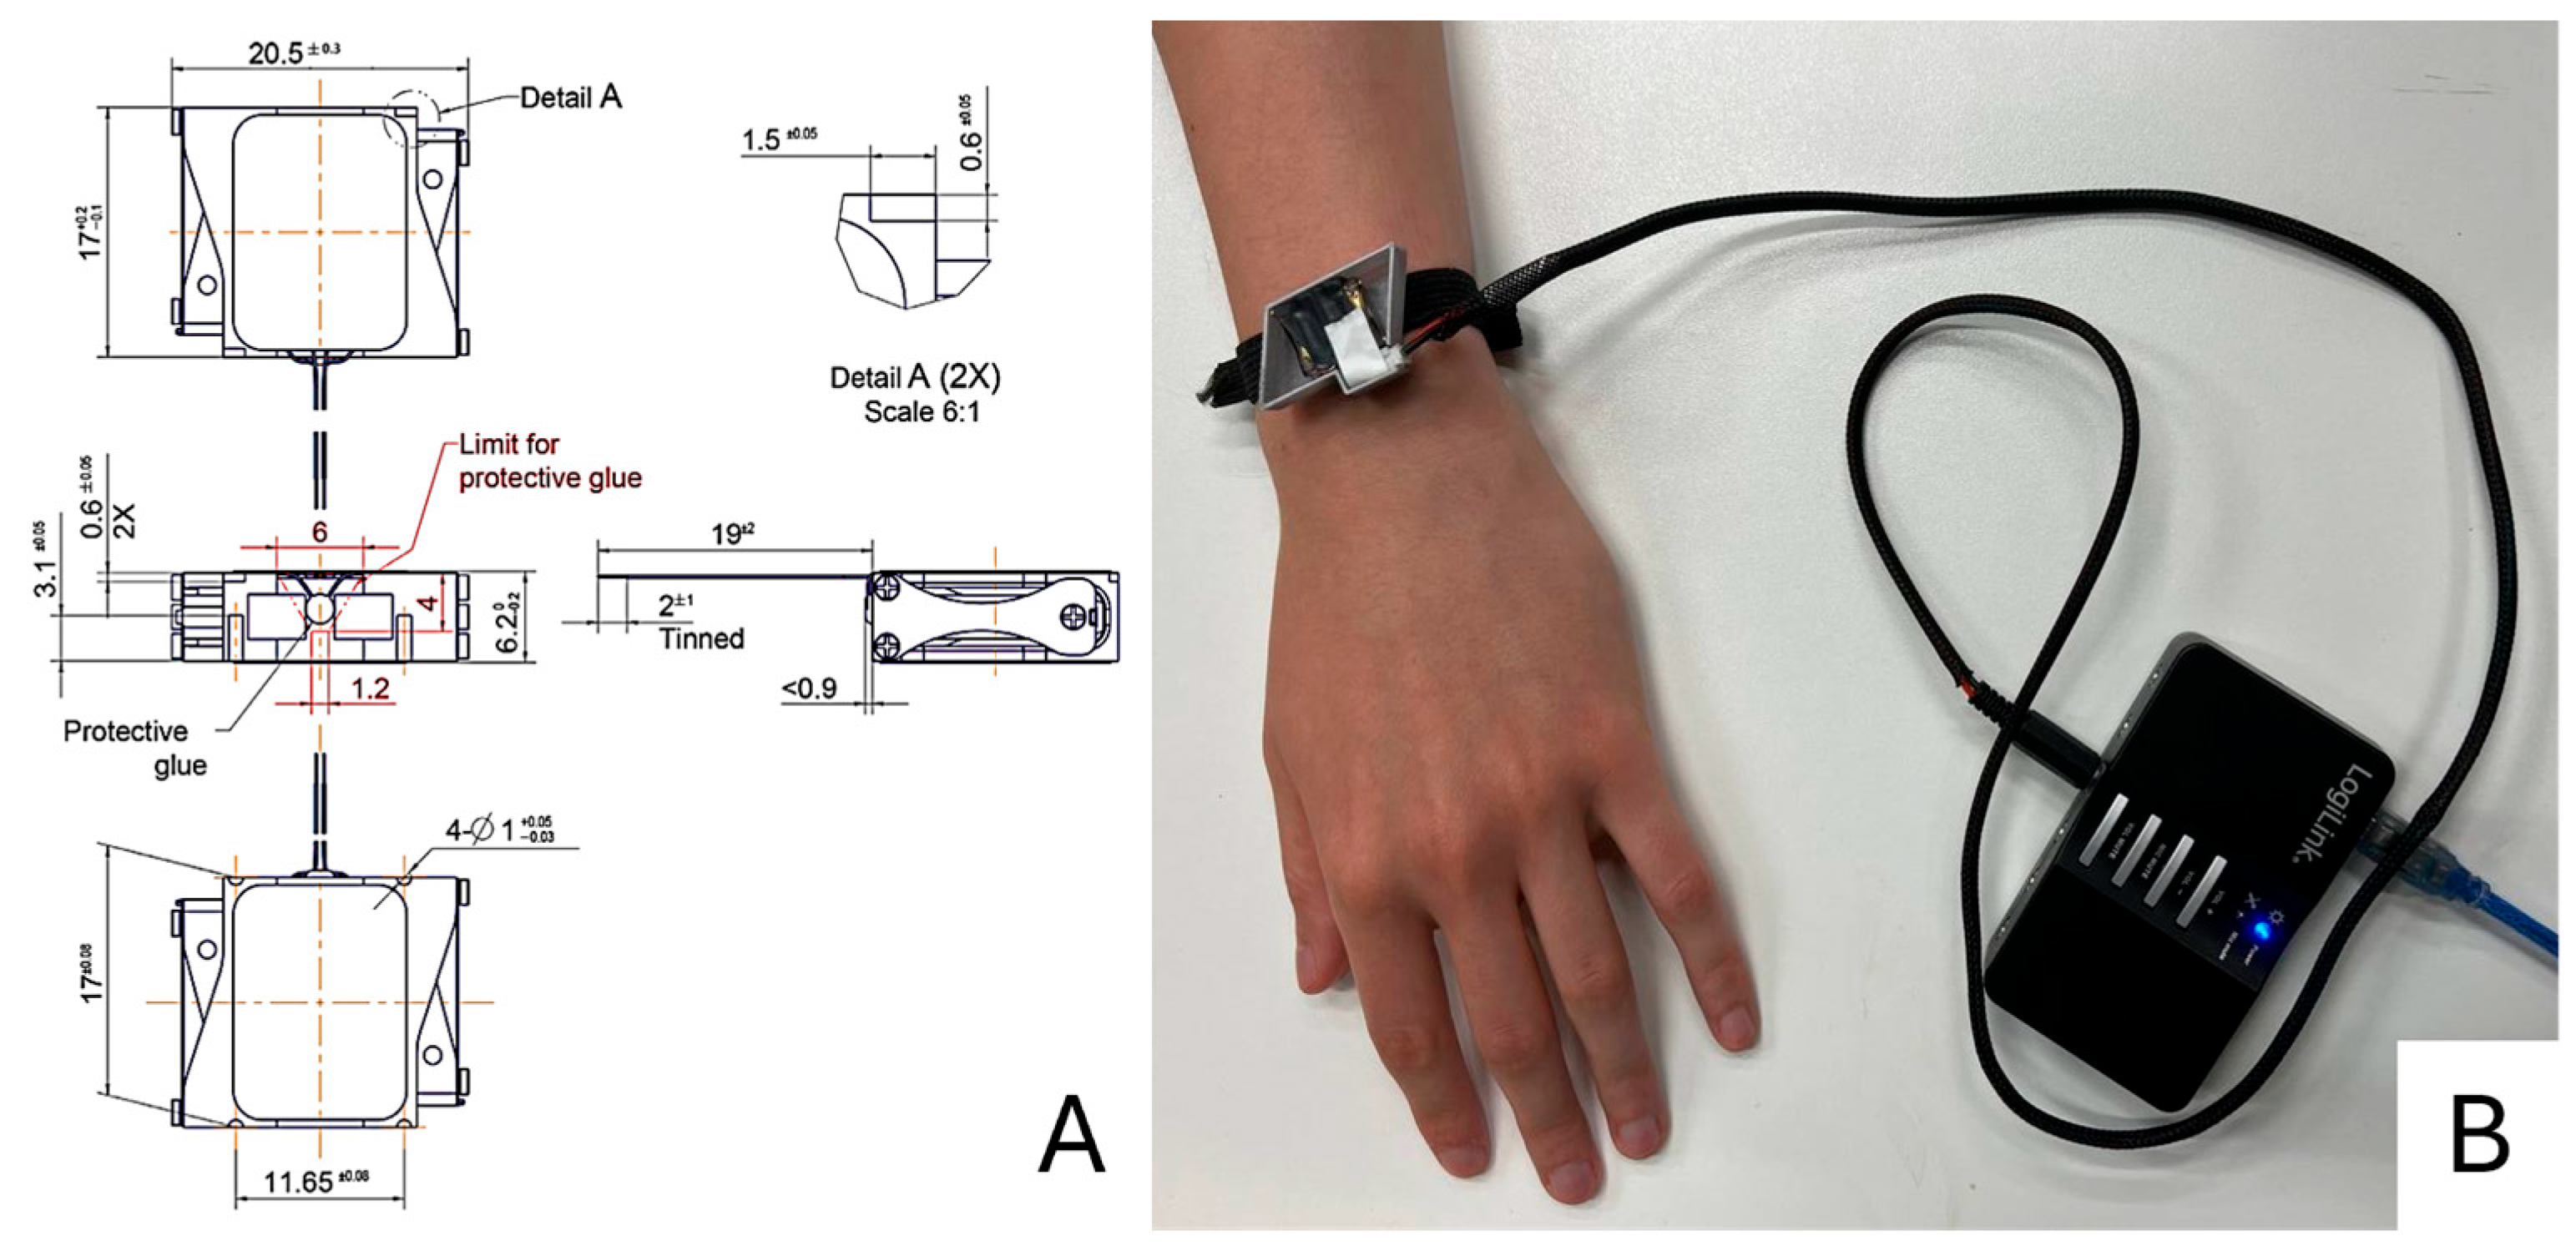
Vibrotactile stimulation was delivered using a custom-made wearable bracelet containing a Lofelt L5 voice-coil actuator [21] (Lofelt L5 Actuator: Lofelt GmbH, Berlin, Germany). The actuator was housed in a 3D-printed plastic casing and positioned flat against the skin to produce back-and-forth vibrations parallel to the skin surface (Figure 1B). A technical drawing of the actuator, including its external dimensions, is shown in Figure 1A. The L5 actuator was selected because it allows precise and independent control of vibration amplitude and frequency, enabling systematic manipulation of these parameters in the present experiment. Voice-coil actuators provide stable output across a broad frequency range relevant for vibrotactile perception (see Table 1), ensuring reliable presentation of the selected stimulus frequencies. Participants wore the bracelet on the wrist of the non-dominant hand, and it remained in a fixed position throughout the experiment. The wrist was chosen as the stimulation site because it is a practical location for wearable vibrotactile interfaces and has been characterized in previous threshold measurements using comparable actuator configurations [16].
Figure 1.
(A) Technical drawing of the Lofelt L5 voice-coil actuator showing external dimensions. (B) Custom-made wearable bracelet with the Lofelt L5 actuator mounted on the wrist, housed in a 3D-printed plastic casing placed flat against the skin and connected to a LogiLink 7.1 channel USB sound box used for stimulus delivery.
Table 1.
Haptic, Electrical and Acoustic Characteristics of Lofelt L5 [21].
The actuator was driven by audio signals generated on a desktop computer and delivered via an external USB sound card (LogiLink 7.1 Channel USB Sound Box: LogiLink, Shenzhen, China). Vibrotactile stimuli were generated as sinusoidal waveforms, allowing precise control over stimulus frequency and amplitude. All stimuli were presented through the same actuator to ensure that no spatial cues were available. Full technical specifications of the actuator including electrical and mechanical characteristics, are provided in Table 1.
2.3. Stimuli
The vibrotactile stimuli consisted of sinusoidal vibrations that varied in amplitude and frequency. Two amplitude levels (50% and 100%) were defined relative to the normalized peak amplitude of the sinusoidal digital drive signal (range 0–1) generated in Python 3.13.5 prior to digital-to-analog conversion and amplification by the actuator driver. Thus, 100% corresponded to the maximum digital output level used in the experiment, and 50% corresponded to half of this peak value. Two frequency levels (125 Hz and 250 Hz) were selected based on previous psychophysical measurements demonstrating peak vibrotactile sensitivity within approximately 100–275 Hz at the wrist [16]. Similar frequency ranges have also been successfully employed in prior studies from our research group investigating vibrotactile perception and related perceptual phenomena [20]. The two amplitude levels were chosen to provide a clearly perceivable intensity difference while maintaining a simple and controlled comparison between amplitude- and frequency-based discrimination. The combination of two amplitude and two frequency levels resulted in four distinct stimulus conditions (Table 2). For convenience, these stimuli are referred to as A–D, where A and B represent the lower amplitude, C and D the higher amplitude, and frequencies were either 125 Hz (A and C) or 250 Hz (B and D).
Table 2.
The different experimental conditions.
Stimulus generation and presentation were controlled using custom-written software. Amplitude and frequency were precisely specified at the signal generation stage, and the same waveform parameters were used across all trials and participants.
To prevent any potential auditory cues from the vibration of the L5 actuators, participants wore closed-back headphones that delivered continuous white noise throughout the experiment (approximately 60 dB SPL, comfortable listening level). The noise level was adjusted individually to ensure masking of any audible mechanical sound from the actuator. Participants confirmed that they could not hear the actuator during stimulation.
2.4. Procedure
Participants were seated comfortably in a quiet testing room during the experiment, wearing headphones playing continuous white noise throughout the session. Each trial consisted of two vibrotactile stimuli presented sequentially at the same skin location. Each stimulus was presented for 500 ms, separated by an inter-stimulus interval (ISI) of 200 ms. A stimulus duration of 500 ms was chosen to ensure clear perception while minimizing potential adaptation or temporal overlap effects. The ISI of 200 ms was selected to provide clear temporal separation between the two stimuli while keeping them within a short comparison window suitable for sequential discrimination. All stimuli were delivered through the same actuator, ensuring that no spatial information was available for discrimination.
Participants performed a same–different 2AFC discrimination task. At the beginning of the experiment, they were given clear written and verbal instructions explaining the task and the response mapping. They were instructed to indicate whether the two vibrations on each trial were the same or different, and to respond as accurately as possible. Responses were made using a keyboard, and both accuracy and reaction time were recorded.
Before the main experiment, participants completed a short practice block consisting of five trials, which provided feedback to ensure that participants understood the task and response mappings. The practice block was followed by the experimental block, which consisted of 200 trials presented in randomized order. The order of stimulus conditions was randomized across trials to minimize potential order effects such as learning, adaptation, or expectation biases. Feedback was presented in the practice trials.
The experiment took approximately 20–25 min to complete for each participant, including instructions and practice trials. Short pauses were allowed as needed.
2.5. Data Analysis
Accuracy and reaction time (RT) were recorded on each trial. Accuracy was defined as the proportion of correct same-different responses. RTs were measured from the onset of the response prompt following the second stimulus. Trials with no response were excluded from RT analyses but counted as incorrect for accuracy. Practice trials were excluded from all analyses.
Since our analyses revealed that the order of stimulus presentation (e.g., A_B vs. B_A) did not affect performance, the data were collapsed across the two possible orders, and analyses were performed on unordered stimulus pairs. For each participant, mean accuracy was calculated separately for each unordered pair.
To test whether discrimination performance was above chance, one-sample t-tests compared accuracy for each stimulus pair against chance level (0.5). Holm corrections were applied to control for multiple comparisons. Differences in performance across stimulus pairs were examined using repeated-measures analyses of variance (ANOVAs), with Greenhouse–Geisser corrections to the degrees of freedom applied when the sphericity violations were detected. Post hoc comparisons were adjusted using Holm correction.
To examine the relative roles of amplitude and frequency, additional repeated-measures ANOVAs were conducted with the factors Amplitude (same vs. different) and Frequency (same vs. different). Additional analyses grouped stimulus pairs into three categories: amplitude-only, frequency-only, and both.
Signal detection measures (d′ and response criterion c) were calculated across all trials to provide an overall measure of discrimination sensitivity and response bias. These measures were collapsed across conditions because the main analyses focused on differences in accuracy across stimulus pairs and conditions.
RT analyses were conducted alongside accuracy analyses but did not reveal any additional effects and are therefore not reported further.
All statistical analyses were conducted using standard parametric tests with a significance threshold (alpha) of p < 0.05. Data analysis was performed in RStudio (version 2025.09.0, Build 387), using the rstatix, ez, and tidyverse packages [22,23,24,25].
3. Results
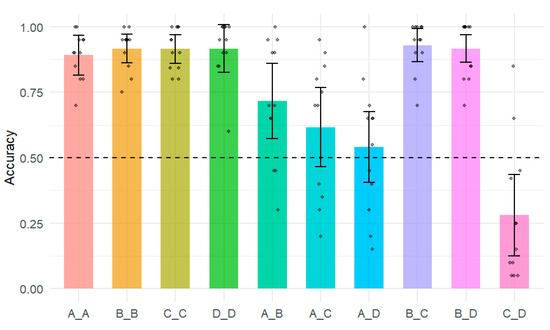
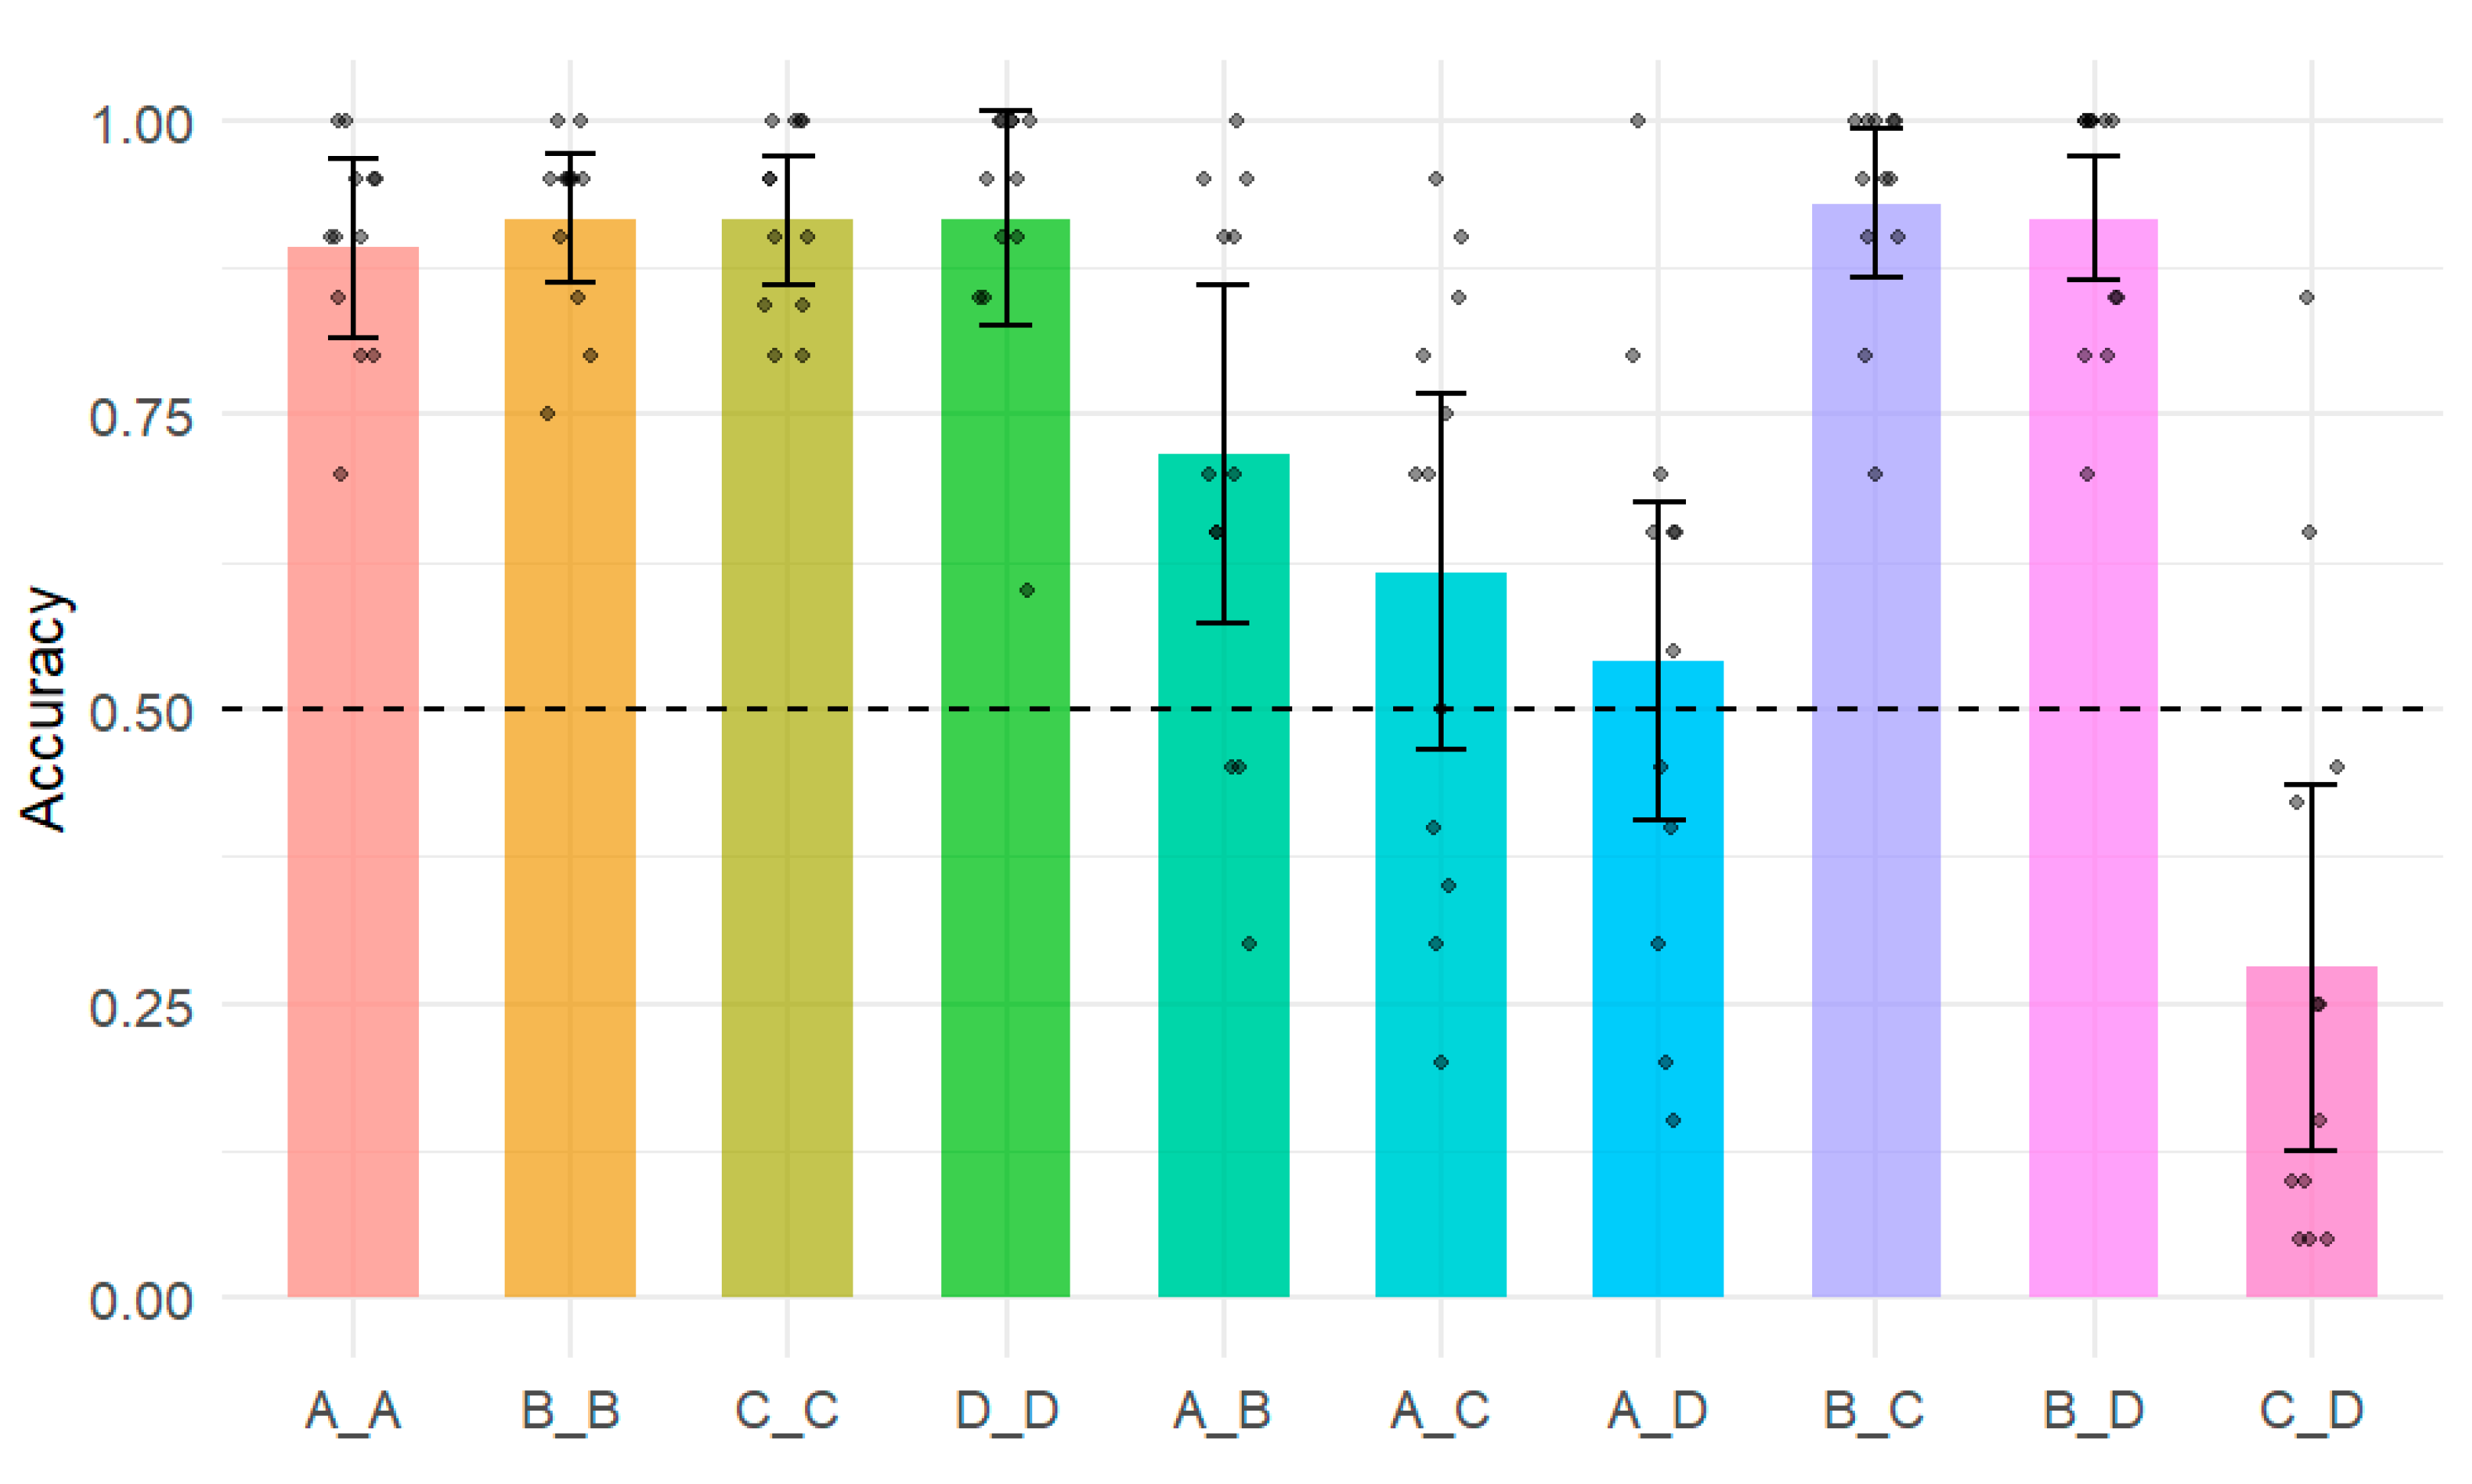
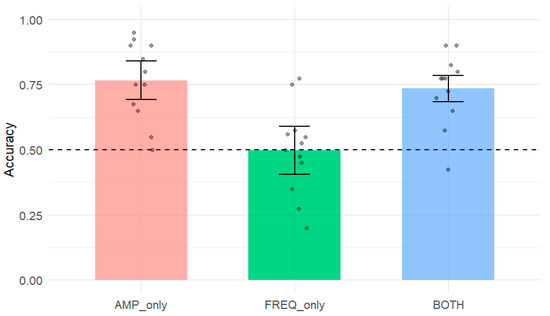
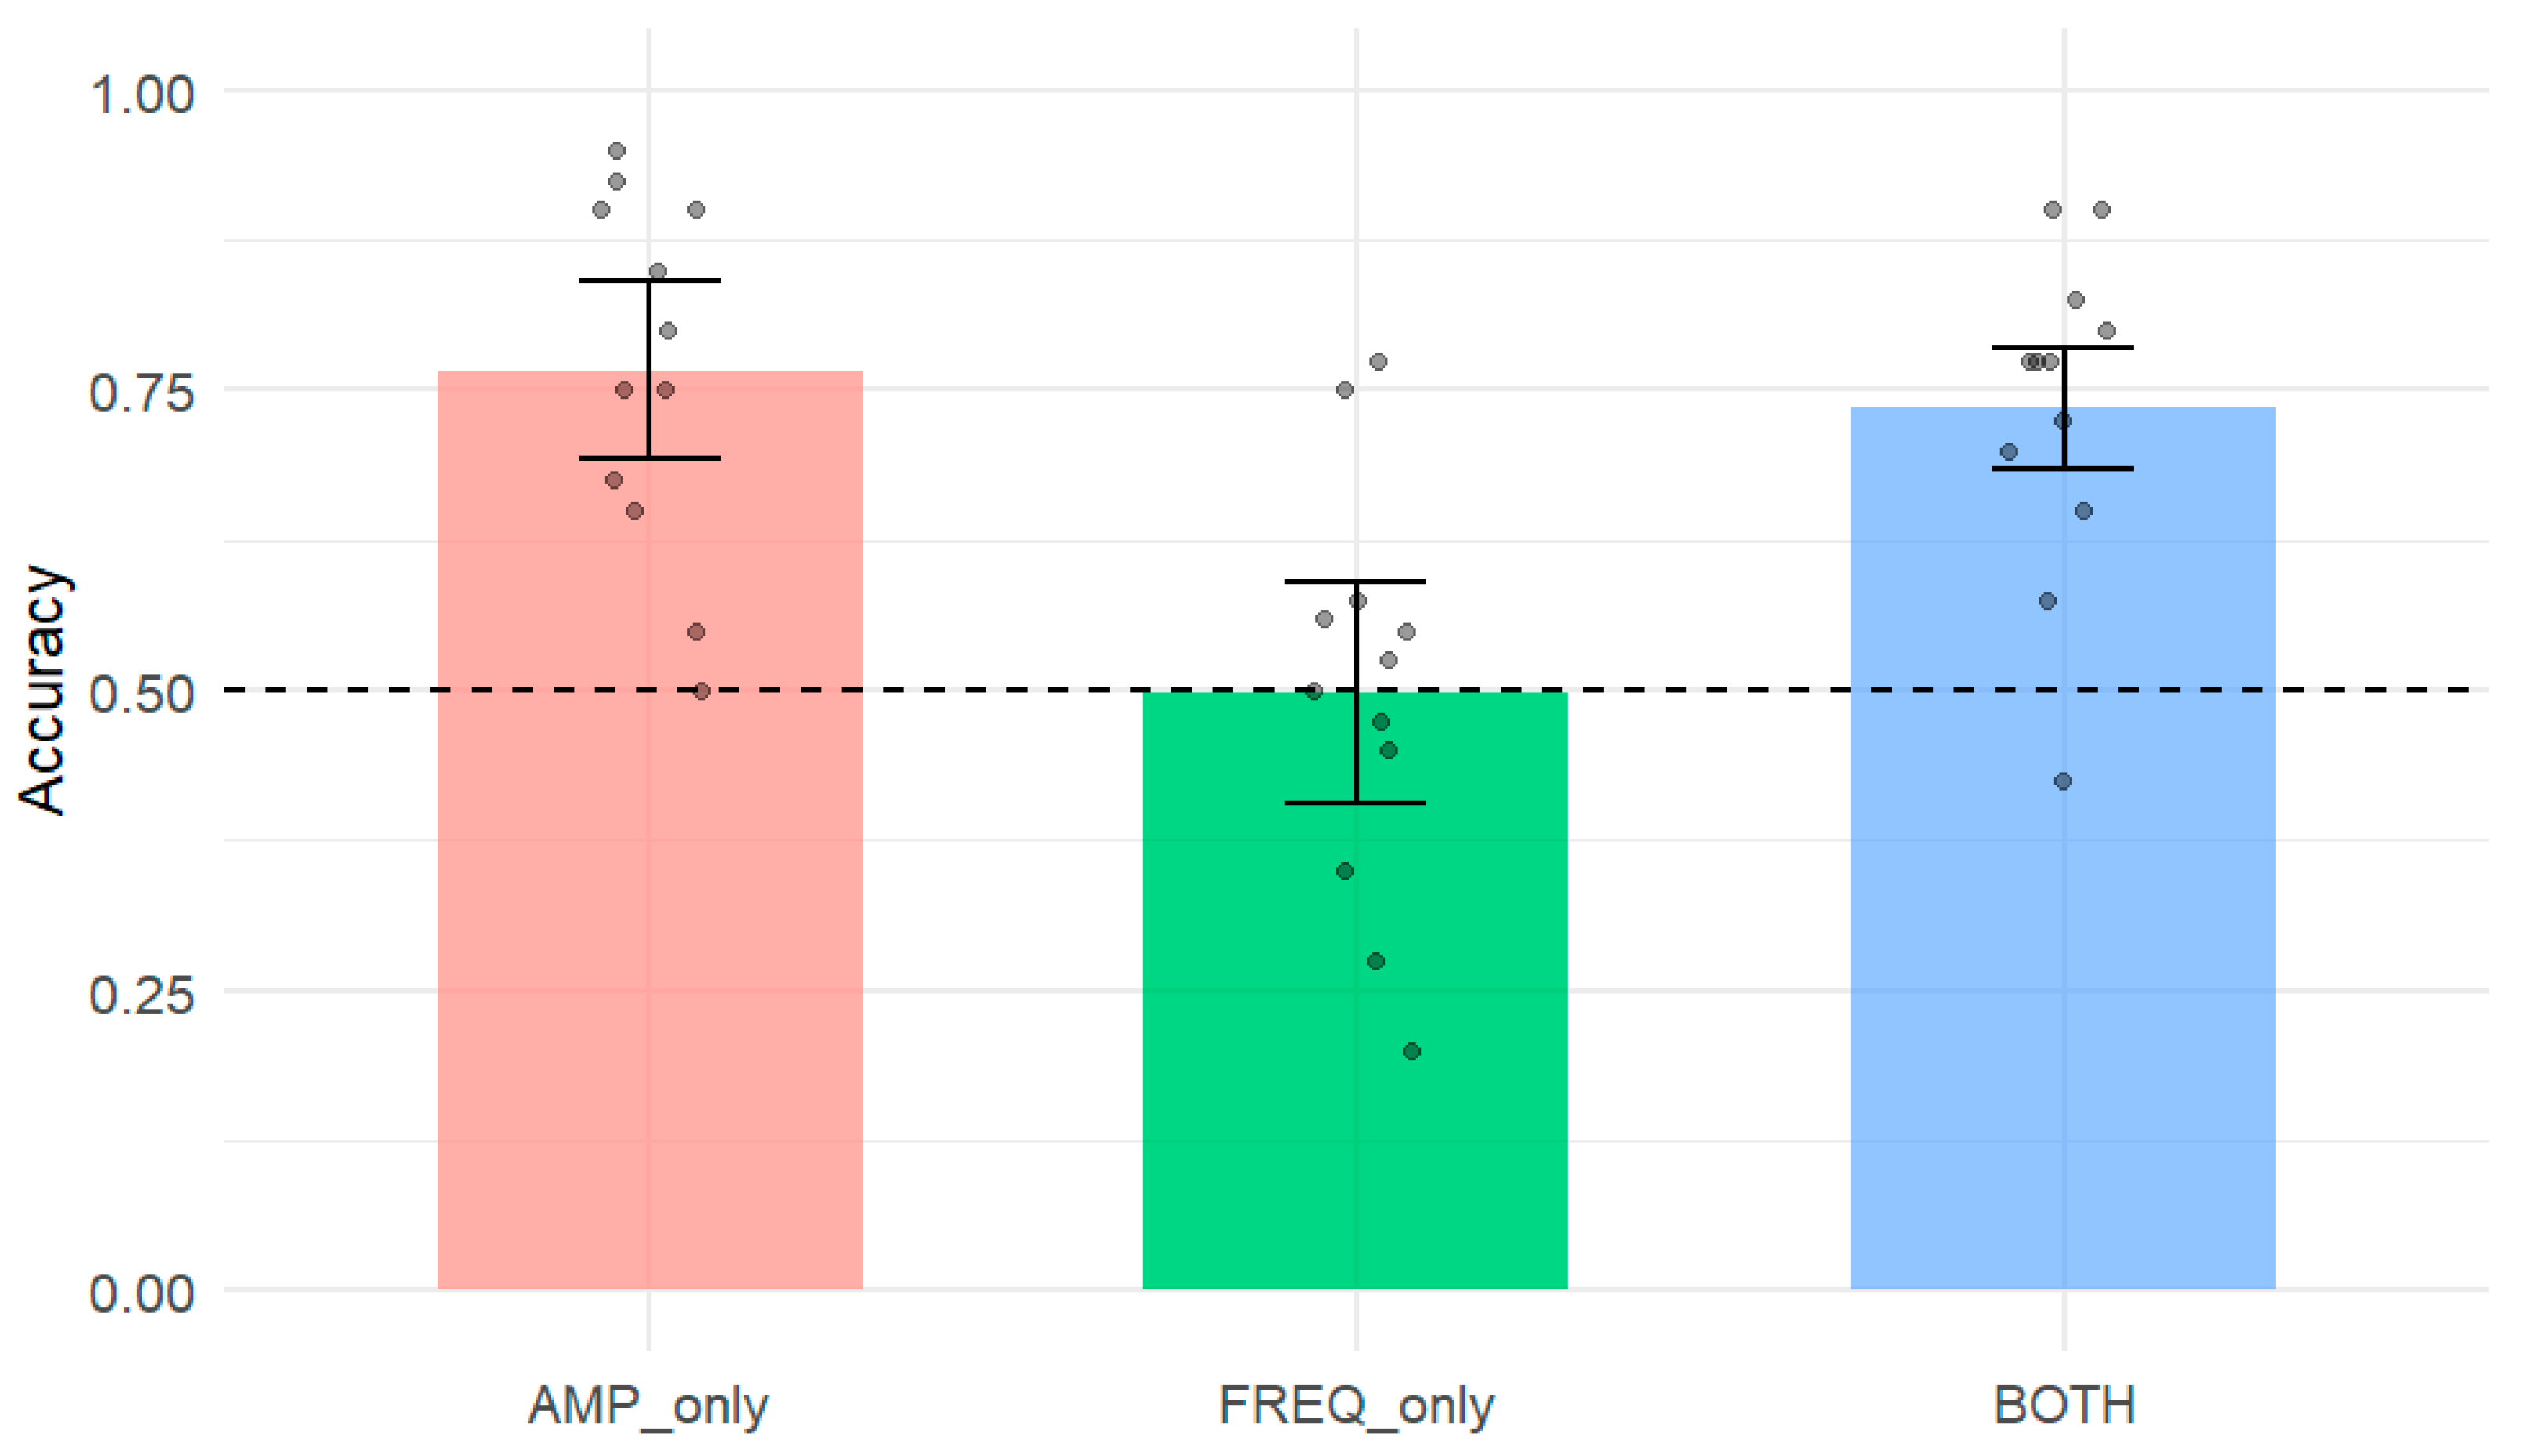
The results are summarised in Figure 2, Figure 3 and Figure 4. Figure 2 shows mean accuracy for all ten unordered stimulus pairs (A_A, B_B, C_C, D_D, A_B, A_C, A_D, B_C, B_D, C_D) with within-subject confidence intervals and individual participant data. Figure 5 shows accuracy grouped by change type (AMP_only, FREQ_only, BOTH).
Figure 2.
Mean accuracy for each unordered stimulus pair (A_A, B_B, C_C, D_D, A_B, A_C, A_D, B_C, B_D, C_D). Bars show mean accuracy across participants; error bars represent within-subject 95% confidence intervals. Jittered dots show accuracy for individual participants. The horizontal dashed line marks chance level (0.5).
Figure 3.
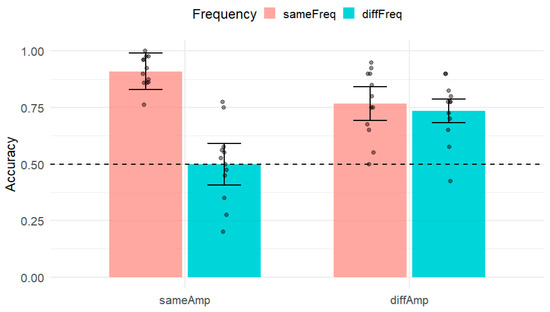
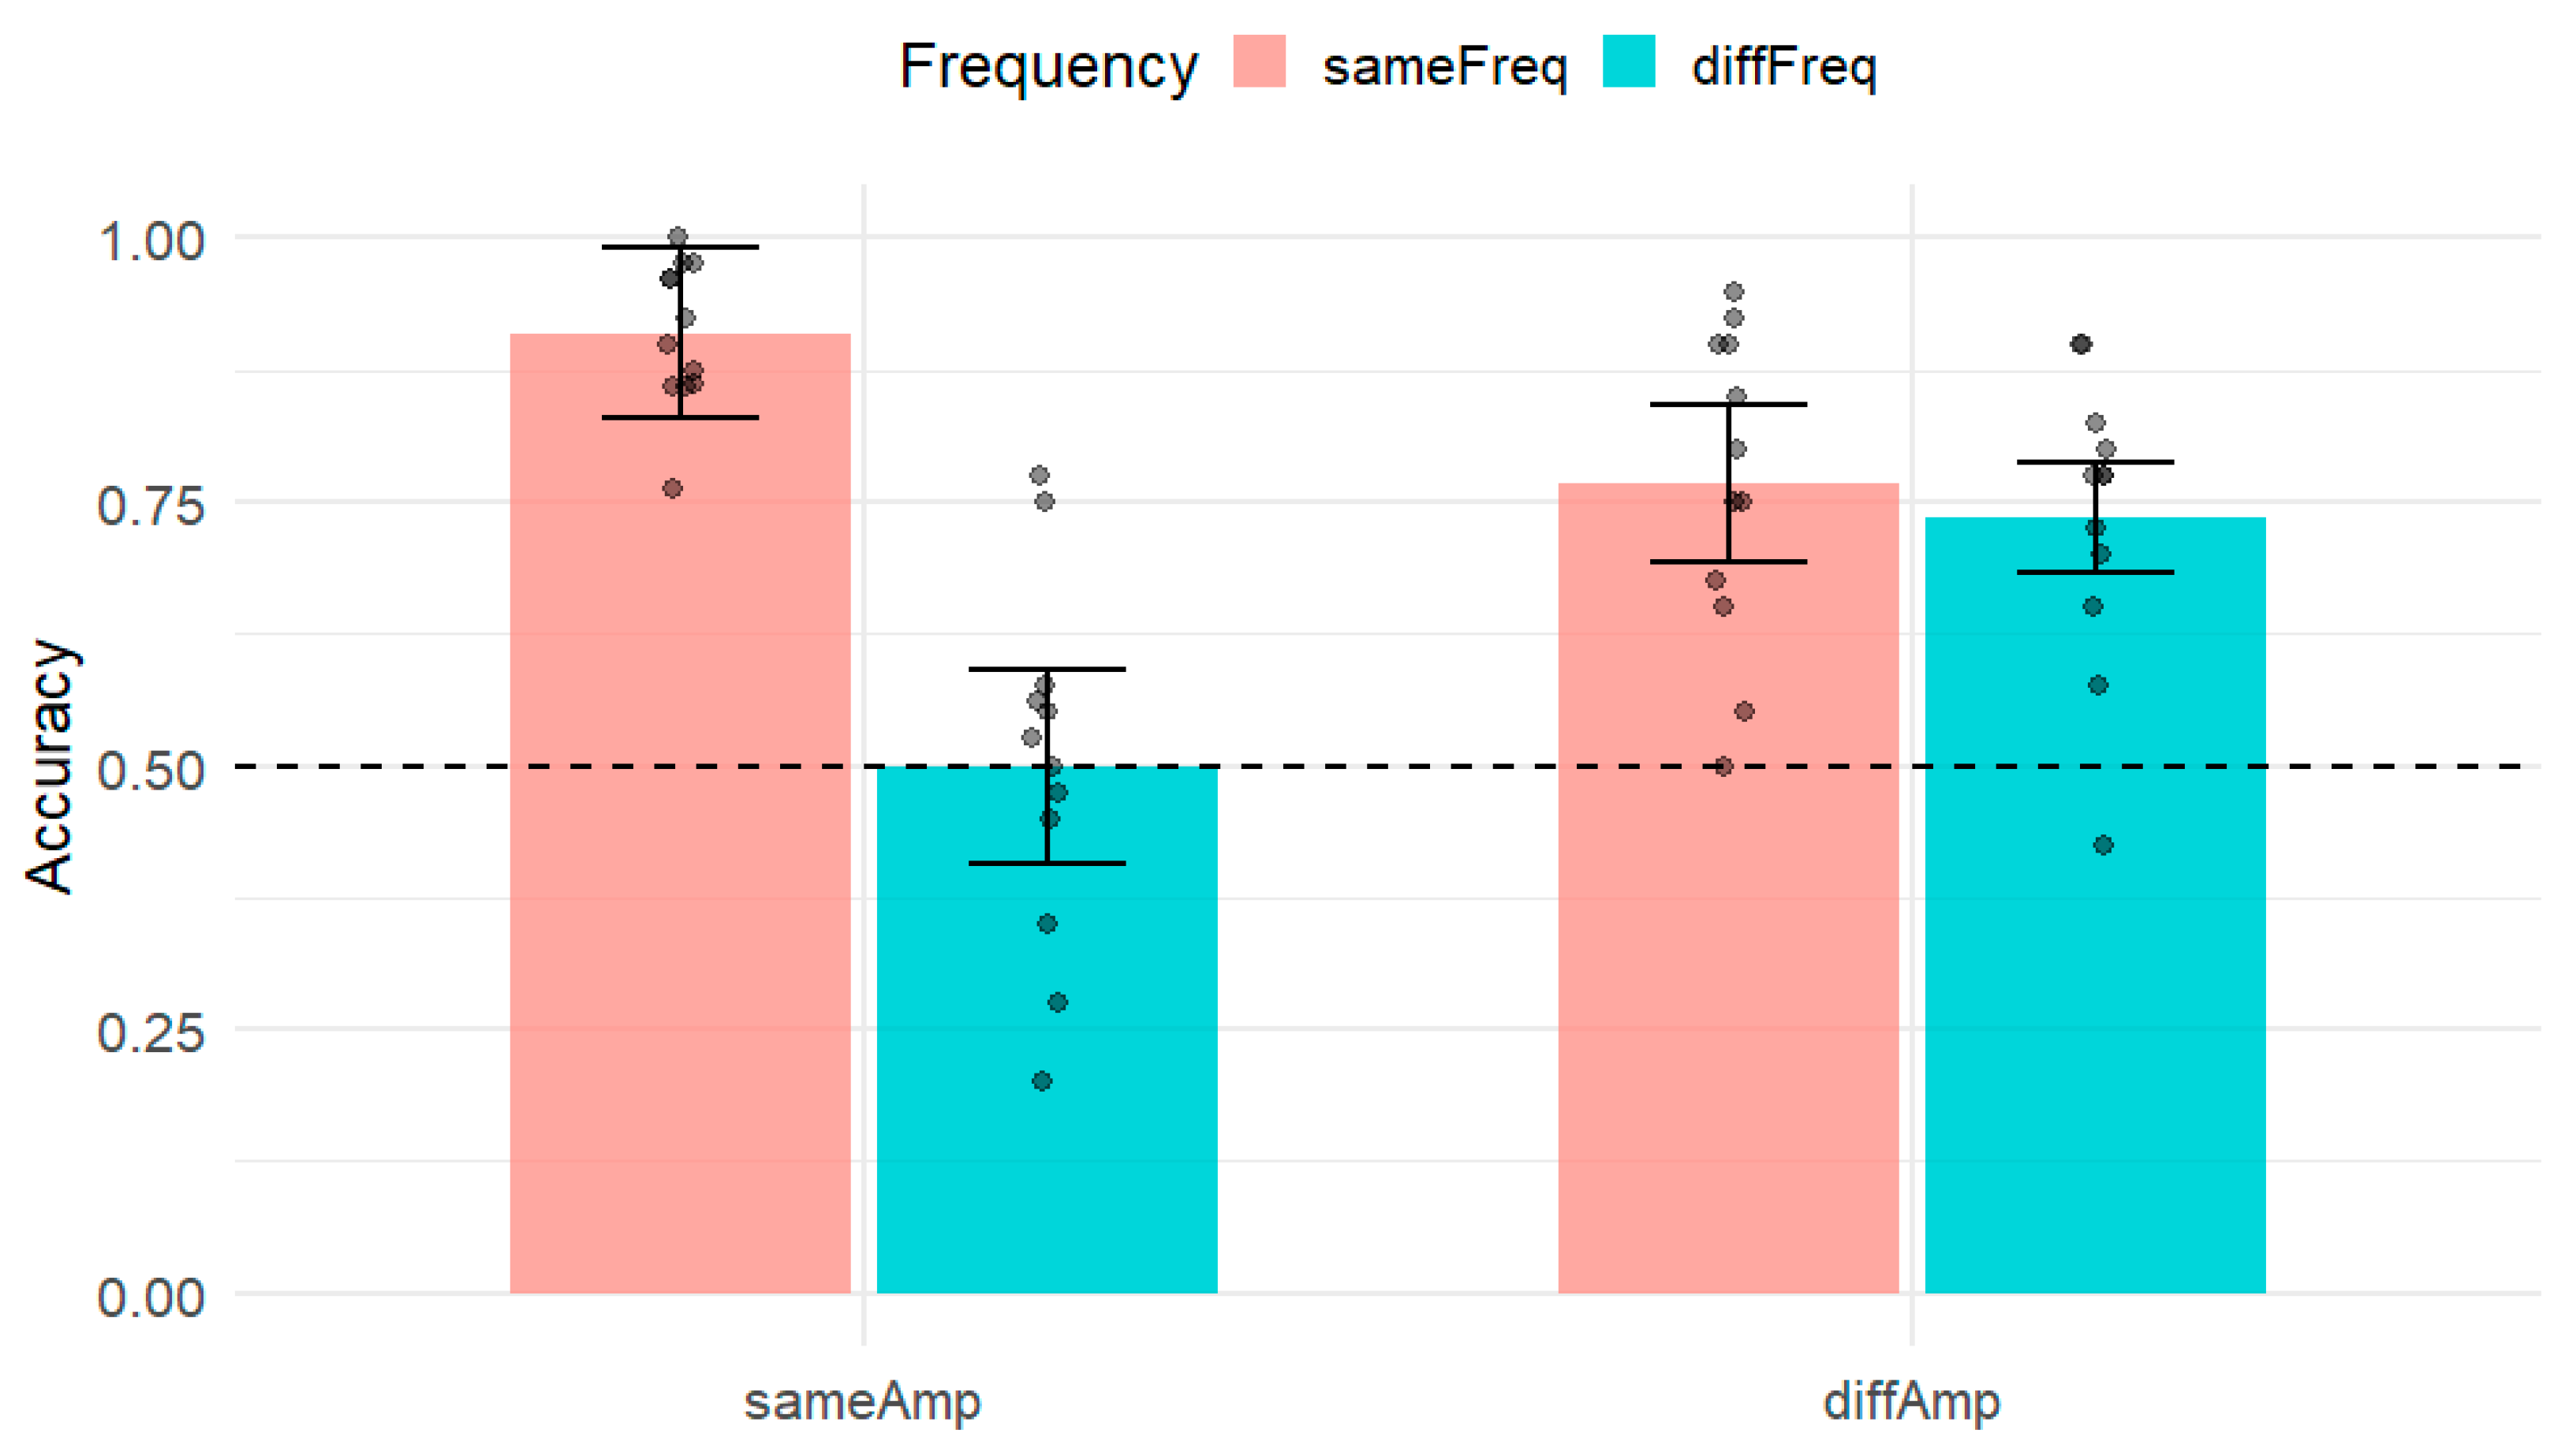
2 × 2 accuracy by Amplitude (x-axis: sameAmp, diffAmp) and Frequency (fill: sameFreq, diffFreq). Bars show means; error bars depict within-subject 95% CIs; jittered black dots show individual participants. Dashed line marks chance (0.5).
Figure 4.
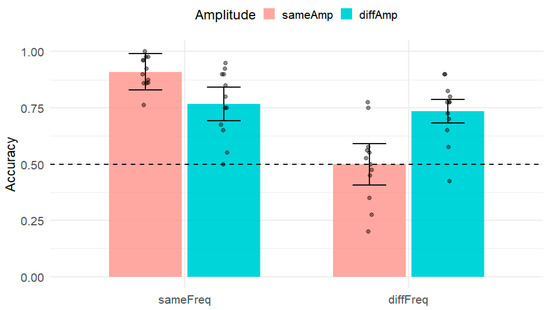
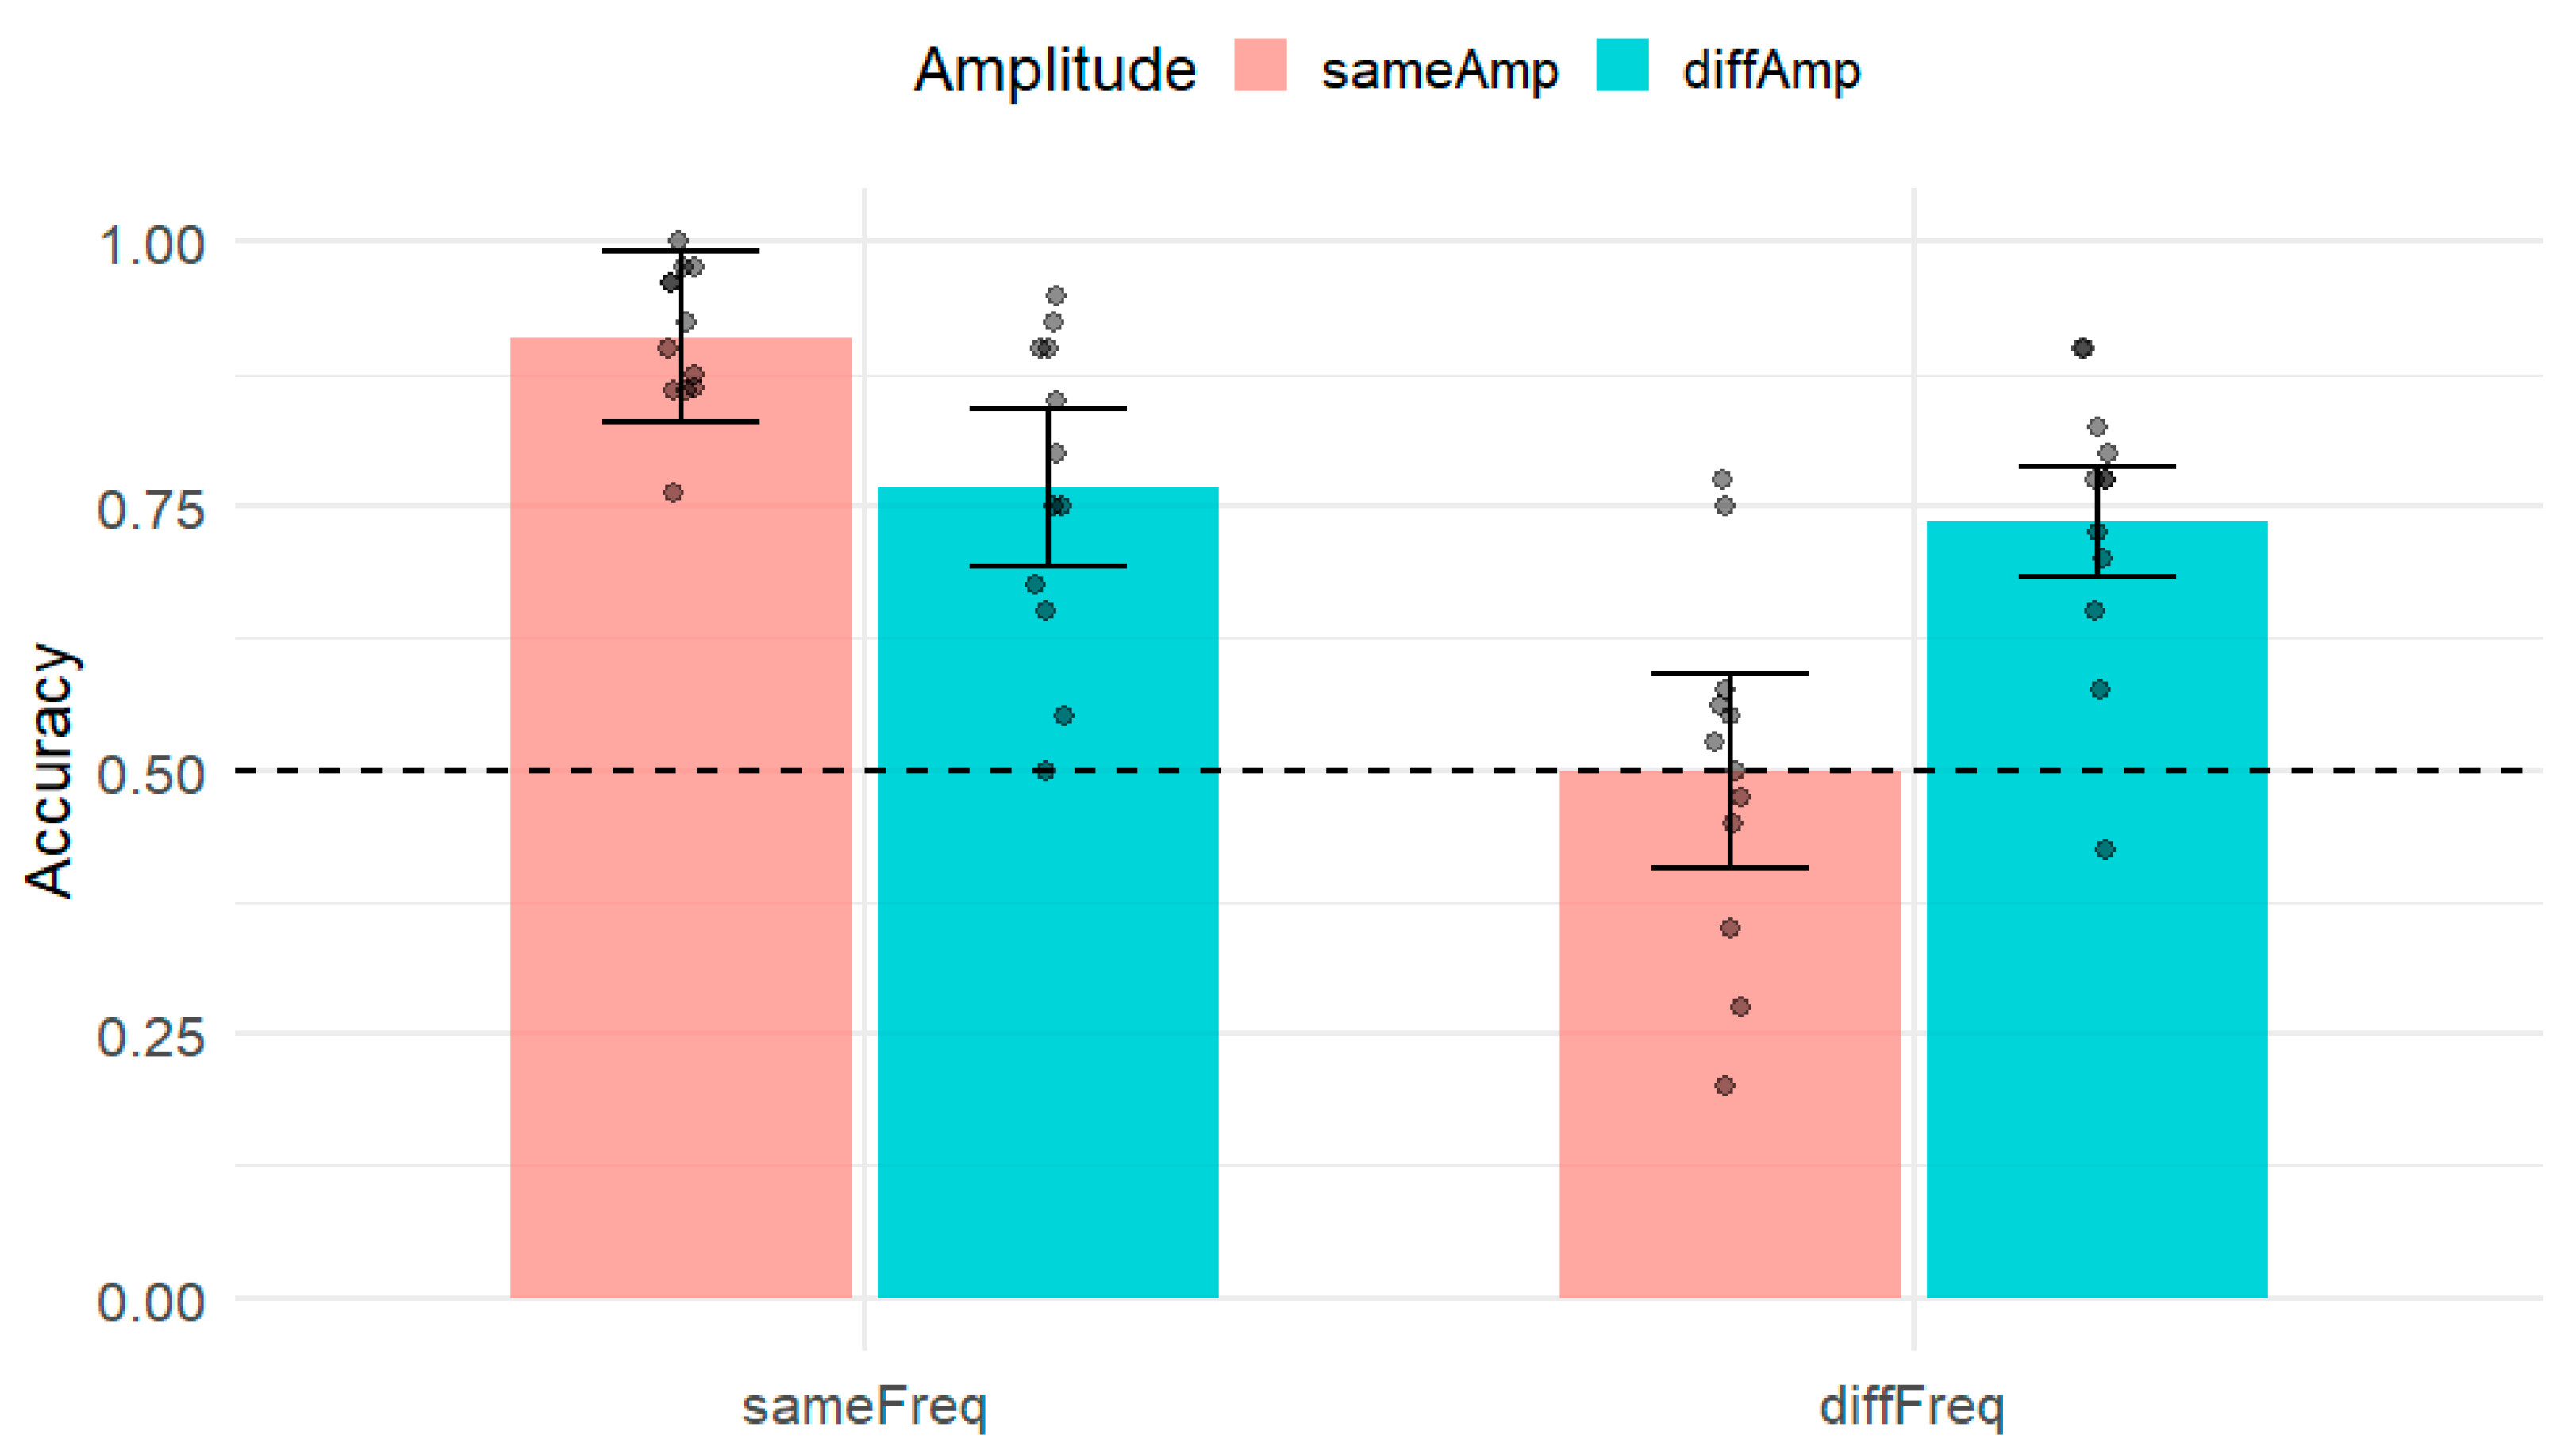
2 × 2 accuracy by Frequency (x-axis: sameFreq, diffFreq) and Amplitude (fill: sameAmp, diffAmp). Bars show means; error bars depict within-subject 95% CIs; jittered black dots show individual participants. Dashed line marks chance (0.5).
Figure 5.
Mean accuracy for unordered different pairs grouped by change type (AMP_only, FREQ_only, BOTH). Bars show mean accuracy across participants; error bars represent within-subject 95% confidence intervals. Jittered dots show accuracy for individual participants. The horizontal dashed line marks chance level (0.5).
A signal detection analysis, collapsing across all conditions, revealed high overall sensitivity, d′ = 2.00, with a conservative response criterion, c = 0.47, indicating a tendency to respond “same” more often than “different” despite a higher proportion of different trials.
3.1. Order Effects
The first set of analyses examined whether the order of the two vibrations in a pair influenced discrimination accuracy. For each unordered pair (A_B, A_C, A_D, B_C, B_D, C_D), paired t-tests compared accuracy for the two possible orders (e.g., A_B vs. B_A).
None of the six paired comparisons showed a reliable order effect t(11) = 1.88, p > 0.05, (Holm-corrections for multiple comparisons were used). To further confirm this result, a 2 (direction: forward, reverse) × 6 (pair: A_B, A_C, A_D, B_C, B_D, C_D) repeated-measures ANOVA on accuracy was conducted. This analysis revealed a strong main effect of pair, F(5, 55) = 19.37, p < 0.001, η2 = 0.51, but no main effect of direction, F(1, 11) = 1.40, p = 0.26, η2 = 0.00, and no pair × direction interaction, F(5, 55) = 1.35, p = 0.26, η2 = 0.02.
Because the order of presentation did not influence performance, subsequent analyses were conducted on unordered pairs, collapsing across the two orders (e.g., A_B and B_A combined into A_B).
3.2. Discrimination Performance Relative to Chance and Pairwise Differences
For each participant, mean accuracy was computed for each unordered pair (A_A, B_B, C_C, D_D, A_B, A_C, A_D, B_C, B_D, C_D). Accuracy for each pair was compared to chance (0.5) using one-sample t-tests (one-sided, “greater than 0.5”), with Holm correction for ten tests.
All four identical pairs (A_A, B_B, C_C, D_D) were clearly above chance (all p < 0.001), with mean accuracies close to ceiling (=0.89–0.95), indicating that identical vibrations were reliably recognised as “same”.
Most different pairs were also above chance. Pairs with clear amplitude differences (B_C, B_D) showed the highest performance (mean accuracy = 0.92–0.93) and were significantly above chance after correction. Pairs with smaller or mixed differences (A_B, A_C, A_D) showed intermediate performance (mean accuracy = 0.55–0.75), with evidence for above-chance accuracy for A_B and A_C.
The high-amplitude frequency pair C_D (100% amplitude, 125 vs. 250 Hz) produced performance close to or below chance level (0.28). However, this effect did not survive correction for multiple comparisons and should therefore be interpreted cautiously. The patterns in Figure 2 clearly show that the responses for C_D cluster near or even below chance, indicating that this pure frequency difference at high amplitude was very difficult to discriminate.
To formally compare discrimination across the six different unordered pairs (A_B, A_C, A_D, B_C, B_D, C_D), a one-way repeated-measures ANOVA on accuracy was conducted. The main effect of pair was large and reliable, F(5, 55) = 19.35, p < 0.001, η2 = 0.55 (Greenhouse–Geisser correction was used). Post hoc comparisons with Holm corrections showed that pairs involving a large amplitude difference (particularly B_C and B_D) were significantly better discriminated than pairs relying primarily or exclusively on frequency differences, with C_D consistently among the worst-performing pairs (see Figure 2).
3.3. Relative Contributions of Amplitude and Frequency
A 2 (Amplitude: same vs. different) × 2 (Frequency: same vs. different) repeated-measures ANOVA on accuracy (see Figure 3) showed a significant main effect of frequency, F(1, 11) = 40.35, p < 0.001, generalized η2 = 0.42. Conversely, the main effect of amplitude was not significant, F(1, 11) = 1.41, p = 0.26, η2 = 0.03. In addition, there was a strong interaction effect F(1, 11) = 42.68, p < 0.001, η2 = 0.35. The interaction pattern is straightforward: with the same amplitude, introducing a frequency change reduces accuracy toward chance; with different amplitudes, accuracy remains high and a frequency change provides no additional benefit (see Figure 3).
3.4. Relative Contributions of Amplitude and Frequency (Additional Analysis)
To assess more directly the contribution of amplitude and frequency differences to discrimination performance, unordered pairs of different combinations were grouped into three theoretically defined categories:
- AMP_only: A_C and B_D (amplitude differs; frequency constant);
- FREQ_only: A_B and C_D (frequency differs; amplitude constant;
- BOTH: A_D and B_C (both amplitude and frequency differ).
For each participant, accuracy was averaged across the two pairs in each category, yielding three scores (see Figure 5).
A one-way repeated-measures ANOVA with the factor change type (AMP_only, FREQ_only, BOTH) revealed a strong effect, F(2, 22) = 18.83, p < 0.001, η2 = 0.40 (Greenhouse–Geisser correction was used). Mean accuracy was highest when there was a difference in amplitude (AMP_only and BOTH) and lowest when only frequency differed (FREQ_only).
Planned contrasts tested specific hypotheses about these differences. Holm adjustment was used for every test. Accuracy was higher for AMP_only than for FREQ_only trials, t(11) = 4.53, p = 0.0017. Accuracy was also higher for BOTH than for FREQ_only trials t(11) = 4.94, p = 0.0013. In contrast, there was no difference between the BOTH and AMP_only conditions t(11) = −0.97, p = 0.35.
Overall, the pattern of results indicates that amplitude differences are the primary cue for discriminating between the different vibrotactile signals used in this experiment. Pure frequency differences, especially at high amplitude (C vs. D), produced performance close to or below chance (perhaps due to a conservative response criterion), and adding a frequency change on top of an amplitude change did not yield any additional benefit beyond amplitude changes alone.
4. Discussion
In this study we tested how well vibrotactile signals that differ in amplitude, frequency, or both can be distinguished when they are presented sequentially at the same skin location. The results showed a clear difference between these stimulus dimensions. Signals that differed in amplitude were discriminated accurately, while signals that differed only in frequency were much harder to distinguish and often produced performance close to chance. Adding a frequency difference to an amplitude difference did not improve discrimination beyond amplitude differences alone. Although frequency showed significant effects in the ANOVA, this reflects reduced discrimination accuracy when amplitude was held constant, rather than improved performance. In contrast, amplitude differences reliably supported discrimination, and adding frequency changes on top of amplitude did not improve performance.
These findings are in line with our previous results showing that changes in stimulus amplitude can strongly bias tactile perception. In particular, the intensity order illusion demonstrates that increasing stimulus intensity can distort perceived spatial order rather than improve perceptual accuracy [20]. The present results extend this observation by showing that, even in a simple same-different task without spatial variation, amplitude differences dominate perception while frequency differences alone provide little reliable information. This pattern is consistent with population-coding accounts of tactile intensity, in which perceived magnitude is largely determined by the aggregate response of afferent populations, rendering amplitude cues particularly salient for perceptual judgments [26].
Similar conclusions have been drawn in other work, which has shown that vibrotactile frequency perception depends strongly on stimulation context and intensity, and can be difficult to use as a stable cue for conveying information with vibrotactile stimulation [9]. A recent investigation of perceptual discrimination thresholds for qualitative vibration attributes further demonstrated that frequency- and modulation-based judgments exhibit larger and reference-dependent thresholds compared to amplitude-based discrimination, reinforcing the view that intensity cues provide more stable perceptual anchors in haptic design [10]. Computational analyses of tactile afferent populations further suggest that stimulus information is distributed across afferent classes and that feature-specific encoding depends on population composition and density rather than single-fiber responses alone [27]. Within such population-coding frameworks, amplitude and frequency do not operate as strictly independent channels but interact through class-specific saturation and redundancy patterns.
More generally, the present findings fit with a large body of work showing that tactile perception does not treat all physical stimulus dimensions equally. Changes in stimulus amplitude are closely linked to perceived intensity and are therefore easy to access perceptually. In contrast, frequency perception in touch seems to be less precise and depends on several interacting factors, including stimulus intensity, stimulation site, and the receptor populations at a given site. Previous work has shown that vibrotactile frequency discrimination varies substantially across body locations and task contexts, and that frequency information can become unreliable or ambiguous when presented without spatial cues or when amplitude is high [7,10]. From this perspective, the poor discrimination observed for pure frequency differences in the present study reflects a broader limitation of tactile frequency coding rather than a task-specific effect.
The present findings of robust amplitude-based discrimination alongside comparatively poor frequency discrimination at the wrist can be interpreted in the context of prior work examining vibrotactile perception across body sites and stimulus conditions. Previous studies have shown that frequency discrimination performance is influenced by amplitude-related cues, with performance decreasing when such cues are controlled or equated, suggesting that frequency alone may provide a relatively weak perceptual basis under certain conditions [28]. Differences in discrimination performance across body locations have also been reported, with hairy skin regions such as the forearm typically showing higher frequency discrimination thresholds compared to glabrous fingertip skin [29]. Additional work has demonstrated that vibrotactile discrimination varies across dermatomes and is influenced by temporal presentation, with sequential stimulation typically yielding better performance [30]. Furthermore, discrimination performance has been shown to differ across proximal versus distal body locations, with more proximal sites such as the torso generally associated with reduced perceptual acuity [31]. Together, these findings support the interpretation that the present wrist-based results are consistent with broader patterns of site-dependent vibrotactile sensitivity, particularly under conditions where spatial cues are minimized.
From an engineering perspective, these results indicate that amplitude modulation provides a robust and reliable control dimension for sequential vibrotactile signals without spatial separation, whereas frequency modulation alone offers limited discriminability and should not be relied on as a primary encoding parameter in such designs.
Several limitations should be considered when interpreting these findings. First, the study examined vibrotactile perception at a single stimulation site (the wrist), which was selected due to its relevance for wearable tactile interfaces; however, perceptual performance may differ across other body locations. Second, only two frequency and amplitude levels were tested. While this allowed a controlled comparison with a powerful 2 by 2 design between amplitude- and frequency-based discrimination, it does not represent a full exploration of the broader parameter space. Finally, the stimuli were defined using fixed physical amplitude values rather than perceptually matched intensity levels across frequencies. Because vibrotactile sensitivity varies with frequency, perceived intensity may not have been identical between conditions. This approach reflects typical control strategies in applied vibrotactile interface design, where signals are specified in physical terms; however, future studies could incorporate perceptual calibration procedures to further isolate frequency-specific effects.
5. Conclusions
In summary, the present study shows that amplitude differences reliably support discrimination of vibrotactile signals presented sequentially at the same skin location, whereas frequency differences alone do not reliably support discrimination under the present actuator conditions. Under these non-spatial conditions, frequency variations provided little benefit and might even have interfered with discrimination. Although frequency modulation offers many possibilities for signal design without increasing intensity, these results show that such flexibility does not necessarily translate into perceptually reliable cues. Effective vibrotactile communication should prioritize stimulus dimensions that are perceptually robust, rather than assuming that all physical parameters can be used interchangeably.
Author Contributions
I.M. contributed to methodology, formal analysis, investigation, data collection, software, writing—original draft preparation. R.U. contributed to methodology, writing—review and editing, and supervision. Á.K. contributed to methodology, writing—review and editing, and co-supervision. All authors have read and agreed to the published version of the manuscript.
Funding
This research was funded by The Icelandic Research Fund, IRF, grant no. 2511369-051 and supported by the Technology development fund grant no. 2422920.
Institutional Review Board Statement
The experiments were run in accordance with the requirements of the local ethical committee and in accordance with the Declaration of Helsinki.
Informed Consent Statement
Informed consent was obtained from all subjects involved in the study.
Data Availability Statement
Data available here https://osf.io/tv75j/files/osfstorage (accessed on 9 March 2026).
Conflicts of Interest
The authors declare no conflicts of interest.
References
- Amedi, A.; Stern, W.M.; Camprodon, J.A.; Bermpohl, F.; Merabet, L.; Rotman, S.; Hemond, C.; Meijer, P.; Pascual-Leone, A. Shape Conveyed by Visual-to-Auditory Sensory Substitution Activates the Lateral Occipital Complex. Nat. Neurosci. 2007, 10, 687–689. [Google Scholar] [CrossRef] [Scilit]
- Bach-y-Rita, P.; Kercel, S.W. Sensory Substitution and the Human–Machine Interface. Trends Cogn. Sci. 2003, 7, 541–546. [Google Scholar] [CrossRef] [Scilit]
- Kristjánsson, Á.; Moldoveanu, A.; Jóhannesson, Ó.I.; Balan, O.; Spagnol, S.; Valgeirsdóttir, V.V.; Unnthorsson, R. Designing Sensory-Substitution Devices: Principles, Pitfalls and Potential1. Restor. Neurol. Neurosci. 2016, 34, 769–787. [Google Scholar] [CrossRef] [Scilit]
- Choi, S.; Kuchenbecker, K.J. Vibrotactile Display: Perception, Technology, and Applications. Proc. IEEE 2013, 101, 2093–2104. [Google Scholar] [CrossRef] [Scilit]
- Bach-y-Rita, P.; Collins, C.C.; Saunders, S.A.; White, B.; Scadden, L. Vision Substitution by Tactile Image Projection. Nature 1969, 221, 963–964. [Google Scholar] [CrossRef] [Scilit] [PubMed]
- Kupers, R.; Chebat, D.R.; Madsen, K.H.; Paulson, O.B.; Ptito, M.; Mishkin, M. Neural Correlates of Virtual Route Recognition in Congenital Blindness. Proc. Natl. Acad. Sci. USA 2010, 107, 12716–12721. [Google Scholar] [CrossRef] [Scilit]
- Mountcastle, V.; Steinmetz, M.; Romo, R. Frequency Discrimination in the Sense of Flutter: Psychophysical Measurements Correlated with Postcentral Events in Behaving Monkeys. J. Neurosci. 1990, 10, 3032–3044. [Google Scholar] [CrossRef] [Scilit] [PubMed]
- Ziat, M.; James, J.; Hua, J.; Burgan, T.; Mohamed, M.; Raisamo, R. When Does Movement Help Touch? Interstimulus Separation and Task Difficulty in Vibrotactile Frequency Discrimination. i-Perception 2026, 17, 20416695261416355. [Google Scholar] [CrossRef] [Scilit]
- Romo, R.; Salinas, E. Flutter Discrimination: Neural Codes, Perception, Memory and Decision Making. Nat. Rev. Neurosci. 2003, 4, 203–218. [Google Scholar] [CrossRef] [Scilit] [PubMed]
- Kullukcu, B.; Krautwurm, J.; Merchel, S.; Rosenkranz, R.; Altinsoy, E. Investigating Perceptual Discrimination Thresholds for Attributes of Whole-Body Vibration. Sci. Rep. 2026, 16, 7168. [Google Scholar] [CrossRef] [Scilit]
- Cataldo, A.; Hagura, N.; Hyder, Y.; Haggard, P. Touch Inhibits Touch: Sanshool-Induced Paradoxical Tingling Reveals Perceptual Interaction between Somatosensory Submodalities. Proc. R. Soc. B. 2021, 288, 20202914. [Google Scholar] [CrossRef] [Scilit] [PubMed]
- Tang, X.; Zhang, T.; Sun, J.; Lu, S. Echoes of the Mind’s Eye: Reciprocal Crossmodal Interaction between Auditory and Visual Processing. iScience 2026, 29, 114990. [Google Scholar] [CrossRef] [Scilit] [PubMed]
- Gardner, E.P.; Martin, J.H. Coding of Sensory Information. In Principles of Neural Science; Kandel, E.R., Schwartz, J.H., Jessell, T.M., Eds.; McGraw-Hill: New York, NY, USA, 2013; Volume 574. [Google Scholar]
- Loomis, J.M.; Klatzky, R.L.; Giudice, N.A. Sensory Substitution of Vision: Importance of Perceptual and Cognitive Processing. In Assistive Technology for Blindness and Low Vision; Manduchi, R., Kurniawan, S., Eds.; CRC Press: Boca Raton, FL, USA, 2018; pp. 179–210. ISBN 978-1-315-21693-5. [Google Scholar]
- Gescheider, G.A.; Bolanowski, S.J.; Verrillo, R.T. Some Characteristics of Tactile Channels. Behav. Brain Res. 2004, 148, 35–40. [Google Scholar] [CrossRef] [Scilit] [PubMed]
- Ævarsson, E.A.; Ásgeirsdóttir, T.; Pind, F.; Kristjánsson, Á.; Unnthorsson, R. Vibrotactile Threshold Measurements at the Wrist Using Parallel Vibration Actuators. ACM Trans. Appl. Percept. 2022, 19, 1–11. [Google Scholar] [CrossRef] [Scilit]
- Yeganeh, N.; Makarov, I.; Stefánsson Thors, S.S.; Kristjánsson, Á.; Unnthorsson, R. Evaluating the Optimum Distance between Voice Coil Actuators Using the Relative Point Localization Method on the Forearm. Actuators 2022, 12, 6. [Google Scholar] [CrossRef] [Scilit]
- Yoshioka, T.; Gibb, B.; Dorsch, A.K.; Hsiao, S.S.; Johnson, K.O. Neural Coding Mechanisms Underlying Perceived Roughness of Finely Textured Surfaces. J. Neurosci. 2001, 21, 6905–6916. [Google Scholar] [CrossRef] [Scilit]
- Flach, R.; Haggard, P. The Cutaneous Rabbit Revisited. J. Exp. Psychol. Human Percept. Perform. 2006, 32, 717–732. [Google Scholar] [CrossRef] [Scilit]
- Makarov, I.; Stefánsson Thors, S.S.; Ævarsson, E.A.; Jörgensson, F.K.P.; Yeganeh, N.; Kristjánsson, Á.; Unnthorsson, R. The Haptic Intensity Order Illusion Is Caused by Amplitude Changes. ACM Trans. Appl. Percept. 2024, 21, 1–18. [Google Scholar] [CrossRef] [Scilit]
- Lofelt GmbH Datasheet L5 Voice Coil Actuator; Revision 1.4; Lofelt GmbH: Berlin, Germany, 2019; Available online: https://e2e.ti.com/cfs-file/__key/communityserver-discussions-components-files/6/Lofelt-L5-Actuator-Datasheet.pdf (accessed on 9 March 2026).
- Kassambara, A. Rstatix: Pipe-Friendly Framework for Basic Statistical Tests, version 0.7.2; R Foundation for Statistical Computing: Vienna, Austria, 2021. [Google Scholar]
- Lawrence, M.A. ez: Easy Analysis and Visualization of Factorial Experiments; R Package Version 4.4-0; R Foundation for Statistical Computing: Vienna, Austria, 2016. [Google Scholar]
- RStudio Team. RStudio: Integrated Development for R; RStudio, PBC: Boston, MA, USA, 2020. [Google Scholar]
- Wickham, H.; Averick, M.; Bryan, J.; Chang, W.; McGowan, L.; François, R.; Grolemund, G.; Hayes, A.; Henry, L.; Hester, J.; et al. Welcome to the Tidyverse. J. Open Source Softw. 2019, 4, 1686. [Google Scholar] [CrossRef] [Scilit]
- Bensmaia, S. Tactile Intensity and Population Codes. Behav. Brain Res. 2008, 190, 165–173. [Google Scholar] [CrossRef] [Scilit]
- Corniani, G.; Casal, M.A.; Panzeri, S.; Saal, H.P. Population Coding Strategies in Human Tactile Afferents. PLoS Comput. Biol. 2022, 18, e1010763. [Google Scholar] [CrossRef] [Scilit]
- Harris, J.A.; Arabzadeh, E.; Fairhall, A.L.; Benito, C.; Diamond, M.E. Factors Affecting Frequency Discrimination of Vibrotactile Stimuli: Implications for Cortical Encoding. PLoS ONE 2006, 1, e100. [Google Scholar] [CrossRef] [Scilit] [PubMed]
- Mahns, D.A.; Perkins, N.M.; Sahai, V.; Robinson, L.; Rowe, M.J. Vibrotactile Frequency Discrimination in Human Hairy Skin. J. Neurophysiol. 2006, 95, 1442–1450. [Google Scholar] [CrossRef] [Scilit] [PubMed]
- Shah, V.A.; Casadio, M.; Scheidt, R.A.; Mrotek, L.A. Spatial and Temporal Influences on Discrimination of Vibrotactile Stimuli on the Arm. Exp. Brain Res. 2019, 237, 2075–2086. [Google Scholar] [CrossRef] [Scilit] [PubMed]
- Pomplun, E.; Thomas, A.; Corrigan, E.; Shah, V.A.; Mrotek, L.A.; Scheidt, R.A. Vibrotactile Perception for Sensorimotor Augmentation: Perceptual Discrimination of Vibrotactile Stimuli Induced by Low-Cost Eccentric Rotating Mass Motors at Different Body Locations in Young, Middle-Aged, and Older Adults. Front. Rehabilit. Sci. 2022, 3, 895036. [Google Scholar] [CrossRef] [Scilit]

Disclaimer/Publisher’s Note: The statements, opinions and data contained in all publications are solely those of the individual author(s) and contributor(s) and not of MDPI and/or the editor(s). MDPI and/or the editor(s) disclaim responsibility for any injury to people or property resulting from any ideas, methods, instructions or products referred to in the content. |
© 2026 by the authors. Licensee MDPI, Basel, Switzerland. This article is an open access article distributed under the terms and conditions of the Creative Commons Attribution (CC BY) license.