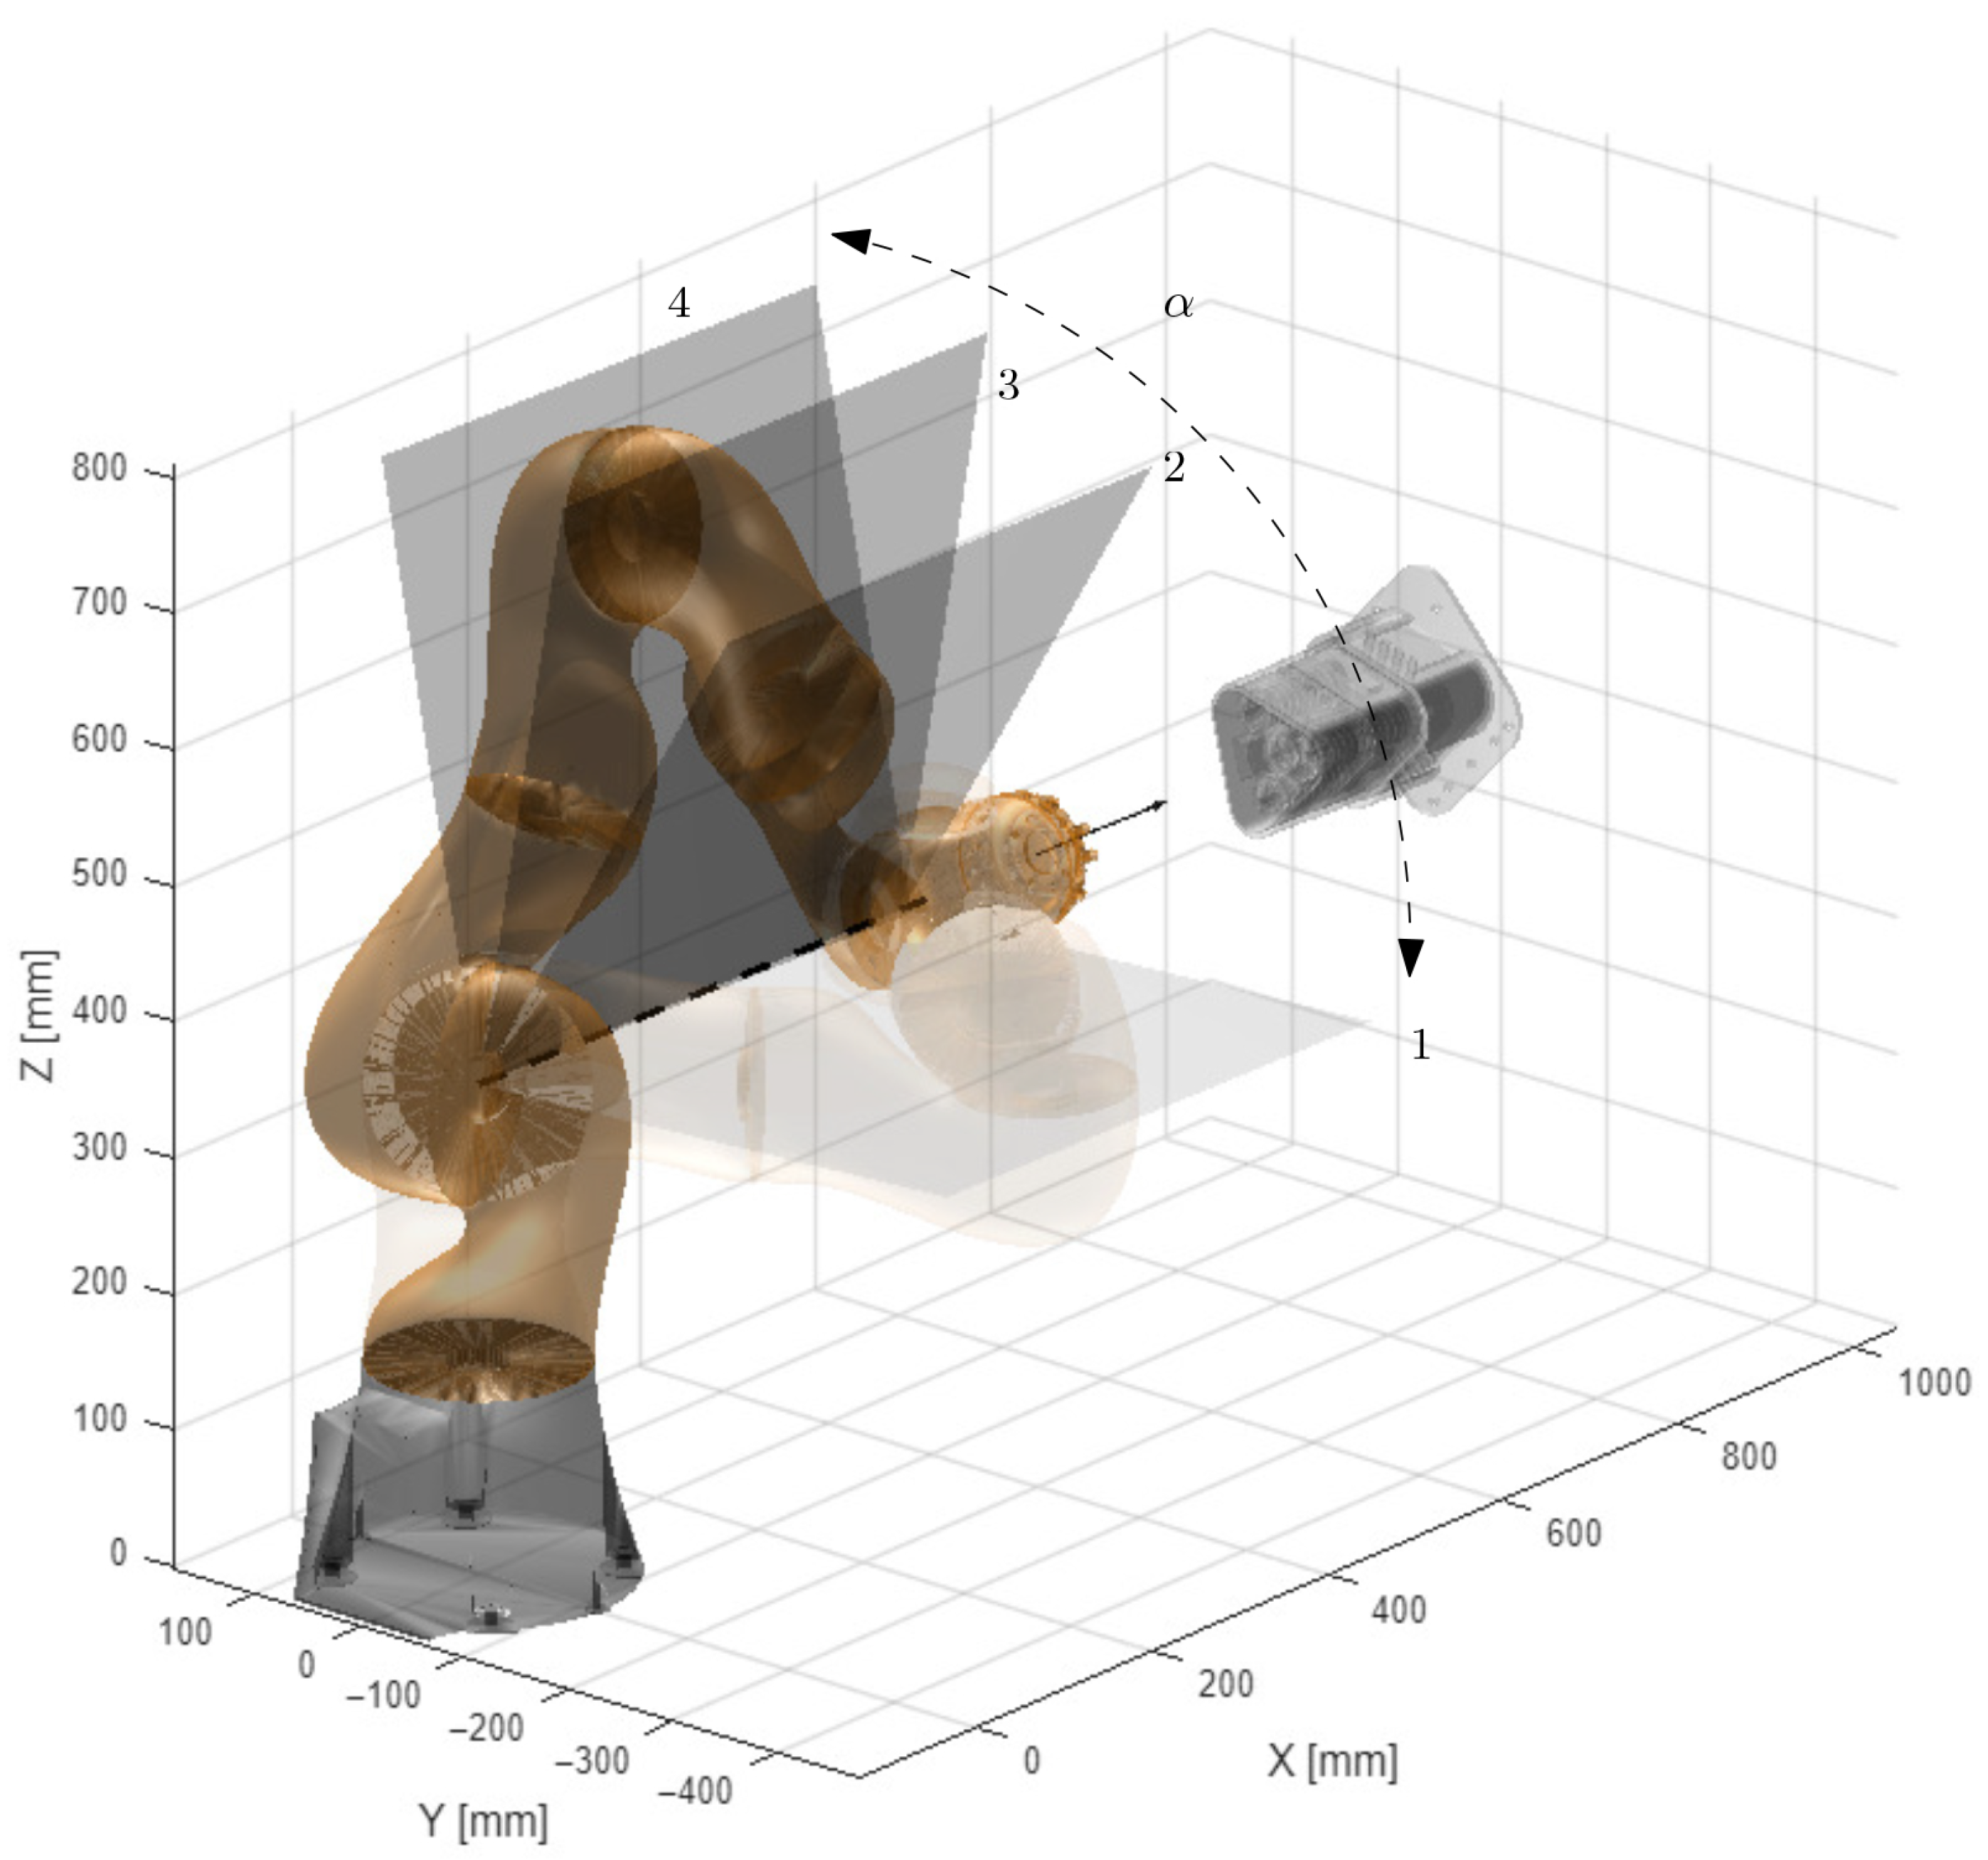
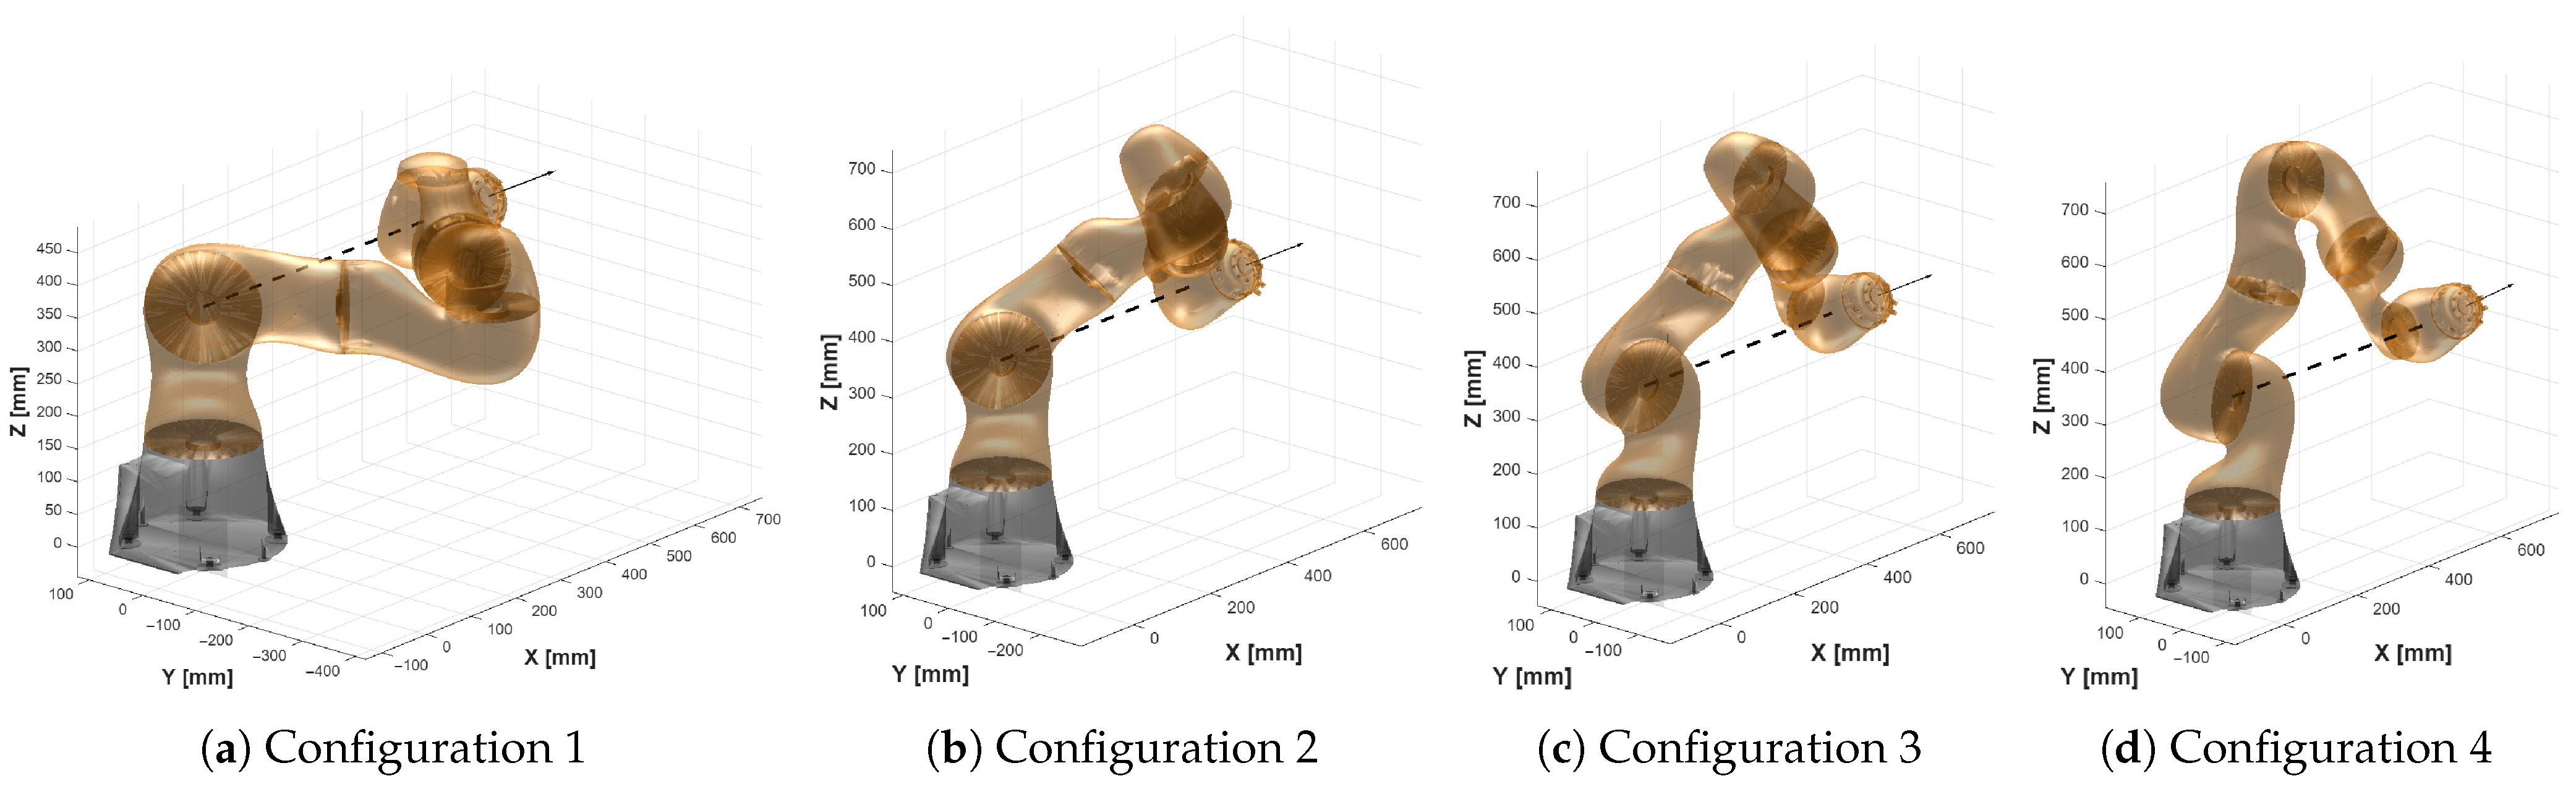
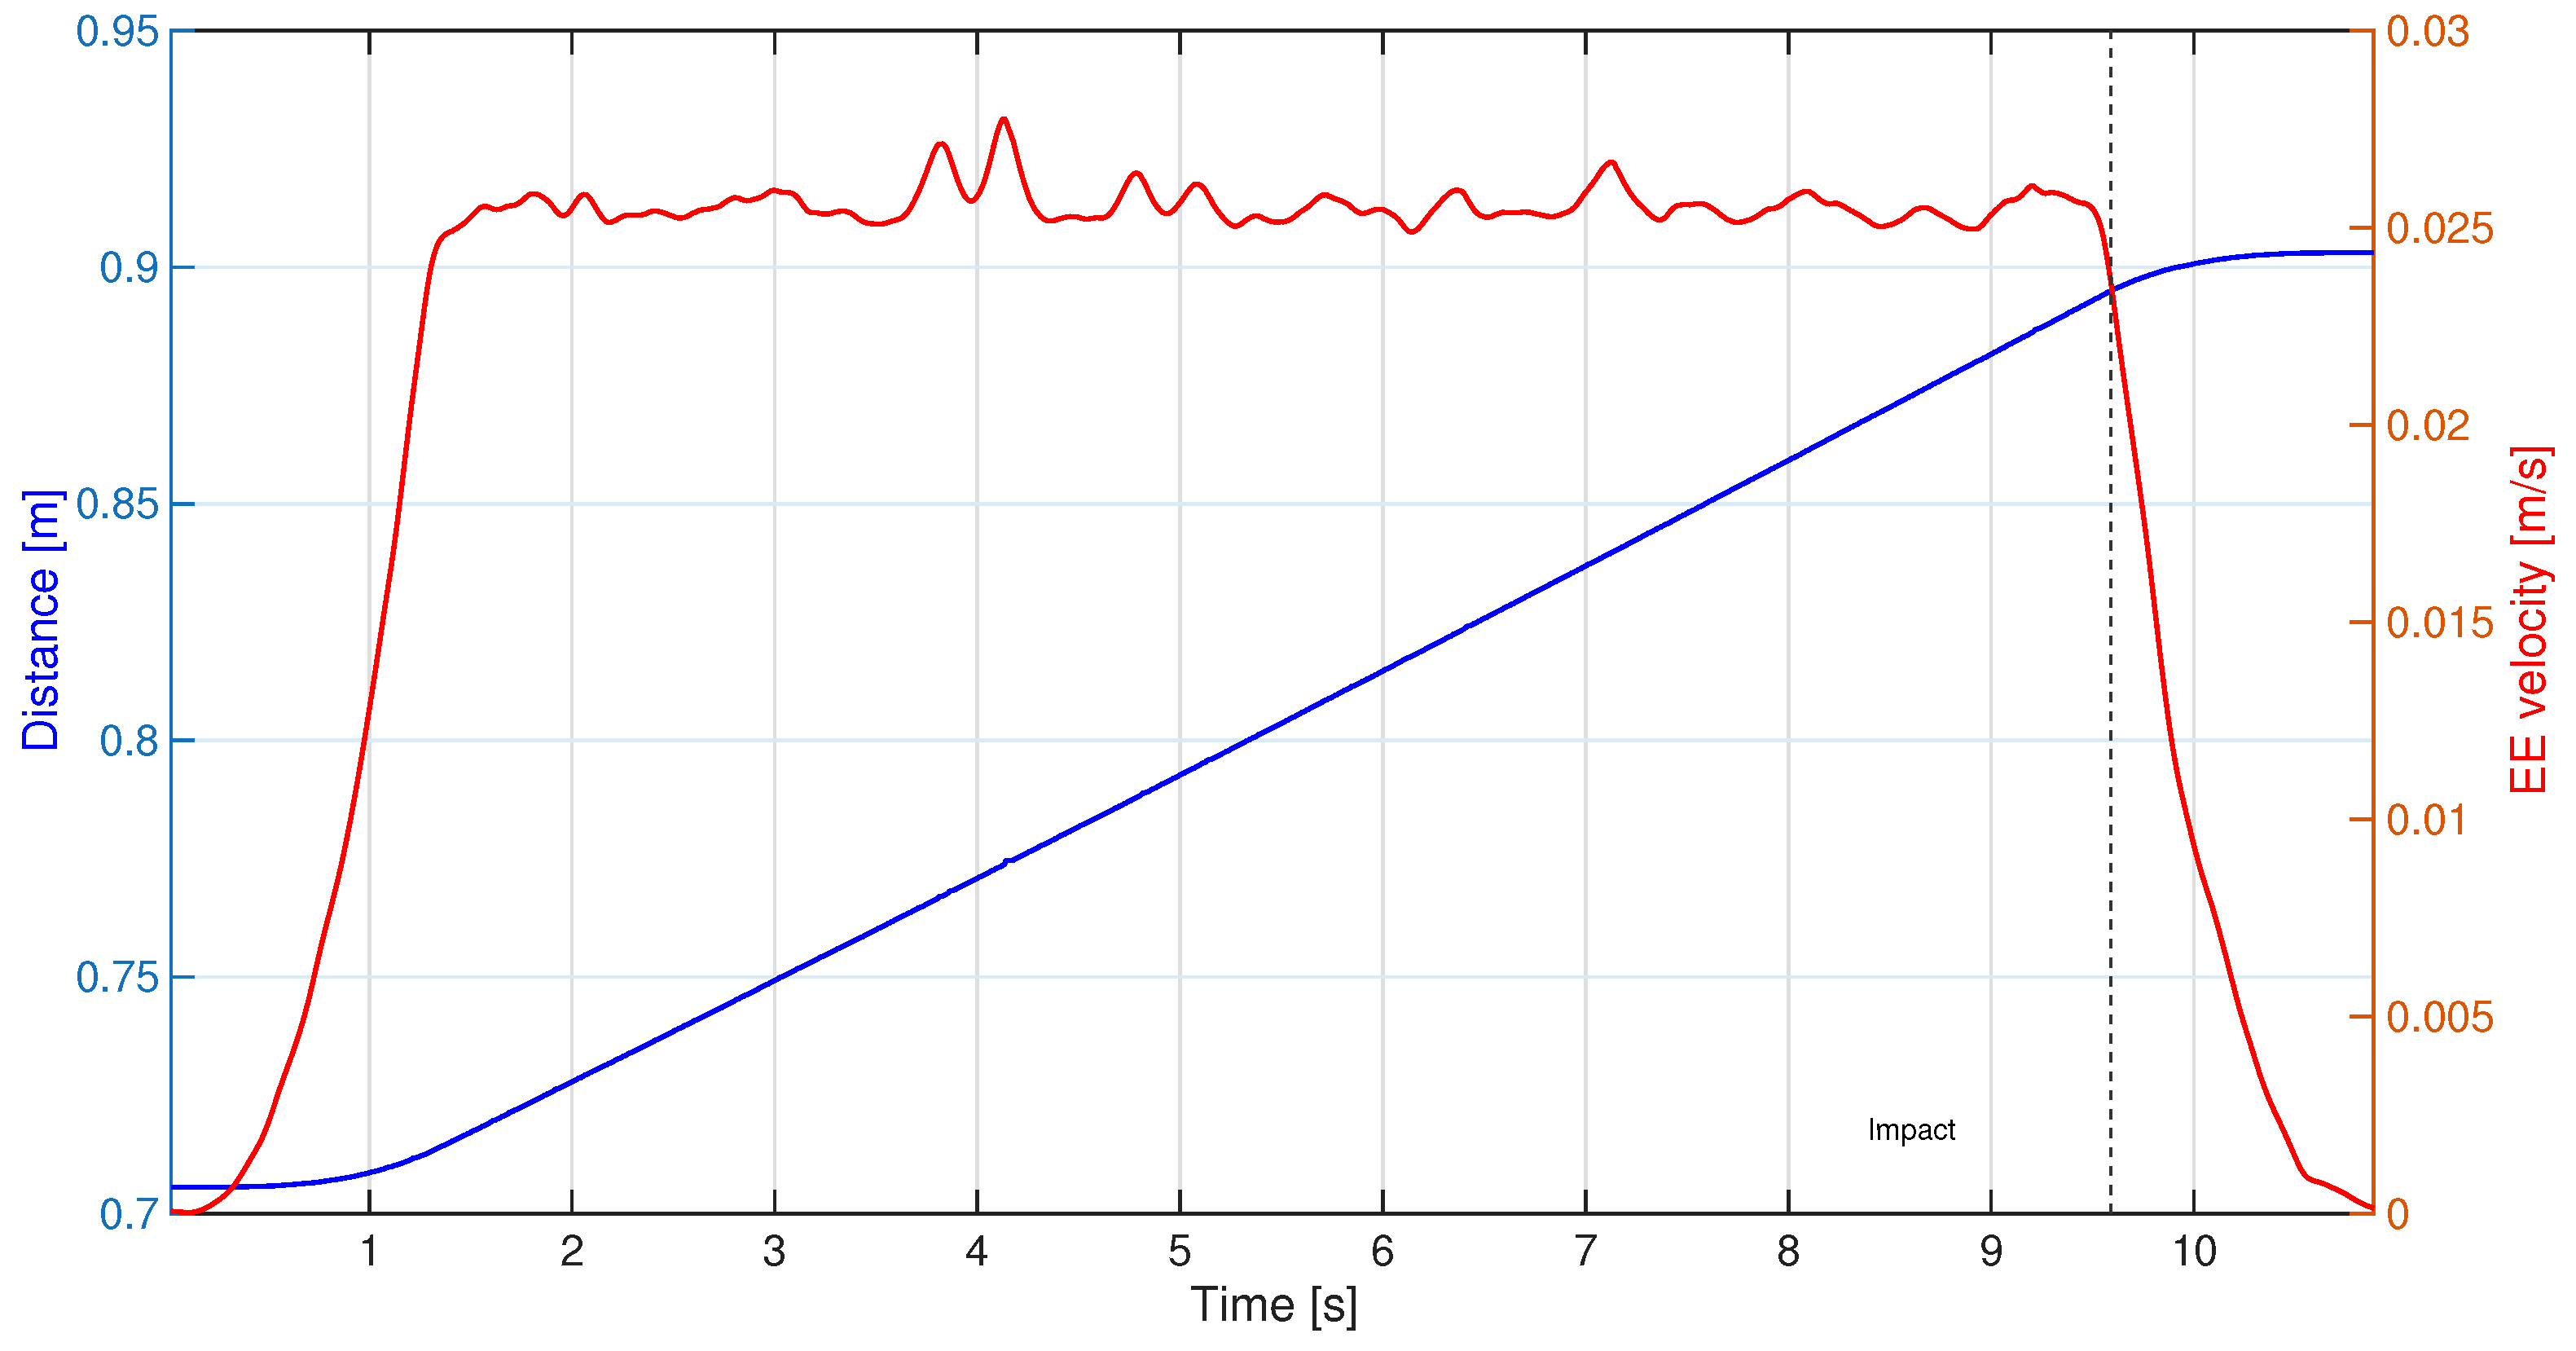
1. Introduction
Human–robot collaboration (HRC) has emerged as a transformative paradigm in manufacturing and industrial environments over the past decade. Driven by increasing demand for flexible, adaptive, and safe robotic systems capable of operating in close proximity to humans [
1], collaborative robots (cobots) have fundamentally altered field of industrial automation; in [
2], main standards were published to guarantee safe human–robot interactions, dividng human–robot co-tasks into three groups: Hand-guided control (HGC), speed and separation monitoring (SSM), and power-force limiting (PFL). Unlike traditional industrial robots confined to protected industrial cells with perimeter fencing, collaborative robots are explicitly designed to share workspaces with human operators, enabling dynamic task allocation and real-time human–robot teaming. However, this physical proximity introduces unprecedented challenges in ensuring safety during both intentional and accidental contacts [
3].
Especially in PFL approach, rather than eliminating human–robot contact, collaborative systems must render such contact inherently safe. This requires a rigorous understanding of contact mechanics, impact dynamics, and the mechanical response of both the robot and the human body. International standards such as ISO/TS 15066:2016 (Robots and Robotic Devices—Collaborative Robots) [
4], and ISO 10218-2:2025 (Safety Requirements for Industrial Robots—Part 2: Robot Systems and Integration) [
5] define stringent safety requirements for collaborative operations. These standards emphasize the critical importance of limiting both quasi-static contact forces and transient impact forces to prevent injury during accidental collisions.
Beyond the standards, other studies introduced different ways to determine biomechanical limits to avoid injuries. As an example, in [
6] Behrens proposed a method to determine biomechanical limits based on the probability of injury, acquiring data from real collision experiments.
Impact scenarios are particularly challenging from a safety perspective, as their outcomes depend on multiple factors: robot control laws and trajectory planning, the effective mass distribution along the kinematic chain, relative velocity at contact, mechanical properties of the contact interfaces, and the anatomical and physiological characteristics of the human body segment involved [
7]. A collision that may be safe from the perspective of force magnitude may cause serious injury if the contact is concentrated over a small area or if the impact energy is dissipated in a way that amplifies local stress. Hence, collaborative systems must be designed in such a way that impact energy is absorbed and distributed across larger body regions [
8] (e.g., by employing round surfaces). Another way of increasing human safety is to employ algorithms and methods for collision detection and avoidance [
9]. Therefore, understanding and modelling the dynamic response of the robot during collision events is essential for both validating safe physical interaction and designing control strategies that minimize injury risk. Recent findings also indicate that collision detection itself can be formulated as an optimization problem, enabling significantly faster and more scalable distance queries for real-time safety assessment [
10]. Scoccia et al. [
11] proposed a method to avoid obstacles during human–robot collaboration, using a depth camera to detect human presence and adapting robot trajectory in real time.
The scientific literature on human–robot impact dynamics reveals two complementary but distinct approaches, each with inherent strengths and limitations [
12]. In the first approach, experimental investigations provide empirical force–deformation data through carefully instrumented tests conducted with human surrogates (anthropomorphic dummies, tissue-equivalent materials) or compliant prototypes designed to replicate human body mechanics [
13,
14]. These experiments capture realistic, complex behaviour including nonlinear material response, friction effects, and anatomical detail. A representative example of such experimental work is provided by Fischer et al. [
15], who performed extensive collision tests with a power-and-force measuring device to study how impact geometry, body-region stiffness, and damping affect measured forces and pressures relative to ISO/TS 15066 biomechanical limits. However, physical testing is often expensive, time-consuming, difficult to reproduce across different laboratories, and inherently limited to the specific test configurations actually performed. In the second approach, several analytical and numerical models have been developed to describe contact phenomena using mathematical formulations such as nonlinear stiffness–damping models, most notably the Hertzian elastic theory and the Hunt–Crossley viscoelastic model [
16,
17,
18]. Analytical models are less time consuming, offer transparency and the ability to conduct parametric studies across a wide range of conditions. On the other hand, every model inherits some simplifications which yield to some errors in the prediction of the contact forces. Furthermore, model parameters are not easy to measure during online tasks, and the validation of the models with real data for collaborative robots remains limited in the literature.
A recent and promising research trend is the integration of physics-based formulations with data-driven and machine learning methods to predict impact outcomes under diverse and previously unseen conditions. These hybrid approaches aim to combine the interpretability and efficiency of analytical models with the fidelity and realism of experimental data.
In [
19], Rezayati et al. trained a neural network to clusterize incidental and intentional collisions. Similarly, in [
20] the authors collected experimental data from the prototype presented in [
14] and used them to train a neural network to predict the contact force during human–robot collisions, using contact velocity and distance from the robot base as input parameters.
Alongside learning-based approaches, empirical formulations have been proposed to estimate impact forces using a limited set of physical parameters. In [
21], Tae-Jung Kim proposed an empirical formulation to predict the maximum impact force using only effective mass and contact velocity as input parameters, consistently with the quantities defined in ISO/TS 15066:2016. However, this formulation was derived from only 50 collision experiments performed on a dummy representing solely the human face.
The quantitative assessment of safe collaborative operation requires accurate estimation of the robot’s effective mass along its kinematic chain. The effective mass, a fundamental concept introduced by Khatib in the context of operational space control [
22,
23,
24], represents the apparent inertia of the robot end-effector or of a generic body point as experienced in a given direction and configuration. During impact, the effective mass directly determines the contact force for a given collision velocity and contact stiffness.
In [
25], Kirschner proposed a method to determine the effective mass, and, consequently, in [
26], Steinecker developed the concept of mean reflective mass (MRM). Furthermore, lumped-parameter models and impedance-based approaches have been recently refined to accurately characterize effective mass in realistic robotic systems, enabling precise yet computationally efficient prediction of impact dynamics [
27] with improved consistency with ISO/TS 15066:2016.
Despite these advances, reliable and well-documented experimental data remain essential to calibrate advanced models and to ensure reproducible compliance with normative safety requirements.
This work aims to bridge the gap between empirical accuracy and analytical simplicity by developing a physics-guided modelling framework that combines the interpretability and efficiency of analytical contact models with the fidelity and realism of experimental data.
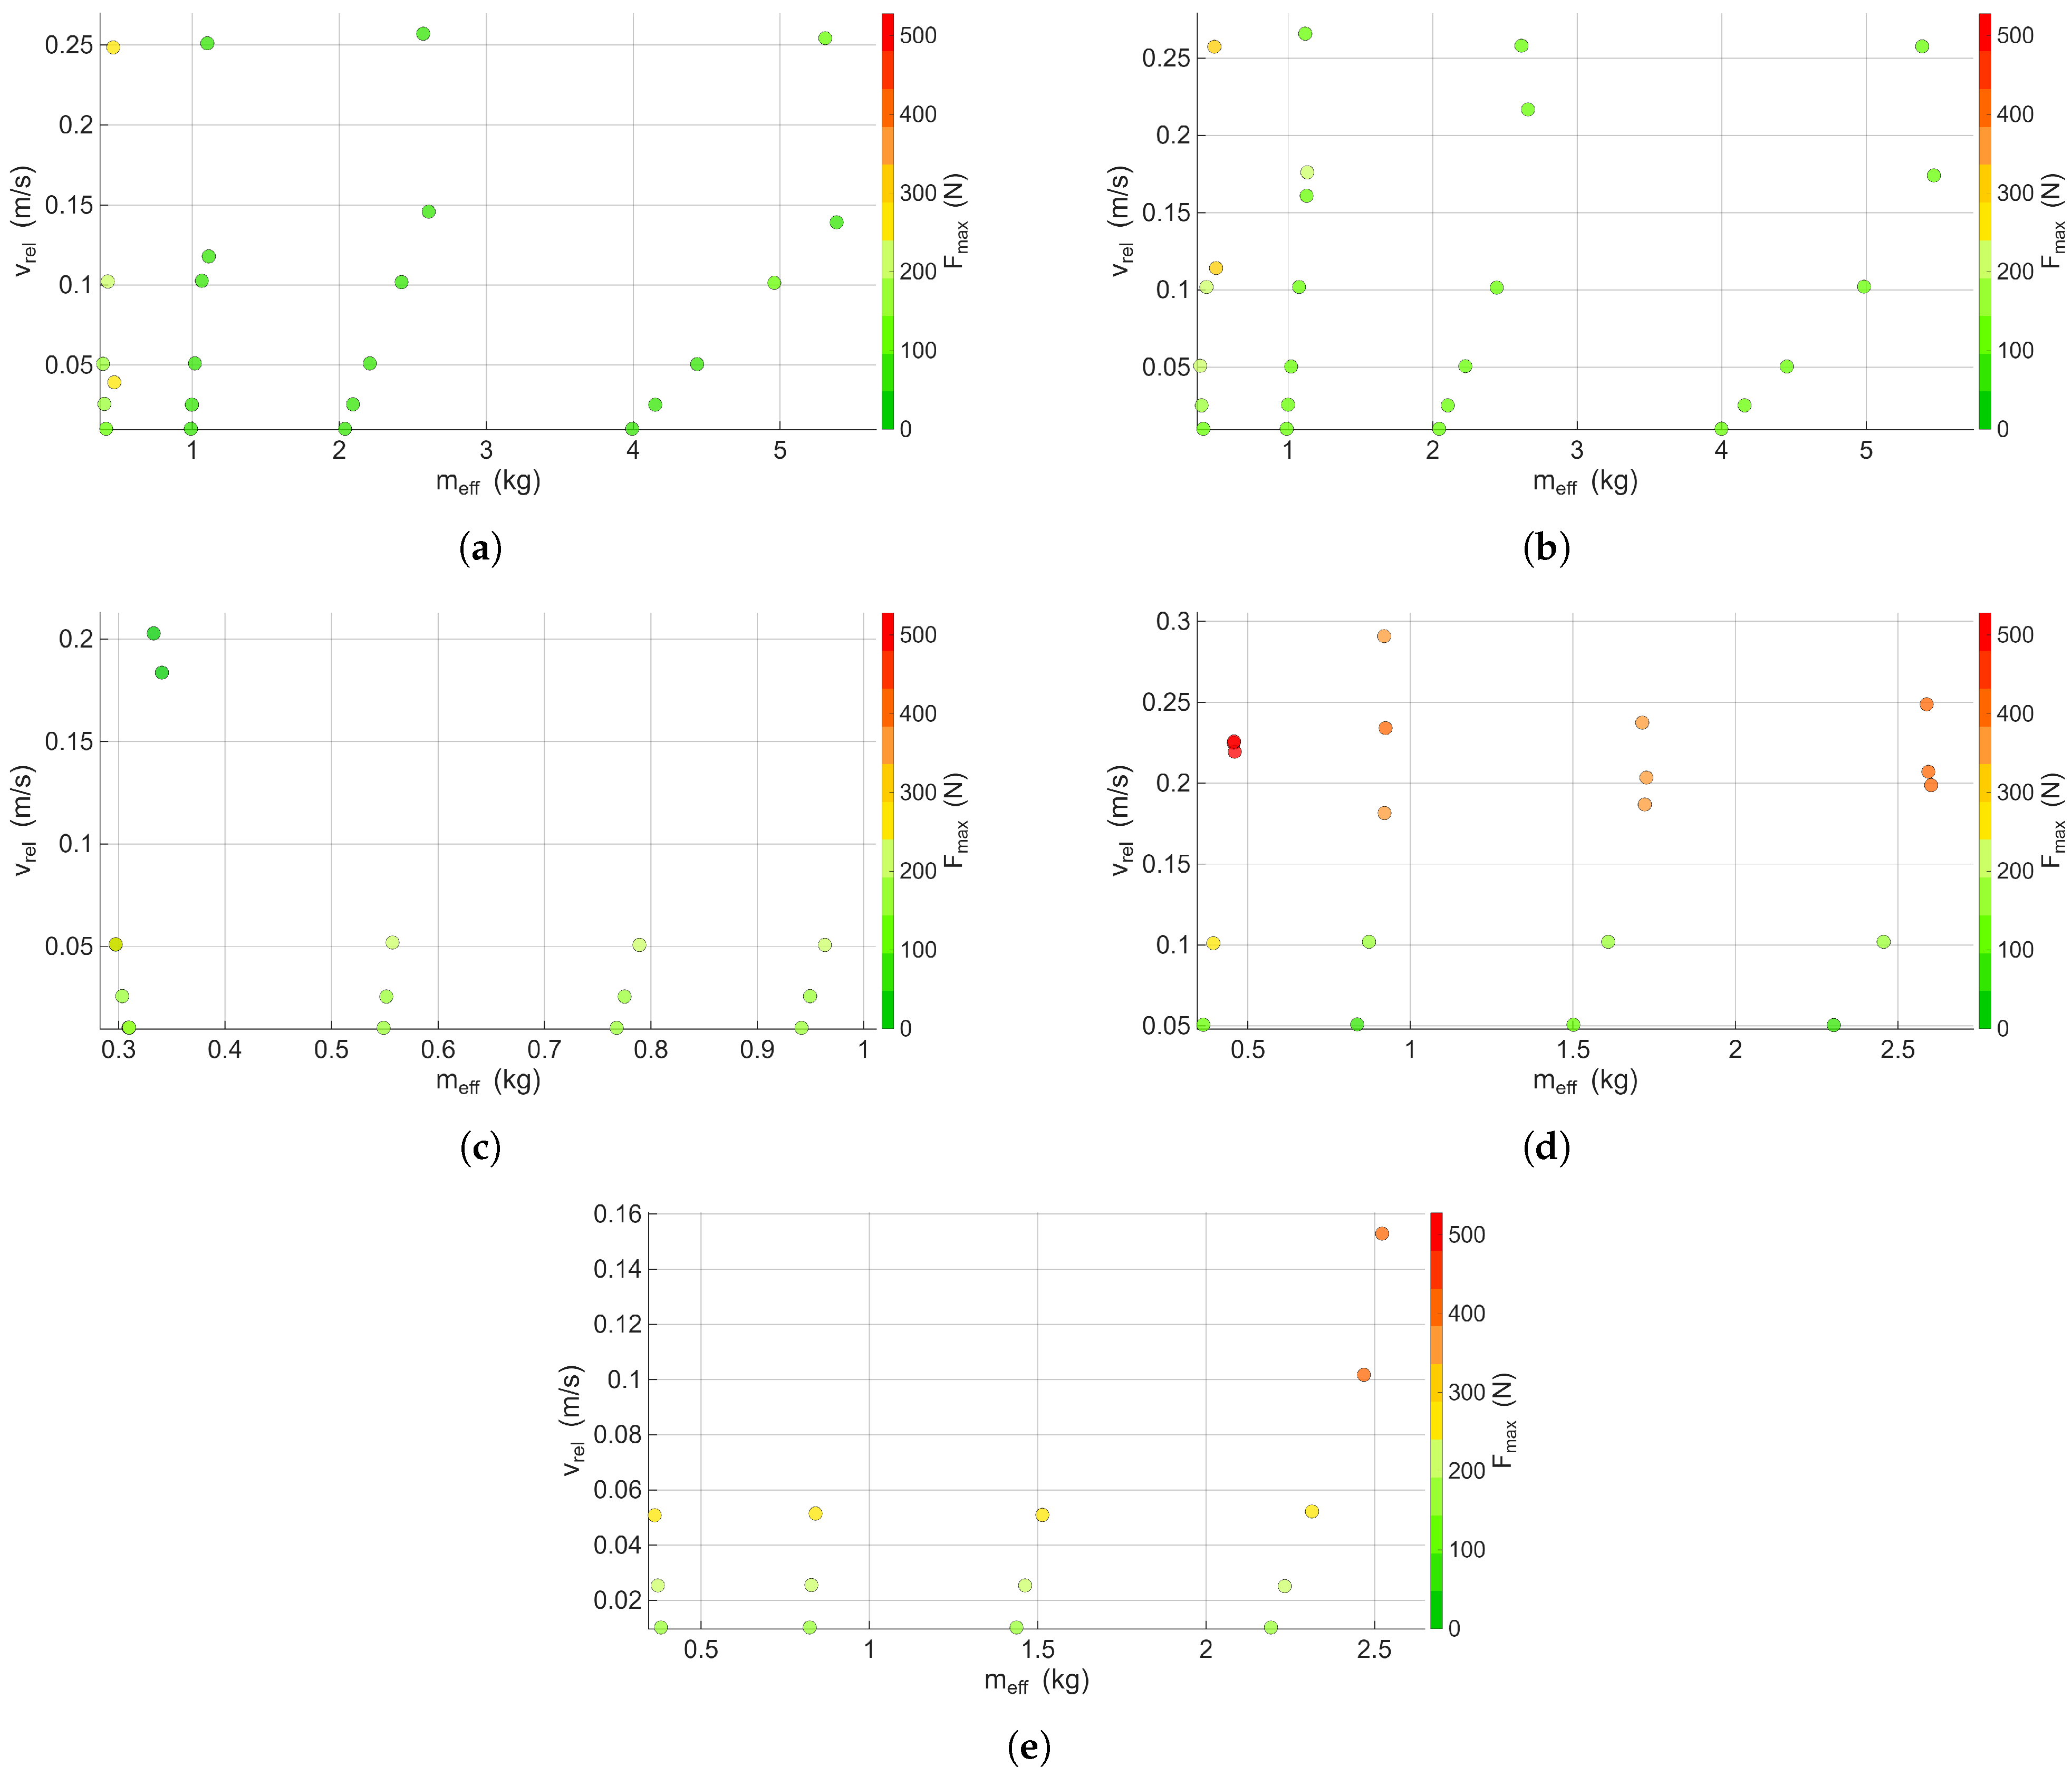
To this end, a large experimental dataset was collected by designing a low-cost and effective impact testing prototype compliant with PD ISO/PAS 5672:2023. An entire framework was then developed to compare classical contact models and machine learning approaches in terms of their predictive accuracy for collaborative robot impacts. Then, a predictive model was trained using joint angles and contact velocity as input parameters, enabling online execution directly on the robot and allowing the proposed framework to be employed as a real-time risk assessment tool.
In this work, the robot’s effective mass was estimated using an approximate yet computationally efficient method [
27] based on the robot’s kinematic and dynamic parameters, enabling accurate computation of impact energy and safety metrics as defined in ISO/TS 15066:2016.
This paper is structured as follows.
Section 2 reviews the current state of knowledge in contact mechanics and human–robot impact dynamics.
Section 3 provides a detailed description of the testing collision prototype and validation test protocol. After that,
Section 4 describes the collaborative robot system employed, the test setup and the data collection process. Then,
Section 5 reports quantitative comparisons between simulated predictions (using physical and machine learning models) and experimental measurements, discusses the implications for safety evaluation, and analyzes the robustness of model predictions. Finally,
Section 7 summarizes the main findings, highlights the practical implications for collaborative robot design and deployment, and outlines promising directions for future research, including the integration of machine learning methods.
Contributions of This Paper
The primary contributions of this work are summarized as follows:
The design, validation, and implementation of a low-cost impact test prototype capable of reproducing controlled human–robot contact scenarios, enabling synchronized acquisition of force data during collision events.
A quantitative comparative evaluation of classical contact models (Hertzian, Hunt–Crossley) and new machine learning approaches in terms of their predictive accuracy for robot impacts.
An hybrid and online-oriented approach which integrates extensive experimental data (four robot configurations, five body regions) with classical physical models (Hertz/Hunt-Crossley) and ML (SVM/DT) to predict impact forces, which can be used for online risk assessment during PFL working mode. Compared to [
20,
25,
26], a larger dataset is used and different ML approaches are explored.
A novel use of the effective mass, in its simplifed version [
27,
28], is created for compliant collision assessment.
2. Human–Robot Impact Dynamics
This section establishes the safety framework for human–robot interaction in industrial environments, focusing on the Power and Force Limiting (PFL) mode regulated by the ISO TS 15066:2016 standard, which provides the theoretical context for the prototype developed. Human–robot impact dynamics is a multidisciplinary research area that integrates principles from robotics, biomechanics, materials science, and safety engineering. The primary objective is to understand and predict the mechanical interactions that occur during collisions between robots and humans, with the ultimate goal of ensuring safe and effective collaboration in shared workspaces; then regulate manipulator parameters to prevent or limit pain upon collision.
2.1. Contact Forces
Safety protocols focus on limiting robot performance parameters such as forces, velocities, power, and momentum. Collision scenarios are primarily categorized as either quasi-static contacts or transient contacts. The first refers to situations where the robot applies a continuous force on the human body, typically during slow movements or when the human body part is spatially costrained, while the latter involves typically brief, spatially uncostrained high-impact events where the robot collides with the human body at higher speeds. Typically, an impact event can be subdivided in a transient contact part (duration of 0.5 s according to standard) followed by a quasi-static contact part, when the robot remains in contact with the human body after the impact.
The normative framework models the human body by partitioning it into 12 regions [
4]. To each region is assigned a specific maximum permissible force
and is modeled, from a mechanical perspective, by an effective mass
and an effective stiffness
. The force limit is critical as it relates to the thresholds for pain onset.
2.2. Energetic Approach
For defining transient contact, the standard model [
4] applies a simplified physical-mathematical model of a completely inelastic collision between the robot and the effective mass representing the human body region. The maximum allowed energy transfer
E at the human–robot interface is calculated using the biomechanical limits
and the region’s effective stiffness
, equal to the elastic energy stored in the equivalent spring:
This energy is equated to the kinetic energy of the system, expressed via the reduced mass
and the relative velocity
:
The relative velocity is normally calculated as the difference between the robot’s velocity (considered as the point of the robot that will impact the human) and the human body region velocity, both projected along the impact direction.
The ISO standard [
4] calculates the reduced mass
using the effective mass of the human region
and the effective mass of the robot
:
which can be substituted into Equation (
2), so the force at impact
can be derived as follows:
According to the ISO/PAS 5672:2023, when test collisions with rigidly fixed impact prototypes are performed, it is not necessary to adopt a mass
that matches the body part under analysis, but instead a scaling factor is used to convert the measured force
to an equivalent value of force
similar to the one which would have occurred when impacting the real body part. The scaling factor is defined as follows:
The force measured during the test
is converted to the equivalent force
, according to Equation (
5), as follows:
The ISO/TS 15066 defines the robot effective mass as , where M is the total mass of the robot’s moving parts and is the load mass.
Furthermore, the model assumes a perfectly flat contact surface between the robot and the human body region.
Accurate estimation of
is essential to predict the forces generated during a collision and assess potential injury risks. A more in-depth analysis can be performed by calculating the effective mass
of the robot at the contact point from the configuration-dependent Cartesian mass matrix
:
where
is the joint-space inertia matrix which can be computed via the Lagrange approach [
29],
is the geometric Jacobian of the contact point, and
is the unit vector along the impact/force direction.
In
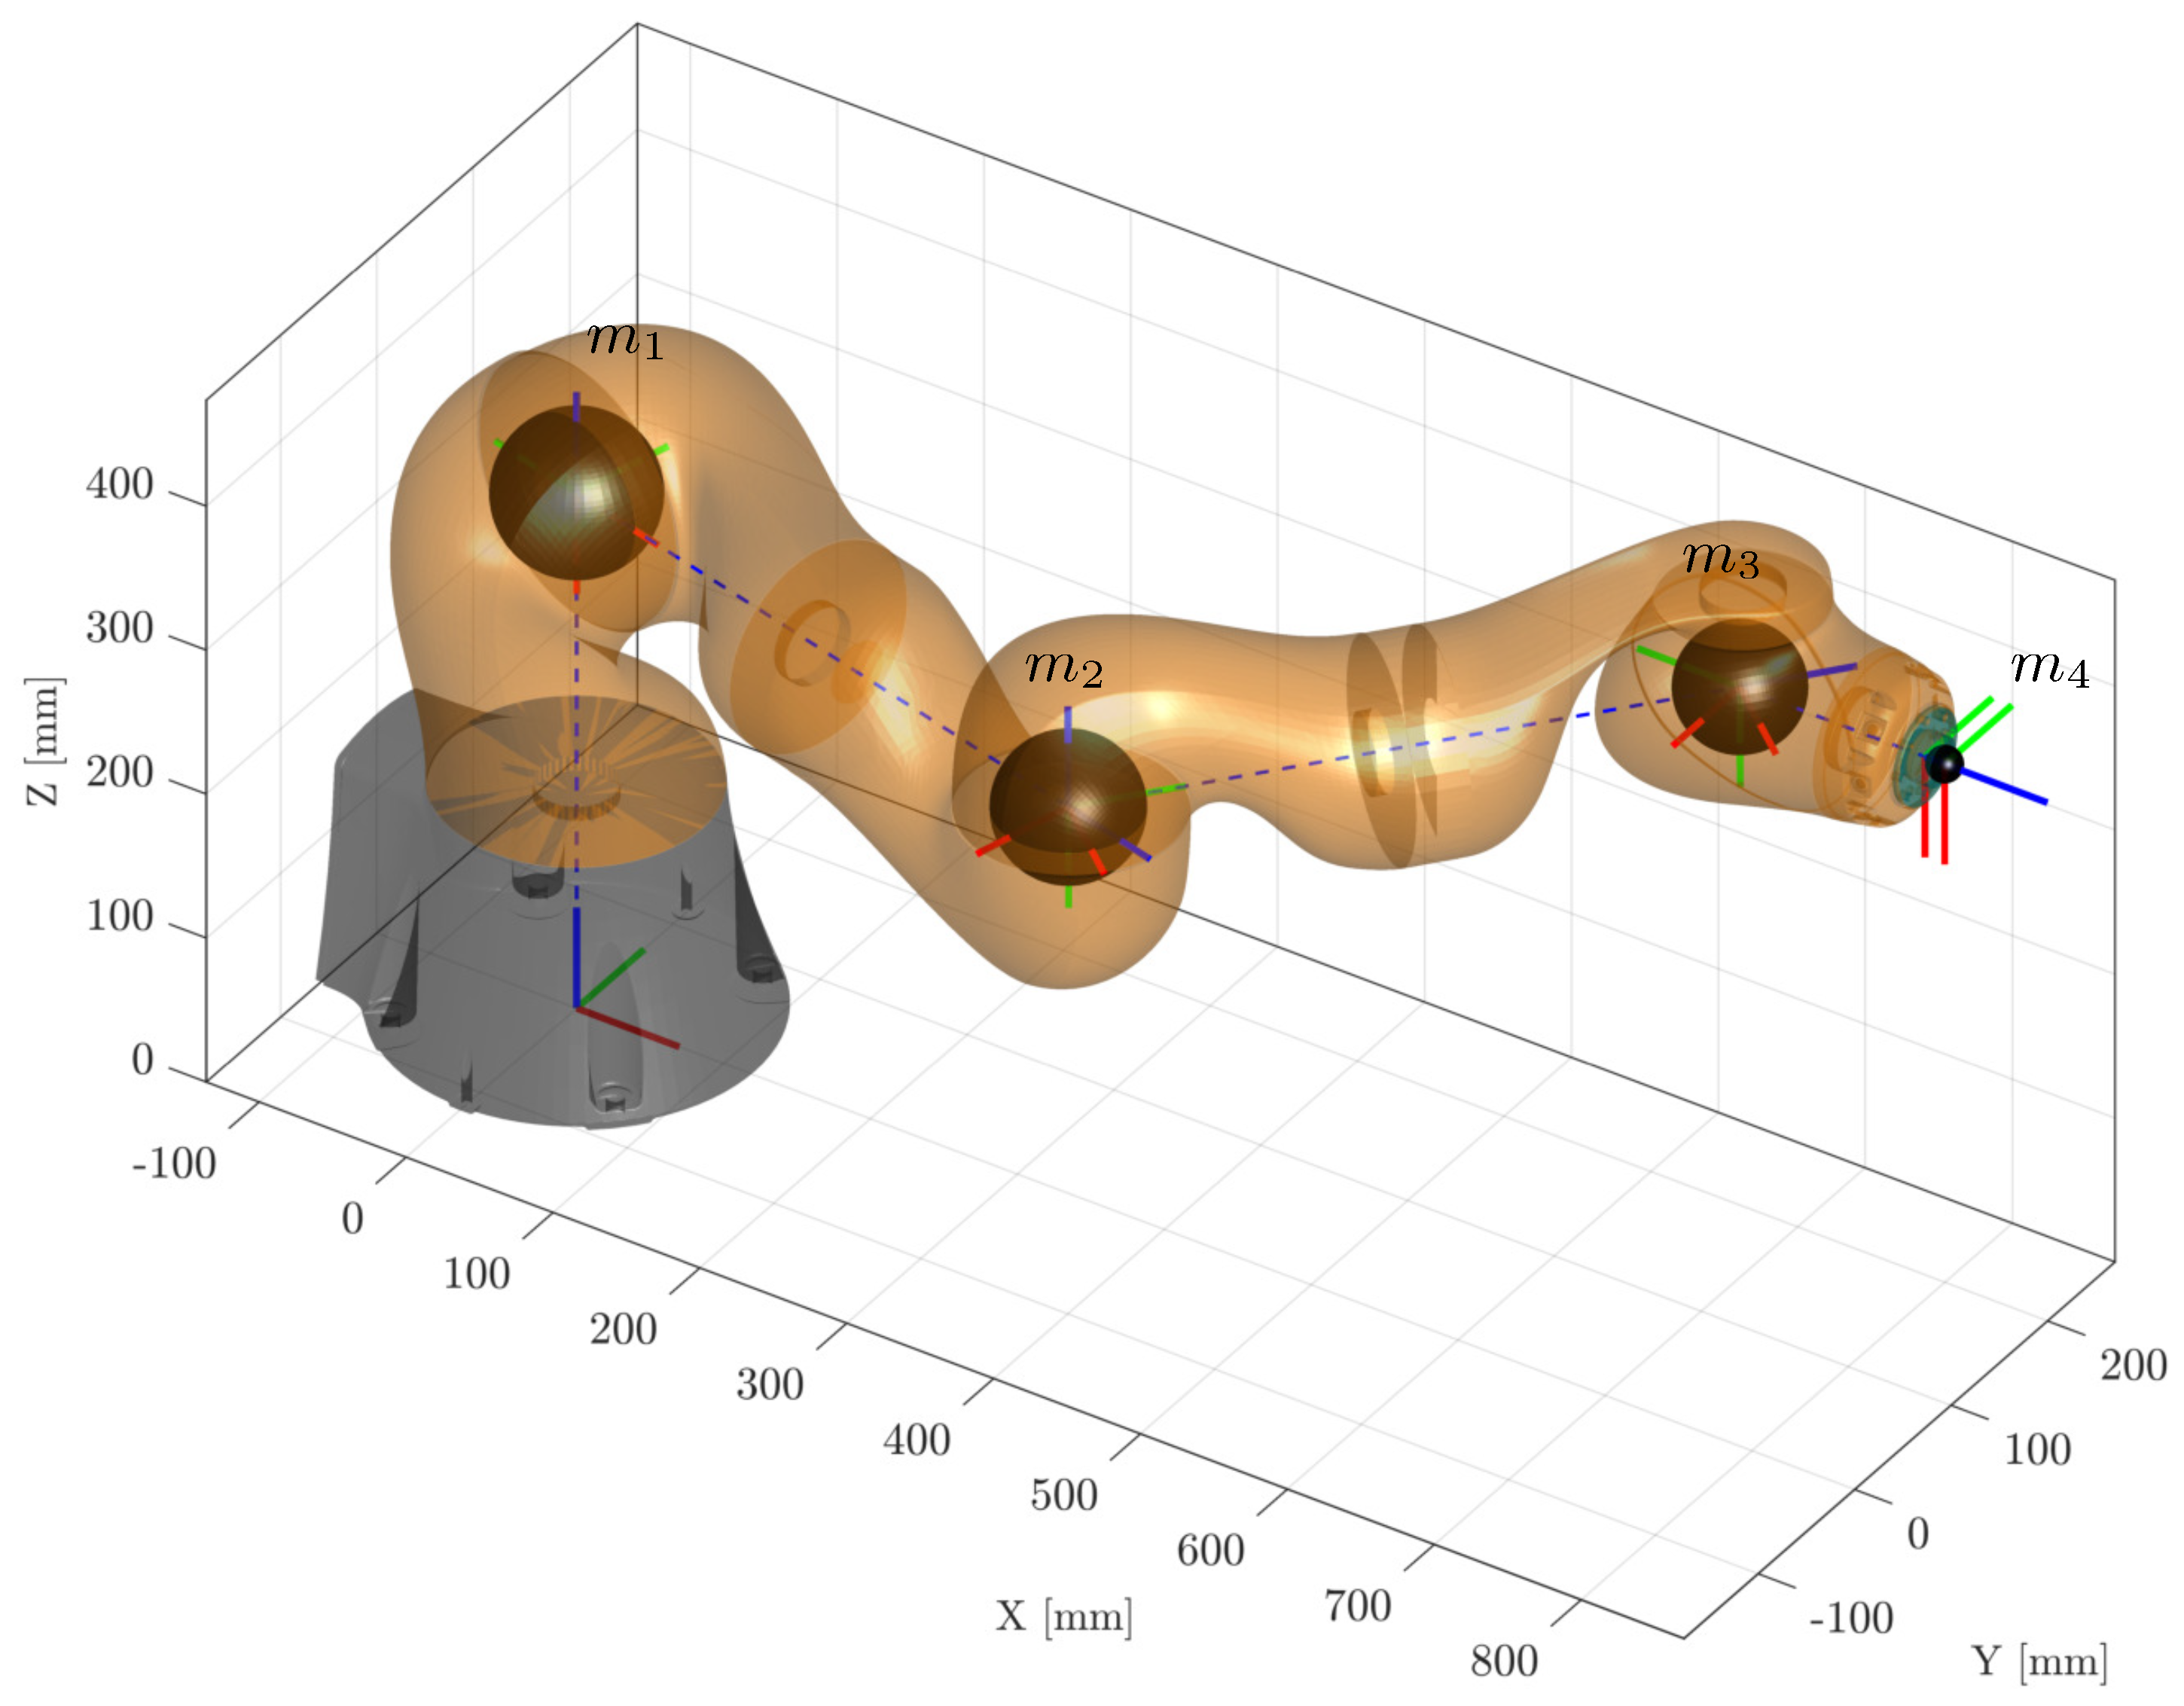
Figure 1, the lumped mass configuration for the KUKA IIWA 14R820 (produced by KUKA AG, Augsburg, Germany) is shown, where the effective mass is calculated by considering three lumped masses (black spheres in
Figure 1) at shoulder, elbow and wrist. An additional mass for the gripper is addressed as payload mass. The lumped masses are chosen and positioned respecting dynamic equivalence principles. Using Equation (
8), the effective mass
can be calculated. Considering lumped masses of the robot instead of link’s full inertia contributes and avoiding computation of rotational inertia. This approach approximates the effective mass by considering only the major contributors along the kinematic chain, significantly reducing computational complexity while maintaining accuracy [
27]. This approximation neglects the full link inertia tensors and thus does not reproduce the complete Cartesian mass matrix
. A quantitative assessment of the resulting error has been carried out in [
28], where the same lumped formulation was compared against the full dynamic model for several industrial manipulators over random trajectories, including the KUKA IIWA 14R820. Their results show that the normalized RMSE in kinetic energy remains below about 3%, with even smaller errors on linear momentum, indicating that the simplified
is sufficiently accurate for impact-energy and effective-mass estimation in safety-oriented applications.
Figure 1.
Lumped masses configuration in KUKA IIWA 14 R820 (the corresponding Denavit–Hartenberg parameters [
30] are listed in
Table 1). The robot configuration is the first one experimented in the
Section 4. The black spheres represented the four chosen lumped masses
; axes of the links are represented in red (x-axis), green (y axis), blue (z-axis).
Figure 1.
Lumped masses configuration in KUKA IIWA 14 R820 (the corresponding Denavit–Hartenberg parameters [
30] are listed in
Table 1). The robot configuration is the first one experimented in the
Section 4. The black spheres represented the four chosen lumped masses
; axes of the links are represented in red (x-axis), green (y axis), blue (z-axis).
Table 1.
Denavit–Hartenberg parameters of the KUKA LBR iiwa 14 R820.
Table 1.
Denavit–Hartenberg parameters of the KUKA LBR iiwa 14 R820.
| Link i | [°] | [mm] | | [mm] |
|---|
| 1 | 0 | 0 | | 358 |
| 2 | −90 | 0 | | 0 |
| 3 | 90 | 0 | | 420 |
| 4 | 90 | 0 | | 0 |
| 5 | −90 | 0 | | 400 |
| 6 | −90 | 0 | | 0 |
| 7 | 90 | 0 | | 126 |
2.3. Classical Contact Models
Several classical contact models have been developed to describe the mechanical interactions during collisions. Most of them are derived from the Hunt–Crossley viscoelastic model [
16].
This model is able to describe the contact force between two bodies during an impact event, incorporating both elastic and damping effects, accounted for energy dissipation during impact. The contact force is expressed as follows:
where
is the penetration distance of the contacting bodies,
the penetration velocity,
the Hunt–Crossley stiffness coefficient, which accounts for stiffness of the colliding bodies,
the interaction damping coefficient of the colliding bodies, and
m and
n are nonlinear exponents. The exponents
m and
n are typically set to 1.5 for spherical contacts [
18], but can be adjusted based on experimental observations to fit specific contact scenarios.
The coefficient
in (
9) is defined as follows:
where
is a parameter depending on geometry, material and kinematics of the two bodies. The coefficient of restitution
, representing the ratio between the relative velocity of the two bodies after (
) and before (
) the impact (
), in the Hunt–Crossley formulation is defined as [
18]:
where
is the relative velocity just before impact.
Introducing (
11) into Equation (
9) gives the following:
It is important to underline that knowing the penetration distance and velocity parameters, depends on three parameters only: , and n.
When the damping effects are negligible with respect to the elastic ones,
tends to 1 and the Hunt–Crossley model simplifies to the Hertz contact model [
31], which describes purely elastic contact interactions. The Hertz contact model assumes that the contact area is small compared to the dimensions of the bodies and that the materials behave elastically. The contact force
F is related to the penetration depth
by a nonlinear relationship:
where
is the Hertzian stiffness coefficient and
n is the nonlinear exponent, which depends on the material properties and geometries of the contact bodies. This model captures the nonlinear elastic behavior observed in many contact scenarios, particularly for spherical or curved surfaces.
2.4. Data-Driven Contact Force Prediction
Physics-based models often struggle to provide accurate predictions in highly complex scenarios [
19]. For this reason, data-driven approaches based on Machine Learning (ML) have been widely adopted in the literature [
20]. These methods enable predictions to be obtained solely from experimental data collected in laboratory settings, without requiring an explicit physical model of the system.
A fundamental assumption is the existence of an unknown functional input-output relationship f between the space of input measurements and the corresponding force values. The learning task therefore consists in approximating such a function from data. To assess the quality of a candidate function, a loss function is introduced, quantifying the error between predicted and observed outputs.
Additionally, the input–output pairs
, where
is an arbitrary measurable input space and
denotes the output dimension, are assumed to be drawn from an unknown joint probability distribution
, and the ideal objective is the minimization of the expected risk
namely, the expected value
of the loss function
with respect to the unknown distribution
. Hence,
defines the expected risk of the predictor
f, namely, the average loss incurred by
f over the data-generating process.
As a consequence,
evaluates the performance of
f at the population level, rather than on individual samples, and represents the ideal learning objective. However, as the underlying distribution
is not accessible, the expected risk cannot be minimized directly. In practical ML settings, the function
is instead estimated by restricting the search to a predefined hypothesis space
and by exploiting a finite dataset of labeled examples
, where each pair
is a sample from the input-output space. The expected risk is approximated by the empirical risk
leading to the following optimization problem:
Within this framework, Support Vector Machines for Regression (SVR) [
32] and Decision Trees (DTs) [
33] are employed to obtain accurate predictions of the force from experimental measurements. Specifically, the input space
is defined by a set of input within: the robot joint angles
at impact, Cartesian velocity at impact
,
, the maximum penetration distance
,
,
and
. The output space is given by the measured contact force values
, as in Equation (
6).
As a baseline, a simple linear regression model is evaluated. Such a model allows for simplifying the model to achieve good results in little computational time. Nonetheless, the interaction between bodies is highly non-linear, and more complex models should be adopted if the accurate modeling of the impact is top priority. The linear regression model assumes the following:
where
denotes the
i-th input feature (e.g.,
,
,
, etc.),
is the intercept,
are the feature coefficients, and
is the error term.
2.5. Support Vector Machine (SVM) and Decision Tree (DT)
Support Vector Machines (SVMs) are a powerful class of supervised learning algorithms that can capture complex relationships between input features and output values. SVR works by finding a hyperplane in a high-dimensional feature space that best fits the data while maximizing the margin around it. The
-insensitive loss function is commonly used in SVR, which allows for some tolerance to errors within a specified margin
. The optimization problem for SVR can be formulated as follows:
where
w is the weight vector,
b is the bias term,
and
are slack variables that allow for errors,
C is a regularization parameter that controls the trade-off between the flatness of the function and the amount of tolerated deviations, and
is a kernel function that maps the input data into a higher-dimensional space.
Decision Trees (DTs) are another supervised learning method that can be used for regression tasks. A decision tree is a flowchart-like structure where each internal node represents a test on an input feature, each branch represents the outcome of the test, and each leaf node represents a predicted output value. The tree is built by recursively splitting the data based on feature values to minimize a certain impurity measure (e.g., mean squared error for regression). The prediction for a new input is obtained by traversing the tree according to the feature values of the input until reaching a leaf node, which provides the predicted output. DTs are interpretable and can capture non-linear relationships, but they can be prone to overfitting if not properly regularized (e.g., by limiting the depth of the tree or the minimum number of samples required to split a node). In this work, both SVR and DT are trained on the experimental dataset to predict the contact force based on the input features, and their performance is compared against classical contact models and a linear regression baseline.
The predictive performance of all models is evaluated using the Root Mean Square Error (RMSE) and the coefficient of determination (
). RMSE is computed as follows:
where
are the measured values,
are the model predictions, and
n is the number of samples.
quantifies the proportion of variance in the observed data explained by the model and is calculated as follows:
where
is the mean of the observed values. Higher
indicates better fit, whereas lower RMSE indicates smaller prediction errors.
3. Experimental Apparatus
The experimental setup is designed to systematically investigate human–robot impact dynamics using a collaborative redundant manipulator (KUKA LBR iiwa 14 R820) and a custom-designed compliant prototype for collisions. This section details the design of the impact test prototype, its validation, the experimental setup, instrumentation, test protocol, and data acquisition procedures used to collect impact measurements. The aim is to create a controlled environment for replicating simplified human–robot contact scenarios, under the constraints of the current ISO [
2,
4,
5,
34] enabling the collection of ISO compliant data for model calibration and validation.
3.1. Prototype Design
An impact test prototype was developed to replicate the mechanical behavior of various human body regions under controlled impact conditions. The prototype is designed to be compliant to PD ISO/PAS 5672:2023 [
34], allowing for realistic deformation and force response during collisions with the robot. The prototype dimensions are listed in
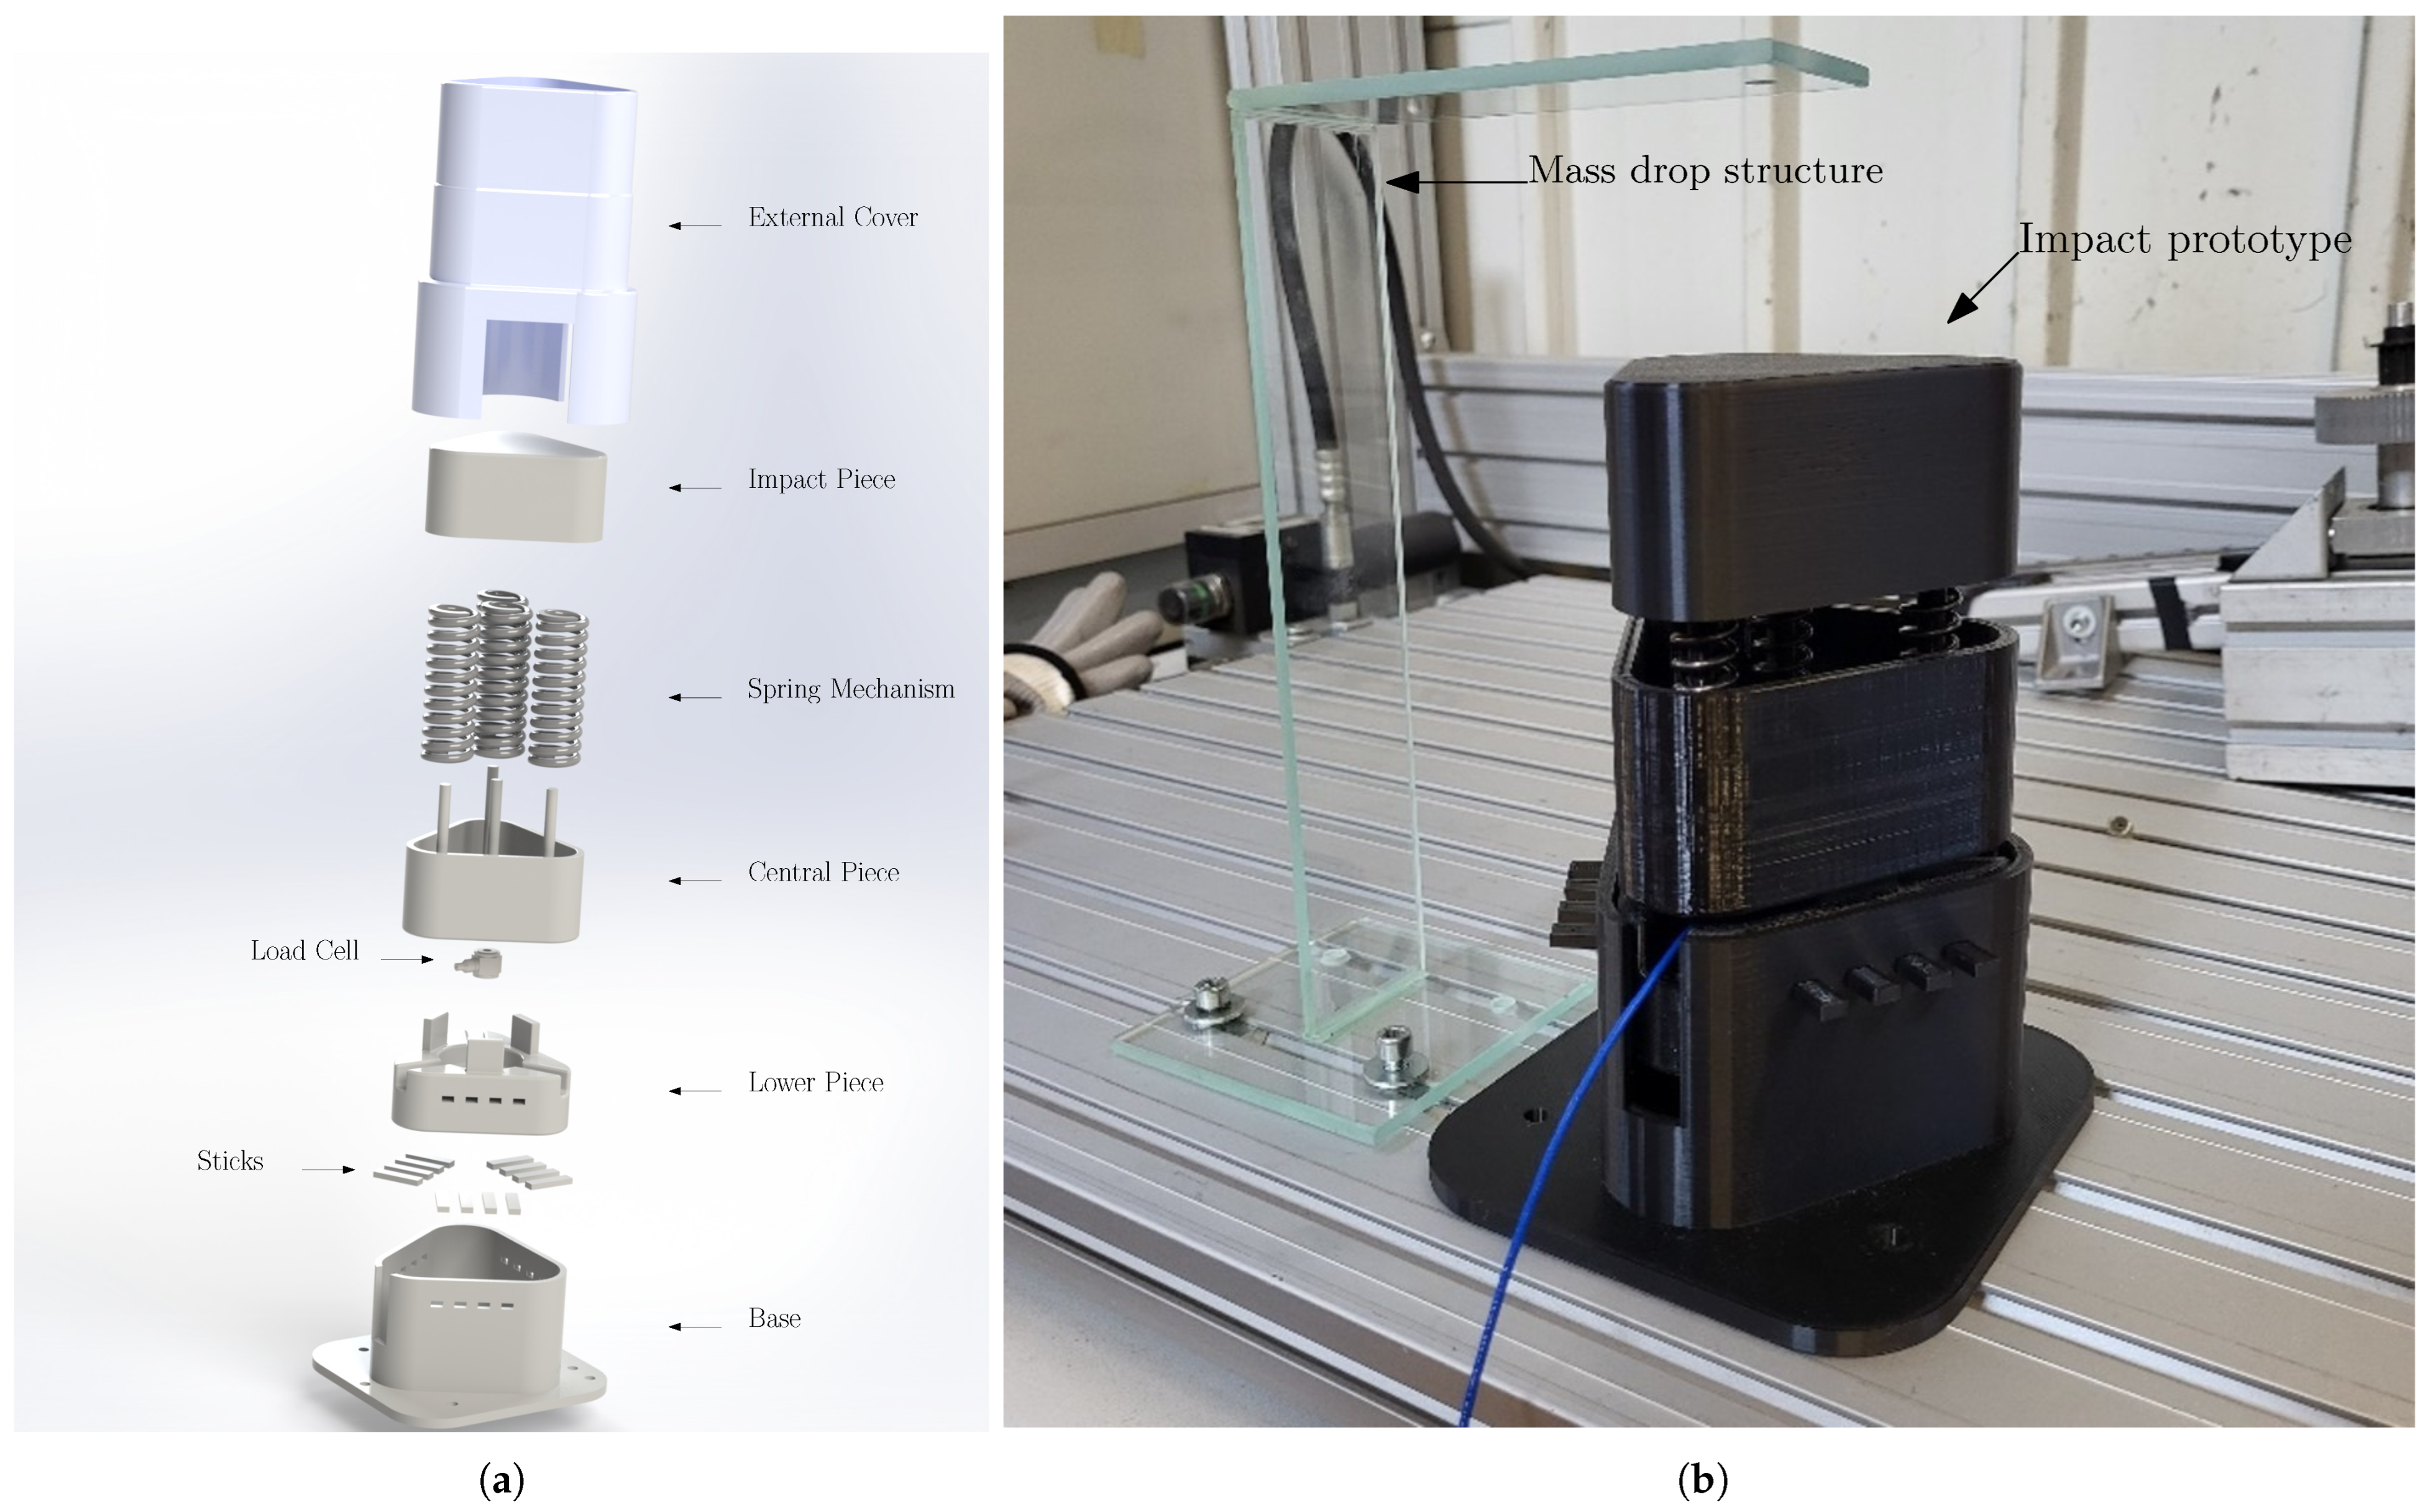
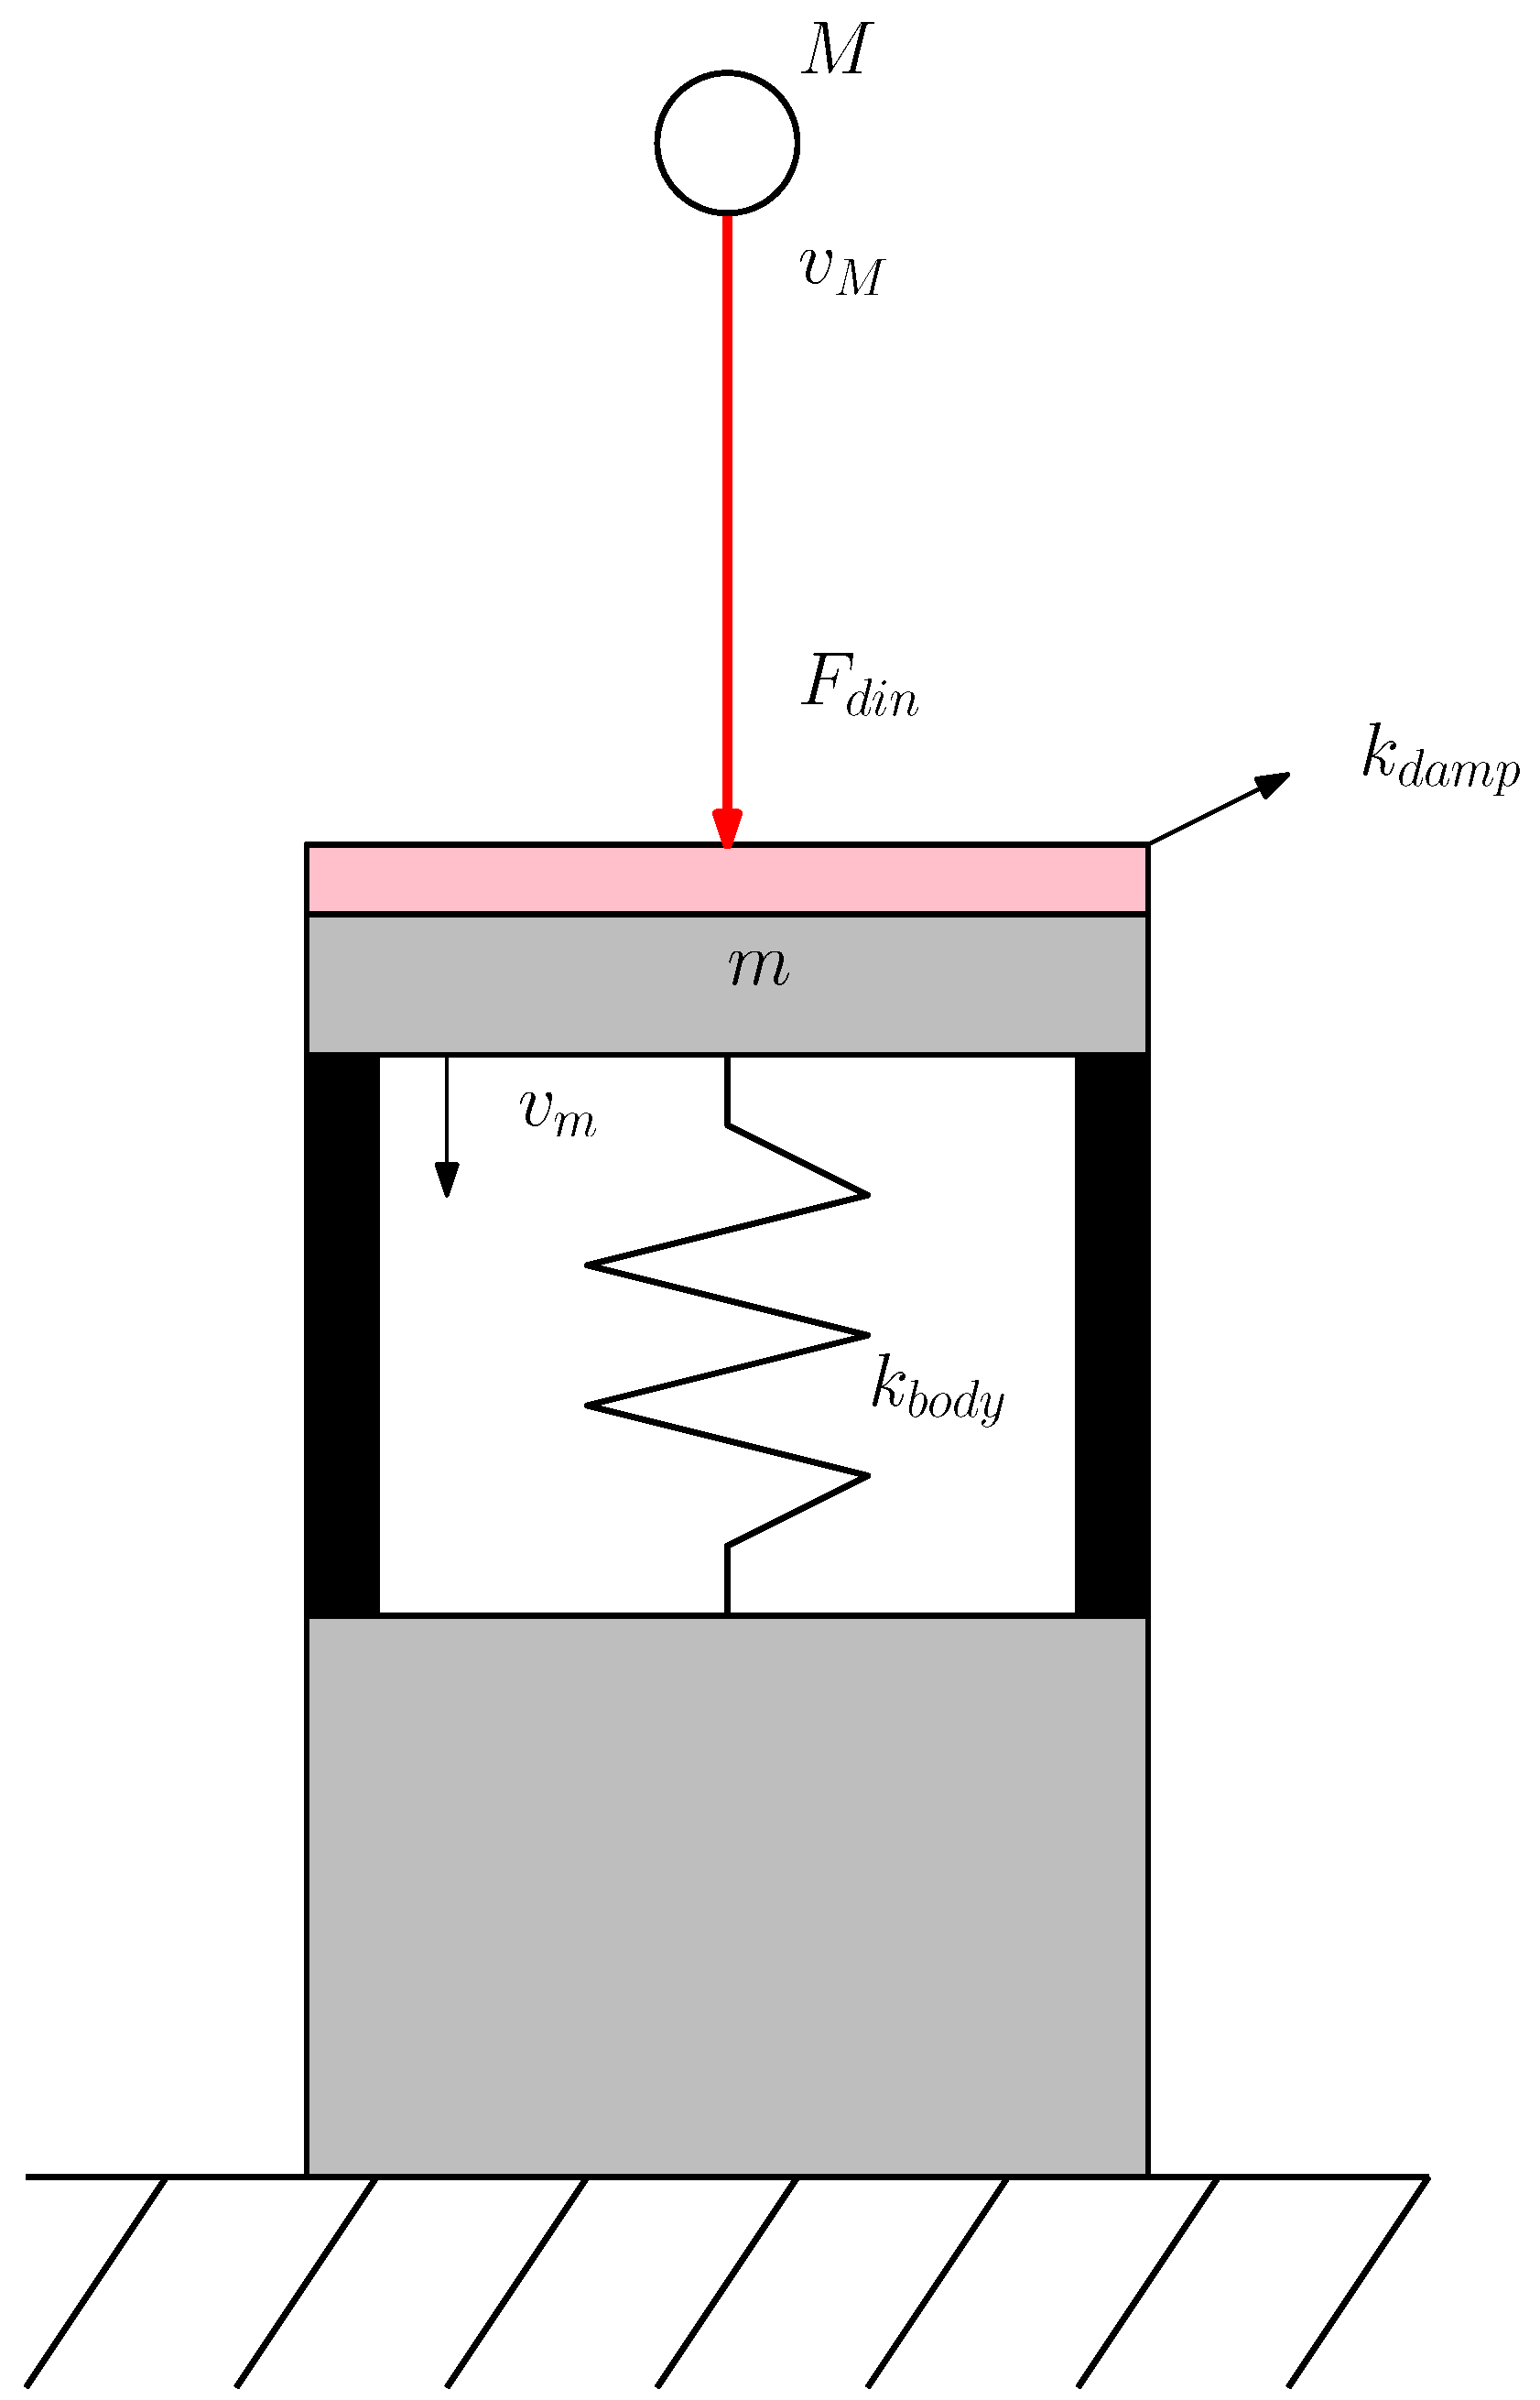
Table 2. The prototype consists of several key components (
Figure 2):
Compliant Damping Layer: A layer of compliant material placed on top of the impact piece to simulate the soft tissue response of human body regions. The material properties are selected to closely match the biomechanical characteristics of human tissues [
13], ensuring realistic force-deformation behavior during impacts.
External Cover: A rigid outer shell that protects the internal components and permits a proper impact stimulation of the load cell. It works also as a linear guide system that ensures the impact piece moves along a predefined path during impact, minimizing lateral movements and ensuring consistent contact conditions.
Impact Piece: A rigid component that directly interfaces with the robot during impact.
Spring Mechanism: A set of springs arranged to provide the desired stiffness, compliant to the ISO standard.
Central Piece: A structural component that connects the impact piece to the load cell, ensuring proper alignment of springs and force transmission during impacts.
Load Cell: A high-precision piezoelectric force sensor (PCB Piezotronics, Model 208C03, Depew, NY, USA capacity 2.224 kN, bandwidth 0.0003–36,000 Hz) integrated into the prototype to measure the contact forces during impact events.
Lower Piece: A structural component that supports the load cell and connects it to the base, ensuring stability during impact tests.
Base: A stable platform that securely fix the prototype to the ground, ensuring consistent positioning during tests.
Sticks: Proper sticks, dimensioned with a finite element analysis approach, were positioned in order to protect the prototype in case of exceeding loads or accidents. These pins are designed to fail in bending, triggering a controlled drop of the upper assembly when the total applied force exceeds a predefined threshold, avoiding damages to the internal components of the prototype.
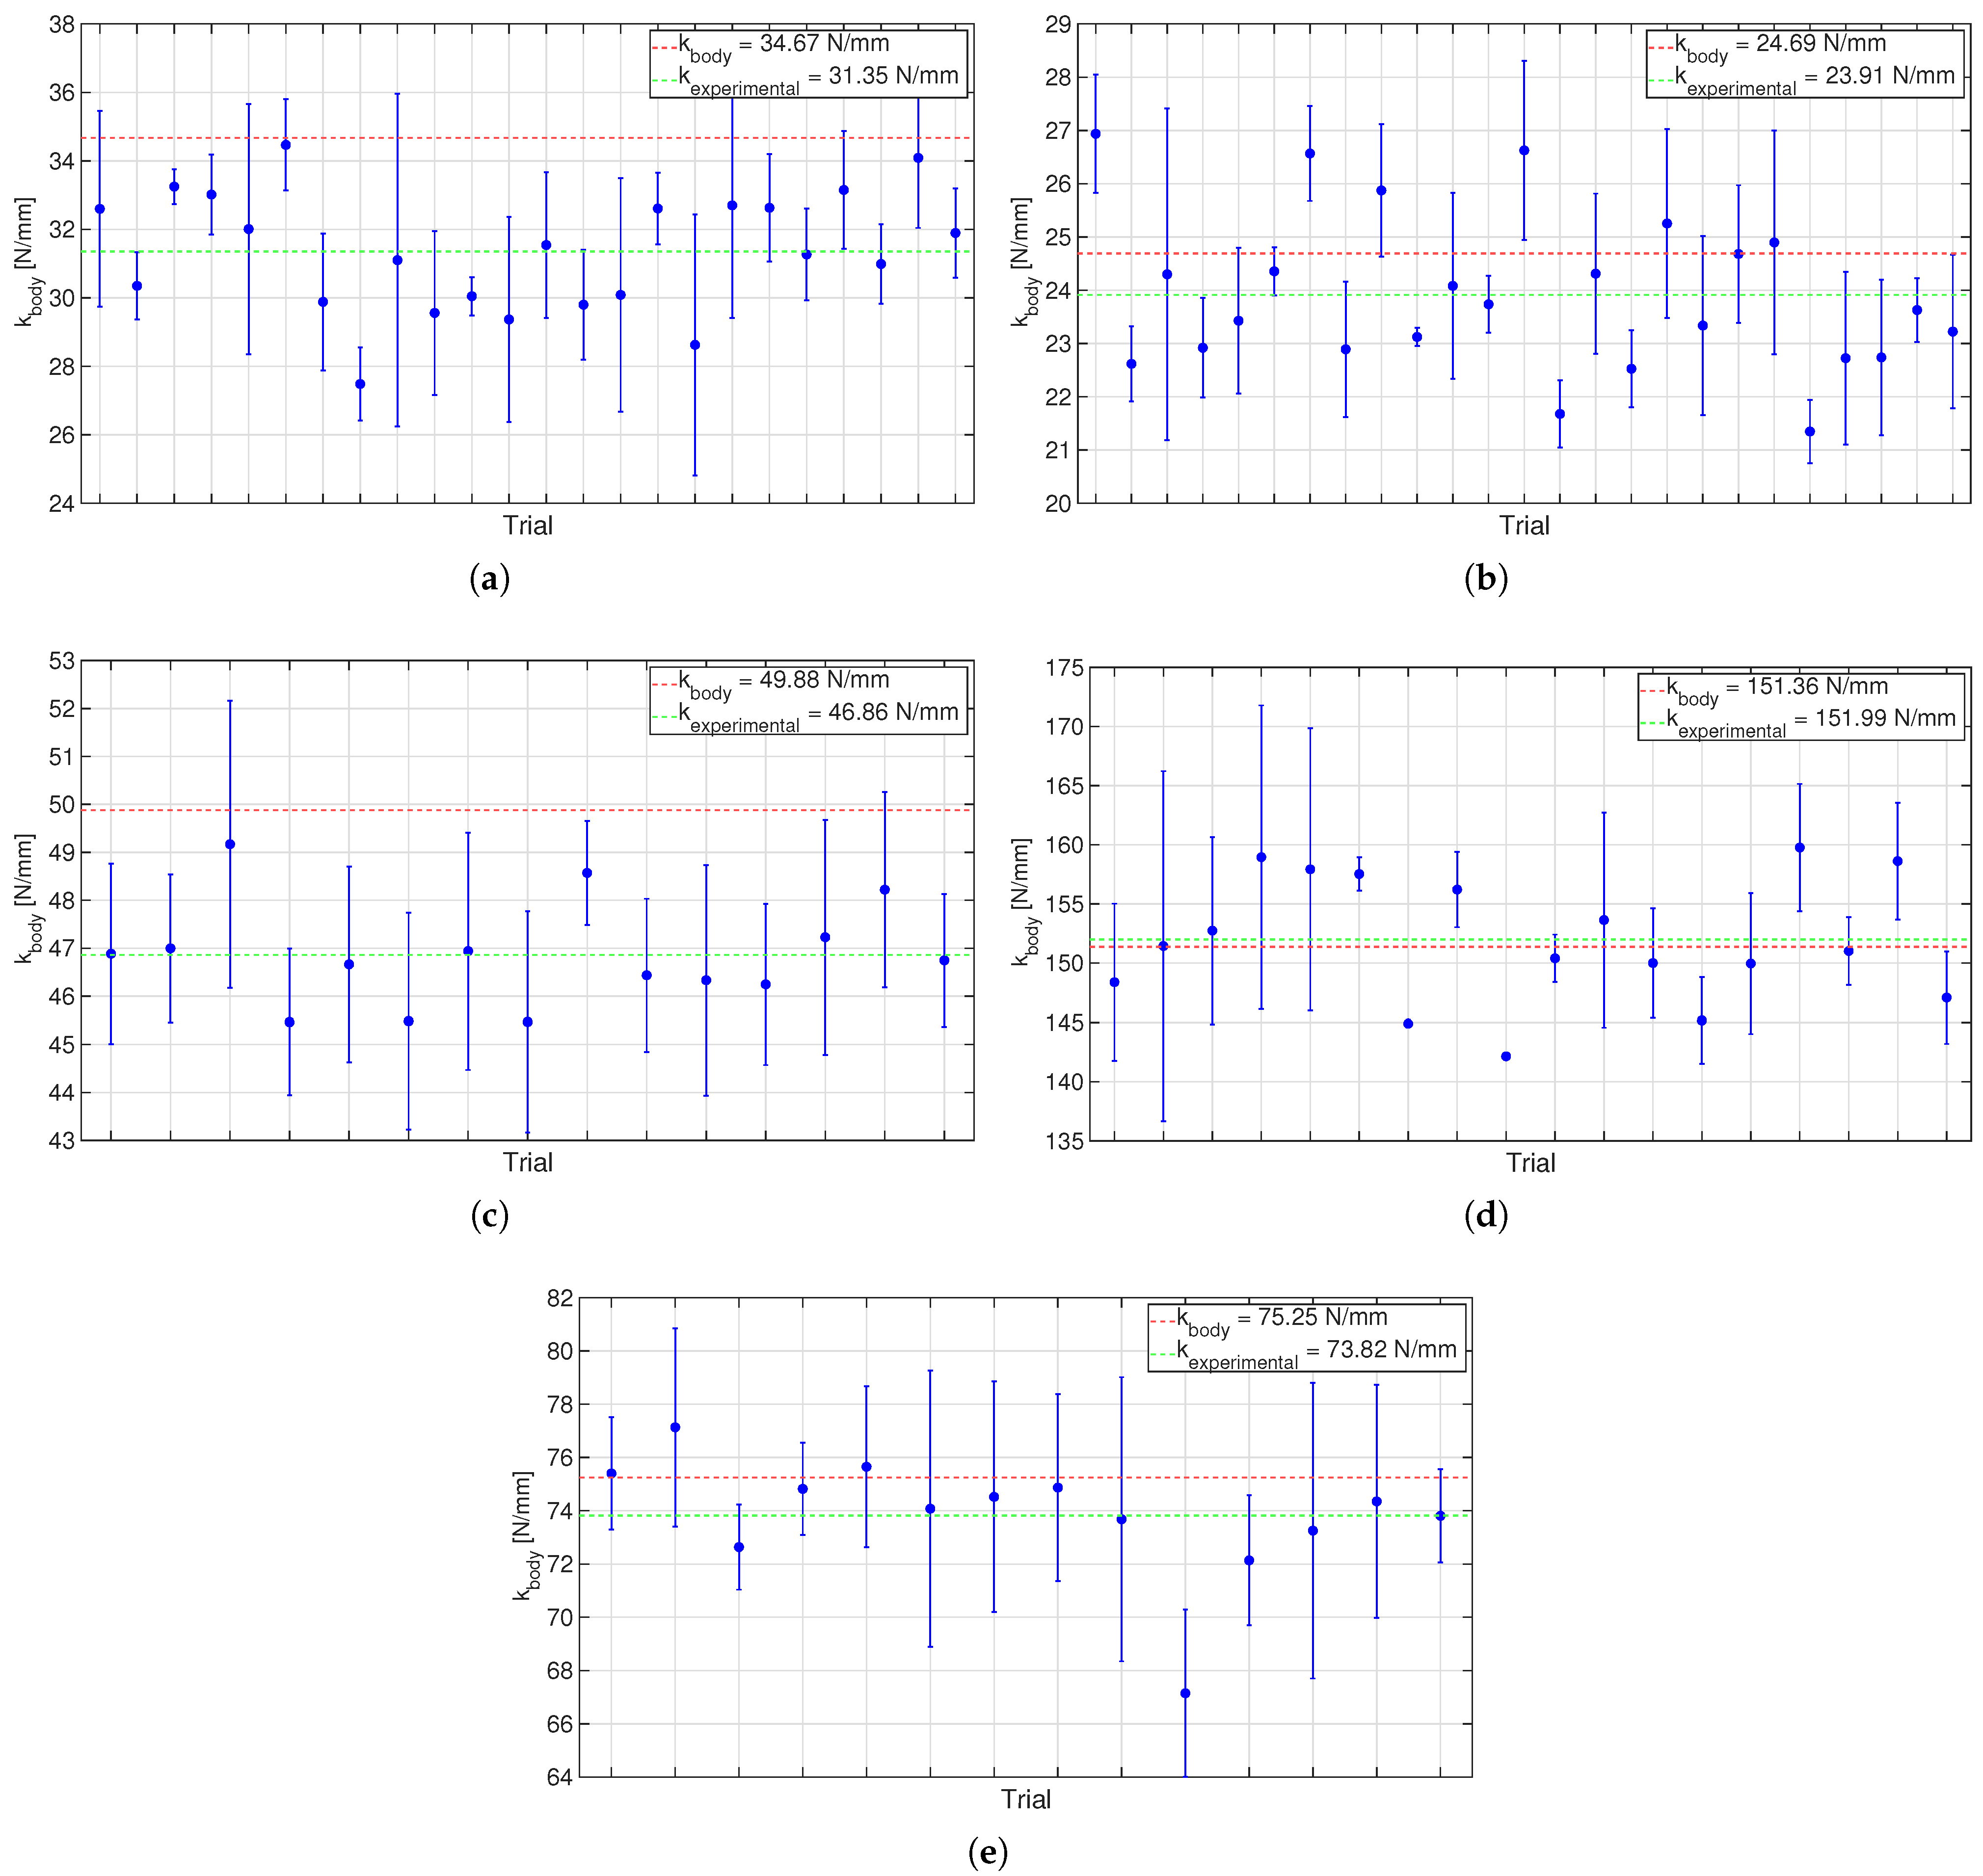
Since the core function of the prototype is to replicate the mechanical response of human body regions, the design process focused on achieving biofidelity in terms of stiffness and damping characteristics. The prototype was engineered to simulate the effective stiffness values specified in ISO/TS 15066:2016 for different body regions, ranging from 10 N/mm to 150 N/mm. The spring constants can be adjusted inserting or removing springs, to reach a configuration of four springs arranged in parallel (three at the vertices of an equilateral triangle, one central), choosing within a set of spring constants of 2.5, 7.5, 12.5, and 37.5 N/mm, to match the effective stiffness of the target human body region. The prototype’s modular design allows for easy adjustment of spring configurations to simulate different body regions as needed. Regarding the damping contribute, a 7 mm thick layer of polyurethan with hardness shore A70 (MISUMI Group Inc., Tokyo, Japan) was used for the hardest body regions; a 14 mm thick layer of polyurethan with hardness shore A30 (MISUMI Group Inc., Tokyo, Japan) was used for the medium ones, and a 21 mm thick layer of silicone (liquid silicone rubber R PRO 10 (Reschimica, Pordenone, Italy) with hardness shore A10 was used for the softest body regions.
Given the stiffness contribution of soft tissues using standard compliant damping elements, an additional stiffness component (
) in series with the effective body stiffness (
k) must be considerd, leading to an equivalent stiffness (
):
It is relevant to notice that, using
in the energy Equation (
2), higher permissible relative velocities (
) are permitted and still safe, potentially increasing productivity (e.g., up to
increase for the lower legs region).
The structural components were realized using fused deposition modeling (FDM). Tough PLA and PETG UHD filaments (3DItaly, Rome, Italy) were employed. To ensure strength, particularly in stress-prone parts, like the cylindrical guide features, a 100% infill density was applied. The theoretical model assumes that impact piece is infinitely rigid, avoiding to add an additional stiffness element in series.
Cylindrical elements act as guides, ensuring the vertical movement of the impact piece during contact. Diverse lengths of those elements prevent the springs from reaching maximum compression (coil-to-coil contact) prematurely in less rigid configurations. This ensures springs to maintain linear behavior.
Frequency Analysis
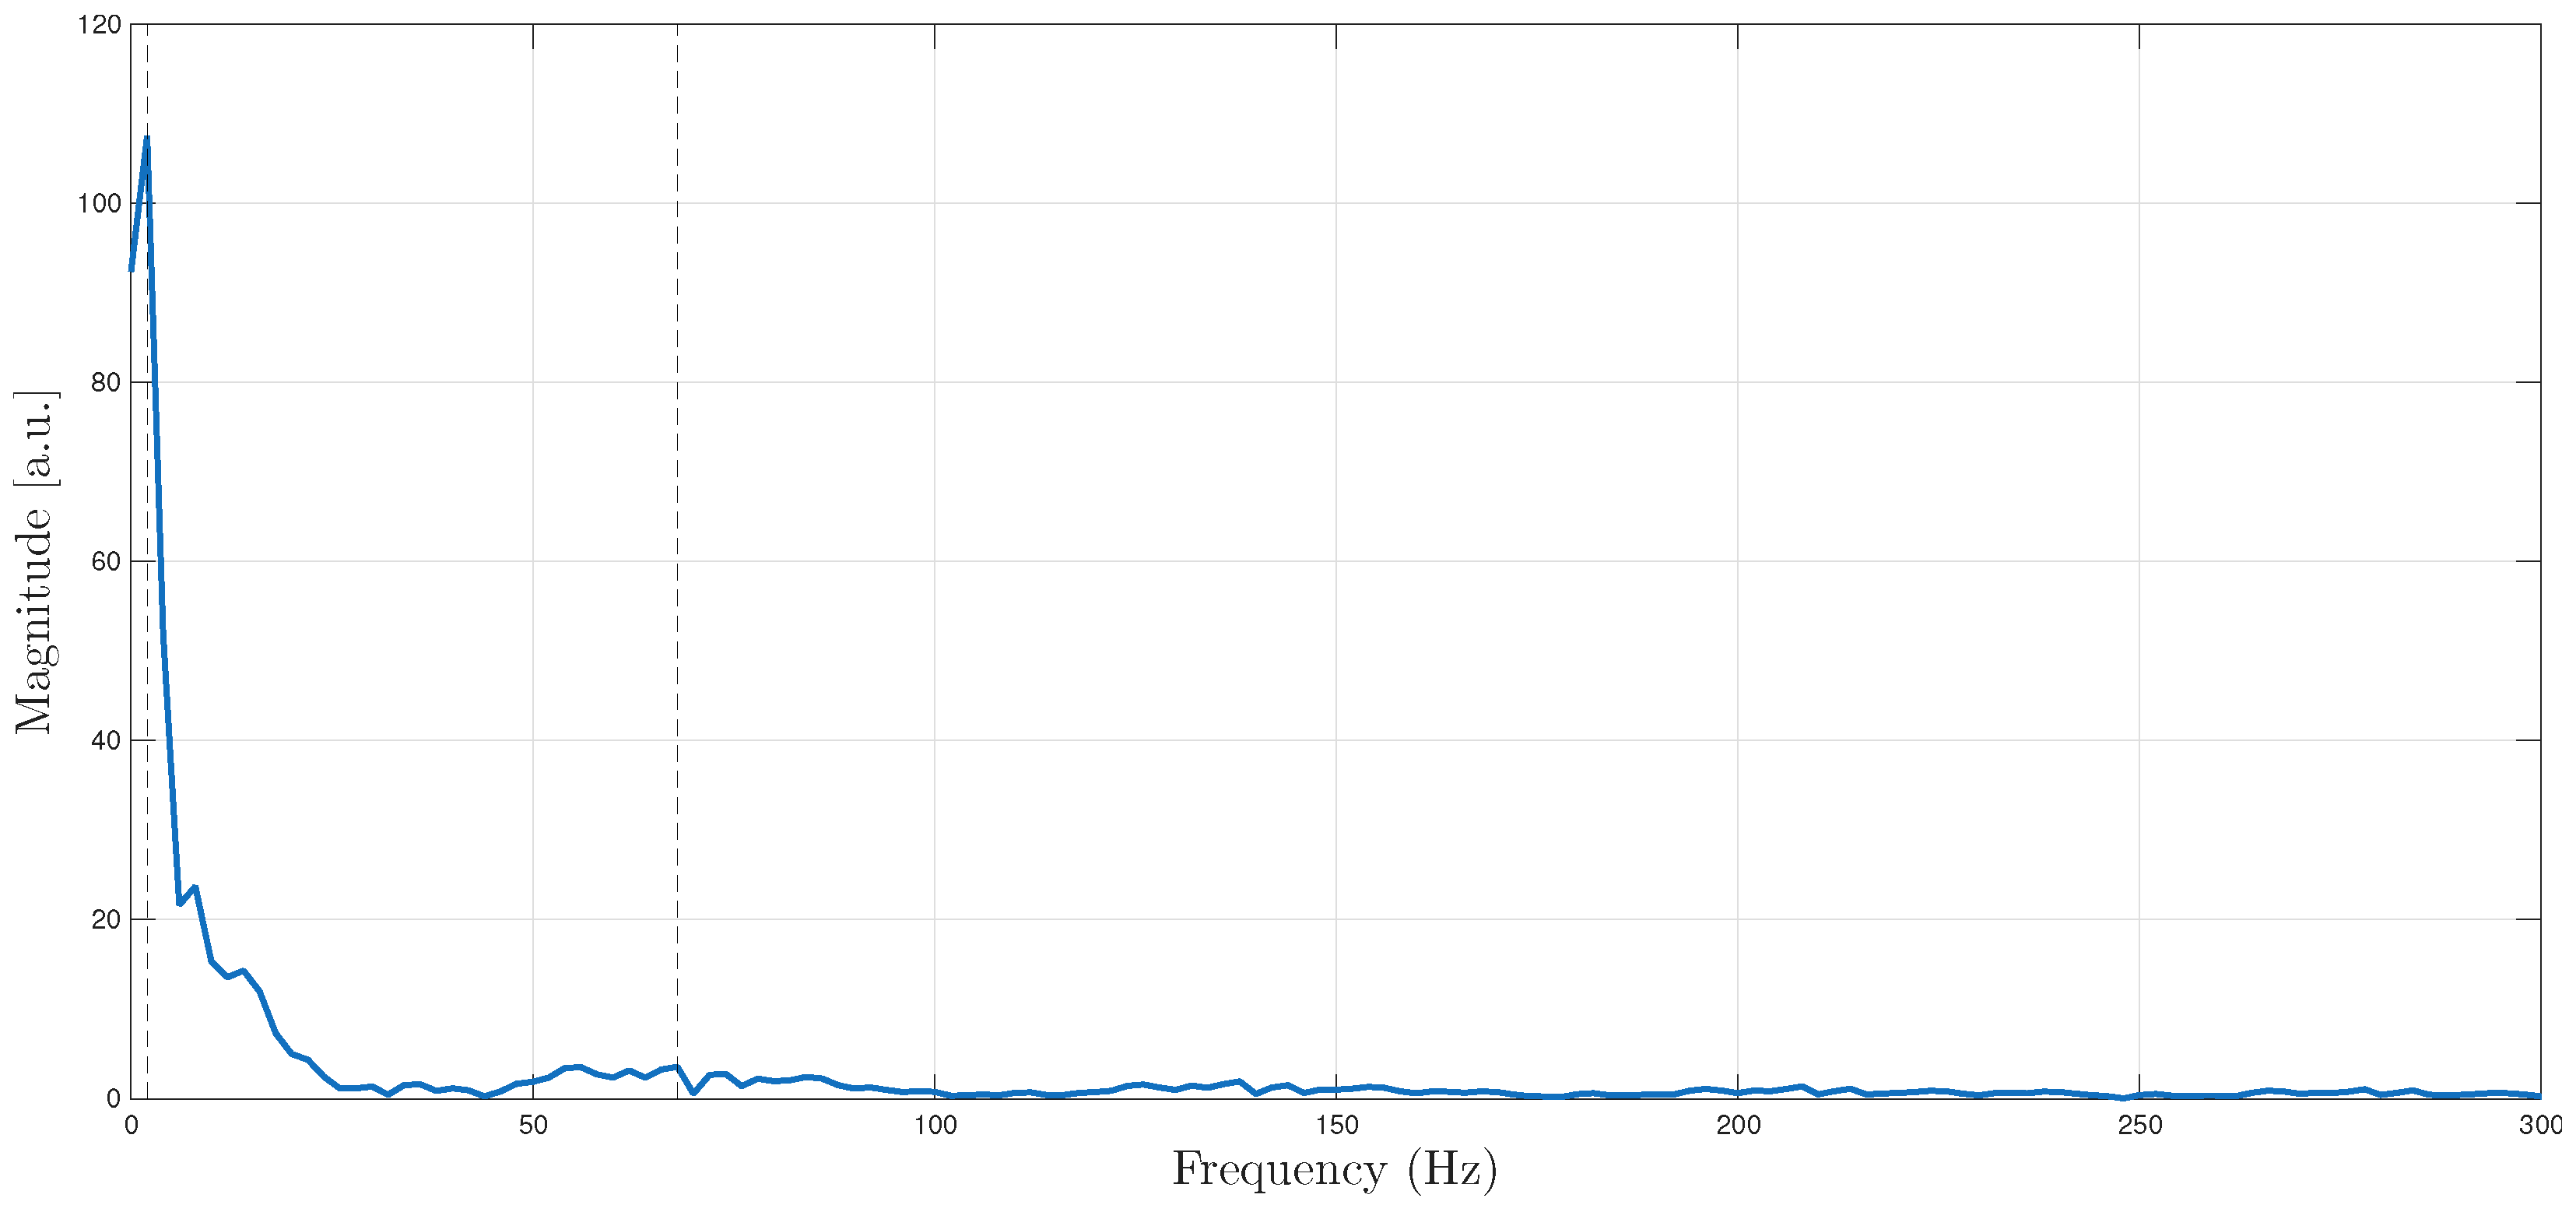
A Fast Fourier Transform (FFT) analysis was carried out in design phase to identify the characteristic frequency range of impacts similar to the ones in the literature. The importance of this analysis lies in the need to select a load cell with an appropriate frequency response, ensuring accurate force measurements during impact events.
The analysis was carried out on a force profile in [
35] and revealed that the significant frequency components of the impact events fall between 2 Hz and 68 Hz (
Figure 3). The frequency range identified through the analysis performed in MATLAB (version 2025a) environment is consistent with the literature [
13], which are also referenced by commercial solutions [
14]. In this context, it is indicated that signals arising from contact events, even when characterized by very rapid dynamics, typically exhibit frequency components extending up to approximately 100 Hz. Given the detail shown above and since sensor noise is declared by producer as 0.000942
at 1 Hz, 0.000488
at 10 Hz and 0.000173
at 100 Hz, the load cell was considered suitable for this work.
3.2. Pre-Deployment Test Protocol
To validate the prototype before using it with a robotic manipulator, a mass drop test protocol was designed. The tests utilized three masses ( g) and two drop heights ( mm).
Using the mass drop structure shown in
Figure 2, the drop height
was set by positioning the mass at the desired height above the impact piece, dropping the ball shaped mass from the hole at the edge of the mass drop structure, ensuring a consistent and repeatable drop for each test. The dropping mass was chosen to be a sphere to ensure repeatable results. The objective is to characterize the prototype and provide repeatable and comparable impact conditions, rather than reproducing every real-world impacts. Five force measurements were recorded for each combination of mass, height, and stiffness configuration. The impact velocity
of the mass
impacting on the prototype was calculated using the equation:
where
g is the acceleration due to gravity. The theoretical impact energy
was determined by the following:
The initial mathematical model for dynamic force (
) during contact after drops assumes that the stiffness
equals the effective elastic constant of the spring assembly. This model accounts for system masses (
M for the falling mass,
m for the impact piece) and the velocities post-impact (
,
), respectively, of the falling mass
and of the impact piece, which depend on the coefficient of restitution
. In fact, using the momentum conservation and the definition of
, the post-impact velocities can be expressed as follows:
The dynamic force can then be derived using the principle of mechanical energy conservation. The maximum elastic deformation
u of the prototype occurs when the sum of kinetic energy of the masses and the potential energy due to gravity is completely stored as elastic energy:
Solving this quadratic equation for the force gives the following:
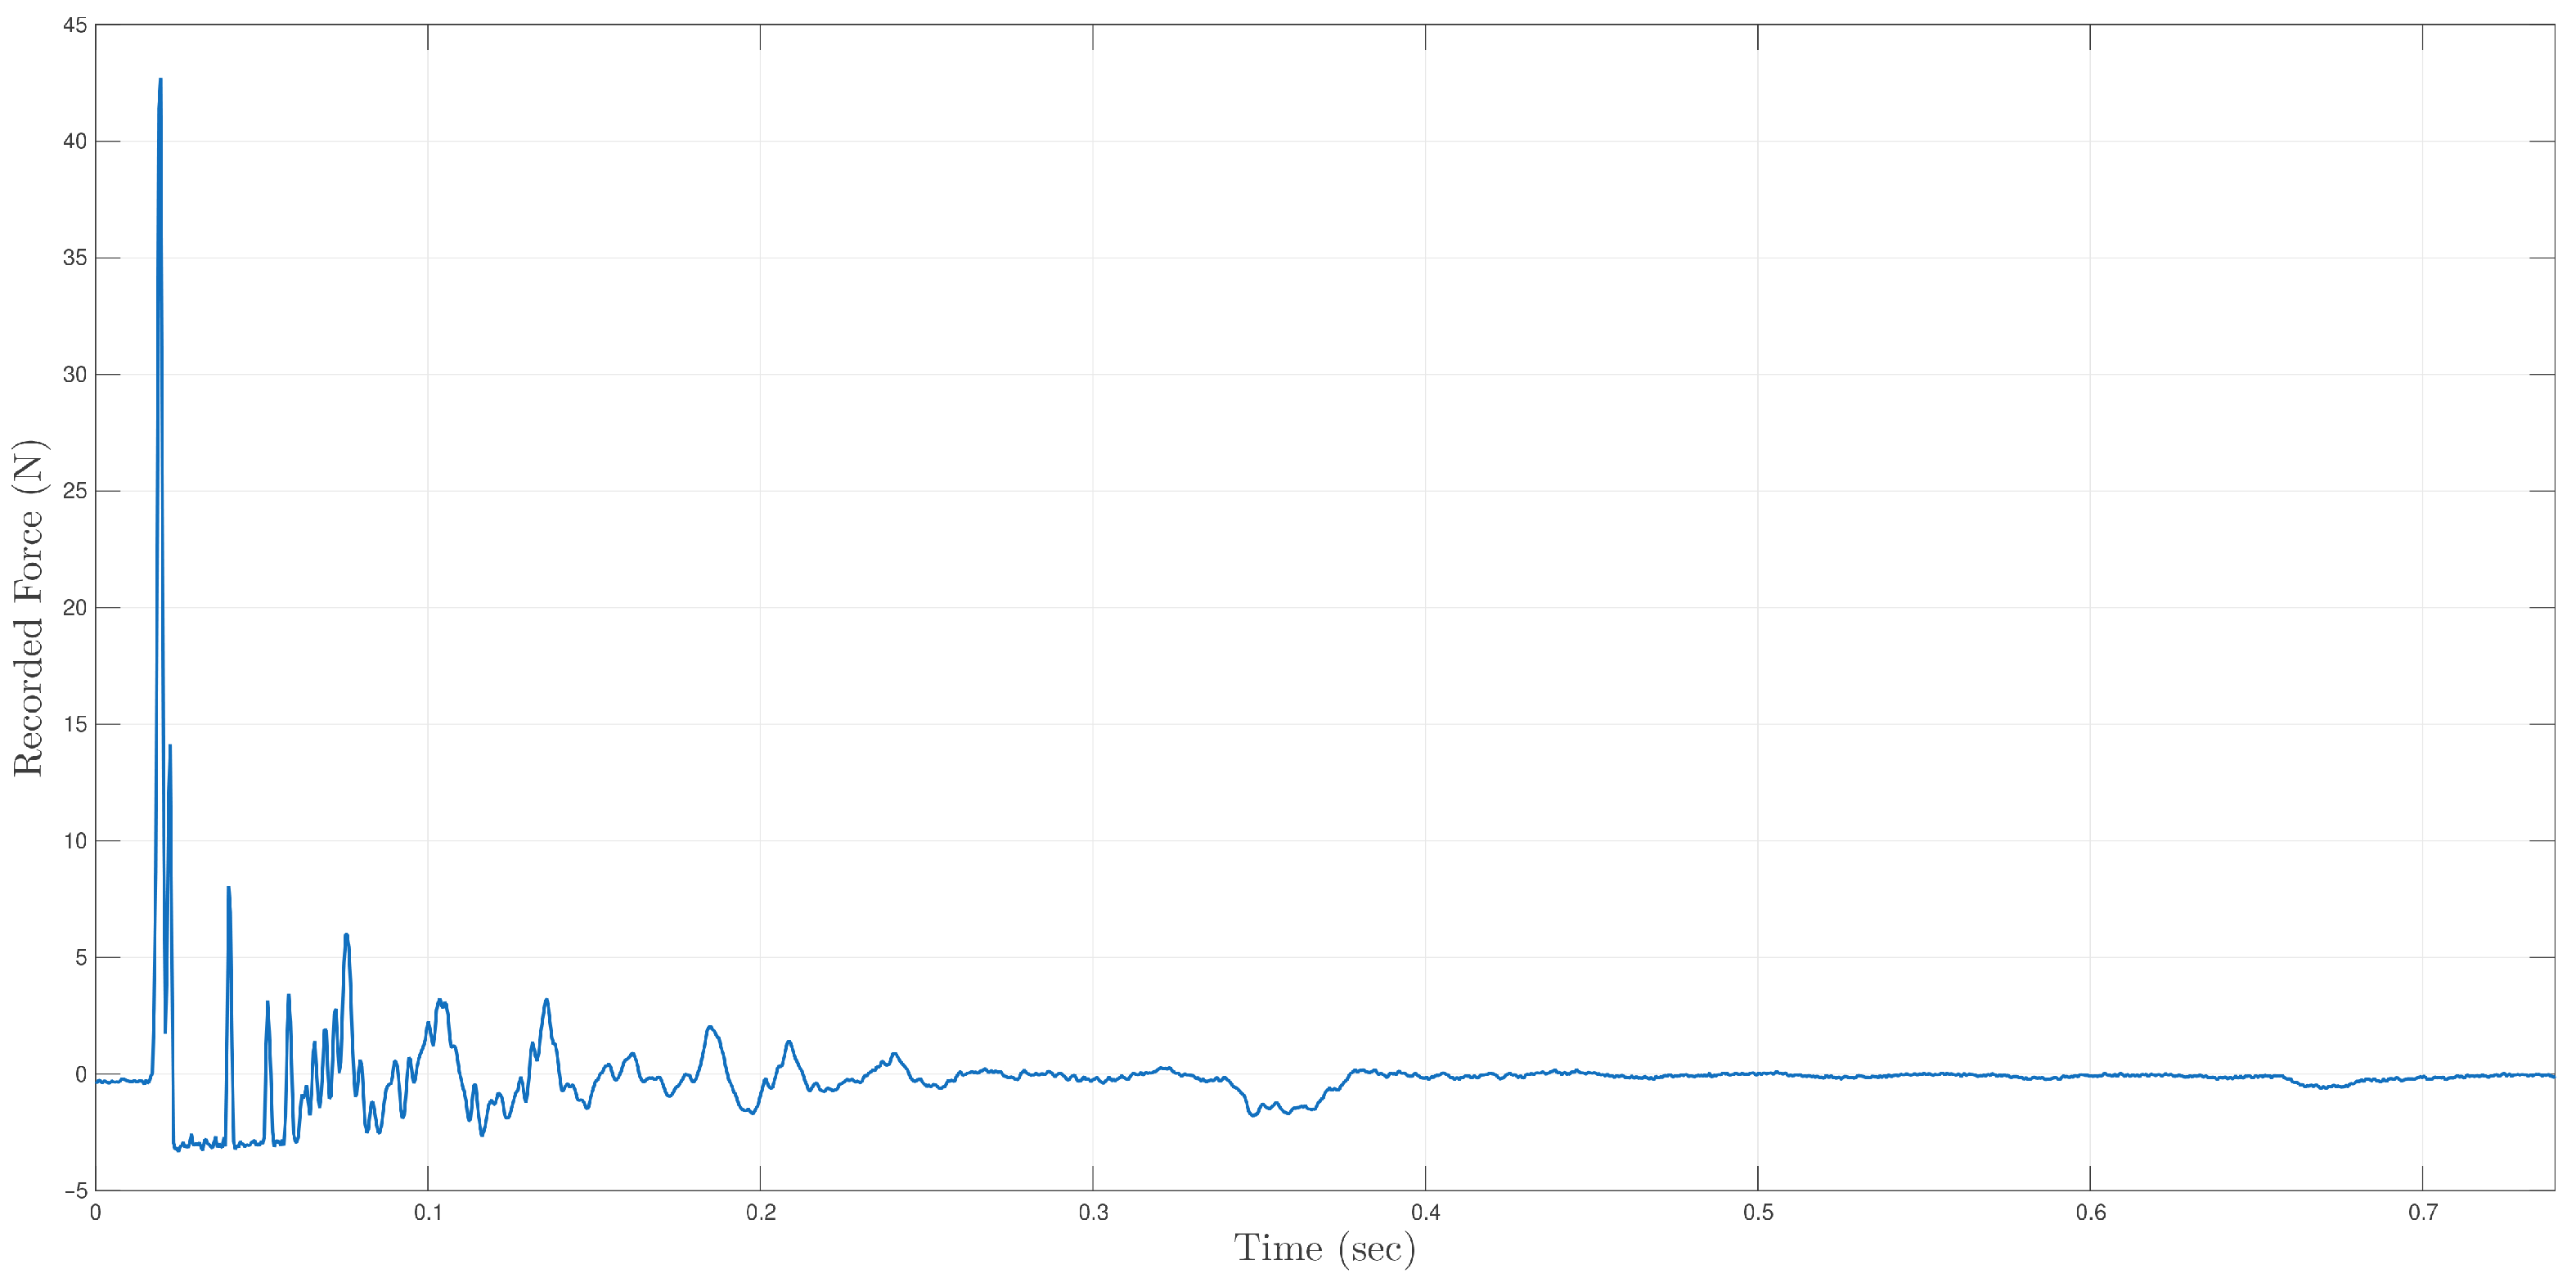
In
Figure 4, the force-time history for the first test is shown, where the peak force
is spotted. Brief negative force values observed immediately after impact are attributable to the intrinsic decay time constant of the piezoelectric load cell. Due to its dynamic high-pass behavior, the rapid unloading phase may produce a transient undershoot in the signal, without representing a physical tensile interaction. The peak force is the maximum value of the force recorded during the impact event and is one of the main parameters of interest for validating the model under ISO constraints [
34]. In
Figure 5, a scheme of test for prototype validation is shown. The hypotheses of this model include assuming the impact piece infinitely rigid, a linear spring behavior, and neglecting air friction and static deflection due to the impact piece weight. These assumptions are reasonable for human–robot impact conditions, as stated in the standards [
34].
The results from the drop tests were compared to theoretical predictions based on the model in Equation (
27). Model performance was quantified using the percentage deviation (
) between the model value (
) and the corrected experimental value (
):
The ISO/TS 15066:2016 model (with , representing a completely inelastic collision) severely underestimated the measured forces. Negative deviations ranged from to .
The model with
(perfectly elastic collision) was selected as the most appropriate for estimating forces in HRC application, as it showed smaller percentage differences (always under 15%), especially for tests with larger masses. Based on the
assumption and the conclusion that the prototype mass (
m) is negligible for peak force magnitude, the simplified dynamic force formulation (
) for mass drop tests (
M dropped from height
h) was derived:
For most configurations using the larger test masses, the deviation () between the simplified model and the corrected experimental data was deemed acceptable, generally falling within an interval of approximately .
The maximum force recorded during each impact was analyzed to assess the prototype’s performance. The experimental data closely matched theoretical expectations, confirming the prototype’s suitability for simulating human–robot impacts.
6. Discussion of Results
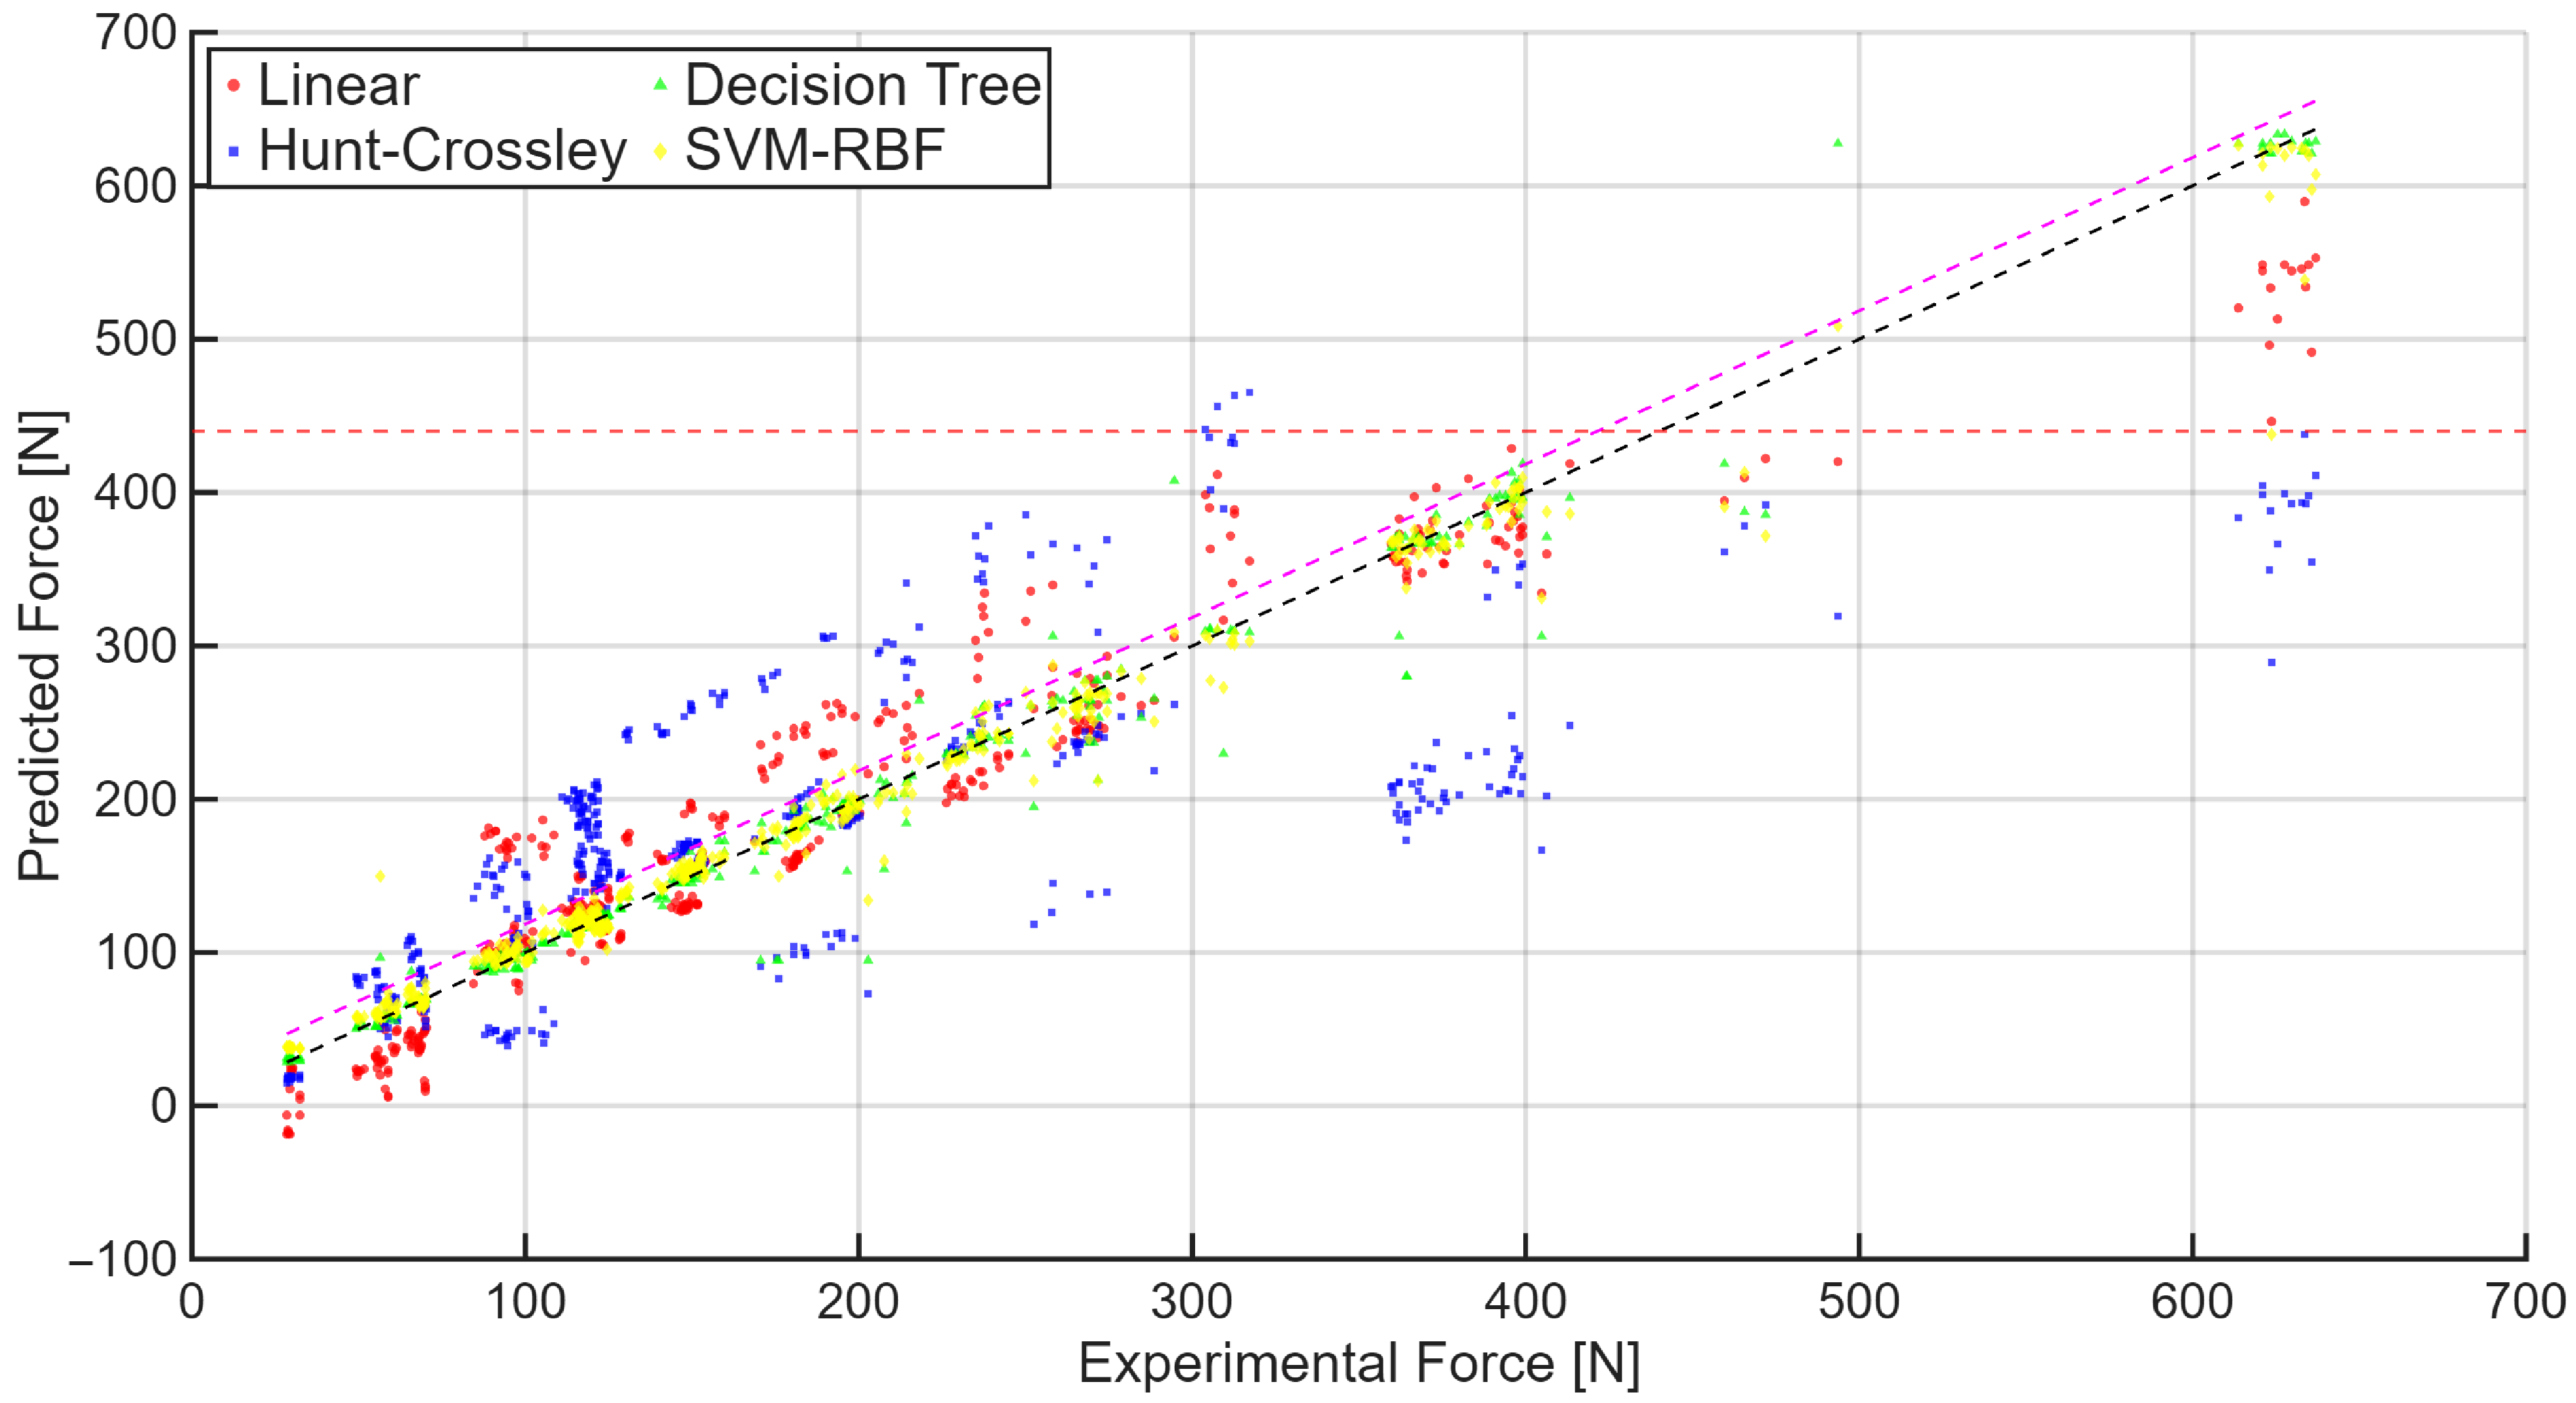
The predictive models for maximum contact force () in this last configuration of input features (, , and ) were evaluated for both accuracy and computational efficiency. Two models were considered: a Decision Tree regressor and a Support Vector Machine (SVM) with an RBF kernel. Each model underwent 5-fold cross-validation (repeated 100 times to estimate execution times.).
6.1. Accuracy and Overfitting Analysis
The predictive performance of the final
models is summarized in
Table 6.
For reference, the Hunt-Crossley (HC) model and the linear regression are also reported in
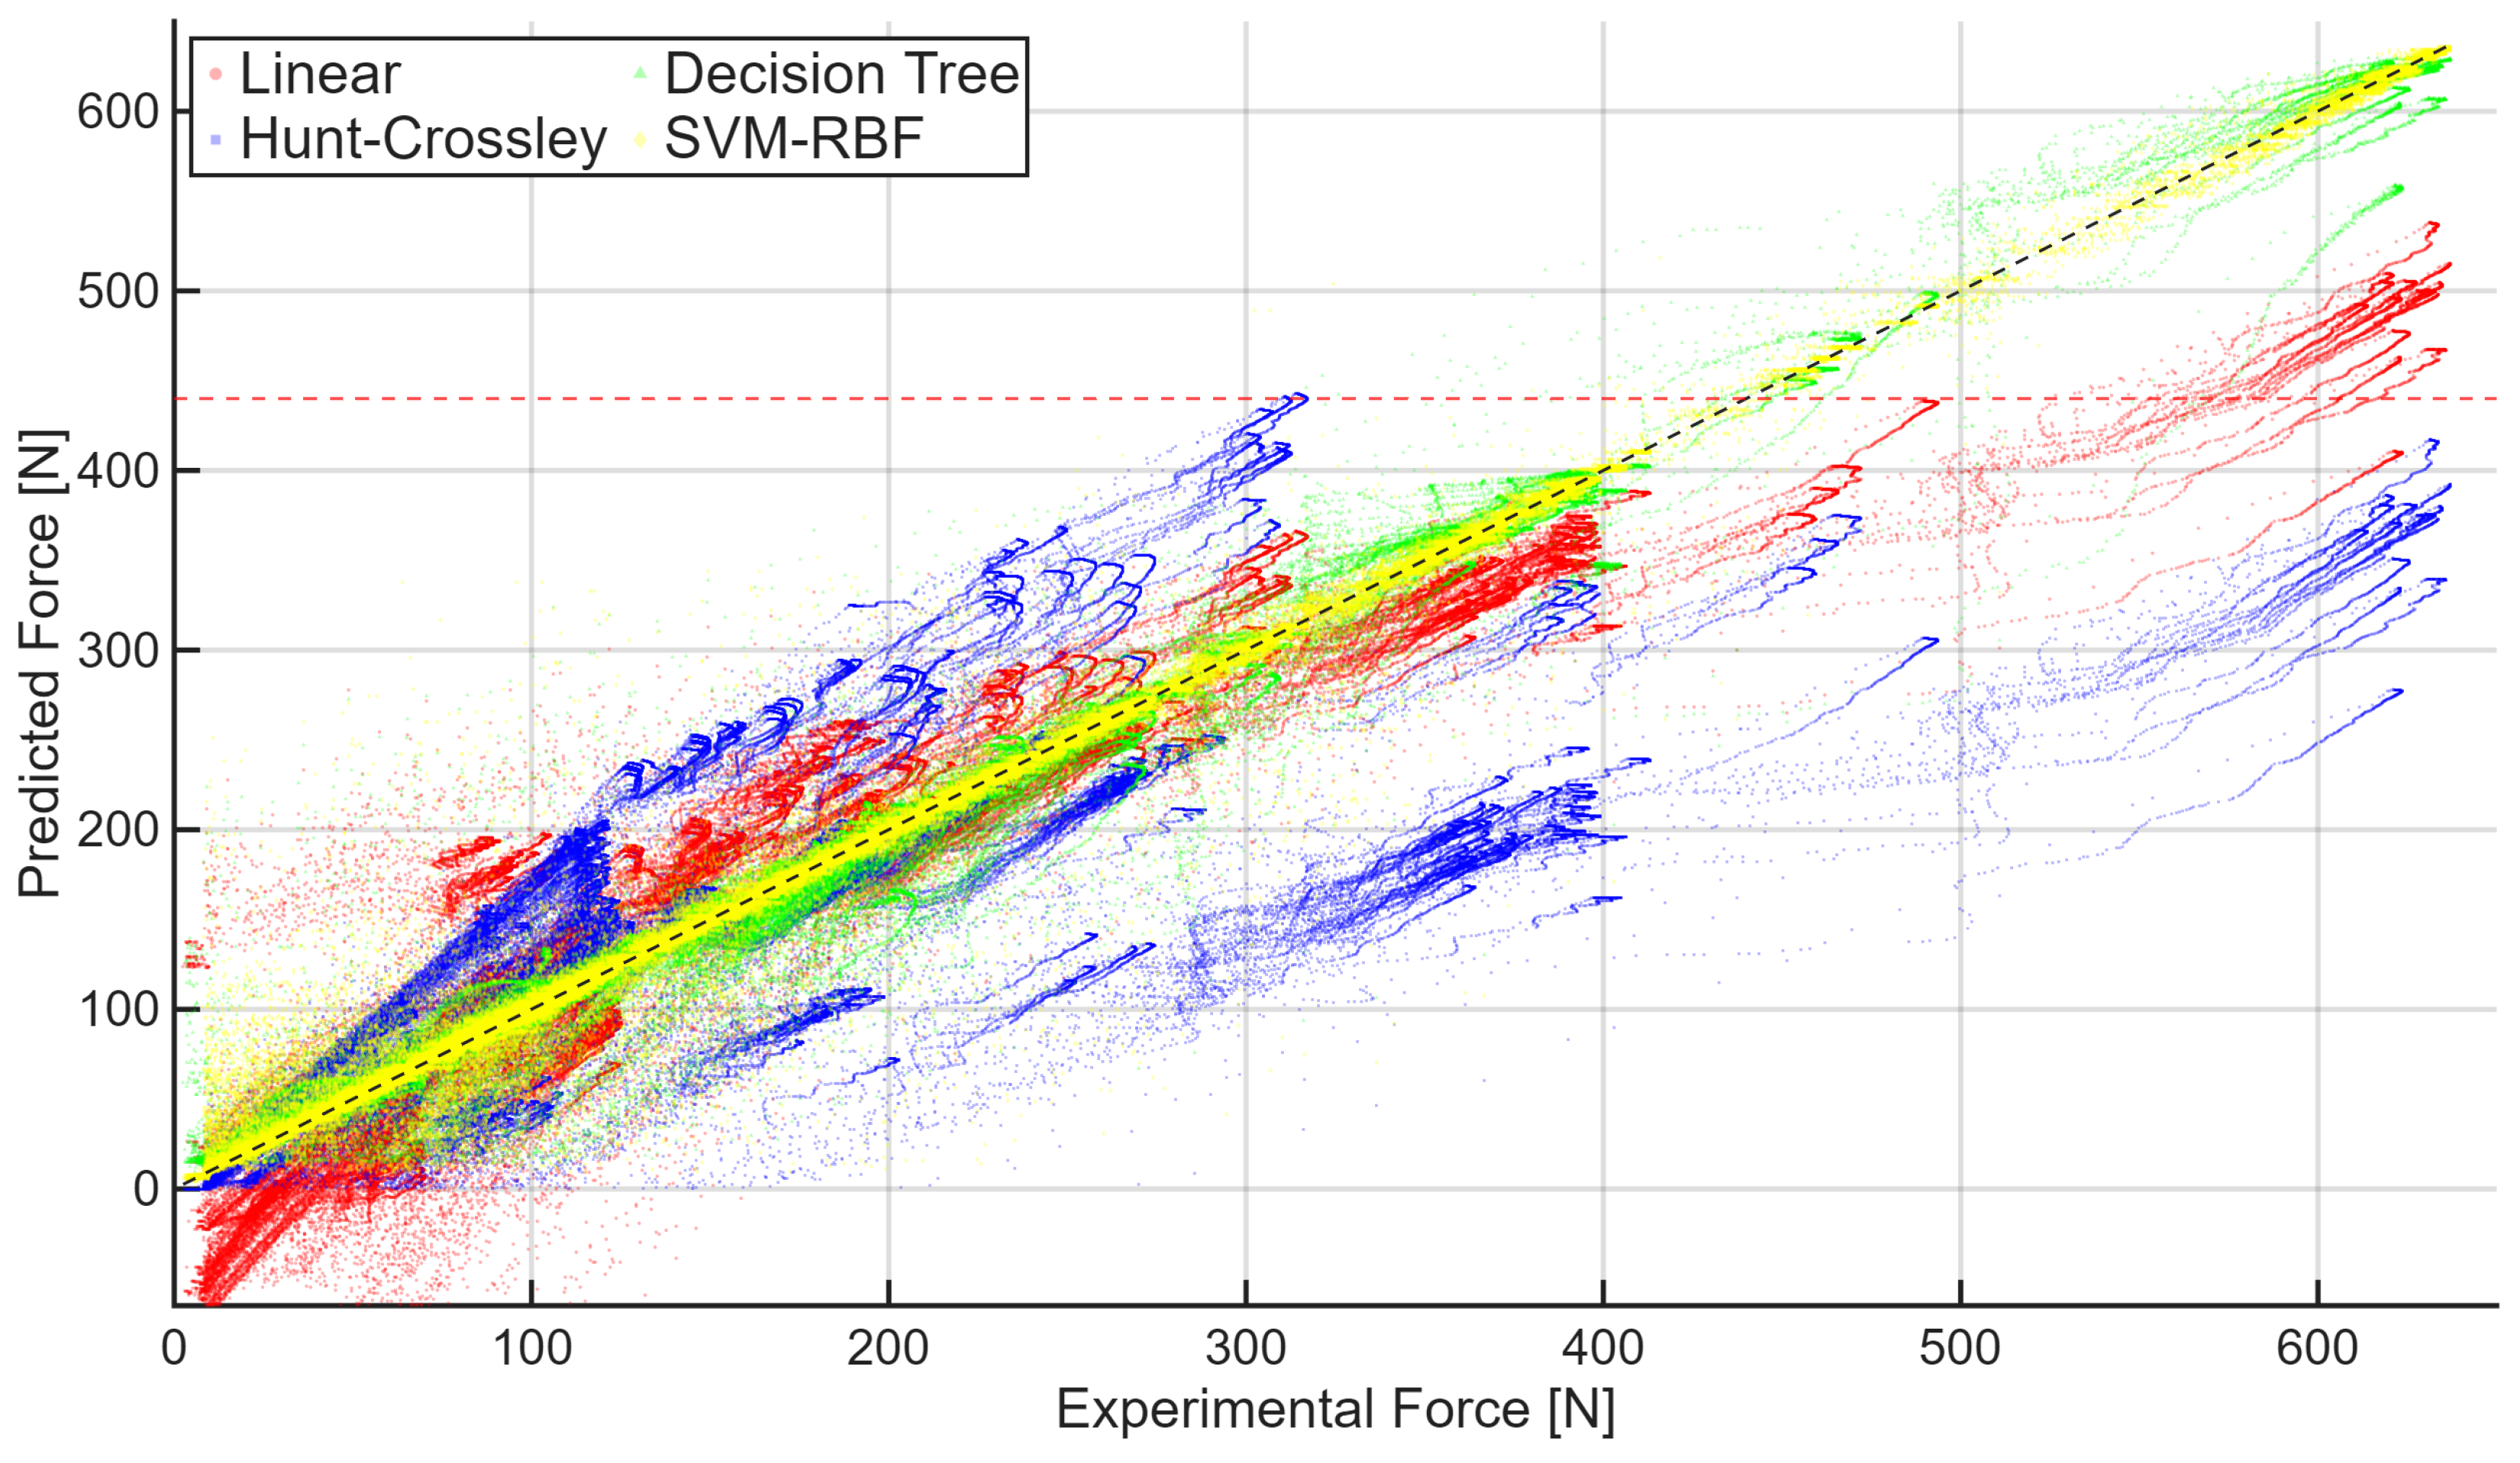
Table 6, showing lower predictive performance than the data-driven models, when generalized and fitted on the full dataset.
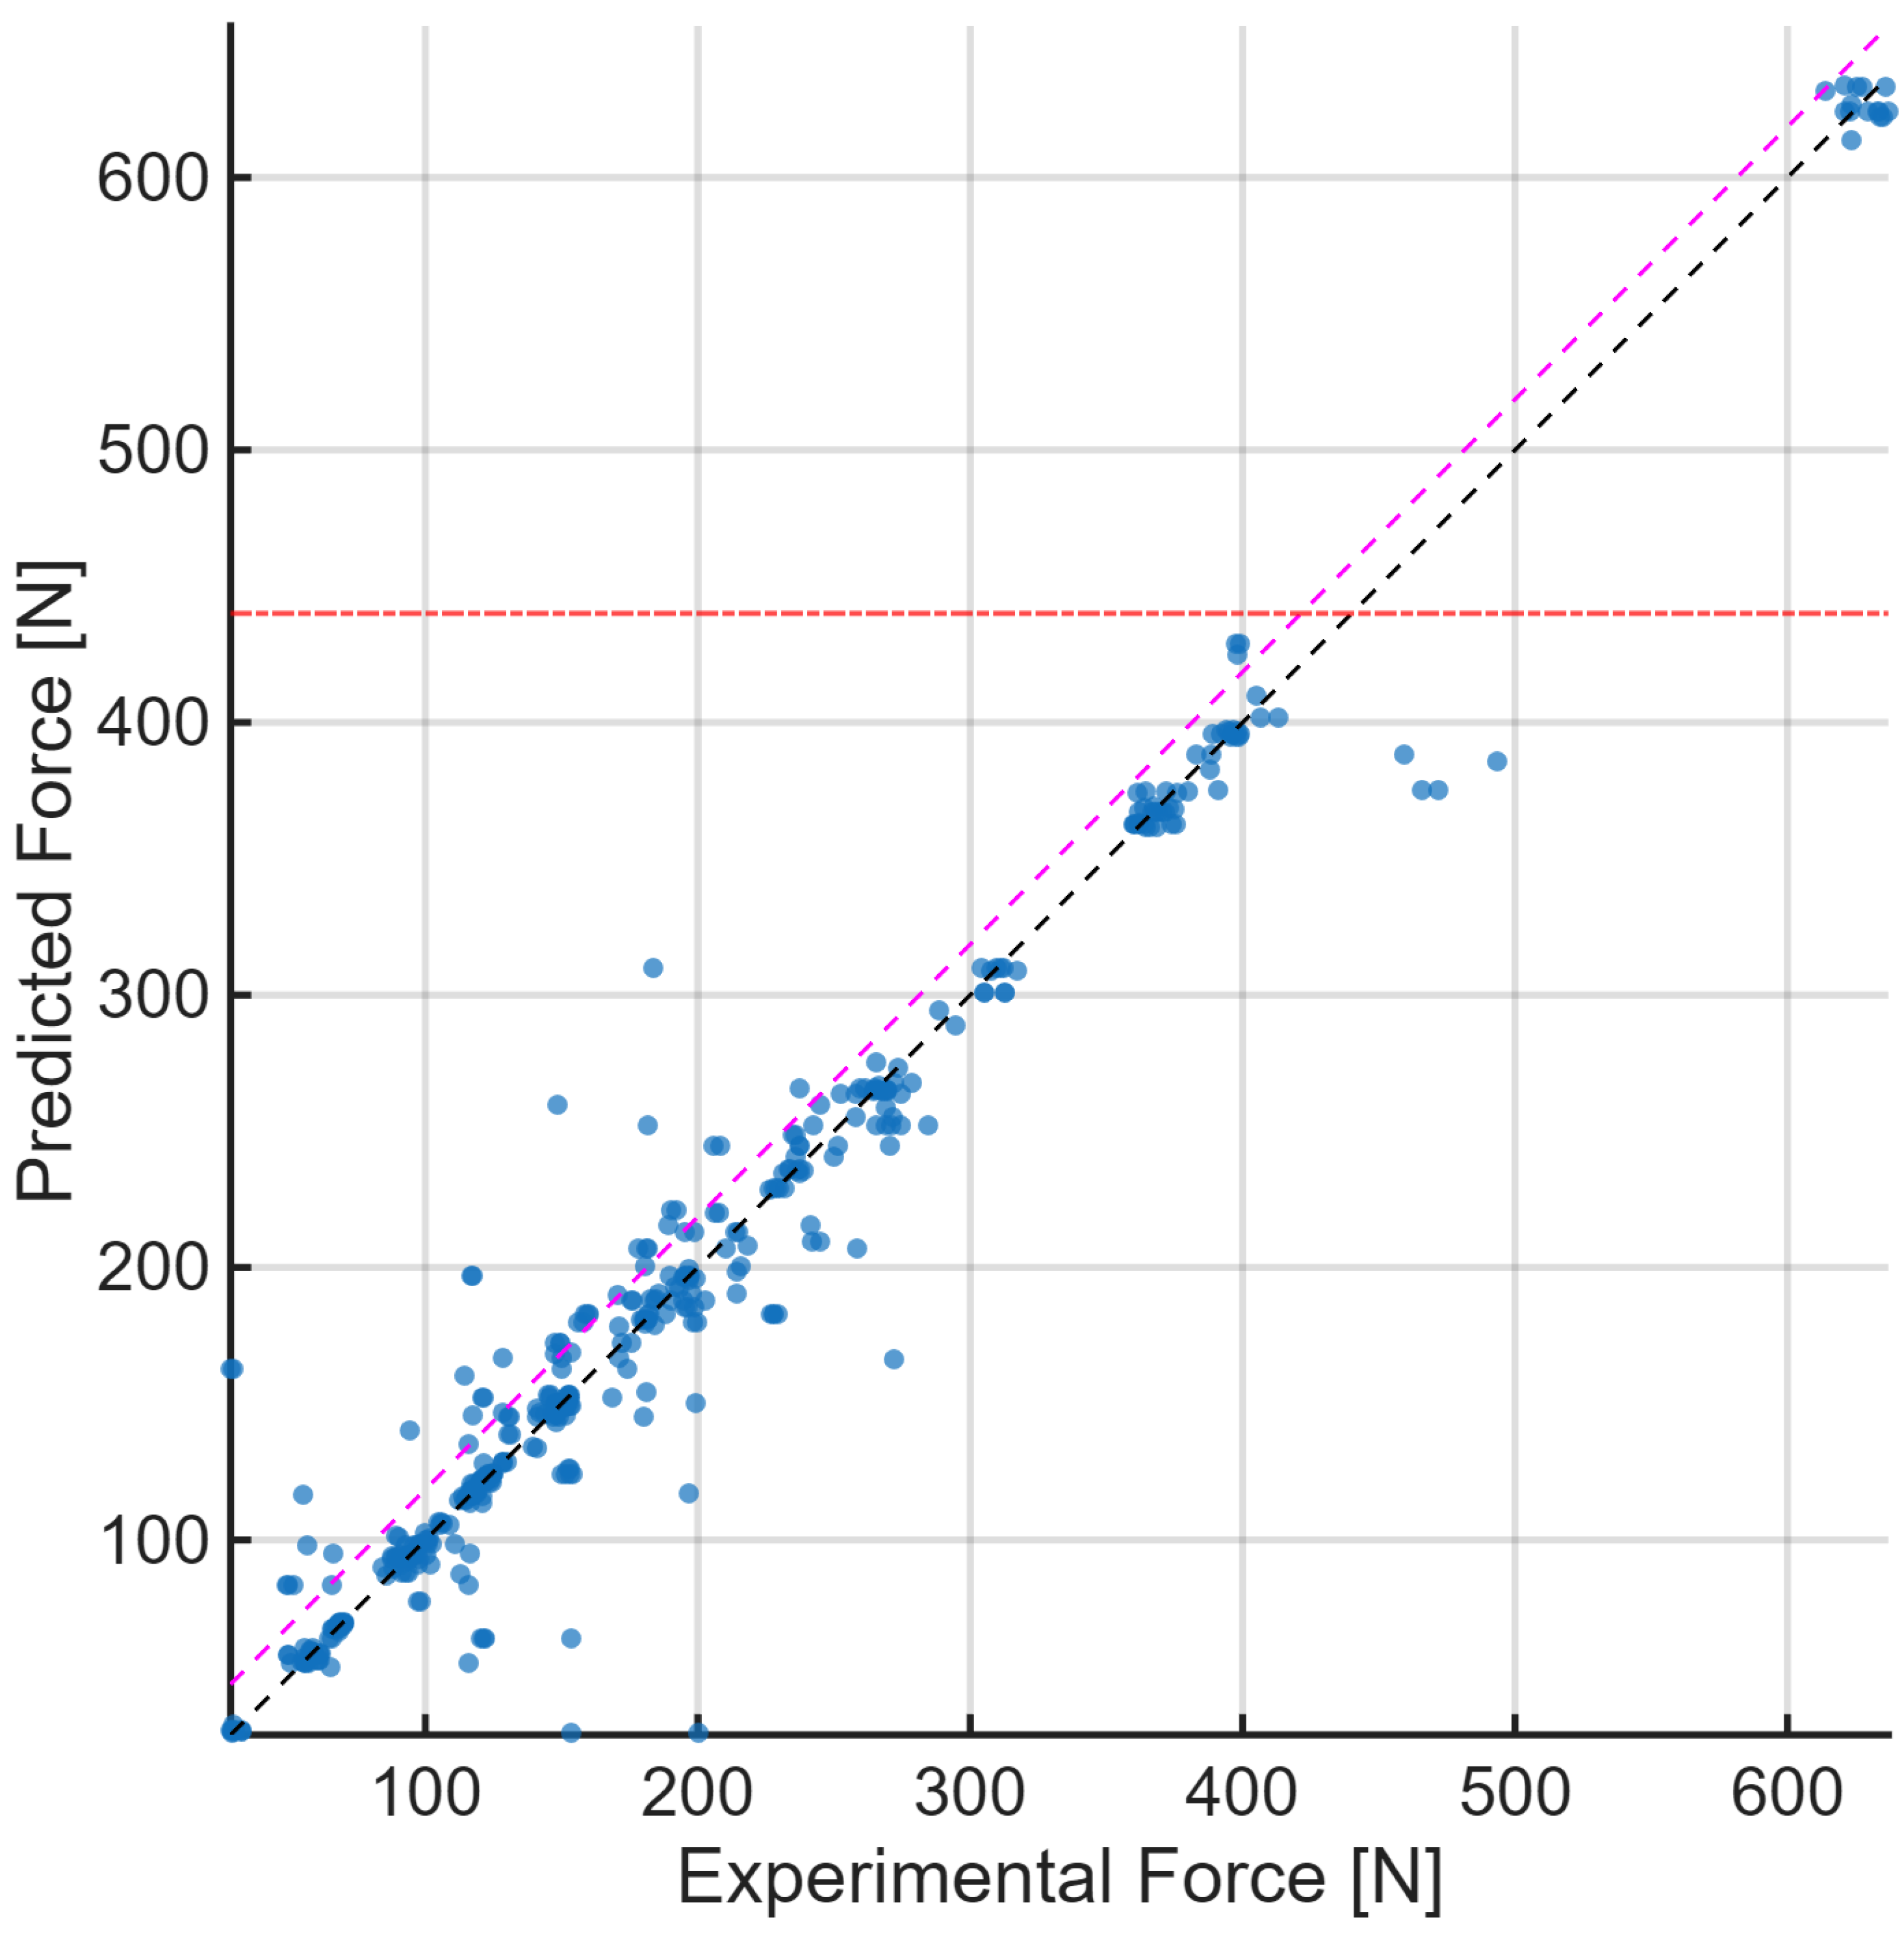
The final SVM model achieves a modest predictive performance, with a cross-validated of 0.6340 ± 0.0781 and an RMSE of 74.74 ± 9.18 N. The final decision tree shows higher cross-validated accuracy, with an of 0.9243 ± 0.0252 and RMSE of 33.08 ± 4.47 N. These results indicate that the decision tree captures more variance of the dataset, whereas the SVM is less accurate.
The final SVM model achieves a modest predictive performance, with a cross-validated of 0.6340 ± 0.0781 and an RMSE of 74.74 ± 9.18 N. The final decision tree shows higher cross-validated accuracy, with an of 0.9243 ± 0.0252 and RMSE of 33.08 ± 4.47 N, being more accurate.
Regarding overfitting, the final SVM exhibits an gap of 0.0930 and an RMSE gap of N, indicating moderate overfitting with smoother RMSE generalization across folds. The decision tree, in contrast, has a smaller gap of 0.0490 but a larger RMSE gap of N, suggesting that it fits the training data more closely in terms of absolute errors while maintaining higher accuracy.
Overall, the SVM provides more uniform generalization across folds, whereas the decision tree achieves higher predictive accuracy but is more prone to fitting specific patterns of the training set.
6.2. Computational Feasibility Analysis
Inference latency was measured by predicting a single sample 500 times to average out measurement noise. The Decision Tree exhibited a mean single-sample latency of ms, while the SVM-RBF showed ms. The training times per fold were ms and ms for the Decision Tree and SVM, respectively. All times are reported in milliseconds (ms). Although these measurements were obtained on a MATLAB desktop environment (Windows 11 Pro, Intel Core i7-13620H 13th generation, 10 cores and 16 logical threads with a base frequency of 2.4 GHz, 16 GB of installed RAM, Geforce RTX 4050 6 GB DDR6), they provide a lower-bound estimate of computational cost. Both models are therefore compatible with real-time control scenarios at typical robotic control frequencies (1–2 kHz).
7. Conclusions
This work presented an integrated experimental and modeling framework to analyze human–robot impact dynamics for collaborative applications. A dedicated impact prototype, compliant with ISO/TS 15066:2016 and PD ISO/PAS 5672:2023, was designed and validated to reproduce the mechanical behavior of different human body regions with tunable stiffness and damping. The resulting setup enabled the acquisition of a large and well-characterized dataset of impacts with a KUKA LBR iiwa 14 R820, spanning multiple effective masses, impact velocities and body regions.
The analysis of the experimental data showed that, under the tested conditions, collisions are almost elastic, with restitution coefficients close to one and a negligible contribution of the damping term in the Hunt-Crossley formulation. Consequently, a simplified Hertz-like model with a single dominant stiffness parameter was sufficient to capture the main characteristics of the force-penetration relationship, with identified stiffness values in good agreement with the normative ones. At the same time, the classical ISO/TS 15066 energetic model, when used with its standard effective mass definition, significantly overestimated peak forces for some ISO body regions, and underestimates for others [
38], whereas the refined effective mass formulation adopted in this work led to more conservative and realistic predictions [
27,
28]. Data-driven models based on Support Vector Machine and Decision Trees improved predictive performance with respect to simple linear and Hunt Crossley formulations, but exhibited different trade-offs in terms of accuracy and generalization. In particular, Decision Tree models achieved higher coefficients of determination and lower RMSE for peak forces prediction, at the cost of a slightly increased tendency to overfit, whereas SVMs provided smoother generalization with lower accuracy. Among the configurations tested, models using a reduced set of physically meaningful inputs (contact velocity and a subset of joint angles) proved suitable for online implementation, ensuring inference times well below five millisecond while maintaining prediction errors within ranges compatible with safety margins for Power and Force Limiting operation. In this perspective, the proposed hybrid strategy—combining interpretable analytical formulations with lightweight machine learning models calibrated on experimental data—provides a practical toolset for supporting real-time risk assessment and for guiding the design and validation of safe collaborative robotic systems.
Future work will extend the proposed framework along several directions. On the experimental side, additional robot configurations, contact geometries and motion tasks will be investigated, including scenarios where the human body is not stationary and where multi-contact events may occur. On the modeling side, the integration of more advanced learning techniques, uncertainty quantification and formal safety margins will be explored, with the aim of embedding the proposed predictors directly into the robot controller for continuous monitoring of collision severity. Ultimately, the methodology introduced in this study can contribute to more informed standardization efforts and to the deployment of collaborative robots that are both productive and intrinsically safe.