


Abstract
PEG-344 is a predicted metabolite transporter implicated in the virulence of hypervirulent Klebsiella pneumoniae, but its role in carbapenem-resistant hypervirulent K. pneumoniae (CR-hvKp) remains unclear. We investigated KPL1, an ST11-KL62 CR-hvKp isolate carrying a peg-344-positive virulence plasmid. An isogenic peg-344 deletion mutant was evaluated using growth assays, an intraperitoneal infection model in male C57BL/6J mice, RNA sequencing, quantitative real-time PCR, and untargeted and targeted metabolomics. Deletion of peg-344 did not cause sustained growth impairment, but prevented mortality over 168 h, reduced organ bacterial burdens by 2–3 log10 CFU/g, and reduced biochemical evidence of hepatic and renal injury. RNA sequencing identified 88 differentially expressed genes, including coordinated downregulation of six histidine utilization (HUT) system genes. Histidine metabolism was significantly enriched, and selected changes were confirmed by qRT-PCR. Histidine-related metabolites were not significant after false-discovery-rate correction in untargeted metabolomics. Targeted UHPLC–MS/MS analysis showed numerically lower mean L-histidine concentrations in mutant-derived samples, although the differences were not statistically significant. These findings extend evidence for peg-344 deletion-associated virulence attenuation to an ST11-KL62 CR-hvKp background and identify coordinated HUT-system repression as a prominent transcriptional response. Because complementation and direct transport assays were not performed and the omics samples were non-matched, these associations do not establish a direct substrate or causal mechanism.
1. Introduction
Klebsiella pneumoniae causes community—and hospital—acquired infections ranging from pneumonia and urinary tract infection to bloodstream infection and liver abscess. Classical strains mainly affect hospitalized or immunocompromised patients, whereas hypervirulent K. pneumoniae (hvKp) can cause invasive and metastatic disease in otherwise healthy individuals [1,2]. The convergence of carbapenem resistance and hypervirulence is particularly concerning because it combines limited therapeutic options with an enhanced capacity for tissue invasion. Such carbapenem-resistant hypervirulent K. pneumoniae (CR-hvKp) can emerge through acquisition of resistance determinants by hvKp, acquisition of virulence plasmids by carbapenem-resistant lineages, or formation of hybrid plasmids [3,4,5]. In China, ST11 carbapenem-resistant K. pneumoniae represents an important background for this convergence [6,7,8].
Virulence plasmids commonly encode regulators of the mucoid phenotype, siderophore systems, and marker genes associated with hvKp. The combination of peg-344, iroB, iucA, plasmid-borne rmpA, and rmpA2 has shown high diagnostic accuracy in a defined strain collection, but genotype alone does not fully establish hypervirulence and should be interpreted with phenotypic evidence and strain background [1,9,10,11]. PEG-344 is predicted to be an inner-membrane metabolite transporter. In hvKP1, deletion of peg-344 reduced virulence in a pulmonary model but not in a subcutaneous model, suggesting that its contribution may depend on the infection environment and availability of an unidentified metabolite [12]. Its physiological substrate and role in carbapenem-resistant hvKp remain unresolved.
KPL1 is a clinical ST11-KL62 carbapenem-resistant isolate carrying a remodeled virulence plasmid with peg-344, rmpA/rmpA2, and iucABCD-iutA, but without a complete iroBCDN salmochelin locus. This non-classical resistance–virulence convergence provides a relevant setting in which to examine PEG-344 without assuming that all canonical hvKp loci are present. Because PEG-344 is predicted to function as a metabolite transporter, we further investigated its potential association with bacterial metabolic adaptation. The histidine utilization (HUT) system mediates the sequential degradation of histidine through urocanate and downstream intermediates to glutamate, thereby contributing to bacterial carbon and nitrogen metabolism. In K. pneumoniae, HUT-system expression is regulated by nutrient availability and the HutC repressor, while HutT participates in urocanate transport [13,14]. These functions suggest that the HUT system may contribute to bacterial metabolic flexibility under changing nutrient conditions.
We therefore constructed an isogenic peg-344 deletion mutant in KPL1 and assessed bacterial growth, systemic virulence, tissue colonization, organ injury, transcriptional remodeling, and metabolic changes. Whole-genome sequencing, mouse infection assays, RNA sequencing, qRT-PCR, and untargeted and targeted metabolomics were used to determine whether PEG-344 contributes to the full virulence of this clinical CR-hvKp isolate and to explore its association with HUT-related metabolic adaptation.
This design deliberately separated two questions. The infection experiments tested whether PEG-344 contributes to the phenotype of the intact clinical strain, whereas the omics experiments were used to generate mechanistic hypotheses rather than to assign a transported substrate. This distinction is important because virulence-associated plasmids contain multiple interacting loci and because a transcriptional or metabolite-level association cannot, by itself, identify the biochemical activity of a predicted transporter.
2. Materials and Methods
2.1. Bacterial Strains and Culture Conditions
KPL1 was recovered from a tracheal aspirate obtained from a 73-year-old man with pulmonary infection at the First Affiliated Hospital of Zhengzhou University, China. The isolate was cultured on Columbia blood agar at 35 °C under anaerobic conditions for 24 h and identified as K. pneumoniae by MALDI-TOF MS (Bruker Daltonik, Bremen, Germany). Antimicrobial susceptibility testing showed resistance to carbapenems and multiple additional agents (Supplementary Table S1). The parental strain and its isogenic peg-344 deletion mutant are referred to as KPL1_WT and KPL1_KO, respectively. NTUH-K2044 and the carbapenemase-producing strain HS11286 served as high- and low-virulence reference strains. Unless otherwise stated, strains were cultured on LB agar or in LB broth at 37 °C with shaking at 200 rpm and stored at −80 °C in 20% glycerol.
2.2. Whole-Genome Sequencing and Genomic Analysis
Genomic DNA from KPL1_WT was assessed by agarose gel electrophoresis and Qubit fluorometry. Whole-genome sequencing was performed by Novogene Co., Ltd. (Beijing, China) using PacBio long reads and Illumina paired-end 150 bp reads. Long reads were assembled with Canu v2.0, polished with Racon v1.4.13, and corrected with Pilon v1.22 using Illumina reads [15,16,17]. Protein-coding genes were predicted with GeneMarkS v4.17. Sequence type and capsular locus were assigned using Kleborate v2.4.1 and Kaptive v2.0.9; virulence and antimicrobial-resistance determinants were queried against VFDB and CARD; plasmid replicons were assessed using PlasmidFinder v2.1.6 [18,19,20,21,22]. The main characteristics of the three KPL1 plasmids are summarized in Supplementary Table S2.
2.3. Comparative Analysis of the peg-344 Locus
The peg-344 region and flanking open reading frames were extracted from pKPL1-Vir and compared by BLASTn (BLAST+ v2.16.0) with the corresponding region of the NTUH-K2044 virulence plasmid pK2044 (GenBank AP006726.1). Adjacent proteins were examined by BLASTp (BLAST+ v2.16.0) against the NCBI non-redundant database, and comparative maps were generated with Easyfig v2.2.5 [23,24].
2.4. Construction and Validation of the peg-344 Deletion Mutant
KPL1_KO was generated using a two-plasmid CRISPR–Cas9 system with minor modifications [25,26]. Electrocompetent KPL1_WT cells were prepared from cultures at OD600 0.5–0.6 by two washes in ice-cold 10% glycerol. pCasKP-apr was introduced by electroporation, and transformants were selected at 30 °C on LB agar containing 50 μg/mL apramycin. A spacer targeting nucleotides 752–781 of peg-344 was cloned into pSGKP-km. Approximately 500 bp upstream and downstream homology arms were joined by overlap-extension PCR and inserted into the spacer-containing plasmid to create the donor template. The sequence-verified recombinant plasmid was electroporated into KPL1_WT carrying pCasKP-apr, and colonies were selected at 30 °C on LB agar containing 0.2% L-arabinose, 25 μg/mL apramycin, and 25 μg/mL kanamycin. External primers were used to distinguish the approximately 2 kb wild-type and 1 kb deletion amplicons; primer sequences are listed in Supplementary Table S3.
KPL1_KO was additionally subjected to Illumina paired-end resequencing. Quality-filtered reads were mapped to the KPL1_WT reference assembly to verify loss of the target interval, retention of the virulence-plasmid backbone, and the absence of obvious unintended changes at the locus.
PCR products spanning the deletion junction were evaluated by agarose gel electrophoresis and sequence verification. Read depth across the target and both flanking regions was inspected in relation to the mean chromosomal and plasmid depths. These complementary checks were used because loss of the entire virulence plasmid could otherwise produce an apparent negative result for peg-344 while simultaneously removing other virulence determinants.
2.5. Growth-Curve Assay
Overnight KPL1_WT and KPL1_KO cultures were diluted in LB broth to an initial OD600 of approximately 0.05 and distributed into 96-well plates with five replicate wells per strain. OD600 was monitored for 72 h using a BMG LABTECH microplate reader (Ortenberg, Germany). Growth curves were analyzed by two-way repeated-measures analysis of variance in GraphPad Prism 9.
2.6. Mouse Systemic Infection Model
Male C57BL/6J mice (6–8 weeks old; 20.0 ± 1.0 g) were obtained from SPF (Beijing) Biotechnology Co., Ltd. (Beijing, China) and maintained under specific-pathogen-free conditions at the Laboratory Animal Center of Henan University of Chinese Medicine. Mice were housed six per cage at 22–24 °C and 45–55% relative humidity under a 12 h light/dark cycle, with food and water provided ad libitum. Animals were acclimatized for 7 days before infection.
For survival analysis, mice were randomly assigned to PBS, HS11286, NTUH-K2044, KPL1_WT, or KPL1_KO groups (n = 10 per group). Mice were intraperitoneally injected with approximately 1 × 10⁶ CFU per 20 g of body weight in approximately 100 μL; controls received PBS. Survival was monitored for 168 h and analyzed using the log-rank test. Animals were assessed at least twice daily and euthanized by cervical dislocation upon reaching humane endpoints, including severe lethargy, inability to access food or water, loss of the righting reflex, respiratory distress, or severe hypothermia. No anesthesia or analgesia was used.
An independent cohort containing the same five groups (n = 5 per group) was euthanized at 24 h. The liver, spleen, lungs, and kidneys were collected, and approximately 0.01 g of tissue was homogenized in PBS at a 1:3 mass-to-volume ratio. Serial dilutions were plated on LB agar, and bacterial burdens were expressed as CFU/g. Serum alanine aminotransferase, aspartate aminotransferase, blood urea nitrogen, and creatinine were measured by Servicebio Technology Co., Ltd. (Wuhan, China). A total of 75 mice were used.
2.7. Untargeted Metabolomics
Six independent cultures per strain were grown to OD600 0.55–0.65. Cultures were centrifuged at 12,000× g rpm for 5 min at 4 °C, and pellets were washed twice with precooled PBS. Pellet and supernatant fractions were snap-frozen and analyzed by Shanghai Majorbio Bio-pharm Technology Co., Ltd. (Shanghai, China). Pellet metabolites were extracted with methanol/water (4:1, v/v) containing internal standards, subjected to low-temperature grinding and sonication, and clarified by centrifugation. Pooled quality-control samples were prepared from equal aliquots of all extracts.
LC–MS was performed on a UHPLC-Q Exactive HF-X system (Thermo Fisher Scientific, Waltham, MA, USA) using an ACQUITY UPLC HSS T3 column (Waters Corporation, Milford, MA, USA) and positive- and negative-ion electrospray acquisition over m/z 70–1050. Raw data were processed in Progenesis QI v3.0 for peak detection, alignment, and integration. Features were annotated by MS/MS matching against HMDB, METLIN, and the Majorbio database with a mass-error threshold below 10 ppm. Variables failing the 80% presence rule or showing a relative standard deviation above 30% in quality-control samples were removed; remaining intensities were sum-normalized and log10-transformed. PCA and OPLS-DA were performed on the Majorbio Cloud platform. Candidate features were screened using VIP ≥ 1, nominal p < 0.05, and fold change ≥ 1.2 or ≤0.833. KEGG annotation and pathway enrichment were exploratory; metabolite identities based only on database matching were considered putative [27,28,29].
Pellet and supernatant datasets were processed and interpreted separately because they represent different biological compartments and have markedly different concentration ranges and matrix effects. PCA was used primarily to visualize overall sample structure. Features meeting the nominal screening criteria were displayed in volcano plots for hypothesis generation, but were not described as statistically confirmed metabolites unless they also met the relevant multiple-testing criterion or were independently quantified with authentic standards.
2.8. RNA Sequencing
Three independent KPL1_WT and KPL1_KO cultures were grown under the same conditions and harvested at OD600 0.5–0.6. Total RNA was extracted after rapid stabilization, residual DNA was removed, and rRNA was depleted using the RiboCop kit (Lexogen GmbH, Vienna, Austria) for mixed bacterial samples. Strand-specific libraries were prepared with the Illumina Stranded mRNA Prep, Ligation kit (Illumina, Inc., San Diego, CA, USA) and sequenced on a NovaSeq 6000 (Illumina, Inc.). Adapter-contaminated, low-quality, N-rich, and short reads were removed. Clean reads were aligned with Bowtie2 [30], expression was quantified with RSEM [31], and count-based differential analysis was performed with DESeq2 v1.40.2 [32]. Genes with FDR < 0.05 and |log2 fold change| > 1 were considered differentially expressed. GO and KEGG enrichment analyses used Fisher’s exact test with multiple-testing correction on the Majorbio Cloud platform. To evaluate potential transcriptional effects on genes neighboring peg-344, the corresponding genes were identified based on their genomic positions on pKPL1-Vir, and their expression profiles were extracted from the RNA-seq dataset. The identified neighboring genes were subsequently matched to the corresponding annotations in the RNA-seq reference genome. Genes with ambiguous or non-unique annotation correspondence, particularly certain hypothetical protein- and transposase-associated genes, were excluded from the expression comparison to avoid potentially incorrect assignments.
2.9. Quantitative Real-Time PCR
RNA-seq expression changes in hutH, hutG, hutI, and hutT were validated using three independent cultures per strain harvested under the RNA-seq conditions. RNA was extracted with the RNAprep Pure Cell/Bacteria Kit (DP430; TIANGEN, Beijing, China), and genomic DNA removal and reverse transcription were performed with PrimeScript RT Reagent Kit with gDNA Eraser (RR047Q; Takara, Kusatsu, Japan). RNA purity was assessed by NanoDrop 2000 (Thermo Fisher Scientific) and integrity by agarose gel electrophoresis. cDNA was synthesized from 1.5 μg RNA in 20 μL and diluted 10-fold.
qRT-PCR was performed on a QuantStudio 5 using Taq Pro Universal SYBR qPCR Master Mix (Q712; Vazyme, Nanjing, China). Each 20 μL reaction contained 10 μL master mix, 0.4 μL of each 10 μM primer, and 2 μL diluted cDNA. Cycling comprised 95 °C for 30 s, followed by 40 cycles of 95 °C for 10 s and 60 °C for 15 s; melting curves verified specificity. The reference genes recA and yciH were initially considered for qRT-PCR normalization. Reference-gene Ct distributions were examined across KPL1_WT and KPL1_KO biological replicates, and primer amplification efficiencies were evaluated using standard curves generated from serially diluted cDNA. Although yciH showed comparable mean Ct values between the two strains, its amplification efficiency was 131.78%, exceeding the commonly accepted range of 90–110%. Therefore, yciH was excluded from the final normalization procedure. The recA gene was selected as the sole reference gene based on its acceptable amplification efficiency (98.27%) and previous evidence supporting its use as a candidate reference gene in K. pneumoniae [33]. Amplification efficiencies were initially evaluated using standard curves prepared from pooled cDNA. For certain HUT-associated targets, the pooled template did not provide a sufficiently reliable dilution series, potentially because of the low abundance of the target transcripts after pooling. Therefore, cDNA from one randomly selected wild-type biological replicate (WT-2) was used to generate the standard curves for hutH, hutI, and hutT. Pooled cDNA was retained for recA, yciH, and hutG. Amplification efficiencies were calculated from the slopes of the standard curves, and the template sources and validation results are provided in Supplementary Table S6.
Nevertheless, a modest between-group Ct difference was observed for recA, and this limitation was considered when interpreting the qRT-PCR results. Primer amplification efficiencies and candidate reference-gene Ct distributions are provided in Supplementary Tables S6 and S7, respectively.
Relative gene expression was calculated using the 2−ΔΔCt method with recA as the reference gene and KPL1_WT as the calibrator [34]. Technical triplicates were averaged, and statistical comparisons between groups were performed using ΔCt values and two-sided Welch’s t-tests. Primer sequences are provided in Supplementary Table S5.
2.10. Targeted Quantification of L-Histidine
KPL1_WT and KPL1_KO were cultured under comparable conditions and harvested at an OD600 of approximately 0.6. To provide an additional assessment of bacterial-load comparability at this sampling density, viable bacterial counts were determined under comparable culture conditions, yielding approximately 2.0 × 10⁸ CFU/mL for KPL1_WT and 2.4 × 10⁸ CFU/mL for KPL1_KO. These measurements were used as supporting information on bacterial density rather than for normalization of individual metabolomics samples.
Cell pellets and culture supernatants were separated at 12,000 rpm for 10 min at 4 °C, and the pellets were washed twice with PBS. Targeted amino-acid analysis was performed by Shanghai Majorbio Bio-pharm Technology Co., Ltd. Cell-pellet and culture-supernatant samples were processed separately using standardized procedures. For culture-supernatant samples, equal 50 μL aliquots were used for analytical preparation. For cell-pellet samples, the amounts of material used for extraction varied among individual samples. Samples were mixed with isotope-labelled internal standards, sonicated, treated with trichloroacetic acid for protein precipitation, centrifuged at 14,000× g for 10 min at 4 °C, diluted, and filtered.
L-histidine was quantified using an ExionLC AD UHPLC system (SCIEX, Framingham, MA, USA) coupled to a QTRAP 6500+ mass spectrometer (SCIEX) with an AdvanceBio MS Spent Media column (Agilent Technologies, Newport, DE, USA). Concentrations were calculated using authentic-standard calibration curves and expressed as ng/mL of the processed sample solutions. Quality-control samples were analyzed throughout the analytical run [28,35,36]. The reported concentrations were not additionally normalized to bacterial CFU, total protein content, or cell-pellet biomass. All ten biological replicates per strain were included in the final analysis of each sample fraction. Between-group differences were assessed using two-sided unpaired Student’s t-tests.
2.11. Transcriptome–Metabolome Integration
Differentially expressed genes and annotated metabolites were mapped to KEGG pathways. Because histidine metabolism was significantly enriched in the transcriptome, changes in hutT, hutH, hutU, hutC, hutG, and hutI were compared with detected L-histidine, urocanate, 4-imidazolone-5-propionate, and L-glutamate in pellet and supernatant fractions. Transcriptomic and metabolomic experiments used independently cultured, non-matched samples; integration was therefore restricted to exploratory pathway-level comparison without sample-level correlations or causal inference. Figures were generated in R 4.4.1 with ggplot2 4.0.0.
2.12. Statistical Analysis
Analyses were performed in R 4.4.1, GraphPad Prism 9 v9.5.1, and, for selected omics procedures, the Majorbio Cloud platform. Biological replicates were independent observations; technical replicates were averaged. Data are presented as mean ± SD unless otherwise stated. Two groups were compared by a two-sided unpaired t-test, Welch’s t-test, or Mann–Whitney U test, as appropriate. Multiple groups were analyzed by one-way ANOVA with a prespecified multiple-comparison procedure or a corresponding nonparametric test. Growth curves used two-way repeated-measures ANOVA and survival curves used the log-rank test. Benjamini–Hochberg correction was applied where multiple omics tests were performed; FDR < 0.05 defined significance in such analyses, whereas nominal p < 0.05 was used for individual hypothesis tests.
3. Results
3.1. KPL1 Carries Resistance Determinants and a peg-344-Positive Virulence Plasmid
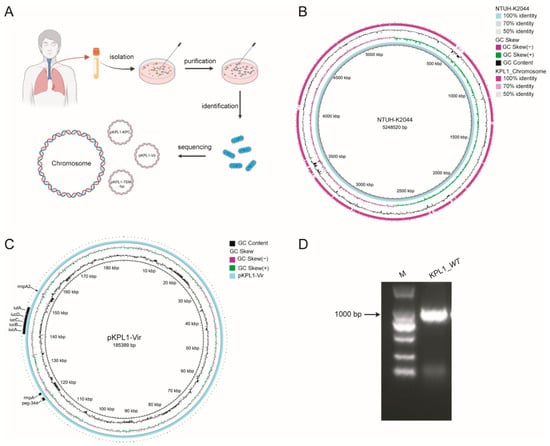
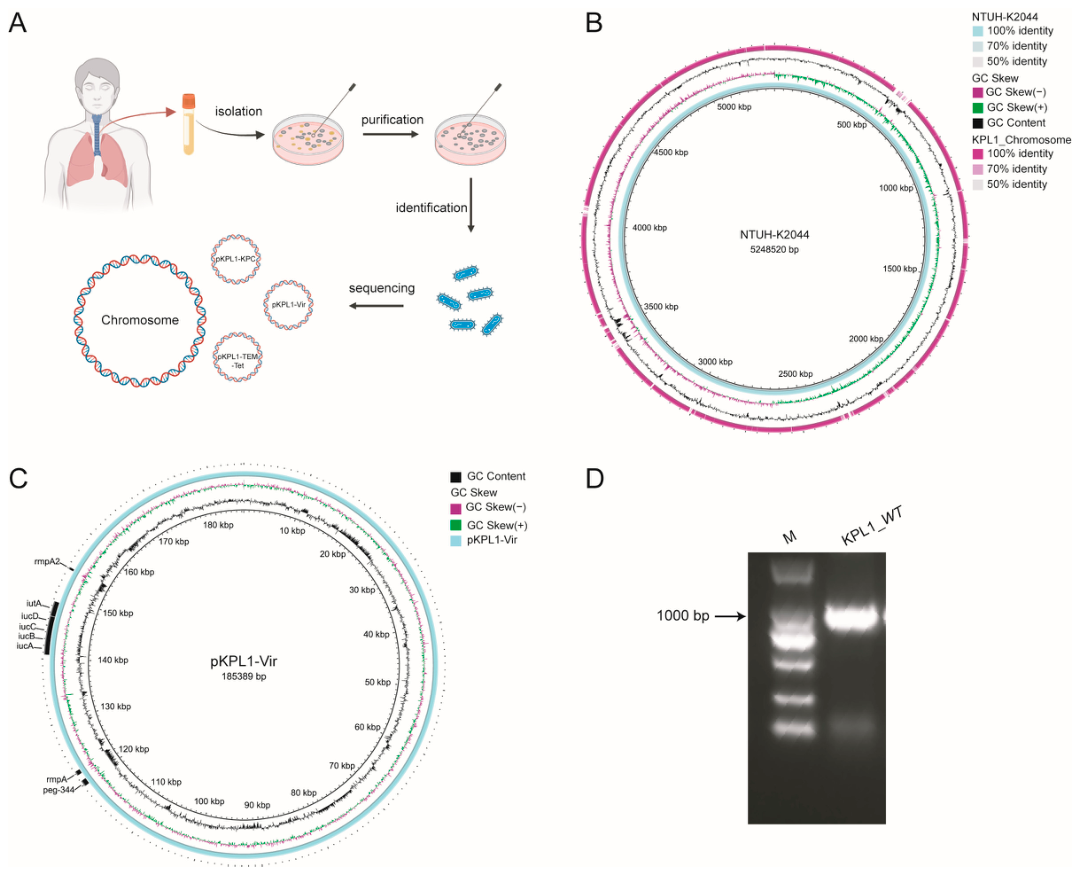
KPL1 was isolated from a tracheal aspirate in August 2024 and identified as K. pneumoniae (Figure 1A). It was resistant to penicillins, β-lactam/β-lactamase-inhibitor combinations, cephalosporins, aztreonam, carbapenems, fluoroquinolones, and tetracyclines, but remained susceptible to tobramycin, amikacin, trimethoprim–sulfamethoxazole, tigecycline, and colistin. The isolate was mCIM-positive and eCIM-negative, consistent with a serine-carbapenemase phenotype (Supplementary Tables S1 and S8).
Figure 1.
Clinical isolation and genomic characterization of KPL1 and its peg-344-positive virulence plasmid. (A) Workflow for isolation, identification, and whole-genome sequencing. The assembly comprised one chromosome and three plasmids: pKPL1-KPC, pKPL1-Vir, and pKPL1-TEM-Tet. (B) Circular comparison of the KPL1 and NTUH-K2044 chromosomes. (C) Map of the 185,389 bp pKPL1-Vir plasmid, highlighting peg-344, rmpA, rmpA2, and iucABCD-iutA. (D) PCR detection of an approximately 1 kb peg-344 product. PCR detection of peg-344 in KPL1_WT. M, DNA marker.
The completed genome comprised a 5,498,575 bp chromosome and three plasmids. KPL1 belonged to ST11 and carried the KL62 capsular locus. The plasmids were designated pKPL1-KPC, pKPL1-Vir, and pKPL1-TEM-Tet according to their principal genetic contents (Supplementary Table S2). Chromosomal comparison with the ST23-KL1 reference strain NTUH-K2044 showed a largely conserved backbone with divergence in local variable regions (Figure 1B). pKPL1-Vir was 185,389 bp, had a GC content of 50.48%, and encoded 210 predicted proteins. It carried rmpA, rmpA2, iucABCD-iutA, and peg-344, but lacked a complete iroBCDN locus (Figure 1C). pKPL1-KPC carried blaKPC, blaSHV-2, and heavy-metal tolerance genes, whereas pKPL1-TEM-Tet carried blaTEM, tetA, and tetR. PCR produced the expected approximately 1 kb peg-344 amplicon (Figure 1D). These findings established KPL1 as an ST11-KL62 isolate combining carbapenem resistance with a remodeled hypervirulence-associated plasmid.
3.2. KPL1 Exhibits Enhanced Virulence in Mice
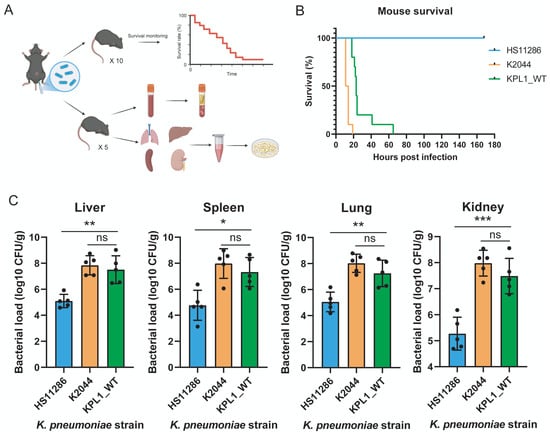
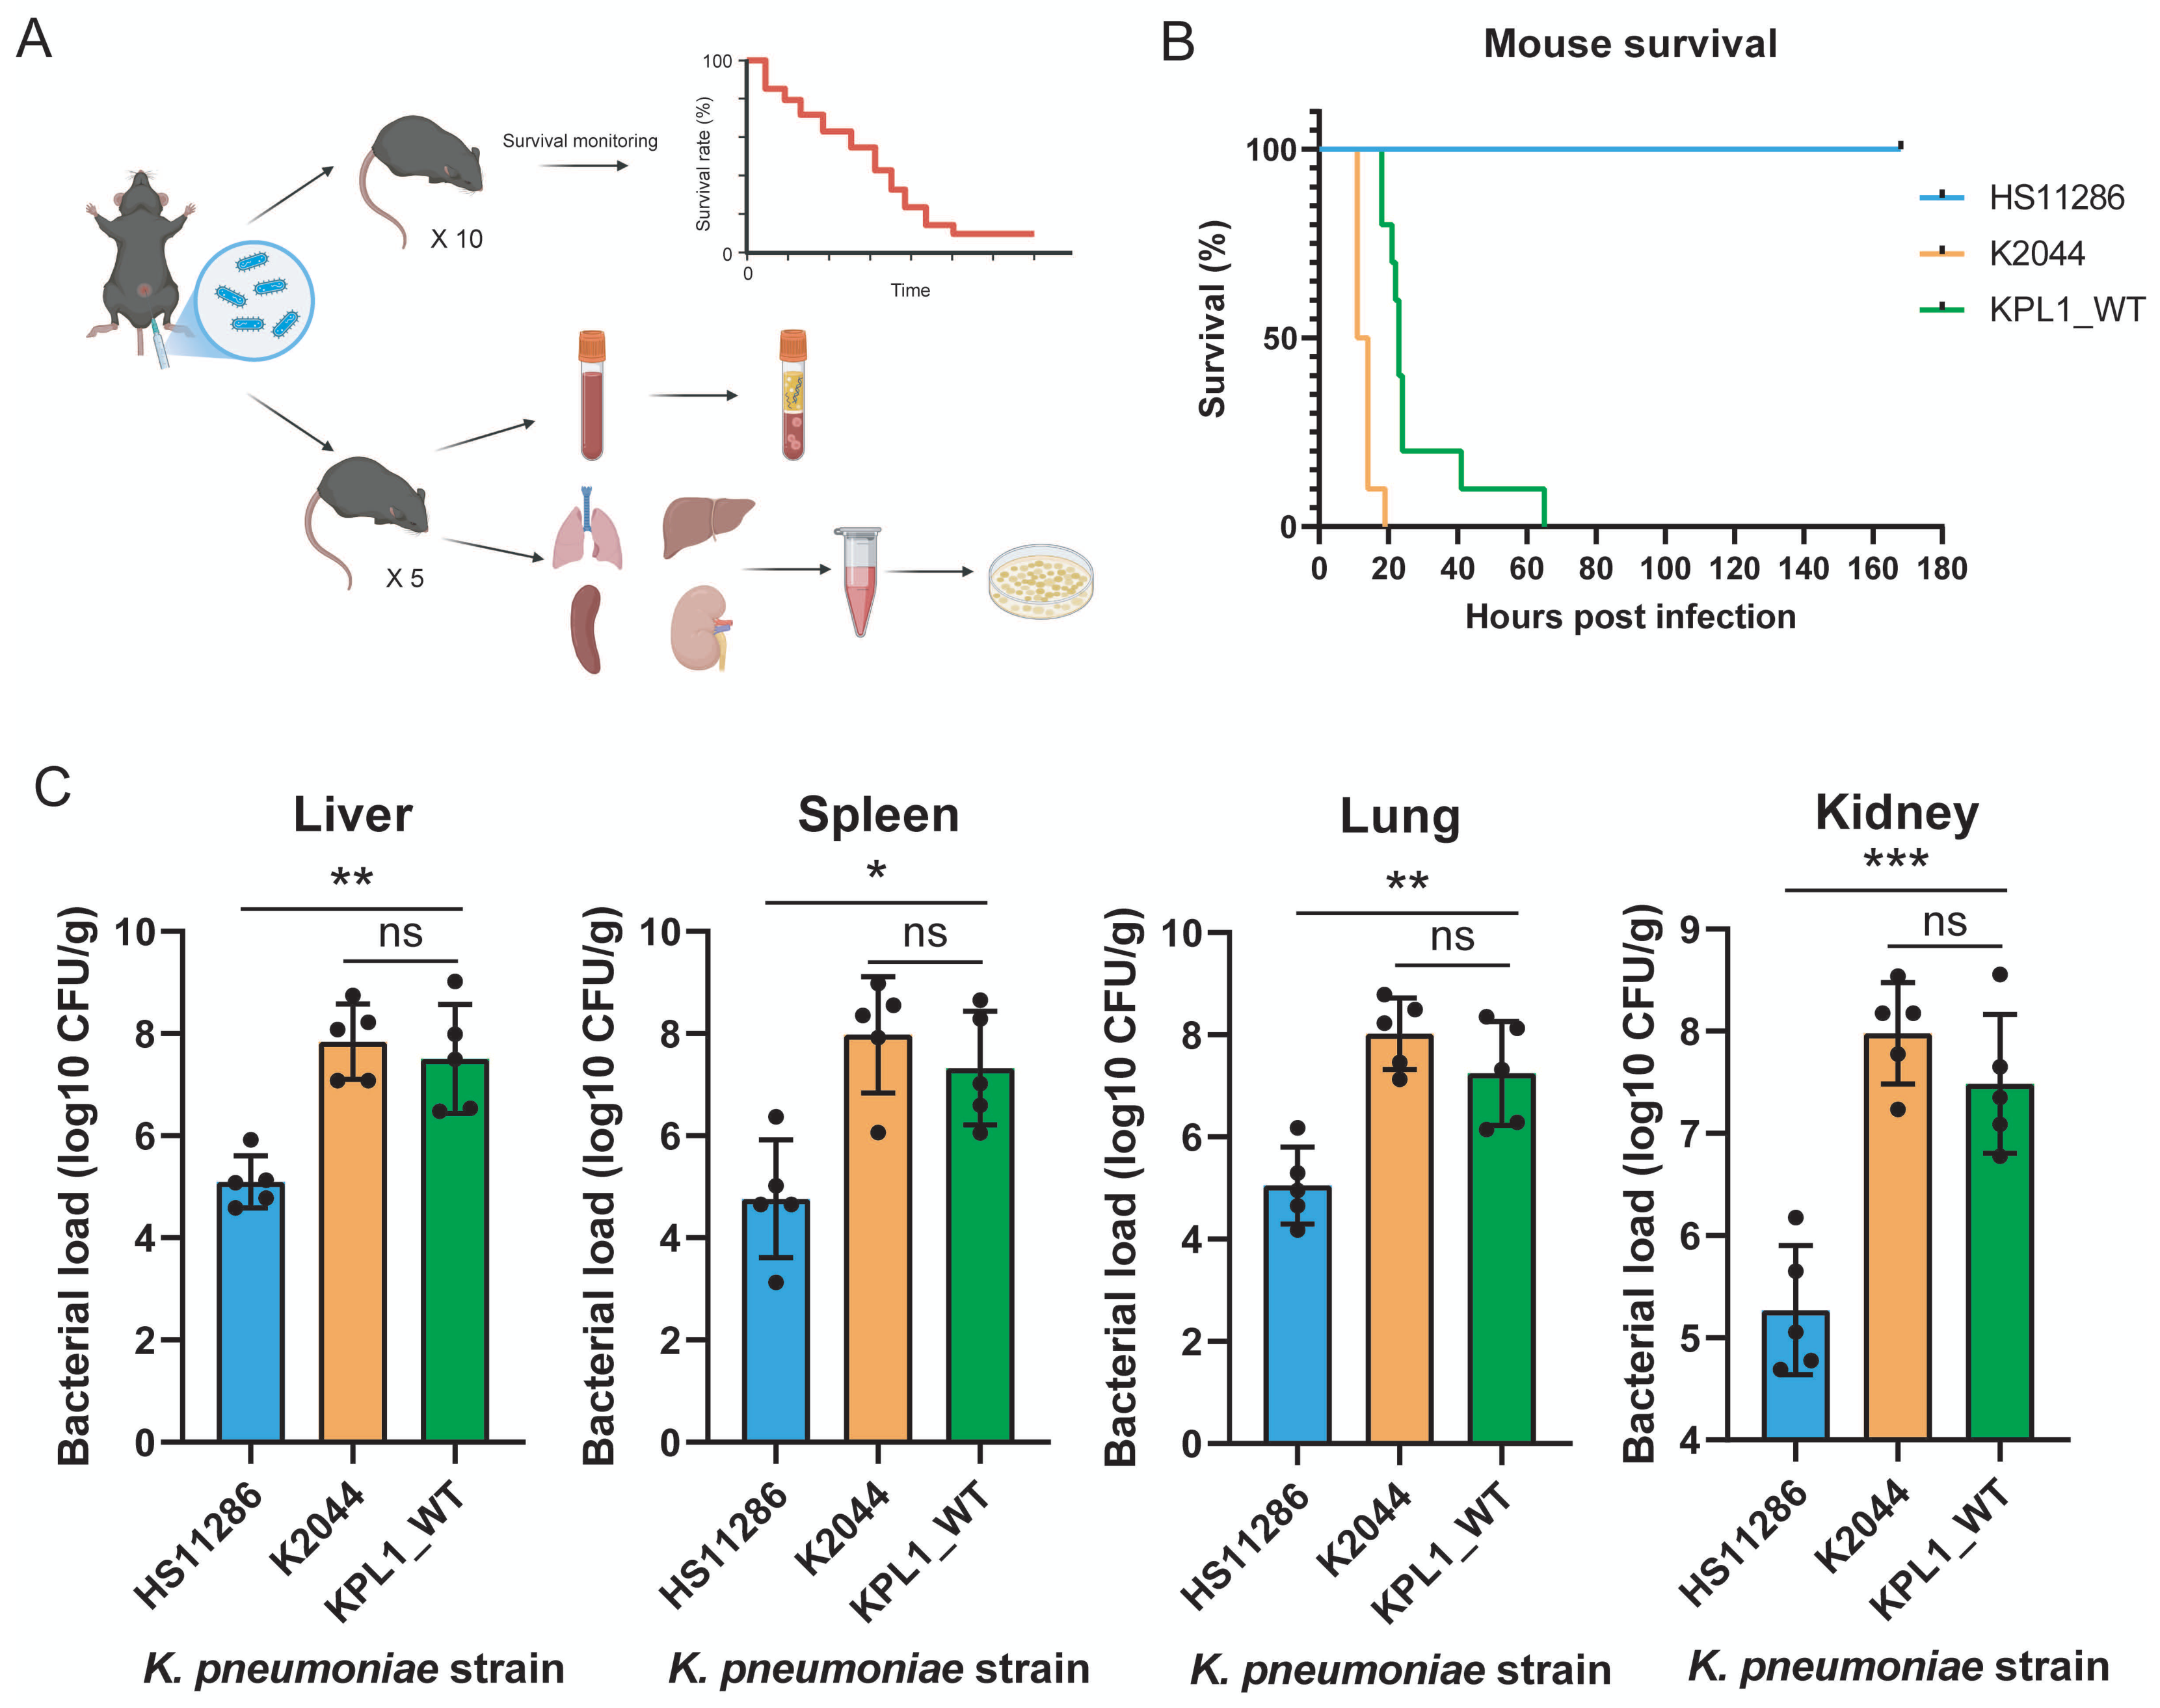
In the intraperitoneal infection model (Figure 2A), all mice infected with low-virulence HS11286 survived for 168 h, whereas NTUH-K2044 (labeled K2044 in the figure) caused complete mortality at approximately 20 h. KPL1_WT also caused 100% mortality, although all deaths occurred later, by approximately 65 h (Figure 2B). At 24 h, KPL1_WT produced significantly higher bacterial burdens than HS11286 in the liver (p < 0.01), spleen (p < 0.05), lung (p < 0.01), and kidney (p < 0.001). Burdens did not differ significantly between KPL1_WT and NTUH-K2044 in any organ (all p > 0.05; Figure 2C). Thus, KPL1 showed strong in vivo lethality and multi-organ colonization consistent with a hypervirulent phenotype.
Figure 2.
KPL1 exhibits enhanced virulence in a mouse systemic infection model. (A) Experimental design. Male C57BL/6 mice received 1 × 10⁶ CFU per 20 g body weight. Separate cohorts were used for survival (n = 10/group) and organ burdens at 24 h (n = 5/group). (B) Kaplan–Meier curves for HS11286, NTUH-K2044 (K2044 in the figure), and KPL1_WT; log-rank test. (C) Liver, spleen, lung, and kidney burdens. Mean ± SD; one-way ANOVA with Tukey’s test. * p < 0.05, ** p < 0.01, *** p < 0.001; ns, not significant.
3.3. Construction and Genetic Validation of KPL1Δpeg-344
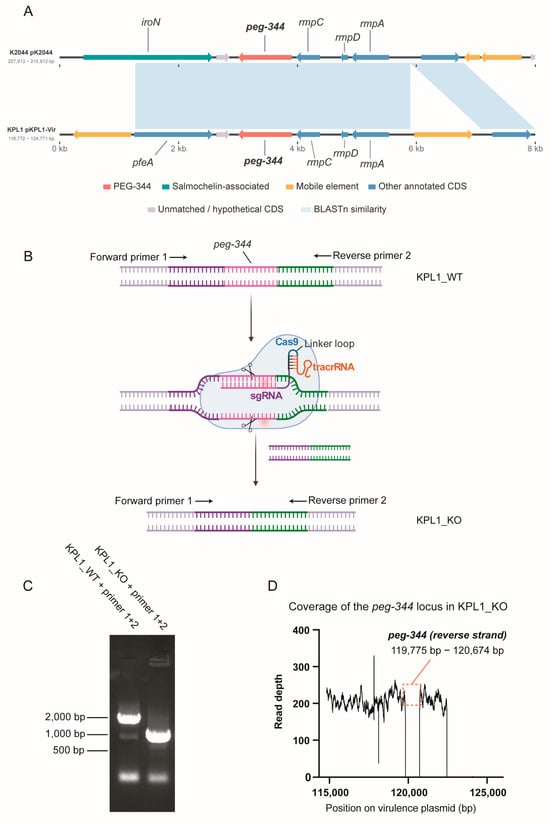
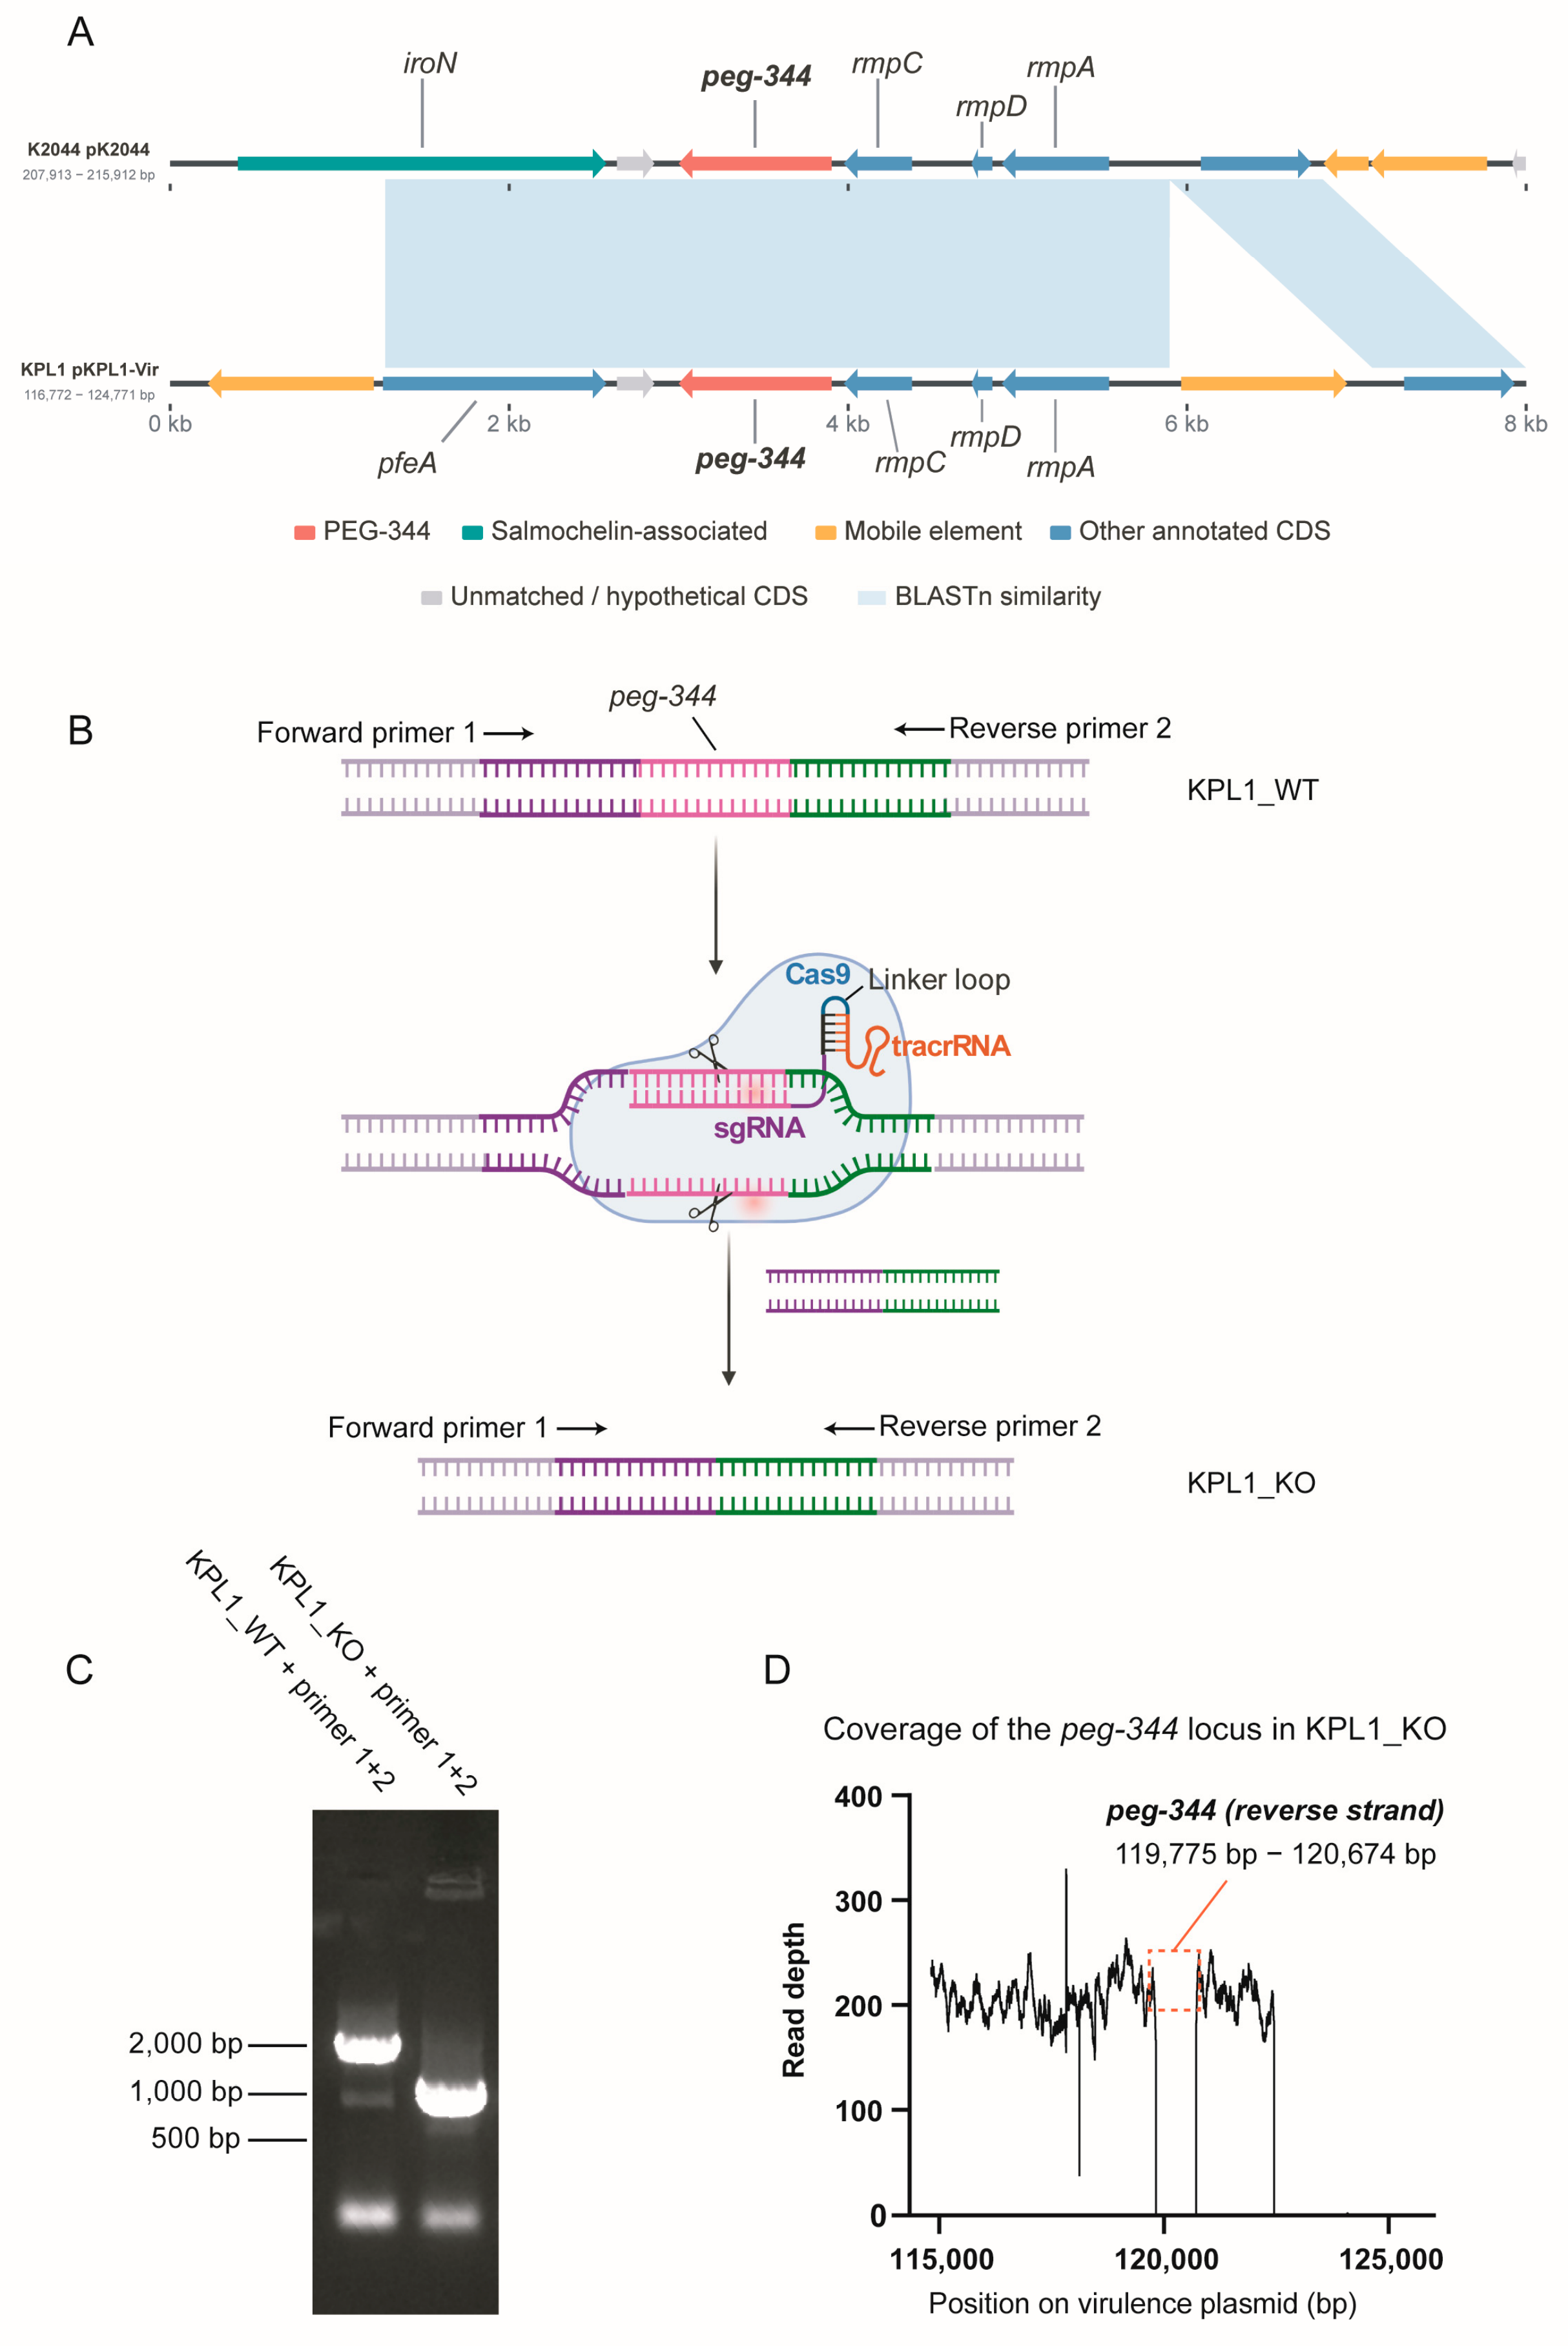
The peg-344 region and downstream rmpC, rmpD, and rmpA genes were highly similar and collinear between pKPL1-Vir and pK2044, whereas the upstream region differed: pK2044 carried iroN, while the corresponding KPL1 sequence was annotated as pfeA (Figure 3A). CRISPR–Cas9-mediated recombination was used to replace peg-344 with fused upstream and downstream homology arms (Figure 3B). External-primer PCR yielded an approximately 2 kb fragment from KPL1_WT and a 1 kb fragment from KPL1_KO, matching the expected deletion (Figure 3C).
Figure 3.
Construction and genetic validation of KPL1Δpeg-344. (A) Comparative organization of the peg-344 regions in pK2044 and pKPL1-Vir. Arrows show coding sequences; shading shows BLASTn identity. (B) CRISPR–Cas9-mediated deletion strategy. Scissors indicate Cas9 cleavage sites, and the red-highlighted region represents the sgRNA-targeting sequence. (C) External-primer PCR showing approximately 2 kb WT and 1 kb KO products. (D) KPL1_KO read depth across peg-344. Mean depths were 183.5× for the chromosome, 240.3× for pKPL1-Vir, 0.18× for peg-344, and 206.032× and 69.230× for the upstream and downstream regions.
Resequencing of KPL1_KO showed mean depths of 183.5× for the chromosome and 240.3× for pKPL1-Vir. Coverage across peg-344 was 0.18×, compared with 206.032× and 69.230× in the upstream and downstream regions, respectively (Figure 3D). Retention of high coverage across the plasmid backbone excluded loss of the entire virulence plasmid and supported targeted deletion of peg-344.
To assess potential transcriptional effects of peg-344 deletion on neighboring genes, we examined the RNA-seq expression profiles of seven non-target genes surrounding the deleted locus (Supplementary Table S4). Among these genes, dinG showed a modest decrease in expression (log2 FC = −0.445, adjusted p = 0.0064), whereas the remaining six genes, including rcsA and rmpA, did not exhibit statistically significant expression differences (adjusted p > 0.05). These results did not reveal widespread transcriptional alterations among the examined neighboring genes, although potential local effects cannot be completely excluded.
3.4. peg-344 Deletion Is Associated with Altered Growth Dynamics in LB Broth
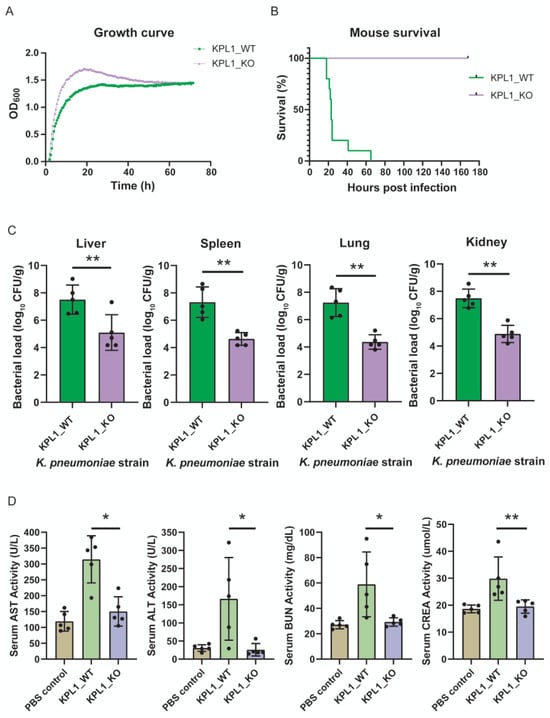
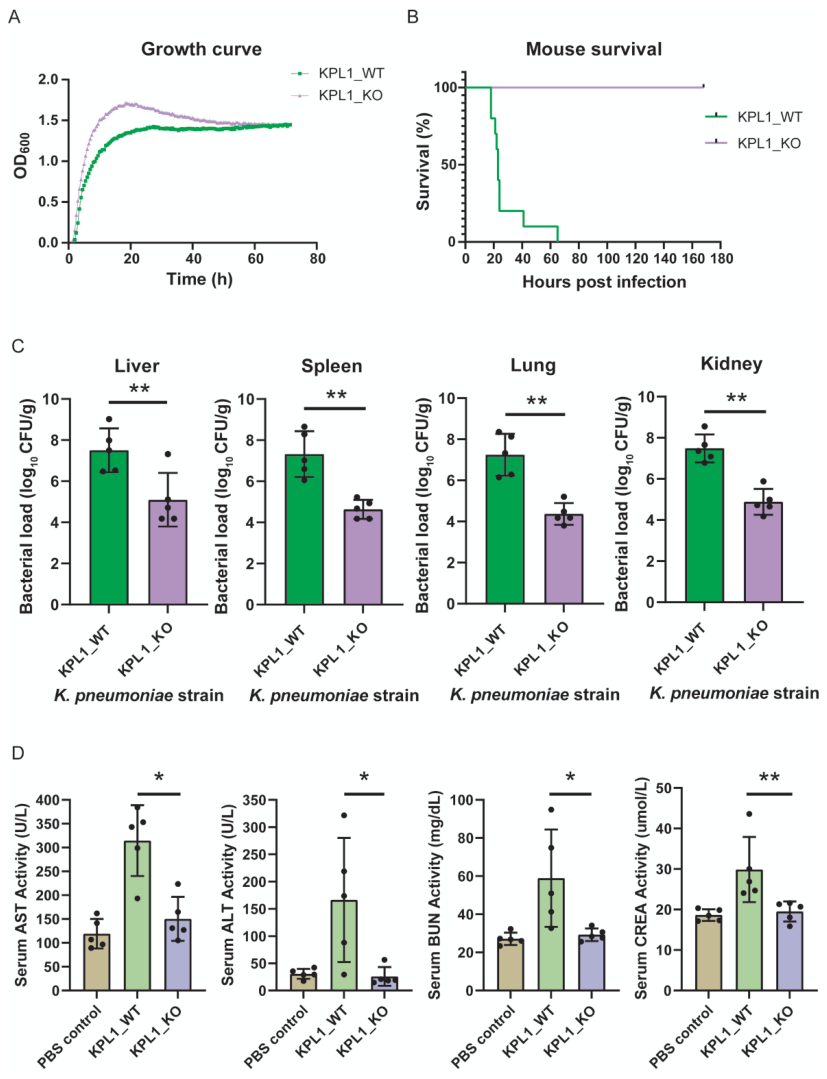
Both strains entered logarithmic growth and reached high densities in LB broth. KPL1_KO increased more rapidly and reached a higher OD600 near 20 h, followed by a gradual decline, whereas KPL1_WT increased more gradually and remained more stable. By approximately 50–70 h, the strains reached comparable OD600 values (Figure 4A). These observations indicate differences in growth dynamics between KPL1_WT and KPL1_KO, particularly during the earlier stages of cultivation. However, the mutant did not exhibit a persistent reduction in optical density relative to the parental strain under the tested nutrient-rich conditions.
Figure 4.
peg-344 deletion attenuates systemic virulence without sustained growth impairment. (A) Growth curves in LB broth (five replicate wells/strain). (B) Survival after intraperitoneal infection (n = 10/group); log-rank test. (C) Organ burdens at 24 h (n = 5/group); two-sided unpaired test. (D) Serum AST, ALT, BUN, and creatinine in PBS, KPL1_WT, and KPL1_KO groups (n = 5/group); one-way ANOVA with Tukey’s test. Mean ± SD; * p < 0.05, ** p < 0.01.
3.5. Loss of peg-344 Markedly Attenuates Systemic Virulence
All KPL1_WT-infected mice died within approximately 65 h, whereas every KPL1_KO-infected mouse survived for 168 h (Figure 4B). At 24 h, KPL1_KO burdens were significantly reduced in the liver, spleen, lung, and kidney (all p < 0.01), by approximately 2–3 log10 CFU/g overall (Figure 4C). The consistent decrease across organs indicated impaired establishment or maintenance of systemic bacterial burdens rather than an organ-specific effect.
KPL1_WT infection was accompanied by increased serum AST, ALT, BUN, and creatinine. Compared with KPL1_WT, KPL1_KO produced significantly lower AST, ALT, and BUN values (all p < 0.05) and lower creatinine (p < 0.01); values were closer to those of PBS controls (Figure 4D). Together, the survival, organ bacterial-burden, and biochemical findings demonstrate marked attenuation of systemic infection associated with the peg-344 deletion genotype, without evidence of sustained growth impairment under the tested in vitro conditions.
3.6. peg-344 Deletion Induces a Distinct Transcriptional Response
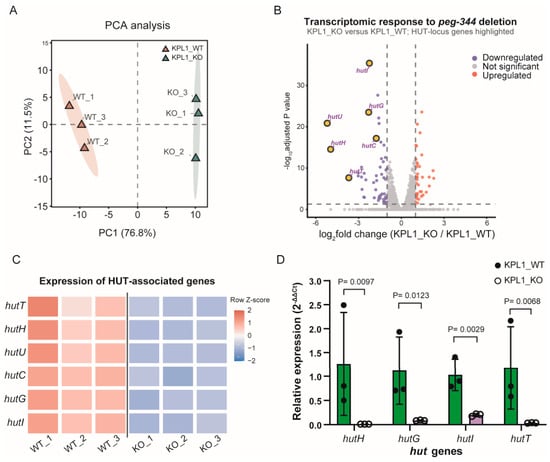
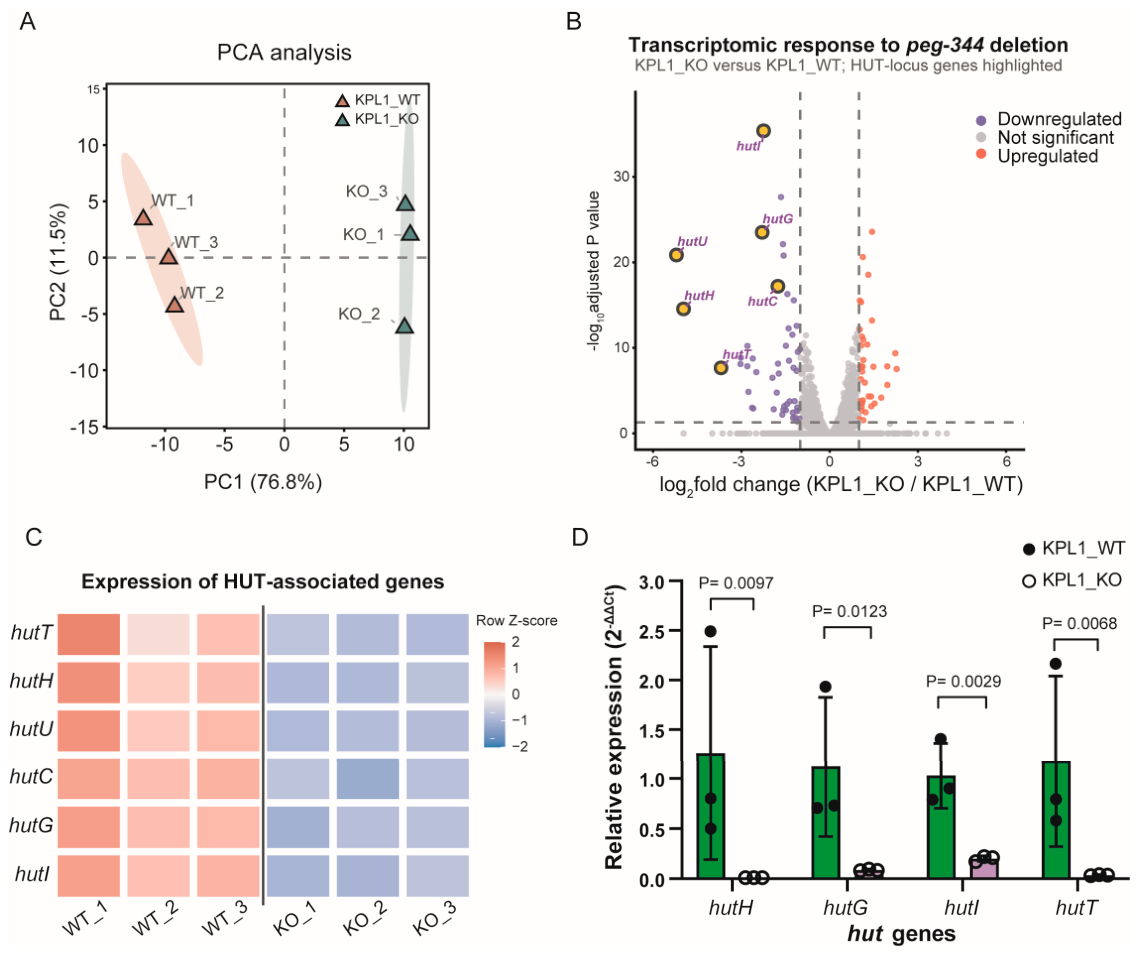
RNA sequencing was performed with three biological replicates per strain. PC1 and PC2 explained 76.8% and 11.5% of the variance, respectively. WT and KO samples separated along PC1, while replicates clustered within groups (Figure 5A). Within-group Pearson correlations were 0.991–0.994 for WT and 0.989–0.994 for KO, exceeding the between-group range of 0.972–0.980; hierarchical clustering likewise separated the groups (Supplementary Figure S1A).
Figure 5.
Transcriptional remodeling and HUT-system repression associated with peg-344 deletion. (A) Principal component analysis (PCA) of RNA-seq profiles from three biological replicates per group. (B) Volcano plot showing differentially expressed genes in KPL1_KO relative to KPL1_WT (FDR < 0.05 and |log2 fold change| ≥ 1). HUT-associated genes are highlighted. (C) Row-wise Z-score heatmap showing the expression patterns of six HUT-associated genes (hutT, hutH, hutU, hutC, hutG, and hutI) across three biological replicates per group. (D) qRT-PCR validation of hutH, hutG, hutI, and hutT using recA as the sole reference gene. Relative expression was calculated using the 2−ΔΔCt method, with KPL1_WT as the calibrator. Bars represent mean ± SD from three independent biological replicates per group, with individual data points shown. p values were calculated using two-sided Welch’s t-tests on ΔCt values.
At FDR < 0.05 and |log2 fold change| ≥ 1, 88 genes were differentially expressed in KPL1_KO, including 49 downregulated and 39 upregulated genes (Figure 5B). The HUT genes were coherently repressed: hutU (log2 fold change, −5.21), hutH (−4.97), hutT (−3.69), hutG (−2.29), hutI (−2.24), and hutC (−1.76), all at FDR < 0.05. These data linked peg-344 deletion to reproducible global transcriptional remodeling and prominent suppression of histidine-utilization genes.
The simultaneous changes in transporter, catabolic-enzyme, and regulatory genes distinguished the HUT signal from a change affecting only one annotated gene. Nevertheless, the analysis compared the steady transcriptional states of independently cultured populations and did not determine whether HUT repression was an immediate consequence of PEG-344 loss or a downstream adaptation that emerged during growth.
3.7. The HUT System Is Coordinately Downregulated
The HUT-gene heatmap showed uniformly higher expression in the three KPL1_WT replicates and lower expression in the three KPL1_KO replicates (Figure 5C). Following primer-efficiency assessment, qRT-PCR data were reanalyzed using recA as the sole reference gene. The revised analysis confirmed lower expression of hutH (p = 0.0097), hutG (p = 0.0123), hutI (p = 0.0029), and hutT (p = 0.0068) in KPL1_KO compared with KPL1_WT (Figure 5D). Primer amplification efficiencies and candidate reference-gene Ct distributions are provided in Supplementary Tables S6 and S7, respectively.
Among 220 tested bacterial KEGG pathways, ribosome (FDR = 0.000613), phenylalanine metabolism (FDR = 0.0118), and histidine metabolism (FDR = 0.0162) were significantly enriched (Supplementary Figure S1B). Histidine metabolism contained four annotated differentially expressed genes and had an enrichment ratio of approximately 12.1. The agreement between RNA sequencing, qRT-PCR, and pathway enrichment supports coordinated HUT-system repression after peg-344 deletion, but does not demonstrate direct regulation by PEG-344.
3.8. Untargeted Metabolomics Indicates Compartment-Specific Remodeling
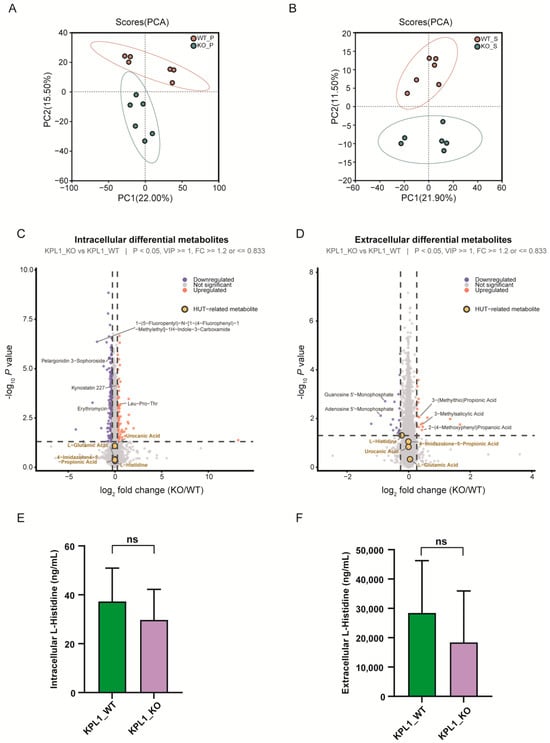
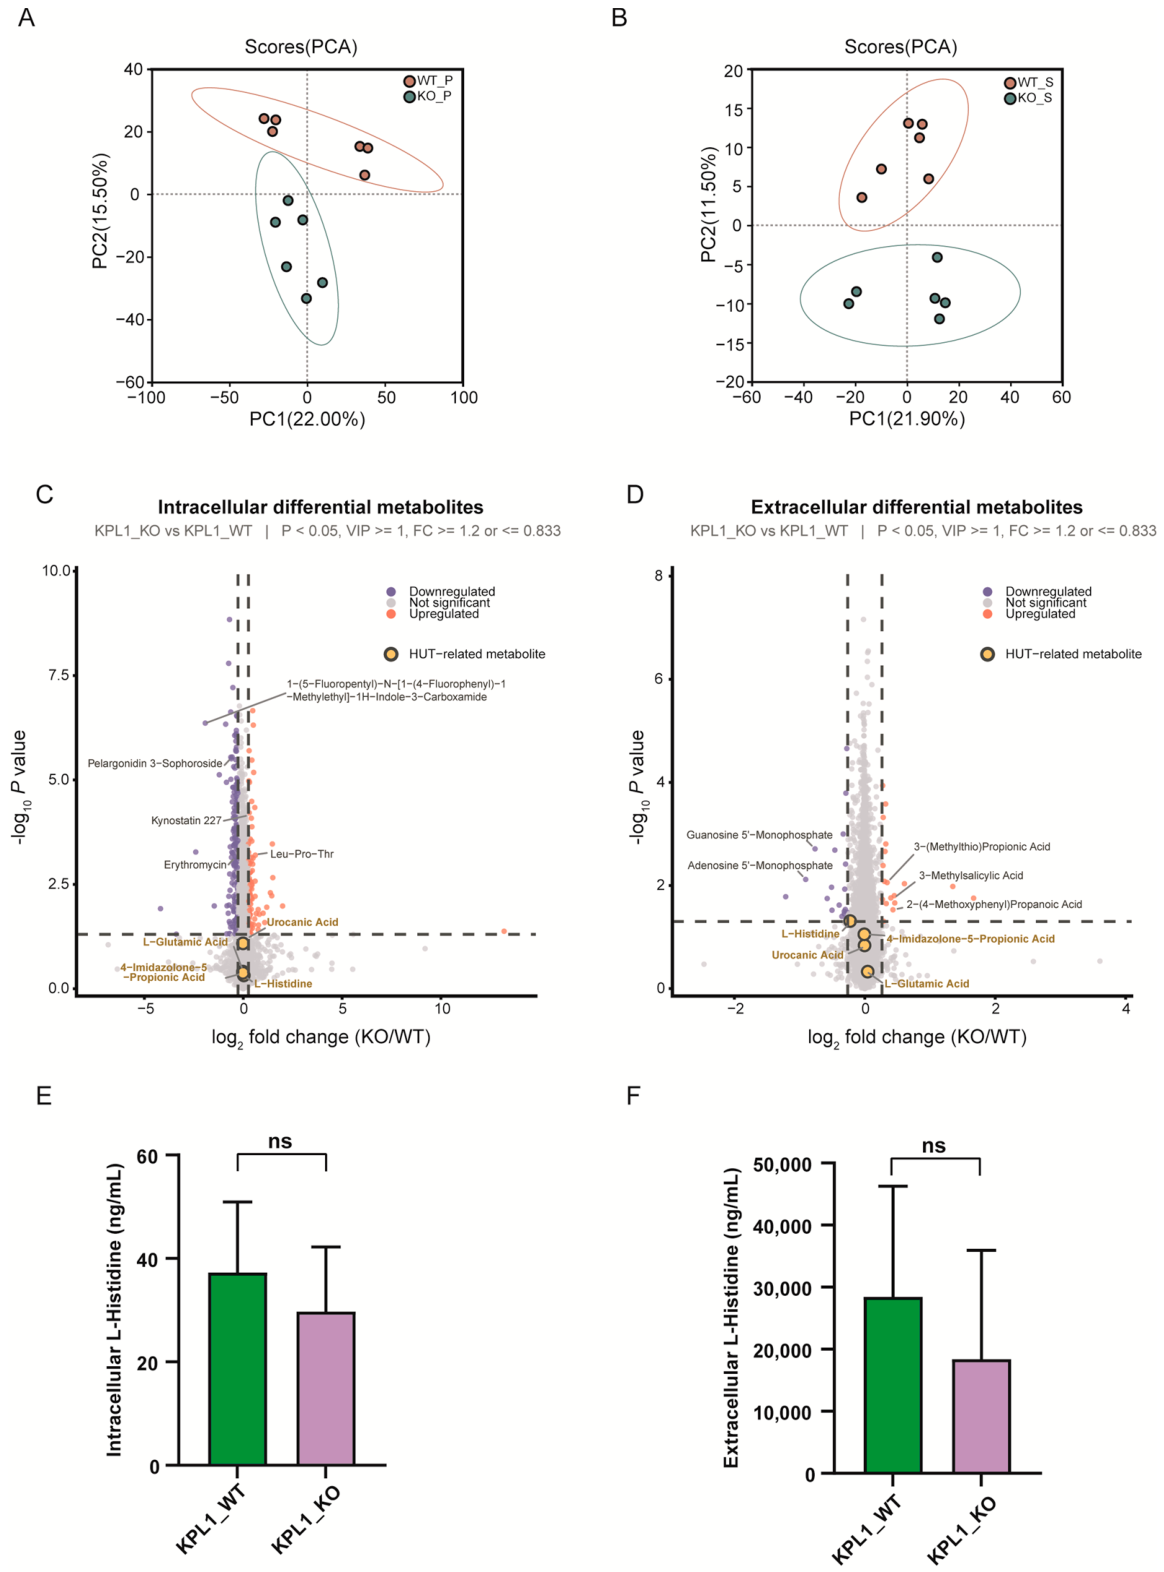
Untargeted metabolomics was analyzed separately in cell pellets and culture supernatants. In pellets, PC1 and PC2 explained 22.0% and 15.5% of the variance; in supernatants, they explained 21.9% and 11.5%. WT and KO distributions differed primarily along PC2, with clearer separation in supernatants (Figure 6A,B). Volcano plots showed both increased and decreased candidate features, and the leading annotations differed between the two compartments (Figure 6C,D). Because candidates were selected using nominal p < 0.05, VIP ≥ 1, and fold-change thresholds rather than FDR < 0.05, these features were treated as exploratory. Several identities were derived solely from database matching and therefore remain putative.
Figure 6.
Metabolomic changes after peg-344 deletion. (A,B) PCA of cell-pellet (A) and supernatant (B) untargeted metabolomes (n = 6/group). (C,D) Volcano plots of candidate features in pellets (C) and supernatants (D), screened using nominal p < 0.05, VIP ≥ 1, and fold change ≥ 1.2 or ≤0.833. Labels based on database matching are putative; colored candidates did not necessarily remain significant after FDR correction. (E,F) Targeted L-histidine concentrations in processed cell-pellet extracts (E) and culture-supernatant samples (F). Ten biological replicates were included per strain in each fraction. Data are presented as mean ± SD. Between-group comparisons were performed using two-sided unpaired Student’s t-tests (E, p = 0.2154; F, p = 0.2211). Neither comparison was statistically significant (ns). Concentrations are expressed as ng/mL of processed sample solutions without normalization to bacterial CFU or biomass.
The modest variance captured by the first two principal components and the residual within-group dispersion indicated that deletion did not create a uniformly dominant metabolic shift under these culture conditions. The clearer supernatant separation suggested that extracellular composition may be more responsive than the pellet metabolome, but this pattern was not used as evidence for secretion or uptake of any individual compound.
3.9. Histidine-Related Metabolites Are Not Significant After FDR Correction
In untargeted data, pellet L-histidine was essentially unchanged (fold change = 1.022, p = 0.480, FDR = 0.628; Supplementary Figure S2A). Supernatant L-histidine showed a nominal decrease (fold change = 0.855, p = 0.0489) that did not survive correction (FDR = 0.486). Urocanate, 4-imidazolone-5-propionate, and L-glutamate showed small changes in both compartments, with all FDR values above 0.05; FIGLU was not reliably detected (Supplementary Figure S2B). Pathway mapping therefore showed a marked transcript-level HUT response without corresponding FDR-significant changes in the measured metabolite pools (Supplementary Figure S2C). Because the omics samples were independently cultured and not paired, this comparison was descriptive rather than correlational.
3.10. Targeted L-Histidine Analysis Reveals No Statistically Significant Between-Strain Differences
Targeted UHPLC–MS/MS analysis included ten biological replicates per strain for both cell-pellet and culture-supernatant fractions. In processed cell-pellet extracts, the mean L-histidine concentration was numerically lower in KPL1_KO than in KPL1_WT (29.72 ± 12.52 versus 37.25 ± 13.69 ng/mL, respectively; p = 0.2154; Figure 6E). Similarly, the mean concentration in culture-supernatant samples was lower in KPL1_KO than in KPL1_WT (18,397.64 ± 17,548.67 versus 28,424.77 ± 17,829.18 ng/mL, respectively; p = 0.2211; Figure 6F). However, neither comparison reached statistical significance. The measurements represent concentrations in processed sample solutions and were not normalized to bacterial CFU or biomass. Therefore, these results do not establish differences in L-histidine abundance per bacterial cell or demonstrate direct transport by PEG-344.
4. Discussion
4.1. PEG-344 Contributes to the Full Virulence of KPL1
peg-344 is a useful marker of hvKp, yet marker association does not establish function. In the ST11-KL62 clinical isolate KPL1, targeted deletion produced complete survival over 168 h, reduced bacterial burdens in four organs by approximately 2–3 log10 CFU/g, and lowered biochemical indicators of liver and kidney dysfunction. These concordant endpoints extend functional evidence for PEG-344 beyond its diagnostic association [9,12]. Although KPL1_KO retained robust growth in nutrient-rich LB broth, its growth dynamics differed from those of KPL1_WT, particularly during the earlier stages of cultivation. These observations suggest that the marked attenuation observed in the mouse infection model cannot be explained solely by a persistent growth defect under the tested in vitro conditions. Nevertheless, growth in LB broth does not adequately reproduce the nutrient availability, immune pressures, and other environmental constraints encountered during infection. Therefore, differences in bacterial growth or metabolic fitness under host-associated conditions may also contribute to the reduced virulence of KPL1_KO.
The mutant remained detectable in multiple organs, indicating attenuation rather than complete loss of in vivo viability. KPL1 retains capsule-associated regulators, aerobactin, and other factors that could sustain residual pathogenicity. PEG-344 should therefore be viewed as one component of a broader virulence network, not as the sole determinant of the KPL1 phenotype. Although PCR and genome resequencing confirmed the intended deletion of peg-344 and supported retention of the virulence-plasmid backbone, the absence of a genetically complemented strain limits definitive attribution of the observed virulence attenuation to the loss of PEG-344 function alone. The additional analysis of neighboring-gene expression revealed no widespread transcriptional alterations among the examined genes, although dinG exhibited a modest but statistically significant expression change (Supplementary Table S4). Nevertheless, potential polar effects on genes not reliably assessed and other secondary genetic consequences cannot be completely excluded. Therefore, the present findings support an association between the peg-344 deletion genotype and reduced systemic virulence, while genetic complementation remains necessary to strengthen causal inference.
The biochemical measurements add a host-level dimension to the survival and culture-based endpoints. Lower transaminases and renal-function markers in the KPL1_KO group were directionally consistent with reduced organ burdens, although they cannot distinguish direct tissue injury from secondary consequences of lower systemic bacterial exposure. For this reason, the biochemical data are interpreted as evidence of reduced infection severity rather than as proof of a specific PEG-344-dependent injury pathway.
4.2. The Contribution of PEG-344 May Depend on Infection Context
Previous work showed reduced virulence of a peg-344 mutant in a pulmonary model but not after subcutaneous infection [12]. Here, attenuation was pronounced after intraperitoneal challenge. These observations are compatible with context dependence rather than contradiction. The lung, subcutaneous tissue, and peritoneal cavity impose different nutrient supplies, immune pressures, tissue barriers, and dissemination bottlenecks. If PEG-344 transports a metabolite important only when its availability becomes limiting, its phenotypic effect would vary by site and stage of infection. Differences in bacterial background, mouse strain, inoculum, and endpoints may further modify the outcome.
KPL1 also differs from classical hvKp in plasmid architecture. It retains peg-344, iucABCD-iutA, and rmpA/rmpA2 but lacks the complete salmochelin locus. Its ST11-KL62 background is relevant to resistance–virulence convergence, but it may create interactions distinct from those in ST23-KL1 strains. Accordingly, these findings extend the evidence for PEG-344 to a non-classical CR-hvKp background without implying an identical effect in all lineages or infection routes.
4.3. PEG-344 Is Associated with the HUT System
The most coherent molecular response associated with peg-344 deletion was the coordinated downregulation of six HUT-associated genes (hutT, hutH, hutU, hutI, hutG, and hutC). This transcriptional pattern was supported by qRT-PCR validation of four representative genes and significant enrichment of histidine metabolism in the RNA-seq analysis. The HUT pathway enables bacteria to catabolize histidine and generate metabolites that contribute to central carbon and nitrogen metabolism [13]. Such metabolic flexibility may be relevant to bacterial adaptation when nutrient availability changes during host colonization and infection. Therefore, HUT-system repression in KPL1_KO may reflect an altered capacity for nutrient utilization. However, because HUT expression and function were not directly measured in infected host tissues, its contribution to bacterial survival in vivo remains uncertain.
Recent evidence has linked HUT-system regulation to virulence in K. pneumoniae. Li et al. reported that deletion of the type I-E* CRISPR-Cas-associated genes in an ST23-K1 strain increased HUT-gene expression and histidine utilization, while attenuating virulence in the experimental models examined [14]. In contrast, our ST11-KL62 KPL1 mutant exhibited HUT-system repression together with reduced systemic virulence. These different patterns suggest that the relationship between HUT activity and bacterial pathogenicity may depend on genetic background, regulatory context, and infection conditions, rather than following a simple linear relationship. Accordingly, HUT repression in our study should not be interpreted as an established cause of the attenuated virulence phenotype.
The mechanism linking peg-344 deletion to HUT-system repression remains unresolved. Given the predicted membrane-associated transporter function of PEG-344, one possibility is that its loss alters the availability or distribution of an unidentified small molecule, indirectly influencing nutrient-responsive regulatory pathways, including the HUT system. Alternatively, HUT repression may represent a secondary transcriptional adaptation to broader physiological or metabolic changes following deletion of the peg-344 locus. The present transcriptomic and metabolomic findings cannot distinguish between these possibilities, nor do they establish L-histidine or urocanate as a direct PEG-344 substrate. Furthermore, whether HUT-system repression contributes functionally to the observed virulence attenuation remains to be determined. Thus, the findings support an association between the peg-344 deletion genotype and HUT-related metabolic regulation, rather than a demonstrated direct regulatory or transport mechanism.
4.4. Transcriptomic and Metabolomic Changes Are Not Equivalent
Untargeted metabolomics did not identify histidine-related metabolites that remained significant after FDR correction, despite marked HUT-gene repression. This difference is biologically plausible because transcription reflects regulatory responses, whereas a metabolite concentration represents a steady-state pool determined by synthesis, degradation, uptake, efflux, and reutilization. Pool size cannot be equated with pathway flux, and compensatory transport or nitrogen-utilization pathways may buffer transcriptional changes [37,38]. Rich LB medium may further mask dependence on a specific uptake or catabolic system, while a single sampling time may miss transient changes.
Targeted UHPLC–MS/MS analysis showed numerically lower mean L-histidine concentrations in KPL1_KO than in KPL1_WT in both cell-pellet extracts and culture-supernatant samples. However, neither difference reached statistical significance when all ten biological replicates per group were included. Although cultures were harvested at comparable OD600 values and an independent assessment showed broadly comparable viable bacterial densities, these measurements were not used for sample-specific normalization. Furthermore, the amounts of cell-pellet material used for extraction varied among samples. Thus, the observed numerical differences cannot be regarded as conclusive evidence of altered histidine homeostasis. Moreover, the transcriptomic and metabolomic datasets were generated from independently cultured, non-matched samples, preventing sample-level correlation analysis. Analytical coverage, ion suppression, instability of pathway intermediates, and uncertainties in untargeted metabolite annotation further limit mechanistic interpretation [28,39]. Direct uptake, efflux, isotope-tracing, and membrane-transport assays would be required to determine whether L-histidine or another molecule is a physiological substrate of PEG-344.
The differences between untargeted and targeted metabolomic analyses highlight the importance of distinguishing analytical sensitivity from statistical evidence. Untargeted metabolomics provides broad metabolic coverage but requires correction for multiple testing, whereas targeted UHPLC–MS/MS enables quantification of a prespecified metabolite using authentic-standard calibration. Nevertheless, the targeted L-histidine measurements did not demonstrate statistically significant between-strain differences in the complete dataset. Therefore, the pronounced HUT transcriptional response was not accompanied by conclusive evidence of corresponding changes in the measured L-histidine concentrations under the experimental conditions examined.
4.5. Limitations
This study has several limitations. First, a direct PEG-344 substrate was not identified, and neither HUT repression nor targeted L-histidine changes demonstrate binding or transport. In addition, the functional contribution of HUT-system repression to the attenuated virulence phenotype was not directly evaluated. Therefore, the observed transcriptional changes cannot establish whether altered histidine utilization mediates the reduced bacterial fitness or pathogenicity in the host environment. Second, a genetically complemented strain was not included in this study. Although PCR and genome resequencing supported the intended deletion and retention of the virulence-plasmid backbone, potential polar effects on neighboring genes or other secondary genetic consequences cannot be fully excluded. Furthermore, without complementation, we cannot establish whether restoration of PEG-344 expression would rescue the attenuated virulence phenotype or the associated changes in HUT-system expression and histidine-related measurements. Therefore, these findings should be interpreted as deletion-associated phenotypes rather than definitive evidence of a direct PEG-344-dependent mechanism. In addition, qRT-PCR normalization relied on a single reference gene, recA, after yciH was excluded because of its excessive amplification efficiency. Although recA exhibited acceptable amplification efficiency and low within-group Ct variability, a modest between-group Ct shift was observed. Therefore, potential normalization bias cannot be completely excluded, and the qRT-PCR findings should be interpreted alongside the RNA-seq results. Third, the work focused on one ST11-KL62 isolate and one intraperitoneal model; strain background, infection route, inoculum, and sampling time may alter the phenotype. Fourth, organ burdens and serum markers were assessed at 24 h, when disease progression in WT- and KO-infected animals may already differ substantially. Fifth, untargeted annotations were partly putative, and transcriptomic and metabolomic samples were not paired. In addition, targeted L-histidine concentrations were reported for processed sample solutions without normalization to bacterial CFU, total protein content, or biomass. Although comparable sampling densities and standardized analytical procedures were used, an independent CFU assessment could not account for variation in the amounts of cell-pellet material used for extraction. Together with the substantial within-group variability and non-significant between-strain differences, these limitations restrict the biological interpretation of the targeted metabolomics findings. Finally, growth was assessed under nutrient-rich LB conditions, which do not reproduce the nutrient limitation, oxygen availability, immune pressures, and other environmental constraints encountered during infection. Therefore, the absence of a persistent growth reduction in LB broth cannot exclude differences in bacterial proliferation or metabolic fitness under host-associated conditions. Validation across additional isolates, infection models, time points, and physiologically relevant media will be necessary.
5. Conclusions
In the ST11-KL62 CR-hvKp clinical isolate KPL1, deletion of peg-344 was associated with marked attenuation of systemic virulence, including reduced lethality, multi-organ bacterial burdens, and biochemical evidence of organ injury. This phenotype was accompanied by coordinated repression of the HUT system, suggesting a potential association between the peg-344 locus and histidine-related metabolic adaptation. However, the absence of genetic complementation and direct functional validation limits definitive attribution of these phenotypes to PEG-344 protein function or HUT-system repression. Further studies are needed to clarify the underlying molecular mechanisms.
Supplementary Materials
The following supporting information can be downloaded at: https://www.mdpi.com/article/10.3390/pathogens15111159/s1, Figure S1: RNA-seq reproducibility and KEGG enrichment. (A) Pearson correlation matrix and hierarchical clustering of three KPL1_WT and three KPL1_KO replicates. (B) FDR-significant KEGG pathways. Bubble position indicates fold enrichment, size indicates the DEG count, and color indicates −log10(FDR); Figure S2: Histidine-related metabolites and pathway-level integration. (A) Untargeted relative abundance of L-histidine in pellets and supernatants (n = 6/group). ns, not significant after FDR correction. (B) Effect-size plot for L-histidine, urocanate, 4-imidazolone-5-propionate, and L-glutamate. Color indicates log2 fold change, size indicates −log10(FDR), and open outlines indicate FDR ≥ 0.05. (C) Exploratory mapping of HUT transcript changes and histidine-pathway metabolites. P and S denote pellet and supernatant; FIGLU was not reliably detected. Omics samples were independently cultured and non-matched; Table S1: Antimicrobial susceptibility profile of KPL1; Table S2: Characteristics of the plasmids identified in KPL1; Table S3: Primers used for construction of the KPL1 Δpeg-344 mutant; Table S4: Genomic positions and RNA-seq expression profiles of genes neighboring peg-344 in KPL1_WT and KPL1_KO; Table S5: Primers used for qRT-PCR validation of HUT-associated genes; Table S6: Amplification efficiency of primers used for qRT-PCR analysis; Table S7: Ct distribution of candidate reference genes in KPL1_WT and KPL1_KO; Table S8: Phenotypic characterization of carbapenemase production in KPL1.
Author Contributions
Conceptualization: Y.J. (Yong Jiang), Y.L. and W.W.; methodology: Y.J. (Yong Jiang), Y.L. and X.X.; investigation: Y.L. and X.X.; formal analysis: Y.J. (Yong Jiang) and Y.L.; data curation: Y.L., X.X., N.J., Y.J. (Yuanxia Jiang) and S.S.; visualization: Y.L. and X.X.; writing—original draft: Y.L.; writing—review and editing: X.X., N.J., Y.J. (Yuanxia Jiang), S.S., W.W. and Y.J. (Yong Jiang); supervision: Y.J. (Yong Jiang) and W.W.; funding acquisition: Y.L.; resources: W.W. and S.S. All authors have read and agreed to the published version of the manuscript.
Funding
The authors disclosed receipt of the following financial support for the research, authorship, and/or publication of this article: This work was supported by the National Natural Science Foundation of China (grant no. 82502626) and the Postdoctoral Research Start-up Fund from the First Affiliated Hospital of Zhengzhou University.
Institutional Review Board Statement
The research use of the de-identified clinical isolate and the associated de-identified clinical information was approved by the Ethics Committee of the First Affiliated Hospital of Zhengzhou University (approval no. 2025-KY-1365-001; approval date: 4 September 2025). The requirement for written informed consent was waived because this was a retrospective, non-interventional study using de-identified clinical information and a bacterial isolate obtained during routine diagnostic procedures. Mouse experiments were approved by the Experimental Animal Ethics Committee of Henan University of Chinese Medicine (approval no. DWLL202202107; approval date: 28 February 2022) and were conducted in accordance with relevant national regulations and institutional guidelines for the care and use of laboratory animals.
Informed Consent Statement
The requirement for written informed consent was waived by the Ethics Committee of the First Affiliated Hospital of Zhengzhou University because this retrospective, non-interventional study used only de-identified clinical information and a bacterial isolate obtained during routine diagnostic procedures.
Data Availability Statement
The genomic sequencing data generated in this study have been deposited in the NCBI under BioProject accession number PRJNA1291995. Illumina whole-genome sequencing reads for Klebsiella pneumoniae KPL1_WT and the peg-344 deletion mutant KPL1_KO have been deposited in the NCBI Sequence Read Archive (SRA) under accession numbers SRR40999399 and SRR40999418, respectively. The PacBio long-read sequencing data for KPL1_WT have been deposited under accession number SRR41005965. The corresponding BioSample accession numbers for KPL1_WT and KPL1_KO are SAMN63858212 and SAMN63858231, respectively. These genomic sequencing datasets are currently not publicly accessible pending their scheduled release. The complete genome assembly of KPL1_WT has been submitted to GenBank under the same BioProject, and the corresponding chromosome and plasmid accession numbers are pending assignment. The raw RNA-seq data generated in this study have been deposited in the NCBI Gene Expression Omnibus (GEO) under accession number GSE352973. The dataset has been approved and is currently under private access, with public release scheduled for 10 November 2026. The metabolomics datasets, including targeted amino acid metabolomics and untargeted metabolomics, have been deposited in the China National Center for Bioinformation (CNCB) OMIX database under BioProject accession number PRJCA078608 (OMIX accession number OMIX022812). The corresponding file accession numbers are OMIX022812-01 (targeted amino acid metabolomics) and OMIX022812-02 (untargeted metabolomics), respectively. These datasets are designated as open-access.
Acknowledgments
The authors thank the staff of the clinical microbiology laboratory for their assistance in bacterial isolation and identification.
Conflicts of Interest
The authors declare no conflicts of interest.
References
- Stanton, T.D.; Wyres, K.L. What defines hypervirulent Klebsiella pneumoniae? EBioMedicine 2024, 108, 105331. [Google Scholar] [CrossRef] [Scilit]
- Mba, I.E.; Mba, T.O.; Uwazie, C.K.; Aina, F.A.; Kemisola, A.O.; Uwazie, I.J. New insights and perspectives on the virulence of hypervirulent Klebsiella pneumoniae. Folia Microbiol. 2025, 70, 517–533. [Google Scholar] [CrossRef] [Scilit]
- Lan, P.; Jiang, Y.; Zhou, J.; Yu, Y. A global perspective on the convergence of hypervirulence and carbapenem resistance in Klebsiella pneumoniae. J. Glob. Antimicrob. Resist. 2021, 25, 26–34. [Google Scholar] [CrossRef] [Scilit]
- Lam, M.M.C.; Wyres, K.L.; Wick, R.R.; Judd, L.M.; Fostervold, A.; Holt, K.E.; Löhr, I.H. Convergence of virulence and MDR in a single plasmid vector in MDR Klebsiella pneumoniae ST15. J. Antimicrob. Chemother. 2019, 74, 1218–1222. [Google Scholar] [CrossRef] [Scilit]
- Chen, Y.; Marimuthu, K.; Teo, J.; Venkatachalam, I.; Cherng, B.P.Z.; De Wang, L.; Prakki, S.R.S.; Xu, W.; Tan, Y.H.; Nguyen, L.C.; et al. Acquisition of Plasmid with Carbapenem-Resistance Gene blaKPC2 in Hypervirulent Klebsiella pneumoniae, Singapore. Emerg. Infect. Dis. 2020, 26, 549–559. [Google Scholar] [CrossRef] [Scilit]
- Liu, Y.; Wang, Z.; Jian, Z.; Liu, P.; Li, Y.; Qin, F.; Yan, Q.; Liu, W. Nosocomial transmission, adaption and clinical outcomes of carbapenem-resistant hypervirulent Klebsiella pneumoniae. BMC Microbiol. 2025, 25, 376. [Google Scholar] [CrossRef] [Scilit]
- Han, Y.-L.; Wang, H.; Zhu, H.-Z.; Lv, Y.-Y.; Zhao, W.; Wang, Y.-Y.; Wen, J.-X.; Hu, Z.-D.; Wang, J.-R.; Zheng, W.-Q. Phenotypic and genomic characterization of ST11-K1 CR-hvKP with highly homologous blaKPC-2-bearing plasmids in China. mSystems 2024, 9, e0110124. [Google Scholar] [CrossRef] [Scilit]
- Zhang, F.; Li, L.; Zhao, Y.; Dong, H.; Zhao, B.; Zhao, X.; Xia, Z.; Chi, L.; Wang, Y.; Li, R.; et al. Molecular characterization of hybrid virulence plasmids in ST11-KL64 KPC-2-producing multidrug-resistant hypervirulent Klebsiella pneumoniae from China. Front. Microbiol. 2024, 15, 1353849. [Google Scholar] [CrossRef] [Scilit]
- Russo, T.A.; Olson, R.; Fang, C.-T.; Stoesser, N.; Miller, M.; MacDonald, U.; Hutson, A.; Barker, J.H.; La Hoz, R.M.; Johnson, J.R. Identification of Biomarkers for Differentiation of Hypervirulent Klebsiella pneumoniae from Classical K. pneumoniae. J. Clin. Microbiol. 2018, 56, e00776-18. [Google Scholar] [CrossRef] [Scilit]
- Russo, T.A.; Alvarado, C.L.; Davies, C.J.; Drayer, Z.J.; Carlino-MacDonald, U.; Hutson, A.; Luo, T.L.; Martin, M.J.; Corey, B.W.; Moser, K.A.; et al. Differentiation of hypervirulent and classical Klebsiella pneumoniae with acquired drug resistance. mBio 2024, 15, e0286723. [Google Scholar] [CrossRef] [Scilit]
- Duong, T.T.T.; Lin, W.-H.; Tsai, Y.-M.; Liao, C.-H.; Huang, Y.-T.; Hsueh, P.-R.; Kao, C.-Y. A combined genetic and phenotypic marker approach enables precise detection of hypervirulent Klebsiella pneumoniae and reveals associated traits of capsule overproduction and tellurite resistance. Microbiol. Spectr. 2026, 14, e0247425. [Google Scholar] [CrossRef] [Scilit]
- Bulger, J.; MacDonald, U.; Olson, R.; Beanan, J.; Russo, T.A. Metabolite Transporter PEG344 Is Required for Full Virulence of Hypervirulent Klebsiella pneumoniae Strain hvKP1 after Pulmonary but Not Subcutaneous Challenge. Infect. Immun. 2017, 85, e00093-17. [Google Scholar] [CrossRef] [Scilit]
- Bender, R.A. Regulation of the histidine utilization (hut) system in bacteria. Microbiol. Mol. Biol. Rev. 2012, 76, 565–584. [Google Scholar] [CrossRef] [Scilit]
- Li, J.; Liu, Y.; Jiang, J.; Chen, F.; Zhang, N.; Kang, X.; Liu, L.; Wang, Y.; Xia, Q.; Zhu, C.; et al. Type I-E* CRISPR-Cas of Klebsiella pneumoniae upregulates bacterial virulence by targeting endogenous histidine utilization system. mSphere 2025, 10, e0021525. [Google Scholar] [CrossRef] [Scilit]
- Koren, S.; Walenz, B.P.; Berlin, K.; Miller, J.R.; Bergman, N.H.; Phillippy, A.M. Canu: Scalable and accurate long-read assembly via adaptive k-mer weighting and repeat separation. Genome Res. 2017, 27, 722–736. [Google Scholar] [CrossRef] [Scilit] [PubMed]
- Vaser, R.; Sović, I.; Nagarajan, N.; Šikić, M. Fast and accurate de novo genome assembly from long uncorrected reads. Genome Res. 2017, 27, 737–746. [Google Scholar] [CrossRef] [Scilit]
- Walker, B.J.; Abeel, T.; Shea, T.; Priest, M.; Abouelliel, A.; Sakthikumar, S.; Cuomo, C.A.; Zeng, Q.; Wortman, J.; Young, S.K.; et al. Pilon: An integrated tool for comprehensive microbial variant detection and genome assembly improvement. PLoS ONE 2014, 9, e112963. [Google Scholar] [CrossRef] [Scilit] [PubMed]
- Lam, M.M.C.; Wick, R.R.; Watts, S.C.; Cerdeira, L.T.; Wyres, K.L.; Holt, K.E. A genomic surveillance framework and genotyping tool for Klebsiella pneumoniae and its related species complex. Nat. Commun. 2021, 12, 4188. [Google Scholar] [CrossRef] [Scilit]
- Wyres, K.L.; Wick, R.R.; Gorrie, C.; Jenney, A.; Follador, R.; Thomson, N.R.; Holt, K.E. Identification of Klebsiella capsule synthesis loci from whole genome data. Microb. Genom. 2016, 2, e000102. [Google Scholar] [CrossRef] [Scilit]
- Chen, L.; Zheng, D.; Liu, B.; Yang, J.; Jin, Q. VFDB 2016: Hierarchical and refined dataset for big data analysis—10 years on. Nucleic Acids Res. 2015, 44, D694–D697. [Google Scholar] [CrossRef] [Scilit]
- Alcock, B.P.; Raphenya, A.R.; Lau, T.T.Y.; Tsang, K.K.; Bouchard, M.; Edalatmand, A.; Huynh, W.; Nguyen, A.-L.V.; Cheng, A.A.; Liu, S.; et al. CARD 2020: Antibiotic resistome surveillance with the comprehensive antibiotic resistance database. Nucleic Acids Res. 2020, 48, D517–D525. [Google Scholar] [CrossRef] [Scilit]
- Carattoli, A.; Zankari, E.; García-Fernández, A.; Voldby Larsen, M.; Lund, O.; Villa, L.; Møller Aarestrup, F.; Hasman, H. In silico detection and typing of plasmids using PlasmidFinder and plasmid multilocus sequence typing. Antimicrob. Agents Chemother. 2014, 58, 3895–3903. [Google Scholar] [CrossRef] [Scilit] [PubMed]
- Altschul, S.F.; Gish, W.; Miller, W.; Myers, E.W.; Lipman, D.J. Basic local alignment search tool. J. Mol. Biol. 1990, 215, 403–410. [Google Scholar] [CrossRef] [Scilit]
- Sullivan, M.J.; Petty, N.K.; Beatson, S.A. Easyfig: A genome comparison visualizer. Bioinformatics 2011, 27, 1009–1010. [Google Scholar] [CrossRef] [Scilit] [PubMed]
- Wang, Y.; Wang, S.; Chen, W.; Song, L.; Zhang, Y.; Shen, Z.; Yu, F.; Li, M.; Ji, Q. CRISPR-Cas9 and CRISPR-Assisted Cytidine Deaminase Enable Precise and Efficient Genome Editing in Klebsiella pneumoniae. Appl. Environ. Microbiol. 2018, 84, e01834-18. [Google Scholar] [CrossRef] [Scilit]
- Wang, Z.; Wang, Y.; Ji, Q. Genome Editing in Klebsiella pneumoniae Using CRISPR/Cas9 Technology. Methods Mol. Biol. 2022, 2479, 105–117. [Google Scholar] [CrossRef] [Scilit]
- Broeckling, C.D.; Beger, R.D.; Cheng, L.L.; Cumeras, R.; Cuthbertson, D.J.; Dasari, S.; Davis, W.C.; Dunn, W.B.; Evans, A.M.; Fernández-Ochoa, A.; et al. Current Practices in LC-MS Untargeted Metabolomics: A Scoping Review on the Use of Pooled Quality Control Samples. Anal. Chem. 2023, 95, 18645–18654. [Google Scholar] [CrossRef] [Scilit]
- Mosley, J.D.; Schock, T.B.; Beecher, C.W.; Dunn, W.B.; Kuligowski, J.; Lewis, M.R.; Theodoridis, G.; Ulmer Holland, C.Z.; Vuckovic, D.; Wilson, I.D.; et al. Establishing a framework for best practices for quality assurance and quality control in untargeted metabolomics. Metabolomics 2024, 20, 20. [Google Scholar] [CrossRef] [Scilit]
- Kodra, D.; Pousinis, P.; Vorkas, P.A.; Kademoglou, K.; Liapikos, T.; Pechlivanis, A.; Virgiliou, C.; Wilson, I.D.; Gika, H.; Theodoridis, G. Is Current Practice Adhering to Guidelines Proposed for Metabolite Identification in LC-MS Untargeted Metabolomics? A Meta-Analysis of the Literature. J. Proteome Res. 2021, 21, 590–598. [Google Scholar] [CrossRef] [Scilit]
- Langmead, B.; Salzberg, S.L. Fast gapped-read alignment with Bowtie 2. Nat. Methods 2012, 9, 357–359. [Google Scholar] [CrossRef] [Scilit] [PubMed]
- Li, B.; Dewey, C.N. RSEM: Accurate transcript quantification from RNA-Seq data with or without a reference genome. BMC Bioinform. 2011, 12, 323. [Google Scholar] [CrossRef] [Scilit] [PubMed]
- Love, M.I.; Huber, W.; Anders, S. Moderated estimation of fold change and dispersion for RNA-seq data with DESeq2. Genome Biol. 2014, 15, 550. [Google Scholar] [CrossRef] [Scilit]
- Gomes, A.É.I.; Stuchi, L.P.; Siqueira, N.M.G.; Henrique, J.B.; Vicentini, R.; Ribeiro, M.L.; Darrieux, M.; Ferraz, L.F.C. Selection and validation of reference genes for gene expression studies in Klebsiella pneumoniae using Reverse Transcription Quantitative real-time PCR. Sci. Rep. 2018, 8, 9001. [Google Scholar] [CrossRef] [Scilit]
- Livak, K.J.; Schmittgen, T.D. Analysis of relative gene expression data using real-time quantitative PCR and the 2(-Delta Delta C(T)) Method. Methods 2001, 25, 402–408. [Google Scholar] [PubMed]
- DeArmond, P.D.; Bunch, D.R. Quantitation of non-derivatized free amino acids for detecting inborn errors of metabolism by incorporating mixed-mode chromatography with tandem mass spectrometry. J. Mass Spectrom. Adv. Clin. Lab. 2022, 25, 1–11. [Google Scholar] [CrossRef] [Scilit]
- Ma, W.; Yang, B.; Li, J.; Li, X. Development of a Simple, Underivatized Method for Rapid Determination of Free Amino Acids in Honey Using Dilute-and-Shoot Strategy and Liquid Chromatography-Tandem Mass Spectrometry. Molecules 2022, 27, 1056. [Google Scholar] [CrossRef] [Scilit]
- Moiz, B.; Sriram, G.; Clyne, A.M. Interpreting metabolic complexity via isotope-assisted metabolic flux analysis. Trends Biochem. Sci. 2023, 48, 553–567. [Google Scholar] [CrossRef] [Scilit]
- Go, D.; Yeon, G.-H.; Park, S.J.; Lee, Y.; Koh, H.G.; Koo, H.; Kim, K.H.; Jin, Y.-S.; Sung, B.H.; Kim, J. Integration of metabolomics and other omics: From microbes to microbiome. Appl. Microbiol. Biotechnol. 2024, 108, 538. [Google Scholar] [CrossRef] [Scilit]
- Nguyen, Q.-H.; Nguyen, H.; Oh, E.C.; Nguyen, T. Current approaches and outstanding challenges of functional annotation of metabolites: A comprehensive review. Brief. Bioinform. 2024, 25, bbae498. [Google Scholar] [CrossRef] [Scilit]
Disclaimer/Publisher’s Note: The statements, opinions and data contained in all publications are solely those of the individual author(s) and contributor(s) and not of MDPI and/or the editor(s). MDPI and/or the editor(s) disclaim responsibility for any injury to people or property resulting from any ideas, methods, instructions or products referred to in the content. |
© 2026 by the authors. Licensee MDPI, Basel, Switzerland. This article is an open access article distributed under the terms and conditions of the Creative Commons Attribution (CC BY) license.