


Abstract
A growing demand for resources that exceeds the capacity of the biophysical system to regenerate puts environmental resources under stress, and society faces uncertainties about their scarcity and climate change. In this context, understanding how interactions among environmental, social, and economic systems shape behavioural responses becomes essential for explaining the emergence of sustainable socio-ecological dynamics. Therefore, this research explores how interactions among environmental, social, and economic systems influence sustainability outcomes, where emergent behaviours, including cooperation, reveal the interaction mechanisms connecting environmental, social and economic subsystems. A simulation model is built using the agent-based model method for this goal. The simulations suggest that scarcity may reinforce non-cooperative behaviours and generate lock-in dynamics that hinder transitions toward more sustainable system states. Additionally, cooperative behaviours emerge from the interactions among heterogeneous agents embedded within environmental, social, and economic subsystems, highlighting cooperation as a key mechanism connecting these subsystems and supporting more sustainable socio-ecological dynamics.
1. Introduction
Human societies face the challenge of achieving economic development while maintaining the ecological conditions that support long-term human well-being. The growing interdependence between environmental degradation, socio-economic dynamics, and peace has highlighted the need to understand how these systems influence one another and how sustainable outcomes may emerge from their interactions. While previous studies have examined these dimensions separately, less attention has been paid to the behavioural mechanisms that connect them. This study explores how interactions among environmental, social, and economic systems generate emergent behavioural patterns, including cooperation, through an agent-based modelling approach grounded in complexity theory.
1.1. Research Problem
It is widely accepted that the environment has played a crucial role in shaping human evolution. However, humans have recently reached a critical point at which human relations and productivity have altered Earth’s geological processes. This geological epoch has been called the Anthropocene by some authors (Tschirhart and Bloomfield 2020). However, the point of its beginning is still in debate. Some scientists, such as Nobel Prize-winning atmospheric chemist Paul Crutzen and biologist Eugene Stoermer, recognised the difficulty of identifying a specific date for its onset. Nevertheless, they proposed the latter part of the 18th century, with the beginning of the Industrial Revolution and the invention of the steam engine, given that the global effects of human activities have been more notable (Crutzen and Stoermer 2000).
However, as human being’s development affects the environment, this environment affects, in return, human being’s development, showing a loop. This idea is represented in Figure 1, each of which describes the same form: a sharp increase. The five graphs that follow exhibit the resemblances and associations that, in a particular way, embody an inconvenient cycle, showing how a steep escalation in population is correlated with a rise in GDP, concurrently with an increase in CO2 emissions, ultimately leading to a rise in global temperatures and an amplification of natural disasters.
Figure 1.
Impact of human beings on nature1.
The changes and behaviours observed in the environmental system do not come exclusively from the economic system but from of the social system understood as the set of individual interactions through which behavioural norms and responses to environmental conditions emerge and evolve2.
To understand the interactions among environmental, social and economic subsystems, it is useful to adopt the ontology of ecological economics that considers the environment as a meta-system that includes the social system of which the economy is a subsystem, forming a nested order. In these relationships, the environmental system provides environmental resources and services to the social and economic system, enabling but also simultaneously limiting its development. In contrast, the interactions between the social and economic systems push the systems toward each other, exert pressure on each other, and exert pressure on the environmental system, influencing human well-being.
According to Spangenberg (2016), the economy cannot be understood solely in terms of monetary flows, but also in terms of social interactions and physical flows that should be considered within the economic process. Individuals have the power to decide, but they are immersed in social processes that influence their decisions. This perspective views ecosystems as complex evolutionary systems that cannot be subdivided into discrete objects for trade. What can be specifically traded are goods and services. Here, overexploitation can reduce the environmental value of the system by impairing its ability to provide economically unvalued yet ecologically important functions.
The interaction pathways identified in the literature are synthesised in Figure 2. Rather than representing isolated relationships, the figure illustrates how environmental, social, and economic subsystems are interconnected through multiple feedback processes. These interactions provide the conceptual foundation for the agent-based model developed in this study.
Figure 2.
Intersystemic relations. Note: The idea of the arrows are explained in the body’s manuscript “Rather than representing isolated relationships, the figure illustrates how environmental, social, and economic subsystems are interconnected through multiple feedback processes.” Source: Authors’ own synthesis based on (Acquier et al. 2017; Loorbach et al. 2010; Spangenberg 2016; Rettberg 2016; Aktouf 2017; Hochschild 2015; Suarez et al. 2018; Brauch 2016; U.S. Global Change Research Program 2017).
Despite growing evidence of interactions among environmental, social, and economic systems, limited attention has been paid to the mechanisms through which these subsystems influence one another and generate emergent behavioural dynamics. Understanding these interaction mechanisms is essential for explaining how different socio-ecological configurations produce distinct sustainability outcomes. Among these emergent dynamics, cooperation and non-cooperation provide valuable insights into how socio-ecological systems respond to different environmental and behavioural conditions.
1.2. Emergent Cooperation in Socio-Ecological Systems
In light of environmental deterioration and its impact on the human social system, the concept of sustainability emerges. As Mebratu (1998) suggests, sustainability is an epistemological resource for the desired future. Therefore, based on the problem at hand, Fisher and Rucki (2017, p. 270) argue that “sustainability becomes a process of maintaining gains made in desirable systems dynamics, while actively changing, modifying and enhancing other dynamics to move the system closer to the goal of social justice and human wellbeing.” However, it is suggested that there is only a superficial understanding of the pathways through which drivers of any subcomponent of sustainability (economic development, ecosystem functioning, and peace) operate. It is known that these subcomponents are interconnected, but there is a lack of coherent understanding of these feedback processes within systems. This study therefore examines the interaction mechanisms among environmental, social, and economic subsystems, considering cooperation as one of the emergent behaviours through which these interactions can be observed.
1.2.1. Cooperation and Sustainability
Joireman (2005) suggested that pro-environmental behaviours can be considered social dilemmas, as acting for the benefit of the environment can be costly in terms of time, money, and effort for each individual but can yield long-term collective benefits. Thus, it can be suggested that environmental behaviour is a strong signal of cooperative behaviour (Vesely et al. 2020). In this direction, strategies aimed at climate resilience and sustainable development depend on cooperation policies at multiple levels of governance (Brauch and Oswald Spring 2016). Given the global nature of environmental issues and the sustainability perspective, cooperation must extend to relations between nations, as it is required to support technologies developed in a local context that also support a transformation towards a global low-carbon society (Brauch and Oswald Spring 2016) and the management of interconnected socio-ecological systems that evolve through adaptive cycles of growth, accumulation, restructuring, and renewal (Dalby 2016). Therefore, sustainability requires collective action around shared goals and decision-making processes that transcend individual and national interests (Brauch 2016).
1.2.2. Cooperation in the Economic System
The economic behaviour of firms is shaped by their interactions with both social and environmental systems. From a business perspective, companies adopt sustainability models under incentives that show sustainability as a new approach to creating shareholder value (Barcellos 2010; Ferro et al. 2017; Markard et al. 2012). This is a way of doing business that ensures economic and financial viability while promoting social inclusion, optimising the use of natural resources, and reducing environmental impact. It is a mechanism for strengthening ties with stakeholder groups that generate value for the companies, the market, and society (Ferro et al. 2017; Porter and Kramer 2011).
However, the management of common goods, particularly natural resources, remain as a social dilemma, because such resources are often characterised by non-excludability and rivalry; individual actors may be tempted to maximise short-term benefits through overexploitation, even when this reduces collective welfare (Carrozzo Magli et al. 2021). While Hardin’s (1996) perspective emphasises the tendency toward resource depletion, Ostrom (2010) suggested the capacity of individuals and communities to overcome these dilemmas through cooperation and collective governance arrangements.
Sustainability depends not only on environmental and economic considerations, but also on the ability of actors to cooperate in the management and governance of shared resources. Cooperation emerges as a key mechanism linking environmental, social, and economic subsystems.
1.3. Complex Adaptive Systems as the Theoretical Framework
To understand relations among environmental, social, and economic systems requires a theoretical framework capable of explaining how collective behaviours emerge from the interactions of individual actors. In this regard, a complex adaptive system is a suitable approach for modelling and understanding how interactions between people are shaped by the social and environmental context they co-create.
In the literature, there is no uniform technical definition for a complex system (Schelling 1978). However, there is some consensus that it is a system of large networks or individual components that typically follow simple rules without central control (Mitchell 2009); giving rise to emergent patterns at the system level (Newman 2009); with properties that alter system states maintaining different regimes; the ability to process information and respond to it; and the presence of feedback cycles that regulate or amplify trends to the extent that agents react to the ecology created by themselves, often resulting in multiple equilibriums (Cumming et al. 2013). Once the system reaches a stable state, it may be resistant to changes, as significant impacts are required to shift to another regime. This is known as lock-in (Arthur 2014).
These feedback loops make it challenging to distinguish cause from effect, producing delays in time and space, discontinuities, thresholds, and limits. For this reason, it is not possible to sum or aggregate the behaviour of small units to obtain the aggregate result (Costanza et al. 2013).
In this study, complex adaptive systems provide the theoretical basis for analysing how interactions among individuals, firms, and renewable environmental resources generate emergent cooperative and non-cooperative behaviours under different socio-ecological conditions. This perspective justifies the use of agent-based modelling as an appropriate methodology for representing these interaction mechanisms.
1.3.1. Complexity Economy
Göpel (2016) points out that traditional economic models (Walrasian) assume that greater production is always better and that the price paid reflects the utility obtained from consuming the produced good. This leads to economic growth, which allows people to escape the poverty trap. This means that to meet the needs of current and future generations, productivity must be increased as much as possible. This has been the main objective of policy and business conduct. However, this large-scale dynamic puts pressure on environmental resources, as the dominant economic perspective ignores the direct gains from the utility of intact nature and the often harmful effects of waste resulting from production and consumption on the future quality of ecosystems. Hence, economics is essential for delving into sustainability problems. As Schelling (1978) argued, individual decisions (micromotives) can lead to collective outcomes (macrobehavior).
Those who study economics from the perspective of complexity sciences consider society to be a layered system, composed of changing subsystems with both reducible and non-reducible global properties. These properties are relevant in a top-down view, for example, from institutions to individuals, and in a bottom-up view, from individuals to social structures (Arthur 2014). From this systemic perspective, the emergence of structure and the patterns that agents deploy in the economy become relevant (Schasfoort 2017). Therefore, complex economic systems overlap with other complex systems when they interact in a panarchy (Arthur 2014). This consists of the group of dynamic interactions of a set of nested adaptive cycles (Folke et al. 2010).
In this sense, Arthur (2014, p. 2) conceptualises the economy as a complex adaptive system composed of multiple interacting agents whose simultaneous actions generate aggregate structures such as markets, institutions, industries, and prices.
From the perspective of complexity economics, the relevant question is how individual behaviours might respond to the pattern they create together, and how that pattern would change as a result (Arthur 2014). Thus, this research seeks to understand emergent phenomena arising from the behaviour of economic and social agents that interact with an environmental system they modify, and how these relationships are connected to peace and sustainability.
For this intersystemic interaction to occur, the economic system, which is part of the social system, must be open to reconfiguring its connective structure and changing its internal structure and order. For this to happen, a system of rules must determine the connections and changes, or modify them as they become obsolete due to dynamic circumstances, and then replace them with new ones (Foster 2005). The economic system is multiscale. At the micro level are the agents, at the meso level are the rules, and at the macro level is the economic system as a whole, levels that are constantly recreated and create new structures as they evolve (Arthur 2014). Consequently, macro-level patterns cannot be fully explained by analysing isolated agents, since system-level properties emerge from interactions among agents and networks.
The micro level of the economic system comprises heterogeneous agents without perfect foresight but capable of adapting and learning over time. Therefore, no central controller or exploiter can exploit all the opportunities of the economy (Rosser and Kramer 2000). Economic agents rely on past experience and simple decision heuristics. Through learning processes, they adapt, retain successful routines, and replace ineffective strategies, continuously adjusting their behaviour to the environment they collectively create (Arthur 2014). In this sense, errors not only constitute a device for evolutionary experimentation with new solutions to problems but also imply that evolutionary adaptation involves looking back.
Indeed, the path to promoting behaviours that foster the emergence of peace and sustainability begins with individual behaviours at the local level, which trigger dynamics at the meso and macro levels. This underscores the importance of understanding their local operation. Consequently, understanding how local interactions generate macro-level patterns becomes essential for explaining the emergence of cooperation, peace, and sustainability. This motivates the use of an agent-based model capable of capturing adaptive behaviours and their systemic consequences across multiple scales.
1.3.2. Transition to Sustainability from a Complex System Approach
Both the environmental and social systems are dynamic, and adaptation plays a decisive role in their dynamics, especially when it occurs between them. This is how, as Folke et al. (2010) refers to as the interplay between social and ecological systems, socio-ecological systems exhibit powerful feedback, leading them to act as complex adaptive systems (CASs).
These adaptations emerge through responses to the interactions between social and environmental systems. Under moderate environmental changes, socio-ecological systems tend to maintain a dynamic equilibrium. However, stronger disturbances may trigger feedback processes that reinforce new behaviours, practices, or resource-use patterns. Under certain conditions, these dynamics can create niches that progressively alter the dominant system configuration, leading to a new equilibrium state. Such profound shifts in system structure and functioning are understood as transitions (Grin 2016).
The transition to sustainability is a multi-level perspective in which innovative practices, regimes, and the environment, corresponding to long-term trends at a high level of aggregation, are structured to generate changes towards more sustainable modes of production and consumption. This field of study has advanced in understanding how significant radical transformations develop and what drives them toward sustainable practices. Therefore, it is of great interest for the discipline to explore different behaviours at the regime or socio-technical system level (Brauch and Oswald Spring 2016). In this way, this research is grounded in the theoretical elements of this approach and seeks to contribute to understanding behaviours and dynamics at different scales.
2. Methodology
Analysing a complex adaptive system requires a methodology with mechanisms to comprehend emergent phenomena at the meso or macro levels that arise from interactions at the micro level. In this sense, social phenomena can exhibit emergent properties at higher levels of aggregation, to the extent that these emergences are not possessed by the elements that make up the phenomenon but rather show new information not perceived by the observer in the elements that compose it. These emergences are non-linear phenomena (García-Valdecasas 2016).
It is relevant to explain the social phenomenon in light of the actions of individuals and companies, but also from the structure of interaction between them and the environment that surrounds them (García-Valdecasas 2016), as well as understand these dynamics at different scales, since it can contribute to the design of public policies for sustainable management of environmental resources by understanding how the processes in the socio-economic and environmental subsystems feed off each other (Lippe et al. 2019). To understand these multi-level dynamics and the emergence of collective outcomes from local interactions, a methodological approach capable of representing heterogeneous agents, adaptation processes, and feedback mechanisms is required. Agent-based modelling (ABM) provides such a framework.
2.1. Agent-Based Modelling Approach
Mainstream macroeconomic theory, based on general-equilibrium microfoundations, fails to capture socio-economic dynamics. The representative-agent framework, used to model aggregate behaviour, assumes unique and stable equilibria. However, studies show these conditions do not exist, making the representative agent unrepresentative. Agent-based computational economics extends beyond the assumptions of neoclassical economics. It focuses on agent–agent and agent–environment interactions to provide a realistic economic view (Lippe et al. 2019). Regression-based approaches identify statistical associations but are less suited to representing adaptive interactions and emergent dynamics. At the same time, ABM is an instrument for explaining emerging social phenomena based on the surrounding environment and the interaction structure (García-Valdecasas 2016).
ABM programmes provide an understanding of emergences through the interactions of agents (BenDor and Scheffran 2019; Foxon et al. 2013; Köhler et al. 2018; Newman 2009; Sarmiento-Vásquez and López-Sandoval 2017). In this case, agents are in a state of continuous co-creation. In this type of system, agents themselves are usually altered by the entirety of the interactions they make part in. Regarding this, ABM enables the design of a complex system with agents’ autonomy, which grants them independence in decision-making, the ability to perceive changes in the environment and react to them, proactive action in line with their objectives, social skills that enable communication and interaction among them, and memory that allows for learning and adaptation of behaviours based on experiences (Sarmiento-Vásquez and López-Sandoval 2017). As Epstein argues, ABMs allow researchers to represent actions and processes—such as buying, selling, learning, cooperating, or changing strategies—whereas equation-based approaches primarily describe aggregate quantities (Galán-Ordax 2007; Arthur et al. 2020).
Accordingly, an agent-based model was developed to represent the interactions among social, economic, and environmental subsystems and to explore how individual behavioural strategies influence the emergence of cooperation, resource-use patterns, and sustainability outcomes across different socio-ecological configurations. Modelling heterogeneous agents, adaptive behaviours, and feedback processes, the approach allows the analysis of how local interactions generate system-level cooperation patterns that they are associated with sustainability and peace.
2.2. Model Design Following the ODD Protocol
The agent-based model was documented following the ODD (Overview, Design Concepts and Details) protocol to ensure understanding and replicability in the description of model structure, behavioural rules, and simulation processes (Grimm et al. 2006).
The complete ODD protocol is provided in Appendix C, while the main model components are summarised below in Table 1.
Table 1.
Methodology summary table.
The model represents a socio-ecological system composed of three interacting subsystems—environmental, economic, and social—whose dynamics emerge from the behaviour and interaction across heterogeneous agents and their interactions with renewable environmental resources.
Overview.
Purpose
The model represented in Figure 3 aims to explore how different behavioural strategies influence the emergence of cooperative and non-cooperative behaviours and how these emergent dynamics affect sustainability outcomes within socio-ecological systems.
Figure 3.
Model flowchart.
To achieve this, the model represents interactions among environmental resources, individuals, and firms, allowing adaptive behaviours to emerge through repeated interactions, learning processes, and resource constraints. In this context, cooperation is analysed as a mechanism that may contribute to both sustainability and peaceful forms of social organisation.
The following diagram depicts the dynamic model of three interacting subsystems: the economic (red), social (blue), and environmental (green) systems. It summarises the interaction structure of the model and the sequence of processes executed during each simulation cycle.
State variables and scale.
The model distinguishes between two types of agents (individuals and companies) and the patch (the space in which agents interact and where environmental resources are located).
- Environmental system (green).
The environmental subsystem represents the renewable resource base upon which both social and economic activities depend. Environmental resources are spatially distributed across patches and constitute the ecological constraints of the model.
- (i)
- Each patch corresponds to a unit of renewable resources that represents the biophysical system and is made up of a predetermined number to adjust to the reality of hectares; global biocapacity (35 × 35): 1225 in total.
- (ii)
- Environmental resources regenerate during each simulation cycle according to a renewal rate specified by the observer, representing the regenerative capacity of the ecosystem.
- Economic system (red).
The economic subsystem is represented by firms that extract environmental resources, provide goods and services, interact strategically with other agents, and adapt their behaviour according to their performance and surrounding performance firms.
- (i)
- Firms may adopt one of four behavioural strategies described in Section 2.4
- (ii)
- These corporations provide goods and services to individuals within the social system.
- (iii)
- They resolve socio-environmental dilemmas through an interaction matrix that assigns costs associated with conflictual behaviours.
- (iv)
- They transfer biophysical resource units to individuals through mechanisms analogous to wages or dividends. No explicit monetary system is represented in the model; all transactions and transfers are expressed in biophysical resource units that represent renewable resources.
- (v)
- Subsequently, it evaluates which strategy among nearby corporations generates greater benefits and switches to it if it is not already applied.
- (vi)
- They consume environmental resources with an intensity subject to the strategy they deploy.
- (vii)
- If they have sufficient resources, they generate a new corporation and deduct the cost of creating this new agent.
- (viii)
- They evaluate whether it has sufficient resources to sustain itself.
- Social system (blue).
The social subsystem is represented by individuals who consume goods and services, interact with firms and other individuals, and adapt their strategies according to environmental conditions and for the strategy used by other individuals.
- (i)
- Individuals may adopt one of four behavioural strategies described in Section 2.4
- (ii)
- These individuals demand goods and services from corporations according to the level of their resources to pay for them.
- (iii)
- They resolve environmental conflicts with corporations or other individuals through the prisoner’s dilemma, with a negative payoff matrix representing the costs of disputes.
- (iv)
- They receive resources from the economic system, such as wages or dividends, which they use to meet their needs. Transactions and transfers are expressed in biophysical resource units that represent renewable resources.
- (v)
- They change their current strategy to a non-cooperative one if the environmental resources around them fall below a certain threshold. Otherwise, with a certain probability, they adopt the strategy of another nearby individual.
- (vi)
- If they have sufficient resources, they reproduce and deduct the cost of a birth.
- (vii)
- They evaluate whether they have sufficient resources to sustain themselves.
2.3. Empirical Parameterisation and Initial Conditions
The initial conditions of the model were derived from empirical demographic, environmental, and socio-economic indicators collected at the country level. These indicators included population size, renewable resource availability, ecological footprint, life expectancy, and the estimated number of firms (York University Ecological Footprint Initiative and Global Footprint Network 2022; Bolddata 2022). The data were subsequently aggregated to construct the global reference configuration, together with the OECD-based and non-OECD-based configurations used in the simulations. The purpose of this aggregation was not to classify countries according to their degree of peace, conflict, or development, but rather to generate contrasting socio-ecological configurations based on observed demographic, environmental, and economic characteristics.
Given the computational requirements of the simulations, the empirical values were scaled while preserving the proportional relationships observed in the original datasets. For example, population and biocapacity values were transformed into representative numbers of agents and resource patches, allowing the model to reproduce the relative structure of the system while maintaining computational tractability. This was an exercise in scaling real data to a model.
The environmental subsystem was parameterised using renewable resource availability data. The social subsystem was initialised using population size and life expectancy data, while the economic subsystem incorporated the estimated number of firms derived from the observed population-to-firm relationship. Individual consumption was parameterized using an estimate of 2.74 hectares of biocapacity consumed per person (York University Ecological Footprint Initiative and Global Footprint Network 2022). These empirical indicators were used exclusively to define the initial conditions of the model; subsequent system dynamics emerged from the behavioural rules governing agent interactions.
Parameters governing reproduction, inheritance, mutation, resource thresholds, and behavioural adaptation were either derived from the empirical indicators or calibrated to maintain internal consistency among the social, economic, and environmental subsystems. Main conditions are explained below and the complete set of parameters is reported in Appendix A.
Country-level observations were aggregated according to OECD and non-OECD membership in 2018 to generate contrasting socio-ecological configurations. These groupings were employed exclusively to construct empirical initial conditions and should not be interpreted as indicators of peace, conflict, or development. Rather, they provide alternative demographic, environmental, and economic contexts through which the emergence of cooperation and sustainability outcomes can be explored.
2.4. Behavioural Rules and Interaction Structure
The dynamics of the model emerge from repeated interactions among individuals, firms, and environmental resources. Agents are heterogeneous (firms and companies) and adapt their behaviour according to local conditions (renewable resources level) and interactions with neighbouring agents. Through these adaptive processes, individual decisions generate collective patterns that evolve over time.
Both individuals and companies can adopt one of four behavioural strategies: cooperative, non-cooperative, tit-for-tat, and ethnocentric. Cooperative agents always cooperate during interactions, while non-cooperative agents systematically pursue individual benefits. Tit-for-tat agents initially cooperate and subsequently replicate the behaviour of their previous interaction partner. Ethnocentric agents cooperate only with agents who have the same identifying label. These strategies were selected because they represent a variate of behaviour mechanisms that people and companies can display.
Interactions occur locally within an agent’s radius of influence. Individuals and firms interact with neighbouring agents (people or companies). Through these interactions, agents experience gains or losses that affect their capacity to survive, reproduce, and maintain their current strategy. Consequently, local interactions create feedback mechanisms linking environmental conditions, economic performance, and social behaviour.
To represent socio-environmental dilemmas, interactions between agents incorporate a conflict-cost structure. Cooperative interactions avoid conflict-related costs, whereas non-cooperative interactions generate increasing losses for one or both participants. This mechanism reflects the idea that conflictual behaviours may produce short-term advantages (that means—not assume costs) but can reduce collective welfare and system performance over time.
Agents continuously evaluate the outcomes of their interactions and may modify their behaviour through adaptive process. Firms compare their performance and may adopt the most successful strategy among neighbouring companies. Individuals respond both to social influence because according to certain probability they may imitate a neighbour’s individual strategy, and to environmental conditions because their strategy can change to non-cooperative behaviour when the availability of local resources falls below critical thresholds.
Interactions among agents are represented through a conflict-cost structure that captures the potential losses associated with socio-environmental disputes. Rather than modelling rewards from cooperation, the matrix represents the costs generated by conflictual interactions. Cooperative behaviour avoids these costs, whereas non-cooperative behaviour increases the losses experienced by one or both agents.
Those negative payoffs represent conflict-related costs, including expenditures associated with legal disputes, loss of market opportunities, reputational damage, coordination efforts, and other transaction costs arising from socio-environmental conflicts between agents. These costs are avoided under mutual cooperation and increase under hostile interactions.
This approach reflects the assumption that conflicts over shared resources may reduce the capacity of both individuals and firms to maintain their activities, thereby affecting the long-term sustainability of the system. Consequently, cooperation is not rewarded through additional benefits but through the avoidance of conflict-related costs. The amount of cost is represented in Table 2 below, where C = cooperate and D = defect.
Table 2.
Cost matrix.
The conflict-cost values were conceptually defined to represent different levels of losses associated with non-cooperative interactions. The objective was not to reproduce a classical game-theoretic payoff structure, but rather to capture the assumption that conflicts over shared resources generate costs that reduce the capacity of agents to sustain their activities. Consequently, interactions involving non-cooperative behaviours impose increasing penalties on the agents involved, with mutual non-cooperation producing the highest costs.
2.5. Configurations
Three empirical configurations were constructed from the country-level database described in Section 2.3 by aggregating demographic, environmental, and socio-economic indicators for different country groupings. The first was the global reference configuration, which combined data from all countries. The remaining two configurations were generated by grouping countries according to OECD membership in 2018, resulting in the OECD and non-OECD configurations. The three configurations were developed using the same parameterisation, behavioural rules, and scaling procedures, differing only in the empirical composition of their initial conditions.
The global reference configuration was not conceived as an additional experimental configuration but as a methodological reference to assess the behavioural plausibility of the model under aggregated global empirical conditions. Specifically, it was used to evaluate whether the implemented behavioural rules reproduced the observed relationship between the consumption and regeneration of renewable environmental resources. This configuration therefore provided a common methodological reference against which the OECD and non-OECD configurations could subsequently be interpreted.
The OECD and non-OECD configurations were selected as contrasting empirical country groupings because previous studies report systematic differences in socio-economic, institutional, and environmental conditions relevant to the processes analysed in this research, including the economic impacts of violence, environmental conditions, and the governance of common-pool resources (Institute for Economics & Peace 2021; Our World in Data 2022; BenDor and Scheffran 2019). Accordingly, these configurations were used to construct contrasting empirical initial conditions for analysing the emergence of cooperation.
Configuration 1: Global Reference Configuration
The global reference configuration was constructed by aggregating country-level demographic, environmental, and socio-economic indicators for all countries included in the Ecological Footprint Dataset for 2018 (York University Ecological Footprint Initiative and Global Footprint Network 2022). It served as the baseline empirical configuration, providing a common reference for assessing the behavioural plausibility of the model and for interpreting the OECD and non-OECD configurations.
Configuration 2: OECD Configuration
The OECD configuration was constructed by aggregating country-level demographic, environmental, and socio-economic indicators for OECD member countries in 2018. It was used as one of the two contrasting empirical configurations in the comparative analysis.
Configuration 3: Non-OECD Configuration
The non-OECD configuration was constructed by aggregating country-level demographic, environmental, and socio-economic indicators for non-OECD countries in 2018. It was used as the second contrasting empirical configuration in the comparative analysis.
The OECD and non-OECD configurations were employed exclusively as empirical references for constructing contrasting initial conditions. Consequently, the comparison should be interpreted as an exploration of alternative socio-ecological configurations rather than as a classification of countries according to their degree of peace, conflict, or development.
To ensure comparability across the empirical configurations, each configuration was evaluated under two behavioural conditions: with and without scarcity perception. Scarcity perception was incorporated as a behavioural condition because scarcity influences not only the availability of resources but also the way individuals make decisions. According to Mullainathan and Shafir (2014), scarcity narrows attention towards immediate needs, modifies decision-making processes, and alters behavioural responses. Within socio-ecological systems, these behavioural changes may affect the balance between cooperative and competitive strategies, although their effects depend on the interaction between environmental and social conditions (Roux et al. 2015; Bowles and Gintis 2002). Comparing both behavioural conditions while maintaining identical empirical configurations allows the influence of scarcity-induced behavioural adaptation to be distinguished from the effects associated with different initial socio-ecological conditions.
Following Axelrod (1997), the performance of cooperative strategies was analysed in terms of (i) robustness, which refers to the type of strategy that thrives in a diverse environment of more or less sophisticated strategies; (ii) stability, which analyses under what conditions a type of strategy, once established, could resist the invasion of a mutant strategy; and (iii) initial viability, describing even if the strategy is robust and stable, how it can be nurtured in a predominantly non-cooperative environment. Each experiment consists of several scenarios generated from parameter variations in a particular variable. Each configuration presents ten simulations randomly produced by the NetLogo 6.2.2 software through the BehaviourSpace 6.2.2 tool. The data from the runs are analysed using statistics and graphs to identify relevant patterns.
2.6. Model Verification, Calibration and Validation
To enhance the credibility of the model, verification, calibration, and validation procedures were conducted throughout the model development process.
Model verification focused on ensuring consistency between the conceptual design and its computational implementation. Extreme-condition tests were performed to evaluate whether the model generated behaviours consistent with theoretical expectations under boundary conditions. In addition, the relationships between inputs, behavioural rules, and simulation outputs were systematically examined to identify potential implementation errors and inconsistencies.
Model calibration was conducted through iterative simulation experiments in which parameter values and initial conditions were adjusted using empirical information derived from the Ecological Footprint Data for 2018 and related studies (York University Ecological Footprint Initiative and Global Footprint Network 2022). To support the calibration process, a global reference configuration was constructed by aggregating empirical indicators across all countries and used to assess the behavioural plausibility of the model. The objective was to evaluate whether the implemented behavioural rules reproduced the empirically observed imbalance between the consumption and regeneration of renewable environmental resources. According to the empirical data used for parameterisation, humanity’s ecological footprint exceeded the planet’s regenerative capacity by approximately 73% (Wackernagel et al. 2021). The model was initialised from aggregated empirical indicators and evaluates the dynamic relationship between the consumption and regeneration of renewable environmental resources without explicitly representing the accumulated global stock of natural resources. Multiple simulation runs were then performed over extended time horizons to assess whether the resulting dynamics reproduced plausible relationships among resource consumption, regeneration processes, population dynamics, and economic activity.
Given the complexity of socio-ecological systems and the limited availability of behavioural data at the agent level, model validation relied primarily on face validation. Throughout the development process, the model structure, assumptions, behavioural rules, and simulation outcomes were reviewed and discussed with experts in complexity economics, agent-based modelling, game theory, sustainability, environmental systems, and peace studies. The objective of these evaluations was to assess whether the mechanisms represented in the model and the resulting dynamics were theoretically consistent, plausible, and aligned with current knowledge of the system under study.
Additionally, as part of the model development process, the model was evaluated under extreme conditions to verify that the implemented behavioural rules produced logically consistent outcomes under limiting scenarios. Extreme-condition testing is commonly used in agent-based modelling to assess the internal consistency of a model by examining whether its behaviour is consistent with theoretical expectations as is shown in Figure 4.
Figure 4.
Extreme-condition tests.
Two representative tests are presented in Figure 4. Both tests were initialised with abundant renewable environmental resources while varying only the scarcity perception parameter. Under these conditions, the model was expected to maintain high levels of cooperation when scarcity perception was disabled, whereas activating scarcity perception was expected to reduce cooperative behaviour despite identical resource availability. The observed outcomes were fully consistent with these theoretical expectations, providing additional evidence of the model’s internal consistency and the correct implementation of its behavioural mechanisms.
Following Balci’s principles for simulation modelling, model credibility was evaluated as a gradual process rather than a binary condition (Balci 1998). Consequently, the model is considered sufficiently credible within the scope of its objectives and assumptions, namely the exploration of how behavioural strategies influence the emergence of cooperation and sustainability outcomes in interconnected socio-ecological systems. The combined verification, calibration, and face validation procedures provided confidence that the model adequately represents the mechanisms required to explore the research questions addressed in this study.
2.7. Declaration of Generative AI and AI-Assisted Technologies in the Writing Process
During manuscript revision, ChatGPT 5.5 (OpenAI) was used as an editorial support tool to improve language, structure, and the presentation of responses to reviewers. The conceptual framework, model design, coding, simulations, analyses, and conclusions were developed fully by the authors. All outputs generated with AI assistance were critically reviewed, modified when necessary, and validated by the authors, who assume full responsibility for the content.
3. Results
Experiments were run under three empirical configurations—global, OECD and non-OECD configurations—in order to identify behavioural patterns emerging under different system configurations. The following sections present the main results obtained from these simulations.
3.1. Global Reference Configuration
The global reference configuration provides the baseline empirical configuration for interpreting the OECD and non-OECD configurations. The results presented in this section characterise the model behaviour under aggregated global empirical conditions and provide the reference against which the subsequent comparative analyses are interpreted.
Before presenting the aggregate simulation results, it is useful to illustrate the spatial mechanisms underlying the model dynamics. Figure 5 shows representative snapshots of a simulation run under the global reference configuration, highlighting how local resource depletion, environmental regeneration, and the spatial distribution of agents jointly produce the aggregate behaviour analysed in the following figure.
Figure 5.
Spatial mechanisms underlying the global reference configuration.
As illustrated in Figure 5, resource scarcity emerges locally around areas of intensive extraction rather than uniformly across the simulated environment. Consequently, while renewable environmental resources become depleted in regions occupied by companies and individuals, regeneration continues in areas with little or no extraction. As the productive subsystem contracts, resource consumption decreases whereas environmental regeneration persists, progressively increasing aggregate resource levels. Thus, the model may simultaneously exhibit increasing total renewable environmental resources and declining companies and population. From a complex adaptive system perspective, this apparently counterintuitive outcome illustrates how aggregate system-level patterns may emerge from local interactions and feedback among heterogeneous agents and their environment. The spatial dynamics illustrated in Figure 5 provide the basis for interpreting the aggregate temporal behaviour presented in Figure 6, Figure 7 and Figure 8.
Figure 6.
Global reference configuration.
Figure 7.
OECD configuration.
Figure 8.
Non-OECD configuration.
Figure 6 compares the temporal evolution of the global reference configuration under the two behavioural conditions described in Section 2.5: with and without scarcity perception. The comparison illustrates how scarcity perception modifies the dynamics of the economic, social, and environmental subsystems while maintaining the same empirical initial conditions.
The economic subsystem exhibits a similar behavioural pattern under both behavioural conditions. Tit-for-tat3 remains the predominant strategy throughout most of the simulation period, whereas the remaining strategies progressively decline as firms disappear. Although the timing of the contraction differs slightly between the two behavioural conditions, scarcity perception produces only minor changes in the adaptive dynamics of firms compared with those observed in the social subsystem.
The social subsystem responds differently under the two behavioural conditions. When scarcity perception is absent, cooperative strategies progressively become predominant, whereas non-cooperative behaviour declines throughout most of the simulation. Conversely, when individuals perceive environmental scarcity, non-cooperative behaviour increasingly dominates, while cooperative strategies progressively disappear.
These behavioural differences are reflected in the environmental subsystem. Under both behavioural conditions, renewable environmental resources increase as the economic and social subsystems progressively contract and resource extraction declines. However, the trajectory without scarcity perception is characterised by a greater prevalence of cooperative behaviours before subsystem contraction, whereas scarcity perception is associated with the predominance of non-cooperative behaviour during the transition. Together, these results establish the global reference configuration as the behavioural reference against which the OECD and non-OECD configurations are subsequently interpreted.
3.2. OECD-Based Configuration Scenario
The OECD configuration was evaluated under the two behavioural conditions described in Section 2.5: with and without scarcity perception. Figure 7 presents the temporal evolution of the aggregate system dynamics under these conditions.
The economic subsystem (companies) exhibits a stable behavioural pattern under both experimental conditions. The tit-for-tat strategy remains dominant throughout most of the simulation period, whereas the remaining strategies show comparatively minor variations.
The social subsystem exhibits markedly different dynamics under the two behavioural conditions. When scarcity perception is enabled, non-cooperative behaviour remains the dominant strategy throughout most of the simulation period. In contrast, when scarcity perception is absent, tit-for-tat progressively becomes the predominant strategy, while non-cooperative behaviour steadily declines. Population levels increase under the latter condition, with the marked rise around tick 30 reflecting the model’s demographic specification rather than an emergent system behaviour, as many individuals reach the minimum reproductive age after being initialised with heterogeneous ages.
Overall, the OECD configuration reveals a clear divergence between the economic and social subsystems. While firms maintain stable reciprocal cooperation under both behavioural conditions, the social subsystem is highly sensitive to scarcity perception. When scarcity is perceived, non-cooperative behaviour predominates, whereas its absence favours the emergence of reciprocal cooperation among individuals.
3.3. Non-OECD-Based Configuration Scenario
The non-OECD configuration was evaluated under the two behavioural conditions described in Section 2.5: with and without scarcity perception. Figure 8 presents the temporal evolution of the aggregate system dynamics under both conditions.
The economic subsystem exhibits a rapid collapse under both behavioural conditions. During the brief period in which companies remain active, the non-cooperative strategy remains slightly more prevalent than the other strategies. The early disappearance of firms marks the onset of the contraction of the socio-economic system, preceding the subsequent decline of the population and the progressive recovery of renewable environmental resources.
The social subsystem also exhibits contrasting dynamics under the two behavioural conditions. When scarcity perception is enabled, non-cooperative behaviour remains the dominant strategy and the population declines rapidly until disappearance. In the absence of scarcity perception, cooperative strategies, particularly tit-for-tat, become predominant, delaying the contraction of the social subsystem. However, despite this behavioural shift, the population also collapses, indicating that cooperative dynamics alone are insufficient to sustain the system under the initial conditions represented by the non-OECD configuration.
3.4. Integrated Analysis of the Simulation Results
The previous sections presented the results for each empirical configuration independently. To facilitate an integrated comparison, Table 3 summarises the principal behavioural and system-level patterns observed across the global, OECD, and non-OECD configurations under both behavioural conditions. The comparison focuses on subsystem persistence, dominant behavioural strategies, renewable environmental resource dynamics, and overall system evolution, providing a consolidated view of the simulation outcomes before discussing their theoretical implications.
Table 3.
Integrated comparison of system dynamics across the three empirical configurations.
The integrated comparison reveals three consistent patterns across the simulations. First, the economic subsystem exhibits greater behavioural stability than the social subsystem. Tit-for-tat remains the dominant firm strategy in both the global and OECD configurations regardless of scarcity perception, whereas no dominant strategy is sustained in the non-OECD configuration because of the rapid disappearance of firms. Second, the emergence of cooperation is strongly influenced by agents’ perception of resource availability. Across all three configurations, scarcity perception consistently promotes the predominance of non-cooperative behaviour, whereas the absence of scarcity perception favours the emergence of cooperative strategies, reaching its highest expression in the OECD configuration. Third, the persistence of both firms and individuals differs substantially across the three empirical configurations, being greatest in the OECD configuration, intermediate in the global configuration, and shortest in the non-OECD configuration. Together, these comparative results provide the empirical basis for examining how behavioural responses to environmental conditions influence cooperation, sustainability, and peaceful socio-economic dynamics in the following discussion.
4. Discussion
The simulations suggest that cooperation is not solely determined by the objective availability of renewable resources, but also by how agents perceive those resources. Across all empirical configurations, scarcity perception consistently shifted the social subsystem toward non-cooperative behaviour, whereas the absence of scarcity perception facilitated the emergence of cooperative strategies. This finding indicates that behavioural responses to environmental conditions constitute a key mechanism through which socio-ecological systems evolve. As an exploratory agent-based model, these results should be interpreted as emergent outcomes generated by the interaction between the empirical initial conditions and the behavioural rules implemented in the model, rather than as predictions of real-world trajectories.
4.1. Scarcity Perception as a Behavioural Mechanism
Across the three empirical configurations, scarcity perception consistently shifted the social subsystem toward non-cooperative behaviour, whereas the absence of scarcity perception favoured the emergence of cooperative strategies. Because the behavioural rules remained identical across simulations, this pattern suggests that cooperation depends not only on resource availability but also on how agents perceive environmental conditions. From the perspective of complexity economics (Arthur 2014), agents continuously adapt their behavioural responses to the environment they collectively create, making cooperation an emergent property of these adaptive interactions rather than a fixed behavioural trait.
The persistence of non-cooperative behaviour under scarcity perception also suggests the emergence of behavioural lock-in dynamics. Once agents repeatedly adopt non-cooperative strategies under perceived scarcity, these behaviours become self-reinforcing, even when environmental conditions subsequently improve. This finding is consistent with Arthur’s (2014) concept of lock-in, whereby adaptive behaviours that are initially advantageous may persist because of positive feedback mechanisms rather than continued optimality.
4.2. Initial Conditions and Socio-Ecological Resilience
The three empirical configurations also differed markedly in their capacity to sustain economic and social activity over time. The OECD configuration exhibited the greatest persistence of both firms and individuals, whereas the non-OECD configuration experienced the earliest socio-economic collapse. The global configuration displayed an intermediate trajectory. These differences suggest that system resilience emerges from the interaction between initial resource conditions and the behavioural strategies adopted by agents rather than from resource availability alone.
In the OECD configuration, individuals remained active long after firms had disappeared because they accumulated larger renewable resource stocks during earlier interactions. This persistence is consistent with the more favourable initial resource conditions of the OECD configuration and the accumulation of renewable resource stocks associated with the cooperative dynamics observed during the simulations.
4.3. Cooperation as an Emergent Organisational Strategy
Unlike the social subsystem, firms exhibited comparatively stable behavioural dynamics across the simulations. In both the global and OECD configurations, tit-for-tat remained the dominant strategy regardless of scarcity perception, suggesting that reciprocal cooperation constitutes a robust adaptive response within the economic subsystem. From the perspective of complexity economics, firms, according to Arthur (2014), continuously adapt their decisions by observing the outcomes of previous interactions and adjusting their behaviour. Under these conditions, reciprocal cooperation can progressively spread because strategies associated with higher collective performance are more likely to be maintained and reproduced through repeated interactions.
This behavioural pattern is consistent with contemporary organisational dynamics in which firms increasingly adopt sustainability-oriented practices through adaptive learning and institutional imitation. Rather than acting in isolation, organisations observe successful peers and voluntarily adopt governance mechanisms that enhance long-term competitiveness and legitimacy. Examples include the global diffusion of B Corp certification (Attanasio et al. 2025), the growing adoption of Science-Based Targets (SBTs) (Schüder and Zülch 2026), or the expansion of ESG disclosure frameworks promoted by stock exchanges and international initiatives (Yan et al. 2026), to name a few. Although these mechanisms differ in scope and purpose, they share a common feature: firms progressively converge towards practices perceived as generating superior environmental, social, and economic performance. While the present model does not explicitly represent these institutional arrangements, the persistence of reciprocal cooperation among firms is consistent with these adaptive affordance dynamics observed in contemporary sustainability transitions.
4.4. From Intergroup Competition to Resource Governance
Across the three empirical configurations, cooperative dynamics were sustained when repeated interactions generated reciprocal benefits, whereas competition at the individual level tended to reinforce non-cooperative behaviour under scarcity perception. This pattern is consistent with multi-level selection theory, which proposes that cooperation is more likely to evolve when selection operates primarily between groups rather than exclusively among individuals (Wilson 2016). Accordingly, the emergence and persistence of cooperation depend not only on individual incentives but also on how interactions are structured within the socio-ecological system.
From this perspective, the findings suggest practical implications for renewable resource governance. Rather than attempting to eliminate differences among stakeholders, public policies could promote the formation of heterogeneous groups integrating firms, local communities, governmental agencies, environmental organisations, indigenous peoples, academia, and other relevant actors. These groups would cooperate internally while competing with other heterogeneous groups in the design, implementation, and evaluation of conservation, restoration, or sustainable resource management initiatives. This proposal extends the concept of intergroup competition developed by Giraldo-Suárez and León-Rodríguez (2023), in which cooperation is strengthened by relocating competition from direct access to resources toward intergroup competition in achieving shared environmental and social objectives.
This governance approach is also consistent with the concept of coopetition, which recognises that cooperation and competition are complementary rather than mutually exclusive processes (Brandenburger and Nalebuff 1996; Bengtsson and Kock 2000). While coopetition has traditionally been applied to business strategy, the present findings suggest that its underlying principles may also inform the governance of socio-ecological systems. Rather than asking how competition over renewable resources can be eliminated, it is suggested under this perspective that institutional arrangements that combine cooperation within heterogeneous stakeholder groups and competition between groups may contribute to strengthening governance capacity, promoting more sustainable resource management, and reducing incentives for conflict over resource appropriation.
Beyond their implications for renewable resource governance, the proposed institutional approach also provides a conceptual bridge between sustainability and peace. Recent research on sustainable peace argues that enduringly peaceful societies are characterised not simply by the absence of violence, but by the predominance of cooperative and positively reciprocal interactions that become embedded within social systems over time (Coleman et al. 2020). From a complexity perspective, peace emerges as an emergent property of systems in which constructive interactions consistently outweigh destructive ones. Although the present model does not explicitly simulate peacebuilding processes, its results suggest that institutional arrangements capable of fostering repeated cooperation among heterogeneous stakeholders may simultaneously strengthen socio-ecological sustainability and create conditions associated with more peaceful and resilient social systems.
5. Conclusions
This study examined how interactions among environmental, social, and economic subsystems influence sustainability outcomes and whether cooperation emerges as the mechanism linking these systems. The simulations suggest that cooperation is not an intrinsic property of any individual subsystem but an emergent property arising from repeated interactions among heterogeneous agents operating under specific environmental conditions. Behavioural responses to perceived resource scarcity proved to be a key driver of these dynamics, reinforcing non-cooperative lock-in states under scarcity while favouring reciprocal cooperation in its absence. These findings suggest that cooperation constitutes the behavioural mechanism connecting environmental sustainability with the conditions associated with sustainable peace, as cooperative interactions simultaneously strengthen socio-ecological resilience and reduce the persistence of non-cooperative dynamics.
The comparative analysis further showed that the persistence of cooperation depends on both the initial conditions of the socio-ecological system and the adaptive strategies adopted by agents. The OECD-based configuration exhibited greater resilience, maintaining firms and individuals active for longer periods through more favourable initial resource conditions and sustained reciprocal interactions. In contrast, the non-OECD configuration experienced an early collapse of both economic and social subsystems. Across the global reference and OECD configurations, tit-for-tat remained the dominant organisational strategy, indicating that repeated reciprocal cooperation represents a robust adaptive mechanism capable of supporting more resilient socio-ecological systems and creating conditions consistent with the emergence of sustainable peace.
From a methodological perspective, integrating environmental, social, and economic subsystems within a single agent-based model made it possible to analyse feedback and emergent behaviours that would be difficult to capture using conventional approaches. At the same time, representing three interconnected adaptive subsystems increased the complexity of model calibration, validation, and interpretation. Although empirical information was used to define the initial conditions, the simulations were designed to explore behavioural mechanisms rather than predict real-world trajectories. These methodological trade-offs constitute both a limitation and an opportunity for future developments of socio-ecological agent-based models.
Future research could extend this framework by examining how alternative behavioural assumptions, institutional mechanisms, and modelling approaches may generate different emergent dynamics. In particular, explicitly modelling heterogeneous intergroup coopetition as an institutional mechanism for renewable resource governance and further investigating lock-in dynamics in sustainability transitions could provide promising directions for future research. Advancing these research directions may improve understanding of how institutional design influences the emergence of cooperation in socio-ecological systems. More broadly, this study suggests that cooperation should be understood not merely as a desirable policy objective but as an emergent property that can be fostered through the design of interactions among environmental, social, and economic systems.
Author Contributions
Conceptualisation, A.I.G.-S. and J.I.G.-V.; methodology, A.I.G.-S.; writing—review and editing, A.I.G.-S., Y.C.O.-G. and J.I.G.-V.; funding acquisition, Y.C.O.-G. All authors have read and agreed to the published version of the manuscript.
Funding
This research was supported by a doctoral scholarship awarded through the National Doctoral Scholarship Program (Call No. 757) of the Ministry of Science, Technology and Innovation of Colombia (formerly Colciencias). No individual grant number was assigned.
Institutional Review Board Statement
Not applicable.
Informed Consent Statement
Not applicable.
Data Availability Statement
Data Availability Statements are available at https://drive.google.com/drive/folders/1yFt4SonAIhTWY0J99CXeYs-6hrb442Qk?usp=drive_link (accessed on 17 April 2026).
Acknowledgments
Declaration of generative AI and AI-assisted technologies in the writing process. During the preparation of this work, the authors used GPT-4, GPT 5.5 and Grammarly to improve language and readability. After using those tools, the authors reviewed and edited the content as needed and take full responsibility for the content of the publication.
Conflicts of Interest
The authors declare no conflicts of interest. The scholarship founder had no role in the design of the study; in the collection, analyses, or interpretation of data; in the writing of the manuscript; or in the decision to publish the results.
Abbreviations
The following abbreviations are used in this manuscript:
| CAS | Complex Adaptive System |
| GDP | Gross Domestic Product |
| IPCC | International Panel of Climate Change |
| ODD | Overview, Design Concepts and Details |
| OECD | Organization for Economic Cooperation and Development |
Appendix A. Initial Condition and Model
The base data used to construct, calibrate, and initiate the model are from 2017.
Table A1.
Initial conditions and parameters.
Appendix B. Submodels
Appendix B.1. Environmental System
Humanity demands biologically productive areas for food, fibre, and timber production, physical infrastructure, and waste absorption, particularly carbon dioxide from fossil fuel combustion. This demand is comparable to the available productive areas that provide regeneration. As this varies, it must be measured not in terms of physical space but in terms of biological renewal. Thus, the ecosystem’s capacity to regenerate biomass is called, measured in standardised global hectares and represents the productivity of an average biologically productive hectare worldwide. According to 2017 data, the Earth had about 12.1 billion biologically productive hectares, including productive ocean areas.
The totality of environmental resources, in terms of biocapacity hectares, is denoted as S(t) with t as time > 0 and is made up of resources in smaller areas, called Ri, with i varying between (0 and 1225)4 and which are graphically observed in the model as small grids called patch. In these, each one represents approximately one million hectares of biocapacity. The renewal of those resources that can do so is done at each time (tick), which equals a year, using a value provided by the observer through the variable (inc-environmental-resources).
The total resources for a time (t) are given by
Furthermore, it presents a renewal behaviour:
Appendix B.2. Economic System
In the proposed model, the economic system comprises atomised companies that seek to maximise their profits and are not subject to any regulatory entity. These interact with the people who constitute the social system (individuals), and in turn, both groups interact with the environmental system.
Each company and individual operate within the framework of a cooperative game, using one of four strategies j that range between (one and four), representing the heterogeneity of the agents that are assigned randomly. This means that the created universe comprises both companies and cooperative, non-cooperative, ethnocentric, or tit-for-tat individuals, and the proportion of both companies and individuals of each of these strategies is assigned randomly. The general characteristics of each strategy are:
j = 1 Cooperative Strategy. As Cottey (2018) suggests, the intricate social network is woven with human actions at a micro level, day by day, almost minute by minute, in which cooperation plays a significant role. The market does not exist as an “invisible hand” exogenously but as a dense network of interactions, many of which are cooperative. According to León (2006), cooperation is the individual behaviour that entails personal costs to participate in a common activity that confers benefits exceeding those costs for other group members.
j = 2 Non-Cooperative (Defection). In opposition to cooperation, defection is the individual behaviour that deviates from common welfare, incentivised by a greater particular benefit.
j = 3. Ethnocentrism. Axelrod and Hammond (2003) define ethnocentrism as cooperation with members of the group but not with those outside it. When interacting, the agent’s choice depends on whether the other agent has the same or a different observable label. The authors, in their inquiries, found that people validate their belonging to a group through a set of attributes that usually correspond to evident cultural traits they believe they share. Similarly, the authors point out that both favouritism within the group and hostility towards those who do not belong to it tend to be stronger in competitive situations or in the presence of external threats, which, given current environmental characteristics, can come to represent one of these. Thus, this type of interaction has been seen not only in ethnic conflicts and wars but also in consumer choice behaviours.
j = 4 tit-for-tat. Several studies have shown that the tit-for-tat strategy has been dominant in various round tournaments that simulate rational human behaviours among pairs of agents. These behaviours have been evidenced in human relationships and in nature and present the following pattern:
It starts by being cooperative.
It replicates the immediately previous move of the pair. When the pair responds cooperatively, cooperative behaviour is established. However, if the pair changes to defects, the agent retaliates by defecting in the next interaction. If the opponent later resumes cooperation, the agent also returns to cooperation, reflecting the strategy’s capacity for forgiveness.
This allows the cooperative dynamic to be re-established. In this type of interaction, it is necessary to remember the last past action (Axelrod 1984).
Furthermore, each strategy type is associated with behaviour in the prisoner’s dilemma cooperative game—used to model environmental dilemmas—and is linked to the levels of consumption of environmental resources by companies and individuals. Cooperative companies consume environmental resources moderately, while non-cooperative ones do so at the highest possible rates. Similarly, individuals with a cooperative strategy exhibit frugal consumption, while those with a non-cooperative strategy have a more abundant consumption.
Each individual is denoted as Pi with i ranging from 0 to a number of individuals selected by the model observer, through the variable called N-peo. This number of individuals represents the world population which, for 2017, was 7620 million people (Wackernagel et al. 2021). The model is developed to scale; therefore, it models 762 individuals.
Pi Person i ∀ i (0 − N-peo).
Meanwhile, the number of companies is determined by the global company density (3.8 companies per 100 inhabitants)5. Consequently, the number of companies comprising the model is determined by the number of individuals initially given. This value is recorded in the parameter num-com/num-peo.
As a consequence,
Thus, the companies are denoted as
Ei: Enterprise i ∀ i (0 − N-peo × 0.038).
The initial resources of the companies are given in biophysical units that represent in the model renewable resources (which is the transaction metric in the model), which are randomly assigned to each of them within a range between the minimum required for their existence (minimum-life-com) plus a random value given in a range between zero and a value assigned by the model observer, adjustable in the initial-resources-com variable and which is calibrated. Therefore, the initial resources of each company are a random value that oscillates in the range (minimum-life-com + random (0 − initial-resources-com)).
Economic Relationship Between Enterprises and Individuals
As already pointed out in the description of the environmental system, there is a supply of environmental resources measured in hectares of biocapacity. However, there is also a demand from humanity for these resources, known as the environmental footprint. To maintain biodiversity, which is fundamental for the integrity of the global ecosystem, humanity’s footprint should be less than the planet’s total biocapacity. However, in 2017, it was calculated to be 20,900 million hectares of biocapacity, which includes all human demands, even those of domestic animals, but not of other living beings that make up the planet. This is equivalent to 73% more than the regeneration of all the planet’s ecosystems combined. This value per person is equivalent to 2.8 global hectares (Wackernagel et al. 2021).
Enterprises are responsible for taking environmental resources and processing them to deliver them to people through goods and services (but in this model, the only transactional metric is biophysical units, representing renewable resources). Given the current number of companies, each company requires, on average, 66 hectares of biocapacity.
The economic relationship between enterprises and individuals is represented in the model by two roles. One comes from the point of view of companies, which are those that make transfers to the social system, for example, through hiring labour or paying dividends, and constitute the only source of income for individuals. Moreover, the other is the role of individuals who buy the goods or services demanded for their well-being.
From the perspective of individual purchases, each one of them, according to their profile, makes a consumption that corresponds to a percentage with respect to the consumption established by each person, which is given by the tick-consume-peo variable, which corresponds to a value of 2.8 hectares of biocapacity. If the individual has a cooperative strategy, they will consume less than this value; if they are ethnocentric or tit-for-tat, consumption will be close to this amount. Consumption will be greater than the base value if they have a non-cooperative character. These percentages are adjusted with variables for each strategy: %consume-tick-coop-peo, %consume-tick-average-peo, and %consume-tick-non-coop-peo.
Consumption of each individual = tick consumes peo × %consumes tick peo (according to the strategy)
This consumed value is deducted from people’s total resources and added to the selected company to make the “purchase.”
At first, the individual wonders whether they have sufficient resources to meet the demands of their profile. If so, it chooses one of the companies that has taken resources from the environmental system, transfers the resources it is going to consume (makes the payment), and assigns a label to the company that sold them, because only companies that sell can take resources from the environmental system.
If the individual does not have sufficient resources for consumption in line with their profile, they spend what they have with a company that has drawn resources from the natural system. The company is assigned the label of having sold.
From the perspective of companies, when they transfer part of their resources to the social system, each company selects several people to whom it pays (dividends or salaries). This number is determined by the ratio of the number of people in the system to the number of current companies. Each company “pays” this number of people the equivalent of what each company consumes, plus a random value within each company’s surplus, divided by the number of people to be transferred. Thus, each individual does not receive the same amount transferred.
The formula would be given by
Payment matrix environmental conflicts.
The strategies established by corporations and individuals are relevant when resolving environmental conflicts. A conflict can arise when actors are heterogeneous and have varying objectives. Actions are taken not only based on one’s reasoning but also on that of others. In this context, game theory proves an appropriate approach for modelling, providing an optimisation framework for decision-making among interdependent agents (Axelrod 1984).
The prisoner’s dilemma (PD) has become a classic way to model interactions among agents with mixed objectives, including both conflict and cooperation. In these cases, individuals are cooperatively better off if they collaborate with a view to a common interest. However, they face the strategy of defecting (free rider), which is better paid by enjoying or exploiting the cooperation of others without contributing to it.
In cooperation exercises, when constructing the payment matrix, the compensations must not be of the same magnitude or symmetrical, but the payoffs must be based on the prisoner’s dilemma. Compensations need not be on an absolute scale; they must be relative, and the matrix must reflect that cooperation is desirable (Axelrod 1984).
Each player has two possible actions in each move: {cooperate, defect}. Interactions occur between pairs of players. The number of moves is fixed but unknown for each player. The payoff matrix is known by the players before the game.
From the interactions of agents resolving their conflicts, a score is obtained from the payoff matrix, representing each agent’s losses in the conflict under the implemented strategy.
Table A2.
Payment matrix.
Obtaining resources from the environmental system.
This use of environmental resources varies across companies and is determined by the strategies they follow. Companies with a cooperative strategy take the resources of the environmental system sparingly; tit-for-tat or ethnocentrists take a little more environmental resources than those with a cooperative strategy, but they do not take all the possible resources from the environmental system, as those with a non-cooperative strategy do. These consumption proportions are given by percentages assigned to each strategy through the variables %resources-taken-coop-com, %resources-taken-average-com, and %resources-taken-non-coop-com.
Economic agents’ adaptation.
Once the agents of the economic and social systems have resolved their environmental dilemmas and the enterprises have drawn on the environmental system in accordance with their strategies, they adapt their strategies based on their resource levels and the companies around them.
At this point, the company asks itself: What has been the strategy (of the four already mentioned) that has generated the most significant benefits for the companies around it? To determine what exactly is “around” an action, a radius is used, editable by the observer, called radius-influence-com. Thus, the company compares its resources at a time (t) with the maximum of the set made up of the averages of the resources of the enterprises located in the range of influence according to each strategy type for the same time (t). If its strategy is not higher than the average of the most successful strategy in the influence range, switch to the strategy that offers better results.
In this way, if
With n: influence radius Eij.
Switch to the average maximum strategy.
Economic agents: birth and death.
Finally, each company takes stock of its resources, and if it exceeds a certain threshold, it can generate a new company with the same characteristics. The model observer determines this threshold through the variable Threshold-reproduction-com.
Under this framework of evolutionary theory, the new company has a percentage probability of mutating by not following the strategy of its parent. This means that you can choose, at random, any of the four strategies presented. This mutation percentage is editable by the observer through the %mutation-com variable. Furthermore, this new company has a portion of the resources of the parent strategy, editable by the observer through the %heritage-com variable.
Subsequently, the resources required to implement a new company are discounted. The observer establishes this value based on the reproduction-com-cost variable and calculates the company’s new resource balance. If this is below the life threshold, editable by the observer through the threshold-life-com variable, the company disappears.
In this way, we seek to evaluate which strategies dominate the system on two scales: (i) whether there is a dominant tendency of specific strategies adopted by the agents given the adaptive characteristics, and (ii) what strategies are presented by the agents that have the greatest capacity to survive and, therefore, to reproduce.
In summary, enterprise resource balance, called total-earnings-com in the model, results from the total resources in a given time plus the resources obtained from individuals by “selling their goods”, minus the resources delivered to people as salary payments or dividends, less the costs of social dilemma score, plus the resources obtained, directly, from the environmental system according to the type of strategy implemented, less the cost in resources for generating a new company.
Appendix C. Social System
The primary agent representing this system is the individual, who participates in various processes across the economic and social systems. The operational form can influence the strategies of the enterprises that, for this model, are the only type of agent that can take resources from the environment. Therefore, the level of responses of the environmental system affects people’s behaviour, and their subsequent behaviour can, in turn, affect the environmental system.
The people come with several resources, which are randomly assigned to each of them, in a range between the minimum required for their existence (minimum-life-peo) and a random value within a range between 0 and an assigned value by the observer, adjustable in the variable initial-resources-peo and calibrated. Therefore, these initial conditions of the person peo (0) is a random value that oscillates in the range (minimum-life-peo) + random (0 − initial-resources-peo).
These persons establish a commercial relationship with enterprises; they buy goods or services from enterprises and receive income through salaries and/or dividend payments, while also being subject to environmental issues, dynamics that were explained in the economic system.
Adaptation mechanism.
Individuals’ strategies are subject to change according to the dynamics of the environment in which they interact. In the designed model, individuals adapt to the environment through two mechanisms: (i) perception of environmental resource scarcity and (ii) social influence.
Regarding the first point, academic evidence suggests that the level of environmental resources can be perceived as a threat to the social system, leading to the emergence of another endogenous economic and evolutionary biology. In their bibliographic and experimental research, Roux et al. (2015) found that resource scarcity can lead to selfish behaviours. As resources become scarce, individuals expend more effort and time competing with others for them. Their experimental results showed evidence of a cognitive association between scarcity and competition. Furthermore, the authors point out that reminders of resource scarcity can affect decision-making by shifting competitive orientation, leading to a greater desire to promote one’s own well-being. This may lead to prioritising benefits for oneself over benefits for others.
However, the authors concluded from their experiments that a competitive orientation does not necessarily yield selfish outcomes. Reminders of resource scarcity can promote generous behaviours when the connection between such behaviours and the advancement of one’s well-being is highlighted. Bowles and Gintis (2002) provide a broader explanation of this situation. Their studies suggest that cooperation becomes more necessary for survival when a group is threatened with extinction or dispersion, as in the case of war, pestilence, or famine. However, the likelihood of one’s contributions being repaid in the future decreases sharply when the group is threatened, as the probability of its dissolution increases. Therefore, the incentive to cooperate will not thrive. This leads to a situation in which cooperation based on reciprocal altruism collapses when a group most needs prosocial behaviour. These critical periods are common in the evolutionary history of the human species.
Therefore, the perception of environmental resource scarcity can amplify a behaviour in which personal interest prevails over cooperative behaviour. In this context, individuals question the level of environmental resources around them for the proposed model, delimited by an action radius given by the variable radius-influence-peo. If these resources fall below a threshold established by the observer, called shortage-threshold-peo, individuals, with a probability between 0 and a value specified by the observer through the variable %change-people, switch to a non-cooperative strategy if it is not already implemented.
Then, pij changes to pi2 with a probability in a range of .
Otherwise, if there is no perception of scarcity, the second adaptation mechanism appears from social influence.
Holling (2001) suggests that self-organised patterns frequently develop in human systems. Humans possess the unique ability to communicate ideas and experiences, and as these are tested, they are incorporated into myths, norms, laws, and other forms. In Axelrod’s (1997) modelling on the dissemination of culture, it is found that in more than a hundred definitions, there is a consensus that culture is something learned among people. Hence, he also uses a bottom-up approach in his model of cultural trait transmission. Axelrod assumed that culture is what social influence influences.
As has been explained, based on the rationality of the agents, the social system, made up of people, affects the decisions of individuals who, in turn, again affect the entire social environment. For this reason, in this model the social environment is also considered an influential factor in people’s adaptations. In this sense, each ‘pij’ can change with a given probability between 0 and ‘%change people’ (provided by the observer) to one of the ‘pij’ strategies within their radius of influence ‘radius-influence-peo.’
Therefore, the strategy of ‘pij’ can change to any other ‘pij’ within the radius of influence. This behaviour brings with it an amplifying mechanism since the more surrounded a person is by others with the same type of strategy, the greater the probability of changing to that strategy, thus triggering an expansion effect. This strategy subsequently affects how one resolves environmental dilemmas with other agents. These dilemmas bring costs that affect companies’ total resources. Based on that balance, companies can change the type of strategy that determines the intensity of consumption of environmental resources. In this way, an individual can affect the entire system.
Social agents: birth and death.
Subsequently, each individual assesses the level of their biophysical units representing renewable resources. If these surpass the reproduction threshold set for individuals, which the observer assigns through the variable Threshold-reproduction-peo, they reproduce to generate offspring with identical characteristics. However, a mutation can occur with a probability given by the observer with the variable %mutation-peo. This implies that instead of adopting the same strategy as its parent, it can choose any of the four strategies with the established probability. Moreover, this new individual possesses a percentage of the parent’s resources, determined by the parameter %hertiage-peo.
Following this, the cost of a new birth is deducted, whose value is given by the variable reproduction-peo-cost (adjustable by the observer). Finally, a balance of resources available to the individual is made; if these are below the survival threshold, as set by the variable Threshold-life-peo, the individual dies. Otherwise, it restarts the cycle.
The total balance of resources for each pij, called total-earnings-peo, is given by the balance of biophysical units (renewable resources) of the individual at a time (t) plus transfers from companies for wage payments or profits, minus the resources of the individual allocated to purchasing their goods or services, minus social dilemma costs (score), minus reproduction cost if it reproduces.
Appendix D. Protocol ODD
Overview
This is to comprehend the behaviour of cooperation as an essential element in promoting peace, stemming from the emergencies arising from interactions among environmental, economic, and social systems. In this model, the behaviour of the economic system is driven by the maximisation of its benefits, which are impacted by environmental dilemmas with society. Society acts based on the state of these environmental resources and the influence they exert on individuals.
The following diagram represents the model dynamics within which three subsystems are interacting: economic, social, and the environmental system.
State variables and scale.
The model distinguishes between two types of agents (individuals and companies) and patch (the space in which the agents interact and which contain the environmental resources).
- Environmental system.
- (i)
- The patch corresponds to a unit of renewable resources and is made up of a predetermined number to adjust to the reality of hectares; global biocapacity (35 × 35): 1225 in total.
- (ii)
- In each execution, each patch containing the resources is renewed at a rate given by the observer, which represents the environmental regeneration rate.
- Economic system.
- (i)
- The type of agent it represents is the corporation, which can deploy one of four strategies (cooperative: always cooperates; non-cooperative: never cooperates; tit-for-tat: starts coopering and then uses the same last strategy used by his opponent; and ethnocentric: only cooperates with others with the same label).
- (ii)
- These corporations provide goods and services to individuals within the social system.
- (iii)
- They deal with environmental conflicts with individuals or other corporations through the prisoner’s dilemma, with a negative payoff matrix representing the costs of disputes.
- (iv)
- They transfer resources (biophysical units) to the social system by paying wages or dividends, providing the means for the social system to consume the demanded goods or services. Transactions and transfers are expressed in biophysical resource units that represent renewable resources.
- (v)
- Subsequently, it evaluates which strategy among nearby corporations generates greater benefits and switches to it if it is not already applied.
- (vi)
- They consume environmental resources with an intensity subject to the strategy they deploy.
- (vii)
- If they have sufficient resources, they generate a new corporation and deduct the cost of creating this new agent.
- (viii)
- They evaluate whether it has sufficient resources to sustain itself.
- Social system.
- (i)
- The type of agent represented is the individual who can implement one of four strategies (cooperative: always cooperates; non-cooperative: never cooperates; tit-for-tat: starts coopering and then uses the same last strategy used by his opponent; and ethnocentric: only cooperates with others with the same label).
- (ii)
- These individuals demand goods and services from corporations according to the level of their resources to pay for them.
- (iii)
- They resolve environmental conflicts with corporations or other individuals through the prisoner’s dilemma, with a negative payoff matrix representing the costs of disputes.
- (iv)
- They receive resources from the economic system, such as wages or dividends, which they use to meet their needs. Transactions and transfers are expressed in biophysical resource units that represent renewable resources.
- (v)
- They change their current strategy to a non-cooperative one if the environmental resources around them fall below a certain threshold. Otherwise, with a certain probability, they adopt the strategy of another nearby individual.
- (vi)
- If they have sufficient resources, they reproduce and deduct the cost of a birth.
- (vii)
- They evaluate whether they have sufficient resources to sustain themselves.
Process overview and scheduling.
This refers to the resolution (spatial grain size, time unit, or degree of model complexity) and the extent (time, space, and number of components modelled). The scale is directly tied to the aggregation problem (Costanza et al. 2013). For the research on sustainability and its practice, an operational and realistic time scale is suggested to be 50 years or two generations (Wu 2013).
Advancing in Time.
In ABM, there are two methods to advance the clock: the fixed-increment time advancement method (or asynchronous update) and the following-event advancement method (or synchronous update) (Sarmiento-Vásquez and López-Sandoval 2017). For this research, the first option is used; that is, all processes run in the same tick (model execution period), which is cumulative and is considered a year.
Design concept
Emergence.
It is expected to observe it in the type of dominant strategy, as well as in the number of available resources.
Interaction.
Occurs through (i) the exchange of resources between agents (individuals and companies), representing market transactions; (ii) the prisoner’s dilemma, subject to the agents’ strategies, whose interaction simulates environmental dilemmas; and (iii) companies’ taking of environmental resources.
Detection.
(i) Companies are sensitive to the resource level of other companies around them, which allows them to identify the most successful strategy and match it; (ii) individuals are sensitive to the environmental resources of their surroundings. If individuals detect environmental resource scarcity, they change to a non-cooperative strategy if they use a different strategy; (iii) individuals can detect the strategy of nearby individuals and match them subject to a probability.
Stochasticity.
It is used to create variability in conditions at various times: (i) Distribution of strategies among individuals. (ii) The amount of resources with which each company starts (they are random, within a specific range). (iii) The amount of resources with which each individual starts (they are random, within a specific range). (iv) The companies’ and individuals’ initial conditions are random. (v) Individuals can change their strategy to one used by their neighbours with a probability between 0 and the value given by the observer. (vi) The strategy of new companies and/or individuals can present mutation (they do not inherit the strategy of the progenitor, but they can randomly choose one of the four given strategies). The observer gives the probability of the mutation event.
Planning.
It is modelled in discrete time, with ticks (years). The agents’ actions must follow the order described in the flowcharts presented in the submodules (Appendix B).
Details
Initialisation.
- (i)
- The model begins with an allocation of resources in each of the patches. In the base model, the total sum of each patch’s resources represents the planet’s total biocapacity (environmental resources).
- (ii)
- The number of companies is given by a relationship between the number of people worldwide and the number of companies worldwide (empirical data).
- (iii)
- Parameters that require calibration are:
- The upper range of the amount of the initial resource for each company.
- The upper range of the amount of the initial resource for each individual.
- The threshold of environmental resources below which people assume non-cooperative behaviours.
- The company’s resource threshold from which a new one can be generated.
- The individual’s resource threshold from which a new person can be born.
- The costs of generating a new company.
- The reproduction costs of a person.
- The company’s resource threshold from which a company disappears.
- The individual’s resource threshold from which a person dies.
- The values of the payoff matrix of the prisoner’s dilemma.
Inputs.
The model requires parameters and initial conditions. The source of the input data and the methods for generating or obtaining initial conditions and parameters are in Appendix A.
Notes
| 1 | Sources for data from pictures from Our World in data are: Population: Historical Database of the Global Enviroment HYDE (V3.2) and UN World Population Prospects (2022 revision) https://ourworldindata.org/poverty-minimum-growth-needed (accessed on 23 August 2023). World GDP: The World Bank GDP (2017) https://data.worldbank.org/indicator/NY.GDP.MKTP.PP.KD (accessed on 23 August 2023) and Madisson data (University of Groningen) http://www.ggdc.net/maddison/oriindex.htm (accessed on 23 August 2023). CO2 emissions: Global carbon budget. https://globalcarbonbudget.org/ (accessed on 23 August 2023) Average temperature change: Met office Hadley Centre observations dataset https://www.metoffice.gov.uk/hadobs/hadcrut5/ (accessed on 23 August 2023) Number of recorded natural disaster events: EM-DAT The international disaster database |
| 2 | Environmental, social and economy system are widely explained in Appendix B. |
| 3 | Tit-for-tat is a reciprocal strategy that initially cooperates and subsequently replicates the partner’s previous action. |
| 4 | In order to represent the hectares of global biocapacity in the model (12.1 billion hectares), each patch represents approximately one million hectares of biocapacity. |
| 5 | According to the data collection firm Bolddata (2022), it is estimated that there are 300,000,000 companies worldwide. |
References
- Acquier, Aurélien, Thibault Daudigeos, and Jonatan Pinkse. 2017. Promises and Paradoxes of the Sharing Economy: An Organizing Framework. Technological Forecasting and Social Change 125: 1–10. [Google Scholar] [CrossRef] [Scilit]
- Aktouf, Omar. 2017. Basta de Derroches: Acabar Con La Economía Management a La Americana. Primera. Bogotá: Universidad Nacional de Colombia. [Google Scholar]
- Arthur, W. Brian. 2014. Complexity Economics: A Different Framework for Economic Thought. In Complexity and the Economy. Oxford: Oxford University Press. [Google Scholar]
- Arthur, W. Brian, Eric Beinhocker, and Allison Stanger. 2020. Complexity Economics. Proceedings of the Santa Fe Institute’s 2019 Fall Symposium. Dialogues of the Applied Complexity Network, I. Santa Fe: The Santa Fe Institute Press. [Google Scholar]
- Attanasio, Giovanna, Cinzia Battistella, and Elia Chizzolini. 2025. B-Corp Certification: Systematic Literature Review and Research Agenda. Corporate Social Responsibility and Environmental Management 32: 3729–69. [Google Scholar] [CrossRef] [Scilit]
- Axelrod, Robert. 1984. The Evolution of Cooperation. New York: Basic Books. [Google Scholar]
- Axelrod, Robert. 1997. The Complexity of Cooperation: Agent-Based Models of Competition and Collaboration. Princeton Studies in Complexity. Princeton: Princeton University Press. [Google Scholar]
- Axelrod, Robert, and Ross A. Hammond. 2003. The Evolution of Ethnocentric Behavior. Available online: http://www-personal.umich.edu/~axe/research/AxHamm_Ethno.pdf (accessed on 17 April 2026).
- Balci, Osman. 1998. Verification, Validation, and Testing. In Handbook of Simulation. Edited by Jerry Banks. Hoboken: John Wiley & Sons Inc. [Google Scholar]
- Barcellos, Luciano. 2010. Modelos de Gestión Aplicados a La Sostenibilidad Empresarial. Doctoral thesis, Universidad de Barcelona, Barcelona, Spain. [Google Scholar]
- BenDor, Todd, and Jürgen Scheffran. 2019. Agent-Based Modelling of Enviromental Conflict and Cooperation. Abingdon: Taylor and Francis Group. [Google Scholar]
- Bengtsson, Maria, and Sören Kock. 2000. “Coopetition” in Business Networks—To Cooperate and Compete Simultaneously. Industrial Marketing Management 29: 411–26. [Google Scholar] [CrossRef] [Scilit]
- Bolddata. 2022. Number of Companies Worldwide Surpasses 300 Million. Available online: https://bolddata.nl/en/number-of-companies-worldwide-surpasses-300-million/ (accessed on 24 October 2022).
- Bowles, Samuel, and Herbert Gintis. 2002. The Origins of Human Cooperation. SFI Working Papers. Santa Fe: Santa Fe Institute. Available online: https://sfi-edu.s3.amazonaws.com/sfi-edu/production/uploads/sfi-com/dev/uploads/filer/d2/2b/d22b3fd4-83eb-437d-a0d8-aa64e6e7ccf5/02-08-035.pdf (accessed on 5 February 2021).
- Brandenburger, Adam M., and Barry J. Nalebuff. 1996. Co-Opetition. New York: Doubleday. [Google Scholar]
- Brauch, Hans Günter. 2016. Sustainable Peace in the Anthropocene: Towards Political Geoecology and Peace Ecology. In Handbook on Sustainability Transition and Sustainable Peace. Edited by Hans Günter Brauch, Úrsula Oswald Spring, Jhon Grin and Jürgen Scheffran. Cham: Springer. [Google Scholar]
- Brauch, Hans Günter, and Úrsula Oswald Spring. 2016. Sustainability Transition and Sustainable Peace: Scientific and Policy Context, Scientific Concepts and Dimensions. In Handbook on Sustainability Transition and Sustainable Peace. Edited by Hans Günter Brauch, Úrsula Oswald Spring, Jhon Grin and Jürgen Scheffran. Cham: Springer, vol. 10. [Google Scholar]
- Carrozzo Magli, Alessio, Pompeo Della Posta, and Piero Manfredi. 2021. The Tragedy of the Commons as a Prisoner’s Dilemma. Its Relevance for Sustainability Games. Sustainability 13: 8125. [Google Scholar] [CrossRef] [Scilit]
- Coleman, Peter T., Joshua Fisher, Douglas P. Fry, Larry S. Liebovitch, Allegra Chen-carrel, and Geneviève Souillac. 2020. How to Live in Peace? Mapping the Science of Sustaining Peace: A Progress Report. American Psychologist 76: 1113–27. [Google Scholar] [CrossRef] [Scilit] [PubMed]
- Costanza, Robert, Lisa Wainger, Carl Folke, Karl-göran Mäler, Robert Costanza, and Lisa Wainger. 2013. Modeling Complex Ecological Economic Systems: Toward an Evolutionary, Dynamic Understanding of People and Nature. BioScience 43: 545–55. [Google Scholar] [CrossRef] [Scilit]
- Cottey, Alan. 2018. Environment Change, Economy Change and Reducing Conflict at Source. AI & Society 33: 215–28. [Google Scholar] [CrossRef] [Scilit]
- Crutzen, Paul, and Eugene Stoermer. 2000. The ‘Anthropocene’. In The Future of Nature. New Haven: Yale University Press. [Google Scholar]
- Cumming, Graeme S., Per Olsson, F. Stuart Chapin, III, and Crawford S. Holling. 2013. Resilience, Experimentation, and Scale Mismatches in Social-Ecological Landscapes. Landscape Ecology 28: 1139–50. [Google Scholar] [CrossRef] [Scilit]
- Dalby, Simon. 2016. Contextual Changes in Earth History: From the Holocene to the Anthropocene—Implications for Sustainable Development and for Strategies of Sustainable Transition. In Handbook on Sustainability Transition and Sustainable Peace. Edited by Hans Günter Brauch, Úrsula Oswald Spring, Jhon Grin and Jürgen Scheffran. Cham: Springer. [Google Scholar]
- Ferro, Carlos, Carmen Padin, Göran Svensson, Juan Carlos Sosa Varela, Beverly Wagner, and Nils M. Høgevold. 2017. Validating a Framework of Stakeholders in Connection to Business Sustainability Efforts in Supply Chains. Journal of Business & Industrial Marketing 32: 124–37. [Google Scholar] [CrossRef] [Scilit]
- Fisher, Joshua, and Kristen Rucki. 2017. Re-Conceptualizing the Science of Sustainability: A Dynamical Systems Approach to Understanding the Nexus of Conflict, Development and the Environment. Sustainable Development 275: 267–75. [Google Scholar] [CrossRef] [Scilit]
- Folke, Graeme Carl, Stephen R. Carpenter, Brian Walker, Marten Scheffer, Terry Chapin, and Johan Rockstrom. 2010. Resilience Thinking: Integrating Resilience, Adaptability and Transformability. Ecology and Society 15: 20. [Google Scholar] [CrossRef] [Scilit] [PubMed]
- Foster, John. 2005. From Simplistic to Complex Systems in Economics. Cambridge Journal of Economics 29: 873–92. [Google Scholar] [CrossRef] [Scilit]
- Foxon, Timothy J., Jonathan Köhler, Jonathan Michie, and Christine Oughton. 2013. Towards a New Complexity Economics for Sustainability. Cambridge Journal of Economics 37: 187–208. [Google Scholar] [CrossRef] [Scilit]
- Galán-Ordax, José Manuel. 2007. Evaluación Integradora de Políticas de Agua: Modelado y Simulación Con Sociedades Artificiales de Agentes. Doctoral dissertation, Universidad de Burgos, Burgos, Spain. [Google Scholar]
- García-Valdecasas, José Ignacio. 2016. Simulación Basada en Agentes. Introducción a NetLogo. Cuadernos Metodológicos 53. Madrid: CIS Centro de Investigación Sociológicas. [Google Scholar]
- Giraldo-Suárez, Angela Isabel, and Nohra León-Rodríguez. 2023. Intergroup Selection as a Way to Peace and Sustainability. Vision for Sustainability 19: 59–89. [Google Scholar] [CrossRef] [PubMed]
- Göpel, Maja. 2016. The Great Mindshift. How a New Economic Paradigm and Sustainability Transformations Go Hand in Hand. Cham: Springer Open. Wuppertal: Wuppertal Institute. [Google Scholar]
- Grimm, Volker, Uta Berger, Finn Bastiansen, Sigrunn Eliassen, Vincent Ginot, Jarl Giske, John Goss-Custard, Tamara Grand, Simone K. Heinz, Geir Huse, and et al. 2006. A standard protocol for describing individual-based and agent-based models. Ecological Modelling 198: 115–126. [Google Scholar] [CrossRef] [Scilit]
- Grin, Jhon. 2016. Transition Studies: Basic Ideas and Analytical Approaches. In Handbook on Sustainability Transition and Sustainable Peace. Edited by Hans Günter Brauch, Úrsula Oswald Spring, Jhon Grin and Jürgen Scheffran. Cham: Springer. [Google Scholar]
- Hardin, Garrett. 1996. The Tragedic of Commons. In Thinking About the Environment. New York: Routledge, pp. 164–169. [Google Scholar]
- Hochschild, Fabrizio. 2015. La Paradoja Ambiental Del Acuerdo de Paz. El Espectador. Available online: http://www.elespectador.com/noticias/paz/paradoja-ambiental-del-acuerdo-de-paz-articulo-539073 (accessed on 23 August 2023).
- Holling, Crawford S. 2001. Understanding the Complexity of Economic, Ecological, and Social Systems. Ecosystems 4: 390–405. [Google Scholar] [CrossRef] [Scilit]
- Institute for Economics & Peace. 2021. The Economy Value of Peace 2021. Available online: https://reliefweb.int/sites/reliefweb.int/files/resources/EVP-2021-web.pdf (accessed on 23 August 2023).
- Joireman, Jeff. 2005. Environmental Problems as Social Dilemmas: The Temporal Dimension. In Understanding Behavior in the Context of Time: Theory, Research, and Application. Mahwah: Lawrence Erlbaum Associates Publisher. [Google Scholar]
- Köhler, Jonathan, Fjalar de Haan, Georg Holtz, Klaus Kubeczko, Enayat Moallemi, George Papachristos, and Emile Chappin. 2018. Modelling Sustainability Transitions: An Assessment of Approaches and Challenges. Journal of Artificial Societies and Social Simulation 21: 8. [Google Scholar] [CrossRef] [Scilit]
- León, Nohra. 2006. Mecanismos Para La Regulación Ambiental. Bogotá: Universidad Nacional de Colombia. [Google Scholar]
- Lippe, Melvin, Mike Bithell, Nick Gotts, Davide Natalini, Peter Barbrook-Johnson, Carlo Giupponi, Mareen Hallier, Gert Jan Hofstede, Christophe Le Page, Robin B. Matthews, and et al. 2019. Using Agent-Based Modelling to Simulate Social-Ecological Systems across Scales. Geoinformatica 23: 269–98. [Google Scholar] [CrossRef] [Scilit]
- Loorbach, Derk, Janneke C. van Bake, Gail Whiteman, and Jan Rotmans. 2010. Business Strategies for Transitions towards Sustainable Systems. Business Strategy and the Environment 19: 133–46. [Google Scholar] [CrossRef] [Scilit]
- Markard, Jochen, Rob Raven, and Bernhard Truffer. 2012. Sustainability Transitions: An Emerging Field of Research and Its Prospects. Research Policy 41: 955–67. [Google Scholar] [CrossRef] [Scilit]
- Mebratu, Desta. 1998. Sustainability and Sustainable Development: Historical and Conceptual Review. Environmental Impact Assessment Review 18: 493–520. [Google Scholar] [CrossRef] [Scilit]
- Mitchell, Melanie. 2009. Complexity: A Guided Tour, 1st ed. Oxford: Oxford University Press. [Google Scholar]
- Mullainathan, Sendhil, and Edgar Shafir. 2014. Scarcity. New York: Picador. [Google Scholar]
- Newman, Mark E. J. 2009. Complex Systems: A Survey. arXiv arXiv:1112.1440. [Google Scholar]
- Ostrom, Elinor. 2010. Beyond Markets and States: Polycentric Governance of Complex Economic Systems. American Economic Review 100: 641–72. [Google Scholar] [CrossRef] [Scilit]
- Our World in Data. 2022. Our World in Data. Fish and Overfishing. Available online: https://ourworldindata.org/fish-and-overfishing (accessed on 23 August 2023).
- Porter, Michael, and Mark Kramer. 2011. La Creación de Valor Compartido. Harvard Business Review América Latina 89: 3–18. [Google Scholar]
- Rettberg, Angelika. 2016. Need, Creed, and Greed: Understanding Why Business Leaders Focus on Issues of Peace. Business Horizons 59: 481–92. [Google Scholar] [CrossRef] [Scilit]
- Rosser, J. Barkley, and Kirby Kramer. 2000. Integraiting the Complexity Vision into Mathematical Economics. In Complexity and the Teaching of Économics. Edited by David Colander. Glos: Edward Elgar. [Google Scholar]
- Roux, Caroline, Kelly Goldsmith, and Andrea Bonezzi. 2015. On the Psychology of Scarcity: When Reminders of Resource Scarcity Promote Selfish (and Generous) Behavior. Journal of Consumer Research 42: 615–31. [Google Scholar] [CrossRef] [Scilit]
- Sarmiento-Vásquez, Alfonso, and Eduardo López-Sandoval. 2017. Una Comparación Cualitativa de La Dinámica de Sistemas, La Simulación de Eventos Discretos y La Simulación Basada En Agentes. Ingeniería Industrial 35: 27–52. [Google Scholar] [CrossRef] [Scilit][Green Version]
- Schasfoort, Joeri. 2017. Complexity Economics. Available online: https://www.exploring-economics.org/en/orientation/complexity-economics/ (accessed on 28 August 2021).
- Schelling, Thomas. 1978. Micromotives and Macrobehaviours. New York: WW Norton & Company. [Google Scholar]
- Schüder, Martiin, and Henning Zülch. 2026. Corporate Carbon Performance and the Science-Based Targets Initiative: Disentangling the Effects across Scope 1, 2, and 3 Emissions. Journal of Industrial Ecology 30: 799–813. [Google Scholar] [CrossRef] [Scilit]
- Spangenberg, Joachim H. 2016. The World We See Shapes the World We Create: How the Underlying Worldviews Lead to Different Recommendations from Environmental and Ecological Economics—The Green Economy Example. International Journal of Sustainable Development 19: 127–46. [Google Scholar] [CrossRef] [Scilit]
- Suarez, Andres, Paola Andrea Arias-Arévalo, and Eliana Martínez-Mera. 2018. Environmental Sustainability in Post-Conflict Countries: Insights for Rural Colombia. Environment, Development and Sustainability 20: 997–1015. [Google Scholar] [CrossRef] [Scilit]
- Tschirhart, Philip, and Emma Frances Bloomfield. 2020. Framing the Anthropocene as Influence or Impact: The Importance of Interdisciplinary Contributions to Stratigraphic Classification. Environmental Communication 18: 698–711. [Google Scholar] [CrossRef] [Scilit]
- United Nations, Department of Economic and Social Affairs, Population Division. 2022. World Population Prospects 2022. Available online: https://www.un.org/development/desa/pd/sites/www.un.org.development.desa.pd/files/wpp2022_summary_of_results.pdf (accessed on 15 May 2022).
- U.S. Global Change Research Program. 2017. Climate Science. Special Report. Fourth National Climate Assessment. Washington: U.S. Global Change Research Program, vol. I. [Google Scholar]
- Vesely, Stepan, Christian Klöckner, and Cameron Brick. 2020. Pro-Environmental Behaviour as a Signal of Cooperativeness: Evidence from a Social Dilemma Experiment. Journal of Environmental Psychology 67: 101362. [Google Scholar] [CrossRef] [Scilit]
- Wackernagel, Mathis, Laurel Hanscom, Priyangi Jayasinghe, David Lin, Adeline Murthy, Evan Neill, and Peter Raven. 2021. The Importance of Resource Security for Poverty Eradication. Nature Sustainability 4: 731–38. [Google Scholar] [CrossRef] [Scilit]
- Wilson, David S. 2016. Two Meanings of Complex Adaptive System. In Complexity and Evolution. Toward a New Synthesis for Economics, 1st ed. Edited by David S. Wilson and Alan Kirman. Cambridge: The MIT press. [Google Scholar]
- Wu, Jianguo. 2013. Landscape Sustainability Science: Ecosystem Services and Human Well-Being in Changing Landscapes. Landscape Ecology 28: 999–1023. [Google Scholar] [CrossRef] [Scilit]
- Yan, Jiamian, Le Luo, and Nuraddeen Nuhu. 2026. Stock Exchange ESG Disclosure Guidance and Corporate Carbon Mitigation: International Evidence. Business Strategy and the Environment. ahead of print. [Google Scholar] [CrossRef] [Scilit]
- York University Ecological Footprint Initiative, and Global Footprint Netwoork. 2022. National Footprint and Biocapacity Accounts, 2022 Edition. Available online: https://data.footprintnetwork.org (accessed on 15 May 2022).
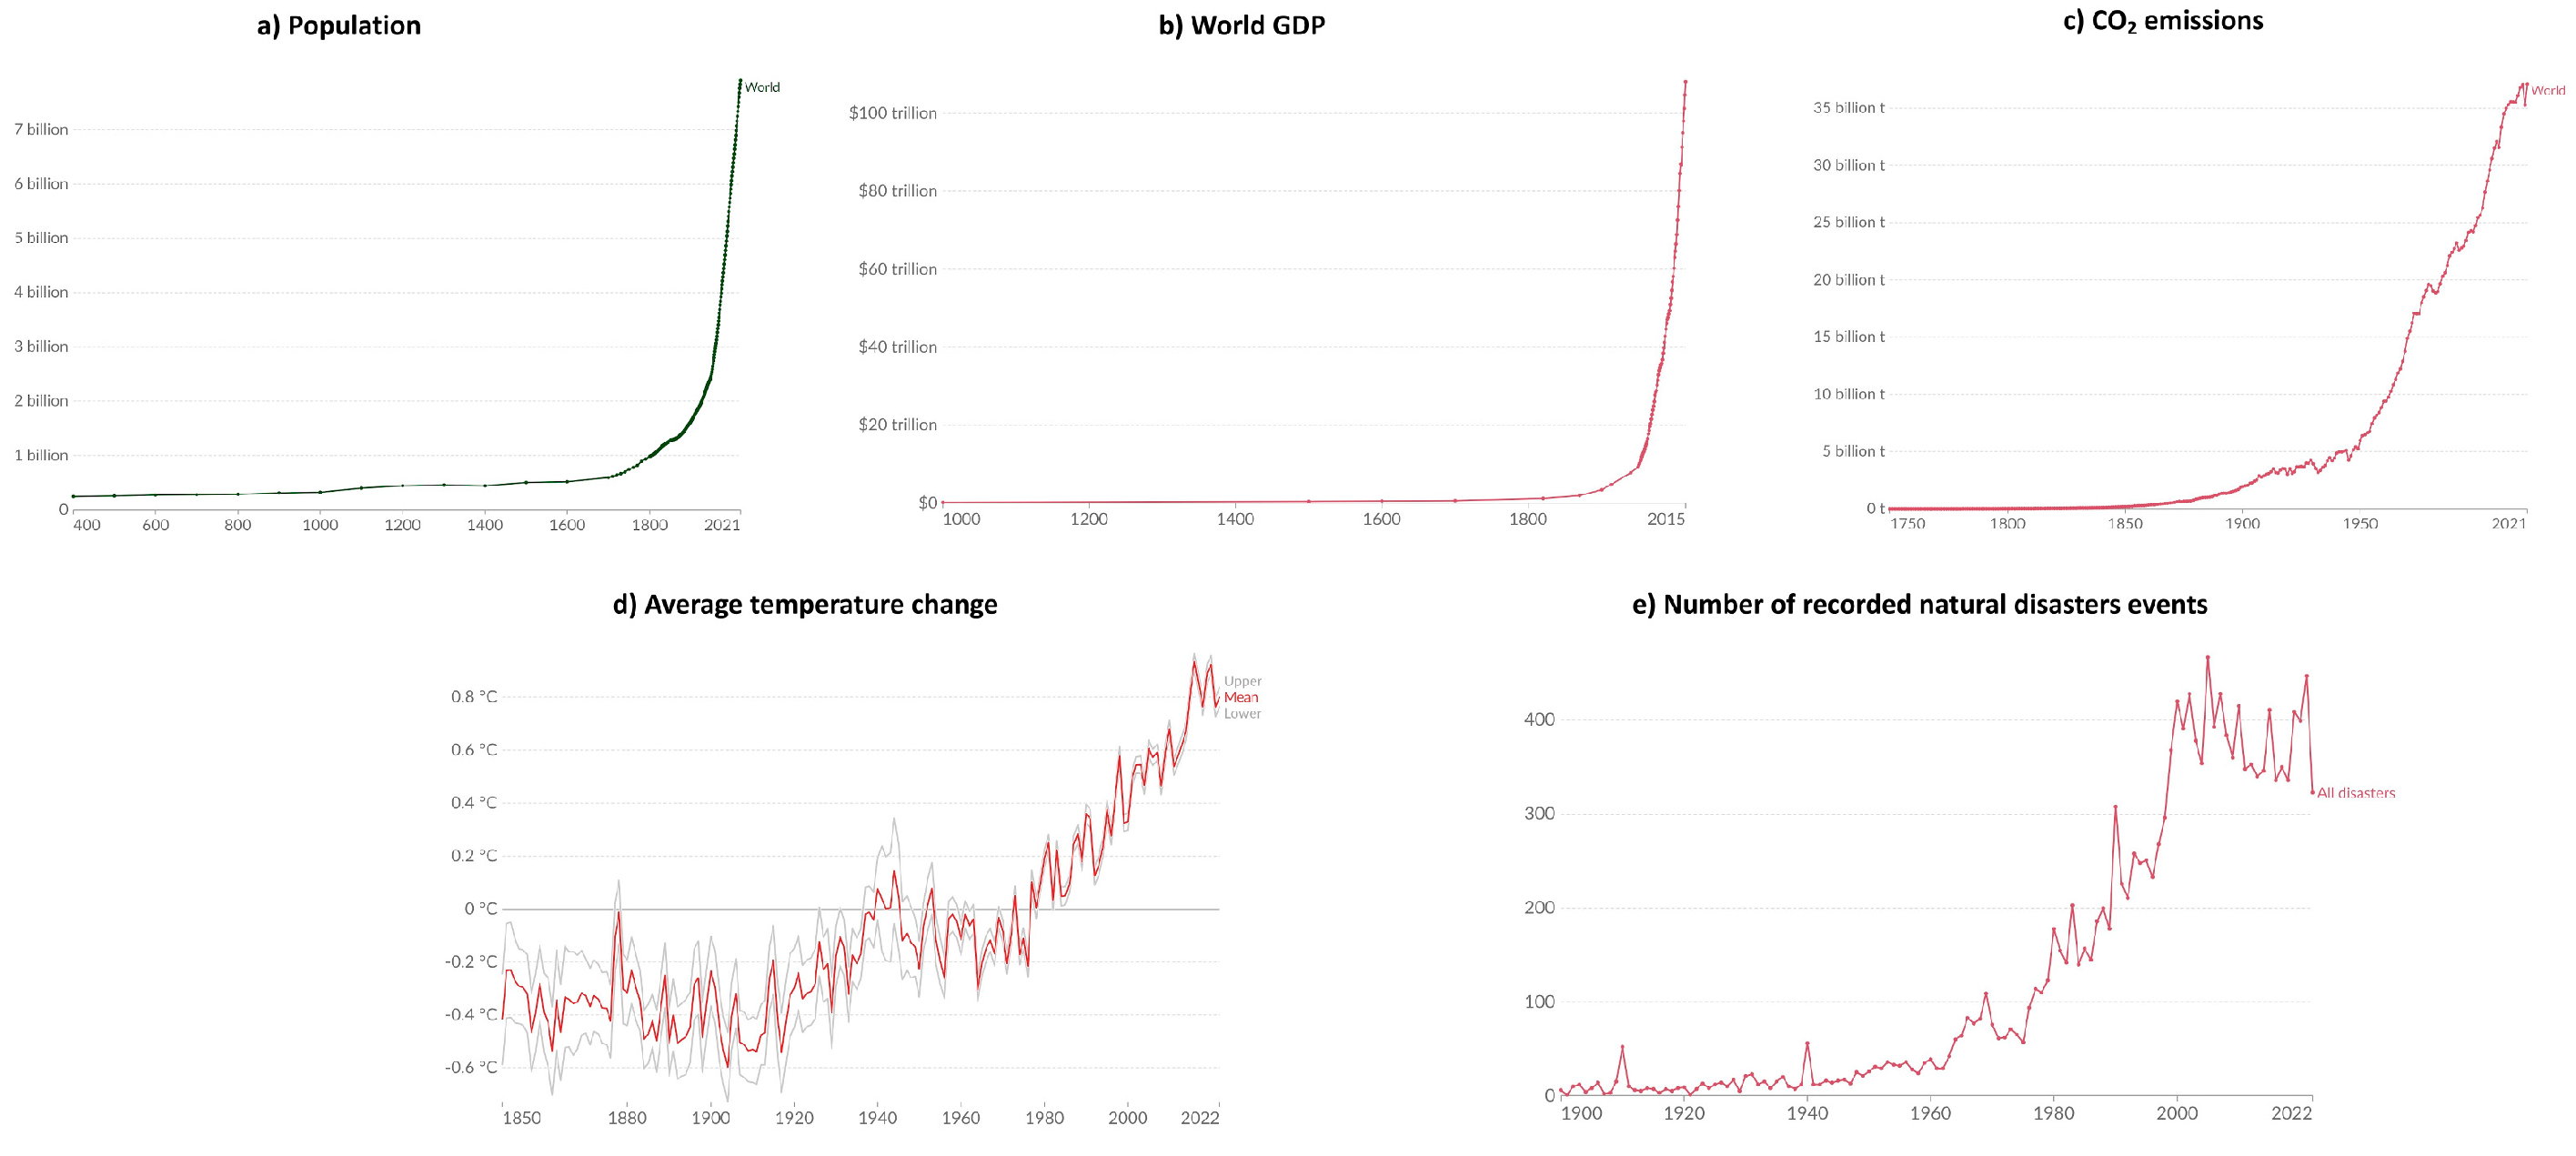
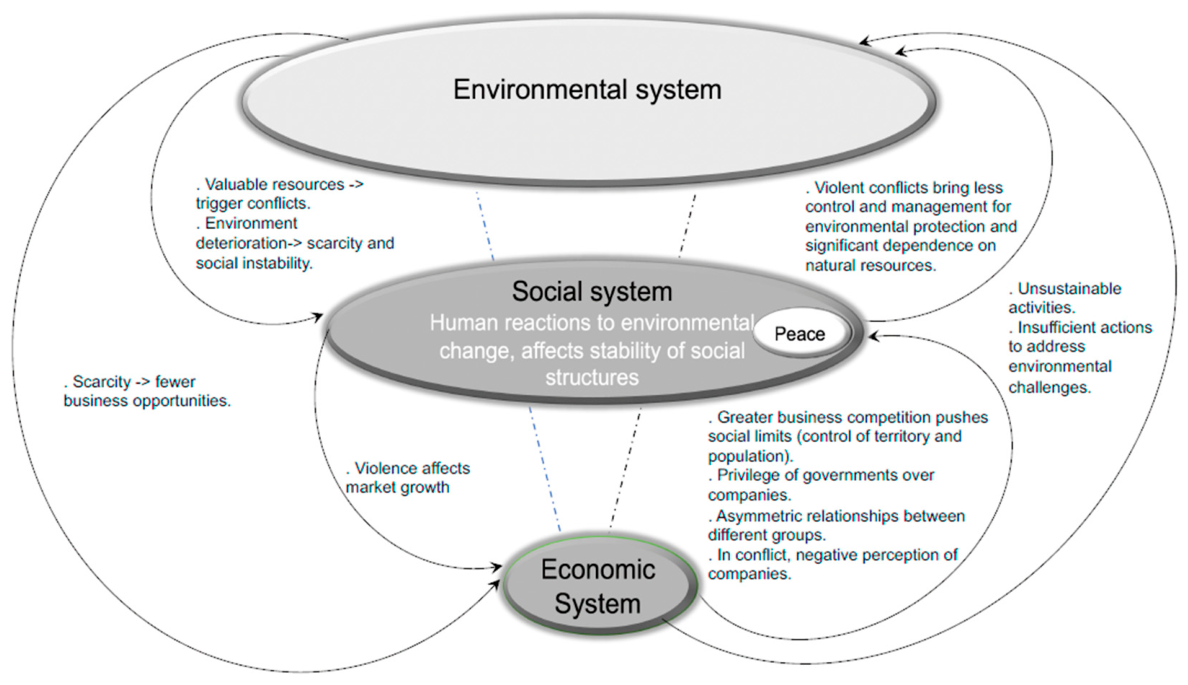
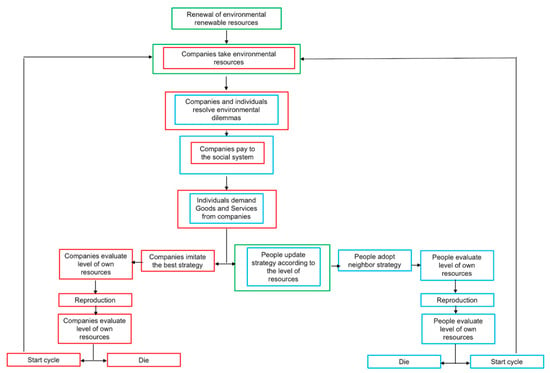
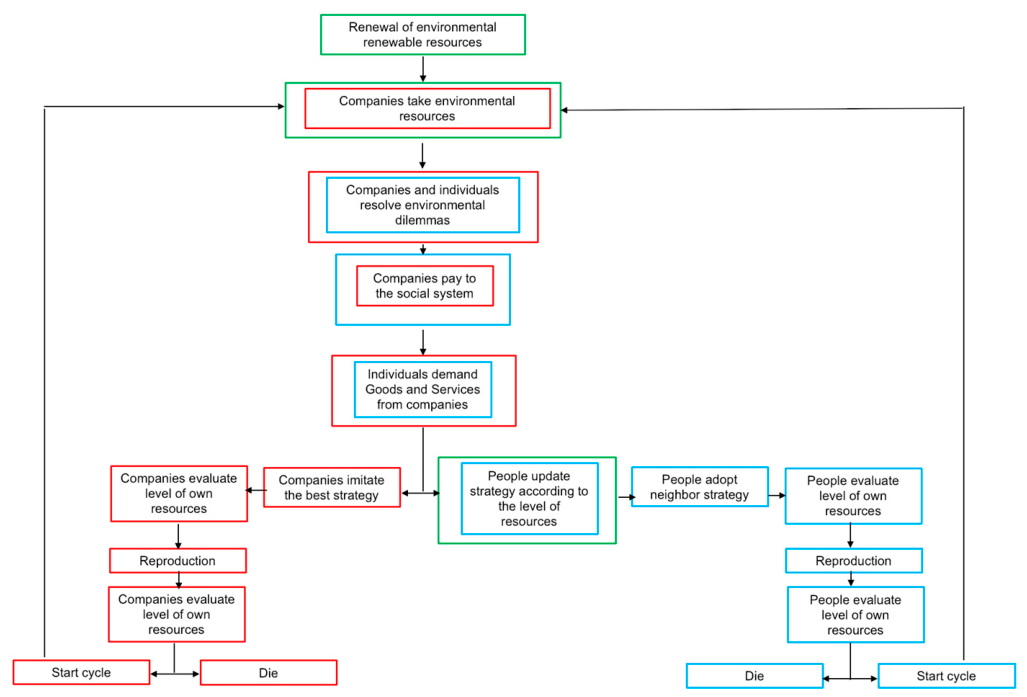
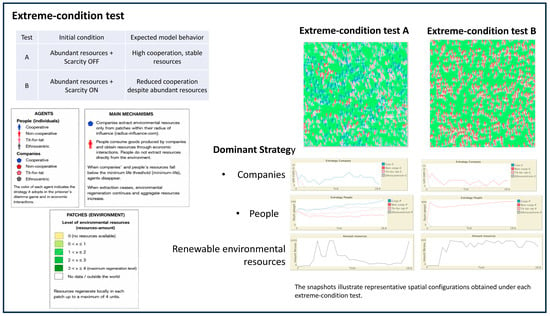
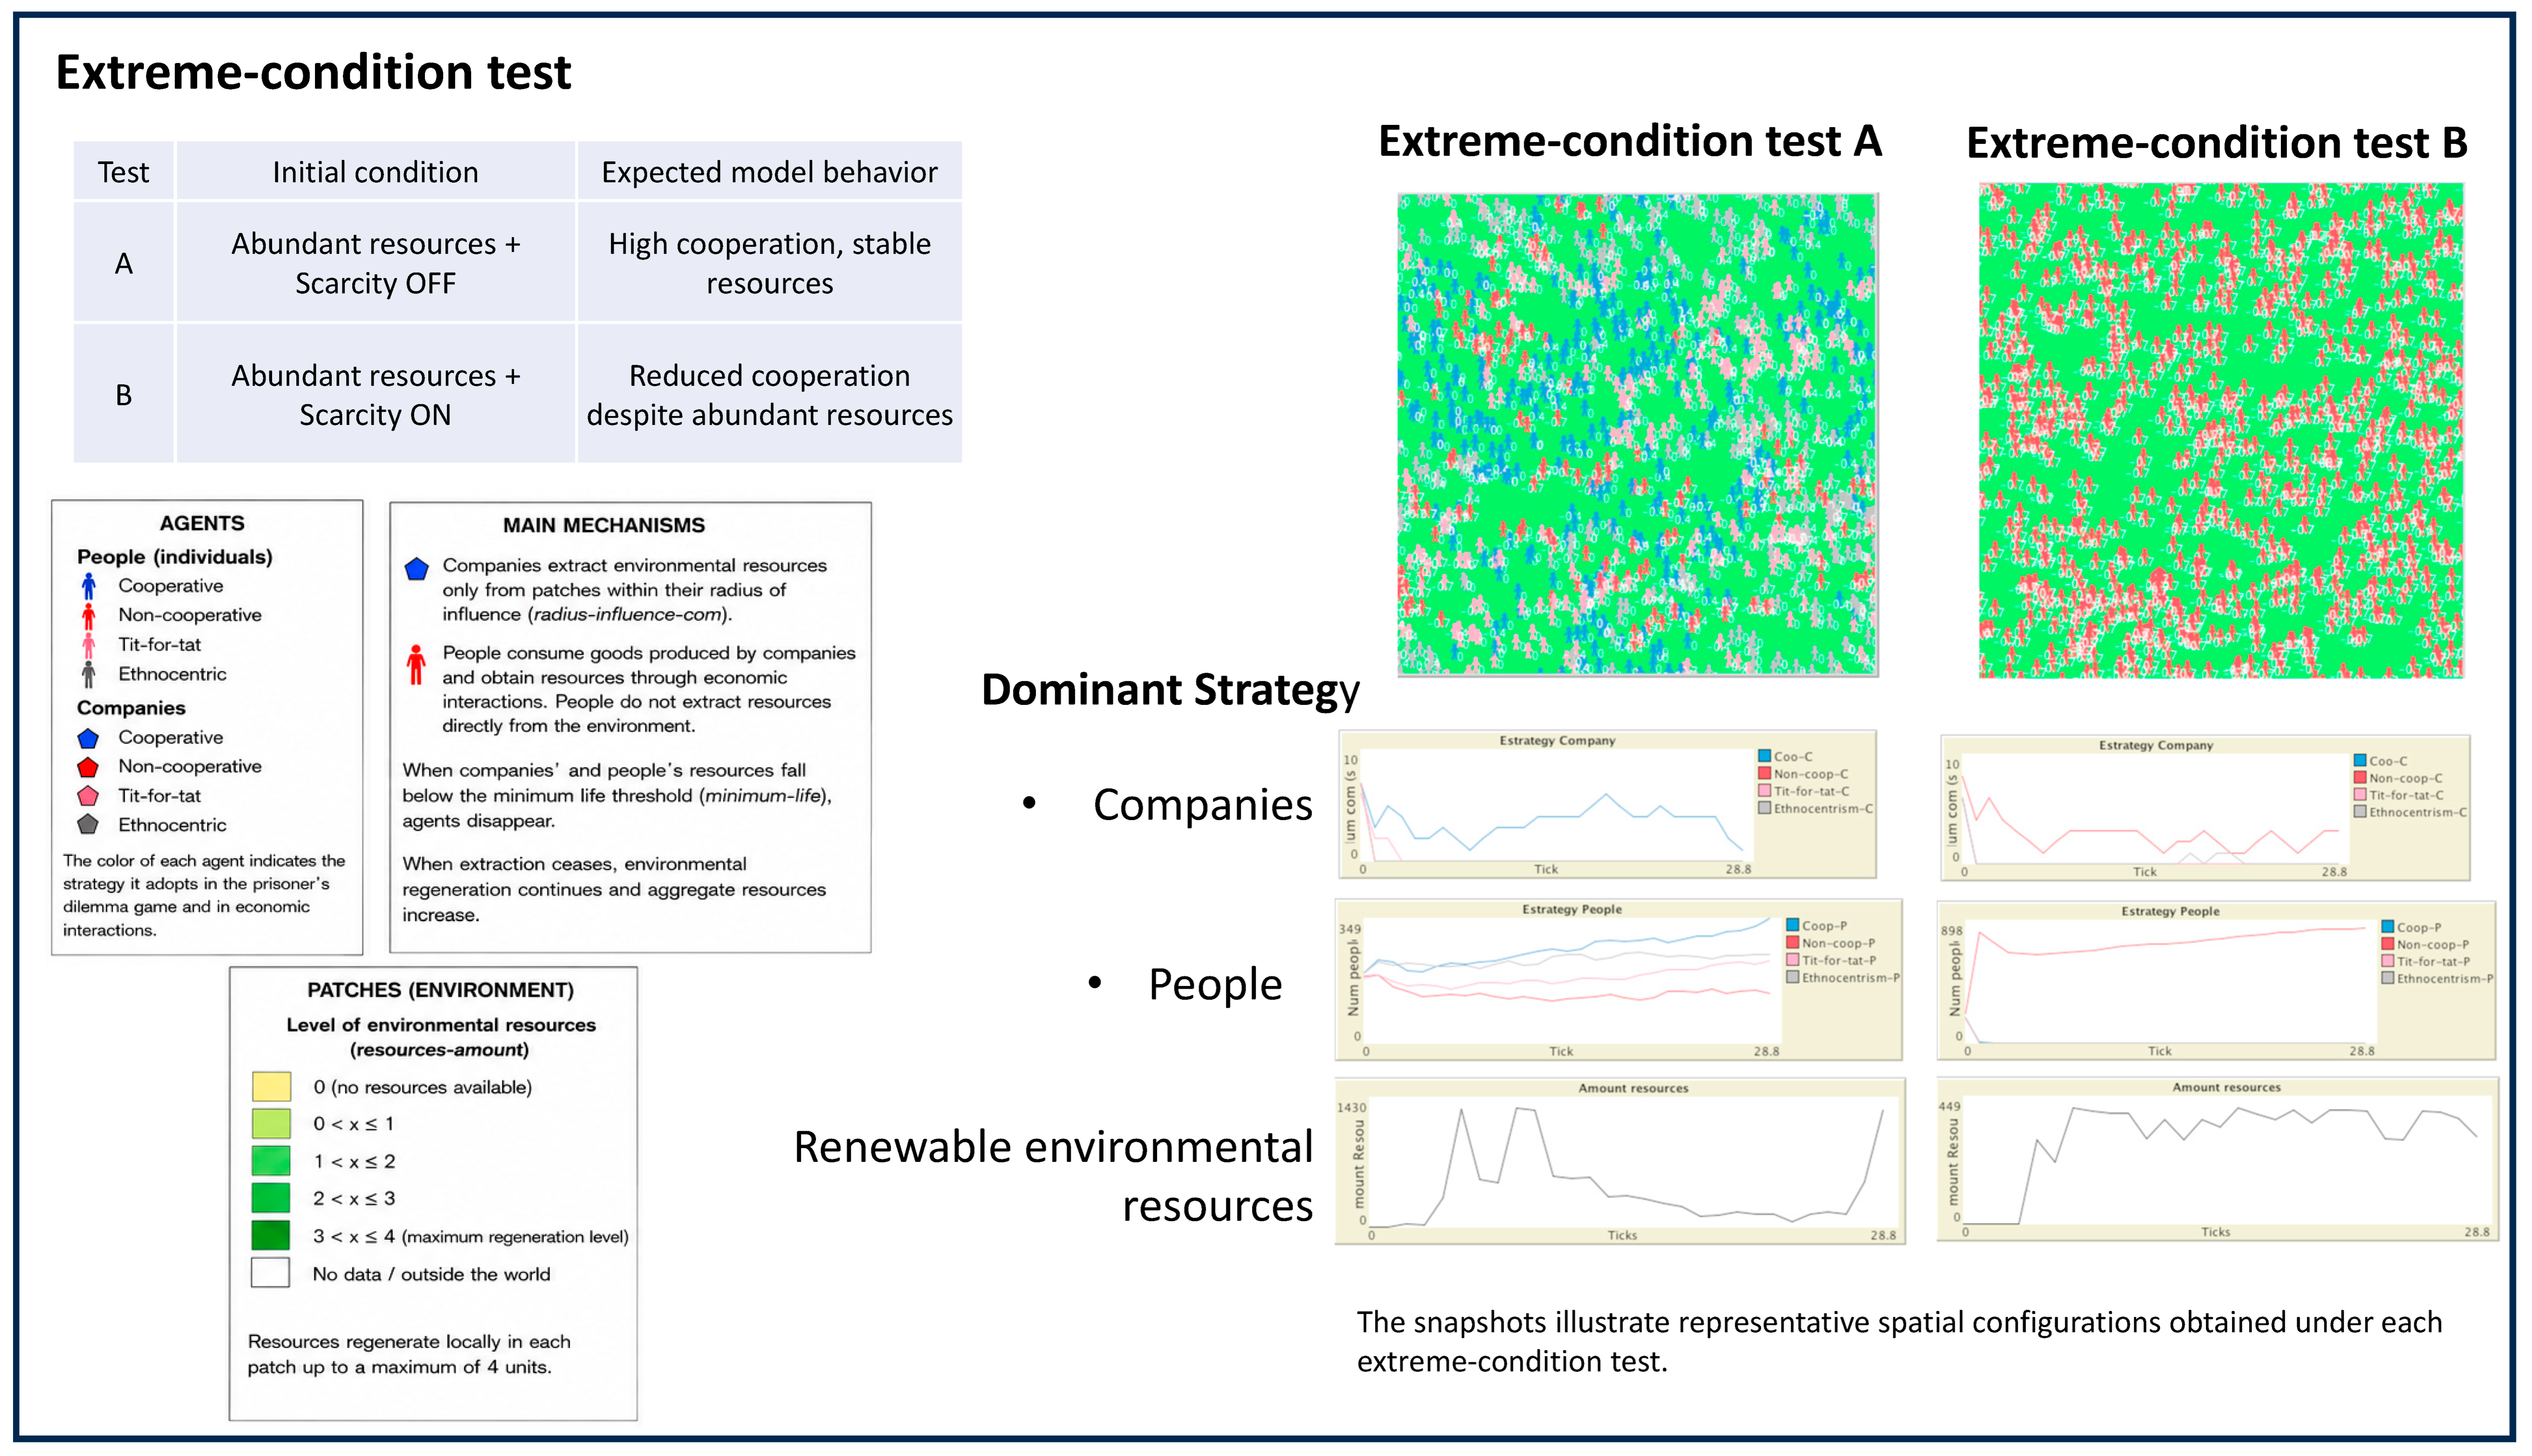
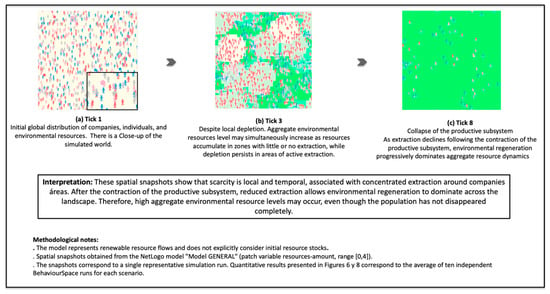
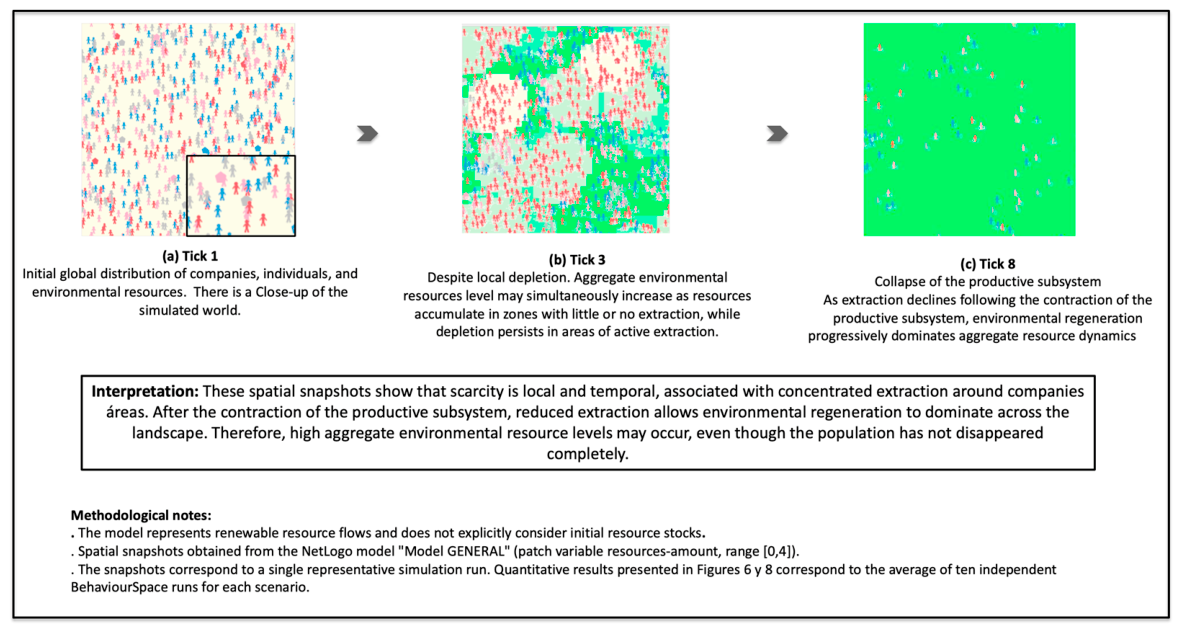
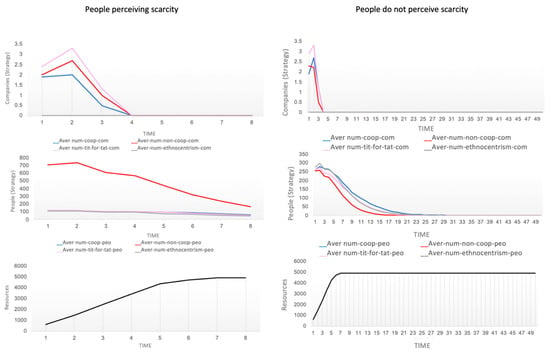
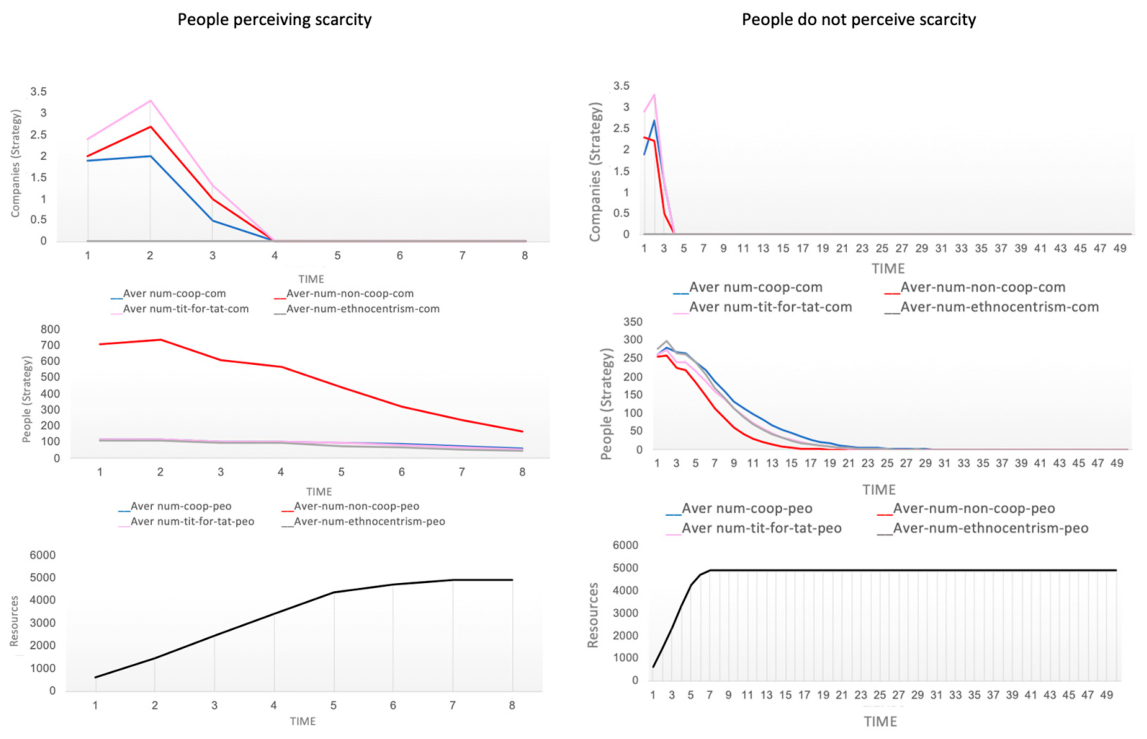
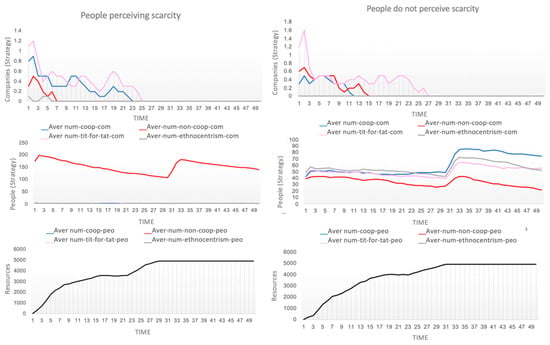
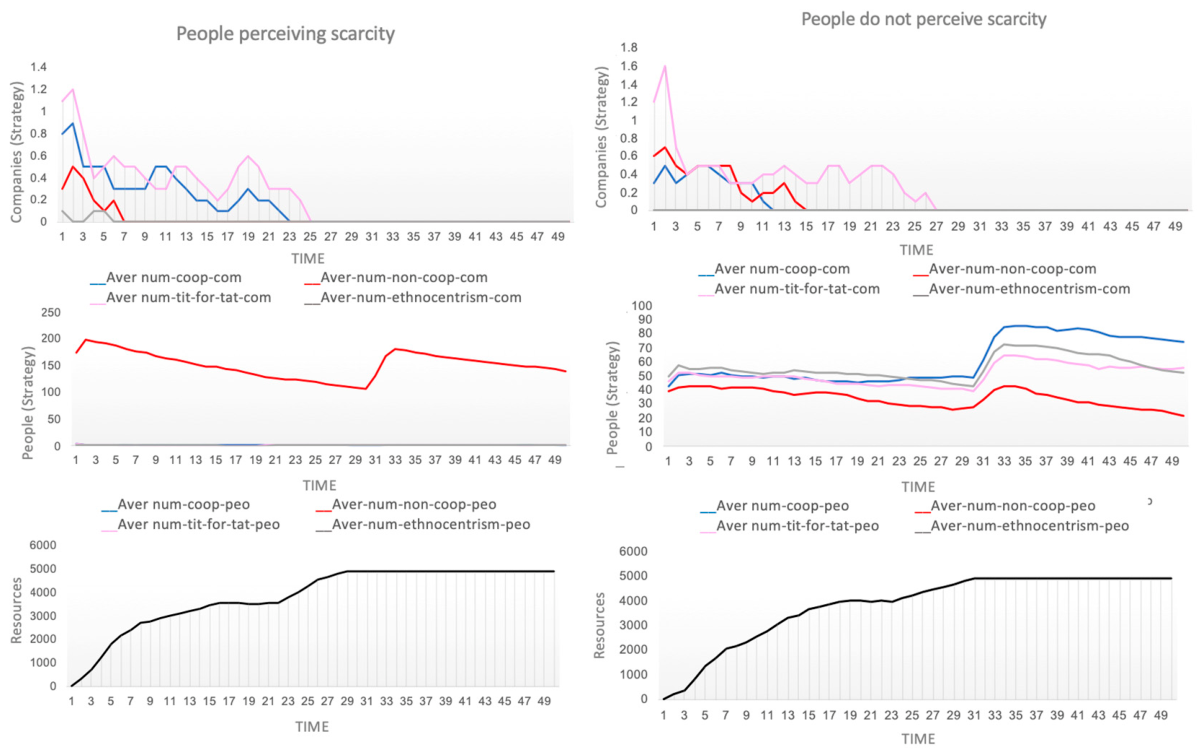
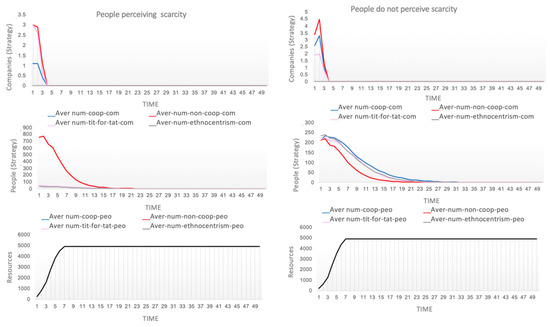
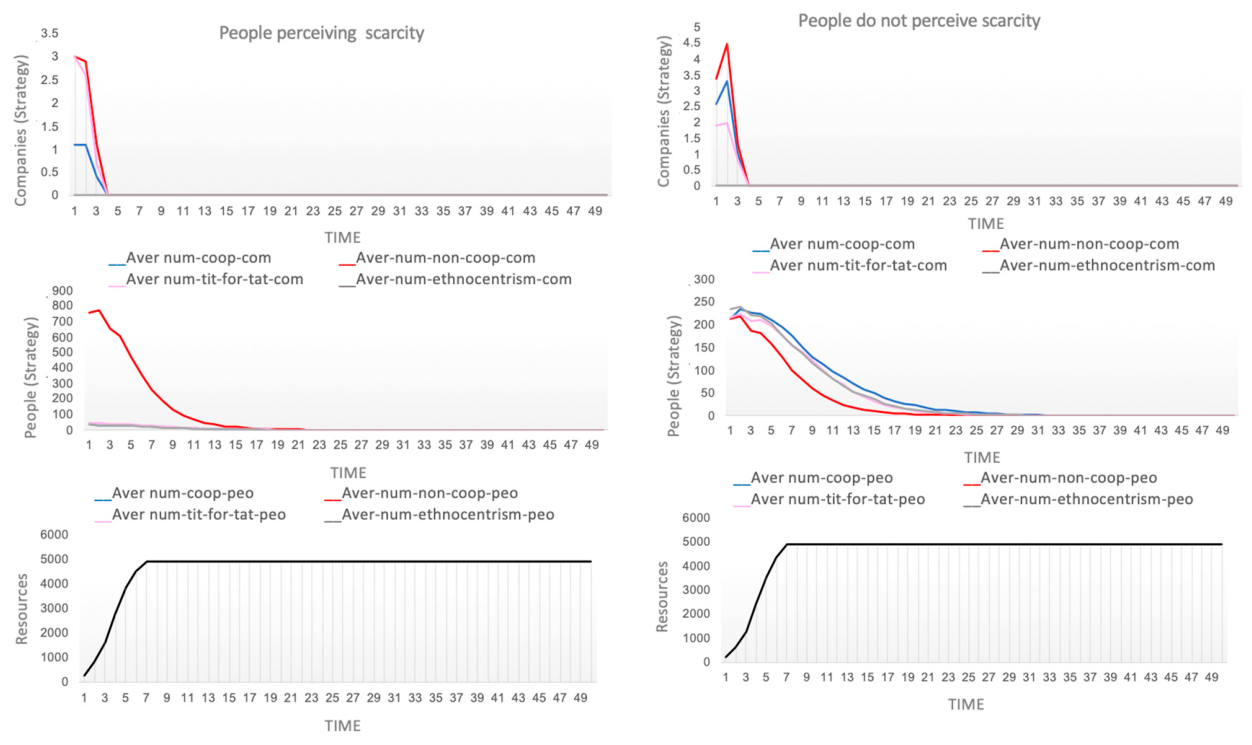

Disclaimer/Publisher’s Note: The statements, opinions and data contained in all publications are solely those of the individual author(s) and contributor(s) and not of MDPI and/or the editor(s). MDPI and/or the editor(s) disclaim responsibility for any injury to people or property resulting from any ideas, methods, instructions or products referred to in the content. |
© 2026 by the authors. Licensee MDPI, Basel, Switzerland. This article is an open access article distributed under the terms and conditions of the Creative Commons Attribution (CC BY) license.