


Abstract
South Africa has implemented an extensive social grant system to improve the wellbeing of vulnerable households. However, evidence remains limited regarding the pathways through which social grants are associated with household food insecurity and whether these relationships vary across geographical contexts of South Africa. Understanding these mechanisms is essential for designing more effective and spatially targeted social protection policies. This study examined the relationship between social grant receipt and household food insecurity, hypothesizing that household income serves as the principal pathway linking social grants to food insecurity. This study used nationally representative data from the 2024 General Household Survey. A latent food insecurity index was constructed using a two-parameter logistic Item Response Theory model, and a moderated-mediation structural equation model was employed to decompose the association between social grant receipt and food insecurity into direct and indirect components while accounting for geographic heterogeneity. The results indicate that social grants are strongly targeted toward households with higher levels of food insecurity and lower incomes, confirming that grant recipients are among the most vulnerable households in South Africa. Household income was negatively associated with food insecurity and mediated 55.4% of the total association between social grant receipt and household food insecurity. This underscores income as the main transmission pathway. High geographic heterogeneity was observed. The indirect income-mediated association was strongest in commercial farming areas, followed by urban and rural areas administered by local leaders. The direct association was significant in urban and rural areas administered by local leaders. These results show that the effectiveness of income transfers depends on the household’s demographic and socioeconomic conditions. The findings suggest that although social grants play an important role in reducing household vulnerability, cash support alone is insufficient to address household food insecurity among disadvantaged households in South Africa. Therefore, strengthening income support provided through social grants should be complemented by location-specific interventions that expand employment opportunities, improve market access, promote productive asset accumulation, and strengthen local food systems, particularly in rural areas where constraints continue to limit household food security.
1. Introduction
Social protection programs are among the government strategies and intervention areas that help improve the livelihoods of vulnerable groups. These programs are a central pillar of poverty alleviation strategies in developing countries, particularly in areas with limited job opportunities, persistent inequality, and weak institutional capacity. The nature of social protection programs varies and may include social insurance, social care, social assistance, public works, and community-based employment schemes (Rustamova et al. 2025; Brollo et al. 2024; Popova 2023). The targeting of interventions depends on the trade-off between equity and efficiency, which addresses issues of dependence and compliance (Rustamova et al. 2025). Social protection programs are determined not only by the ability to transfer income but also by the mechanisms through which they affect livelihoods and income (Zreik and Iqbal 2025; Brollo et al. 2024; Fofana et al. 2024).
South Africa is among the top social grant providers in the Global South. Since 1994, South Africa has implemented social grants as part of a racially fragmented wellbeing system following the end of apartheid by including the most vulnerable social groups (Seekings and Nattrass 2015; Van der Berg 1997). From 1994 to 2000, after the end of racially discriminatory welfare policies, a unified social protection system was institutionalized in South Africa (Patel and Midgley 2023; Barrientos 2013). This equalization and expansion of social protection focused mainly on old-age, disability, foster-child, and care-dependency grants, targeting vulnerable family members (Duflo 2003; Case and Deaton 1998). Furthermore, during 2000–2010, social protection also included child-focused measures for children aged 7–18 to address child poverty and support the future human development plan (Patel 2017; Hall and Wright 2010). This child support grant is the largest social grant coverage in South Africa (South African Social Security Agency (SASSA) 2012; Adato and Bassett 2009).
In 2010–2019, the most costly social grants were reinitiated in South Africa, focusing on vulnerable social groups and centrally administered by the social security agency. These grants include disability, old-age, child support, foster children, care dependency, and war veterans grants (South African Social Security Agency (SASSA) 2019; World Bank 2018). This has been implemented through biometric verification systems integrated with electronic payment platforms to improve efficiency and targeting (Department of Social Development (DSD) et al. 2012; Gelb and Decker 2012). Furthermore, during the COVID-19 pandemic, the South African government implemented a social relief distress grant to address income shocks and labor market disruptions (Casale and Shepherd 2021; Köhler and Bhorat 2021). This has been done on a large scale, even for individuals without dependent children, and it served as a transitional instrument toward a potential basic income support mechanism that reflects an evolving policy discourse on income security in the context of structural unemployment (Köhler and Bhorat 2021). As a result, it is expected to contribute to alleviating household poverty and, more generally, improving people’s wellbeing (Patel and Midgley 2023).
Empirical evidence has shown that social grant beneficiaries and non-beneficiaries have systemic differences, implying that social grants in South Africa have been strongly targeted towards structurally poor households and have reduced food insecurity and poverty (Dunga 2025; Takawira et al. 2024; Mokwena et al. 2023; Gelo and Dikgang 2022; Nenguda and Scholes 2022; Waidler and Devereux 2019; Chakona and Shackleton 2019). The purpose of social grants is to improve the wellbeing of the most vulnerable and poor households (Brollo et al. 2024; Zhou et al. 2023); however, the actual impact of this non-random program selection remains poorly established in the literature.
Impact estimation strategies that rely on non-random causal analysis give biased and misleading estimates of social grant program targeting and fail to account for the pathways through which improvements in welfare outcomes occur (Heckman et al. 1997; Bassi 1984). Although previous empirical evidence has evaluated the role of social grants in improving wellbeing in South Africa, important gaps remain in understanding the mechanisms through which these effects occur. For instance, studies by Chakona and Shackleton (2019), Gelo and Dikgang (2022), Nenguda and Scholes (2022), Mokwena et al. (2023), Takawira et al. (2024), and Dunga (2025) mainly focused on the association between social grants and welfare outcomes such as food security, poverty reduction, household income, and livelihood improvement. Similarly, evaluations of social protection programs conducted by Waddington et al. (2022) largely focused on average treatment effects. While previous research provides important evidence on the effectiveness of social grants, it generally treats the relationship as a direct association and offers limited insight into the underlying mechanisms through which social grants affect food security. Furthermore, these studies mostly fail to separate direct and indirect associations operating through household income. Furthermore, these studies fail to adequately examine whether these pathways are heterogeneous across geographical contexts characterized by distinct household demographic and socioeconomic characteristics.
To our knowledge, no previous study in South Africa has simultaneously measured food insecurity using an Item Response Theory (IRT)-based latent construct, decomposed the effects of social grants into direct and income-mediated pathways, and examined how these relationships vary across different geographical areas. By considering these dimensions, this study contributes to the social protection and food security literature by providing new insights into the mechanisms by which social grants determine household welfare and the spatial heterogeneity of their effects.
Methodologically, this study used a two-parameter IRT model to construct a latent food insecurity index based on self-reported experiences of food access. This approach offers a theoretically grounded and psychometrically robust alternative to conventional data reduction techniques, such as principal component and factor analyses, by explicitly accounting for item severity, discrimination, and measurement error. Theoretically, issues apply a moderated mediation structural equation modeling framework that simultaneously estimates direct, indirect, and total effects while allowing these relationships to vary across geographical contexts, providing a more specific understanding of how social grants operate. By explicitly accounting for spatial heterogeneity in the analysis of income transmission mechanisms, this study provides evidence that is directly relevant to the design of more targeted, context-sensitive social protection interventions.
2. Theoretical Framework
This study integrates social protection theory (Devereux and Sabates-Wheeler 2004), the capability approach (Sen 1999), and agricultural household models (Singh et al. 1986). Social protection theory (Norton et al. 2002). Social protection theory argues that public interventions are necessary when the market fails due to unemployment, unequal job opportunities, external shocks (Mitra and Ranjan 2011), and lack of access to credit (Waidler and Devereux 2019; Hanna and Karlan 2017; Burchi and Muro 2016; Morduch 1995). In South Africa, social grant recipients should not be interpreted as randomly assigned interventions. Social grants are explicitly targeted at economically vulnerable, low-income, and socially disadvantaged groups. As a result, social grant beneficiaries are expected to show higher baseline levels of food insecurity and lower income than non-beneficiaries. The observed association between social grant receipt and food insecurity primarily reflects targeting and pre-existing food insecurity, rather than the effect of social grants. Within this concept, social grants are a marker of household vulnerability, while income represents a potential transmission pathway through which social assistance may be associated with food insecurity. Accordingly, the mediation model is not intended to estimate the causal effect of social grants because they are allocated non-randomly at a given point in time. However, it examines whether differences in household income constitute an important pathway linking social grant beneficiary status and observed food insecurity. However, the effects and expected changes in social protection are influenced by household characteristics and their pathways (VanderWeele 2015; Burchi and Muro 2016; Robeyns 2017).
The second theoretical foundation was the capability approach, which holds that households or individuals have the freedom to perform their valued functions, rather than income alone (Sen 1999). Social grants relax liquidity constraints and improve access to food and essential goods in South Africa. Consistent with the agricultural household model, household income is the principal transmission pathway linking social grant beneficiary status with food insecurity. Consumption decisions mainly depend on current income when access to credit and formal insurance are limited (Dercon 2005; Singh et al. 1986). Under this scenario, income shocks arising from market failures can undermine household wellbeing (Thanh et al. 2022).
As shown Figure 1, by considering social protection theory, the capability approach, and agricultural household models, household income is conceptualized as a pathway variable rather than a background characteristic of the household. The analysis examines whether differences in household income are associated with the relationship between social grant beneficiary status and food insecurity. Social grants may directly affect household wellbeing by providing resources for immediate consumption needs, while indirectly improving food security by contributing to household income. The strength of these pathways is also expected to vary across geographical locations owing to differences in household demographics and socioeconomic status. Accordingly, geographical location was considered a moderating factor, while demographic and socioeconomic household characteristics were included as covariates that shape income and vulnerability to food insecurity. Given the cross-sectional design, these represent theoretically informed pathways rather than confirmed causal effects. Finally, we propose the following hypothesis:
H1.
Grant receipt is expected to be positively associated with food insecurity because beneficiaries are selected from vulnerable households.
H2.
Household income mediates the association between social grant beneficiary status and food insecurity.
H3.
Higher household income is associated with lower food insecurity, regardless of social grant beneficiary status.
H4.
The association between social grants and food insecurity varies by geographical location.
H5.
Household demographic and socioeconomic characteristics significantly influence household food insecurity.
Figure 1.
Social grants improve household food insecurity through income channels. Source: The authors constructed based on the literature.
3. Methods and Materials
3.1. Description of Study Areas
South Africa has a decentralized governance structure and consists of 9 provinces, 52 districts, and 257 municipalities (Statistics South Africa 2025). Unemployment exceeds 30% nationwide (Reuters 2026), and household welfare and livelihoods vary across geographical areas. The main types of livelihoods include wage employment, informal sector activities, self-employment, remittances, and agriculture in rural areas, with reliance on social grants. Furthermore, the economy is dualistic, with advanced urban sectors coexisting with marginalized rural economies (Statistics South Africa 2025/26).
According to Statistics South Africa (2025) and the World Bank (2023), approximately two-thirds of the 63 million people in the country live in urban areas. The population is heavily dominated by relatively young people in the working-age group, although unemployment and dependency ratios are high. Poverty in South Africa remains widespread and is concentrated in historically disadvantaged provinces (such as the Eastern Cape, Limpopo, North West, and KwaZulu-Natal) and rural areas, which are characterized by underdeveloped infrastructure, limited access to the labor market, and a lack of basic services.
Social grants are one of South Africa’s social protection programs and are among the most comprehensive in the Global South. This intervention increased significantly in the post-apartheid period as part of the efforts to address systemic inequality and social exclusion in South Africa. The main programs are the Child Support Grant (introduced in 1998), Older Persons Grant, Disability Grants, Expanded Public Works Program (EPWP), and, more recently, the COVID-19 Social Relief of Distress (SRD) grant, which was introduced in 2020 (South African Social Security Agency (SASSA) 2024). Social grants aim to provide income support and, in turn, meet basic needs, especially by reducing vulnerability to food insecurity and improving the resilience of low-income households (World Bank 2024). According to the South African Social Security Agency (SASSA) (2026), about 19 million people received permanent social grants, and about 9.2 million received the SRD. Nearly half of the population benefits from social grants, directly or indirectly, and they play a significant role in redistributing income and improving household wellbeing.
Inequalities and labor market problems create dependence and have long-term effects on targeting social grants (World Bank 2024). Therefore, to achieve inclusive poverty reduction in South Africa, agriculture and labor-intensive sectors play a higher role; business-as-usual may lead to an increase in poverty. This highlights the importance of integrated economic and development strategies beyond social protection (Mabugu and Fofana 2025).
3.2. Data Source and Sampling Design
This study employed the 2024 General Household Survey (GHS) of Statistics South Africa. It covers all representative private households in nine provinces. A household survey was conducted to determine the sampling procedures. In each stratum, a probability-proportional-to-size design was used to sample the primary sampling units (PSUs). To select the dwelling unit (DUS), systematic sampling was used within the sampled PSUs to select the dwelling unit (DU). Then, using a probability-proportional-to-size systematic sampling design, 3308 PSUs were selected, with the PSU size measured by the number of households per PSU. In each selected PSU, a systematic sample of the dwelling units was selected.
The number of DUs selected from each PSU varies and is determined by the Inverse Sampling Ratios (ISRs) for each PSU. Sampling weights were constructed for the data collected from the sampled households to assign them to provinces. The final survey weights were estimated using regression calibration of the national population. StatMx was used to construct the calibration weights. The final response rate was 85.47 percent. A total of 20,940 households were interviewed for the survey. During data cleaning, observations with implausible income values arising from recording errors (including unspecified income coded), missing values, and other data inconsistencies were removed. Finally, 20,190 households were included in the analysis.
3.3. Variables and Measurement
This study examines the relationship between social grant recipients and household food insecurity within a moderated mediation framework using structural equation modeling. Because social grants are targeted at economically vulnerable households, grant receipt is expected to be associated with lower income and higher baseline food insecurity. Therefore, the mediation framework evaluates whether household income constitutes an important pathway linking social grant recipients and household food insecurity while accounting for geographic heterogeneity and household characteristics. Accordingly, using six household binary indicators of food insecurity, a latent continuous index was constructed as an outcome using a two-parameter logistic (2PL) model. This model allows for the consideration of latent traits, discrimination, and the severity of food insecurity in households (Charamba et al. 2023). Higher index values indicate greater food insecurity. The mediating variable, income, was measured as the logarithm of adult-equivalent household income to allow for comparability across households of different sizes and compositions. Furthermore, income transformation was applied to reduce the skewness of household income, limit the influence of outliers, and improve model estimation. It also provides a good interpretation in proportional terms, which aligns with diminishing marginal welfare returns to income (Wooldridge 2016). It is theoretically expected to have a negative relationship with food insecurity, as higher income improves access to food and enhances consumption stability (Chen et al. 2023; Loopstra and Tarasuk 2013; Statistics South Africa 2023).
Social grants were measured as binary variables. It is expected to be negatively associated with income (reflecting that beneficiaries are poorer) and positively associated with food insecurity vulnerability rather than the social grant effect (South African Social Security Agency (SASSA) 2024; Statistics South Africa 2023). Location type (urban as reference, rural areas under traditional leadership/rural areas located on commercial farms) is included as a moderator through interaction terms with social grants, with the expectation that the income-mediated effect of social grants on improving the vulnerability of food insecurity varies across geography, being weaker in rural areas than in urban areas, where access to markets in rural areas may operate weakly (Battersby and Watson 2018; Human Sciences Research Council 2022).
Household-level covariates may determine income and influence food insecurity. Demographic characteristics, such as household size and dependency ratios, are expected to reduce income and increase vulnerability to food insecurity, reflecting higher consumption pressures (Statistics South Africa 2023). Labor market variables related to salaries and the number of economically active members are expected to increase income and reduce food insecurity (Statistics South Africa 2024). Asset ownership (e.g., television, refrigerator, and computer) and housing quality indicators serve as proxies for long-term wealth and are expected to influence income and, consequently, food insecurity (Statistics South Africa 2023; World Bank 2023). Spatial controls for provincial dummies accounted for these disparities. Provinces with better-connected, economically developed areas are associated with higher income and lower exposure to food insecurity (Human Sciences Research Council 2022). Specifically, the specification reflects a priori hypotheses consistent with welfare theory, in which income and location jointly shape household vulnerability to food insecurity summarized in Table 1.
Table 1.
Definition of variables, measurements and expected signs.
3.4. Analytical Strategy
The food insecurity index was estimated as a latent construct within an Item Response Theory (IRT) two-parameter logistic (2PL) model using a set of binary indicators of experiential food insecurity. This approach captures the experiences of food insecurity by reducing measurement error and provides a theoretically grounded alternative to other multivariate analyses (Charamba et al. 2023; Hambleton and Swaminathan 2013). The IRT two-parameter logistic (2PL) model is better than the one-parameter (Rasch/1PL) and three-parameter (3PL) models because it maximizes both parsimony and empirical flexibility (Dodouh 2023) and allows discrimination parameters to vary across items, thereby capturing heterogeneity in how effectively items differentiate respondents along the latent trait (Dodouh 2023; de Ayala 2009; Embretson and Reise 2000). Furthermore, it avoids the additional complexity of the 3PL model, which introduces a guessing parameter that may often lead to identification problems and overfitting (Dodouh 2023; Baker and Kim 2004; Hambleton et al. 1991).
Compared with the one-parameter logistic (1PL) model, the two-parameter logistic (2PL) Item Response Theory model allows food insecurity items to differ in their discriminatory power while simultaneously estimating item difficulty. This flexibility generally improves model fit and the precision of latent trait estimation when items vary in their ability to distinguish between households with different levels of food insecurity (König et al. 2022; König et al. 2019). In the specification of IRT 2PL, let refer to the response of household i to item j related to food insecurity indicators, where = 1 indicates the household experienced the food insecurity condition and = 0 otherwise. is how well item j discriminates between households : difficulty (latent trait). The probability of endorsing item j is specified as:
where is the item discrimination parameter, indicating how effectively item (j) differentiates households with different levels of latent food insecurity; is the item difficulty (severity) parameter, representing the level of latent food insecurity at which a household has a 50% probability of endorsing the item; and is the latent food insecurity score for household (i), with higher values indicating higher food insecurity. In this study, i = 1,…, N households, and j = 1,…,6 indexes the six food insecurity indicators: worrying about food, consuming limited food varieties, skipping meals, running out of food, experiencing hunger, and going without food for an entire day.
Furthermore, we examined the dimensionality and internal consistency of the food insecurity scale. Unidimensionality was checked using exploratory factor analysis (EFA) based on the tetrachoric correlation matrix and subsequently confirmed through a one-factor confirmatory factor analysis (CFA) with standard model fit statistics. The internal consistency of the food insecurity items was assessed using Cronbach’s alpha. Following these diagnostic assessments, the latent household food insecurity index was estimated using a two-parameter logistic (2PL) Item Response Theory model.
Item Response Theory (IRT) framework was implemented via the irt command in Stata 18, assuming unidimensionality and local item independence, conditional on the latent trait. Household-level aggregate latent food insecurity scores were estimated using marginal maximum likelihood (MML), whereas household-specific latent food insecurity scores were obtained using Empirical Bayes (EB) prediction. The estimated latent score for household i is as follows:
where refers to the vector of observed responses to the six food insecurity items and is the posterior expected value of the latent food insecurity traits.
To ensure compatibility, the standardized food security index was estimated as follows:
where is the sample mean; is the sample standard deviation. As a result, the standardized food insecurity index had a mean of zero and a standard deviation of 1, with higher values indicating greater food insecurity. The latent food insecurity index was estimated using the two-parameter logistic Item Response Theory (IRT) model, and the results were compared with principal component analysis (PCA) as a robustness check, as IRT is suitable for this analysis (Jolliffe 2025). The consistency of the findings across these alternative specifications supports the robustness of our results.
As social grant beneficiaries are systematically selected based on predetermined criteria, simple comparisons between beneficiaries and non-beneficiaries are likely to produce biased estimates due to the underlying differences in household characteristics (Collin and Jahed 2025). To examine the pathways through which social grants are associated with household food insecurity, a moderated-mediation structural equation model (SEM) was estimated to decompose the observed association into direct and indirect components, while accounting for geographic heterogeneity. This approach is well-suited for simultaneously modeling multiple interdependent equations and latent variables (Kline 2016). Interaction terms between social grant receipt and geographic location were also included in the moderated mediation analysis (Hayes 2022; Preacher et al. 2007).
The moderated-mediation structural equation model included exogenous covariates and interaction terms and was nearly saturated. Therefore, conventional global fit indices such as χ2, CFI, TLI, and RMSEA were not emphasized. Because the model was estimated primarily to obtain direct, indirect, and total effects rather than to examine the latent measurement structure. Parameters were estimated using maximum likelihood estimation with a robust (Huber–White sandwich) standard error. This considers potential heteroskedasticity and departures from multivariate normality, which are common in household survey data, yielding consistent standard errors and more reliable statistical inference. The specifications of the moderator mediation analytical framework of the structural equation model (SEM) are as follows:
where = Social grant receipt dummy variable (1 = household receives social grants, 0 otherwise); = log adult-equivalent household income, = Food insecurity score of household i (IRT-based food insecurity index); = Dummy variable for rural areas located on commercial farms; = Dummy variable for rural areas under traditional leadership; and = Vector of household demographic and socioeconomic control variables; = Intercept of the mediator (income) equation; = Effect of social grant receipt on household income in the reference geographical category; = Effect of residing in a traditional rural area on household income; = Effect of residing in a commercial farm area on household income; = Interaction effect between social grant receipt and traditional rural residence; = Interaction effect between social grant receipt and commercial farm residence; β = Vector of coefficients associated with control variables in the income equation; = Intercept of the food insecurity equation; = Direct effect of social grant receipt on food insecurity in the reference geographical category, which is urban; = Effect of household income on food insecurity (Path b); c′ = direct effect of social grants on food insecurity after accounting for income; = Interaction effect between social grant receipt and traditional rural residence on food insecurity; = Interaction effect between social grant receipt and commercial farm residence on food insecurity; δ = Vector of coefficients associated with control variables in the food insecurity equation; = Random disturbance term in the income equation; and = random disturbance term in the food insecurity equation.
Therefore, moderated mediation effects were derived using nonlinear combinations of the estimated coefficients (Sathyanarayana and Mohanasundaram 2025). Path a, if social grants directly affect (c′) income by assuming that they are heterogeneous across geographical locations:
- Path a: Urban = ; Traditional = ( + ); Commercial = ( + ).
- Path b: .
- Direct effect (c′): Urban = ; Traditional = ( + ); Commercial = ( + )
- Indirect effect: Urban = ; Traditional = ( + ) γ2; Commercial = ( + )
- Total effect: Urban = + ; Traditional = ( + ) + ( + ); Commercial = ( + ) + ( + ).
- Proportion mediated: PM = Indirect Effect/Total Effect, computed for each geographic category.
4. Result and Discussion
4.1. Descriptive Analysis
The results, as shown in Table 2, indicate statistically significant differences between households that receive social grants and those that do not, confirming a clear targeting association with covariates related to household characteristics. Social grant beneficiary households have higher levels of food insecurity vulnerability, as reflected in both unstandardized and standardized item response theory indices. These significant associations confirm that social grants are mainly targeted at more vulnerable households, consistent with expected redistributive effects. Furthermore, households that receive social grants have lower incomes, underscoring that grant beneficiaries are poor and that social transfers are effectively directed toward lower-income groups.
Table 2.
Mean differences by social grant status.
Social-grant-recipient households tend to be older and larger, with a higher dependency burden, more non-economically active members, and fewer economically active members. This further indicates that social grants target households with limited labor market participation and a high number of dependents. Additionally, households that receive salary income and have economically active, high-income family members are not targets of traditional grants and are less likely to benefit from social grants.
Inferential statistics confirmed that recipients of social grants are less likely to have lower incomes and are more likely to have food-insecure households, indicating that targeting mainly focuses on poorer households and those vulnerable to food insecurity. A high food insecurity index among social grant recipients suggests that income is the main channel through which social grants are indirectly associated with household food insecurity. However, the significant baseline differences between beneficiaries and non-beneficiaries underscore the need for more rigorous methods to accurately assess the association between social grants and reduced food insecurity in South Africa.
The results presented in Table 3 reveal statistically significant differences between households that receive social grants and those that do not, and show that clear relationships exist among the different demographic, socioeconomic, and geographical targeting criteria. Grant-recipient households are significantly more likely to be male-headed (55.01% vs. 29.32%), suggesting that male-headed households and family structures may be associated with vulnerability and program eligibility. While this may reflect the underlying demographic composition, it also indicates heterogeneity in household vulnerability profiles. Household asset ownership (i.e., televisions, refrigerators, and computers) reveals a dual structure of welfare in the study area. Basic household assets, such as televisions and refrigerators, showed only marginal differences between the two groups. Access to higher-value, productivity-enhancing assets, particularly computers, is significantly lower among grant recipients (11.31% vs. 36.57% of the total).
Table 3.
Distribution of household characteristics by social grant status.
Spatial disparities showed that social grant beneficiaries were significantly less likely to reside in metropolitan areas (30.76% vs. 51.87%) and more likely to reside in rural areas (42.27% vs. 16.03%) than non-beneficiaries. In addition, more social grant beneficiaries are in provinces such as Mpumalanga, KwaZulu-Natal, the Eastern Cape, and the Northwest, while representation is lower in better-off provinces, such as the Western Cape and Gauteng. Most importantly, food insecurity indicators consistently showed a higher prevalence among grant-recipient households for all the items. Households receiving grants reported significantly higher rates of worrying about food, limited dietary diversity, skipping meals, running out of food, experiencing hunger, and going without food for an entire day. The magnitude and statistical significance of these differences confirm that social grants reach households experiencing severe and multidimensional food insecurity (FI).
These descriptive statistics provide strong evidence of effective targeting, as social grants are disproportionately allocated to vulnerable households in rural areas with lower asset ownership and higher food insecurity levels. The magnitude of the difference between the two groups indicated that the interventions were not random and that there was selection bias due to the inclusion criteria used to target them. Therefore, simple comparisons between benefits and non-benefits lead to misleading conclusions and require a more rigorous moderated mediation analysis to examine the true association of social grants.
The high level of food insecurity among social grant beneficiaries, despite the protective role of social grants, implies that the amount of the grant, or perhaps the modality of social grants, is insufficient to prevent food insecurity. This indicates that social grants alone may not avoid food insecurity unless complemented by employment generation, improved market access, and asset building, especially in areas with limited access to public services and in rural areas. However, food insecurity is high among social grant beneficiaries. Therefore, beyond social grants, the government should integrate social grants with building long-term resilience capacity and reduce household exposure to food insecurity.
4.2. Food Insecurity Index
Before estimating an Item Response Theory (IRT) model to assess the dimensionality of the food insecurity construct, we conducted exploratory factor analysis (EFA) based on a tetrachoric correlation matrix and a one-factor confirmatory factor analysis (CFA) within a structural equation modeling (SEM) framework. Model fit was evaluated using the Comparative Fit Index (CFI), Tucker–Lewis Index (TLI), Root Mean Square Error of Approximation (RMSEA), and Standardized Root Mean Square Residual (SRMR).
As shown in Table 4, the first factor explains 98.4% of common variance. Factor loadings were uniformly high, ranging from 0.95 to 0.98 across the six food insecurity indicators, whereas the item uniqueness values were low (0.03–0.10). This result shows that all food insecurity indicators measured a common underlying latent trait and provides strong empirical support for the unidimensionality assumption required for the relevance of the employed two-parameter logistic (2PL) Item Response Theory model.
Table 4.
Validation of the food insecurity latent construct.
The scree plot, based on the tetrachoric correlation matrix of the six food insecurity indicators (Figure 2), also confirms a significant decline in eigenvalues from the first to the second factor, followed by a nearly flat trajectory for the other factors. This clear elbow, which appeared after the first factor, implied the presence of a dominant latent dimension underlying the six food insecurity items. Therefore, the scree plot supports the appropriateness of estimating a unidimensional two-parameter logistic (2PL) IRT model to derive latent food insecurity scores.
Figure 2.
Scree plot of food insecurity indicators. Source: Author’s estimation based on Exploratory Factor Analysis (EFA).
The One-Factor Confirmatory Factor Analysis (CFA) results also supported a strong unidimensional structure, with a dominant first eigenvalue of 5.63 and a second eigenvalue of 0.13, giving a first-to-second eigenvalue ratio of 43.34. The factor loadings were uniformly high and similar, confirming that all food insecurity indicators were strongly associated with the underlying food insecurity constructs. The internal consistency was also excellent (Cronbach’s α = 0.93).
Additionally, in Table 5, the CFA supported the measurement model with acceptable comparative and residual fit index values. Although the RMSEA was relatively high, it is not particularly important in binary indicators and large-sample-size cases, as this measure is usually sensitive in such contexts. Factor analysis, reliability tests, and SEM all support the assumption of unidimensionality required for Item Response Theory (IRT) modeling. As a result, a two-parameter logistic (2PL) IRT model was employed using adaptive Gauss–Hermite quadrature with 15 integration points to derive the latent household food insecurity scores.
Table 5.
Reliability and goodness-of-fit statistics for the food insecurity construct.
Table 6 presents the discrimination and difficulty estimates for the food insecurity indicators from the 2PL IRT model. All six food insecurity indicators showed strong, statistically significant discrimination parameters, indicating a high capacity to differentiate households across the food insecurity continuum in the country. The highest discrimination parameter was observed for experienced hunger, followed by households running out of food and consuming a limited variety of foods. This suggests that these items are particularly informative in differentiating households with different levels of food insecurity. The estimated discrimination parameters indicate excellent item discrimination, implying that each poverty insecurity indicator is highly sensitive to differences in the latent food insecurity traits. From this measurement perspective, items with larger discrimination parameters contribute more information and improve the precision of household classification across the food insecurity continuum. The exceptionally high discrimination estimate for ‘experienced hunger’ indicates that this item is specifically effective in differentiating households experiencing severe food insecurity from those with moderate or low food insecurity. Similarly, ‘the household ran out of food’ and ‘consumed a limited variety of foods’ also showed strong discriminatory power, confirming that these indicators capture meaningful variations in household food insecurity.
Table 6.
Item discrimination and difficulty parameter estimates for food insecurity.
The difficulty parameters indicate a clear gradient in food insecurity severity. Worrying about not having enough food and consuming a limited variety of foods were associated with the lowest severity levels. Households that went without food for a full day experienced the greatest difficulty, followed by hunger and skipping meals. These results suggest that food insecurity indicators progressively capture more severe forms of food insecurity. The statistically significant discrimination and difficulty parameters support the validity of the food insecurity scale and its ability to measure varying levels of household food insecurity.
The ordered difficulty parameters further show that the food insecurity indicators reflect successive stages of food insecurity. Lower difficulty estimates for worrying about food and consuming a limited variety of foods indicate that these behaviors occur at relatively low levels of latent food insecurity and, therefore, function as early warning indicators. In contrast, higher difficulty values for experiencing hunger and going without food for an entire day indicate that these occur only among households experiencing much more severe food insecurity. This result is consistent with the theoretical ordering of experiential food insecurity, whereby households typically move from anxiety about food access to compromised dietary quality, meal reduction, hunger, and ultimately, prolonged food insecurity. The logical ordering of the difficulty parameters, together with the uniformly high discrimination coefficients, provides strong evidence of the construct validity and measurement reliability of the latent food insecurity index.
Figure 3 presents the probability of food insecurity at the item level of the latent trait, estimated using the IRT (2PL) model. Item characteristic curves confirmed that the expected monotonic relationship held: each experience of food insecurity increased the likelihood of greater food insecurity. More severe food insecurity indicators showed a higher level of traits, whereas low food insecurity indicator items shifted to the left.
Figure 3.
Authors’ estimation of Item Characteristic Curves (ICC). Source: Author’s estimation based on a two-parameter logistic (2PL) Item Response Theory model.
Figure 4 shows all food insecurity indicators of item information functions (IIFs) with the corresponding latent trait continuum (θ), which indicates the severity of household food insecurity. The curves indicate heterogeneity in the measurement precision of food insecurity items across the food insecurity index. In particular, experienced hunger and running out of food items showed strong discriminatory power, dominating the information items at different latent trait ranges. However, worrying about food provides limited discriminatory power and yields good information at lower levels of food insecurity.
Figure 4.
Item information functions. Source: Author’s estimation based on a two-parameter logistic (2PL) Item Response Theory model.
Figure 5 shows the information curve for latent traits centered around, which reflects the maximum precision level for measuring food insecurity. The curve is sharp and shows a higher concentration of items, given the combined scale of food insecurity items, rather than looking at each item for households with significant experience of food insecurity. At lower values of the latent trait, food-secure households provide less information, indicating weaker discrimination among relatively food-secure households than among food-secure households. Furthermore, at high levels of the latent trait, drop-off indicates a reduction in precision, especially in separating households within the most severely food-insecure group, even though the decline rate of relatively food-secure households is less likely to be significant compared with the lower-end distribution.
Figure 5.
Test information function. Source: Author’s estimation based on a two-parameter logistic (2PL) Item Response Theory model.
The measurement scale aligned with moderate and severe household food insecurity shows the vulnerability of food insecurity. The peak of the bell-shaped curve confirms the model’s strong discrimination power and internal validity, supporting its further development and informed decision-making. Especially where the latent trait is high, it is important to identify those most affected by food insecurity, as this is effective for social grants.
The results in Figure 6 show high measurement precision for household food insecurity, suggesting that the estimation techniques effectively discriminate between household experiences. A steeper slope at the peak indicates strong responsiveness to small changes in the latent trait and confirms that the distribution of food insecurity lies in the mid-to-upper tail.
Figure 6.
Measurement of reliability or precision. Source: Author’s estimation based on a two-parameter logistic (2PL) Item Response Theory model.
4.3. Social Grant and Food Insecurity
Before interpreting the mediation pathways, the structural equation model (SEM) was estimated using maximum likelihood with robust (Huber–White) standard errors to account for potential heteroscedasticity and non-normality in household income and food insecurity index. The SEM framework was used to examine the direct and indirect relationships among social grant receipts, household income, and food insecurity, while controlling for household covariates and treating geographical context as a moderator. Table 7 presents the association between social grants and household food insecurity using moderated mediation analysis within a structural equation model (SEM). It jointly evaluates the effect of social grants on household income (mediator) and the association of this effect with food insecurity (outcome) and geographic location (rural areas under traditional leadership vs. rural areas on commercial farms) as a moderator relative to urban areas. In the first equation of the structural equation results, households that receive social grants are inversely related to income, and this relationship is statistically significant at the 1 percent level. This negative relationship indicates that social grant programs primarily target household beneficiaries, focusing on the most vulnerable and structurally disadvantaged groups. This finding is consistent with previous empirical evidence from South African studies showing that social grants are targeted toward poor and vulnerable households, specifically those facing chronic poverty and food insecurity (Collin and Jahed 2025; Fofana et al. 2024; Chakona and Shackleton 2019).
Table 7.
Direct and indirect associations between social grants and household food insecurity.
This result aligns with targeted social assistance households, as eligibility requires a social grant and beneficiary group. Compared to urban areas, rural areas under traditional leadership exhibit a statistically significant inverse relationship with household income. Households in rural areas around commercial farms show a positive relationship, which may be due to additional income from engaging in or hiring nearby commercial farms in addition to other sources of income. This implies that rural areas, especially those under traditional leadership, are the main beneficiaries of social grants, as they are disadvantaged groups with fewer opportunities to generate income than those in urban areas.
In the second equation, the structural equation shows that social grant receipts remain positively related to the food insecurity index, whereas household income is negatively associated with food insecurity. This implies that before access to social grants, the most food-insecure and poor households received assistance, and it indicates significantly poorer baseline conditions of grant recipients’ households before receiving the social grants. Higher income reduces food insecurity and serves as a channeling mechanism, as income is a strong mediator. Similarly, previous research has reported that grant recipients generally experience higher levels of deprivation despite receiving income support (Dunga 2025; Chakona and Shackleton 2019). The significant negative coefficient of household income further confirms that income represents an important pathway through which social grants are associated with lower food insecurity, consistent with evidence that increased purchasing power improves household food access (Brollo et al. 2024; Chen et al. 2023).
Without interaction, rural areas under traditional leadership have a positive relationship with the food insecurity index. However, a negative relationship was observed in rural areas near commercial farmers, suggesting that food insecurity is less severe than it is in urban areas. The reduction in food insecurity is not due to the receipt of social grants; rather, moderation operates predominantly through income. Therefore, the special difference in social grants was a more effective complement to different income-generating opportunities, since the difference in how household income was generated into food security outcomes was evident in this study.
Households with a large share of elderly family members have a statistically significant positive relationship with household income. However, households with older adult family members experienced significantly lower food insecurity, which may be due to access to old-age pensions. This reflects the stabilizing contribution of the South African Old Age Grant to households (Duflo 2003; Case and Deaton 1998). Access to asset ownership and the quality of assets were statistically significant and associated with higher income and lower household food insecurity, suggesting that, in addition to current income, wealth reduces household food insecurity. Ownership of productive household assets is associated with higher income and lower food insecurity, supporting previous evidence that both income and accumulated household assets contribute to improved food security and resilience (Chen et al. 2023).
Specifically, in Gauteng and Mpumalanga, lower levels of household food income and household food insecurity were observed compared to the Western Cape (reference province), which may be related to the provinces’ local economic and environmental contexts. In contrast, the Free State Province has higher household income and food insecurity than the reference province. Therefore, social grants could reduce food insecurity at the household level, provided the government complements them with other strategies that enhance household income by addressing structural problems through the development of additional employment programs and improved market access, particularly in rural areas.
Table 8 presents the decomposition of social grants into direct and indirect effects, and both pathways are statistically significant. Social grants had an indirect association and a positive and significant relationship with food insecurity. Even though they increase income at the margin, they do not offset pre-existing household food insecurity. However, income remains a transmission mechanism for social grants that determines food insecurity exposure.
Table 8.
Average moderator mediation effect.
The indirect association of social grants on household food insecurity is larger than the direct association (11.48% vs. 9.26%), implying that there are unobserved effects that lead to greater disadvantage, such as especially marginalized households, labor market exclusion, or chronically vulnerable households of beneficiaries of social grants, and the significant difference is not due to mediated income observed relationships. Both unobserved and observed income channels reinforce household vulnerability to food insecurity among social grant beneficiary households in South Africa. This finding is consistent with evidence from South Africa, which shows that although social grants substantially reduce poverty and smoothen consumption, they are often insufficient to eliminate food insecurity among chronically vulnerable households because multiple non-income constraints remain binding (Dunga 2025; Fofana et al. 2024; Chakona and Shackleton 2019).
The total association (20.74%) indicates that both direct and indirect components were strongly associated with household food insecurity among social grant beneficiaries, suggesting that social grants were concentrated among the most vulnerable households rather than a failure of intervention. Similar conclusions have been reported by Collin and Jahed (2025), Barrientos (2013), and Case and Deaton (1998), who argued that beneficiaries generally exhibit poor income before receiving assistance because eligibility is explicitly based on socioeconomic vulnerability.
The proportion-mediated analysis confirmed that 55.4% of the total relationship between social grant beneficiaries and food insecurity operated through household income. The remaining 44.6% is explained by the direct pathway and other factors not captured by the income mediator, underscoring the strengths and limitations of cash transfer programs. These results suggest that income support plays an important role in alleviating vulnerability to food insecurity in rural South Africa. However, the persistence of a significant direct association indicates that income transfers alone may be insufficient to fully address household food insecurity. Another important finding is that slightly more than half of the total association is mediated through income, suggesting that non-income constraints remain important determinants of food insecurity. Recent studies have similarly concluded that cash transfer programs are most effective when complemented by labor market interventions, local economic development, improvements in the food system, and nutrition-sensitive social protection policies (Dunga 2025; Fofana et al. 2024). This highlights the need to complement social grants with broader interventions that address the structural drivers of food insecurity, especially among highly disadvantaged households and in rural areas.
The findings in Table 9 show the heterogeneous effects of social grants on food insecurity across geographical areas. The results confirm that in rural areas under traditional leadership and around commercial farms, the association between social grants and household income is statistically significant and negative. The largest income effect was observed in commercial farming areas, followed by the urban base group and rural areas under traditional leadership. This implies that social grant beneficiaries were poorer at baseline and that social grants were well targeted. The inverse relationship between income and food insecurity confirms that food poverty is more likely to be reduced as a household’s purchasing power increases. This finding is consistent with the broader food security literature, which identifies income as one of the strongest determinants of household food access because it increases households’ ability to purchase sufficient and nutritious food (Chen et al. 2023; Burchi and Muro 2016).
Table 9.
Geographic heterogeneity in the direct and indirect effects of social grants on household food insecurity.
The indirect effects indicate that social grants are associated with food insecurity through household income, although the magnitudes differ by location. The highest indirect effect was observed in commercial farming areas (12.8%), followed by the urban base group (11.5%), and rural areas under traditional leadership (10.3%). The weaker indirect effect in rural areas under traditional leadership may reflect limited infrastructure, weaker market integration, and fewer off-farm income opportunities in these areas. Furthermore, the total effect remained positive and statistically significant in urban areas (20.7%) and rural areas under traditional leadership (17%). This suggests that the association between social grants and food insecurity varies by geographical context. The stronger income-mediated pathway in commercial farming areas suggests that households in these areas may depend more on labor income and market purchases for food, making income improvements particularly important for reducing food insecurity. In contrast, the smaller indirect effect in traditional rural areas may reflect weaker market integration, inadequate infrastructure, greater distances to food markets, and fewer non-farm employment opportunities, thereby reducing the effect of income transfers on food access improvement. Similar spatial disparities in food security have been reported in the rural food system literature in South Africa (Battersby and Watson 2018; Chakona and Shackleton 2019).
These findings underscore the importance of income as a transmission channel through which social grants influence food insecurity, particularly in areas with greater market access. The stronger indirect effect observed in commercial farming areas suggests that increases in household income are more likely to translate into improved food access in these areas. In contrast, the weaker indirect effect in rural areas under traditional leadership indicates that income transfers alone may be insufficient to reduce food insecurity, where structural constraints such as poor infrastructure and limited livelihood opportunities remain binding. These findings highlight the need to complement social grants with investments in livelihoods, local food systems, and rural development.
Compared with previous empirical evidence from South Africa, this study makes a distinct contribution to the literature on social grants and food insecurity. Similar to Chakona and Shackleton (2019), Waidler and Devereux (2019), and Gelo and Dikgang (2022), the results confirm that social grants play an important role in protecting vulnerable households from food insecurity. However, unlike previous studies, this study explicitly identifies the mechanism by which social grants are associated with food insecurity, showing that household income is a key transmission pathway, and its magnitude differs across geographic locations. This result extends the literature beyond reporting associations by quantifying how the relationship between social grant receipts and food insecurity varies across urban, traditional rural, and commercial farming areas in South Africa.
The study also contributes to food insecurity measurement by using an Item Response Theory (IRT) framework that captures differences in severity across food insecurity experiences, rather than relying on binary indicators. The moderated mediation structural equation model further revealed significant spatial heterogeneity in the association between social grants and food insecurity in urban, traditional rural, and commercial farming areas in South Africa. While Takawira et al. (2024) identified the drivers of food security among grant beneficiaries, this study shows how the geographical context shapes the income-mediated association between social grants and food insecurity. Furthermore, the persistence of food insecurity among grant-dependent households supports Dunga’s (2025) findings on structural food insecurity among social grant beneficiaries. Therefore, the findings suggest that social grants remain a necessary but insufficient instrument for reducing food insecurity and should be complemented by employment creation, labor market reforms, food system interventions, asset-building programmes, and location-specific development strategies.
5. Conclusions
The results of the moderated mediation structural equation model indicate that South Africa’s social grant system strongly targets the poor and vulnerable in household food insecurity. Although social grant beneficiaries continue to experience significantly higher levels of food insecurity than non-beneficiaries, this pattern reflects the effective targeting of assistance to households facing the greatest socioeconomic disadvantage rather than program failure. Therefore, social grants reduce vulnerability by increasing household resources but remain insufficient to overcome the constraints underlying food insecurity.
The mediation analysis shows that household income is the primary mechanism linking social grant receipt to household food insecurity. Approximately 55.4% of the total association operates through household income, underscoring the central role of income support in reducing food insecurity among grant-recipient households. However, the remaining direct association indicates that factors beyond income continue to influence household food insecurity. The moderated mediation results further reveal significant geographical heterogeneity. The indirect income pathway was the strongest in commercial farming areas, followed by urban and rural areas under traditional leadership. This implies that additional income is translated more effectively into food access where market integration is stronger. In contrast, the total association between social grants and food insecurity remained statistically significant only in urban and traditional rural areas, indicating that geographic context shapes both the magnitude and significance of these relationships.
The findings also provide empirical support for the hypotheses of this study. The results support H1, which proposed that social-grant-recipient households exhibit higher baseline food insecurity because grants are targeted at vulnerable households. H2 is also supported, as household income significantly mediates the relationship between social grant receipt and food insecurity, accounting for more than half (55.4%) of the total association. H3 is confirmed, showing that higher household income is significantly associated with lower food insecurity, highlighting income as the principal mechanism through which social grants improve food security. H4 is also supported, as both the direct and indirect associations varied across urban, traditional rural, and commercial farming areas, confirming spatial heterogeneity. Finally, H5 is supported by the significant effects of household demographic, socioeconomic, housing, and geographic characteristics on both household income and food insecurity. Collectively, these findings show that the interaction between income, household characteristics, and spatial context shapes food insecurity.
Because household income accounts for more than half of the observed association between social grants and food insecurity, strengthening income support through the social protection system remains a key strategy for reducing food insecurity. However, because a direct association exists, cash transfers alone cannot eliminate food insecurity. Therefore, social grants should be complemented by employment creation, labor market interventions, livelihood diversification, and nutrition-sensitive social protection programs that address the systemic drivers of food insecurity. The observed spatial heterogeneity further suggests that social grants should be geographically differentiated in their distributions. In commercial farming areas, where the income-mediated pathway is strongest, improving labor market participation, wage opportunities, and market integration are likely to enhance the effectiveness of income transfers. In contrast, rural areas under traditional leadership require complementary investments in rural infrastructure, agricultural productivity, local food systems, market accessibility, and basic public services, as income transfers alone are less effective in reducing food insecurity in areas with limited economic opportunities.
The significant relationship between household assets and income further suggests that long-term food security requires asset-building strategies, alongside income transfers. Policies promoting productive assets and human capital development would strengthen households’ capacity to generate sustainable income and reduce their vulnerability to food insecurity during shocks. Consequently, social grants should be integrated with employment opportunities, food system interventions, agricultural development, and human capital investments to achieve sustainable reductions in household food insecurity.
This study has several limitations. First, the analysis relied on a single cross-sectional survey, preventing the establishment of temporal ordering among social grant recipients, household income, and food insecurity. Consequently, the estimated relationships should be interpreted as associations rather than causal effects. Second, despite controlling for an extensive set of demographic, socioeconomic, and geographic characteristics, unobserved household and community factors may still influence the estimates. In addition, because South Africa’s social grant system intentionally targets disadvantaged households, selection effects and reverse causality cannot be eliminated. Finally, although the mediation framework provides valuable evidence regarding potential transmission mechanisms, its identifying assumptions cannot be fully verified using only cross-sectional data.
Future research should employ longitudinal or panel datasets to examine how the relationships between social grants, household income, and food insecurity evolve. Applying stronger causal identification strategies, including regression discontinuity, instrumental variables, or natural experiments, would further strengthen this inference. Future studies should also investigate additional transmission pathways beyond household income, including labor market participation, asset accumulation, agricultural production, dietary quality, nutritional outcomes, and household resilience to economic shocks. Finally, greater attention should be paid to differences across grant types, beneficiary groups, and geographic contexts to improve our understanding of how social grant interventions can more effectively reduce food insecurity.
Author Contributions
Conceptualization, A.T.T. and S.H.D.; Methodology, A.T.T. and S.H.D.; Validation, A.T.T. and S.H.D.; Formal analysis, A.T.T.; Investigation, A.T.T. and S.H.D.; Resources, S.H.D.; Data curation, A.T.T. and S.H.D.; Writing—original draft, A.T.T.; Writing—review & editing, A.T.T. and S.H.D.; Visualization, A.T.T. and S.H.D.; Supervision, S.H.D. All authors have read and agreed to the published version of the manuscript.
Funding
The authors did not receive any funding for this study.
Institutional Review Board Statement
Not applicable.
Informed Consent Statement
Not applicable.
Data Availability Statement
The data are publicly available from Statistics, South Africa. Specifically, the following link: https://isibaloweb.statssa.gov.za/pages/surveys/pss/ghs/2024/ghs2024.php?utm_source (accessed on 25 March 2026). However, data supporting reported results can be shared upon request.
Acknowledgments
The authors gratefully acknowledge North-West University for funding the publication fee for this manuscript. The authors also sincerely thank the anonymous reviewers for their valuable comments, constructive feedback, and insightful suggestions, which greatly improved the quality of this manuscript during the review process.
Conflicts of Interest
The authors declare no conflict of interest.
References
- Adato, Michelle, and Lucy Bassett. 2009. Social protection to support vulnerable children and families: The potential of cash transfers to protect education, health and nutrition. AIDS Care 21: 60–75. [Google Scholar] [CrossRef] [Scilit] [PubMed]
- Baker, Frank B., and Seock-Ho Kim. 2004. Item Response Theory: Parameter Estimation Techniques, 2nd ed. New York: Marcel Dekker. [Google Scholar]
- Barrientos, Armando. 2013. Social Assistance in Developing Countries. Cambridge: Cambridge University Press. [Google Scholar]
- Bassi, Laurie J. 1984. Estimating the Effect of Training Programs with Non-Random Selection. The Review of Economics and Statistics 66: 36–43. [Google Scholar] [CrossRef] [Scilit]
- Battersby, Jane, and Vanessa Watson. 2018. Urban Food Systems Governance and Poverty in African Cities. Abingdon: Taylor & Francis, p. 290. [Google Scholar]
- Brollo, Fernanda, Gabriel Lara Ibarra, and Ricardo Campante Vale. 2024. Strengthening Income Stabilization Through Social Protection in Emerging and Developing Economies: The Brazilian Experience. Washington, DC: International Monetary Fund. [Google Scholar]
- Burchi, Francesco, and Pasquale De Muro. 2016. From food availability to nutritional capabilities: Advancing food security analysis. Food Policy 60: 10–19. [Google Scholar] [CrossRef] [Scilit]
- Casale, Daniela, and Debra Shepherd. 2021. The Gendered Effects of the COVID-19 Crisis and Ongoing Lockdown in South Africa. Evidence from NIDS-CRAM Waves 1–5. Available online: https://www.researchgate.net/profile/Daniela-Casale-3/publication/353346709_The_gendered_effects_of_the_COVID-19_crisis_and_ongoing_lockdown_in_South_Africa_Evidence_from_NIDS-CRAM_Waves_1_-5/links/60f696e3fb568a7098c04b12/The-gendered-effects-of-the-COVID-19-crisis-and-ongoing-lockdown-in-South-Africa-Evidence-from-NIDS-CRAM-Waves-1-5.pdf (accessed on 25 March 2026).
- Case, Anne, and Angus Deaton. 1998. Large cash transfers to the elderly in South Africa. The Economic Journal 108: 1330–61. [Google Scholar] [CrossRef] [Scilit]
- Chakona, Gamuchirai, and Charlie M. Shackleton. 2019. Food insecurity in South Africa: To what extent can social grants and consumption of wild foods eradicate hunger? World Development Perspectives 13: 87–94. [Google Scholar] [CrossRef] [Scilit]
- Charamba, Vonai, Lawrence N. Kazembe, and Ndeyapo Nickanor. 2023. Application of item response theory modelling to measure an aggregate food security access score. Food Security 15: 1383–98. [Google Scholar] [CrossRef] [Scilit]
- Chen, Jun-Hong, Chi-Fang Wu, and Minchao Jin. 2023. How are income and assets associated with food insecurity? An application of the growth mixture modeling. Social Indicators Research 165: 959–73. [Google Scholar] [CrossRef] [Scilit]
- Collin, Chikwira, and Mohammed Iqbal Jahed. 2025. Social Grants as a Lifeline: Assessing Their Impact on Poverty Reduction in African Countries. International Journal of Economics and Financial Issues 15: 508–13. [Google Scholar] [CrossRef] [Scilit]
- de Ayala, Rafael Jaime. 2009. The Theory and Practice of Item Response Theory. Manhattan: Guilford Press. [Google Scholar]
- Department of Social Development (DSD), SASSA, and UNICEF. 2012. The South African Child Support Grant Impact Assessment; Pretoria: SASSA House.
- Dercon, Stefan. 2005. Risk, insurance, and poverty: A review. Insurance Against Poverty 1974: 9. [Google Scholar]
- Devereux, Stephen, and Rachel Sabates-Wheeler. 2004. Transformative Social Protection. Brighton: University of Sussex. [Google Scholar]
- Dodouh, Hiba Abdullateef. 2023. The Effect of the Difference in the Response Model of the Item (1PL, 2PL, 3PL) on the Differential Item Functioning. Alustath Journal for Human and Social Sciences 62: 23–44. Available online: https://alustath.uobaghdad.edu.iq/journal/vol62/iss1/2/ (accessed on 25 March 2026).
- Duflo, Esther. 2003. Grandmothers and granddaughters: Old-age pensions and intra-household allocation. World Bank Economic Review 17: 1–25. [Google Scholar] [CrossRef] [Scilit]
- Dunga, Hannah Mayamiko. 2025. Assessing poverty dynamics in social grant dependent household: A comprehensive analysis. International Journal of Research in Business and Social Science 14: 164–73. [Google Scholar] [CrossRef] [Scilit]
- Embretson, Susan E., and Steven P. Reise. 2000. Item Response Theory for Psychologists. Mahwah: Lawrence Erlbaum Associates. [Google Scholar]
- Fofana, Ismael, Ramos E. Mabugu, Alhassane Camara, and Babatunde Abidoye. 2024. Ending poverty and accelerating growth in South Africa, through the expansion of its social grant system. Journal of Policy Modeling 46: 1090–102. [Google Scholar] [CrossRef] [Scilit]
- Gelb, Alan, and Caroline Decker. 2012. Cash at your fingertips: Biometric technology for transfers in developing countries. Review of Policy Research 29: 91–117. [Google Scholar] [CrossRef] [Scilit]
- Gelo, Dambala, and Johane Dikgang. 2022. Implications of COVID-19 labour market shock for child and household hungers in South Africa: Do social protection programs protect? PLoS ONE 17: e0269848. [Google Scholar] [CrossRef] [Scilit] [PubMed]
- Hall, K, and G Wright. 2010. A profile of children living in South Africa in 2008. Studies in Economics and Econometrics 34: 45–68. Available online: https://hdl.handle.net/10520/EJC21507 (accessed on 25 March 2026). [CrossRef] [Scilit]
- Hambleton, Ronald K., and Hariharan Swaminathan. 2013. Item Response Theory: Principles and Applications. Berlin/Heidelberg: Springer Science & Business Media. [Google Scholar]
- Hambleton, Ronald K., Hariharan Swaminathan, and H. Jane. 1991. Fundamentals of Item Response Theory. Thousand Oaks: Sage Publications. [Google Scholar]
- Hanna, Rema, and Dean Karlan. 2017. Designing social protection programs: Using theory and experimentation to understand how to help combat poverty. In Handbook of Economic Field Experiments. Amsterdam: North-Holland, vol. 2, pp. 515–53. [Google Scholar] [CrossRef] [Scilit]
- Hayes, Andrew F. 2022. Introduction to Mediation, Moderation, and Conditional Process Analysis: A Regression-Based Approach. Manhattan: Guilford Publications. [Google Scholar]
- Heckman, James J., Hidehiko Ichimura, and Petra E. Todd. 1997. Matching As An Econometric Evaluation Estimator: Evidence from Evaluating a Job Training Programme. The Review of Economic Studies 64: 605–54. [Google Scholar] [CrossRef] [Scilit]
- Human Sciences Research Council. 2022. South African National Food and Nutrition Security Survey (SANHANES-2): Key Findings Report. Cape Town: HSRC Press. Available online: https://www.hsrc.ac.za (accessed on 25 March 2026).
- Jolliffe, Ian. 2025. Principal Component Analysis. In International Encyclopedia of Statistical Science. Berlin/Heidelberg: Springer, pp. 1945–48. [Google Scholar] [CrossRef] [Scilit]
- Kline, Rex B. 2016. Principles and Practice of Structural Equation Modeling, 4th ed. Manhattan: Guilford Press. [Google Scholar]
- Köhler, Timothy, and Haroon Bhorat. 2021. Can Cash Transfers Aid Labour Market Recovery. Evidence from South Africa’s Special COVID-19 Grant. Available online: https://www.researchgate.net/profile/Tim-Koehler/publication/352690096_Can_cash_transfers_aid_labour_market_recovery_Evidence_from_South_Africa’s_special_COVID-19_grant/links/60d34c78299bf1fe4698a60c/Can-cash-transfers-aid-labour-market-recovery-Evidence-from-South-Africas-special-COVID-19-grant.pdf (accessed on 25 March 2026).
- König, Christoph, Christian Spoden, and Andreas Frey. 2019. An Optimized Bayesian Hierarchical Two-Parameter Logistic Model for Small-Sample Item Calibration. Applied Psychological Measurement 44: 311–26. [Google Scholar] [CrossRef] [Scilit] [PubMed]
- König, Christoph, Christian Spoden, and Andreas Frey. 2022. Robustness of the performance of the optimized hierarchical two-parameter logistic IRT model for small-sample item calibration. Behavior Research Methods 55: 3965–83. [Google Scholar] [CrossRef] [Scilit] [PubMed]
- Loopstra, Rachel, and Valerie Tarasuk. 2013. Severity of household food insecurity is sensitive to change in household income and employment status among low-income families. The Journal of Nutrition 143: 1316–23. [Google Scholar] [CrossRef] [Scilit] [PubMed]
- Mabugu, Ramos E., and Ismaël Fofana. 2025. Addressing Hunger and Poverty Eradication: Recursive Dynamic CGE Modelling Analysis Using South Africa as a Case. Agriculture 15: 1836. [Google Scholar] [CrossRef] [Scilit]
- Mitra, Devashish, and Priya Ranjan. 2011. Social protection in labour markets exposed to external shocks. In Making Globalization Socially Sustainable. Geneva: WTO iLibrary, pp. 199–231. [Google Scholar] [CrossRef] [Scilit]
- Mokwena, Mandisa Putuma, Richard Apau, and Paul-Francois Muzindutsi. 2023. Analysis of the impact of social grants on food security in Gauteng province of South Africa. Contaduría y Administración 68: 401. [Google Scholar] [CrossRef] [Scilit]
- Morduch, Jonathan. 1995. Income smoothing and consumption smoothing. Journal of Economic Perspectives 9: 103–14. [Google Scholar] [CrossRef] [Scilit]
- Nenguda, Rendani, and Mary Catherine Scholes. 2022. Appreciating the Resilience and Stability Found in Heterogeneity: A South African Perspective on Urban Household Food Security. Frontiers in Sustainable Food Systems 6: 721849. [Google Scholar] [CrossRef] [Scilit]
- Norton, Andy, Tim Conway, and Mick Foster. 2002. Social protection: Defining the field of action and policy. Development Policy Review 20: 541–67. [Google Scholar] [CrossRef] [Scilit]
- Patel, Leila. 2017. The Child Support Grant in South Africa: Gender, care and social investment. In Social Investment and Social Welfare. Cheltenham: Edward Elgar Publishing, pp. 105–22. [Google Scholar] [CrossRef] [Scilit]
- Patel, Leila, and James Midgley. 2023. The social development approach to social protection and social welfare. In Handbook on Social Protection and Social Development in the Global SOUTH. Cheltenham: Edward Elgar Publishing, pp. 12–27. [Google Scholar] [CrossRef] [Scilit]
- Popova, Daria. 2023. Impact of Equity in Social Protection Spending on Income Poverty and Inequality. Social Indicators Research 169: 697–721. [Google Scholar] [CrossRef] [Scilit]
- Preacher, Kristopher J., Derek D. Rucker, and Andrew F. Hayes. 2007. Addressing moderated mediation hypotheses. Multivariate Behavioral Research 42: 185–227. [Google Scholar] [CrossRef] [Scilit] [PubMed]
- Reuters (Based on Stats SA Data). 2026. South Africa’s Unemployment Rate Trends. Available online: https://www.reuters.com/world/africa/south-africas-official-unemployment-rate-rises-327-first-quarter-2026-05-12/ (accessed on 20 March 2026).
- Robeyns, Ingrid. 2017. Wellbeing, Freedom and Social Justice: The Capability Approach Re-Examined. Cambridge: Open Book Publishers. [Google Scholar] [CrossRef] [Scilit]
- Rustamova, Nodira, Sardorbek Sharifzoda, Xurshida Burxanxodjaeva, Lola Rahimqulova, Mukhammad Turdialiev, Farrukh Nurullaev, and Dauletbike Eshchanova. 2025. Social Protection in Developing Countries: Legal, Economic, and Social Trends. Qubahan Academic Journal 5: 118–49. [Google Scholar] [CrossRef] [Scilit]
- Sathyanarayana, S., and T. Mohanasundaram. 2025. Mediation Analysis in Structural Equation Modeling (Sem): Theoretical Foundations, Statistical Methods and Practical Implications. Asian Journal of Economics, Business and Accounting 25: 19–37. [Google Scholar] [CrossRef] [Scilit]
- Seekings, Jeremy, and Nicoli Nattrass. 2015. The welfare state, public services and the ‘social wage’. In Policy, Politics and Poverty in South Africa. London: Palgrave Macmillan, pp. 162–84. [Google Scholar]
- Sen, Amartya. 1999. Development as Freedom. Oxford: Oxford University Press. [Google Scholar]
- Singh, Inderjit, Lyn Squire, and John Strauss. 1986. Agricultural Household Models: Extensions, Applications, and Policy. Washington, DC: The World Bank. [Google Scholar]
- South African Social Security Agency (SASSA). 2012. Annual Report; Pretoria: South African Social Security Agency.
- South African Social Security Agency (SASSA). 2019. Annual Report; Pretoria: South African Social Security Agency.
- South African Social Security Agency (SASSA). 2024. Social Assistance Statistical Reports; Pretoria: South African Social Security Agency.
- South African Social Security Agency (SASSA). 2026. Social Assistance Statistical Report 2025/2026; Pretoria: SASSA.
- Statistics South Africa. 2023. General Household Survey 2023; Pretoria: Statistics South Africa. Available online: https://www.statssa.gov.za (accessed on 25 March 2026).
- Statistics South Africa. 2024. Quarterly Labour Force Survey (QLFS), 2024; Pretoria: Statistics South Africa. Available online: https://www.statssa.gov.za (accessed on 25 March 2026).
- Statistics South Africa. 2025. General Household Survey 2024/2025; Pretoria: Stats SA.
- Statistics South Africa. 2025/26. Poverty and Inequality Reports; Informal Sector and Labour Market Dynamics; Pretoria: Stats SA.
- Takawira, K., A. Mushunje, and S. Olawuyi. 2024. Determinants of rural households’ food security status in South Africa: Lessons from COVID-19 social relief grant recipients in NIDS-CRAM wave 5. African Journal of Food, Agriculture, Nutrition and Development 15: 24205–28. [Google Scholar] [CrossRef] [Scilit]
- Thanh, Pham Tien, Duong The Duy, and Pham Bao Duong. 2022. Disruptions to agricultural activities, income loss and food insecurity during the COVID-19 pandemic: Evidence from farm households in a developing country. Journal of Agribusiness in Developing and Emerging Economies 12: 531–47. [Google Scholar] [CrossRef] [Scilit]
- Van der Berg, Servaas. 1997. South African social security under apartheid and beyond. Development Southern Africa 14: 481–503. [Google Scholar] [CrossRef] [Scilit]
- VanderWeele, Tyler. 2015. Explanation in Causal Inference: Methods for Mediation and Interaction. Oxford: Oxford University Press. [Google Scholar]
- Waddington, Hugh Sharma, Paul Fenton Villar, and Jeffrey C. Valentine. 2022. Can Non-Randomised Studies of Interventions Provide Unbiased Effect Estimates? A Systematic Review of Internal Replication Studies. Evaluation Review 47: 563–93. [Google Scholar] [CrossRef] [Scilit] [PubMed]
- Waidler, Jennifer, and Stephen Devereux. 2019. Social grants, remittances, and food security: Does the source of income matter? Food Security 11: 679–702. [Google Scholar] [CrossRef] [Scilit]
- Wooldridge, Jeffrey M. 2016. Introductory Econometrics a Modern Approach. South-Western Cengage Learning. Available online: https://www.kufunda.net/publicdocs/Wooldridge-Introductory-Econometrics_-A-Modern-Approach-6th-Edition-c2016.pdf (accessed on 25 March 2026).
- World Bank. 2018. Overcoming Poverty and Inequality in South Africa. Washington, DC: World Bank. [Google Scholar]
- World Bank. 2023. South Africa Economic Update: Structural Constraints and Inequality. Washington, DC: World Bank. [Google Scholar]
- World Bank. 2024. Social Protection and Jobs Diagnostic for South Africa. Washington, DC: World Bank. [Google Scholar]
- Zhou, Sheunesu, Ayansola O. Ayandibu, Tendai Chimucheka, and Mandla M. Masuku. 2023. Government social protection and households’ welfare during the COVID-19 pandemic in South Africa. Journal of Business and Socio-Economic Development 3: 308–21. [Google Scholar] [CrossRef] [Scilit]
- Zreik, Mohamad, and Badar Alam Iqbal. 2025. Social financial grants [SFGs] and poverty eradication in South Africa. Development Southern Africa 42: 107–18. [Google Scholar] [CrossRef] [Scilit]
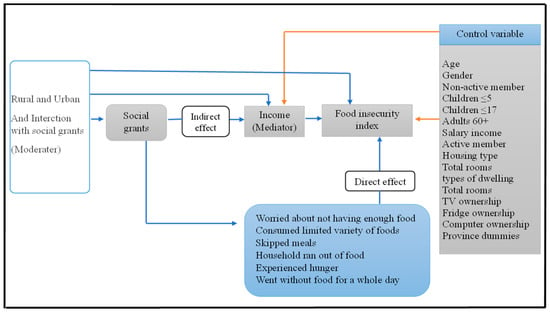
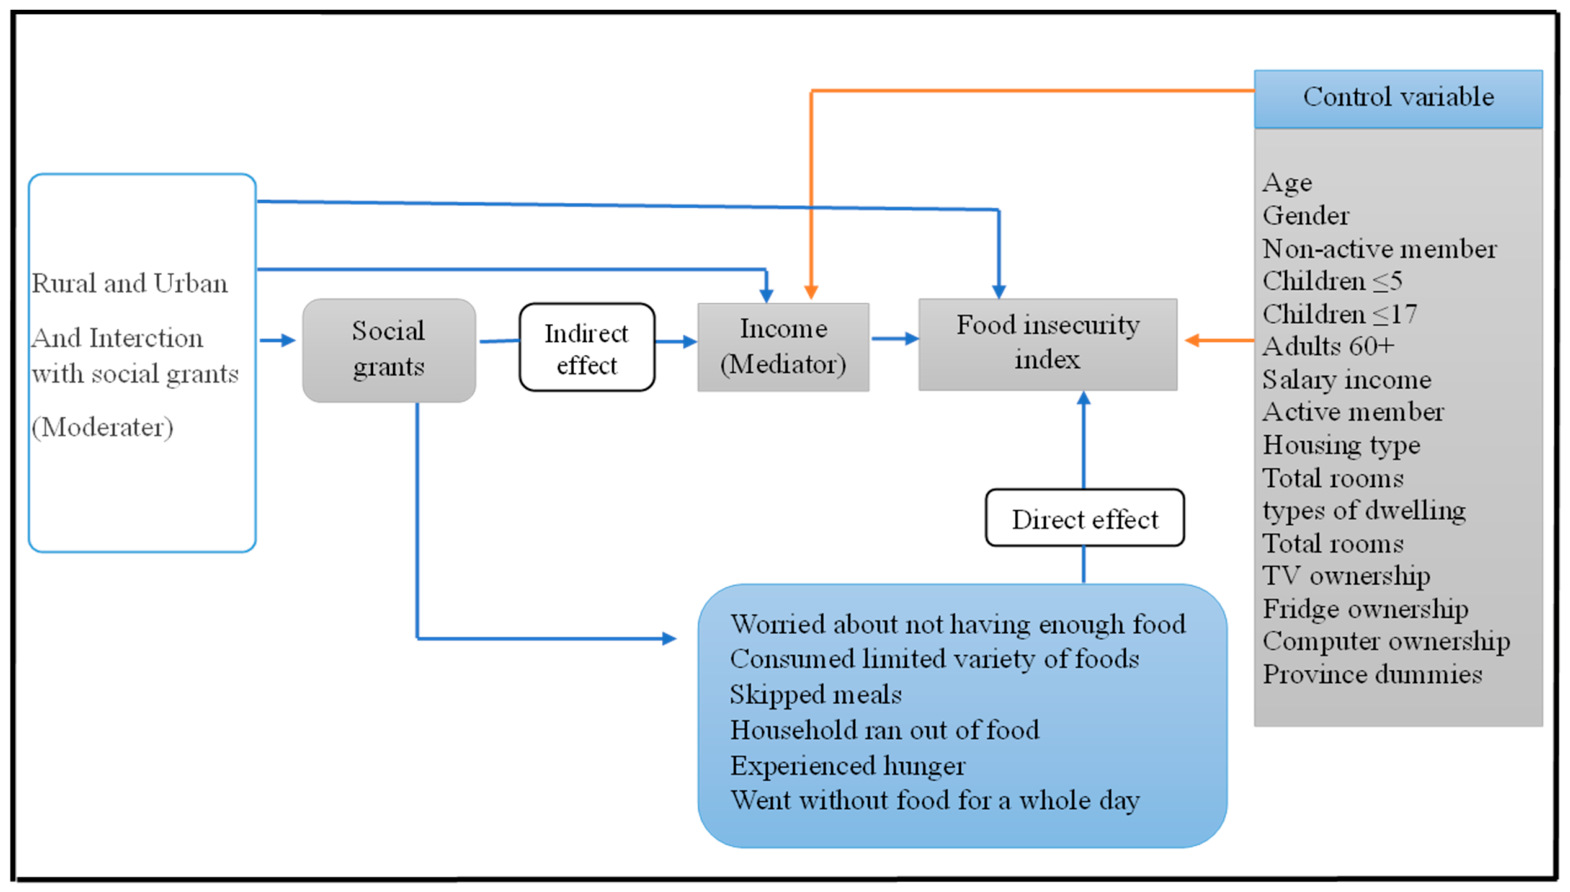
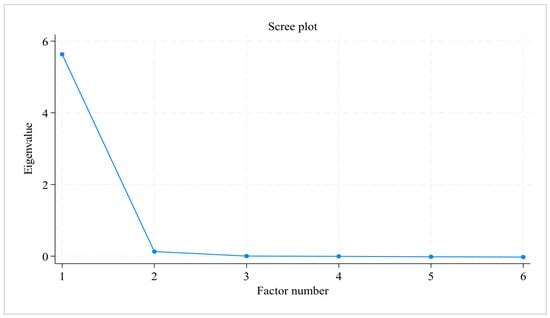
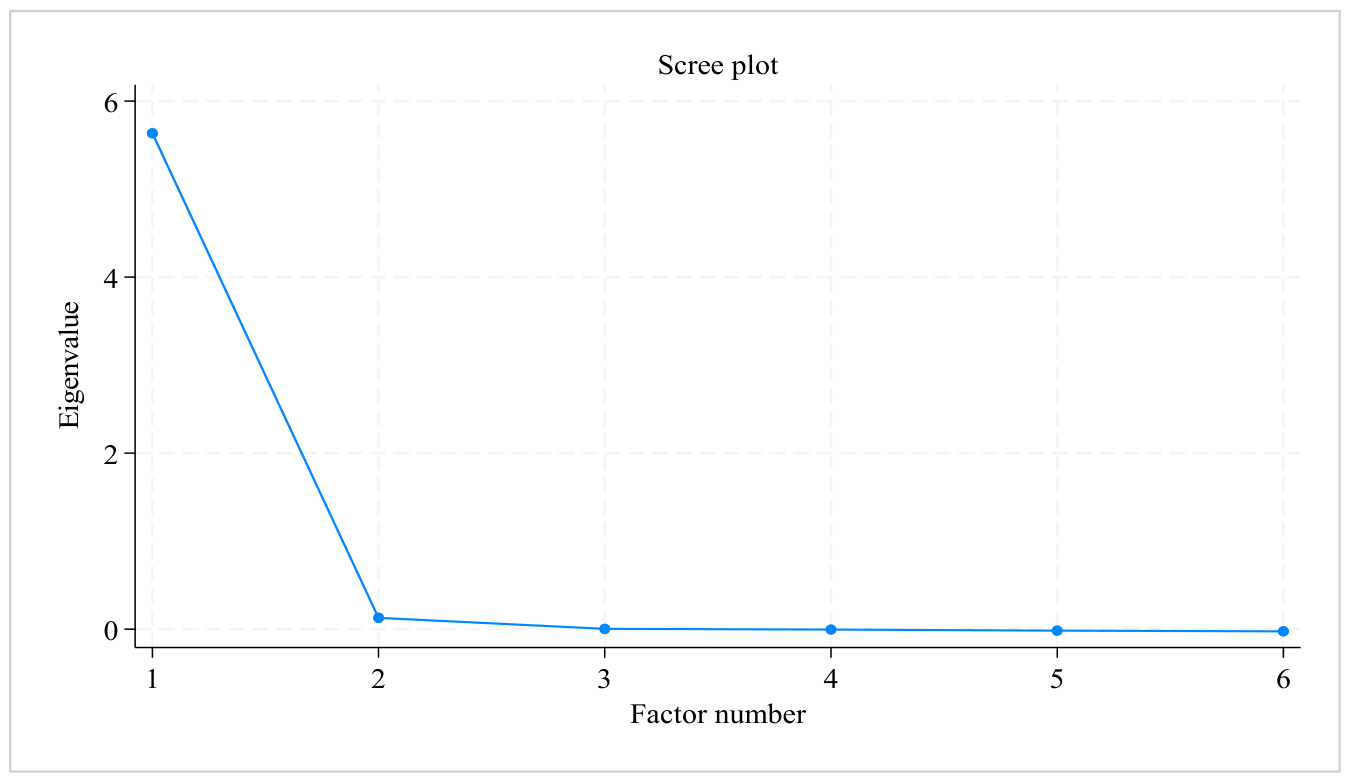
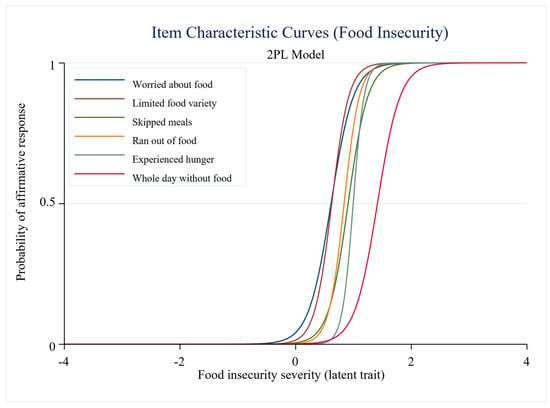
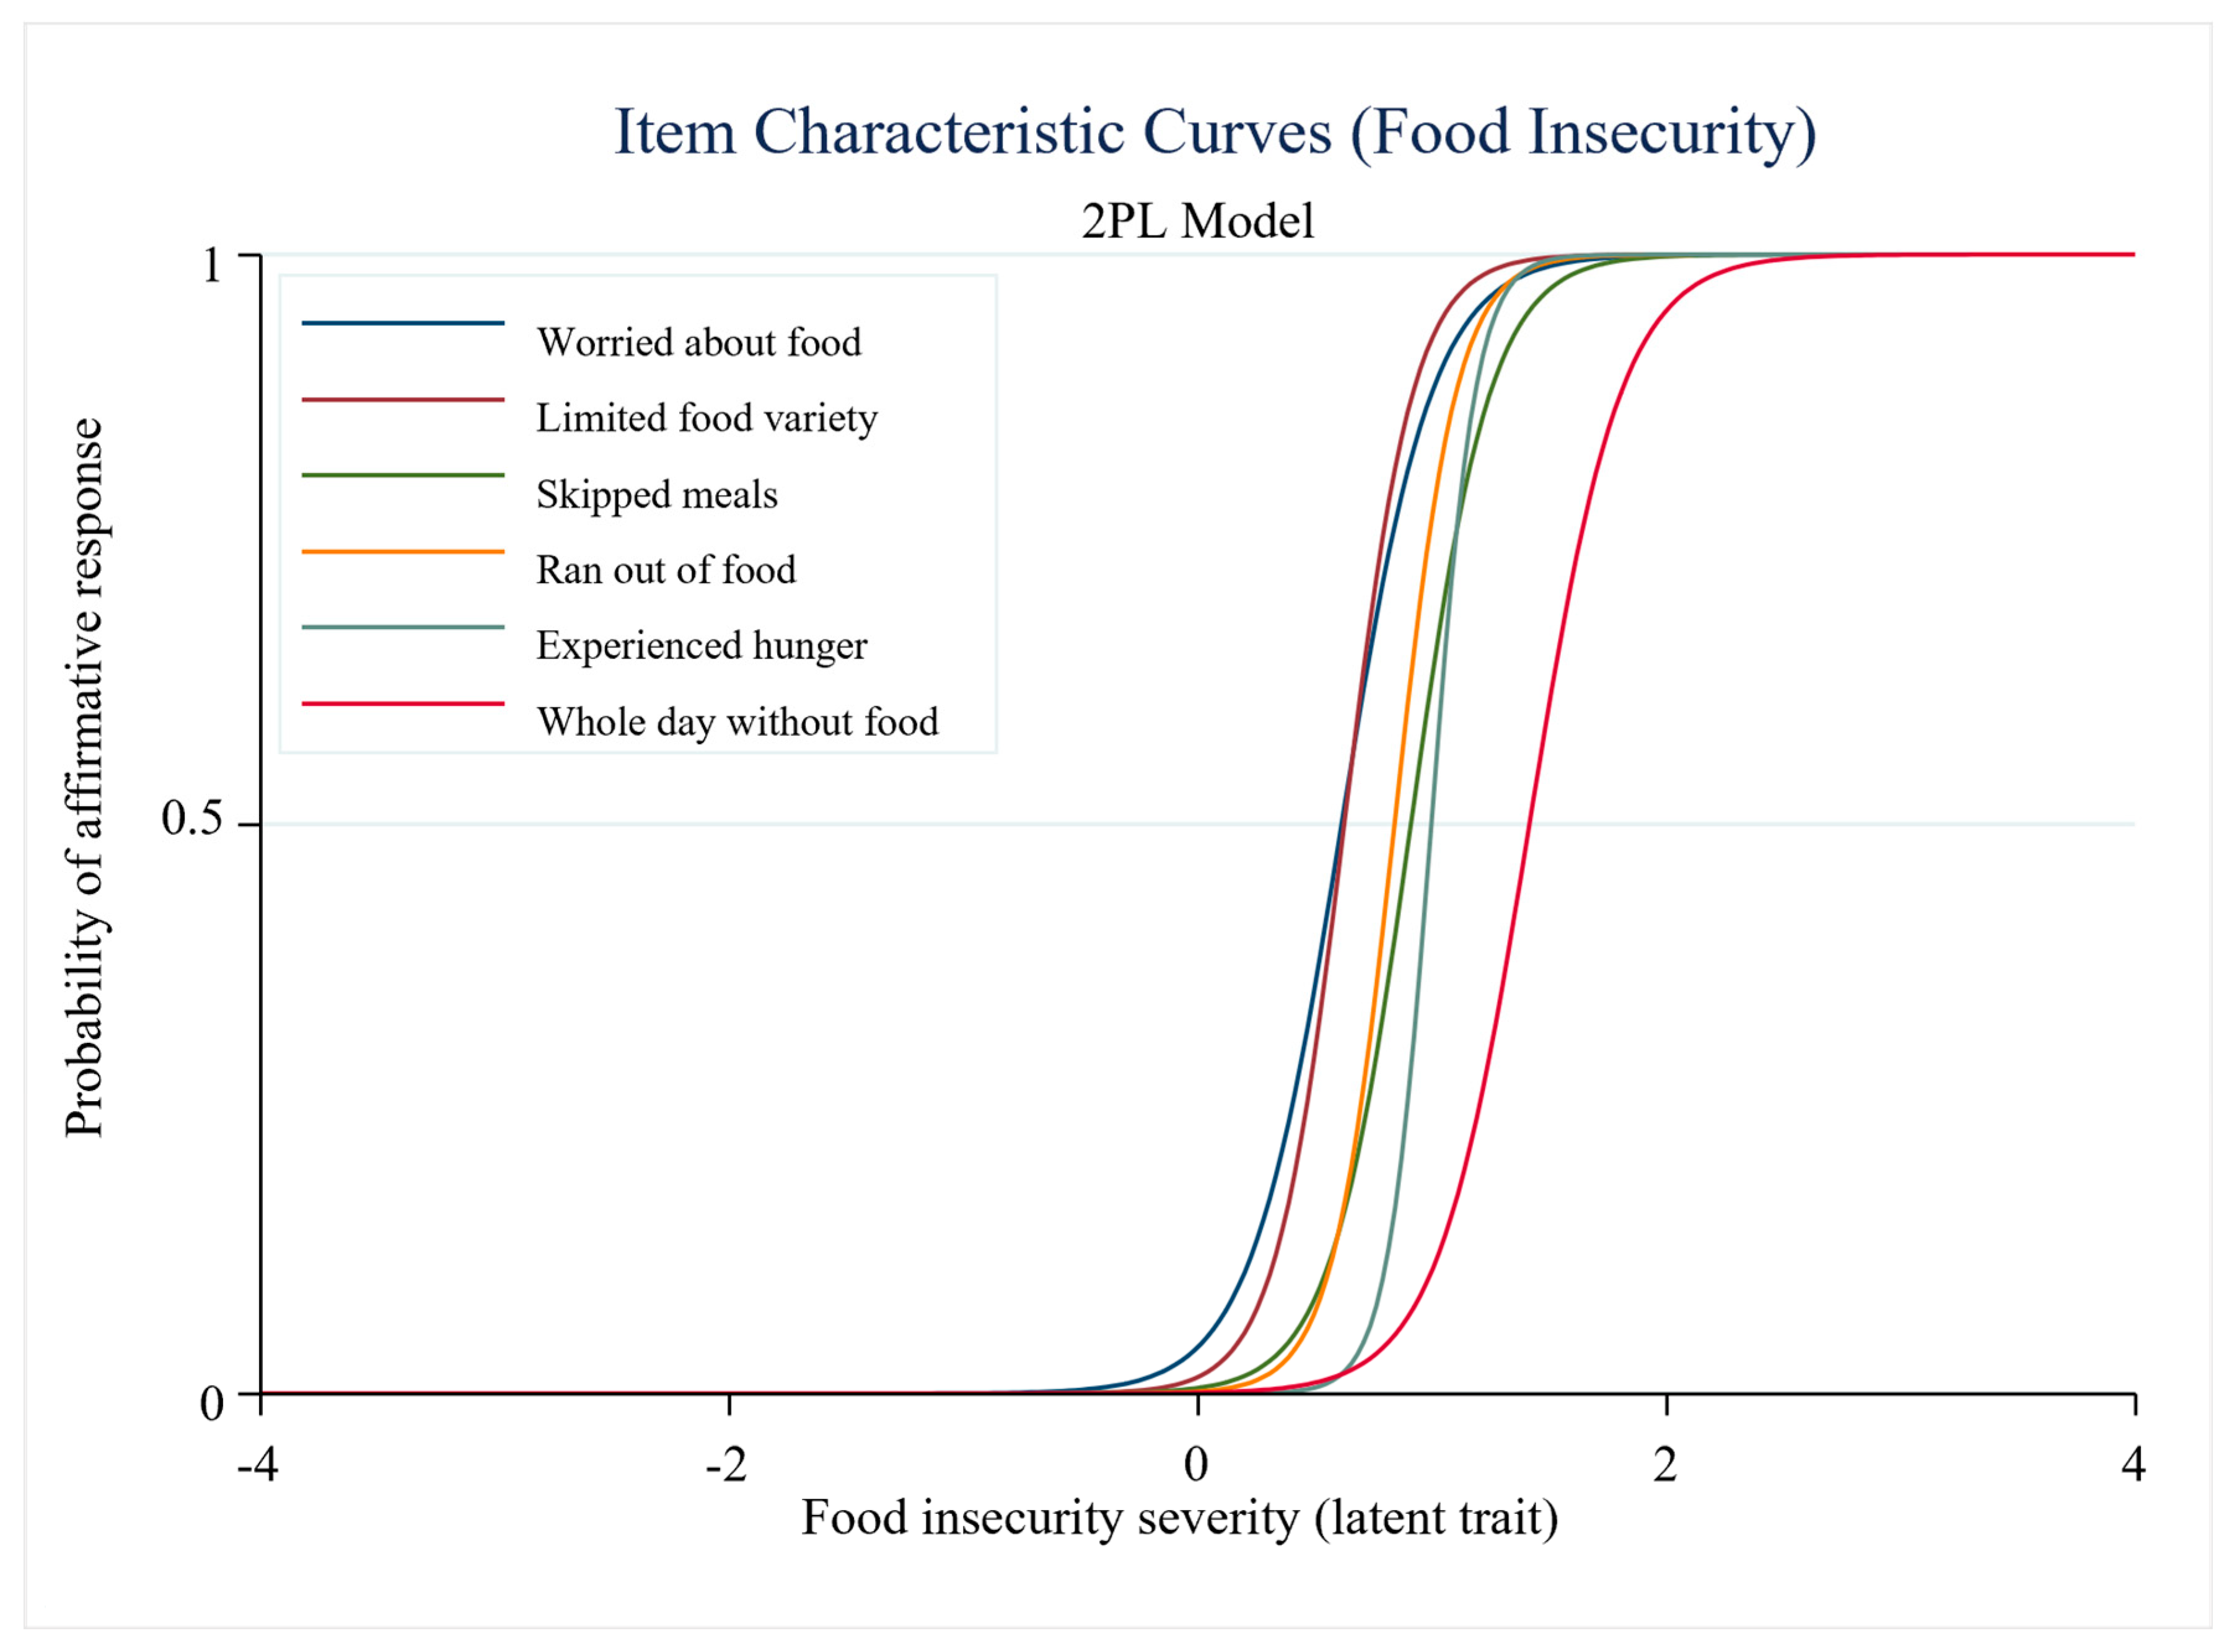
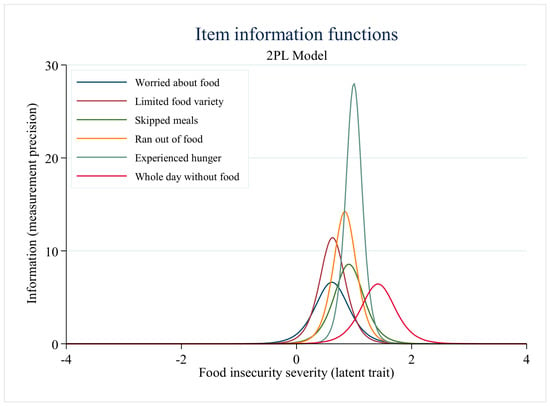
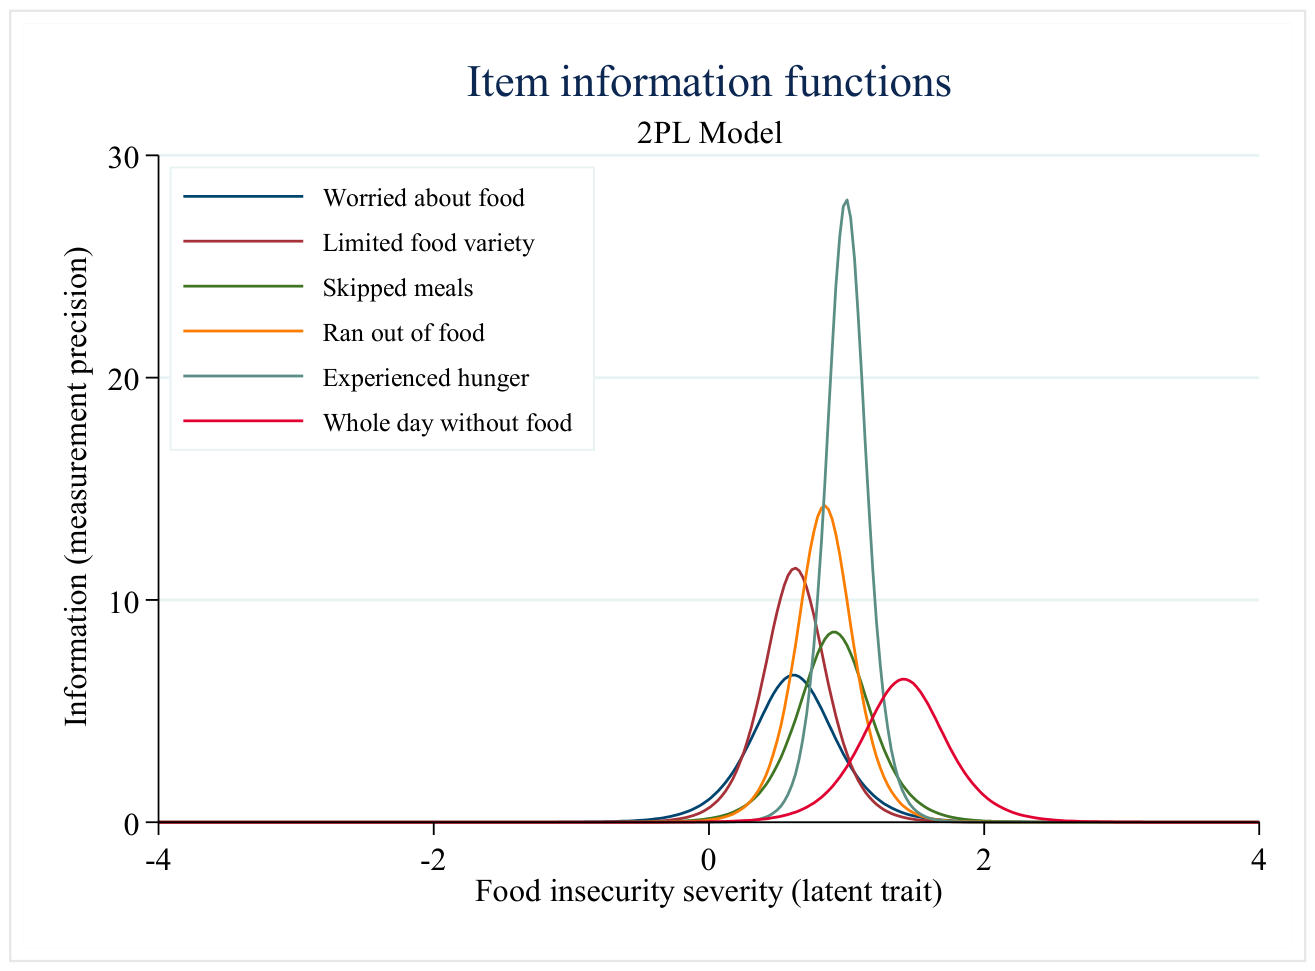
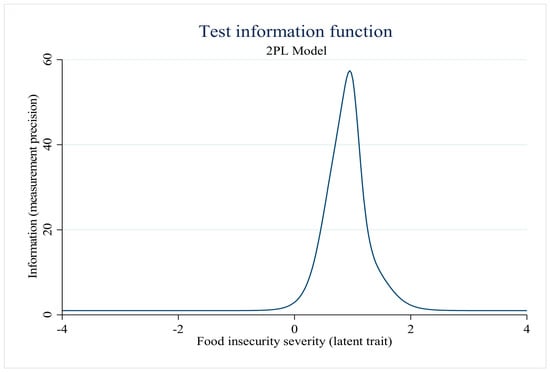
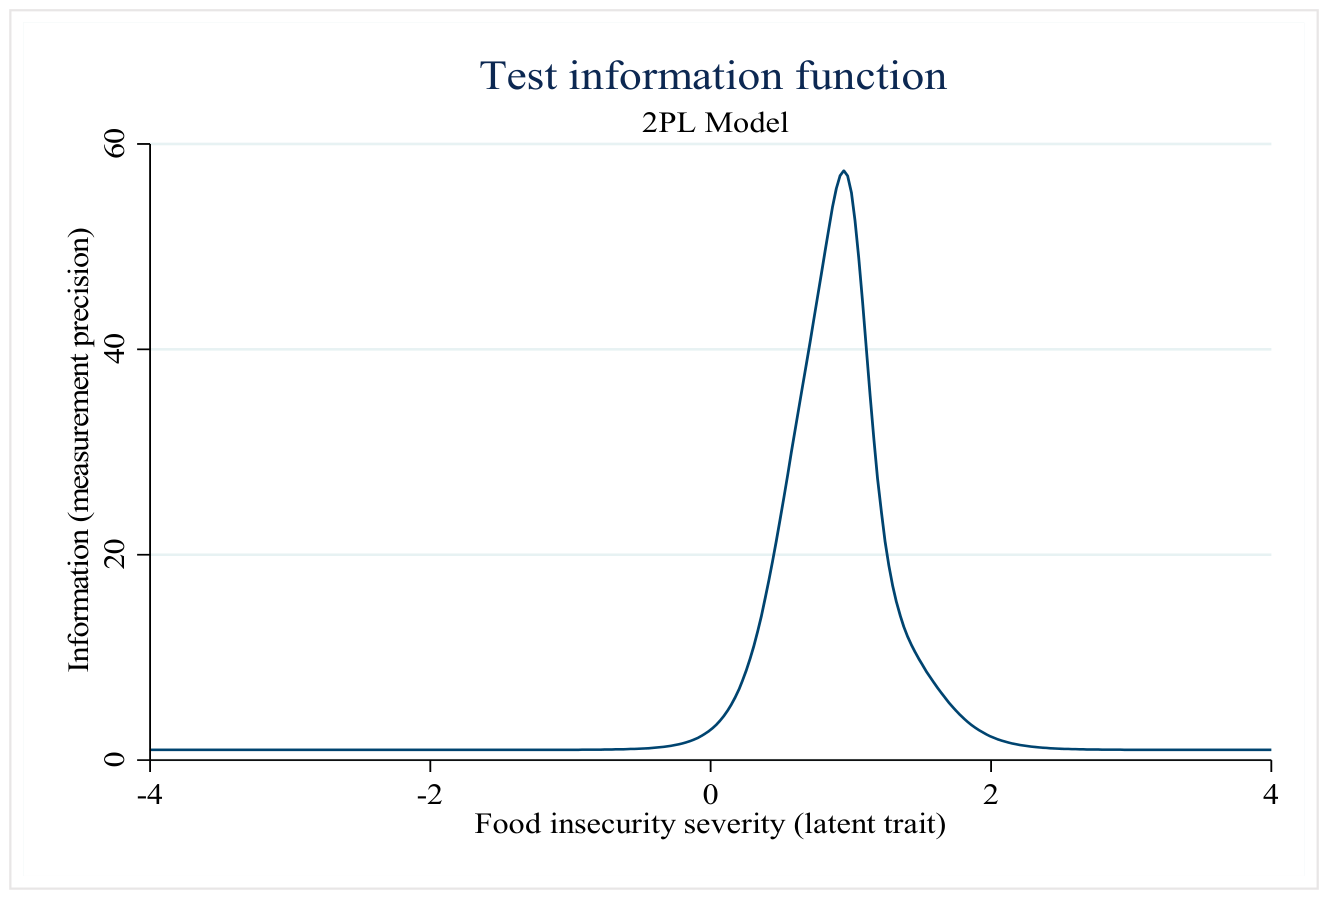
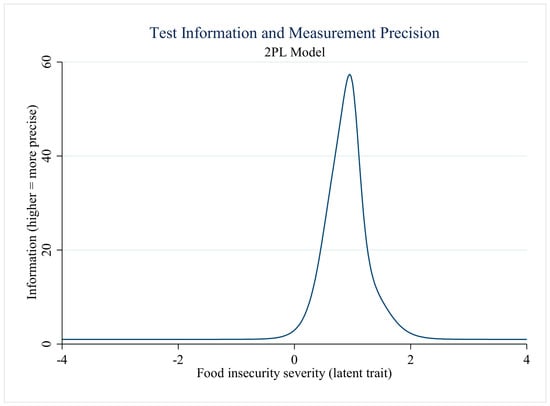
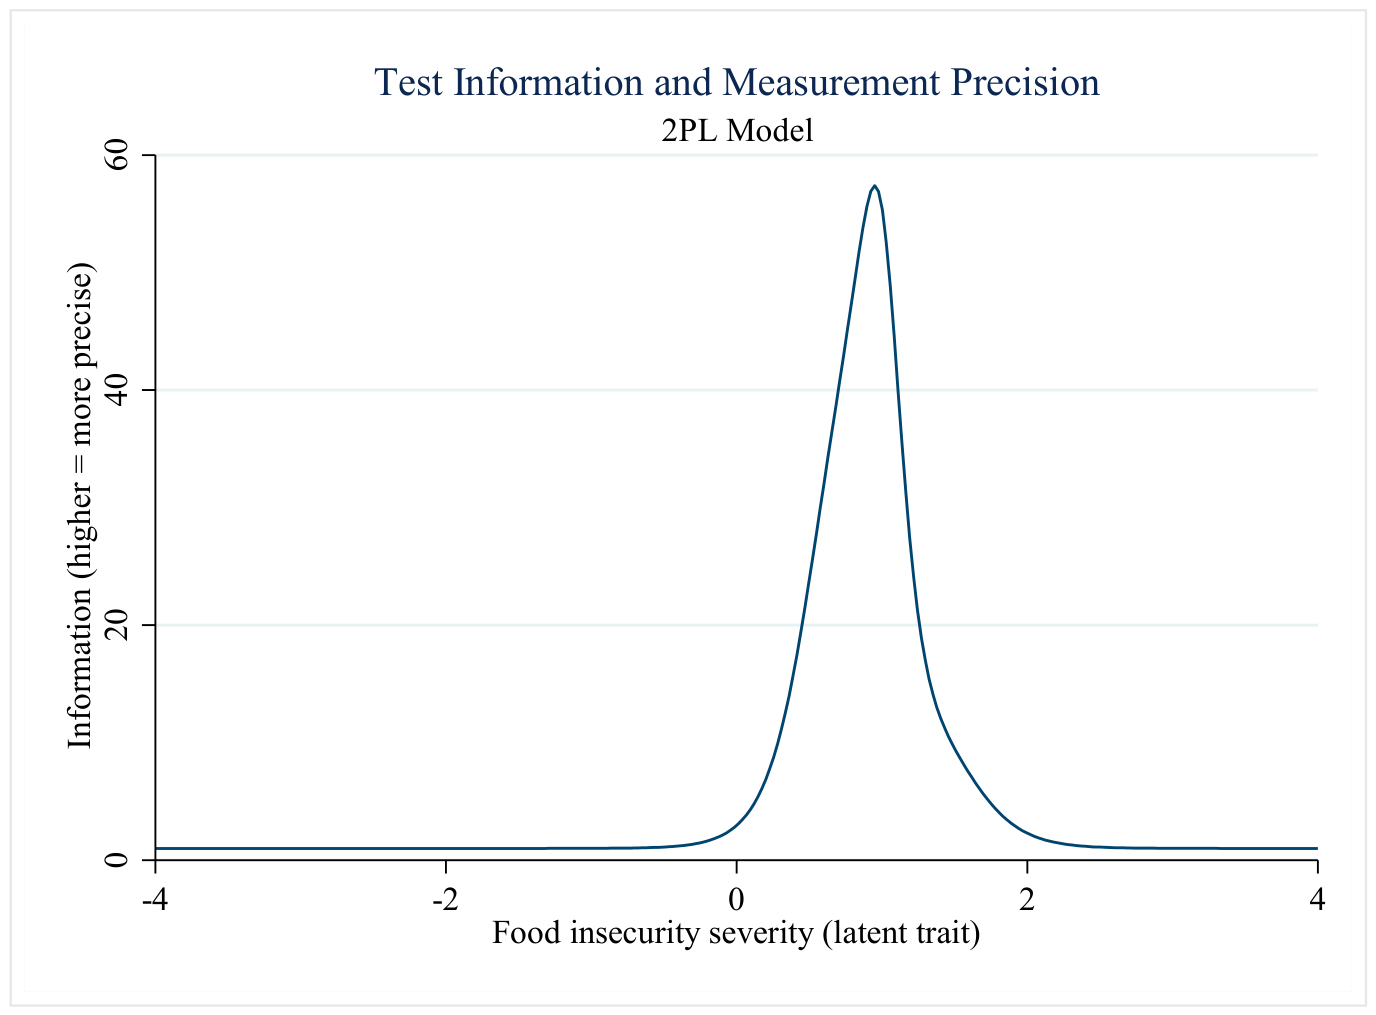

Disclaimer/Publisher’s Note: The statements, opinions and data contained in all publications are solely those of the individual author(s) and contributor(s) and not of MDPI and/or the editor(s). MDPI and/or the editor(s) disclaim responsibility for any injury to people or property resulting from any ideas, methods, instructions or products referred to in the content. |
© 2026 by the authors. Licensee MDPI, Basel, Switzerland. This article is an open access article distributed under the terms and conditions of the Creative Commons Attribution (CC BY) license.