


Abstract
This article examines why, across Central American countries, higher social public spending is not associated with lower inequality or narrower territorial development gaps, a pattern ECLAC describes as a structural “trap” in which inequality, stalled social mobility, and weakening community ties reinforce one another. A six-country panel (Guatemala, Honduras, El Salvador, Nicaragua, Costa Rica, and Panama) was built from World Bank, CEPALSTAT, and Icefi data for 2015–2024, combining a descriptive cross-country comparison with a critical–institutional reading grounded in ECLAC structuralism, the capabilities approach, and the political economy of fiscal capture. Results show a null correlation between social spending and the Gini index (r = −0.05) and a moderate negative association with poverty (r = −0.62), both descriptive and sensitive to the small number of countries. Honduras and Nicaragua, tied for the lowest per capita educational spending in the panel (approximately US$330 and US$336 in PPP terms, against US$1840 in Costa Rica), also register the weakest HDI outcomes—a pattern consistent with an institutional-architecture explanation or, more parsimoniously, spending volume itself; the descriptive design cannot adjudicate between them. Addressing it would plausibly require institutional and territorial reforms or increased per capita investment in Honduras and Nicaragua, depending on which explanation holds.
1. Introduction
Between 2015 and 2024, the six Central American countries analyzed in this article sustained markedly different levels of social public spending, ranging from 7.75% of GDP in Guatemala to 11.51% in Costa Rica, with a generalized regional surge in all six during the COVID-19 pandemic (Icefi (Instituto Centroamericano de Estudios Fiscales) 2021). A previous World Bank diagnosis had already pointed to the need for more efficient and better-targeted social spending in Central America (Acosta et al. 2017). Yet the region remains one of the most unequal in the world regardless of this variation, and except for Costa Rica and Panama, its countries sit in the medium-low tier of the global Human Development Index (HDI), with Honduras ranked 132nd out of 189 countries (UNDP (United Nations Development Programme) 2020). This coexistence, substantially different spending levels across countries paired with similarly high inequality in most of them, is the cross-sectional paradox that organizes this article.
The Economic Commission for Latin America and the Caribbean has recently proposed the image of a “trap” to name this phenomenon: a circle in which high levels of inequality, virtually stalled social mobility, and increasingly weak community ties reinforce one another, resisting the fiscal effort of the region’s states (ECLAC (Economic Commission for Latin America and the Caribbean) 2025). This article takes up that notion and applies it to the Central American case, with a particular emphasis on two dimensions that are rarely examined together: the aggregate distributive incidence of social spending and the territorial and educational inequality that such spending fails to correct.
This regional reading should not obscure the fact that the “trap” ECLAC (Economic Commission for Latin America and the Caribbean) (2025) describes for Central America echoes a broader pattern documented elsewhere: constrained educational access despite formal entitlements in Bangladesh (Alam 2026), persistent cross-country inequality trajectories toward Sustainable Development Goal 4 (Çelik et al. 2025), and critiques of spending-and-coverage indicators that substitute for institutional quality (Garnier 2026).
The question guiding this article is the following: why, across Central American countries, does a higher level of social public spending not correspond to a smaller territorial development gap? The thesis defended here is that higher social spending alone is not enough to break the inequality trap when it coexists with fiscal institutions captured by regional elites, weak decentralization, and historically inherited territorial fragmentation; the problem is not only how much is spent, but the institutional and political architecture that decides where and how it is spent.
To support this thesis, the article is organized as follows. Section 2 situates the topic within the recent literature on fiscal incidence, territorial inequality, and educational equity in Central America. Section 3 develops a five-pillar theoretical framework articulating ECLAC structuralism, the capabilities approach, the sociology of territorial fragmentation, the political economy of fiscal capture, and the sociology of education and curricular policy. Section 4 briefly describes the recent Central American fiscal context. Section 5 presents the mixed methodology employed. Section 6 presents the results of the comparative analysis, including a case study on public educational spending. Section 7 discusses the findings considering the theoretical framework, and Section 8 concludes with public policy implications and a future research agenda.
2. Literature Review
The search was executed in the TITLE-ABS-KEY field, combining terms related to fiscal incidence, public and social spending, and tax burden with terms related to poverty and income inequality, and, alternatively, terms related to territorial and spatial inequality and regional disparity with terms related to political economy and development traps. The reconstructed Boolean query was: TITLE-ABS-KEY((“fiscal incidence” OR “public spending” OR “social spending” OR “tax burden”) AND (poverty OR “income inequality”)) OR TITLE-ABS-KEY((“territorial inequality” OR “spatial inequality” OR “regional disparity”) AND (“political economy” OR “development trap”)).
The query, executed in July 2026, retrieved 292 documents (1977–2026), exported with full metadata (authorship, year, document type, institutional affiliation, author and index keywords, abstract, and citations). The field remains active: between 2024 and 2026, the database itself incorporated studies directly relevant to this article, such as the pan-Latin American analysis of fiscal incidence and poverty by Lustig et al. (2025), the examination of the redistributive effect of taxes and transfers by Claveria (2025), and the study of persistent territorial disparities despite public investment in Ecuador by Urbina Poveda et al. (2026), all cited later in the theoretical framework.
2.1. Temporal and Geographic Distribution
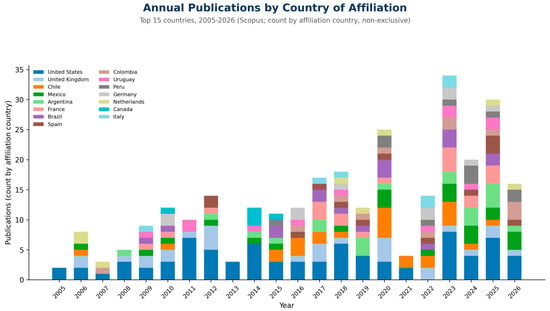
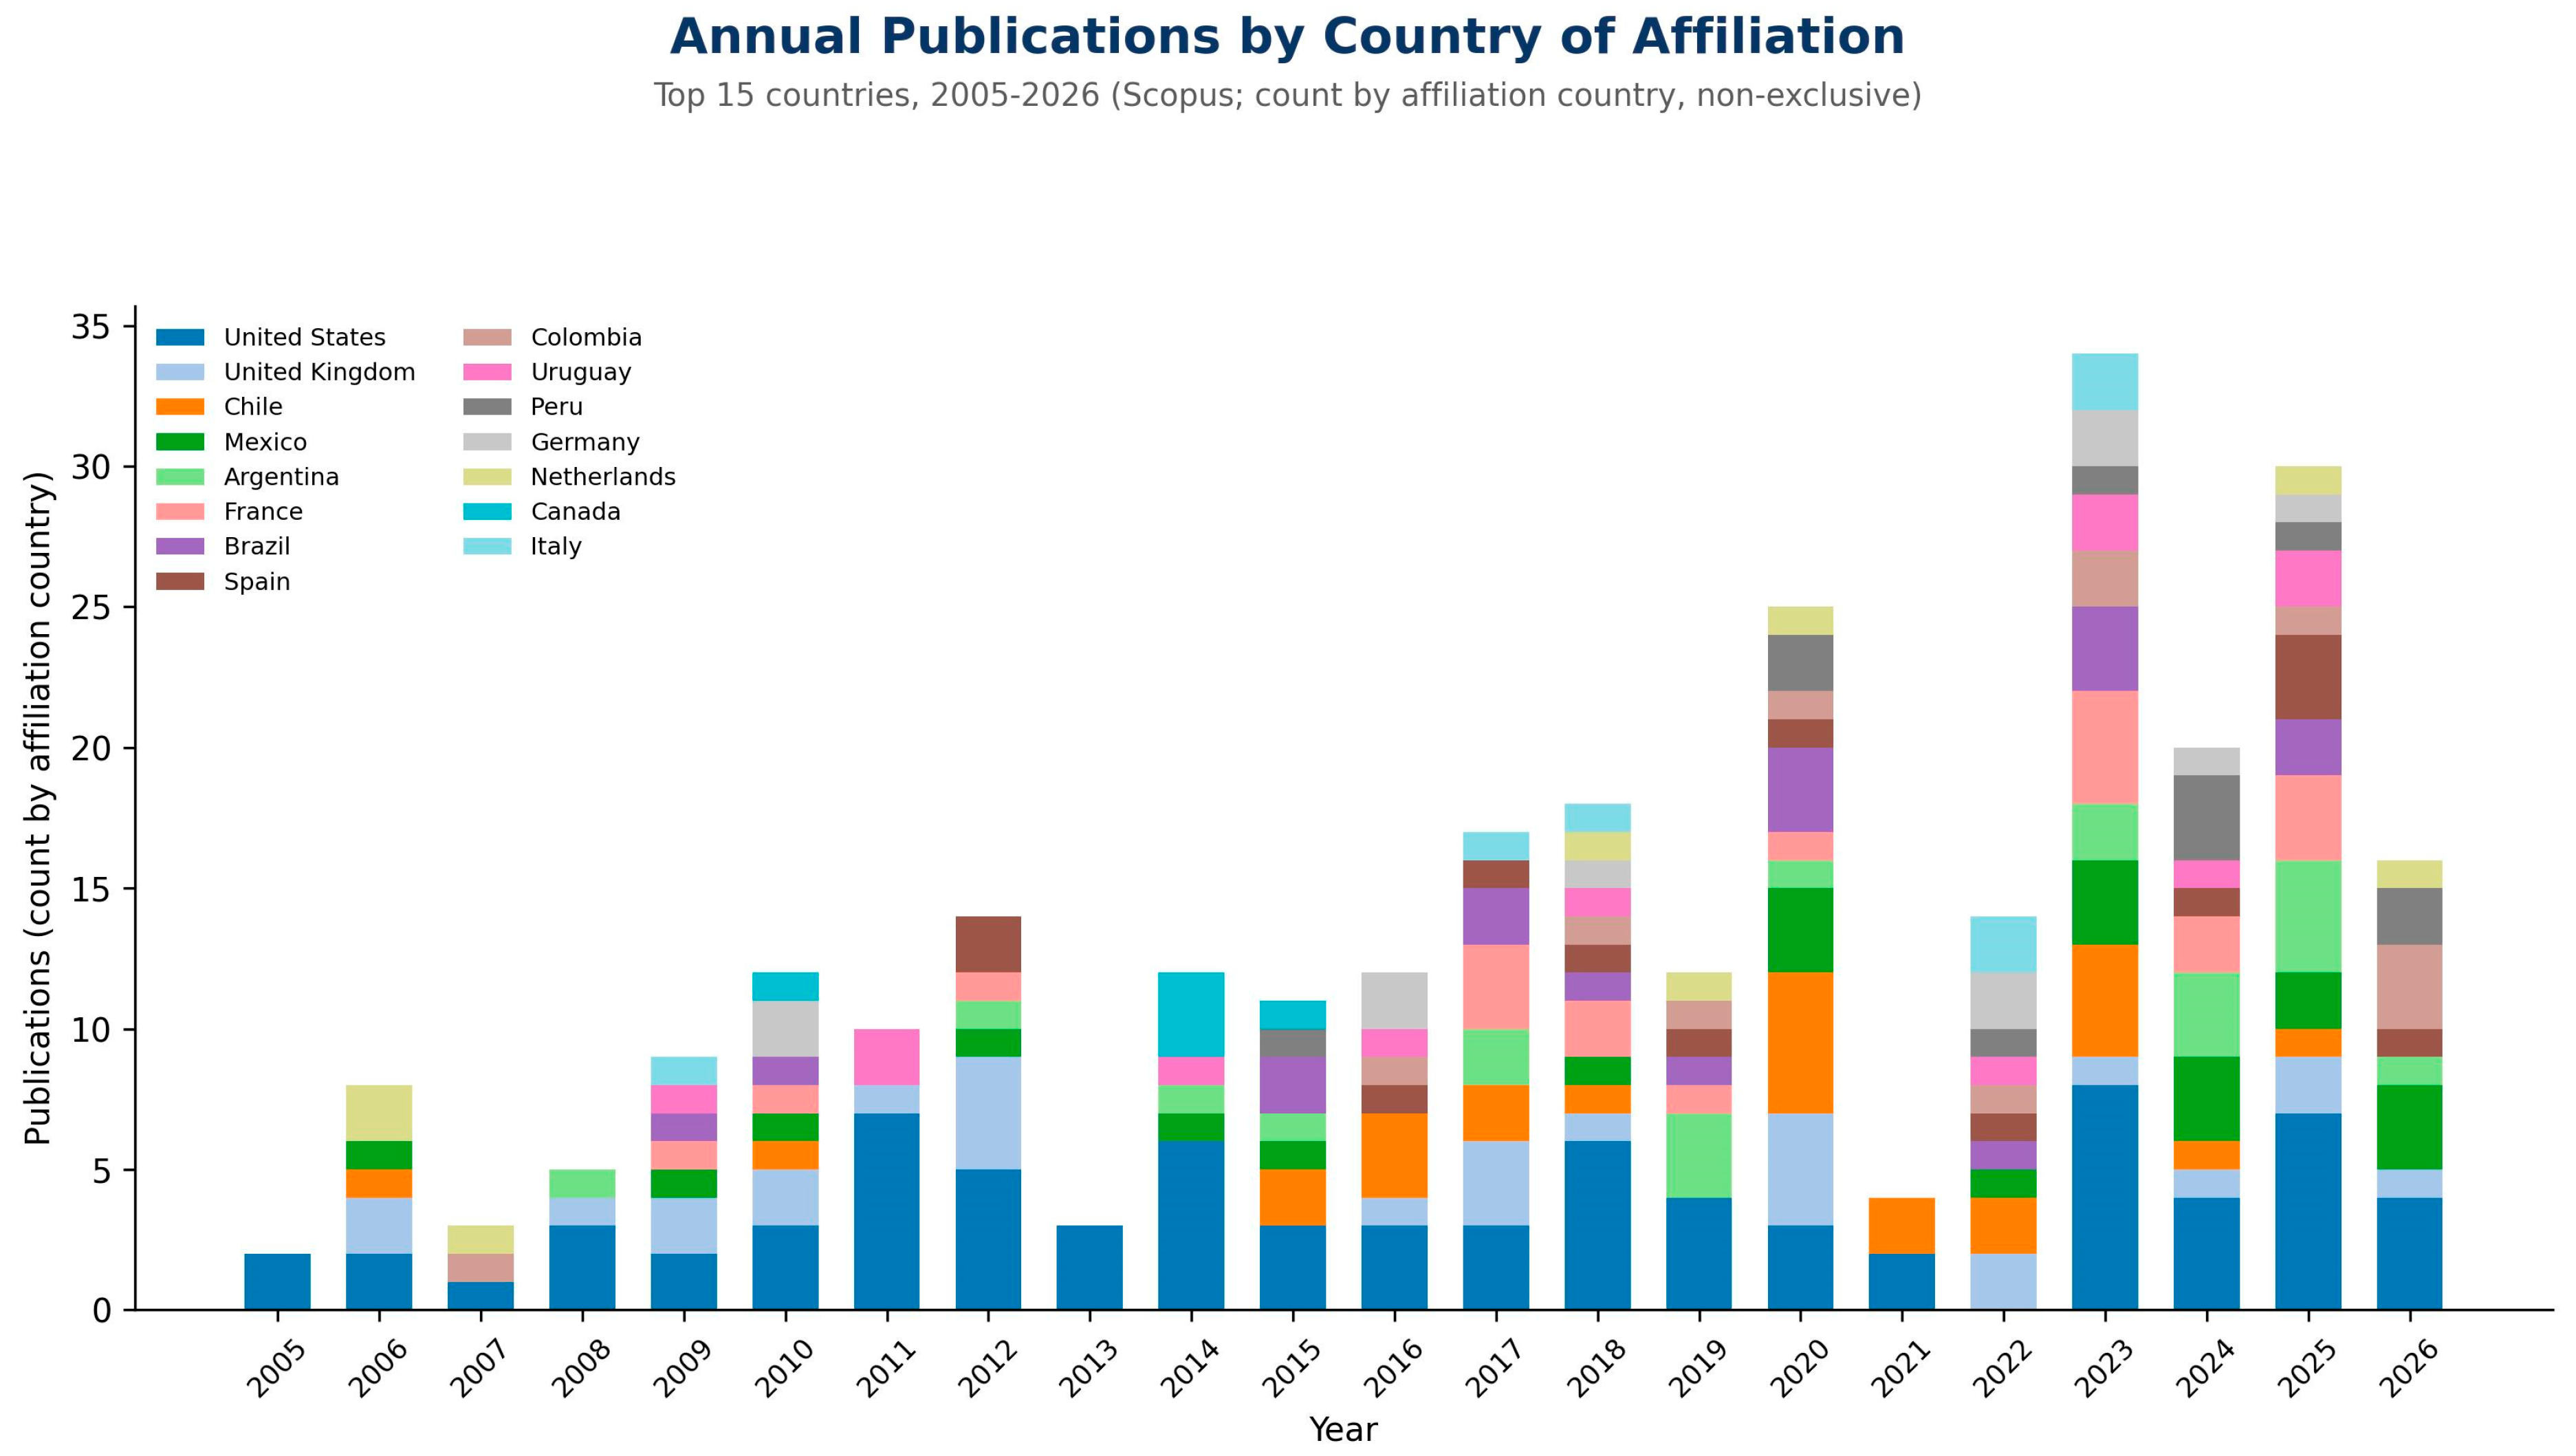
Figure 1 shows sustained growth in output, with a clear acceleration from 2017 onward (19 documents) and peaks in 2023 (26) and 2025 (20); 2026, with 13 documents as of the query date, suggests the trend continues. The United States and the United Kingdom concentrate the largest output by country of affiliation (90 and 32 documents, respectively), followed by a Latin American bloc led by Chile (27), Mexico (24), Argentina (21), and Brazil (18).
Figure 1.
Annual publications by country of affiliation, top 15 countries (Scopus, 2005–2026). Source: authors’ elaboration based on Scopus data (n = 292 documents).
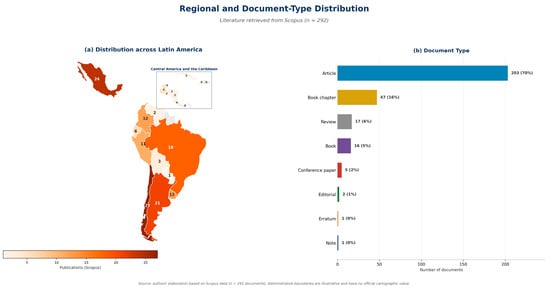
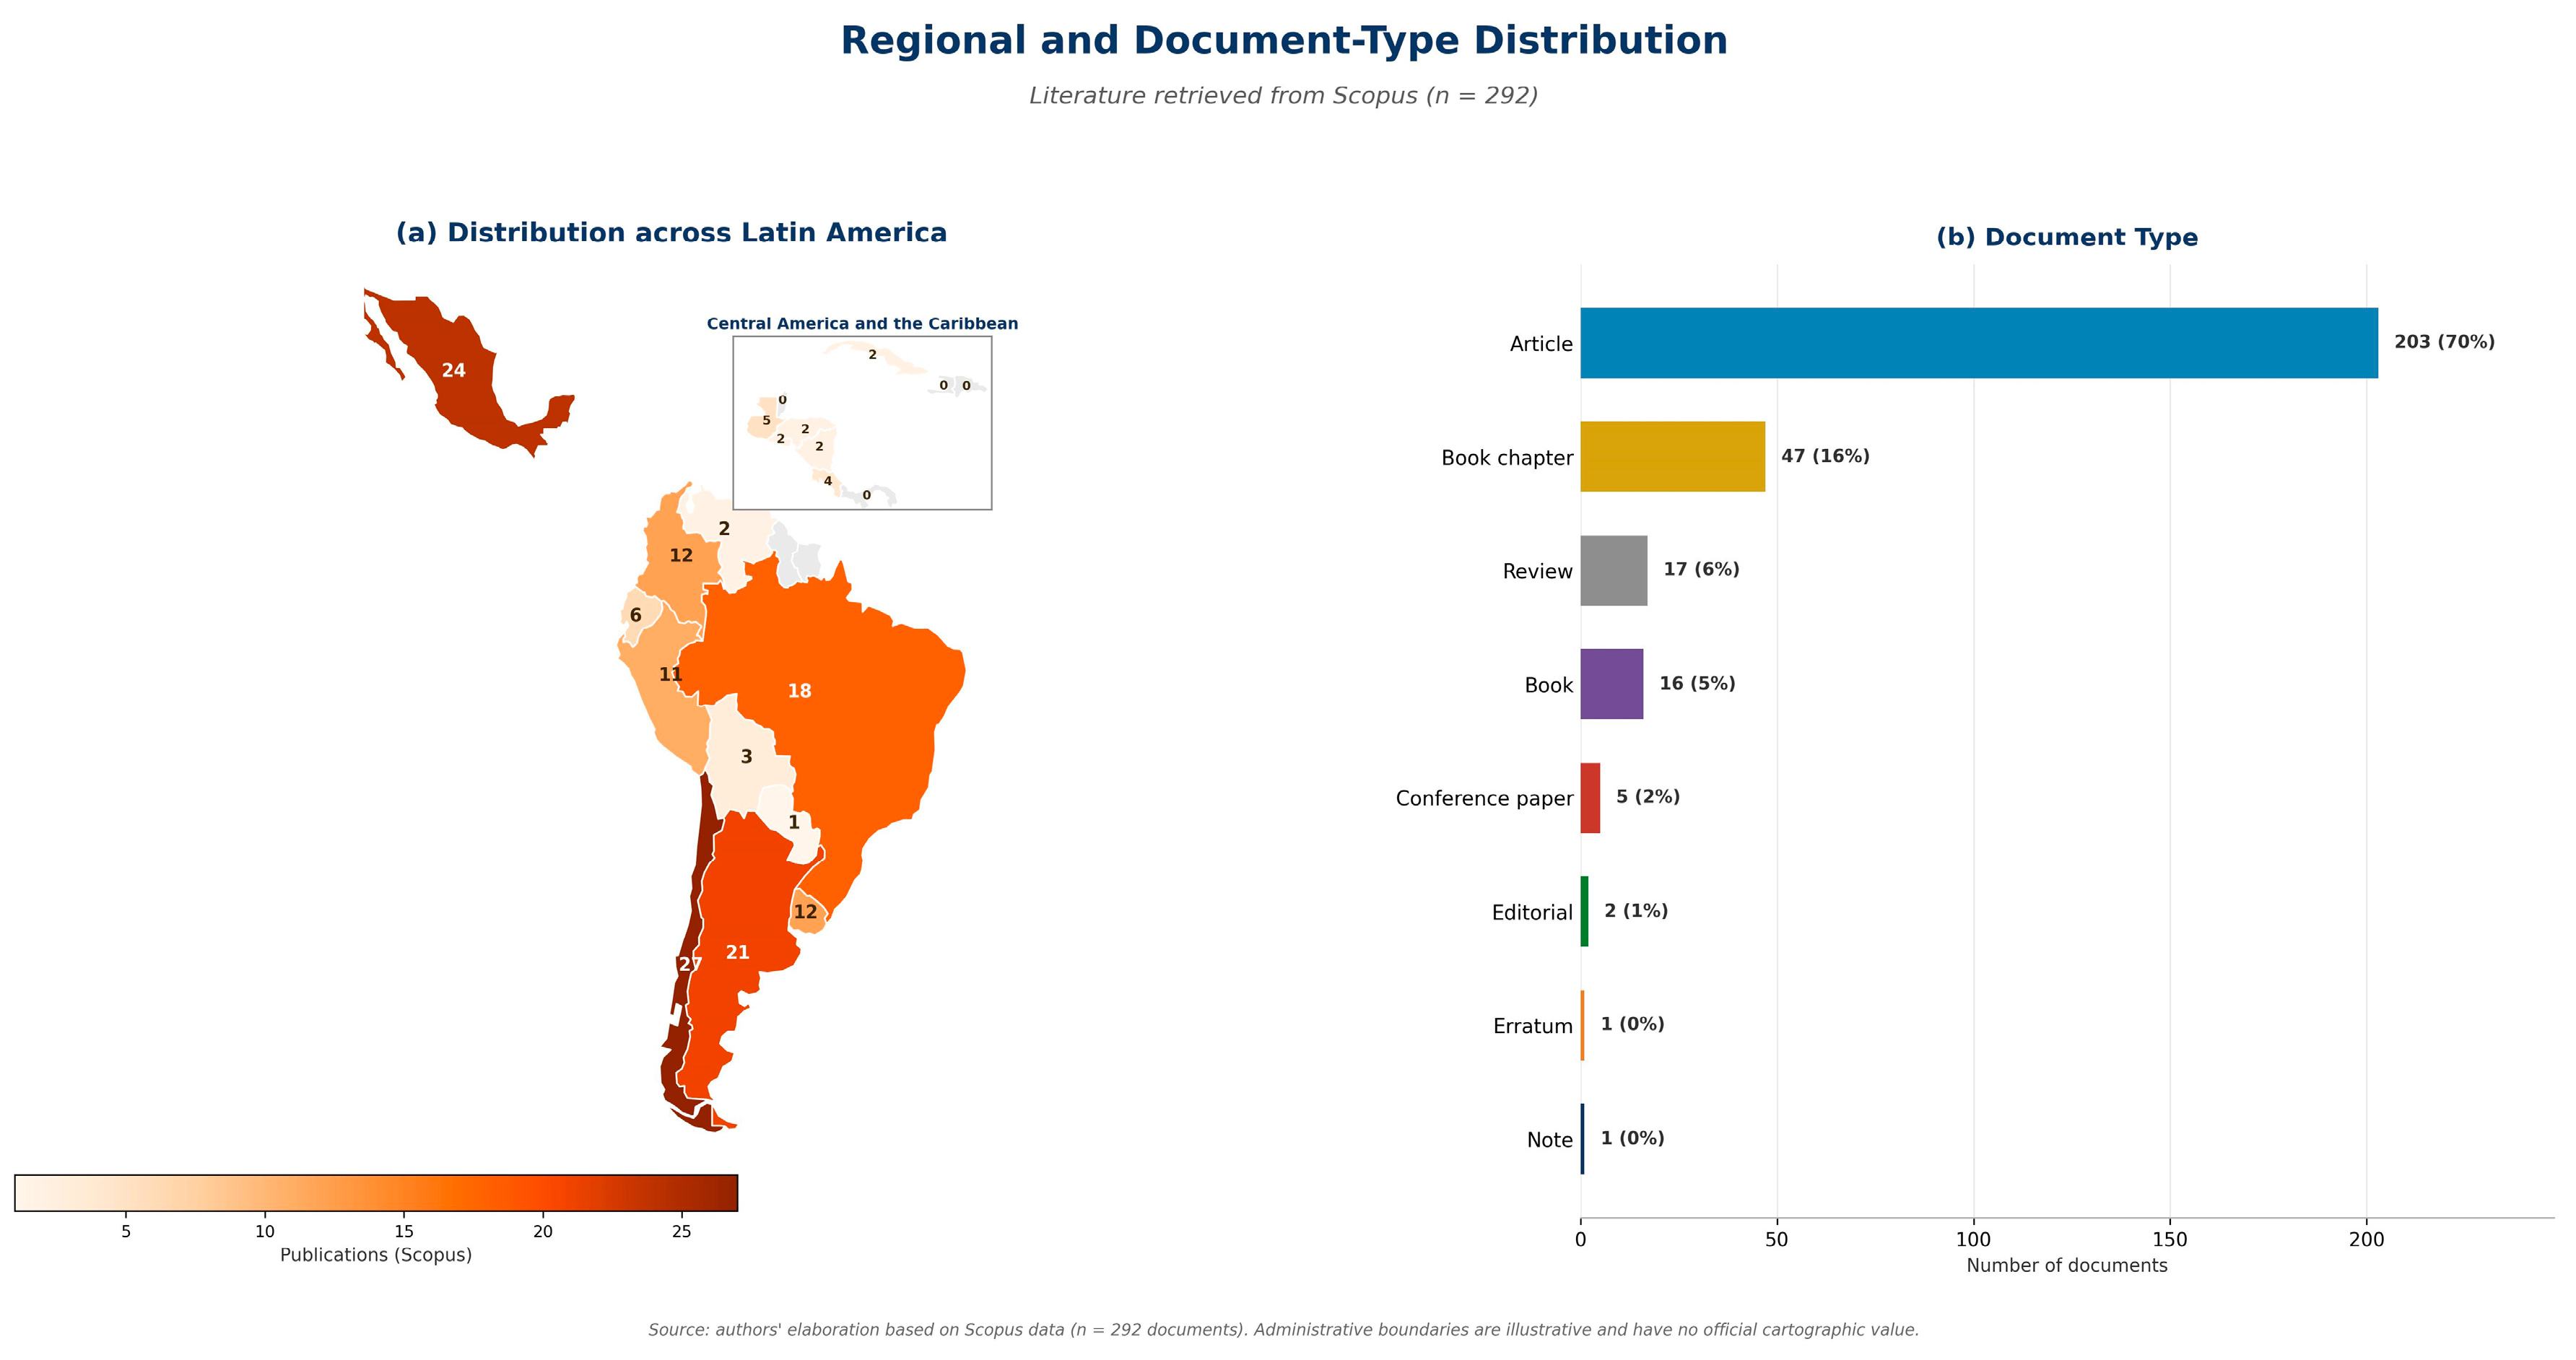
Figure 2 disaggregates this distribution within Latin America and by document type. Chile, Mexico, Argentina, and Brazil concentrate most of the regional output, while Central American countries appear only marginally: Guatemala (5 documents), Costa Rica (4), and Honduras, Nicaragua, and El Salvador (2 each). Journal articles dominate the corpus (203 of 292, 70%), followed by book chapters (47, 16%) and reviews (17, 6%), which supports the academic consistency of the documentary base.
Figure 2.
Distribution of output within Latin America and by document type (Scopus, n = 292). Source: authors’ elaboration based on Scopus data.
2.2. Keyword Map
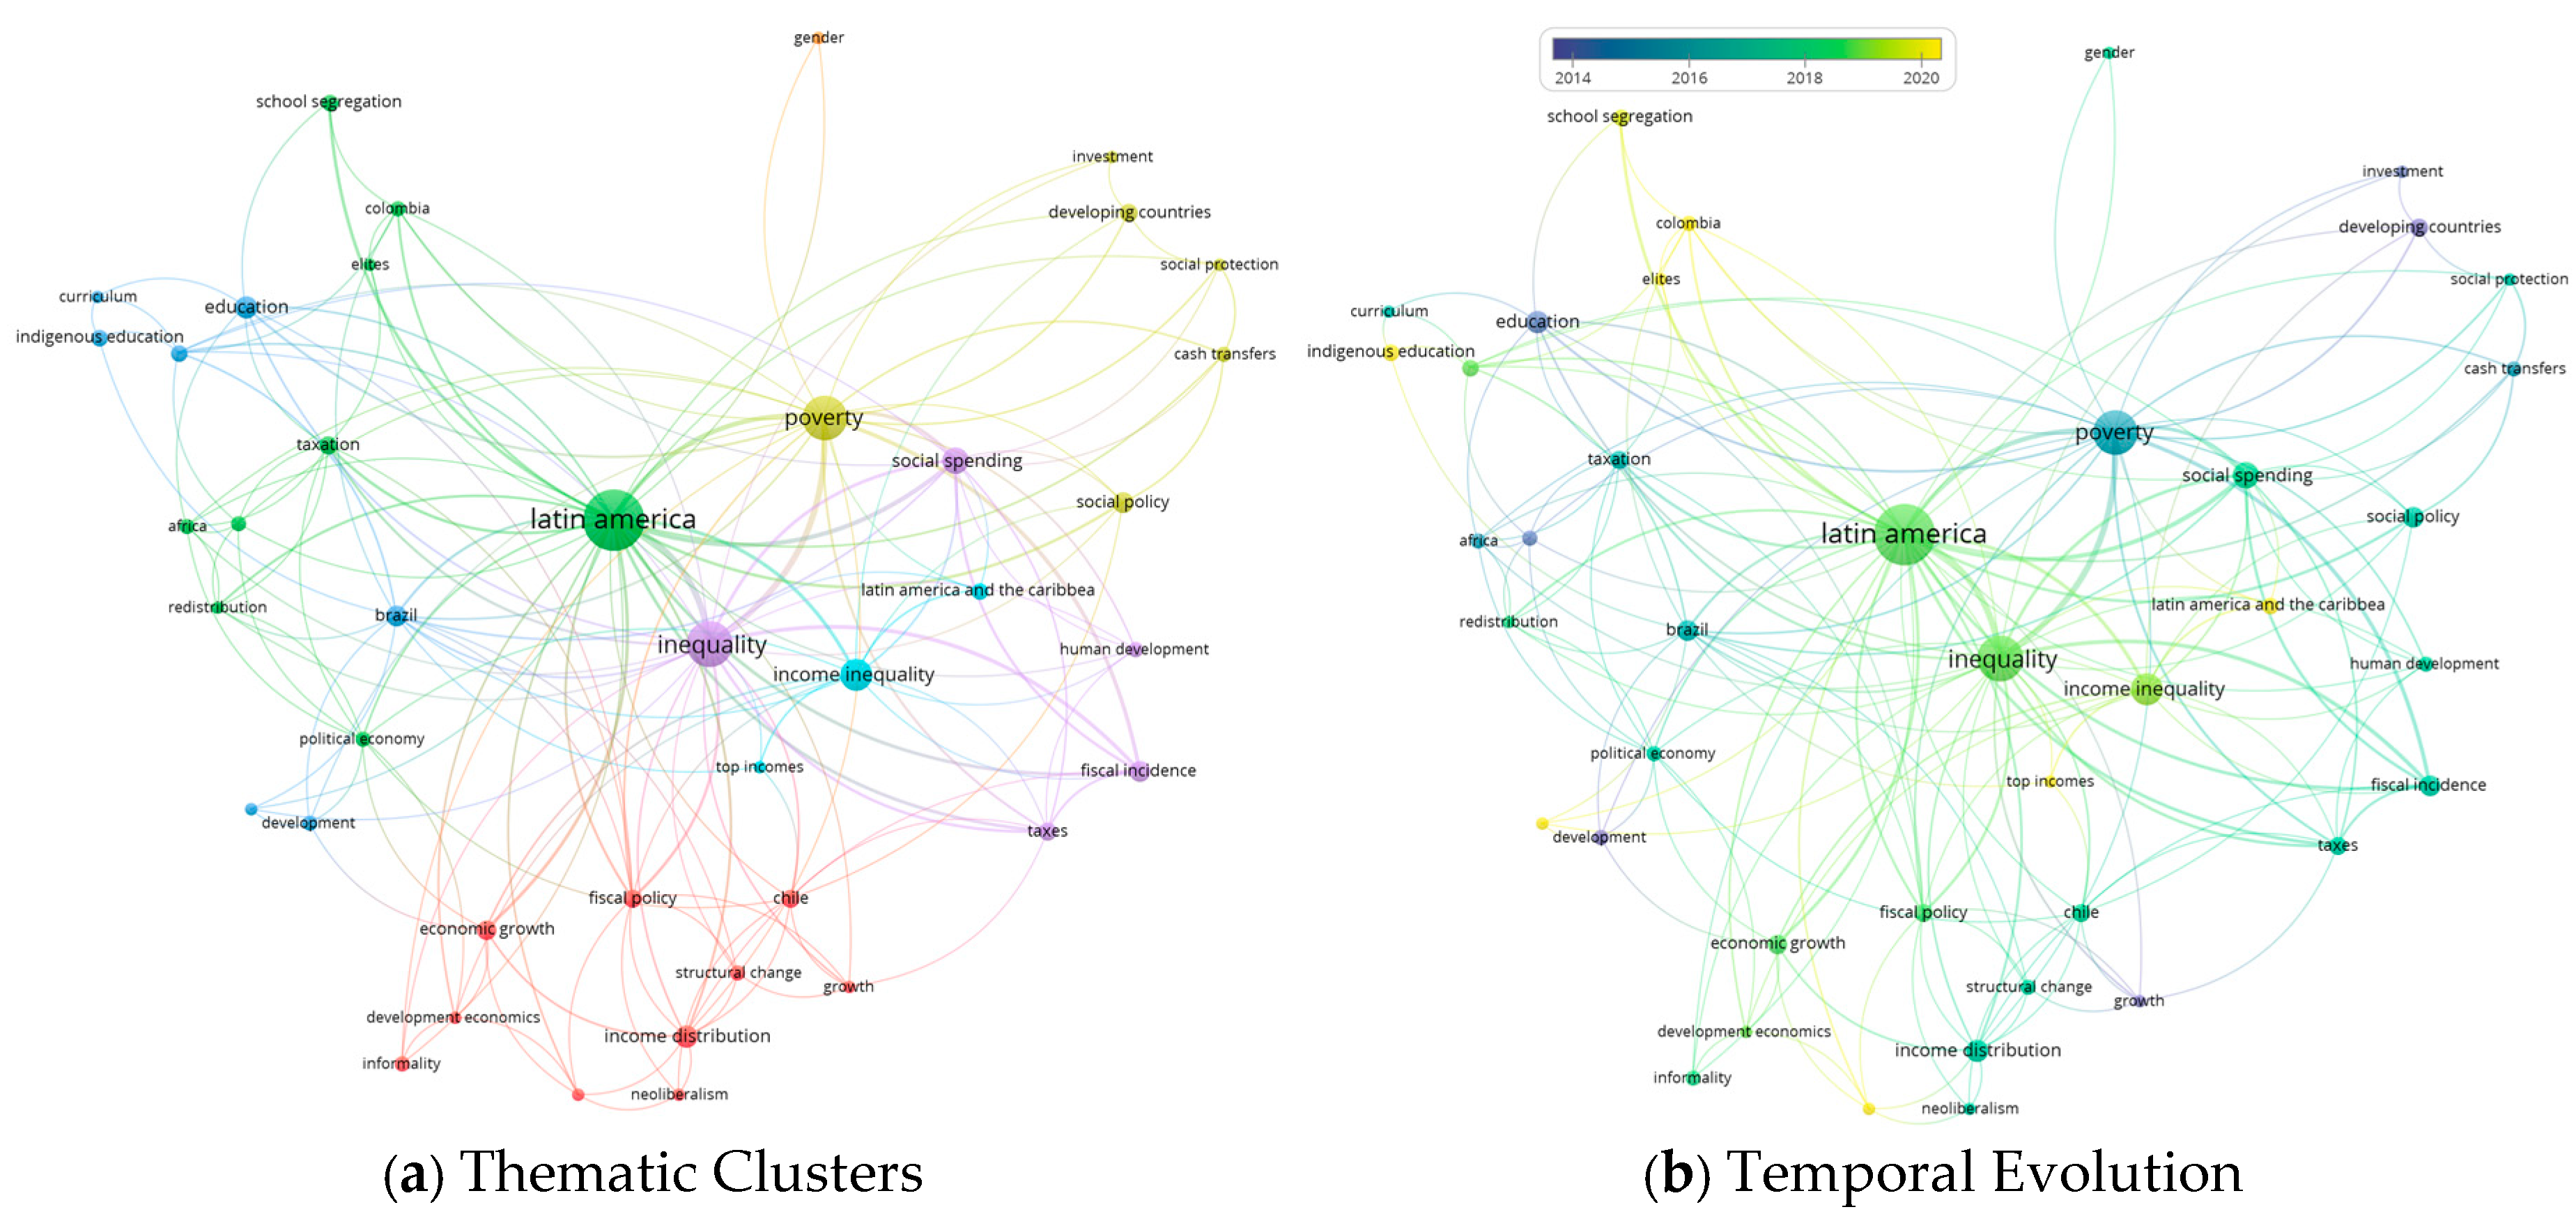
Of the 292 documents, 176 (60%) include author keywords. This subset was analyzed in VOSviewer version 1.6.21 (Van Eck and Waltman 2010) as a co-occurrence network of author keywords, full counting, with a minimum of three occurrences per keyword, yielding 41 keywords grouped by VOSviewer’s modularity-based clustering algorithm into seven clusters (Figure 3a). The dominant terms are “Latin America” (63 documents), “inequality” (35), “poverty” (33), and “income inequality” (18); on the fiscal-policy axis, “social spending” (12), “fiscal incidence” (8), and “taxation” and “taxes” (6 documents each, retained as distinct terms) stand out, and on the educational axis, “education” (9), “school segregation” (5), and “indigenous education” (5).
Figure 3.
Keyword map: (a) thematic clusters; (b) temporal evolution (Scopus author keywords, n = 176 documents, 41 keywords with ≥3 occurrences). Source: authors’ elaboration in VOSviewer based on Scopus data; clustering computed algorithmically by VOSviewer.
Figure 3b colors each keyword by its average publication year, allowing the evolution of the field to be read: terms such as “poverty reduction” (average 2024.7), “Colombia” (2022.8), and “elites” (2022.7) are the most recent, while “development” (2011.0), “developing countries” (2012.8), and “growth” (2013.3) correspond to the earliest stage of the literature. This suggests a gradual shift from aggregate economic growth toward a vocabulary more centered on institutional actors (elites) and specific countries, consistent with the expansion of country-level fiscal-incidence studies documented in the previous subsection.
2.3. The Gap This Article Addresses
A review of the 292-document corpus itself confirms the gap this article seeks to fill. Only nine documents mention Honduras in the title or abstract, and none cross fiscal incidence or social spending with that country; those that do mention it address topics unrelated to public spending (gangs, coffee farming, forestry policy, rural conservation strategies). Of the twelve documents mentioning “Central America” and the twelve mentioning “curriculum,” none (0 of 292) combine both terms: the intersection of public spending, Central American fiscal incidence, and curricular relevance is, strictly speaking, absent from the corpus retrieved from Scopus. This gap, not only thematic but empirically verified in the bibliometric database itself, is what this article addresses directly through the case study in Section 6.7.
The absence of a given term combination from this corpus indicates only that it has not been indexed under these specific descriptors, not that no relevant scholarship exists: grey literature and technical reports, such as those produced by Icefi and the CEQ Institute and cited throughout this article, fall outside Scopus’s indexing criteria. Accordingly, the novelty claimed here rests less on the absence of prior work in this particular database than on the specific integration of social spending, institutional architecture, territorial fragmentation, and educational relevance within a single comparative framework.
3. Theoretical Framework
The article draws on five complementary theoretical perspectives, not all of them originating within Latin American scholarship, that, read together, help explain why social spending alone does not break the inequality trap.
3.1. ECLAC Structuralism
The structuralist tradition inaugurated by Raúl Prebisch holds that Latin American underdevelopment is not a transitory stage toward convergence with the central economies, but the result of structural relations—center–periphery dynamics, deteriorating terms of trade, productive heterogeneity—that reproduce over time (Prebisch 1949). Celso Furtado extended this argument by showing that underdevelopment is a specific process, not simply a shortfall of resources or public spending (Furtado [1961] 1964). This pillar allows Central American social spending to be read not as an isolated variable, but as a policy embedded within an inherited productive and fiscal structure that conditions its distributive outcomes.
3.2. The Capabilities Approach
Amartya Sen’s capabilities approach shifts the question of development from income toward the expansion of people’s real freedoms: what they are able to be and do (Sen 1999). Martha Nussbaum refined this perspective into a list of central capabilities, among them education and social affiliation, that states must guarantee as a minimum threshold of justice (Nussbaum 2011). This is the same framework that ECLAC (Economic Commission for Latin America and the Caribbean) (2025) itself invokes to characterize development as multidimensional. In this framework, income functions as a means toward capabilities rather than as a capability in itself, and poverty is more precisely understood as a deprivation of basic capabilities than as a simple shortfall of income (Sen 1999).
3.3. Territorial Fragmentation and Segregation
Rubén Kaztman showed that Latin American inequality is not only distributed among individuals but becomes “territorialized”: the urban and rural poor become isolated in spaces with less access to services, more homogeneous social networks, and fewer quality educational opportunities, which renders inequality self-reproducing across generations (Kaztman 2001). A fiscal-incidence exercise applied to Guatemala documents this ethno-territorial fragmentation: when the impact of social spending is decomposed by ethnic group, the indigenous population consistently receives less redistributive benefit than the rest of the population (Cabrera et al. 2015). This dynamic is not exclusive to Central America: the International Monetary Fund (IMF) has documented that fiscal policy explains a substantial part of the persistence of regional disparities in middle- and low-income economies (Gbohoui et al. 2019); comparative evidence from Germany likewise shows that regional infrastructure can offset, but does not eliminate, the effect of family background on life-course opportunities (Weßling 2023). Recent evidence for Ecuador confirms that sustained public investment alone is not enough to close territorial disparities when cantons start from very different initial development levels, an “infrastructure paradox” conceptually close to the trap documented here for Central America (Urbina Poveda et al. 2026). This concept is central to this article because it shifts the analysis from “how much each country spends” toward “where and for whom” it is spent within each country, a dimension that national social-spending averages tend to obscure.
3.4. The Political Economy of Fiscal Capture
Juliana Martínez Franzoni and Diego Sánchez-Ancochea have documented that Central American welfare regimes combine a formal expansion of social programs with de facto segmentation that disproportionately benefits formal and urban sectors (Martínez Franzoni and Sánchez-Ancochea 2016). Along the same lines, Aaron Schneider has shown how the construction of Central American states and their tax regimes has been historically and persistently conditioned by pacts with economic elites that limit the redistributive capacity of spending (Schneider 2012). Icefi (Instituto Centroamericano de Estudios Fiscales) (2021, pp. 19–20) itself argues, in an assessment of two centuries of regional fiscal history, that incumbent authorities and the economic groups that have benefited from this arrangement share underlying interests: both actors tend to defend a growth model that does not jeopardize their relative position, and both agree that the prevailing institutional design allows them to preserve their privileges and their share of power.
This pillar explains why increased spending does not necessarily alter the power structure that decides its territorial and sectoral allocation. This reading is consistent with recent evidence showing that, on the Latin American average, taxes and cash transfers have a considerably weaker redistributive effect than in developed economies, reinforcing the institutional-capture hypothesis over one of simple spending insufficiency (Claveria 2025).
3.5. The Sociology of Education and Curricular Policy
The fifth pillar, contributed from the specialization in Pedagogical Sciences of one of the co-authors, holds that public educational spending is the component of social spending where the territorial inequality trap becomes most concrete and measurable: financing more years of schooling is not enough if the curriculum, materials, and teacher training do not engage with the cultures, languages, and productive needs of rural and indigenous territories (López 2005; CEPAL-UNESCO 2020); comparable curriculum-analysis work outside the region confirms that formal curricula frequently fail to engage explicitly with socioeconomic inequality even when the subject matter would allow it (Abril-López et al. 2020). Recent regional learning assessments confirm that these relevance gaps translate into systematically lower outcomes for students in rural and indigenous contexts (Näslund-Hadley and Alonzo 2024). This pillar is developed empirically in Section 6.7 through the case study of Central American educational spending.
4. Central American Context
The recent fiscal trajectory of Central America helps situate this article’s results. Icefi (Instituto Centroamericano de Estudios Fiscales)’s (2021, pp. 40–41) estimates show that the region’s tax revenues equaled 14.0% of GDP in 2019 and fell to 13.3% in 2020, with a recovery projected to reach only 13.6% in 2021, while central government spending moved in the opposite direction: from an average close to 18.8% of GDP in the 2018–2019 biennium to 21.8% in 2020. In other words, Central American states expanded their spending exactly as their revenue collection was contracting, a combination that strains the fiscal sustainability on which social spending itself depends over the medium term.
El Salvador’s case illustrates the pattern with particular clarity: its public spending jumped from 22.2% of GDP in 2019 to 30.1% in 2020 due to the rollout of emergency programs—cash transfers, basic food baskets, salary increases for health personnel—in response to the pandemic (Icefi (Instituto Centroamericano de Estudios Fiscales) 2021, p. 41). This jump is reflected in the social-spending panel used in this article (see Section 6.5), but as argued in the discussion, a cyclical expansion of spending is not equivalent to a structural correction of territorial inequality. This pattern of emergency-driven, cash-transfer-centered expansion is consistent with the broader familialist trend documented across Latin American social protection systems, where transfers to poor households have expanded faster than the structural coverage of care and social services (González 2015).
In terms of human development, UNDP (United Nations Development Programme) (2020) classified Costa Rica (HDI = 0.810; rank 62 of 189) and Panama (HDI = 0.815; rank 57) in the “Very High Human Development” category, while Guatemala (HDI = 0.663; rank 127), Honduras (HDI = 0.634; rank 132), El Salvador (HDI = 0.673; rank 124), and Nicaragua (HDI = 0.660; rank 128) were placed in “Medium Human Development.” This gap is consistent with the difference in GDP per capita in the panel built for this article (from US$2224 in Nicaragua to US$16,138 in Panama) and forms the backdrop against which the comparative results in Section 6 are interpreted.
5. Materials and Methods
The article employs a mixed design with two complementary components, consistent with the aim of combining quantitative rigor with a critical–institutional reading typical of Latin American social science.
5.1. Quantitative Component: Descriptive Cross-Country Comparison of Social Spending and Socioeconomic Outcomes
A cross-country dataset of six Central American countries (Guatemala, Honduras, El Salvador, Nicaragua, Costa Rica, and Panama; on the exclusion of Belize, see below) was built from secondary aggregate sources. This is a descriptive cross-country comparison of social public expenditure and socioeconomic outcomes, not a fiscal-incidence analysis in the technical sense used by the Commitment to Equity (CEQ) Institute, which allocates specific taxes, transfers, subsidies, and in-kind benefits across household income deciles to construct pre- and post-fiscal income concepts (Lustig et al. 2014, 2025); no household-level microdata are used here, and no such allocation is performed in this article. The CEQ and Icefi fiscal-incidence literature is cited throughout as the analytical tradition that motivates the variables examined, not as the method applied. The following variables were compiled (Table 1); each averaged over the years actually available per source within 2015–2024:
Table 1.
Variables and data sources.
For transparency: GDP per capita and the Gini index are averaged over all years with available data in 2015–2024 (World Bank, World Development Indicators); the national poverty rate is averaged over the same window; total and functional social spending are averaged over 2015–2023, the years for which CEPALSTAT’s public series (indicator 3127) is complete; and the HDI position and average years of schooling correspond to single reference years (2020 and 2021, respectively) rather than a multi-year average, since UNDP reports these as point-in-time indicators. Because these series do not share an identical reference window, and because CEPALSTAT’s institutional coverage of health and social-protection spending is not fully uniform across countries, cross-country comparisons of spending levels should be read as approximate rather than strictly synchronized. The six-country sample follows the regional coverage used by Icefi’s own Central America Macrofiscal Profiles, the source for the contextual fiscal indicators used here; Belize, while a member of the Central American Integration System, is not included in that series and is excluded from this analysis for consistency with the fiscal data source, not for substantive reasons.
With these data, country averages, Pearson correlations between pairs of key variables, and a quadrant chart combining four variables (social spending, Gini, poverty, and GDP per capita) were calculated to describe each country’s position relative to the sample means on these four variables. All calculations and figures were produced in R version 4.5.3 (R Core Team 2026). Given the small number of countries, a leave-one-out sensitivity check was additionally performed on the correlation between social spending and the Gini index, recalculating the coefficient after excluding each country in turn (reported in Section 5.3 and Section 6.2).
5.2. Qualitative–Critical Component
The quantitative comparison was complemented with an interpretive reading of a defined secondary corpus: Icefi (Instituto Centroamericano de Estudios Fiscales)’s (2021) regional fiscal-political-economy assessment, and the sociology-of-education sources cited in Section 3.5 (López 2005; CEPAL-UNESCO 2020; Abril-López et al. 2020; Näslund-Hadley and Alonzo 2024). This reading does not follow a formal qualitative coding protocol; it is used to interpret the case study of public educational spending (Section 6.7) against the theoretical framework developed in Section 3, attending specifically to curricular relevance and the territorial and indigenous targeting of spending. Framed this way, the study’s qualitative component is an interpretive, theory-guided reading of a defined secondary literature rather than an independent empirical method with its own corpus, sampling frame, and coding procedure.
5.3. Methodological Limitations
With n = 6 countries (n = 5 for correlations involving the Gini index, since Nicaragua does not report data for the period), the correlation coefficients presented in this article are strictly descriptive and have no inferential power: they do not permit generalization beyond the six observed cases nor the establishment of causality. They are presented as illustrative evidence within a broader qualitative argument, not as statistical proof in the strict sense. Additionally, the national social-spending averages used do not capture the subnational distribution of spending, which is precisely the dimension that the territorial-fragmentation framework (Section 3.3) identifies as critical; this limitation is discussed in Section 8. A descriptive design was adopted deliberately rather than as a fallback: with aggregate secondary data available for only six countries, no panel or multivariate econometric technique can recover reliable parameter estimates, and reporting Pearson correlations on country averages, interpreted through the critical–institutional framework in Section 3, is the level of evidence these data can support without overstating precision. Consistent with this, the correlation coefficients reported in Section 6 are highly sensitive to individual observations: a leave-one-out check on the social spending–Gini correlation shows the coefficient ranging from r = −0.60 (excluding Costa Rica) to r = +0.24 (excluding El Salvador) depending on which of the five countries is excluded, and an equivalent check on the social spending–poverty correlation ranges from r = −0.48 (excluding Guatemala) to r = −0.84 (excluding Panama); the null and moderate results reported for the full sample (r = −0.05 and r = −0.62, respectively) should accordingly be read as descriptive of this specific cross-section rather than as evidence of a stable regional relationship. A further comparability limitation concerns the poverty indicator: the World Bank series used (SI.POV.NAHC) is based on national poverty lines that differ in methodology across countries, so it is not strictly comparable across the panel; the social spending–poverty correlation should accordingly be read as a suggestive cross-country pattern rather than a precise comparative estimate, pending a harmonized international poverty measure.
6. Results
6.1. Regional Overview of Social Spending
Table 2 presents the country averages of the central variables of the analysis. Marked heterogeneity is observed: social spending ranges from 7.75% of GDP in Guatemala to 11.51% in Costa Rica, national poverty ranges from 21.8% in Panama to 66.9% in Honduras, and GDP per capita varies by a factor of more than seven between Nicaragua and Panama.
Table 2.
Summary panel of socioeconomic and fiscal indicators, average 2015–2024.
6.2. Social Spending and Inequality: The Central Paradox
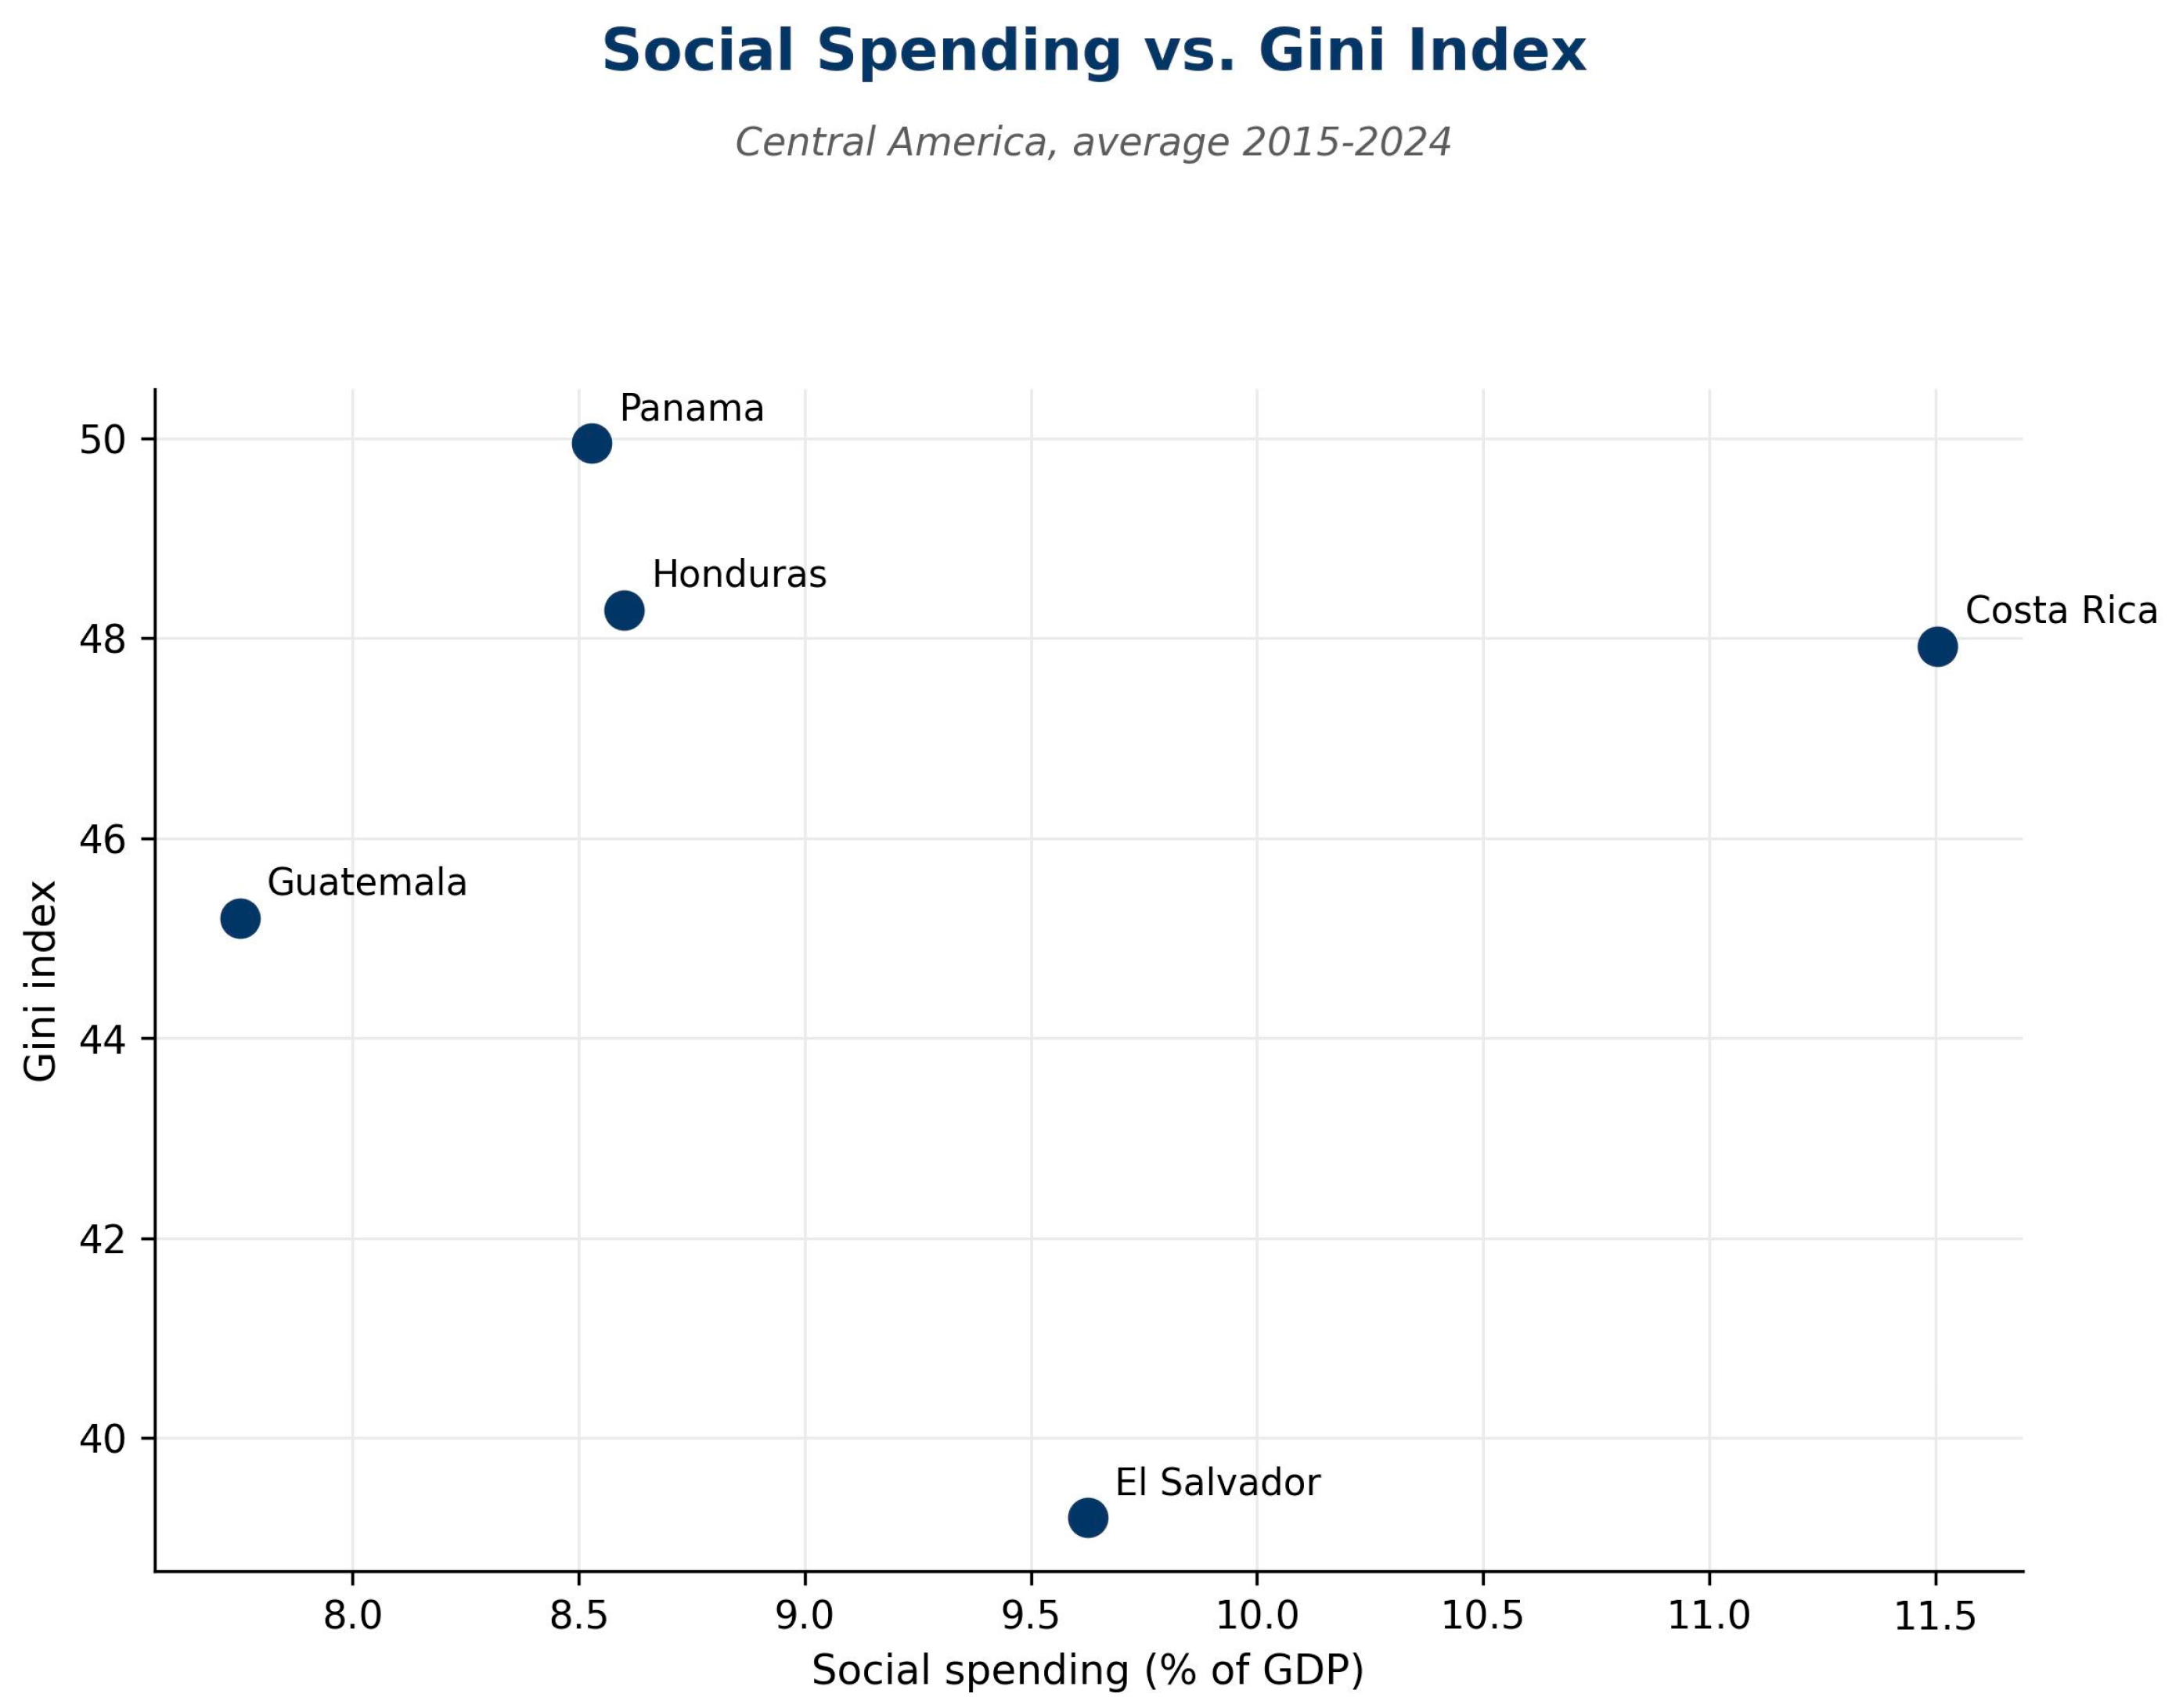
Figure 4 shows the relationship between social spending and the Gini index. The correlation is virtually null (r = −0.05; Table 3), meaning that, among these six countries, spending more as a share of GDP is not associated with lower relative income concentration. This coefficient is, however, highly sensitive to sample composition: a leave-one-out check (Section 5.3) shows that excluding any single one of the five countries moves the correlation between r = −0.60 and r = +0.24, so the null result reported here describes this specific five-country cross-section rather than a stable regional relationship. Panama and Costa Rica, the two countries with the highest GDP per capita in the group, are among those with the highest Gini values (49.9 and 47.9, respectively), while El Salvador combines intermediate social spending (9.63% of GDP) with the lowest Gini in the group (39.2).
Figure 4.
Social spending vs. Gini index, Central America, average 2015–2024. Source: authors’ elaboration based on World Bank and CEPALSTAT data.
Table 3.
Descriptive correlations between key variables (n = 5–6 countries; non-inferential).
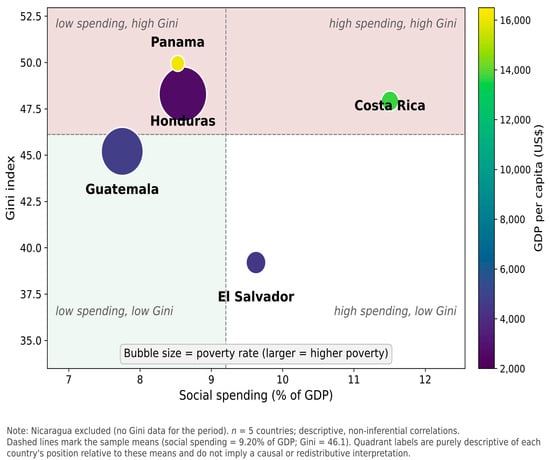
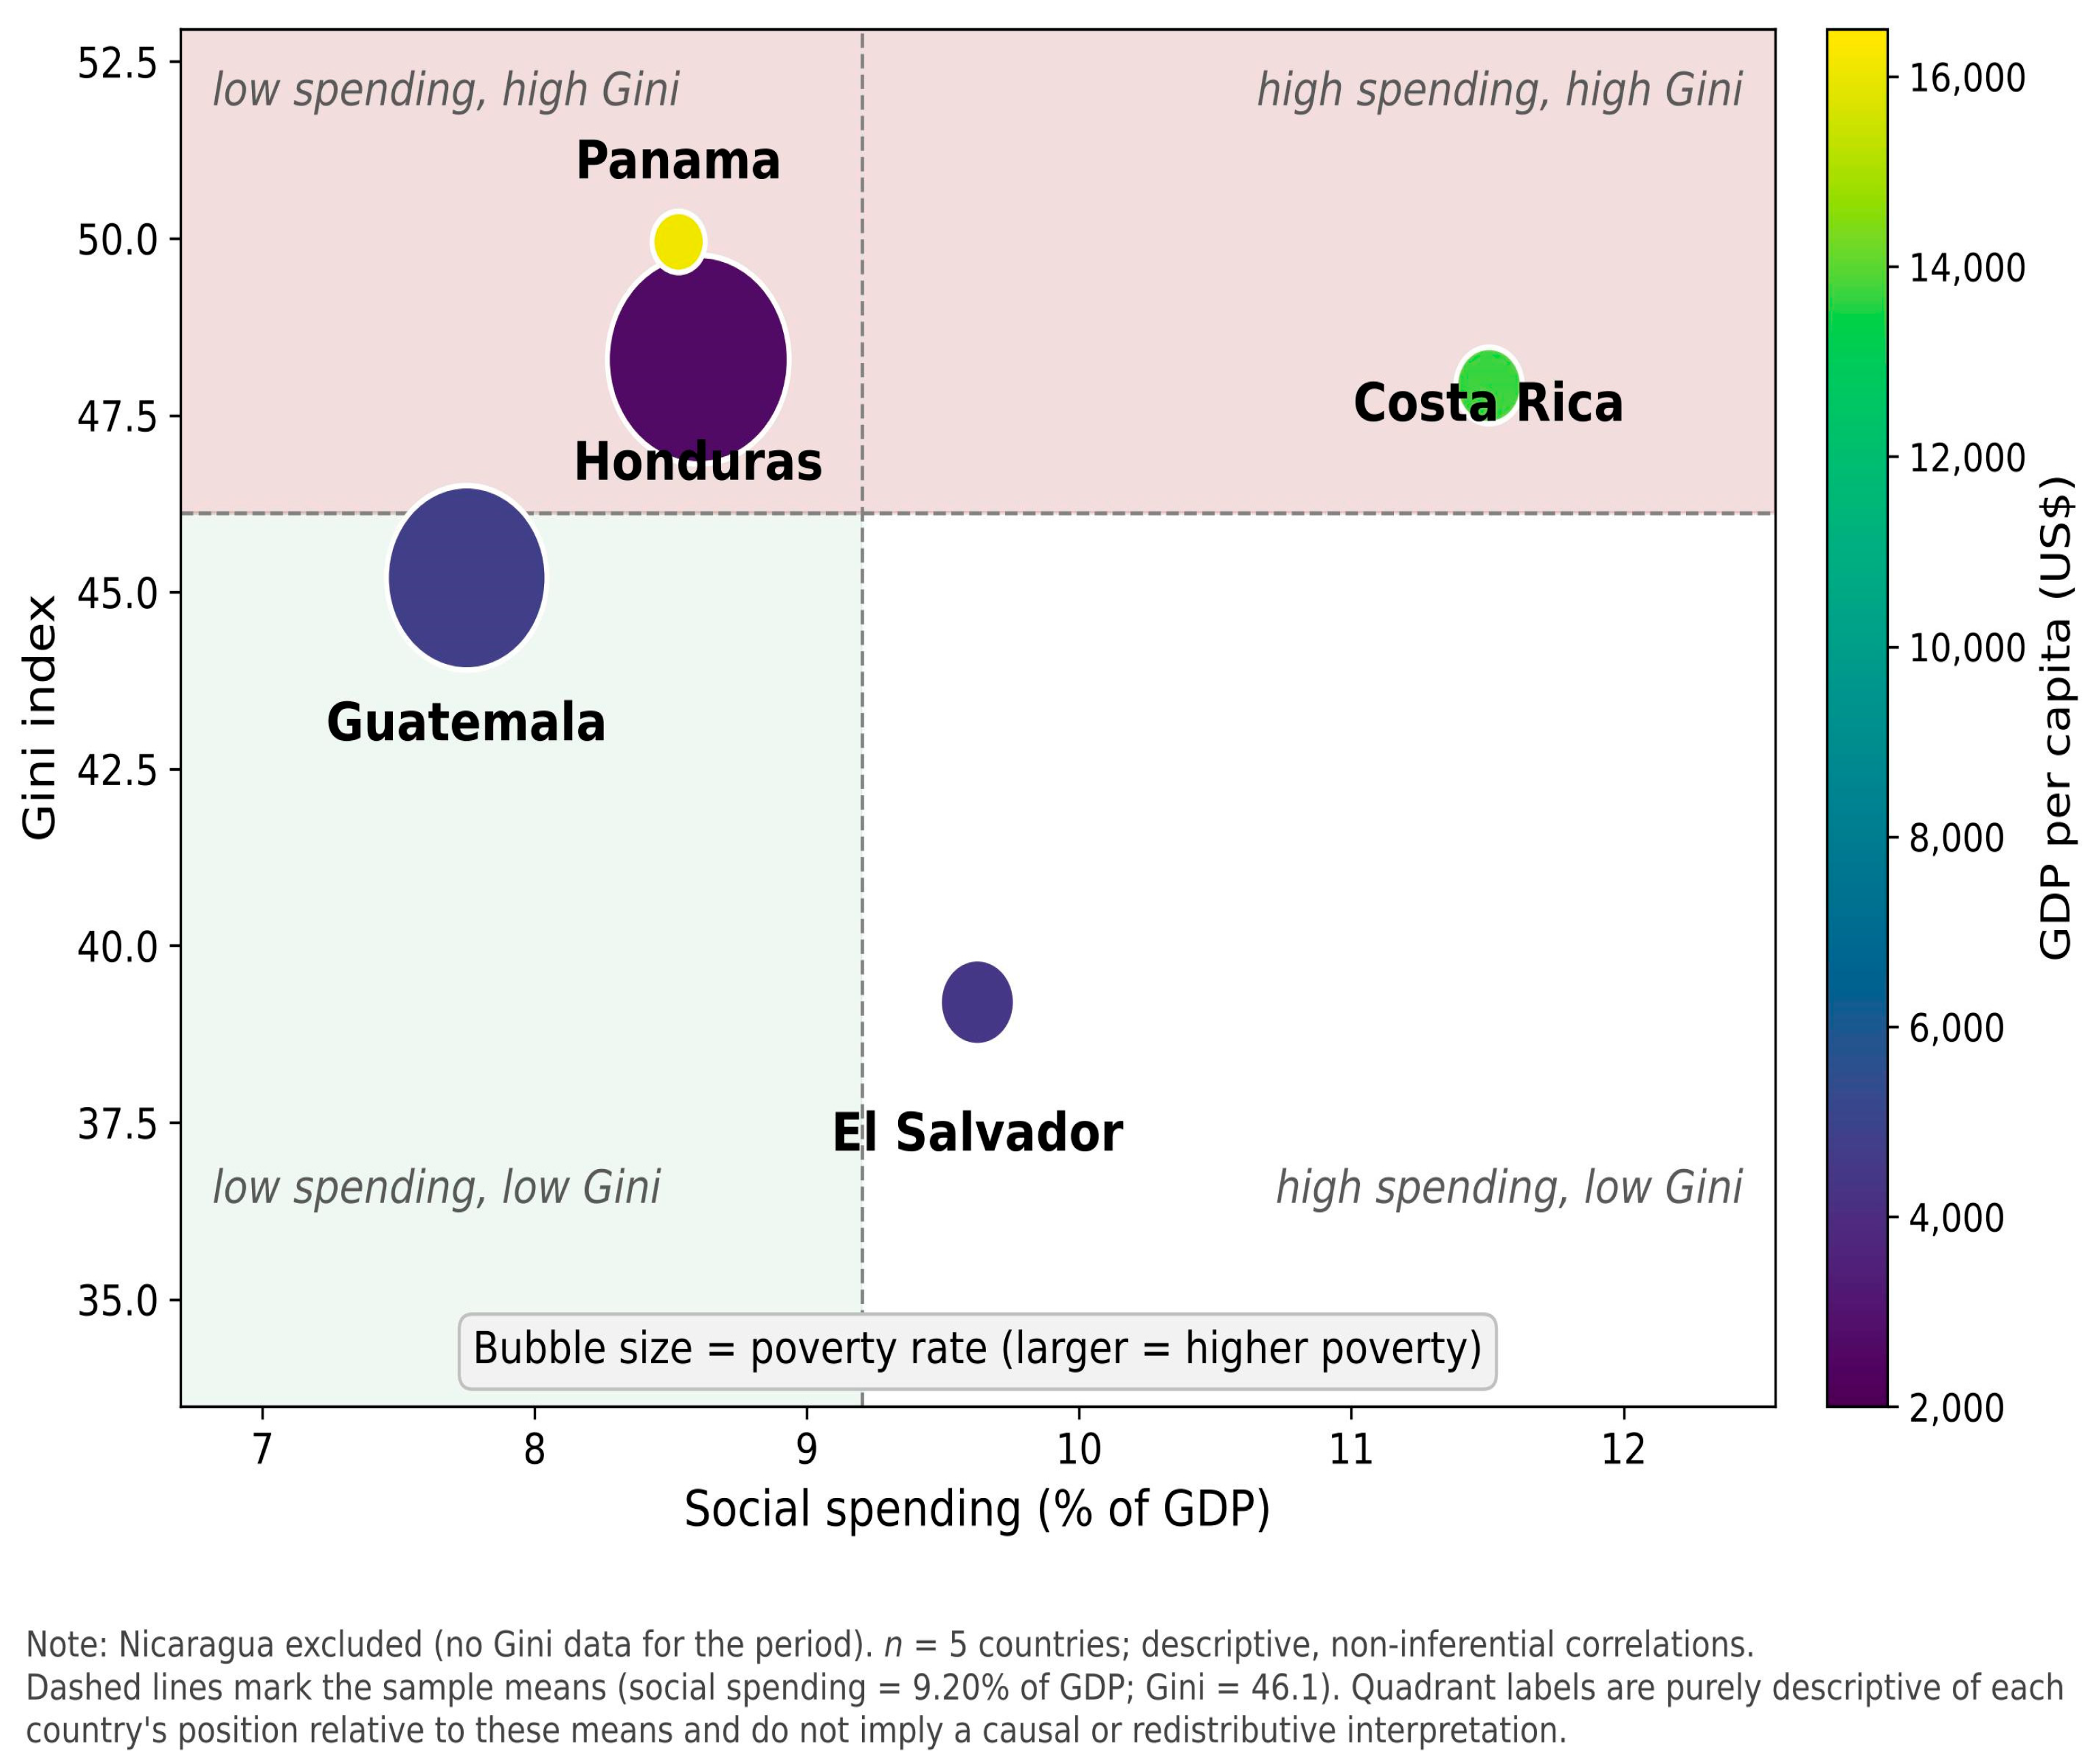
Figure 5 synthesizes this paradox in a single quadrant chart combining the analysis’s four central variables: on the horizontal axis, social spending; on the vertical axis, the Gini index; bubble size represents poverty, and color represents GDP per capita. Quadrant boundaries are drawn at the sample means (social spending = 9.20% of GDP; Gini = 46.1), and the quadrant labels used in the figure are purely descriptive of each country’s position relative to these means, without implying a causal or redistributive interpretation. Only Costa Rica combines above-average social spending with an above-average Gini index, despite having the highest GDP per capita in the group. Honduras and Panama both combine below-average social spending with an above-average Gini index: Honduras despite intermediate social spending and among the lowest GDP per capita in the panel (together with Nicaragua), and Panama despite being the wealthiest country in the group, its comparatively low social spending relative to its income notwithstanding. Guatemala combines below-average social spending with a below-average Gini index. Only El Salvador combines above-average social spending with a below-average Gini index, the lowest in the panel.
Figure 5.
Social spending, inequality, poverty, and income relative to sample means, Central America, average 2015–2024. Source: Authors’ elaboration based on World Bank and CEPALSTAT data. n = 5 countries (Nicaragua excluded, no Gini data). Quadrant labels are descriptive only.
6.3. Social Spending and Poverty
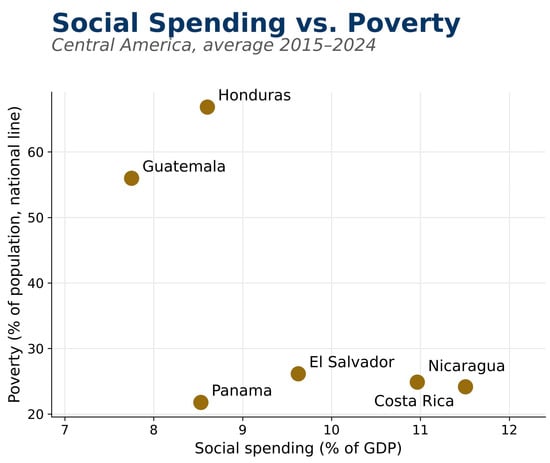
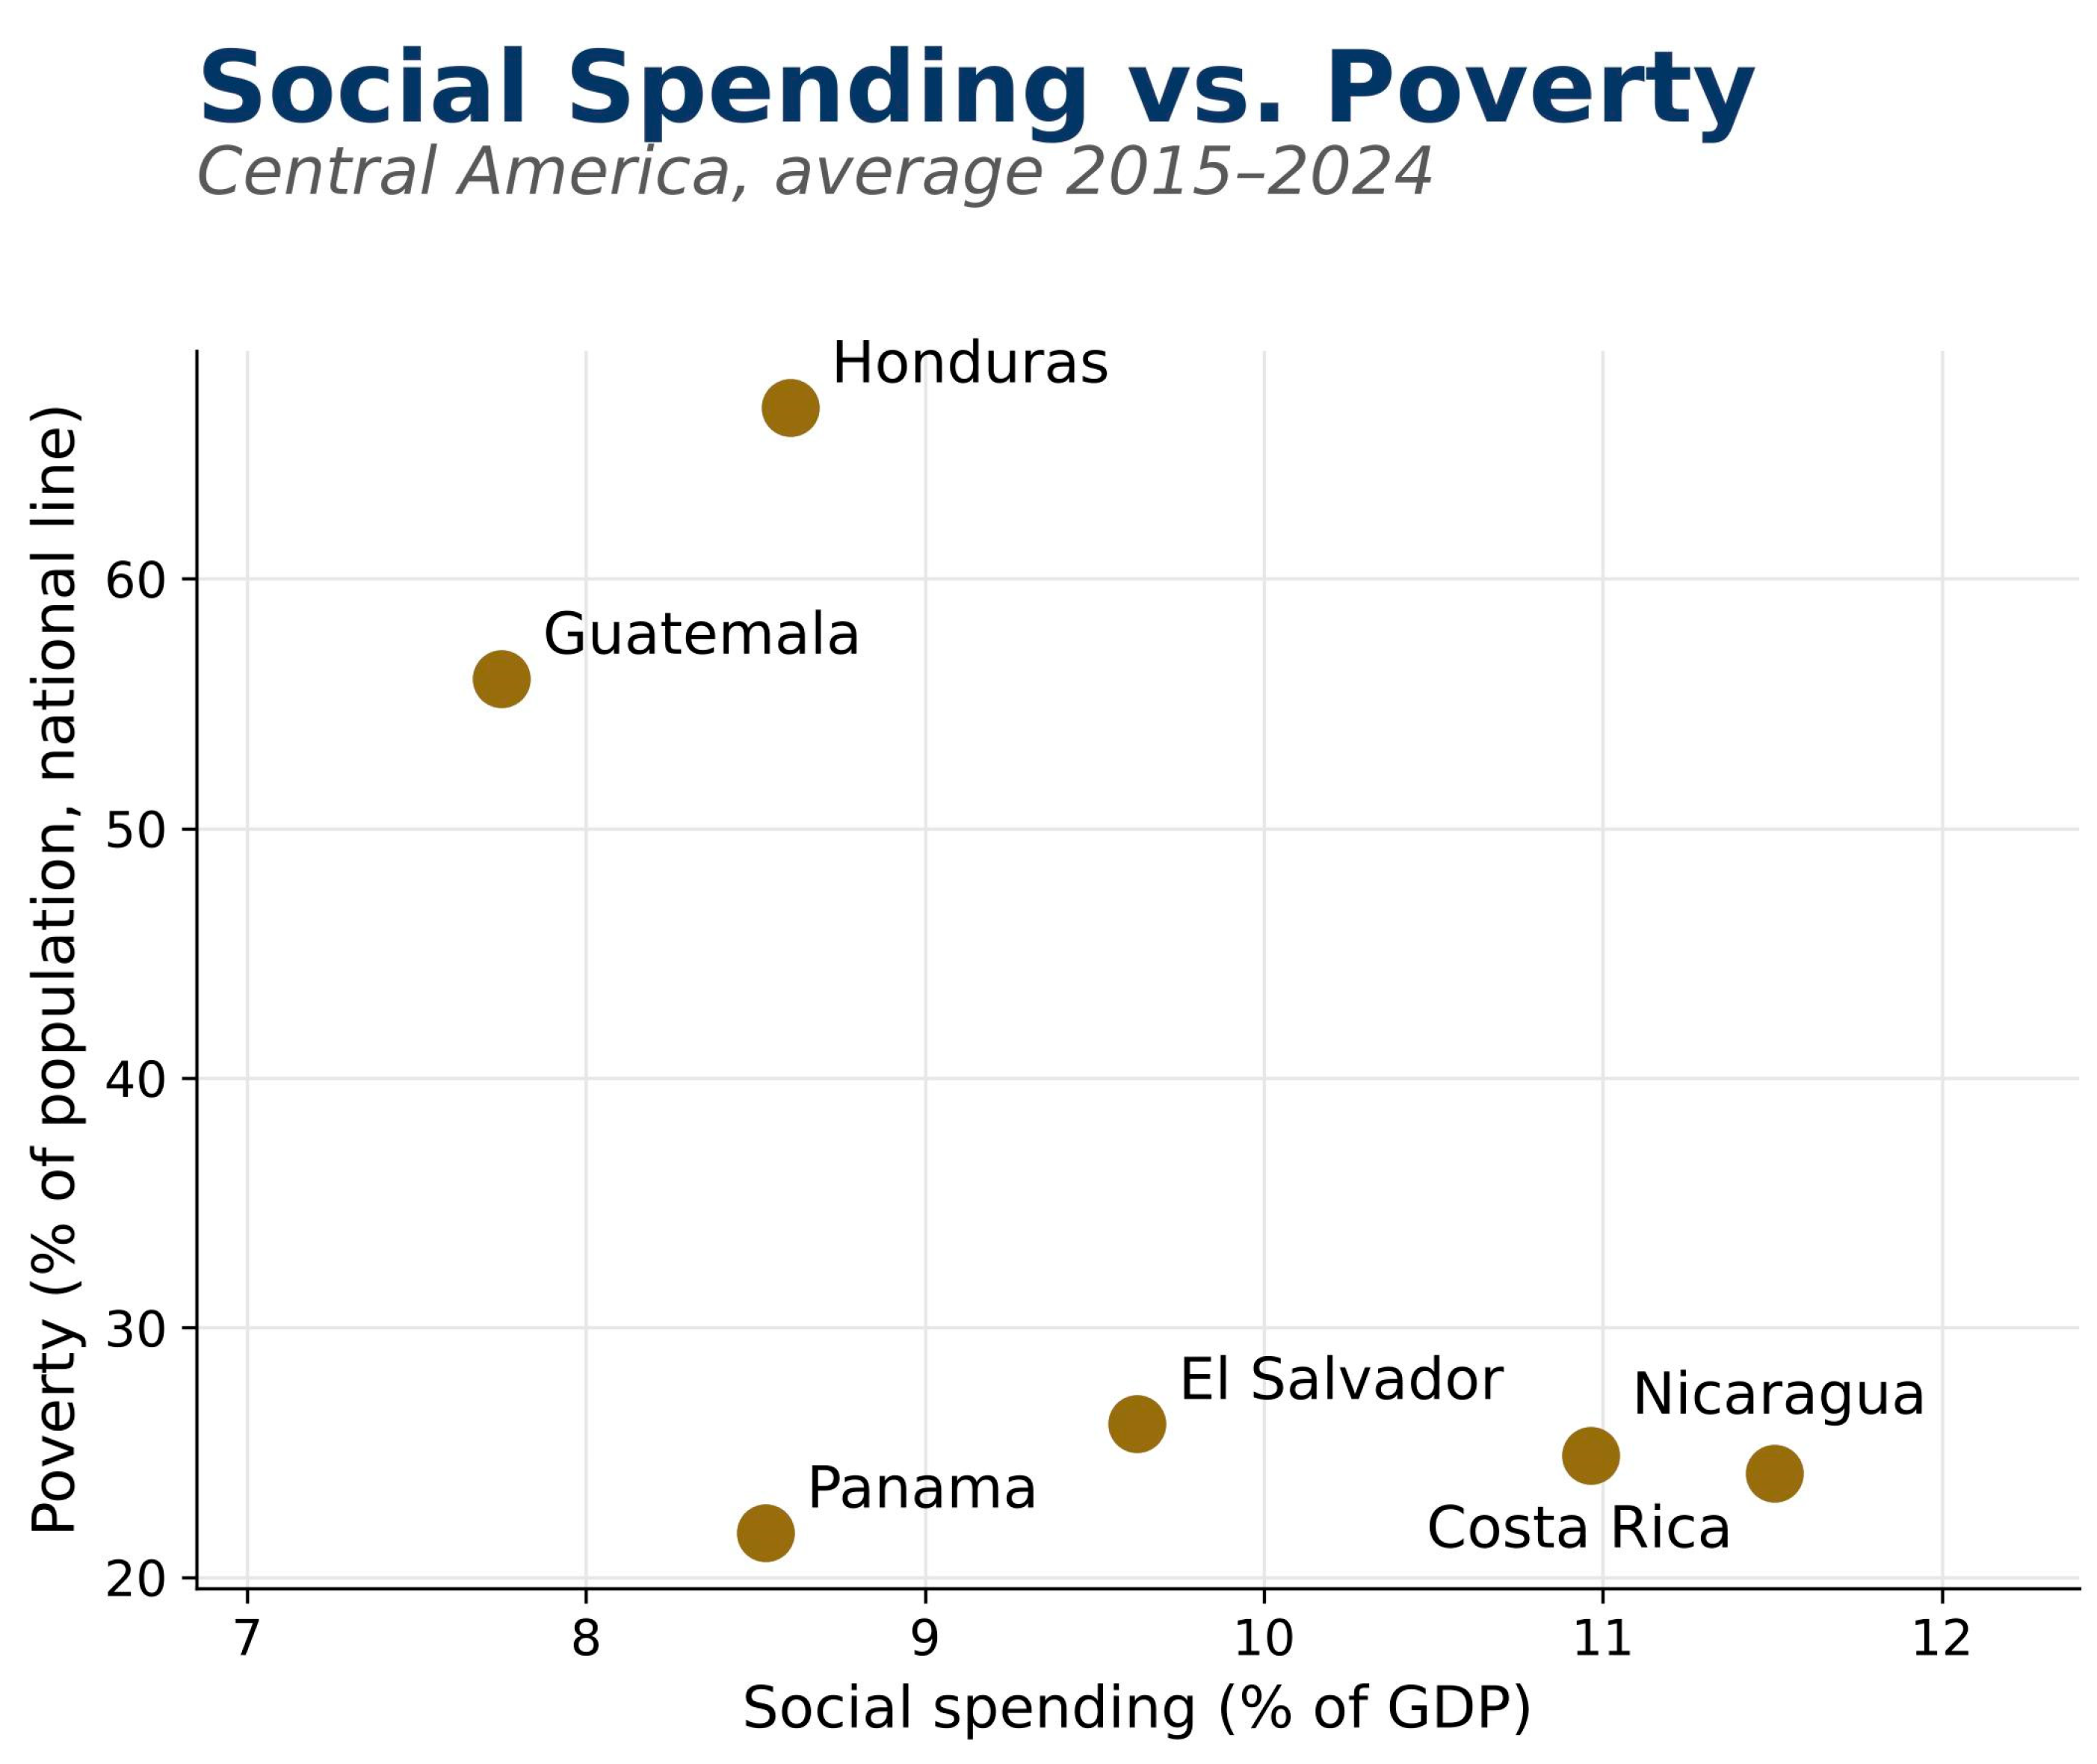
Unlike the relationship with the Gini index, the association between social spending and poverty is negative and of moderate magnitude (r = −0.62, n = 6; Figure 6 and Table 3), though, as with the Gini correlation, this coefficient is sensitive to sample composition (a leave-one-out check ranges from r = −0.48 to r = −0.84 across the six countries) and relies on a national poverty-line measure not strictly comparable across countries (Section 5.3). Countries with higher relative social spending—Costa Rica, Nicaragua, and El Salvador—show the lowest national poverty rates in the group (24.2%, 24.9%, and 26.2%, respectively), while Honduras, with intermediate social spending (8.60% of GDP), records the highest poverty rate (66.9%). Part of the extreme range between the lowest and highest poverty rates in the panel—Nicaragua’s 24.9% against Honduras’s 66.9%, a 42-point gap far wider than the difference in their social spending—may also reflect differences in how each country’s national poverty line is set, rather than purely differences in material deprivation, reinforcing the comparability caveat already noted in Section 5.3. What the data more cautiously support is some association between social spending and lifting people out of poverty, understood in Sen’s (1999) terms as a deprivation of basic capabilities rather than simply an insufficiency of income, which functions as a means toward capabilities rather than a capability in itself.
Figure 6.
Social spending vs. poverty, Central America, average 2015–2024. Source: authors’ elaboration based on World Bank and CEPALSTAT data.
6.4. Composition of Social Public Spending by Function
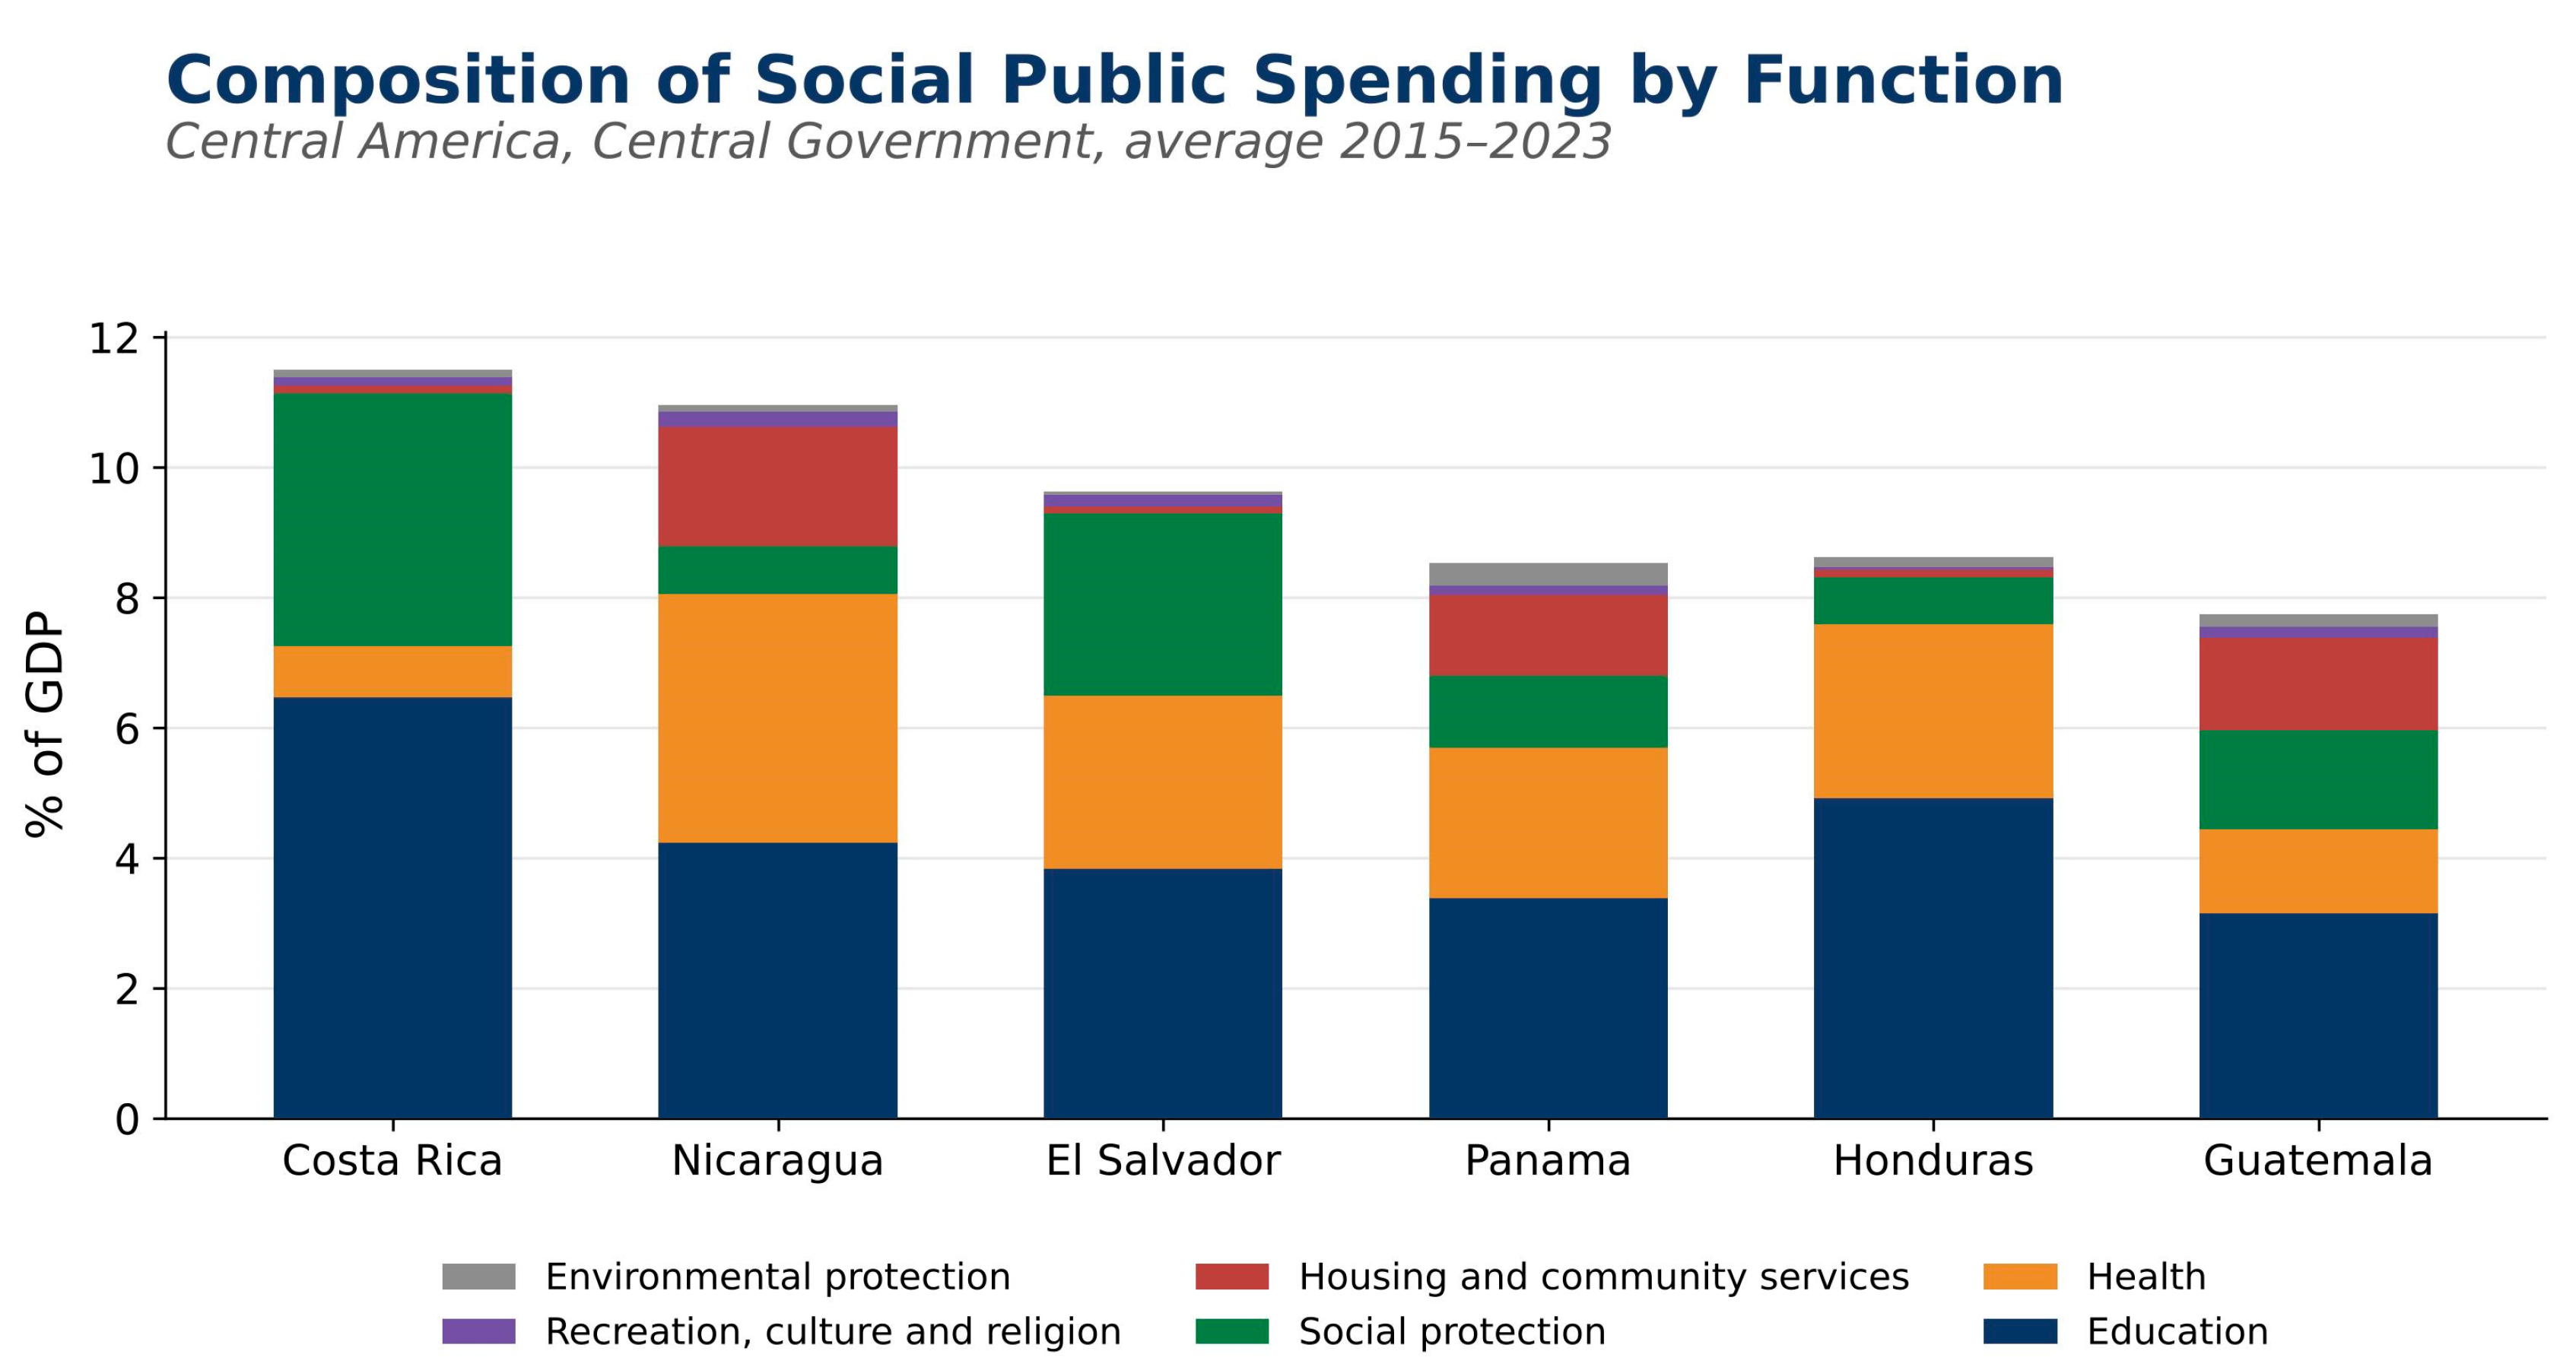
Figure 7 disaggregates social spending by government function. Education is the dominant function in all six countries, between 3.15% of GDP in Guatemala and 6.47% in Costa Rica, followed by health and social protection, with very uneven weights across countries:
Figure 7.
Composition of social public spending by function, Central America, Central Government, average 2015–2023. Source: authors’ elaboration based on CEPALSTAT data (indicator 3127).
6.5. Temporal Evolution of Social Spending, 2015–2023
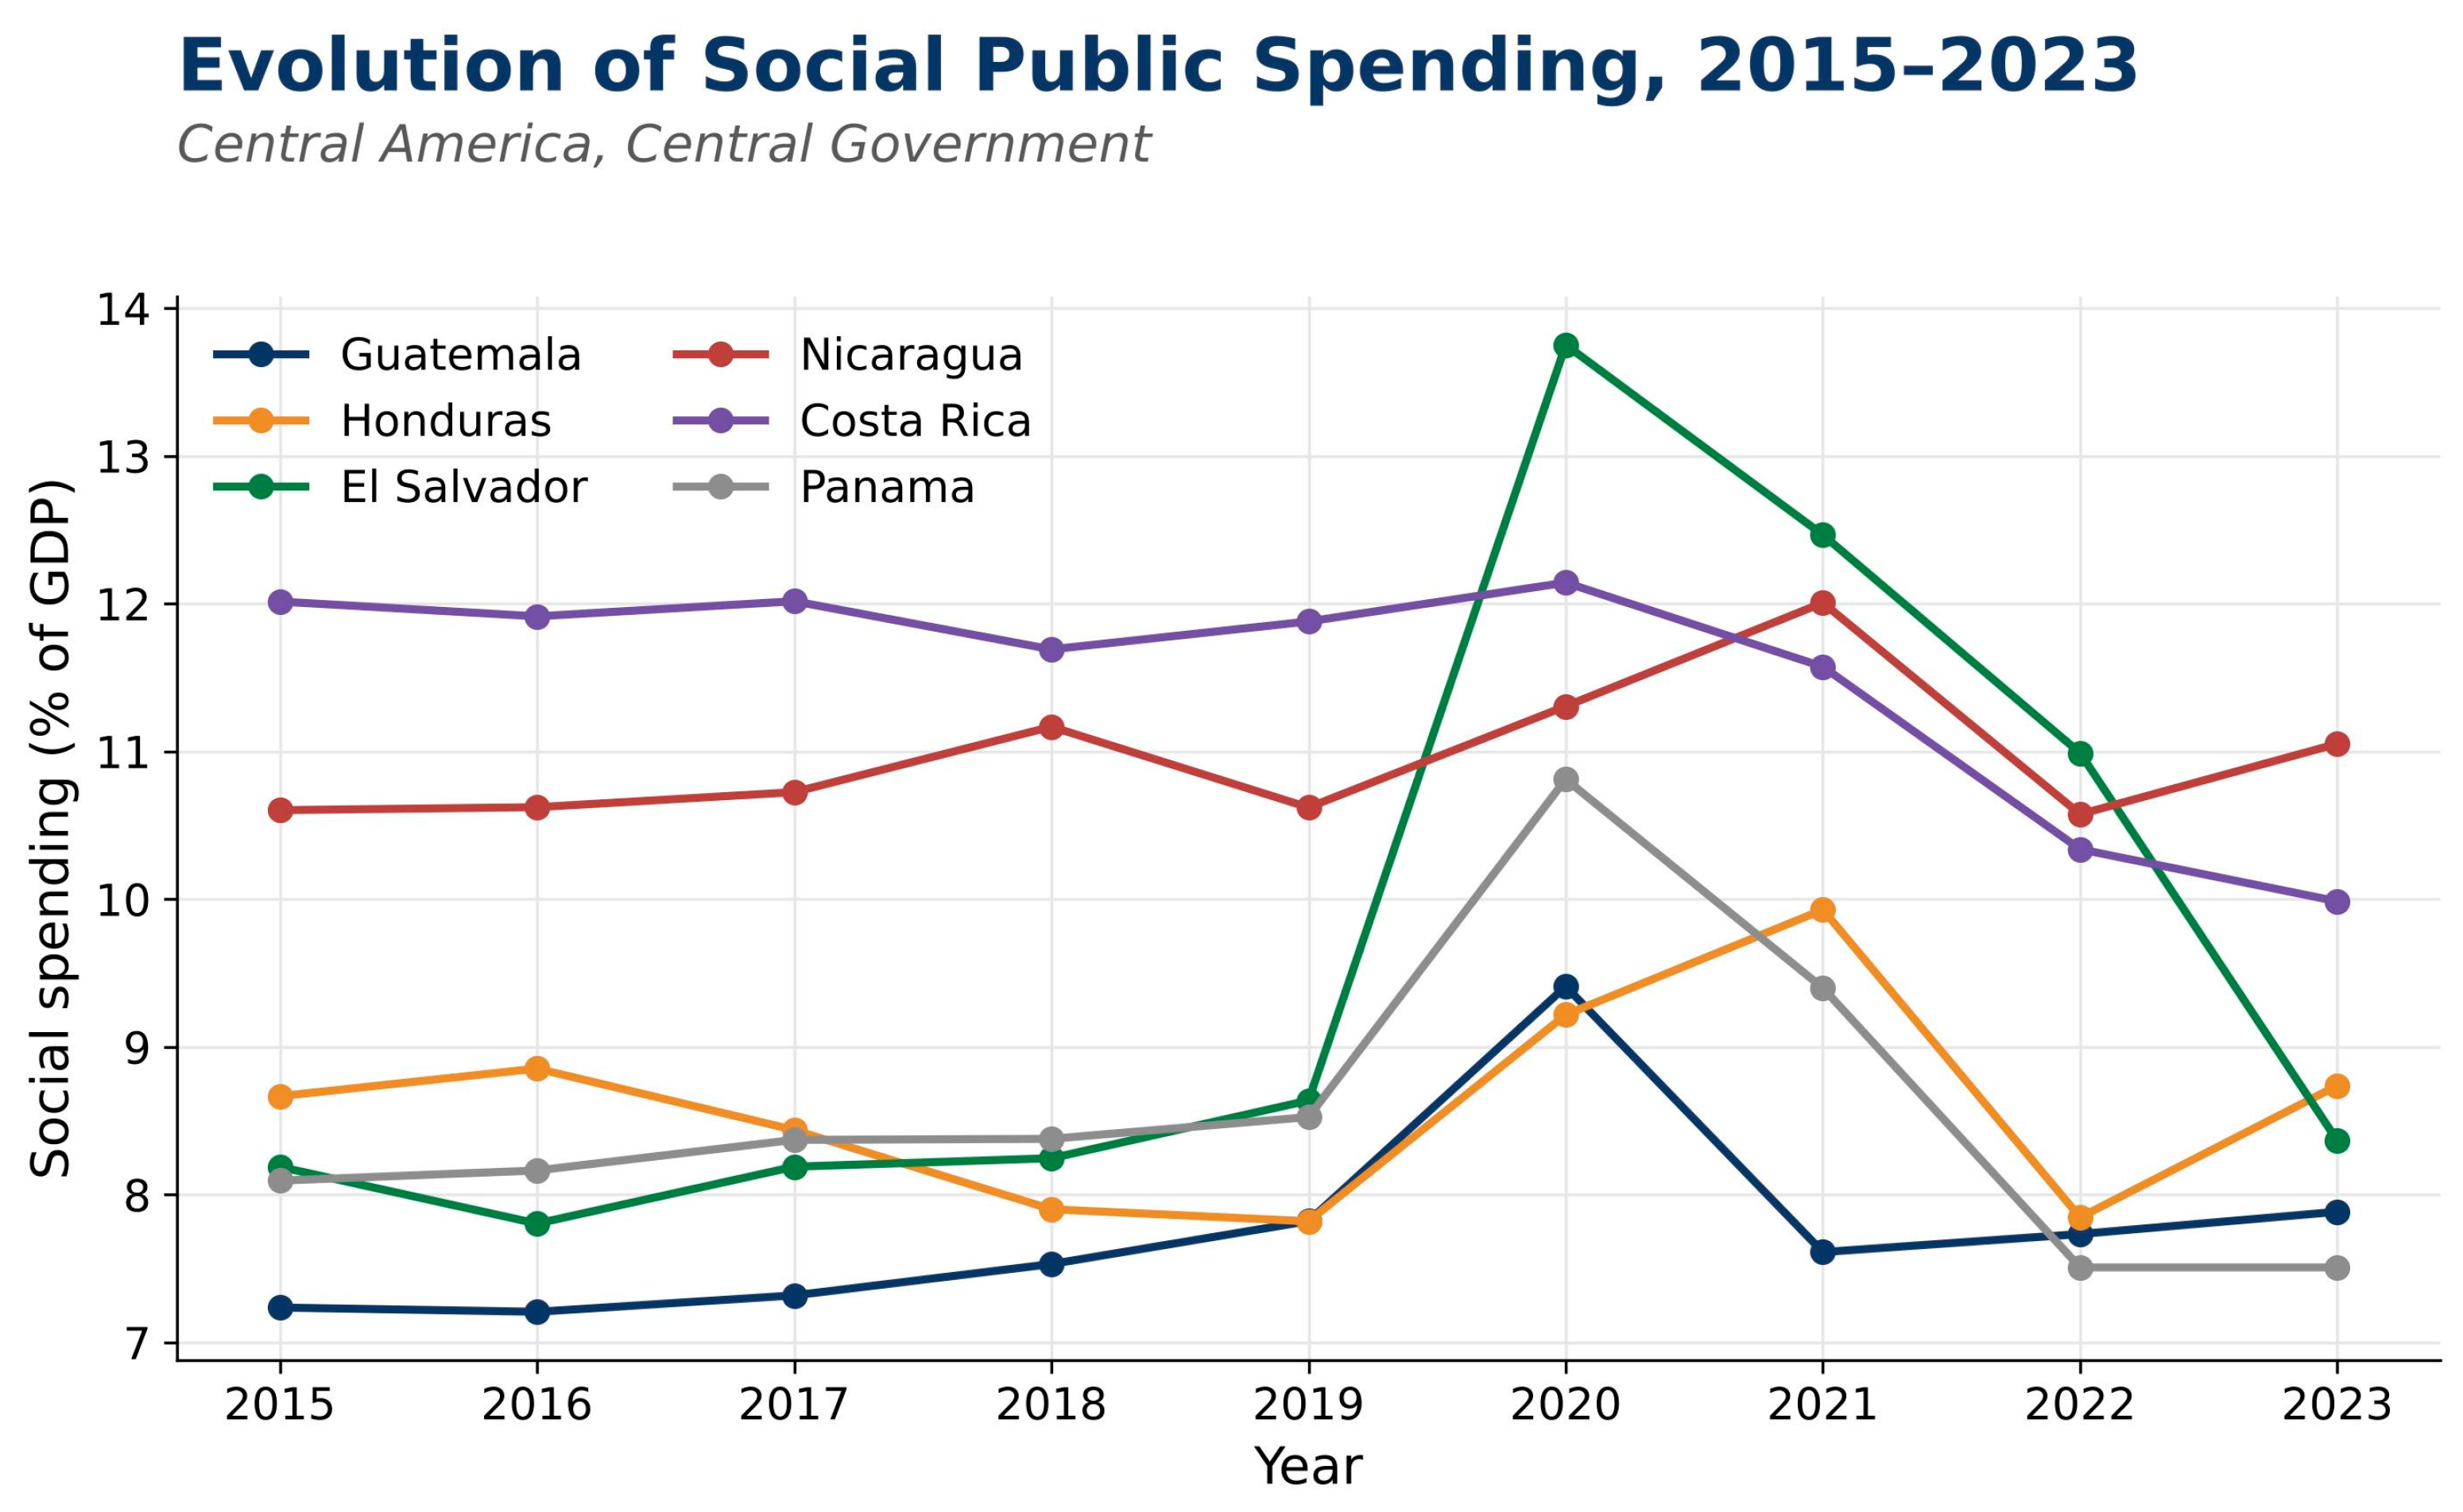
Figure 8 shows the annual evolution of social spending. A generalized jump is observed in 2020, consistent with the emergency fiscal expansion documented by Icefi (Instituto Centroamericano de Estudios Fiscales) (2021) in response to the COVID-19 pandemic: El Salvador goes from 8.64% of GDP in 2019 to 13.75% in 2020, the sharpest increase in the panel, and countries such as Guatemala, Honduras, and Panama, which until then had maintained relatively stable and low social spending, also show notable increases. After the pandemic peak, most countries partially retreat toward levels closer to their prior trend between 2021 and 2023, with the exception of Nicaragua, which maintains a trajectory of sustained growth throughout the period.
Figure 8.
Evolution of social public spending, 2015–2023, Central America, Central Government. Source: authors’ elaboration based on CEPALSTAT data indicator 3127.
6.6. Human Development and Educational Context
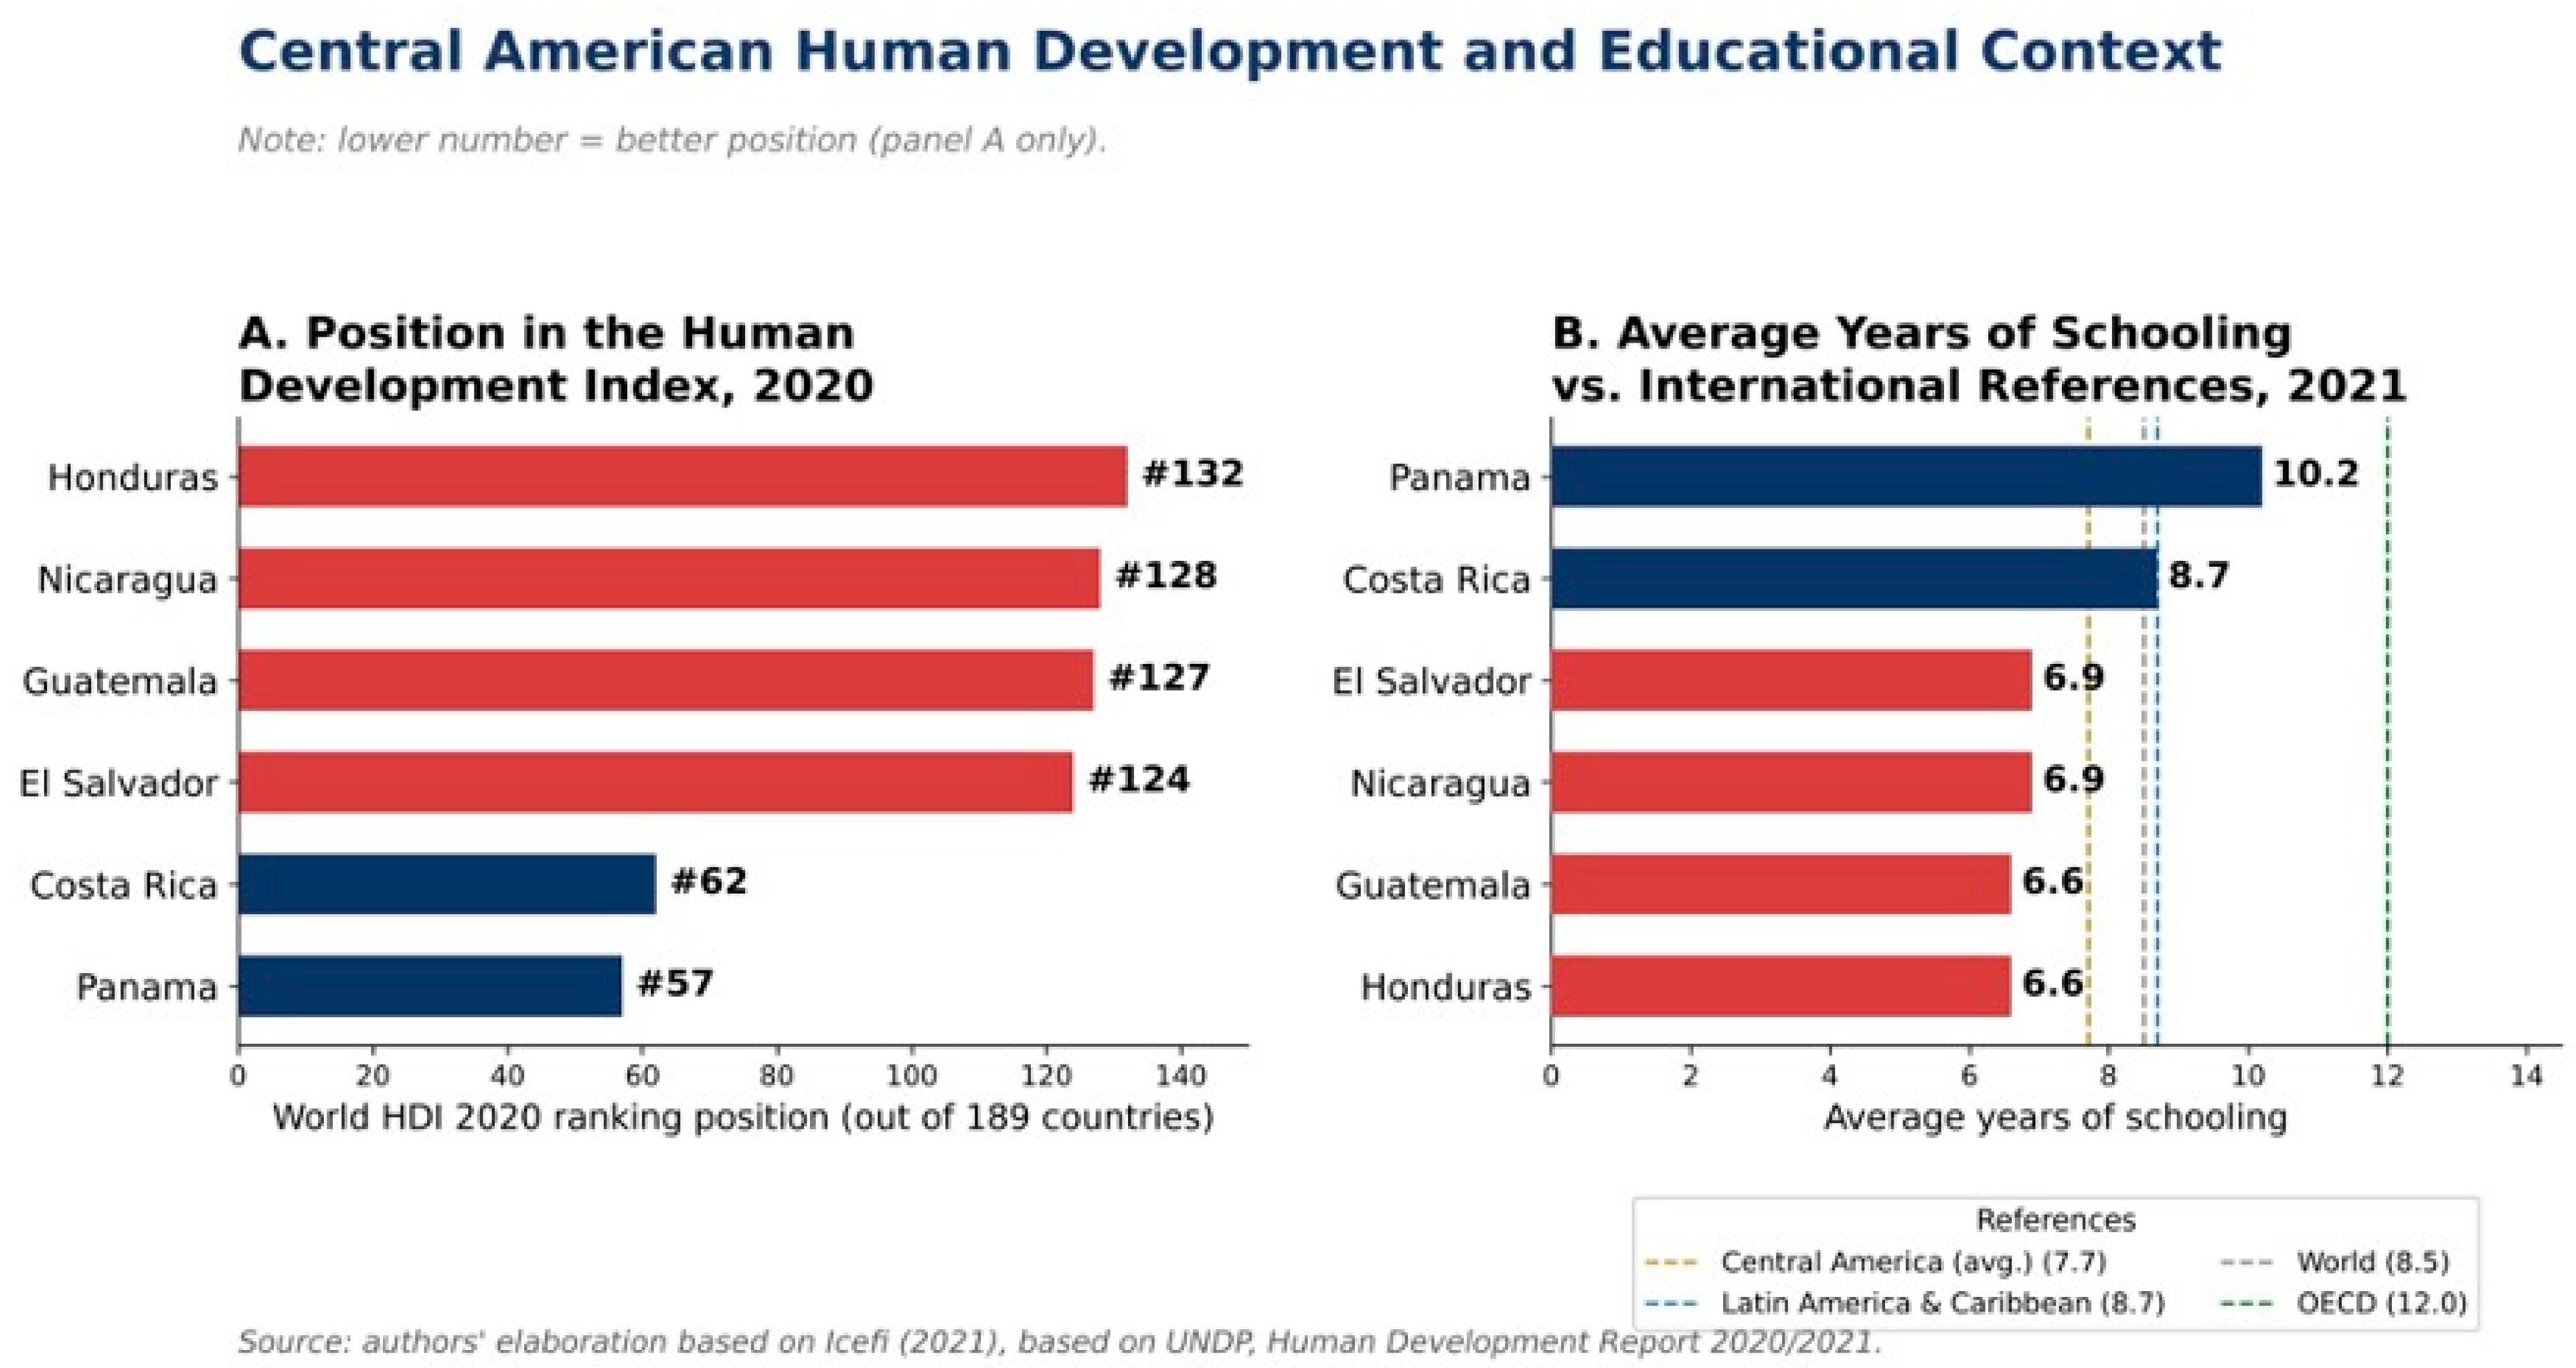
Figure 9 situates the six countries on two human-development and educational indicators: their position in the 2020 world HDI ranking and average years of schooling in 2021, contrasted with reference values for Central America, Latin America and the Caribbean, the world average, and the Organisation for Economic Co-operation and Development (OECD). The six countries clearly cluster into two blocks, Panama and Costa Rica versus the remaining four, and in schooling, all but Panama remain below the world average (8.5 years) and well below the OECD average (12.0 years).
Figure 9.
Central American human development and educational context: position in the 2020 HDI and average years of schooling in 2021, compared with international references. Source: authors’ elaboration based on Icefi (Instituto Centroamericano de Estudios Fiscales) (2021), based on UNDP, Human Development Report 2020/2021.
6.7. Case Study: Public Educational Spending and Curricular Policy
The most relevant finding for this article’s thesis emerges when educational spending is crossed with human-development outcomes. Honduras allocates 4.91% of GDP to education—the second-highest share in the panel, surpassed only by Costa Rica (6.47%) and well above Guatemala (3.15%) or Panama (3.39%)—and yet holds the worst regional position in the HDI (value 0.634; rank 132 of 189) and shares with Guatemala the lowest average years of schooling in the group (6.6 years). These figures, however, are expressed as a share of GDP, and Honduras has the lowest GDP per capita of the six countries; once spending is expressed in absolute per capita terms, the ranking changes substantially. In 2025 purchasing-power-parity (PPP) dollars, Honduras’s education spending amounts to approximately US$330 per capita, tied with Nicaragua for the lowest in the panel despite its second-highest share of GDP, while Panama, which spends only 3.39% of GDP on education, reaches approximately US$1272 per capita, the second-highest absolute level, owing to its much higher GDP per capita (Costa Rica leads at approximately US$1840 per capita; Guatemala, El Salvador, and Nicaragua range between approximately US$330 and US$460 per capita). In other words: among these six countries, a higher relative educational-spending share does not translate into higher absolute educational investment, let alone into better educational or human-development outcomes. Two further qualifications apply to the HDI comparison itself: the HDI’s income dimension means that part of Honduras’s low HDI value reflects its low per capita income directly, independently of its educational spending; and average years of schooling is a stock measure reflecting decades of past educational investment for the adult population, not an outcome of the spending levels reported here. This is illustrated descriptively rather than established statistically: the correlation between education spending and the Gini index (r = 0.26, n = 5, Table 3) is itself weak, not statistically significant, and measures income concentration rather than an educational or human-development outcome directly; it is reported here only to note that higher educational spending is not associated with lower income inequality in this sample, not as evidence about educational effectiveness. The more direct descriptive evidence here is the reversal between relative and absolute educational investment: Honduras’s second-highest share of GDP coexists with per capita spending tied with Nicaragua for the lowest in the panel, the worst HDI position, and, together with Guatemala, the lowest average years of schooling. This pattern is consistent with a critical–institutional reading of how resources are allocated and converted into outcomes, but it is equally consistent with a simpler explanation in which Honduras and Nicaragua, the two lowest per capita spenders in the panel, also register the weakest outcomes because they have the least to spend in absolute terms; Costa Rica and Panama, the two highest per capita spenders, register among the best HDI outcomes, a pattern the institutional reading alone would not predict. The descriptive, cross-sectional data used in this article cannot distinguish between these explanations.
This Honduran paradox is the empirical entry point to the sociology-of-education and curricular-policy pillar developed in Section 3.5. Icefi (Instituto Centroamericano de Estudios Fiscales) (2021, p. 30) notes that, in Guatemala and Panama, public education and health services continue to reach the indigenous population more precariously than the rest of the population, a lag compounded by unresolved land-titling disputes in Guatemala, Honduras, and Nicaragua—direct evidence that educational inequality is not distributed homogeneously within each country but is concentrated territorially and ethnically, in line with Kaztman’s (2001) concept of territorial fragmentation.
The reading proposed here, which constitutes the specific contribution of the Pedagogical Sciences specialization of one of the co-authors, is that aggregate educational spending conceals a curricular-relevance gap: investment in coverage and years of schooling is not equivalent to investment in curricula, materials, and teacher training that engage with the cultures, languages, and productive needs of rural and indigenous territories. Without that relevance, educational spending can expand formal access without closing the real-capabilities gap identified by Sen (1999) and Nussbaum (2011). This hypothesis requires, as noted in the limitations (Section 5.3) and the future agenda (Section 8), additional subnational primary evidence beyond the scope of the aggregate sources used in this article.
7. Discussion
The results of Section 6 allow this article’s central thesis to be revisited with greater precision. Consistent with the methodological limitations noted in Section 5.3, the interpretations offered in this Discussion are framed as theoretically grounded readings of a descriptive cross-country pattern, not as causal claims established by the analysis itself; institutional capture, territorial fragmentation, and curricular relevance are treated throughout as plausible explanatory hypotheses consistent with the evidence, rather than as mechanisms directly measured by this study’s national-level data. Neither coefficient reported in Section 6 is stable enough, given the small number of countries, to characterize a regional pattern with statistical confidence (Section 5.3); the institutional-capture, territorial-fragmentation, and curricular-relevance hypotheses developed below are accordingly offered as interpretive readings of the descriptive patterns documented there, consistent with the critical–institutional framework introduced in Section 3, rather than as findings established by the correlations themselves.
The political-economy-of-fiscal-capture pillar (Section 3.4) offers one institutional explanation for the null social spending–Gini relationship reported in Section 6.2. If, as Martínez Franzoni and Sánchez-Ancochea (2016) and Schneider (2012) document, Central American fiscal pacts have historically been conditioned by economic elites who preserve their relative position, then it is to be expected that public spending will grow, even sharply, as in El Salvador’s total public budget during the pandemic, from 22.2% to 30.1% of GDP in a single year (Icefi (Instituto Centroamericano de Estudios Fiscales) 2021, p. 41; this figure refers to total central government spending, not only to the social-spending series in Figure 8, which for El Salvador rose from 8.64% to 13.75% of GDP over the same period), without that growth altering the regressive tax structure or the asset concentration that sustains the Gini index. The Salvadoran case of 2020 is illustrative: a cyclical and necessary expansion of spending in response to a health emergency does not amount to, nor does it aim to amount to, a structural reform of the distributive matrix.
This institutional reading can be situated within a broader debate in the political economy of development. Acemoglu and Robinson (2012) argue that national trajectories of prosperity and stagnation depend not only on the volume of resources a state mobilizes, but also on whether its institutions are “inclusive,” expanding access to economic and political opportunities, or “extractive,” concentrating decision-making power in a small elite and limiting real competition for public resources. The Central American evidence presented in this article is compatible with a pattern of partially extractive fiscal institutions, in which the rules that decide who benefits, where, and with what quality remain relatively stable even as aggregate spending grows, anchored in the elite pacts documented by Martínez Franzoni and Sánchez-Ancochea (2016) and Icefi (Instituto Centroamericano de Estudios Fiscales) (2021). It is equally compatible, however, with a more parsimonious explanation centered on the absolute volume of resources available to each country: Honduras and Nicaragua, the two countries with the lowest per capita social and educational spending (Section 6.7), also register among the weakest outcomes in the panel. The cross-sectional, descriptive data used here cannot adjudicate between these two readings; both are offered as plausible interpretations consistent with the evidence.
The territorial-fragmentation pillar (Kaztman 2001) in turn explains why national social-spending averages, the unit of analysis available in the sources used, may conceal more than they reveal. Icefi (Instituto Centroamericano de Estudios Fiscales)’s (2021, p. 30) finding on the lesser educational and health attention received by indigenous peoples in Guatemala and Panama, and the unresolved land-recognition problems in Guatemala, Honduras, and Nicaragua, point to the inequality trap playing out, to a large extent, within each country and not only between countries. The Honduran case—high relative educational spending, worst HDI position in the panel—is consistent with this reading: if spending is neither territorialized nor curricularly adapted, it can coexist with deep human-development gaps. This fragmentation is not an exclusively Central American phenomenon: Hall and Patrinos (2006) document, for Latin America as a whole, that indigenous peoples systematically show worse poverty and human-development indicators than the non-indigenous population, even within countries with comparable social spending, a pattern consistent with the ethno-territorial variable operating, at least in part, as an axis of inequality not fully reducible to the volume of aggregate spending—though the national-level data used here cannot rule out that higher absolute spending would also narrow this gap.
The subnational-monitoring policy implication put forward in the conclusions (Section 8) is not free of tensions worth acknowledging. The fiscal-decentralization literature warns that shifting spending decisions to local governments does not automatically correct institutional capture: it can instead reproduce it at a smaller scale if local elites control municipal accountability mechanisms, or it can improve targeting where minimum conditions of administrative capacity and local political competition exist (Bardhan 2002). This ambivalence suggests that subnational disaggregation of Central American social spending is a necessary but not sufficient condition for breaking the inequality trap: it must be accompanied by transparency and participation mechanisms that the decentralization literature identifies as determinants of the success or failure of this type of reform.
Finally, the sociology-of-education and curricular-policy pillar (Section 3.5) allows this article’s most concrete policy implication to be formulated: the relevance and territorial targeting of educational spending matter at least as much as its volume. This reading is reinforced by international econometric evidence: Hanushek and Woessmann (2008) show that it is cognitive skills actually acquired, not years of schooling or educational spending per se, that are robustly associated with economic growth and reduced income inequality, lending quantitative support to this article’s qualitative hypothesis: Honduras can spend proportionally more on education than Guatemala or Panama and still fail to achieve better outcomes if that spending does not translate into real, culturally relevant learning. Along the same lines, the “learning poverty” indicator, the proportion of ten-year-olds unable to read and understand a simple text, offers an internationally comparable metric that documents precisely this gap between coverage and learning; its regional magnitude, estimated by the World Bank and its partners at around 70% in Latin America and the Caribbean after the pandemic (World Bank et al. 2022), suggests that the Honduran case analyzed in Section 6.7 is not an isolated anomaly but the national expression of a regional problem of educational quality and relevance that the future research agenda (Section 8) should measure directly and subnationally.
8. Conclusions
This article started from an observable paradox in the cross-country data: the six Central American countries analyzed here sustain markedly different levels of social public spending, from 7.75% of GDP in Guatemala to 11.51% in Costa Rica (Section 6.1), yet this variation is not systematically associated with lower relative income inequality (Section 6.2); all six countries also shared a pandemic-era spending spike in 2020 followed by partial reversion in several cases (Section 6.5), a within-country pattern noted here descriptively rather than as the basis for the article’s central, cross-sectional comparison. The descriptive evidence presented (a virtually null correlation between social spending and the Gini index, r = −0.05) is compatible with the thesis that the Central American inequality “trap” has more to do with institutional architecture, elite capture, weak decentralization, and territorial fragmentation than with the volume of spending alone; it is equally compatible, however, with a more parsimonious account in which Honduras and Nicaragua, the two countries with the lowest per capita social and educational spending (Section 6.7), simply have less to redistribute. Given the descriptive, cross-sectional nature of the evidence presented in this article, neither reading can be statistically adjudicated here, and both are offered as plausible interpretations for the future-research agenda below to test directly.
The public educational spending case illustrates this ambiguity particularly clearly. Honduras devotes a larger share of GDP to education than every country in the panel except Costa Rica, yet, once its low income is taken into account, it records per capita educational investment tied with Nicaragua for the lowest of the six countries (approximately US$330 and US$336 in PPP terms, respectively, against US$1840 in Costa Rica) and holds the worst regional position in human development—a reminder that the HDI itself incorporates an income component and that average years of schooling reflects decades of past, not recent, educational investment (Section 6.7). As Section 6.7 and Section 7 discuss, this pattern is compatible with an institutional reading in which how spending is allocated matters more than its volume, but it is equally compatible with the more parsimonious observation that Honduras and Nicaragua simply have the least to spend; Costa Rica and Panama, the two highest per capita spenders, register the best HDI outcomes in the panel. Future research with subnational and multivariate data, of the kind called for below, would be needed to separate these explanations. What this descriptive comparison does support is that the volume of educational spending, however measured, interacts with curricular relevance and territorial and indigenous targeting in shaping whether spending translates into real capabilities, in the sense of Sen (1999) and Nussbaum (2011).
At least three public policy implications follow from these findings. First, Central American social-spending monitoring systems should be disaggregated at the subnational, not only national, scale, in order to identify and correct the territorial fragmentation that aggregate averages conceal. Second, equity-oriented fiscal reforms must explicitly address the political economy of institutional capture, not only the volume of spending. Third, education policies should systematically incorporate curricular and territorial relevance criteria, not only coverage, as a condition for educational spending to effectively moderate inequality.
This article has limitations that bound the scope of its conclusions. The sample size (n = 6 countries, n = 5 for correlations involving the Gini index) precludes any generalizable statistical inference; the results are presented as descriptive evidence within a broader qualitative argument, and, as detailed in Section 5.3, the correlation coefficients themselves are highly sensitive to which country is included or excluded. Social-spending data are national averages that do not capture the subnational distribution of spending, precisely the dimension the theoretical framework identifies as critical, and the national poverty measure used (World Bank SI.POV.NAHC) is not strictly comparable across countries (Section 5.3).
Building on this descriptive account, a natural next step is subnational data collection able to test the territorial-fragmentation and curricular-targeting hypotheses directly, together with a longer country-year panel supporting multivariate estimation, a harmonized and internationally comparable poverty measure, and, ultimately, a genuine CEQ-style fiscal-incidence analysis using household-level microdata alongside qualitative fieldwork on curricular relevance in the lowest-performing territories.
Author Contributions
Conceptualization, L.L.-B., D.R. and K.F.-N.; methodology, L.L.-B. and D.R.; software, D.R.; validation, L.L.-B. and D.R.; formal analysis, L.L.-B. and D.R.; investigation, L.L.-B., D.R. and K.F.-N.; resources, D.R. and L.L.-B.; data curation, D.R. and L.L.-B.; writing—original draft preparation, L.L.-B. and D.R.; writing—review and editing, L.L.-B., D.R. and K.F.-N.; visualization, L.L.-B., D.R. and K.F.-N.; supervision, L.L.-B. and D.R.; project administration, L.L.-B. and K.F.-N. All authors have read and agreed to the published version of the manuscript.
Funding
This research received no external funding.
Institutional Review Board Statement
Not applicable. This study relies exclusively on secondary, publicly available aggregate national statistics (World Bank, CEPALSTAT, Icefi, UNDP) and did not involve primary data collection from human or animal subjects.
Informed Consent Statement
Not applicable.
Data Availability Statement
The datasets analyzed in this study are publicly available: World Bank (2024) World Development Indicators (https://databank.worldbank.org), CEPALSTAT (ECLAC (Economic Commission for Latin America and the Caribbean) n.d.) (https://statistics.cepal.org), and Icefi (Instituto Centroamericano de Estudios Fiscales)’s (2021) Central America Macrofiscal Profiles No. 14 and CEQ Working Papers Nos. 50–51 (Icefi (Instituto Centroamericano de Estudios Fiscales) 2017a, 2017b). The compiled six-country panel dataset and R (version 4.5.3) analysis code are available from the corresponding author upon reasonable request.
Acknowledgments
The authors thank the Universidad Nacional Autónoma de Honduras (UNAH) for its institutional support. During the preparation of this manuscript, the authors used Claude Sonnet 5 to assist with editorial support in revising the manuscript text in English and to generate the Graphical Abstract.. All statistical results, figures, and tables were generated by the authors, with the exception of the Graphical Abstract noted above. The authors reviewed, verified, and take full responsibility for the content of this manuscript.
Conflicts of Interest
The authors declare no conflicts of interest.
Abbreviations
The following abbreviations are used in this manuscript:
| CEQ | Commitment to Equity |
| ECLAC | Economic Commission for Latin America and the Caribbean |
| GDP | Gross Domestic Product |
| HDI | Human Development Index |
| Icefi | Central American Institute for Fiscal Studies |
| IMF | International Monetary Fund |
| OECD | Organisation for Economic Co-operation and Development |
| UNDP | United Nations Development Programme |
References
- Abril-López, Daniel, María del Carmen Morón-Monge, Hortensia Morón-Monge, and José María Cuenca-López. 2020. The Treatment of Socioeconomic Inequalities in the Spanish Curriculum of Compulsory Secondary Education (ESO): An Opportunity for Interdisciplinary Teaching. Social Sciences 9: 94. [Google Scholar] [CrossRef] [Scilit]
- Acemoglu, Daron, and James A. Robinson. 2012. Why Nations Fail: The Origins of Power, Prosperity, and Poverty. New York: Crown Business. [Google Scholar]
- Acosta, Pablo, Rita Almeida, Thomas Gindling, and Christine Lao Peña. 2017. Toward More Efficient and Effective Public Social Spending in Central America. Washington, DC: World Bank. [Google Scholar] [CrossRef] [Scilit]
- Alam, Gazi Mahabubul. 2026. The Challenges for Urban Floating Parents to Provide Free-Basic Education for Their Children in Bangladesh. Education and Urban Society 58: 574–93. [Google Scholar] [CrossRef] [Scilit]
- Bardhan, Pranab. 2002. Decentralization of Governance and Development. Journal of Economic Perspectives 16: 185–205. [Google Scholar] [CrossRef] [Scilit]
- Cabrera, Maynor, Nora Lustig, and Hilcías E. Morán. 2015. Fiscal Policy, Inequality, and the Ethnic Divide in Guatemala. World Development 76: 263–79. [Google Scholar] [CrossRef] [Scilit]
- CEPAL-UNESCO. 2020. La Educación en Tiempos de la Pandemia de COVID-19. Informe COVID-19. Santiago: United Nations. [Google Scholar]
- Claveria, Oscar. 2025. Do Taxes and Transfers Stimulate Development in Latin America? Public Finance Review 53: 200–25. [Google Scholar] [CrossRef] [Scilit]
- Çelik, Ahmet Alkan, Yavuz Selim Balcioglu, and Erkut Altındağ. 2025. Educational Inequality Trajectories and SDG4 Achievement: A Comparative Analysis of Global Trends (2010–2024). Quality Education for All 2: 551–76. [Google Scholar] [CrossRef] [Scilit]
- ECLAC (Economic Commission for Latin America and the Caribbean). 2025. Social Panorama of Latin America and the Caribbean 2025: Escaping the Trap of High Inequality, Low Social Mobility and Weak Social Cohesion. Santiago: United Nations. [Google Scholar]
- ECLAC (Economic Commission for Latin America and the Caribbean). n.d. CEPALSTAT: Databases and Statistical Publications [Dataset]. Available online: https://statistics.cepal.org (accessed on 16 July 2026).
- Furtado, Celso. 1964. Desarrollo y Subdesarrollo. Translated by Ana O’Neill. Buenos Aires: Eudeba. First published 1961. [Google Scholar]
- Garnier, Leonardo. 2026. Education: Why Not a Race to the Top? In The Global Governance of Education and Sustainable Development. Edited by David Brent Edwards, Jr., Amber Webb, Mohammad Niaz Asadullah and Husaina Banu Kenayathulla. Cham: Palgrave Macmillan. [Google Scholar] [CrossRef] [Scilit]
- Gbohoui, William, Waikei R. Lam, and Victor Lledo. 2019. The Great Divide: Regional Inequality and Fiscal Policy. IMF Working Paper WP/19/88. Washington, DC: International Monetary Fund. [Google Scholar] [CrossRef] [Scilit]
- González, Cristina. 2015. Social Policies in Contemporary Latin America: Families and Poverty in the Social Protection Systems. Social Sciences 4: 134–47. [Google Scholar] [CrossRef] [Scilit]
- Hall, Gillette, and Harry A. Patrinos, eds. 2006. Indigenous Peoples, Poverty and Human Development in Latin America. Basingstoke: Palgrave Macmillan. [Google Scholar] [CrossRef] [Scilit]
- Hanushek, Eric A., and Ludger Woessmann. 2008. The Role of Cognitive Skills in Economic Development. Journal of Economic Literature 46: 607–68. [Google Scholar] [CrossRef] [Scilit]
- Icefi (Instituto Centroamericano de Estudios Fiscales). 2017a. Incidencia de la Política Fiscal en la Desigualdad y la Pobreza en Guatemala. CEQ Working Paper No. 50. New Orleans: CEQ Institute, Tulane University. [Google Scholar]
- Icefi (Instituto Centroamericano de Estudios Fiscales). 2017b. Incidencia de la Política Fiscal en la Desigualdad y la Pobreza en Honduras. CEQ Working Paper No. 51. New Orleans: CEQ Institute, Tulane University. [Google Scholar]
- Icefi (Instituto Centroamericano de Estudios Fiscales). 2021. Perfiles Macrofiscales de Centroamérica No. 14 (Año 8). Guatemala City: Icefi. [Google Scholar]
- Kaztman, Rubén. 2001. Seducidos y abandonados: El aislamiento social de los pobres urbanos. Revista de la CEPAL 75: 171–89. [Google Scholar] [CrossRef] [Scilit]
- López, Néstor. 2005. Equidad Educativa y Desigualdad Social: Desafíos de la Educación en el Nuevo Escenario Latinoamericano. Buenos Aires: IIPE-UNESCO. [Google Scholar]
- Lustig, Nora, Carola Pessino, and John Scott. 2014. The Impact of Taxes and Social Spending on Inequality and Poverty in Argentina, Bolivia, Brazil, Mexico, Peru, and Uruguay: Introduction to the Special Issue. Public Finance Review 42: 287–303. [Google Scholar] [CrossRef] [Scilit]
- Lustig, Nora, Valentina Martínez-Pabón, and Carola Pessino. 2025. Fiscal Policy, Income Redistribution, and Poverty Reduction in Latin America. Oxford Open Economics 4: i426–i46. [Google Scholar] [CrossRef] [Scilit]
- Martínez Franzoni, Juliana, and Diego Sánchez-Ancochea. 2016. The Quest for Universal Social Policy in the South: Actors, Ideas and Architectures. Cambridge: Cambridge University Press. [Google Scholar] [CrossRef] [Scilit]
- Näslund-Hadley, Emma, and Haydée Alonzo. 2024. Inequality, Education, and Skills in Latin America: Evidence from the Regional Learning Assessment. Washington, DC: Inter-American Development Bank. [Google Scholar] [CrossRef] [Scilit]
- Nussbaum, Martha C. 2011. Creating Capabilities: The Human Development Approach. Cambridge, MA: Harvard University Press. [Google Scholar] [CrossRef] [Scilit]
- Prebisch, Raúl. 1949. El Desarrollo Económico de la América Latina y Algunos de sus Principales Problemas. Santiago: CEPAL. [Google Scholar]
- R Core Team. 2026. R: A Language and Environment for Statistical Computing. Vienna: R Foundation for Statistical Computing. Available online: https://www.R-project.org/ (accessed on 18 October 2026).
- Schneider, Aaron. 2012. State-Building and Tax Regimes in Central America. Cambridge: Cambridge University Press. [Google Scholar] [CrossRef] [Scilit]
- Sen, Amartya. 1999. Development as Freedom. New York: Alfred A. Knopf. [Google Scholar]
- UNDP (United Nations Development Programme). 2020. Human Development Report 2020: The Next Frontier, Human Development and the Anthropocene. New York: UNDP. [Google Scholar] [CrossRef] [Scilit]
- Urbina Poveda, Myriam Alexandra, Helen Magdalena Gómez, María Elena Jerez Calero, Erick Cuenca, Arcenio Córdova, and Víctor Cuenca. 2026. The Infrastructure Paradox in Ecuador: Public Investment and the Persistence of Territorial Disparities in Cantons with Low Initial Development. Economies 14: 139. [Google Scholar] [CrossRef] [Scilit]
- Van Eck, Nees Jan, and Ludo Waltman. 2010. Software Survey: VOSviewer, a Computer Program for Bibliometric Mapping. Scientometrics 84: 523–38. [Google Scholar] [CrossRef] [Scilit] [PubMed]
- Weßling, Katarina. 2023. Does the Region Make a Difference? Social Inequality in Transitions to Adulthood across Cohorts in West Germany. Social Sciences 12: 303. [Google Scholar] [CrossRef] [Scilit]
- World Bank. 2024. World Development Indicators [Dataset]. Available online: https://databank.worldbank.org (accessed on 16 July 2026).
- World Bank, UNESCO, UNICEF, FCDO, USAID, and Bill & Melinda Gates Foundation. 2022. The State of Global Learning Poverty: 2022 Update. Washington, DC: World Bank. [Google Scholar]

Disclaimer/Publisher’s Note: The statements, opinions and data contained in all publications are solely those of the individual author(s) and contributor(s) and not of MDPI and/or the editor(s). MDPI and/or the editor(s) disclaim responsibility for any injury to people or property resulting from any ideas, methods, instructions or products referred to in the content. |
© 2026 by the authors. Licensee MDPI, Basel, Switzerland. This article is an open access article distributed under the terms and conditions of the Creative Commons Attribution (CC BY) license.