


Abstract
This study examines geographic and socioeconomic patterns in interprovincial first-time placements to foundation universities in 12 destination provinces in Türkiye in 2024. The analysis distinguishes four mutually exclusive groups: undergraduate scholarship, undergraduate fee-paying, associate-degree scholarship, and associate-degree fee-paying placements. Destination-specific count models assessed group-specific associations with logarithmic road distance, average years of schooling, unemployment, and logarithmic GDP per capita in origin provinces, using the natural logarithm of the population aged 18–24 as an offset, with standard errors clustered by origin province. Direct coefficient contrasts, residual spatial diagnostics, and sensitivity analyses were conducted, with Benjamini–Hochberg correction applied within specified test families. In the main analysis, distance was significantly negatively associated with placement rates in 41 of 48 destination–group combinations. Socioeconomic associations were less widespread and varied across destinations, placement groups, and model specifications. Eleven of 192 two-way slope contrasts were significant, five involving particularly sparse groups, providing little evidence of systematic differences by scholarship status or programme level. Negative distance associations persisted in many sensitivity specifications, although spatial filtering substantially changed estimates in some destinations. Spatial filters captured much of the same geographic variation as distance, making changes in the distance estimates difficult to interpret. These province-level associations describe realised placements and do not establish individual access or causal effects.
1. Introduction
The expansion of higher education has increased educational opportunities, but these opportunities remain unevenly distributed across social groups and geographic areas (Chien et al. 2017; McCowan 2016; Trahar et al. 2020; Vieira Do Nascimento et al. 2022). The location of institutions, the resources available to prospective students, and the costs of studying away from home can shape participation. Interprovincial placement flows provide an observable outcome through which geographic and socioeconomic patterns in higher education placements can be examined. Understanding where students are placed, and how these patterns vary across educational pathways, can therefore contribute to debates on higher education access and regional disparities.
Geographic distance is central to this inquiry. Studying outside one’s province of residence may involve travel, accommodation, and other living expenses, alongside separation from family and established social networks (Kenyon 2011; Scanlon et al. 2019; Wang 2011). These considerations may make nearby institutions more attractive or feasible, particularly when financial resources are limited. Educational and economic conditions in provinces of origin may also be associated with the pathways students pursue (Chesters and Watson 2013; Cilesiz and Drotos 2016; Haveman and Smeeding 2006; Wanti et al. 2022). From a spatial interaction perspective, placements can be examined as flows between origins and destinations, with distance representing one dimension of their geographic separation. The association between distance and placement rates may vary across destinations and placement groups, making the consistency of this relationship an empirical question.
Foundation universities in Türkiye provide a relevant setting for examining these differences. They offer full-tuition scholarship places alongside fee-paying places, including those with partial tuition discounts (Higher Education Council of Türkiye (YÖK) n.d.). This structure creates distinct tuition arrangements within the same institutional sector. Differences between undergraduate and associate-degree programmes introduce a further dimension of variation. Tuition requirements, programme duration, institutional location, and the costs of studying away from home may be associated with the geographic reach of these pathways. Scholarship status, however, does not directly identify students’ household income, and the presence of an institution does not establish that its opportunities are equally accessible.
Previous research has documented socioeconomic inequalities in higher education participation and the relevance of geographic barriers (Trahar et al. 2020; Vieira Do Nascimento et al. 2022; Chesters and Watson 2013; Wanti et al. 2022; Sosu et al. 2018). It has also shown that expansion can coexist with stratification across institutional types and programme levels (Chien et al. 2017; Balbachevsky et al. 2019; Forsyth and Furlong 2003; Hall 2001). This study complements that literature by examining geographic and socioeconomic associations within the foundation university sector in Türkiye. Its empirical contribution lies in distinguishing four mutually exclusive placement groups, examining variation across destination provinces, and directly testing differences between group-specific associations within each destination. This approach allows differences that may be concealed by aggregate placement figures to be assessed without inferring group differences solely from separate significance tests.
The study examines interprovincial first-time placements to foundation universities in 12 destination provinces in Türkiye in 2024. The four groups are undergraduate scholarship, undergraduate fee-paying, associate-degree scholarship, and associate-degree fee-paying placements. Destination-specific count regression models assess associations with the natural logarithm of road distance, average years of schooling, the unemployment rate, and the natural logarithm of GDP per capita in origin provinces, adjusting placement counts for the population aged 18–24. Placement data were obtained from YÖK Atlas, road distances from the General Directorate of Highways, and provincial socioeconomic indicators from the Turkish Statistical Institute (Higher Education Council of Türkiye (YÖK) n.d.; General Directorate of Highways of Türkiye n.d.; Turkish Statistical Institute (TÜİK) n.d.). Direct coefficient contrasts assess differences across placement groups within each destination. Residual spatial diagnostics and sensitivity analyses examine the robustness of the findings to spatial dependence, alternative distance specifications, the inclusion of socioeconomic predictors, and the presence of foundation universities in origin provinces.
The analysis describes observed province-level placements, which represent one stage of the higher education access process and do not establish subsequent registration or attendance. Provincial socioeconomic indicators describe origin contexts rather than individual or household characteristics. The findings therefore provide evidence on geographic and socioeconomic patterns in placements without identifying individual preferences, actual relocation, or causal effects. The study addresses three research questions:
RQ1. How are road distance and the socioeconomic characteristics of origin provinces associated with interprovincial first-time placement rates to foundation universities?
RQ2. Within each destination province, do distance and socioeconomic associations differ by scholarship status and programme level?
RQ3. Do the findings change when different models are used, and do unexplained placement patterns still cluster geographically after accounting for spatial similarities?
2. Literature Review and Conceptual Framework
Research on higher education access distinguishes the expansion of educational provision from the equitable distribution of opportunities. Increased capacity can broaden participation without eliminating inequalities across social groups (Chien et al. 2017; McCowan 2016). Barriers to university entry can persist, particularly among socioeconomically disadvantaged students (Vieira Do Nascimento et al. 2022; Sosu et al. 2018; Forsyth and Furlong 2003), while wider participation can coexist with stratification in institutional quality and prestige (McCowan 2016). In Brazil, expansion largely absorbed by the private sector has had limited consequences for social inclusion, with institutional hierarchies and limited programme diversification persisting (Balbachevsky et al. 2019). Examining placements across scholarship categories and programme levels can therefore help describe how opportunities are distributed within an expanding system.
Geographic and financial barriers are closely connected dimensions of higher education access. Mobility constraints can restrict participation (Kenyon 2011), while financial considerations are relevant to higher education decisions among disadvantaged communities (Scanlon et al. 2019). Research in China also connects unequal access with social exclusion within the admission system (Wang 2011). In rural areas, institutional location and the availability of educational provision can further constrain opportunities (Trahar et al. 2020). Geographic proximity should therefore be considered alongside students’ financial circumstances and available educational options.
Geographic accessibility research examines both participation in higher education and student flows between origins and destinations. In Canada, students living beyond commuting distance from a university were less likely to attend, particularly those from lower-income families; additional costs of studying away from home were discussed as a possible explanation (Frenette 2006). In Germany, greater distance to the nearest university was associated with a lower likelihood of enrolment after adjustment for socioeconomic and regional characteristics (Spiess and Wrohlich 2010). These findings illustrate how geographic and socioeconomic barriers may overlap, although they concern university participation rather than the distribution of placements across destinations.
Gravity-model studies examine student flows between origins and destinations and differences in institutions’ geographic reach. In the Netherlands, flows were negatively associated with distance and housing rents and positively associated with urban amenities and programme diversity. Distance decay varied across regions and universities, with some specialised institutions attracting students nationally and others serving more regional areas (Sá et al. 2004). In the US state of Georgia, distance decay also varied across institutions and institution types, while proximity was associated with both participation in the University System of Georgia and the choice between colleges and universities within that system (Alm and Winters 2009). In Ireland, flows were associated with geographic and school-level characteristics. Distance associations varied across institutions and institution types and were weaker for institutions with higher quality and greater specialization (Cullinan and Duggan 2016).
Evidence from Türkiye also highlights transport connections. A gravity-model analysis of student flows between 81 provinces during 2018–2020 reported a negative association with distance and positive associations with student numbers and high-speed rail connections (Kolat et al. 2025). Together, these studies identify distance decay as a recurring pattern whose strength varies across institutional, geographic, and transport contexts.
Alongside geographic accessibility, family resources and educational background are relevant to higher education opportunities. In Australia, having a university-educated parent remained associated with university graduation despite expanding participation (Chesters and Watson 2013). Family income is also linked to resources for academic preparation and university entry (Haveman and Smeeding 2006), while students in high-poverty urban schools perceive risks in pursuing higher education and develop strategies to manage them (Cilesiz and Drotos 2016). Research in China further found that associations between social capital and higher education access varied by socioeconomic background, with digital literacy reported as a partial mediator (Wang et al. 2025). These studies highlight individual and family circumstances that provincial indicators cannot directly measure.
Educational expansion alone may have limited capacity to reduce poverty without broader social and economic changes (Brown and James 2020). Higher education access also involves conditions supporting continued participation and completion (Wanti et al. 2022), while overall participation rates can conceal socioeconomic inequalities (Ilie and Rose 2016). These concerns connect educational opportunities with social justice and social sustainability (Waghid 2014; Nilsson Dahlström 2025). In the present study, social sustainability provides contextual background for examining the distribution of educational opportunities rather than a construct measured or tested through placement data. The analysis therefore addresses the geographic distribution of placements without establishing students’ subsequent experiences, completion, or inclusion within higher education.
In Türkiye, foundation universities constitute a diverse institutional sector. They are described as nonprofit private universities and offer both fee-paying and full-tuition scholarship places (Keskiner and Gür 2023). Earlier research distinguished institutions primarily oriented towards meeting demand from a smaller group with more distinctive academic profiles (Mızıkacı 2010). Research has also examined undergraduate students’ profiles and expectations across five foundation universities in İstanbul (Hacıfazlıoğlu and Özdemir 2010). These studies provide context for examining institutional and student differences within the sector.
Research on university choice in Türkiye highlights institutional and financial considerations. A study of economics departments reported associations between university choice and academic performance, host-city population, language of instruction, and tuition fees (Çokgezen 2014). Among business administration students at foundation universities in İstanbul, the importance attached to educational costs, scholarships, employment prospects, and proximity to home and the city centre varied across family-income groups (Aydın and Bayır 2016). These findings support considering institutional characteristics alongside students’ financial and geographic circumstances.
Scholarships introduce a further distinction within the sector. Research on five nonprofit private universities indicates that students from relatively low-income families do not sufficiently benefit from merit-based scholarships (Keskiner and Gür 2023). Additional costs of studying away from home may also constrain participation (Frenette 2006; Spiess and Wrohlich 2010), even when tuition is covered. Scholarship placements therefore cannot directly identify socioeconomic disadvantage, but comparison with fee-paying placements allows geographic associations to be examined across tuition arrangements. Research on inequalities across educational pathways also supports distinguishing the forms of education students enter (Forsyth and Furlong 2003; McCowan 2016), providing a rationale for comparing undergraduate and associate-degree placements.
Taken together, this literature informs the selection of four predictors representing geographic separation and the educational and economic context of origin provinces. Selection was also guided by the availability of comparable provincial data for 2024. Logarithmic road distance captures one dimension of geographic accessibility. Average years of schooling describes the provincial educational context rather than applicants’ academic preparation or examination performance. GDP per capita characterises provincial economic conditions rather than household resources, while unemployment describes labour-market conditions. The dataset did not include comparable measures of institutional reputation, programme availability, tuition fees, or accommodation costs. The predictors therefore capture only some of the factors discussed in the literature, and their coefficients are interpreted as conditional associations rather than estimates of individual decision-making processes.
The framework supports examining whether these associations vary by scholarship status and programme level, without assuming a consistent direction of difference. Destination-specific models allow associations to vary across provinces, while direct coefficient contrasts assess differences between placement groups within each destination. Sensitivity analyses examine robustness to spatial filtering, an alternative distance specification, omission of schooling or GDP per capita, and adjustment for foundation institution presence in origin provinces.
3. Methods and Data
This study used cross-sectional origin–destination data for 2024 to examine first-time placements from provinces of origin to foundation universities in Türkiye. The analysis combined descriptive information on university programs and placements with destination-specific count regression models, sensitivity analyses, tests of residual spatial autocorrelation, and a false discovery rate correction for multiple testing.
3.1. Data and Analytical Scope
Student-placement data were obtained from YÖK Atlas, the official higher education information platform maintained by the Council of Higher Education (Higher Education Council of Türkiye (YÖK) n.d.). The 78 foundation universities examined in the 2024 dataset were located in 12 destination provinces: Ankara, Antalya, Bursa, Gaziantep, İstanbul, İzmir, Kayseri, Kocaeli, Konya, Mersin, Nevşehir, and Trabzon. These 12 provinces include all destinations represented in the dataset; no separate sampling of destination provinces was undertaken. Figure 1 shows their locations and the geographic distribution of foundation universities in 2024.
Figure 1.
Provinces Hosting Foundation Universities in Türkiye, 2024. Provinces highlighted in green are the 12 destinations included in the study.
In Türkiye, central placement in higher education is administered by the Measurement, Selection and Placement Centre (ÖSYM) through the national Higher Education Institutions Examination (YKS). Candidates submit ranked programme preferences, and allocation depends on placement scores, preference order, programme quotas, and eligibility requirements. Associate-degree programmes use the Basic Proficiency Test (TYT) score, whereas undergraduate programmes use numerical (SAY), verbal (SÖZ), equally weighted (EA), or foreign-language (DİL) scores, depending on the field (Ölçme, Seçme ve Yerleştirme Merkezi 2024). Full-tuition scholarship places at foundation universities are also allocated through this system. Scholarship placement therefore reflects examination performance and preferences and should not be interpreted as a direct indicator of financial need.
The placement data were compiled manually at the programme level. For each undergraduate and associate-degree programme, the relevant faculty or vocational-school page was accessed. For each programme, admission quotas were recorded, and placement counts by origin province were obtained from the YÖK Atlas category “Provinces of Origin of Placed Students” (“Yerleşenlerin Geldikleri İller”). These figures were then aggregated across programmes and institutions to obtain placement counts for each origin–destination pair. The province of origin is interpreted as the student’s province of residence, following YÖK’s report on student mobility based on the 2018 YKS. That report defines the province of residence as the province containing the candidate’s address registered with the General Directorate of Population and Citizenship Affairs at the time of the examination (Yükseköğretim Kurulu n.d.). First-time placements were selected as the outcome because they allow origin–destination flows to be examined consistently by scholarship status and programme level. They capture the geographical distribution of realised placements at the entry stage of higher education, while not establishing subsequent registration or attendance.
Table 1 presents programme entries, admission quotas, and first-time placements by destination province. The dataset contains 8237 programme entries across tuition and scholarship categories, with a total admission quota of 191,201 and 171,561 placements. İstanbul contained 47 of the 78 foundation universities represented in the dataset and accounted for 71.8% of all placements. These descriptive totals include students from the destination province and students whose province of origin was unknown.
Table 1.
Programme Entries, Admission Quotas, and First-Time Placements at Foundation Universities by Destination Province, 2024.
Table 2 summarises programme entries, admission quotas, and first-time placements by scholarship status and destination province. Full-tuition scholarship placements accounted for 30,254 students (17.6%), while fee-paying placements, including partially discounted places, accounted for 141,307 students (82.4%). Of the 141,307 fee-paying placements, 17,063 were in full-fee places, 21,466 in places with a 25% tuition discount, and 102,778 in places with a 50% tuition discount. Partially discounted places therefore accounted for 87.92% of fee-paying placements. These figures include placements originating in the host province and those with an unknown province of origin. These categories describe tuition arrangements and do not directly identify students’ socioeconomic backgrounds.
Table 2.
Programme Entries, Admission Quotas, and First-Time Placements by Scholarship Status and Destination Province, 2024.
Table 3 presents the distribution of first-time placements by province of origin for each destination. Host-province shares are calculated using total placements, including those with an unknown province of origin, as the denominator.
Table 3.
First-Time Placements by Origin Category and Destination Province, 2024.
For the interprovincial analysis, 54 placements classified as “Belli Değil” (unknown province of origin) were excluded. For each destination, placements originating in that destination province were also excluded. The other 80 provinces were retained as origins, including those with zero placements.
Placement counts were compiled for nine categories: total placements, scholarship placements, fee-paying placements, undergraduate placements, associate-degree placements, undergraduate scholarship placements, undergraduate fee-paying placements, associate-degree scholarship placements, and associate-degree fee-paying placements. The main regression analysis used the four mutually exclusive categories defined jointly by scholarship status and programme level: undergraduate scholarship, undergraduate fee-paying, associate-degree scholarship, and associate-degree fee-paying placements.
Population data for provinces of origin were obtained from the Turkish Statistical Institute (Turkish Statistical Institute (TÜİK) n.d.). Because the published age groups did not directly provide the population aged 18–24, this population was calculated by adding the 15–19 and 20–24 age groups and subtracting the separately reported population aged 15–17. The resulting figure was used as a common demographic reference for modelling placements across origin provinces.
3.2. Variables and Measurement
The dependent variable was the number of students placed for the first time in foundation universities in each destination province, classified by province of origin. The outcome represented realised placements rather than programme quotas, applications, total enrolment, or actual relocation. Placement counts were compiled for nine categories, with the main regression analysis restricted to the four mutually exclusive categories defined jointly by scholarship status and programme level. Scholarship placements referred to programmes providing a full tuition waiver, whereas fee-paying placements included both full-fee and partially discounted places.
The population aged 18–24 in each origin province was used as the exposure variable. Its natural logarithm was entered into the count regression models as an offset, with its coefficient fixed at one, to account for differences in the size of this population across origin provinces. The models therefore estimated population-adjusted placement rates rather than unadjusted placement counts.
Four explanatory variables were included: road distance between origin and destination provinces and three socioeconomic indicators measured at the origin-province level. Road distance was measured in kilometres between provincial centres using the official interprovincial distance matrix of the General Directorate of Highways (General Directorate of Highways of Türkiye n.d.). Average years of schooling was used as a province-level indicator of educational attainment. The provincial unemployment rate measured the percentage of the labour force aged 15 years and older that was unemployed. GDP per capita, measured in Turkish lira, was used as an indicator of provincial economic conditions. All socioeconomic indicators referred to 2024 and were obtained from the Turkish Statistical Institute (Turkish Statistical Institute (TÜİK) n.d.).
Road distance was entered in natural logarithmic form in the main models, while the linear specification per 100 km increase was examined in sensitivity analyses. GDP per capita was also entered in natural logarithmic form because its distribution was positively skewed. Average years of schooling and the unemployment rate were retained in their original units. The coefficients for logarithmic distance and logarithmic GDP per capita represent elasticities: a 1% increase in either predictor is associated with an approximately β% change in the population-adjusted placement rate, holding the other predictors constant, where β is the corresponding group-specific coefficient. Rate ratios associated with a doubling of road distance or GDP per capita were calculated as exp[β × ln(2)]. For schooling and unemployment, incidence rate ratios represent the multiplicative change in the population-adjusted placement rate associated with a one-year increase in average schooling and a one-percentage-point increase in unemployment, respectively.
The socioeconomic variables were measured at the origin-province level, while road distance was measured for each origin–destination pair. The estimated associations describe relationships between these characteristics and placement rates; they do not identify the schooling, employment, or income of individual students.
3.3. Statistical Analysis
To describe the spatial distribution of interprovincial placements, choropleth maps were produced using total first-time placement rates. For each origin–destination pair, the rate was calculated as the number of first-time placements divided by the origin province’s population aged 18–24, multiplied by 10,000. The destination province was excluded, while the remaining 80 origin provinces, including those with zero placements, were retained. Rates were classified into five categories using the natural-breaks method separately for each destination. Class boundaries therefore vary across maps, which depict within-destination spatial patterns rather than directly comparable rate classes across destinations.
Destination-specific count regression models were estimated in R version 4.5.2. For each destination province, the dataset was structured in long format, with four observations per origin province corresponding to mutually exclusive placement groups: undergraduate scholarship, undergraduate fee-paying, associate-degree scholarship, and associate-degree fee-paying placements. Each dataset therefore comprised 320 observations clustered within 80 origin provinces. Origin provinces with zero placements were retained.
Placement counts were modelled using a negative binomial distribution with a log link, except in Bursa and Gaziantep, where Poisson models were used. These two Poisson specifications were retained throughout the main and sensitivity analyses for comparability: the earlier negative binomial fit for Bursa approached the Poisson boundary, while estimation for Gaziantep encountered numerical difficulties. Negative binomial models were fitted using MASS::glm.nb, with the regression coefficients and a common ancillary parameter across the four placement groups being estimated by maximum likelihood under working independence. Poisson models were fitted using glm.
Statistical inference used an origin-clustered HC0 sandwich covariance matrix, calculated using sandwich::vcovCL with cadjust = FALSE, without an additional finite-cluster correction. This allowed dependence among the four placement-group observations within each origin province. In all models, the natural logarithm of the origin province’s population aged 18–24 was included as an offset, with its coefficient fixed at one. The models therefore estimated population-adjusted placement rates. Table 4 reports the distributions and dispersion parameters for the final logarithmic-distance models.
Table 4.
Distributions and dispersion parameters in the destination-specific logarithmic-distance models.
The explanatory variables were the natural logarithm of road distance, average years of schooling, the provincial unemployment rate, and the natural logarithm of GDP per capita. Logarithmic distance was selected as the primary specification because it provided better information-criterion fit in 10 of 12 destinations and better cross-validation performance in nine of the 11 destinations with complete scores (Supplementary Material S2). This specification allows the proportional association with an additional 100 km to vary with the initial distance. A linear specification per 100 km was retained for sensitivity analysis. Schooling and unemployment were retained in their original units. No predictor was z-standardized.
The final model included a separate intercept and separate slopes for all four explanatory variables in each placement group, yielding 20 mean-model coefficients per destination. This fully interacted specification allowed all four associations to vary across groups. All groups were retained, while estimates from particularly sparse groups were treated as exploratory.
Differences by scholarship status were tested as fee-paying minus scholarship slopes within each programme level. Differences by programme level were tested as associate-degree minus undergraduate slopes within each scholarship category. Three-way interaction contrasts tested whether the fee-paying–scholarship slope difference varied between programme levels. These contrasts were calculated as linear combinations of coefficients from the same fully interacted model, using its clustered covariance matrix.
Statistical inference was based on robust Wald tests. Omnibus tests assessed whether the four group-specific slopes for each explanatory variable were equal. Group-specific estimates were reported as incidence rate ratios (IRRs), with nominal 95% Wald confidence intervals. For logarithmic distance and logarithmic GDP per capita, IRRs were calculated as exp[β × ln(2)] and represented the association with a doubling of the predictor. For schooling and unemployment, IRRs were calculated as exp(β) and represented associations with a one-year increase in average schooling and a one-percentage-point increase in unemployment, respectively. Confidence intervals were calculated using the same scaling. An IRR below one indicated a lower population-adjusted placement rate as the predictor increased. Exponentiated slope contrasts, scaled to the same predictor increment, represented ratios of group-specific IRRs rather than ratios of placement levels. Differences between groups were evaluated through direct statistical tests rather than inferred from separate significance classifications.
3.4. Residual Spatial Autocorrelation
Residual spatial autocorrelation was assessed using Pearson residuals from the main unfiltered models and the spatially filtered models described in Section 3.6. Global Moran’s I was calculated separately for each destination province and placement group using first-order queen contiguity and row-standardized spatial weights. The unfiltered models yielded 48 diagnostic tests (12 destinations × four placement groups) and were the same models used in the main analysis.
All 80 origin provinces were retained in the regressions. For Moran’s I, origins with no neighbour after the destination province was excluded were omitted from the diagnostic. This affected Kilis in the Gaziantep models, leaving 79 origins for these tests and 80 elsewhere. Statistical evidence was assessed using two-sided permutation tests with 999 permutations. Across the unfiltered and four spatial-filter specifications, 236 tests were estimable because Kayseri’s eight-filter model could not be estimated. Benjamini–Hochberg adjustment was applied jointly to these 236 Moran’s I tests.
Origin-clustered robust covariance estimation accounted for dependence among placement-group observations within the same origin province but did not directly account for dependence between neighbouring provinces. Moran’s I therefore assessed spatial dependence remaining after model adjustment. Results are reported in Supplementary Material S1, Tables S1b–S12b.
3.5. Multiple Testing Adjustment
The Benjamini–Hochberg procedure was applied separately to five families of tests from the final models: 192 tests of group-specific slopes (12 destinations × four placement groups × four explanatory variables); 48 omnibus tests of slope equality across the four groups (12 destinations × four explanatory variables); 96 comparisons between fee-paying and scholarship slopes within programme levels; 96 comparisons between associate-degree and undergraduate slopes within scholarship categories; and 48 tests assessing whether scholarship-related slope differences varied by programme level.
Adjustments used full-precision p-values, and statistical significance was defined as an adjusted p-value (q) below 0.05. The reported 95% Wald confidence intervals were not adjusted for multiple testing. Intercepts were excluded from these test families. Equivalent parameterizations of the same model were not counted as additional tests. Sensitivity analyses used the separate test families specified in Section 3.6, so significance classifications across analyses could differ even when coefficients coincided.
Omnibus comparisons of the four group-specific slopes used robust Wald tests with three degrees of freedom. The three-contrast covariance matrices had full rank in all 48 tests. This numerical property does not remove the uncertainty associated with sparse placement counts. Kayseri’s associate-degree scholarship and fee-paying groups contained seven and four placements, respectively, while Bursa’s associate-degree fee-paying group contained 11. Estimates and contrasts involving these groups were therefore treated as exploratory. As a sensitivity check, the Benjamini–Hochberg adjustments were repeated within each test family after excluding Kayseri.
3.6. Sensitivity Analyses
Four sets of sensitivity analyses assessed whether the estimated associations depended on spatial filtering, the functional form of distance, the joint inclusion of schooling and GDP per capita, or the presence of foundation institutions in origin provinces. These analyses used the same R modelling framework, log link, group-specific intercepts and slopes, population offset, and origin-clustered HC0 covariance estimation as the main analysis. Except for the linear-distance comparison, all sensitivity analyses used logarithmic distance. Negative binomial specifications estimated a common dispersion parameter across the four placement groups within each destination and specification. Poisson models were used when the estimated dispersion reached the Poisson boundary.
Bursa and Gaziantep used Poisson distributions throughout the main and sensitivity analyses. In the spatial filtering analyses, Kayseri’s four- and six-filter models and Konya’s eight-filter model also reached the Poisson boundary. To assess overlap between distance and the filters, Pearson correlations were calculated across the 80 origin provinces between each selected eigenvector and both road distance and logarithmic distance. Joint overlap was summarised by the R2 from projecting each distance measure onto the selected filter sets (Supplementary Material S1, Tables S13a–S14b). The spatial filters were not constrained to be orthogonal to distance.
First, spatial filters were derived from the destination-specific queen-contiguity matrix. Let W denote the row-standardized spatial weights matrix and M = I − 11′/n the centring matrix, where I is the identity matrix, 1 is a vector of ones, and n = 80. Eigenvectors of M[(W + W′)/2]M with eigenvalues greater than 10−8 were ranked by decreasing eigenvalue. Nested specifications included the first two, four, six, or eight eigenvectors, each interacted with placement group to allow group-specific filter coefficients. Distance estimates and residual spatial autocorrelation were compared between the main unfiltered model and the filtered specifications. These comparisons assessed how the estimated distance associations changed when broader spatial patterns were included.
All 80 origins were retained in the regressions and spatial-filter construction. For Moran’s I, Kilis was excluded from the Gaziantep diagnostic because it had no neighbour after the destination province was removed. Moran’s I was calculated separately for each placement group using queen contiguity and row-standardized spatial weights. Two-sided permutation p-values were calculated using 999 permutations, with a plus-one correction applied to each tail and the two-sided p-value defined as twice the smaller tail probability. The random seed was reset to 20261010 for each destination–specification combination, with the four groups evaluated sequentially. Kayseri’s eight-filter model could not be estimated and was omitted. Benjamini–Hochberg adjustments were applied separately to the 236 estimable distance tests and the 236 residual Moran’s I tests across baseline and filtered models.
Second, the primary logarithmic-distance specification was compared with a linear specification expressed per 100 km. Both specifications used Poisson models for Bursa and Gaziantep and negative binomial models for the other destinations. Model comparisons used the Akaike information criterion (AIC), the Bayesian information criterion (BIC), and cross-validated negative log scores. Predictive performance was assessed using 10-fold cross-validation at the origin-province level, with all four placement-group observations from each province assigned to the same fold. Within each destination, identical folds were used for both distance specifications. Overall cross-validation scores were not reported for Kayseri because one fold failed in each specification. AIC and BIC were calculated from the working-independence likelihood and did not incorporate the clustered covariance correction. Benjamini–Hochberg adjustment was applied jointly to the 96 distance tests from the two specifications across 12 destinations and four placement groups (Supplementary Material S2).
Third, the full model was compared with two reduced specifications that omitted GDP per capita or schooling, respectively. Unemployment and logarithmic distance were retained in both reduced models. Benjamini–Hochberg adjustment was applied jointly to all group-specific predictor slope tests within each specification. The full model comprised 192 tests (12 destinations × four placement groups × four predictors), and each reduced model comprised 144 tests (12 destinations × four placement groups × three predictors). The three specifications therefore formed three separate test families, comprising 480 tests in total. Full and reduced model estimates are reported in Supplementary Material S3, Tables S27–S30, and the four-predictor correlation matrices are summarised in Table S31.
Fourth, an extended specification included group-specific coefficients for the presence of a foundation university or foundation vocational school in the origin province. The indicator was coded as one for presence and zero for absence, based on the 2024 institutional dataset. After excluding the destination province, each dataset contained 11 origins with a foundation institution and 69 without one. The indicator measured institutional presence rather than capacity or programme availability. Benjamini–Hochberg adjustment was applied jointly to the 192 group-specific slope tests for distance, schooling, unemployment, and logarithmic GDP per capita, separately within the baseline and extended specifications. The 48 institution-presence slope tests in the extended specification formed a separate test family. This yielded three test families: two containing 192 tests each and one containing 48 tests (Supplementary Material S4).
Distance and GDP per capita IRRs were expressed for a doubling of the predictor, calculated as exp[β × ln(2)], except that distance IRRs in the linear specification referred to a 100 km increase. Distance IRRs from the two functional forms therefore represented different increments and were not directly comparable as equivalent changes. Confidence intervals remained nominal 95% Wald intervals throughout the sensitivity analyses. Statistical evidence after adjustment was assessed using q < 0.05. Changes in statistical significance between specifications were not interpreted as evidence of statistically significant differences between their coefficients. Estimates and contrasts involving sparse placement groups were treated as exploratory.
4. Results
This section presents descriptive spatial patterns for 12 destination provinces and regression findings for four mutually exclusive placement groups: undergraduate scholarship, undergraduate fee-paying, associate-degree scholarship, and associate-degree fee-paying placements. Descriptive statistics and counts of origin provinces with zero placements are provided in Supplementary Material S5, Table S39. The results first summarise placement counts, followed by maps of total interprovincial first-time placement rates, distance associations, socioeconomic associations, differences by scholarship status and programme level, and residual spatial autocorrelation and sensitivity analyses. Regression estimates are reported as incidence rate ratios (IRRs) with nominal 95% confidence intervals. For analyses subject to Benjamini–Hochberg correction, statistical significance is assessed using adjusted p-values (q < 0.05), with the relevant test family specified in each table note. Confidence intervals are not adjusted for multiple testing. Findings from sparse placement groups are interpreted cautiously.
Table 5 reports total interprovincial placements and the number of origin provinces with at least one placement for each destination and placement group.
Table 5.
Total interprovincial first-time placements and origin provinces with placements, by destination and placement group.
4.1. Geographic Distribution of Interprovincial First-Time Placement Rates
Figure 2 presents total interprovincial first-time placement rates for Antalya, İstanbul, and Kayseri. These unadjusted maps describe spatial patterns within each destination. Maps for the remaining nine destination provinces are presented in Supplementary Material S6 (Figure S1).
Figure 2.
Interprovincial First-Time Placement Rates to Foundation Universities in (a) Antalya, (b) İstanbul, and (c) Kayseri, 2024. Note: Rates represent total first-time placements per 10,000 residents aged 18–24 in each origin province. The destination province is excluded from the calculations and shown in grey. Five natural-breaks classes were defined separately for each destination; colours therefore do not represent identical numerical ranges across panels. Where present, zero-placement origins are included in the lowest rate class. Numbers in parentheses in the legends indicate the number of origin provinces in each class. Source: Author’s calculations based on YÖK Atlas and Turkish Statistical Institute data.
Higher rate classes for Antalya and Kayseri were concentrated mainly in nearby origin provinces. İstanbul displayed a broader geographic pattern, with higher rate classes across several western and northwestern provinces and a band in southeastern Türkiye despite its distance from the destination. Much of the interior fell within lower rate classes. Because class boundaries were defined separately for each destination, comparisons of rate levels should be based on the numerical legend values rather than colours alone.
4.2. Distance and Placement Rates
Logarithmic distance was significantly negatively associated with population-adjusted placement rates in 41 of the 48 destination–group combinations after Benjamini–Hochberg correction (Table 6; Figure 3). Significant negative associations were observed in all four placement groups in Ankara, Antalya, Gaziantep, İzmir, Konya, Mersin, Nevşehir, and Trabzon. In Bursa and İstanbul, significant negative associations were confined to undergraduate and associate-degree fee-paying placements. In Kocaeli, they were observed in undergraduate fee-paying and both associate-degree groups. In Kayseri, negative associations were significant in the two undergraduate groups, while the associate-degree fee-paying group showed a significant positive association. This positive estimate was based on only four placements and was interpreted as exploratory.
Table 6.
Associations with a doubling of road distance by destination province and placement group.
Figure 3.
Associations with a doubling of road distance by destination province and placement group. Note: Points show IRRs for a doubling of road distance; horizontal lines show nominal 95% Wald confidence intervals. The horizontal axis is logarithmic, and the dashed line marks IRR = 1. Filled points indicate q < 0.05; open points indicate q ≥ 0.05, based on Benjamini–Hochberg adjustment across 192 group-specific slope tests. Confidence intervals are not adjusted for multiple testing. † denotes sparse placement groups—both associate-degree groups in Kayseri and the associate-degree fee-paying group in Bursa—whose estimates are interpreted as exploratory.
Among the 41 significant negative estimates, IRRs ranged from 0.130 to 0.726, corresponding to approximately 27.4–87.0% lower population-adjusted placement rates for a doubling of road distance, conditional on the included socioeconomic variables. These findings indicate a widespread negative distance association, with variation across destinations and placement groups. Direct tests of differences between group-specific slopes are presented in Section 4.4.
4.3. Socioeconomic Associations
Average years of schooling was significantly associated with population-adjusted placement rates in three of the 48 destination–group combinations after Benjamini–Hochberg correction (Table 7). Positive associations were observed for undergraduate fee-paying placements in Ankara (IRR = 1.630, 95% CI [1.100–2.416], q = 0.0496) and associate-degree fee-paying placements in Gaziantep (IRR = 1.983, 95% CI [1.348–2.917], q = 0.002). A negative association was observed for associate-degree fee-paying placements in Kayseri (IRR = 0.028, 95% CI [0.004–0.208], q = 0.002). However, the Kayseri estimate was based on only four placements and was interpreted as exploratory. No other schooling associations remained significant after correction.
Table 7.
Associations between average years of schooling and placement rates by destination province and placement group.
The origin-province unemployment rate was significantly associated with population-adjusted placement rates in five of the 48 destination–group combinations after Benjamini–Hochberg correction (Table 8). Negative associations were observed for undergraduate fee-paying placements in Ankara and associate-degree fee-paying placements in Bursa. Positive associations were observed for associate-degree scholarship placements in Bursa and Konya and undergraduate scholarship placements in Kayseri. These mixed directions indicate no uniform unemployment-related pattern. Bursa’s associate-degree fee-paying estimate warrants particular caution because it was based on 11 placements from seven origin provinces.
Table 8.
Associations between unemployment rate and placement rates by destination province and placement group.
GDP per capita was significantly negatively associated with population-adjusted placement rates in eight of the 48 destination–group combinations after Benjamini–Hochberg correction (Table 9). All significant associations occurred in fee-paying groups: undergraduate placements in Ankara, Antalya, Bursa, Gaziantep, İzmir, and Kayseri, and associate-degree placements in Gaziantep and Mersin. No GDP per capita association remained significant in the scholarship groups. This pattern does not, by itself, establish differences between scholarship and fee-paying slopes; direct comparisons are presented in Section 4.4. The sensitivity of these conditional associations to the joint inclusion of schooling and GDP per capita is examined in Section 4.5.
Table 9.
Associations with a doubling of GDP per capita by destination and placement group.
4.4. Differences in Slopes by Scholarship Status and Programme Level
Omnibus tests identified unequal group-specific slopes in 11 of 48 destination–predictor combinations (Table 10): distance in Bursa, Gaziantep, İzmir, Kayseri, and Konya; schooling in Kayseri; unemployment in Ankara, Bursa, İzmir, and Konya; and GDP per capita in Nevşehir. Kayseri’s findings are exploratory because of its sparse associate-degree groups. Direct contrasts identified 11 significant differences among 192 two-way tests, five involving Kayseri’s associate-degree groups or Bursa’s sparse associate-degree fee-paying group. Thus, the results provide little evidence of systematic differences by scholarship status or programme level.
Table 10.
Omnibus Wald tests of slope equality across the four placement groups.
Five scholarship-status contrasts were significant after correction across 96 tests. For undergraduate placements, the distance IRR was lower in fee-paying than scholarship groups in Bursa (ratio = 0.282, 95% CI [0.139–0.574], q = 0.012) and İzmir (0.603 [0.498–0.731], q < 0.001). Three further contrasts involved sparse associate-degree groups: unemployment in Bursa (0.393 [0.263–0.587], q < 0.001), and distance (4.251 [1.880–9.615], q = 0.012) and schooling (0.015 [0.001–0.213], q = 0.037) in Kayseri. These three estimates are exploratory.
Six programme-level contrasts were significant after correction across 96 tests. Associate-degree slopes exceeded undergraduate slopes for unemployment within Ankara’s fee-paying groups (IRR = 1.141, 95% CI [1.072–1.214], q = 0.001) and İzmir’s scholarship groups (1.154 [1.070–1.244], q = 0.004), and for GDP within Nevşehir’s fee-paying groups (3.605 [2.055–6.323], q < 0.001). Within Konya’s scholarship groups, the distance slope was lower for associate-degree than undergraduate placements (IRR = 0.365, 95% CI [0.187–0.712], q = 0.04997), but this contrast did not remain significant when the correction excluded Kayseri (q = 0.069). Kayseri’s fee-paying distance and schooling contrasts also met the threshold but involved its four-placement associate-degree group and are exploratory.
Two of 48 three-way interactions were significant: unemployment in Bursa (q = 0.040) and schooling in Kayseri (q = 0.003). Both involved particularly sparse groups. Bursa’s interaction no longer met the threshold when correction excluded Kayseri (q = 0.073). These findings do not establish a stable general interaction between programme level and scholarship status. With only 80 origin clusters per destination, sparse outcomes and multiple-testing correction may have limited the ability to detect slope differences. No formal power analysis was performed, and nonsignificant contrasts do not establish equivalence.
4.5. Spatial Diagnostics and Sensitivity Analyses
This section presents residual spatial diagnostics and sensitivity analyses examining spatial filtering, alternative distance specifications, the joint inclusion of schooling and GDP per capita, and foundation institution presence in origin provinces. Table 11 summarises distance estimates from the primary logarithmic model, its eight-filter extension, and the linear-distance specification.
Table 11.
Distance estimates under the primary, eight-filter, and linear specifications.
Across the unfiltered and filtered specifications, 12 of 236 residual Moran’s I tests remained significant after correction (Supplementary Material S1). Spatial adjustment reduced residual dependence in several models, but more filters did not uniformly improve the diagnostics. With eight filters, no Moran’s I test was significant except for negative residual spatial autocorrelation in Antalya’s undergraduate scholarship group. Kayseri’s eight-filter specification was not estimable.
Distance results were sensitive to spatial specification (Table 11; Supplementary Material S1). In Ankara, the undergraduate fee-paying association remained negative and significant with two filters, but no group remained significant with four, six, or eight. In İstanbul, no distance association remained significant with six or eight filters; the associate-degree point estimates were positive but nonsignificant. İzmir retained negative significant associations in three groups with eight filters; its undergraduate scholarship group narrowly missed the threshold (q = 0.0547). All four groups retained negative significant associations with eight filters in Antalya, Gaziantep, Konya, Mersin, Nevşehir, and Trabzon. These are sensitivity results, not evidence that either the unfiltered or filtered coefficient uniquely isolates distance.
The eight filters jointly explained 69.7–94.4% of the variation in log distance, including 84.2% in Ankara, 94.4% in İstanbul, and 85.1% in İzmir. For linear road distance the range was 85.0–95.3%. Individual eigenvector correlations and joint R2 values are reported for every destination (Supplementary Material S1, Tables S13a–S14b). The substantial overlap means that filters can absorb geographic variation associated with distance, so attenuation after filtering cannot establish that the main association was spurious.
The logarithmic specification had lower AIC and BIC in 10 of 12 destinations; the linear form was favoured in Ankara and Kayseri. The Bursa AIC difference was small (0.91). Cross-validation favoured logarithmic distance in nine of the 11 destinations with complete scores, while the linear form performed better in Ankara and Kocaeli. These comparisons supported logarithmic distance as the primary form while retaining linear results as sensitivity estimates (Supplementary Material S2; Table 11). The form-comparison correction covered 96 distance tests, whereas the main correction covered 192 slopes across all four predictors. Consequently, Kocaeli’s logarithmic estimates were significant in all four groups under the former correction but in three under the latter; their coefficients and confidence intervals were identical. Linear per-100-km IRRs and logarithmic per-doubling IRRs represent different increments.
When GDP or schooling was omitted, negative distance associations remained significant in all three specifications for 40 of 48 combinations (Supplementary Material S3, Tables S27–S30). Socioeconomic estimates were less stable. Schooling and log GDP were strongly correlated across origins within each destination (r = 0.762–0.789; Table S31). For Antalya’s undergraduate fee-paying group, the schooling estimate changed from positive and nonsignificant in the full model (IRR = 1.613, q = 0.246) to negative and significant without GDP (0.631, q = 0.002). This reversal and the correlated predictors limit interpretation of their separate coefficients. The reduced estimates are presented alongside the full estimates rather than treated as independent effects of education and economic resources.
Adding origin-province foundation institution presence preserved all 48 distance coefficient signs. The baseline had 41 significant negative distance associations and one exploratory positive association; the extended model had 40 significant negative associations and no significant positive association. The two threshold changes involved Bursa’s and Kayseri’s sparse associate-degree fee-paying groups. Seven of eight negative GDP associations persisted; Bursa’s undergraduate fee-paying association no longer met the threshold. None of the 48 institution-presence coefficients survived their separate correction (minimum q = 0.523). AIC favoured the extended model only in Gaziantep, with a small improvement (ΔAIC = −1.82); BIC favoured the baseline everywhere. These results provide limited support for adding this coarse indicator, which does not capture local institutional capacity (Supplementary Material S4, Tables S32–S38).
5. Discussion
This study documents geographic and socioeconomic associations in interprovincial first-time placements to foundation universities in Türkiye, with variation across destination provinces and differences between placement groups in specific destinations. Negative distance associations in both scholarship and fee-paying groups across most destinations suggest that geographic proximity remains relevant across tuition arrangements. This pattern is consistent with research showing that student flows decline with distance and that distance associations vary across institutions (Sá et al. 2004; Alm and Winters 2009; Cullinan and Duggan 2016). Negative associations in scholarship groups are also consistent with the view that tuition coverage does not eliminate all costs of studying away from home. Additional living and relocation costs have been discussed as possible explanations for geographic differences in university participation (Frenette 2006; Spiess and Wrohlich 2010). These costs were not measured directly in the present study, so the observed associations cannot be attributed to them.
The widespread negative distance association highlights the relevance of institutions’ regional location. Its implications for the sector should also be considered alongside İstanbul’s large share of placements and comparatively weak distance decay. İstanbul accounted for 71.8% of all placements in the dataset, making its geographic pattern particularly relevant to the sector’s overall distribution. The concentration of foundation universities in western Türkiye means that eastern origins are farther from many institutions, but destination-specific associations alone cannot establish geographic exclusion of young people in the east. The study covers realised placements to foundation universities and excludes unsuccessful applicants and public-university placements, so it does not assess access to higher education as a whole.
Using logarithmic distance as the primary specification reflects its better fit and predictive performance in most destinations. Under this specification, an additional 100 km is associated with different proportional changes depending on the initial distance. Reporting IRRs for a doubling of distance provides a common proportional increment for interpreting the estimates across destinations. However, differences in distance distributions, institutional composition, and unmeasured origin–destination connections limit direct comparisons between destination-specific estimates. Analyses using linear distance, omitting schooling or GDP per capita, and adding origin-province institution presence provide complementary sensitivity checks (Supplementary Materials S2–S4).
Spatial filtering shows that distance associations were sensitive to spatial adjustment in some destinations. In Ankara, no distance association remained statistically significant with four or more filters, and none remained significant in İstanbul with six or eight. İzmir retained significant negative associations in three groups with eight filters. The filters overlap strongly with log distance and may capture both residual spatial dependence and geographic variation associated with distance itself (Supplementary Material S1, Tables S13a–S14b). A weaker coefficient or a change in its sign after filtering therefore does not, by itself, establish that the main association was spurious. These models show how the findings change with spatial adjustment, but cannot definitively separate distance from other geographic influences.
Schooling was significantly associated with placement rates in three groups, and its estimates were sensitive to GDP adjustment. The full model showed positive associations for undergraduate fee-paying placements in Ankara and associate-degree fee-paying placements in Gaziantep. A negative association in Kayseri’s associate-degree fee-paying group was treated as exploratory because it was based on only four placements. In Antalya’s undergraduate fee-paying group, the schooling estimate changed from positive and nonsignificant to negative and significant when GDP per capita was omitted. The strong correlations between schooling and log GDP per capita (r = 0.762–0.789) complicate interpretation of their separate associations (Supplementary Material S3, Table S31). Previous research highlights the relevance of individual and family educational resources to higher education opportunities (Chesters and Watson 2013; Cilesiz and Drotos 2016; Haveman and Smeeding 2006). Provincial average schooling does not directly measure these resources, so the limited findings do not establish that they are unimportant.
Unemployment was significantly associated with placement rates in five groups, with mixed directions. Associations were negative for undergraduate fee-paying placements in Ankara and associate-degree fee-paying placements in Bursa, and positive for associate-degree scholarship placements in Bursa and Konya and undergraduate scholarship placements in Kayseri. Some associations changed in statistical significance when schooling or GDP per capita was omitted (Supplementary Material S3). These findings do not support a consistent direction of association between provincial unemployment and placement rates. The unemployment rate describes labour-market conditions in the origin province rather than students’ or households’ employment and financial circumstances.
The eight significant GDP per capita associations in the main model were negative and occurred in fee-paying groups. Higher origin-province GDP per capita was therefore associated with lower population-adjusted interprovincial placement rates in these groups, after adjustment for schooling and the other predictors. This does not imply lower participation among higher-income students, because provincial GDP per capita does not directly measure household income. Omitting schooling produced additional associations in scholarship groups and a positive estimate for Nevşehir’s associate-degree fee-paying group, showing that the findings depended on which predictors were included (Supplementary Material S3). Seven of the eight negative associations remained significant after adding origin-province institution presence (Supplementary Material S4). However, institutional presence alone does not capture local capacity or programme availability, so these results cannot rule out a role for local educational opportunities.
Direct comparisons provided limited evidence of systematic differences by scholarship status or programme level. Eleven of 192 two-way slope comparisons were significant, five involving particularly sparse placement groups. Among the remaining six, Konya’s distance comparison between programme levels within scholarship placements no longer met the significance threshold when Kayseri was excluded from the multiple-testing adjustment. Both significant three-way interactions also involved sparse groups. These findings indicate differences in specific destinations and groups rather than a consistent pattern across destinations. Sparse counts, the 80 origin clusters per destination, and multiple-testing adjustment may have limited the ability to detect differences, although no formal power analysis was performed. Nonsignificant comparisons therefore do not establish that the slopes are equal.
İstanbul warrants separate attention because it hosted 47 of the 78 foundation universities in the dataset and accounted for 71.8% of all placements; 72.7% of its placements originated within the host province (Table 3). The models describe the remaining interprovincial component. Distance associations were negative and significant in both fee-paying groups, while no socioeconomic association was significant. Its comparatively weak distance decay and the southeastern band of higher rate classes in Figure 2b indicate a geographic reach extending beyond nearby origins. Institutional differences and university-choice factors, including academic reputation, location, language of instruction, and tuition fees, provide possible contexts for interpreting this pattern (Mızıkacı 2010; Çokgezen 2014). Programme diversity and urban amenities may also be relevant to student flows (Sá et al. 2004), alongside the additional costs of studying away from home (Frenette 2006; Spiess and Wrohlich 2010). These characteristics were not measured directly, so their contributions cannot be established. Positive associate-degree distance estimates after extensive spatial filtering were nonsignificant and do not establish a positive distance association.
Host-province shares ranged from 14.9% in Nevşehir to 88.6% in Bursa and were also high in Kayseri (84.6%) and Konya (81.4%). In Nevşehir, Trabzon, and Mersin, interprovincial placements formed the majority (Table 3). The models therefore describe a relatively small share of total placements in some destinations and a larger share in others. Kocaeli’s proximity to İstanbul also raises the possibility that educational options across provincial boundaries are relevant to its placement patterns. Three of its four distance associations were significant in the logarithmic model, but the analysis did not directly test the role of proximity to İstanbul.
Realised placements capture only one dimension of higher education access. The available data cannot identify students prevented from participating because of costs or determine which forms of support would increase participation. The limited and specification-sensitive socioeconomic associations do not imply that individual economic and educational circumstances are unimportant. Research at the university and programme levels could examine tuition fees, examination performance, institutional reputation, accommodation costs, and transport accessibility together. Student surveys and interviews could help explain the preferences and constraints underlying the observed patterns. From a social sustainability perspective, the study makes the geographic distribution of placements visible, while recognising that these patterns alone cannot establish whether inclusion has been achieved or particular groups have been excluded.
6. Limitations
This study has several limitations. First, the analysis uses cross-sectional data for 2024. It identifies associations within a single year but cannot establish causal relationships or determine how geographic and socioeconomic patterns in placements change over time. Longitudinal data would be needed to examine changes in placement patterns and their relationships with institutional expansion, economic conditions, or policy changes.
Second, the unit of analysis is the province of origin rather than the individual student or household. Average years of schooling, unemployment, and GDP per capita describe provincial conditions and do not directly measure parental education, household employment, or students’ financial resources. Within-province inequalities may therefore remain obscured. A placement from a province with lower GDP per capita does not establish that the student comes from a low-income household, and scholar-ship status alone does not identify socioeconomic disadvantage. The absence of individual-level data also prevents direct examination of students’ preferences, motivations, information sources, and perceived barriers. Moreover, schooling and GDP estimates were sensitive to whether both indicators were included in the model, limiting the conclusions that can be drawn about their separate associations with placement rates.
Third, first-time placements capture one stage of participation in a specific higher education sector. The data do not identify the full set of institutions students considered, their preference rankings, unsuccessful applications, or those who did not apply. Placements do not necessarily result in registration, attendance, completion, or relocation. The study therefore cannot directly estimate individual admission probabilities or evaluate access to higher education as a whole. Excluding placements originating in the host province focuses the analysis on interprovincial flows but leaves local participation outside the regression framework. The interpretation of origin as residence also assumes that the definition documented for the 2018 YKS remained applicable to the 2024 YÖK Atlas category; this could not be independently confirmed.
Fourth, the population aged 18–24 provides a common demographic reference for modelling placement rates, but it is not equivalent to the eligible or actual applicant population. Provinces may differ in secondary school completion, entrance-examination participation, and delayed entry into higher education. The models do not account for province-level examination performance, which may help explain variation in placements, particularly in full-tuition scholarship places. Some placed students may also fall outside this age range. The offset accounts for differences in the size of the reference population but does not adjust for these differences in the population potentially seeking a place.
Fifth, aggregation at the destination-province level combines universities and programmes that may differ substantially in size, capacity, tuition fees, scholarship provision, academic selectivity, reputation, and employment prospects. The models do not distinguish these characteristics or directly incorporate destination housing costs, living expenses, transport connections, and cultural amenities. Separate destination models allow associations to vary across provinces but do not identify the contributions of these destination characteristics. Likewise, the origin-province institution-presence indicator does not capture institutional capacity, programme diversity, or the suitability of local opportunities for prospective students. Omitted factors may influence the estimated associations where they are related to the included predictors. The findings should therefore be interpreted as provincial patterns rather than comparisons between equivalent institutions. The fee-paying category combines full-fee placements with placements receiving 25% or 50% tuition discounts. This grouping supports the comparison between full-tuition scholarship placements and placements requiring some tuition payment, but may obscure differences across tuition-discount categories. These categories were not modelled separately, so the findings do not establish whether their geographic and socioeconomic associations differ.
Sixth, road distance captures only one dimension of accessibility. It does not measure travel time, service frequency, fares, access to air or rail transport, or differences in accessibility within provinces. Spatial filtering reduced residual dependence in some specifications, but it did not consistently eliminate it, and distance estimates changed substantially in certain destinations. Origin-clustered robust covariance estimation does not directly account for dependence between neighbouring provinces. Furthermore, distance and spatial filters may capture overlapping geographic variation, complicating interpretation of changes in the coefficients. The filtering analyses therefore show how the findings change under spatial adjustment, but cannot definitively separate distance from other geographic influences. Future research could compare alternative spatial count models and spatial interaction specifications.
Finally, the analysis involves multiple tests across destinations, predictors, and group comparisons. FDR correction addresses multiple testing within the specified test families but does not remove uncertainty arising from model specification, omitted variables, or spatial dependence. Sparse counts, particularly in Kayseri’s associate-degree groups and Bursa’s associate-degree fee-paying group, produced substantial uncertainty and limit the reliability of some estimates and contrasts. Counts of significant associations should not be interpreted as measures of effect size, and differences in significance between group-specific associations do not establish differences between their coefficients. Direct contrasts address the latter question, but nonsignificance does not establish equivalence. With 80 origin clusters per destination, sparse outcomes and multiple-testing correction may have limited power to detect group differences; no formal power analysis was performed. Future research combining student-level socioeconomic information with institutional and programme characteristics could provide a more detailed account of the mechanisms underlying the patterns identified here.
7. Conclusions
This study examined how interprovincial first-time placements to foundation universities in Türkiye were associated with distance and the socioeconomic characteristics of origin provinces, and how these associations differed across placement groups. In the main analysis, distance was the predictor most widely associated with placement rates, with greater distance generally associated with lower rates. Associations with socioeconomic indicators were more limited and variable. This may reflect the limited ability of provincial indicators to represent students’ individual circumstances and the potential combined relevance of examination performance, programme options, tuition fees, and living costs to placements. The findings therefore do not imply that socioeconomic circumstances are unimportant, but indicate that their associations with placements can only be identified to a limited extent using the available province-level data.
Direct coefficient comparisons by scholarship status and programme level identified differences in some destinations but did not reveal a common pattern across all destinations. Negative distance associations were widespread in both scholarship and fee-paying groups, while significant differences between their slopes were confined to specific destinations. All significant GDP per capita associations in the main analysis were negative and occurred in fee-paying groups, but this pattern was not preserved across all alternative specifications.
The negative distance association persisted in many alternative models, although spatial filtering substantially changed estimates in some destinations. Filtering reduced similarities between neighbouring origin provinces in placement patterns unexplained by the models in some specifications but did not consistently eliminate them. Sensitivity to model specification and residual spatial dependence remaining after filtering varied across destinations.
The study provides empirical evidence on geographic patterns of first-time placements to foundation universities across different placement groups. From a social sustainability perspective, the findings highlight the importance of the geographic distribution of educational opportunities. Negative distance associations in scholarship groups indicate the need to investigate transport and accommodation conditions alongside tuition support. However, realised placements capture only one dimension of access, and provincial indicators cannot establish individual circumstances or causal mechanisms. Future research examining students’ economic circumstances, university and programme characteristics, and transport and accommodation conditions together could clarify which conditions are associated with regional differences in placements. Such research could improve understanding of regional inequalities in higher education access and inform efforts to widen educational opportunities.
Supplementary Materials
The following supporting information can be downloaded at https://doi.org/10.5281/zenodo.23512054 and includes the following: Supplementary Material S1: Spatial filtering sensitivity analyses, including distance estimates and residual Moran’s I results (Tables S1a–S12a and S1b–S12b), distance–filter correlations (Tables S13a–S13b), and joint overlap between distance and the selected filter sets (Tables S14a–S14b); Supplementary Material S2: Comparison of linear and logarithmic distance specifications, including model fit, cross-validation, and distance estimates (Tables S15a–S26a and S15b–S26b); Supplementary Material S3: Sensitivity analyses examining the joint inclusion of average years of schooling and GDP per capita (Tables S27–S30), and correlations between these predictors (Table S31); Supplementary Material S4: Sensitivity analysis incorporating foundation institution presence in origin provinces (Tables S32–S38); Supplementary Material S5: Descriptive statistics of interprovincial first-time placements by destination province and placement group, including counts and percentages of origin provinces with zero placements (Table S39); Supplementary Material S6: Interprovincial first-time placement rate maps for the remaining nine destination provinces (Figure S1).
Funding
This research received no external funding.
Institutional Review Board Statement
Not applicable.
Informed Consent Statement
Not applicable.
Data Availability Statement
The data used in this study were compiled from publicly available institutional sources. Information on foundation universities and first-time placements was obtained from the Higher Education Council of Türkiye (YÖK Atlas). Socioeconomic indicators were obtained from the Turkish Statistical Institute (TÜİK), and interprovincial distance data were obtained from the General Directorate of Highways of Türkiye (KGM). The analytical dataset and Supplementary Materials are publicly available in Zenodo at https://doi.org/10.5281/zenodo.23512054.
Conflicts of Interest
The author declares no conflicts of interest.
References
- Alm, James, and John V. Winters. 2009. Distance and Intrastate College Student Migration. Economics of Education Review 28: 728–38. [Google Scholar] [CrossRef] [Scilit]
- Aydın, Oya Tamtekin, and Fırat Bayır. 2016. The Impact of Different Demographic Variables on Determinants of University Choice Decision: A Study on Business Administration Students of the Foundation Universities in Istanbul. Educational Sciences: Theory & Practice 16: 1147–69. [Google Scholar] [CrossRef] [Scilit][Green Version]
- Balbachevsky, Elizabeth, Helena Sampaio, and Cibele Yahn De Andrade. 2019. Expanding Access to Higher Education and Its (Limited) Consequences for Social Inclusion: The Brazilian Experience. Social Inclusion 7: 7–17. [Google Scholar] [CrossRef] [Scilit]
- Brown, Phillip, and David James. 2020. Educational Expansion, Poverty Reduction and Social Mobility: Reframing the Debate. International Journal of Educational Research 100: 101537. [Google Scholar] [CrossRef] [Scilit]
- Chesters, Jenny, and Louise Watson. 2013. Understanding the Persistence of Inequality in Higher Education: Evidence from Australia. Journal of Education Policy 28: 198–215. [Google Scholar] [CrossRef] [Scilit]
- Chien, Chiao-Ling, Patrick Montjouridès, and Hendrik van der Pol. 2017. Global Trends of Access to and Equity in Postsecondary Education. In Access to Higher Education Theoretical Perspectives and Contemporary Challenges. London: Routledge. [Google Scholar]
- Cilesiz, Sebnem, and Stephanie M. Drotos. 2016. High-Poverty Urban High School Students’ Plans for Higher Education: Weaving Their Own Safety Nets. Urban Education 51: 3–31. [Google Scholar] [CrossRef] [Scilit]
- Cullinan, John, and Jim Duggan. 2016. A School-Level Gravity Model of Student Migration Flows to Higher Education Institutions. Spatial Economic Analysis 11: 294–314. [Google Scholar] [CrossRef] [Scilit]
- Çokgezen, Murat. 2014. Determinants of University Choice: A Study on Economics Departments in Turkey. Yükseköğretim Dergisi 4: 23–31. [Google Scholar] [CrossRef] [Scilit]
- Forsyth, Alasdair, and Andy Furlong. 2003. Access to Higher Education and Disadvantaged Young People. British Educational Research Journal 29: 205–25. [Google Scholar] [CrossRef] [Scilit]
- Frenette, Marc. 2006. Too Far to Go On? Distance to School and University Participation. Education Economics 14: 31–58. [Google Scholar] [CrossRef] [Scilit]
- General Directorate of Highways of Türkiye. n.d. Inter-Provincial Road Distance Matrix. Available online: https://www.kgm.gov.tr (accessed on 15 November 2025).
- Hacıfazlıoğlu, Özge, and Nesrin Özdemir. 2010. Undergraduate Students’ Expectations of Foundation Universities and Student Profile: Suggestions for University Administrators. Education and Science 35: 118–30. [Google Scholar] [CrossRef] [Scilit]
- Hall, Martin. 2001. Access to Higher Education: Race, Resources, and Social Exclusion. Safundi 2: 1–24. [Google Scholar] [CrossRef] [Scilit]
- Haveman, Robert, and Timothy Smeeding. 2006. The Role of Higher Education in Social Mobility. The Future of Children 16: 125–50. [Google Scholar] [CrossRef] [Scilit]
- Higher Education Council of Türkiye (YÖK). n.d. YÖK Atlas: Higher Education Statistics. Available online: https://yokatlas.yok.gov.tr (accessed on 15 November 2025).
- Ilie, Sonia, and Pauline Rose. 2016. Is Equal Access to Higher Education in South Asia and Sub-Saharan Africa Achievable by 2030? Higher Education 72: 435–55. [Google Scholar] [CrossRef] [Scilit]
- Kenyon, Susan. 2011. Transport and Social Exclusion: Access to Higher Education in the UK Policy Context. Journal of Transport Geography 19: 763–71. [Google Scholar] [CrossRef] [Scilit]
- Keskiner, Hilal, and Bekir S. Gür. 2023. Questioning Merit-Based Scholarships at Nonprofit Private Universities: Lessons from Turkey. International Journal of Educational Development 97: 102719. [Google Scholar] [CrossRef] [Scilit]
- Kolat, Şerife Deniz, Deniz Göktaş, and Jülide Andiç. 2025. Impact of High-Speed Railways on Student Preference among Turkish Provinces: A Gravity Model Approach. International Econometric Review 17: 17–28. [Google Scholar] [CrossRef] [Scilit]
- McCowan, Tristan. 2016. Three Dimensions of Equity of Access to Higher Education. Compare: A Journal of Comparative and International Education 46: 645–65. [Google Scholar] [CrossRef] [Scilit]
- Mızıkacı, Fatma. 2010. Isomorphic and Diverse Institutions among Turkish Foundation Universities. Education and Science 35: 140–51. [Google Scholar] [CrossRef] [Scilit]
- Nilsson Dahlström, Åsa. 2025. Challenges and Opportunities for Social Sustainability in Education: A Scoping Review. Cogent Social Sciences 11: 2491706. [Google Scholar] [CrossRef] [Scilit]
- Ölçme, Seçme ve Yerleştirme Merkezi. 2024. 2024-YKS Yükseköğretim Programları ve Kontenjanları Kılavuzu. Available online: https://www.osym.gov.tr/2024yuksekogretim-kurumlari-sinavi-yks-yuksekogretim-programlari-ve-kontenjanlari-kilavuzu (accessed on 13 October 2026).
- Sá, Carla, Raymond J. G. M. Florax, and Piet Rietveld. 2004. Determinants of the Regional Demand for Higher Education in The Netherlands: A Gravity Model Approach. Regional Studies 38: 375–92. [Google Scholar] [CrossRef] [Scilit]
- Scanlon, Margaret, Hilary Jenkinson, Pat Leahy, Fred Powell, and Olive Byrne. 2019. “How Are We Going to Do It?” An Exploration of the Barriers to Access to Higher Education amongst Young People from Disadvantaged Communities. Irish Educational Studies 38: 343–57. [Google Scholar] [CrossRef] [Scilit]
- Sosu, Edward M., Lauren N. Smith, Ninetta Santoro, and Stephanie McKendry. 2018. Addressing Socioeconomic Inequality in Access to University Education: An Analysis of Synergies and Tensions in Scottish Policy. Palgrave Communications 4: 152. [Google Scholar] [CrossRef] [Scilit]
- Spiess, C. Katharina, and Katharina Wrohlich. 2010. Does Distance Determine Who Attends a University in Germany? Economics of Education Review 29: 470–79. [Google Scholar] [CrossRef] [Scilit]
- Trahar, Sheila, Sue Timmis, Lisa Lucas, and Kibashini Naidoo. 2020. Rurality and Access to Higher Education. Compare: A Journal of Comparative and International Education 50: 929–42. [Google Scholar] [CrossRef] [Scilit]
- Turkish Statistical Institute (TÜİK). n.d. Regional Statistics Database. Available online: https://veriportali.tuik.gov.tr/ (accessed on 15 November 2025).
- Vieira Do Nascimento, Daniele, Takudzwa Mutize, and Jaime Felix Roser Chinchilla. 2022. Universal Access to Higher Education: Trends, Barriers and Drivers. Revista Educación Superior y Sociedad (ESS) 34: 642–67. [Google Scholar] [CrossRef] [Scilit]
- Waghid, Zayd. 2014. (Higher) Education for Social Justice through Sustainable Development, Economic Development and Equity. South African Journal of Higher Education 28: 1448–63. [Google Scholar]
- Wang, Li. 2011. Social Exclusion and Inequality in Higher Education in China: A Capability Perspective. International Journal of Educational Development 31: 277–86. [Google Scholar] [CrossRef] [Scilit]
- Wang, Shiwei, Gazi Mahabubul Alam, Karima Bashir, and Miao Lei. 2025. Reproducing Inequality? Social Capital, Digital Literacy, and SES in Access to Higher Education. Humanities and Social Sciences Communications 13: 42. [Google Scholar] [CrossRef] [Scilit]
- Wanti, Mega, Renate Wesselink, Harm Biemans, and Perry Den Brok. 2022. Determining Factors of Access and Equity in Higher Education: A Systematic Review. Equity in Education & Society 1: 279–96. [Google Scholar] [CrossRef] [Scilit]
- Yükseköğretim Kurulu. n.d. 2018 YKS: Yükseköğretime Geçişte İl–Bölge Başarıları ve Nüfus Hareketliliği. Ankara: Yükseköğretim Kurulu. [Google Scholar]
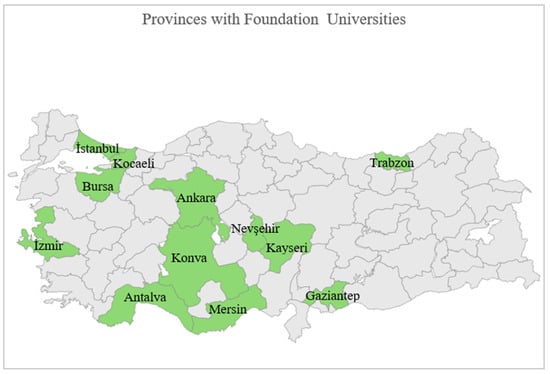
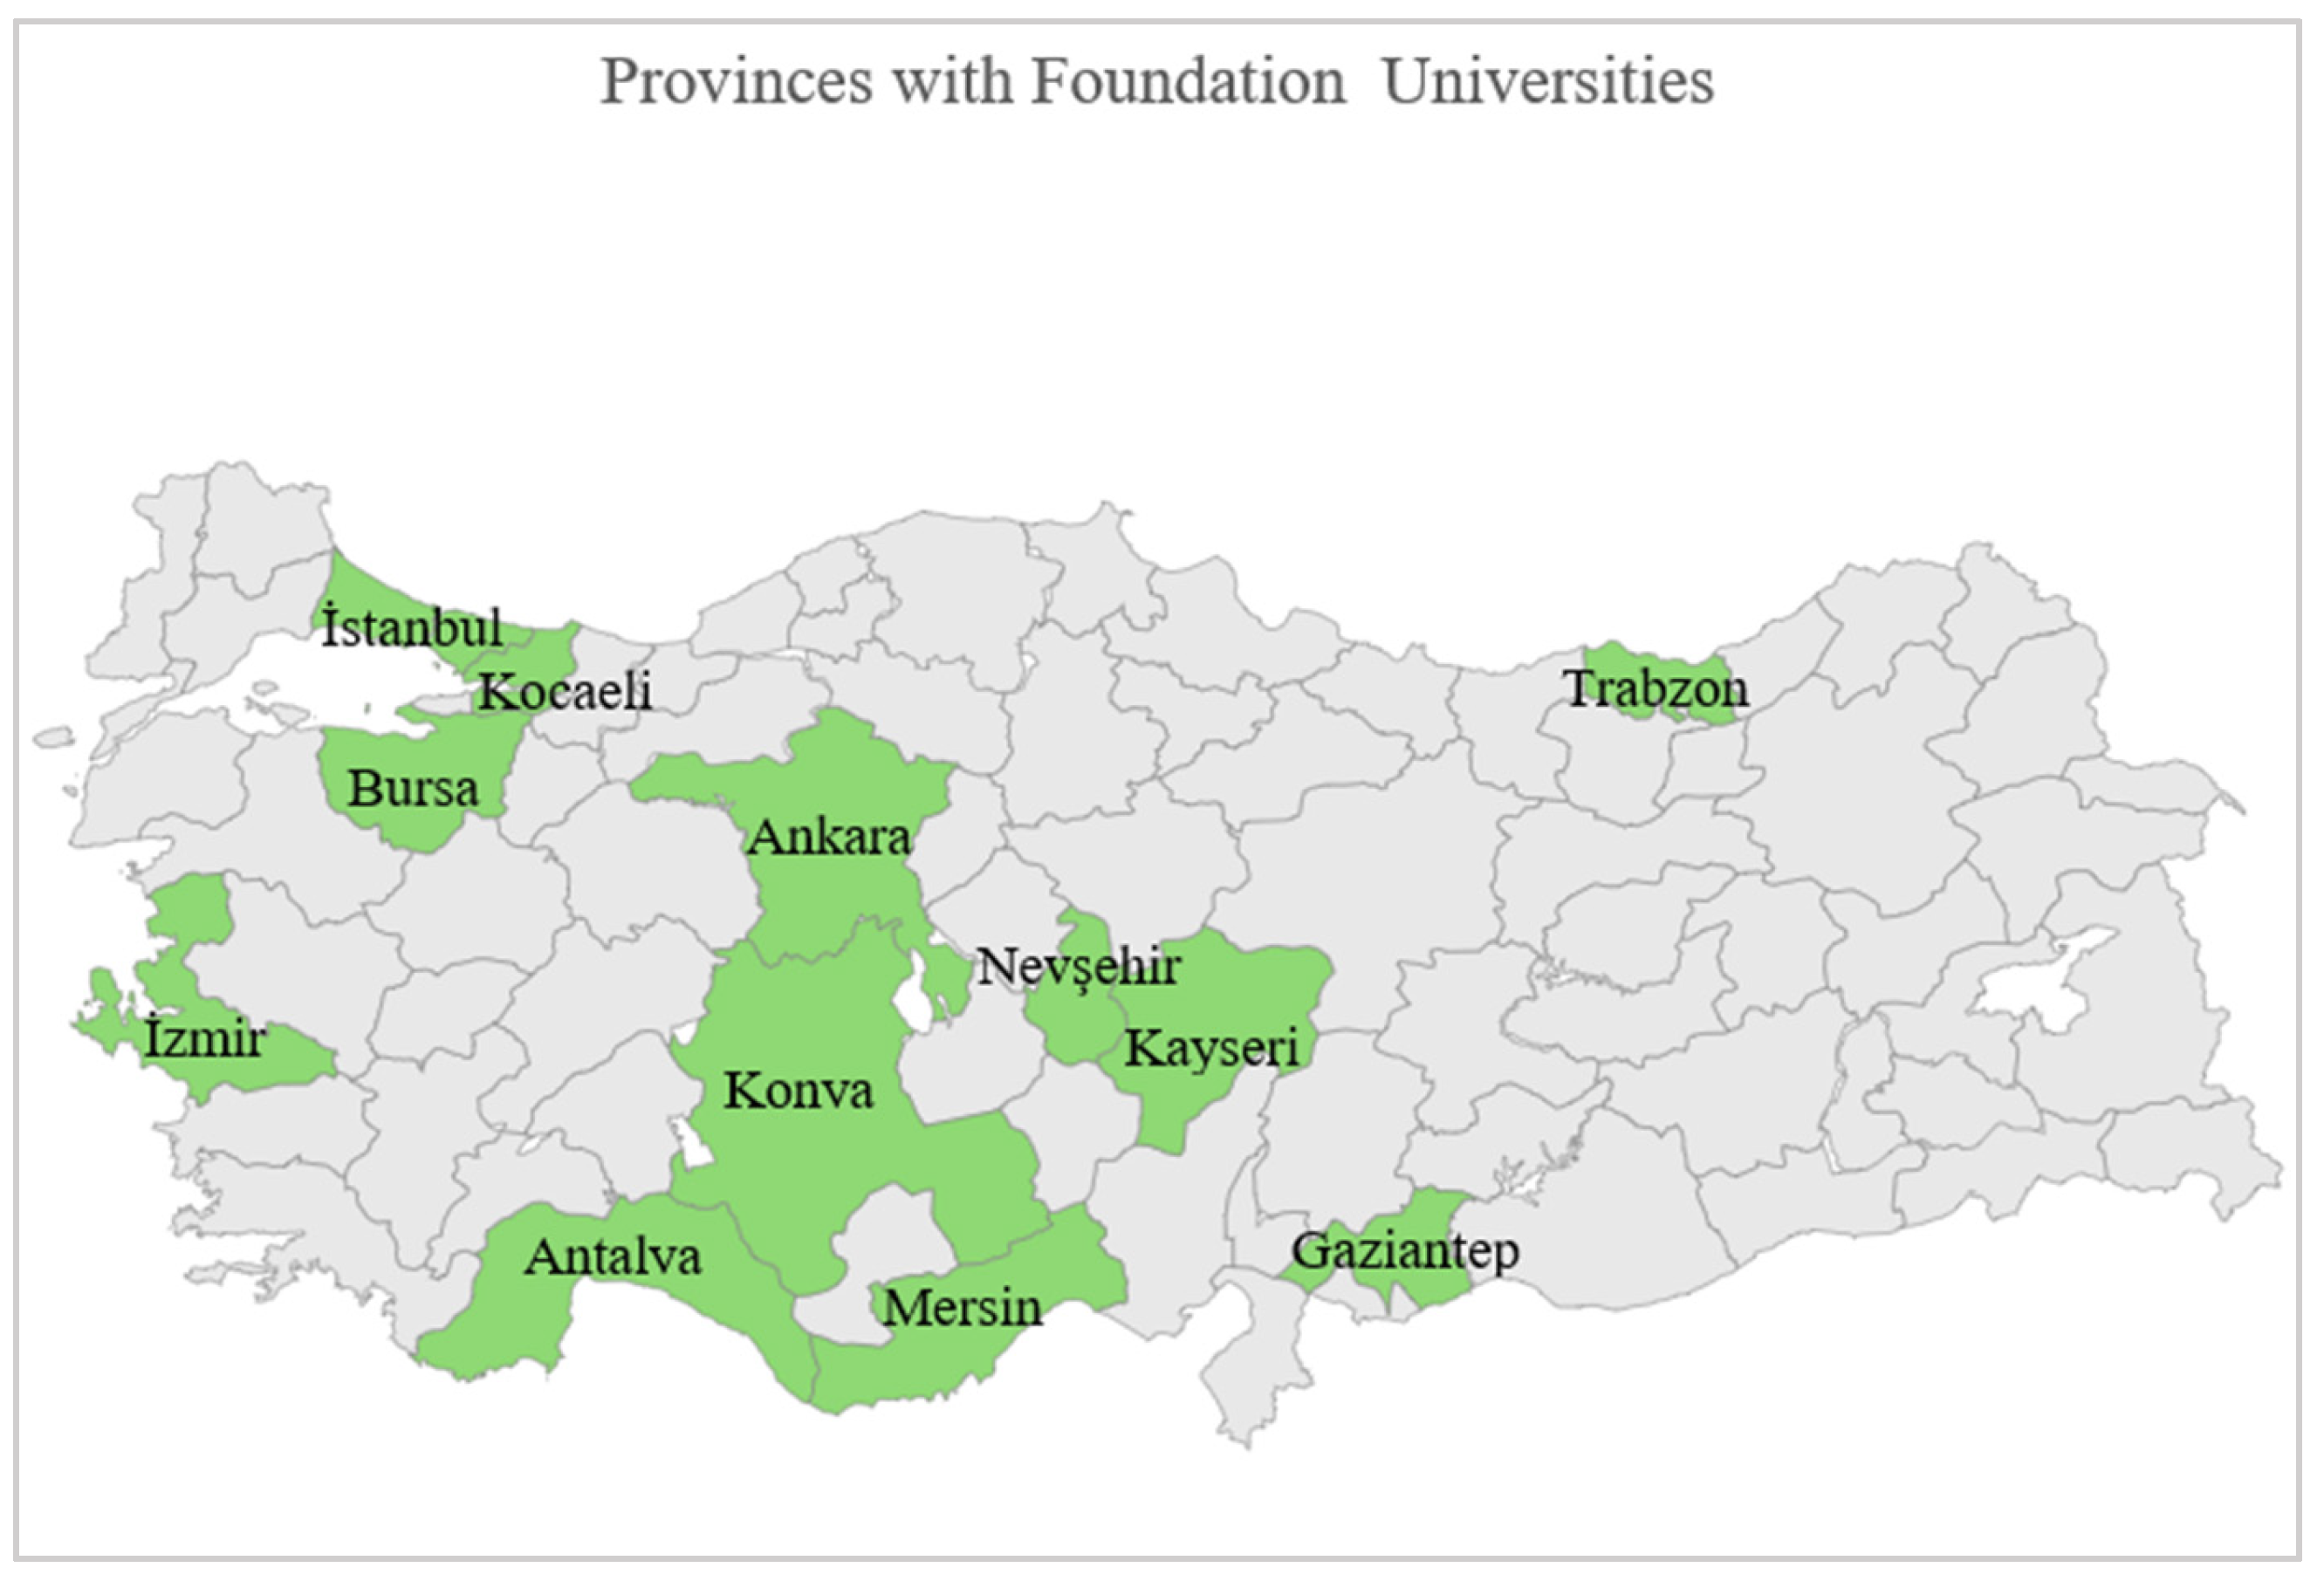
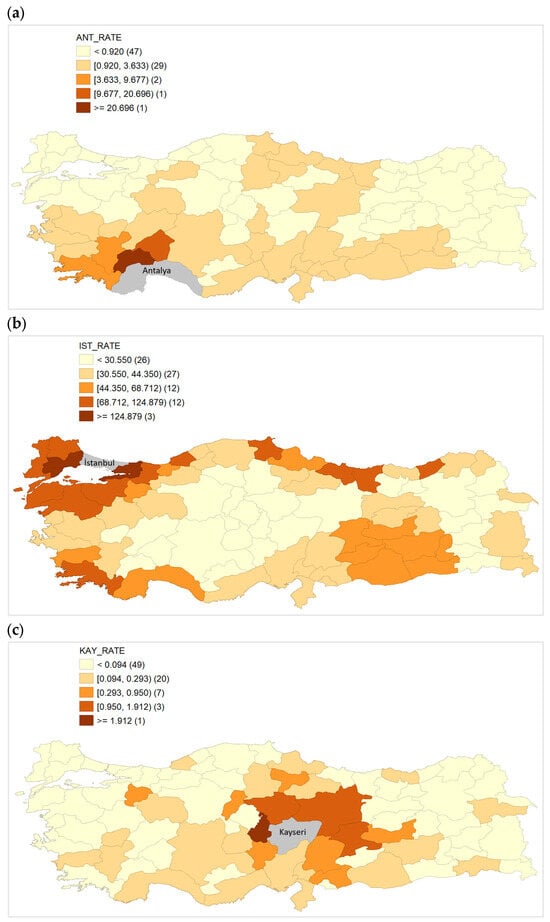
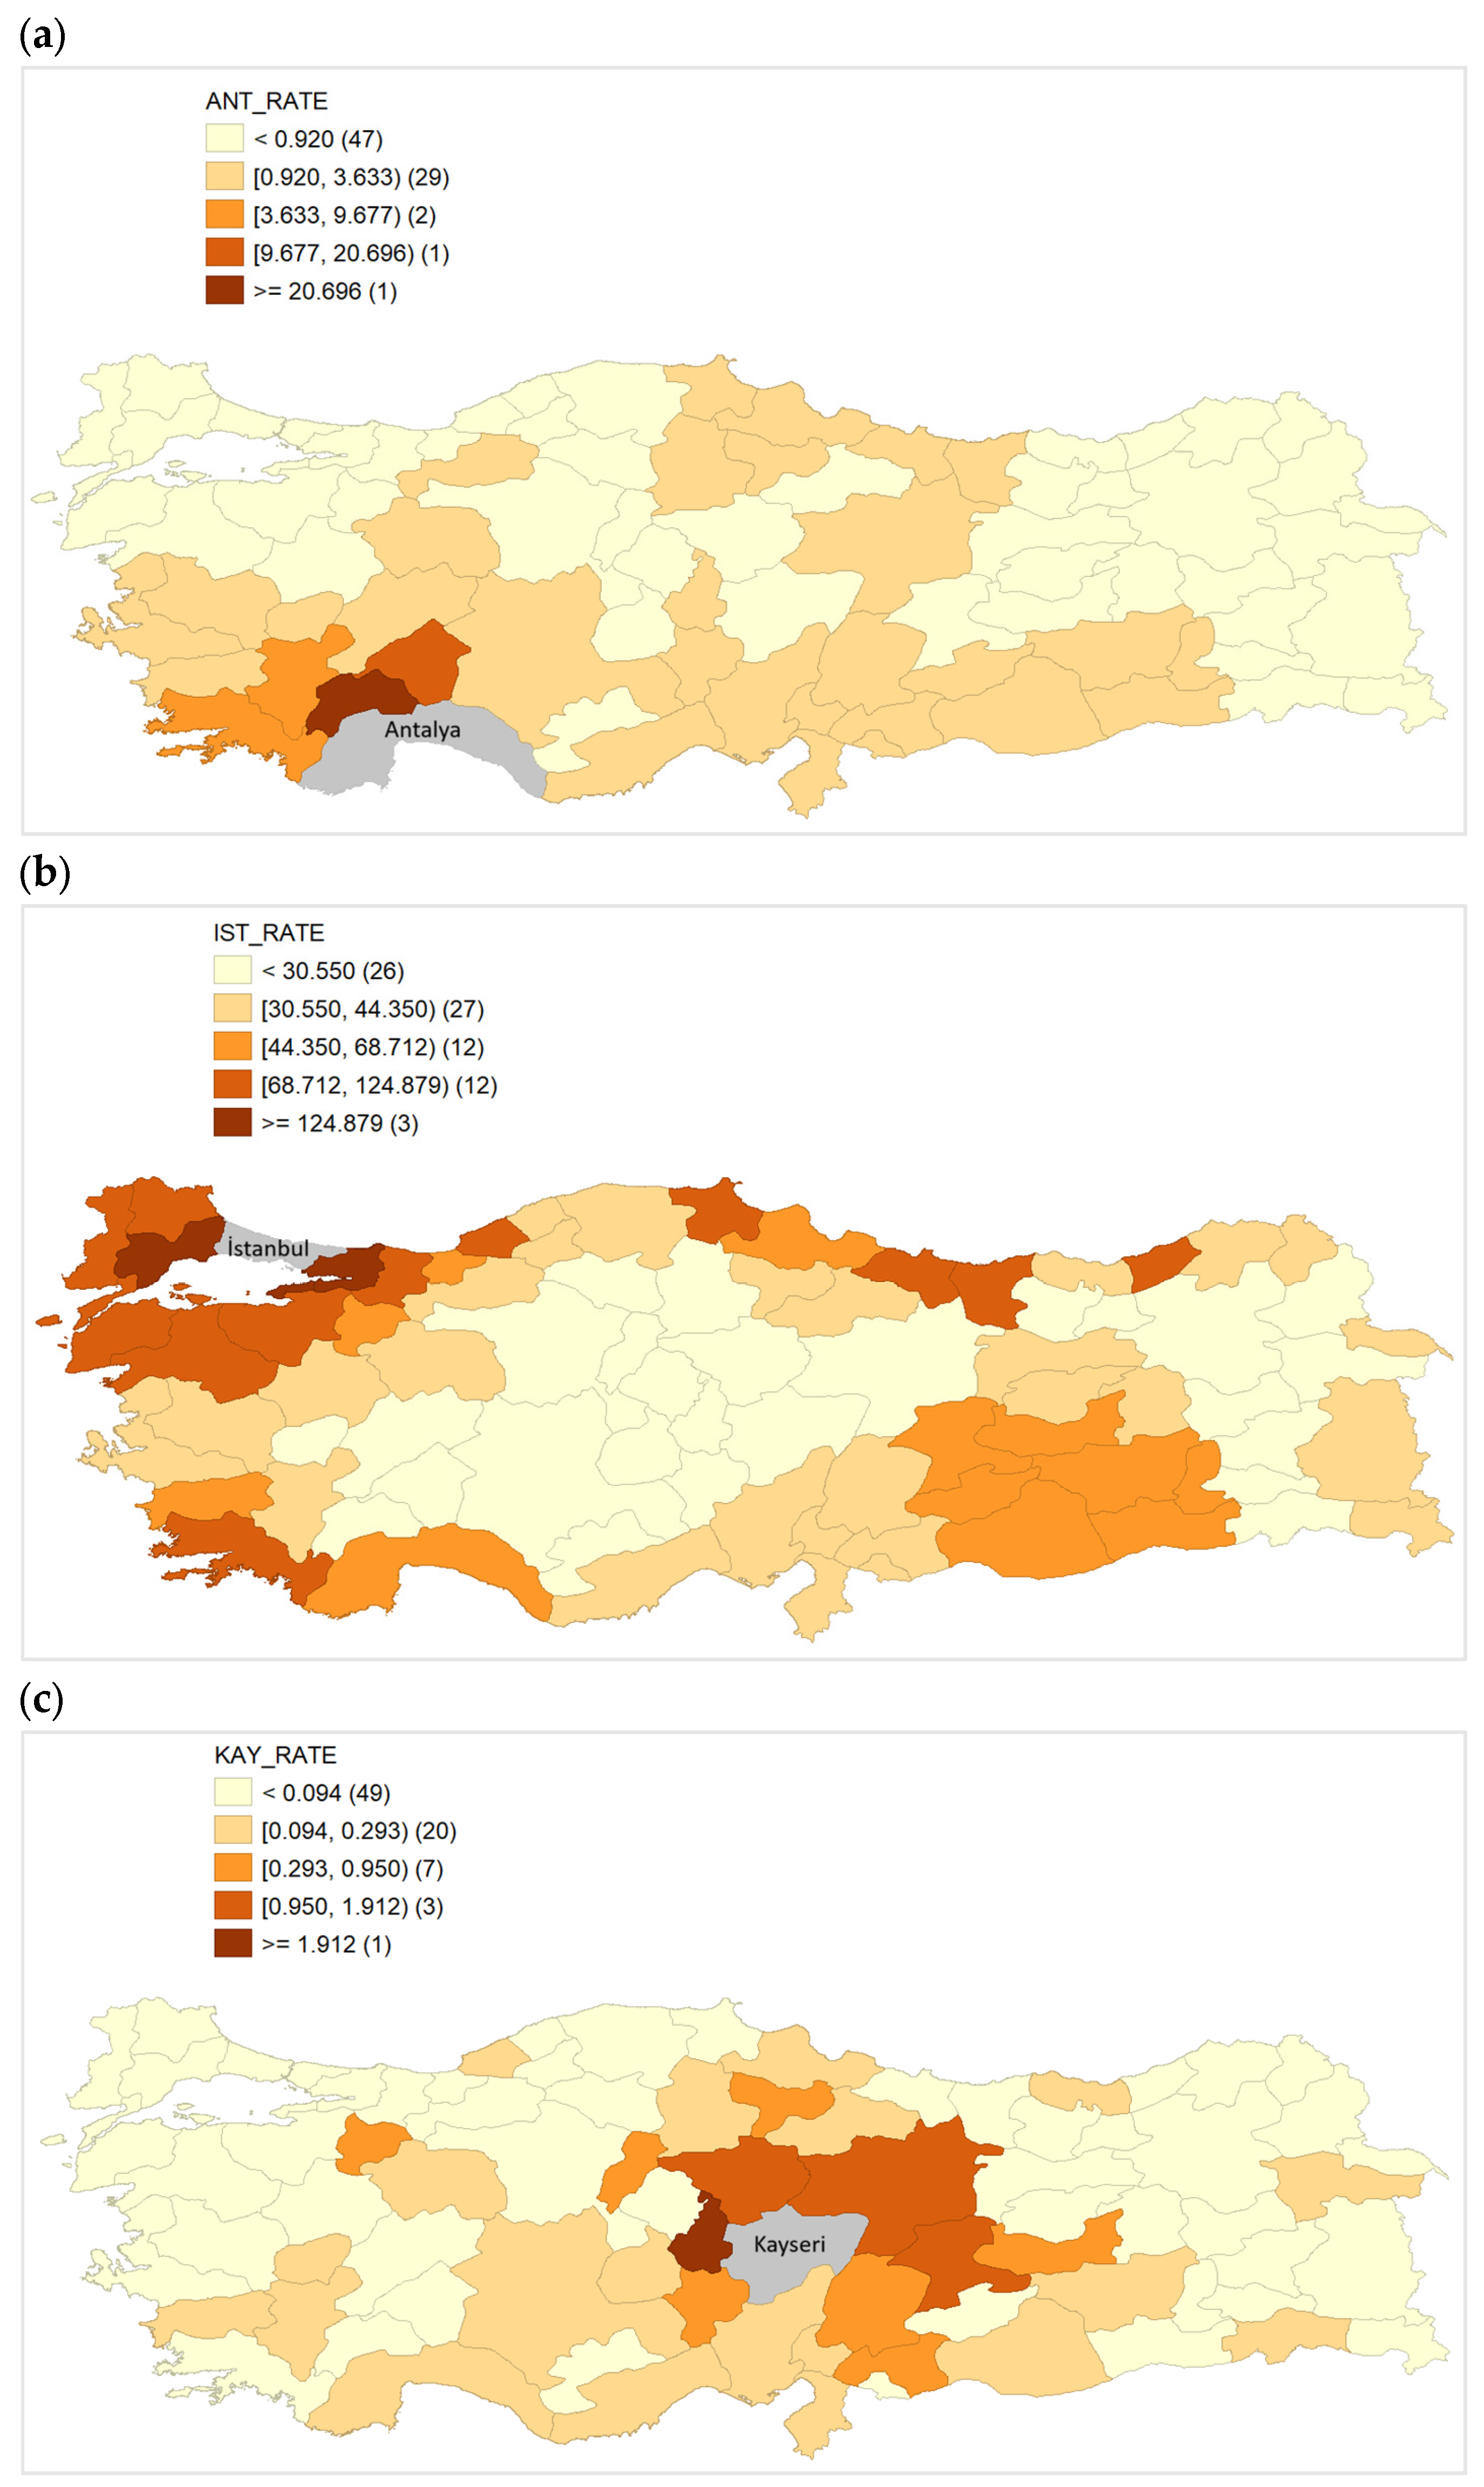
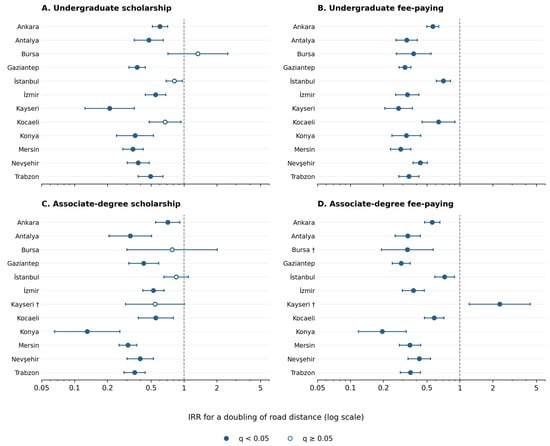
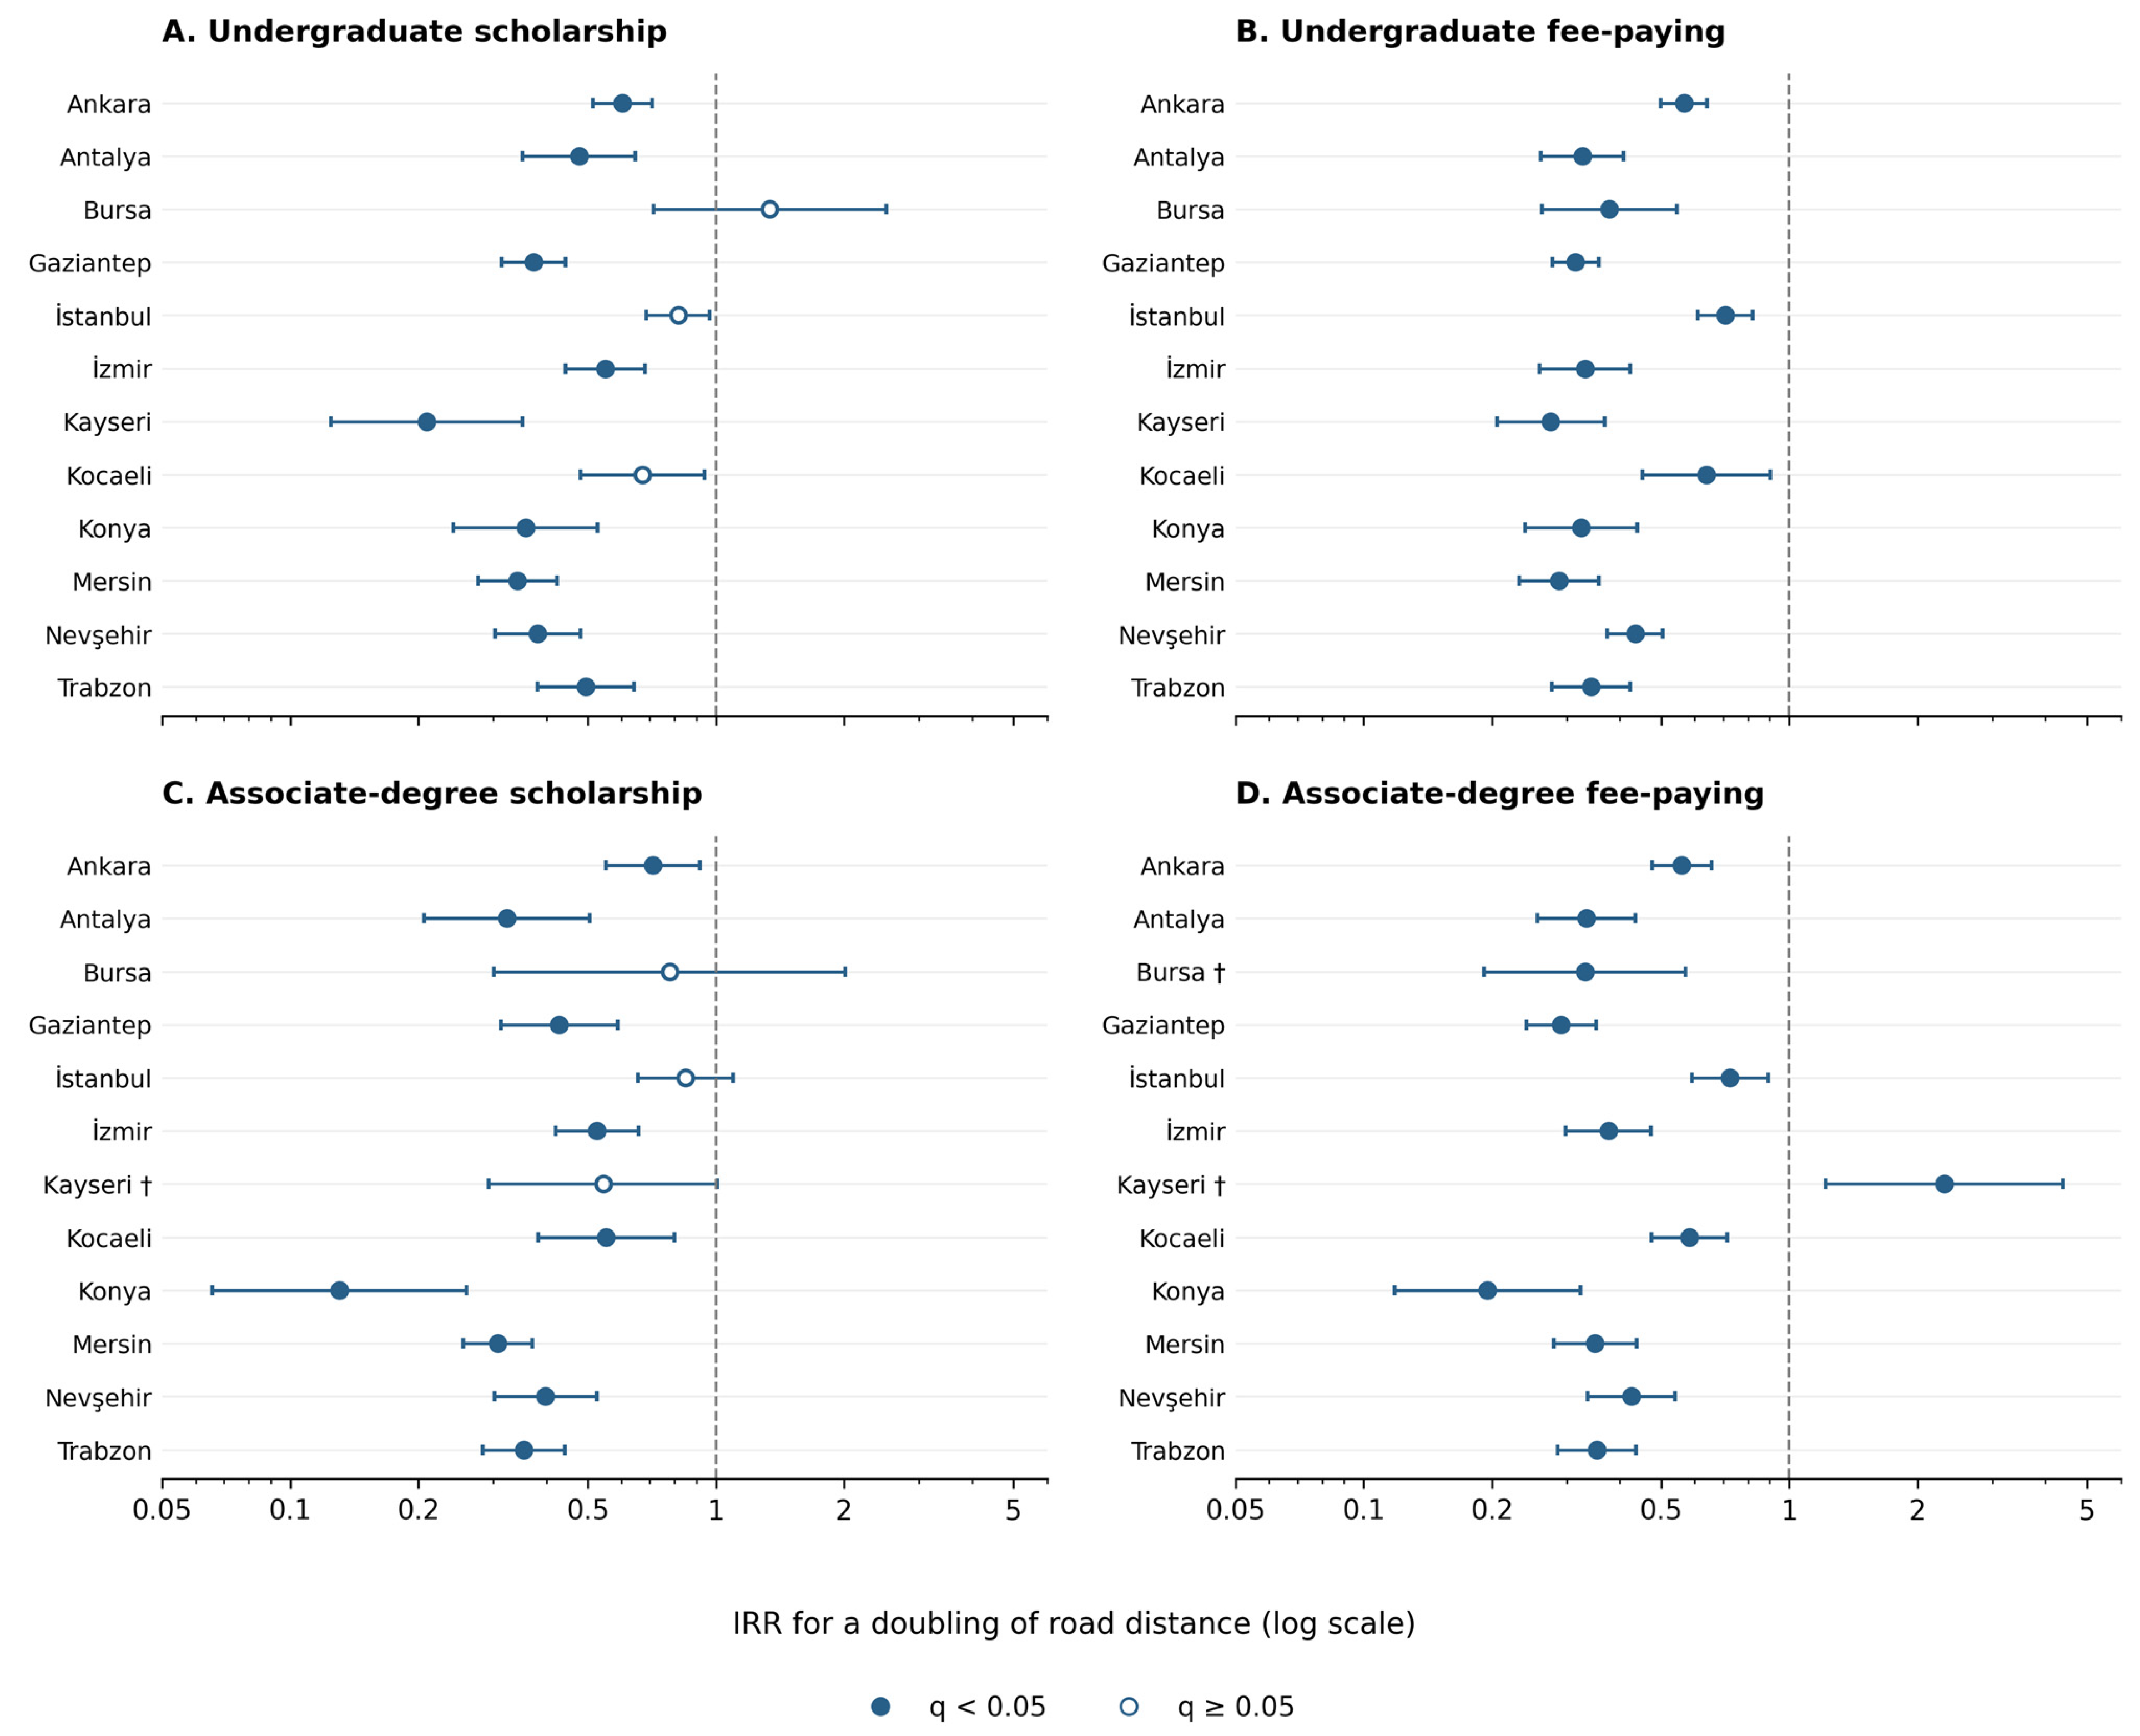

Disclaimer/Publisher’s Note: The statements, opinions and data contained in all publications are solely those of the individual author(s) and contributor(s) and not of MDPI and/or the editor(s). MDPI and/or the editor(s) disclaim responsibility for any injury to people or property resulting from any ideas, methods, instructions or products referred to in the content. |
© 2026 by the author. Licensee MDPI, Basel, Switzerland. This article is an open access article distributed under the terms and conditions of the Creative Commons Attribution (CC BY) license.