


Abstract
Inherent defects in engineering rock masses inevitably lead to randomness in mechanical parameters and uncertainty in tunnel deformation and failure. To address these challenges, this study proposes a novel coupled analysis method that integrates complex function theory, physical model testing, and Monte Carlo simulation (MCS) for the deformation estimation and failure probability analysis of non-circular tunnels. Theoretically, this method provides a high-speed, high-accuracy analytical framework that overcomes the limitations of purely numerical approaches, particularly in handling continuous–discontinuous failure processes. Practically, it enables a more reliable and efficient stability assessment of tunnel systems under uncertain geological conditions. The proposed method is applied to a traffic tunnel at the Baihetan Hydropower Station. A series of uniaxial compression tests on 40 rock specimens are conducted to obtain statistical distributions of rock deformation parameters. An analytical solution for tunnel displacement is derived using plane elastic complex function theory, and the random displacement field is estimated via MCS. Physical model tests reveal that the elastic stage accounts for 83% of the overload failure process, based on which an elastic limit displacement function is established for tunnel arch settlement and surrounding rock convergence. The failure probability of the tunnel is then calculated, and the effects of the mean, coefficient of variation, and cross-correlation coefficient of rock deformation parameters on failure probability are discussed. The entire computational process is characterized by high speed and precision, offering a new and practical tool for tunnel stability evaluation and reliability-based design.
1. Introduction
The deformation and failure of engineering rock masses are usually uncertain and difficult to accurately estimate, resulting in a series of stability challenges, such as uneven deformation and irregular failure, and inducing many engineering disasters [1,2,3]. Generally, the deformation and failure of tunnels and underground caverns are greatly affected by rock mass materials, and it is necessary to estimate the stability probability of tunnels surrounded by rock [4]. At present, the probabilistic limit state design method is adopted in many international geotechnical design norms [5]. Tonon et al. [6] developed a multi-objective tunnel optimization design program that can consider the uncertainty and randomness of parameters, and case comparison showed that the method can reduce costs and improve safety. Jiang et al. [7] developed and verified a new Bayesian method to estimate rock mechanical parameters and constructed a large cavern rock random field according to the obtained parameter distribution, thus obtaining the failure probability of the surrounding rock of the tunnel. Clearly, estimating the deformation range and failure probability of tunnels is important for reducing disaster risk and saving project cost.
For different geotechnical engineering projects, the rock properties are different, and the corresponding distribution characteristics of rock deformation parameters and the correlation between parameters may also be different [8,9]. Many works on the variability effect of rock parameters on the failure probability of tunnels focus on calculation methods, yet few studies have considered combining rock tests with specific projects [10,11,12]. At the same time, some scholars have conducted experimental studies on the distribution law of rock mechanical parameters, but they have not applied it to the deformation and failure analysis of tunnels [13].
Tunnel failure probability analysis is based on deterministic analysis, which mainly includes theoretical analytical methods and numerical methods. At present, tunnel failure probability analysis is mostly based on numerical methods, which can be well used to analyze some complex problems, but it still has some shortcomings, such as low computational efficiency, long time consumption and inaccurate simulation of continuous–discontinuous complex failure processes [14,15]. Thus, some scholars analyzed the circular tunnel’s failure probability based on theoretical analytical methods [16]. However, there are less theoretical analytical methods for deformation estimation and failure probability analysis of non-circular tunnels.
The tunnel physical model test is widely used to study the deformation and failure mechanism of tunnel engineering in the process of excavation and support [17]. The physical model test has the following advantages: (i) The physical model test is more intuitive, which means it can comprehensively and truly simulate the complex underground engineering structure and geological structure. (ii) When making the tunnel physical model, the pressure box, displacement and other measuring sensors can be embedded to monitor the stress and strain of the model. (iii) It can make up for the shortcomings of field testing, and an overload failure test can be carried out on the model, which can more intuitively analyze the continuous–discontinuous deformation failure mechanism of the tunnel. (iv) Physical simulation can also be used to study many problems that are difficult to solve by mathematical and mechanical methods, providing the basis and verification for the establishment of new theories and models [18,19,20].
In practical underground engineering, tunnel cross-sections are often designed as non-circular shapes (e.g., horseshoe, arch, or rectangular profiles) to better accommodate functional requirements such as traffic lanes, rail transit, or hydraulic passages and to optimize the utilization of underground space. Compared with circular tunnels, non-circular tunnels are more commonly encountered in transportation and hydropower projects, yet their mechanical behavior is more complex due to stress concentration at corners and irregular geometry. While extensive theoretical solutions exist for circular tunnels, the analytical treatment of non-circular tunnels remains challenging and underdeveloped. Therefore, focusing on non-circular tunnels not only addresses a significant gap in theoretical research but also holds greater practical relevance for real-world engineering design and risk assessment. The horseshoe-shaped traffic tunnel at the Baihetan Hydropower Station, investigated in this study, is a typical example of such non-circular geometries, making it an ideal case to validate the proposed method.
Given the above research gaps, the broad objectives of this study are threefold: (i) to develop a high-efficiency and high-precision analytical framework for non-circular tunnel deformation and failure probability analysis that integrates theoretical, experimental, and stochastic approaches; (ii) to establish a practical methodology that can incorporate site-specific rock mechanical parameter statistics into tunnel reliability assessment; and (iii) to provide a reference for probabilistic design and risk mitigation in underground engineering under uncertain geological conditions. To achieve these objectives, this technical note proposes a new method for deformation estimation and failure probability analysis of non-circular tunnels based on complex function analysis, physical model testing, and Monte Carlo simulation (MCS). This method is suitable for non-circular tunnel failure estimation, can fully combine the characteristic distribution function of rock mechanics parameters, and has the advantages of high efficiency and high precision. The presented method is further applied to analyze the deformation range and failure probability of a traffic tunnel in the Baihetan Hydropower Station, combined with the uniaxial compression test of basalt. The influence of the rock’s parameter mean, variation coefficient and cross-correlation coefficient on the failure probability of the tunnel are further discussed to enrich our understanding of the uncertainty of tunnel deformation and failure.
2. Methodology
The theoretical analytical solution of non-circular tunnel displacement is obtained by using complex variable function theory, and the proportion of elastic stage to elastoplastic stage is obtained by an overload test of the tunnel physical model. Then, the elastic limit displacement failure function is established, and the deformation failure probability of the non-circular tunnel is analyzed by MCS method.
2.1. Complex Function Analytic Method for Non-Circular Tunnels
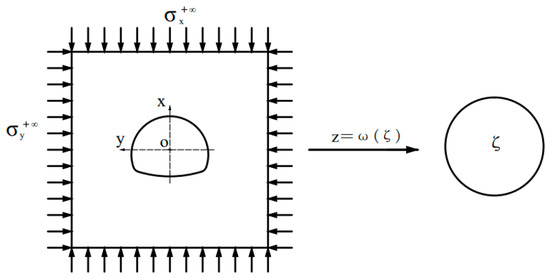
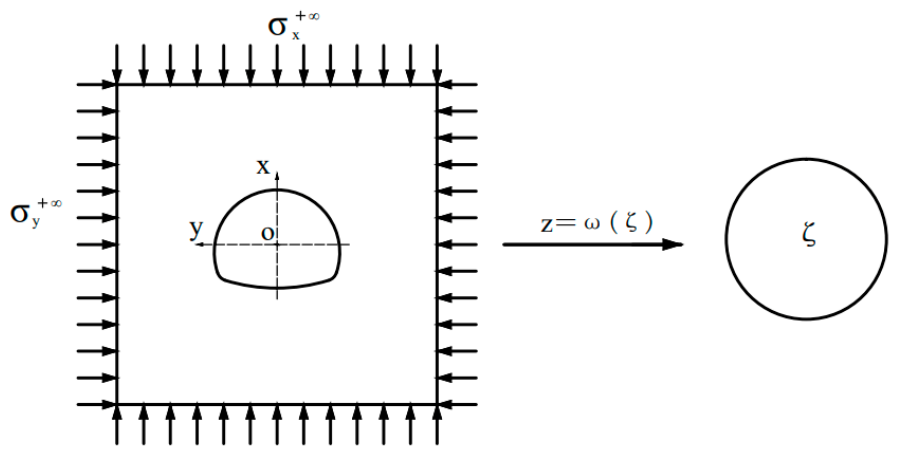
The mechanical problem of a non-circular tunnel can be simplified as an orifice problem. For the non-circular tunnel mechanics problem, the complex function method is adopted, and conformal mapping is used to transform the non-circular problem into a circular problem. For a deeply buried tunnel, the influence of gravity gradient is not considered because the buried depth is much larger than the pore size, and the surrounding rock around the tunnel can be considered an external load affected by the far-field stress. Tunnel section excavation of homogeneous surrounding rock can be simplified as a plane strain problem. and represent the vertical and horizontal ground stresses of the original rocks at infinity, respectively, and the calculation diagram is shown in Figure 1.
Figure 1.
Schematic representation of the problem under discussion.
According to the principle of plane elasticity and the complex function [21,22], the hole on the z-plane can be transformed into a unit circle on the -plane through the conformal mapping function . The conformal maps can generally be written as a power series.
where R represents the hole size, is a complex number characterizing the shape of the hole, and k = 0, 1, 2 …, n. If the cavity is symmetrical, it will degenerate into a real number, and these parameters can be obtained by optimization-based methods. Generally, the first six terms of are enough to meet the accuracy requirements.
According to the classical theory of elasticity, the stress and displacement distribution on the image plane (polar coordinate system) and the original plane (rectangular coordinate system) can be expressed by two analytic functions, and . According to the boundary condition Equation (4), and can be obtained following Equations (2) and (3). Finally, the displacement can be solved by Equation (5).
where is the angle between the two sets of coordinate systems for the same point; and are the vertical and horizontal displacements on the original plane, respectively; and and are the radial displacement and circumferential displacement on the image plane, respectively. G is the shear modulus, which can be obtained by the transformation of the elastic modulus and Poisson’s ratio. For the plane strain problem,
Because of the compressive stress at infinity, the inner boundary of the tunnel is not subjected to force, so the forces and are 0, and C can be taken as zero. The analytic functions of Equations (2) and (3) can be rewritten as the power series of Equations (6) and (7), respectively.
where and are coefficients, and , and are constants.
Therefore, the stress boundary condition is as follows:
Using the Harnack theorem, the Cauchy integral is evaluated for the stress boundary condition in Equation (8). By using the characteristics of unit circle boundary Cauchy integrals, the analytic function can be rewritten as follows:
Substituting Equations (1) and (6) into the above equation and by virtue of the Cauchy integral along the unit circle, the first term on the right-hand side of Equation (9) can be rewritten as follows:
where
where are temporary coefficients in the derivation process.
Similarly, the second term on the right-hand side of Equation (9) can be rewritten as follows:
By merging Equations (10) and (11), the final potential function expression is shown in Equation (12). In the absence of far-field shear stress , , and all coefficients in Equation (12) are real numbers.
where
Similarly, by conjugating both ends of the stress boundary condition in Equation (8), using the Harnack theorem and the Cauchy integral of the unit circle boundary, the analytic function can be rewritten as
Similarly, the two terms on the right-hand side of Equation (13) are expanded in the power series, and Cauchy integrals are evaluated and then combined. Finally, the expression for the potential function is obtained as follows:
Substituting Equations (12) and (14) into Equations (6) and (7), the final expressions for the two analytic functions and can be obtained. Substituting the final expression for the two analytic functions and into Equation (5) and separating the real and imaginary parts, the vertical and horizontal displacement distributions can be obtained.
2.2. Physical Model Test Method for Non-Circular Tunnels
The mechanical behavior of tunnel deformation and failure is complex, often showing nonlinear strain softening and other complex failure processes under geo-stress. The surrounding rock state can be simply divided into the elastic section, plastic section and post-peak residual section. However, it is difficult to obtain accurate elastic–plastic theoretical analytical solutions for non-circular tunnels. This paper intends to obtain the proportional relationship between tunnel elastic and elastic–plastic stages through the similarity physical model overload failure test, so that more accurate functional functions can be established by means of elastic reduction and the failure probability of surrounding rock of the tunnel can be evaluated.
The similarity physical model test of the tunnel is based on similarity theory, which is composed of three theorems of similarity [23,24]. Starting from the elastic–plastic theory, the similarity criterion of a physical simulation of the tunnel can be derived as shown in Table 1, where is the geometric similarity ratio, is the density similarity ratio, is the stress similarity ratio, is the displacement similarity ratio, is the elastic modulus similarity ratio, is the Poisson ratio similarity ratio, is the cohesion similarity ratio, is the internal friction Angle similarity ratio, and is the softening modulus similarity ratio.
Table 1.
Similarity criteria for underground cavern physical simulation.
The stress boundary conditions and displacement boundary conditions should also be considered in solving elastoplastic problems. Therefore, in the process of tunnel physical simulation, the external loading method is often used to apply stress boundary conditions. The stress boundary conditions need to consider the influence range of stress redistribution caused by excavation, so the boundary effect needs to be considered. Generally, the influence range of the tunnel is 2~3 times the excavation space. Displacement boundary conditions are generally realized by special fixtures. For most long tunnels, this can be simplified to the plane strain problem for analysis.
2.3. Monte Carlo Simulation (MCS) Method
Uncertainty analysis methods mainly include approximate analytical methods, surrogate model methods and digital simulation methods [25]. The most typical approximate analytic method [26] is the improved first-order second-moment method, which has the characteristic of high computational efficiency but is not accurate enough for complex nonlinear problems. The surrogate model method constructs the corresponding implicit functional function by regression or classification and then analyzes it by other approximate analytical methods and digital simulation methods [27,28,29]. The digital simulation method is based on the law of large numbers and uses the sample mean to approximate the parent mean [30]. As long as there are enough samples, the estimated value can converge to the real failure probability.
The Monte Carlo simulation (MCS) method is the most basic digital simulation method [31]. The basic idea of the MCS method is to use the ratio of the number of sample points in the failure domain to the total number of projection points as the estimated value of the failure probability, which can improve the calculation accuracy by increasing the number of samples. In this paper, the display function of tunnel failure can be derived through the complex function, which is highly nonlinear. The calculation process of the MCS method is simple and easily meets the accuracy requirements.
The deformation and failure analysis for tunnels needs to consider the vertical and horizontal directions, so it involves the structural system problem. The failure domain of the structural system is determined by multiple failure modes. The structure system can be divided into a parallel structure system, series structure system and hybrid structure system according to the relationship between the failure modes. If the system has failure modes corresponding to function , then the system failure domain of series and parallel structures is
The exact expression of failure probability is the integral of the joint probability density function of input variables in the failure domain, which can be rewritten as the mathematical expectation form of the indicator function in the failure domain, and the failure probability of the structural system can be expressed as
where R is an n-dimensional vector space, and is the joint probability density function of the fundamental random variable. Equation (16) indicates that the structural failure probability is the failure domain indicator function’s mathematical expectation. According to the law of large numbers, the failure domain indicator function’s mathematical expectation can be approximated by the sample mean of the failure domain indicator function. Therefore, the estimated value of failure probability can be expressed as Equation (17):
The variance of the estimated system failure probability and the estimated coefficient of variation are
MCS inherently provides an approximate estimate of the failure probability along with its confidence interval or coefficient of variation (see Equations (19) and (20)). For the problem of tunnel deformation and failure probability analysis, this approximation is not a limitation but a critical advantage. The exact failure probability of a geotechnical system is unknown and cannot be obtained deterministically due to the inherent randomness of rock parameters. MCS enables a statistically rigorous approximation that converges to the true value as the number of samples increases. More importantly, the confidence interval quantifies the uncertainty in the failure probability estimate itself, which is essential for risk-informed decision-making in tunnel engineering. For instance, a small coefficient of variation (e.g., <0.05) indicates that the estimated failure probability is reliable and can be used with confidence in practical design. Without such quantification, engineers cannot assess whether a calculated failure probability of, say, 0.387% is sufficiently accurate to guide support design or to compare with allowable risk levels. Therefore, reporting both the failure probability estimate and its confidence interval (or coefficient of variation) is not a mere formality but a fundamental requirement for transparent and rational reliability assessment of non-circular tunnels.
2.4. Complex Function–MCS Uncertainty Analysis Method for Non-Circular Tunnels
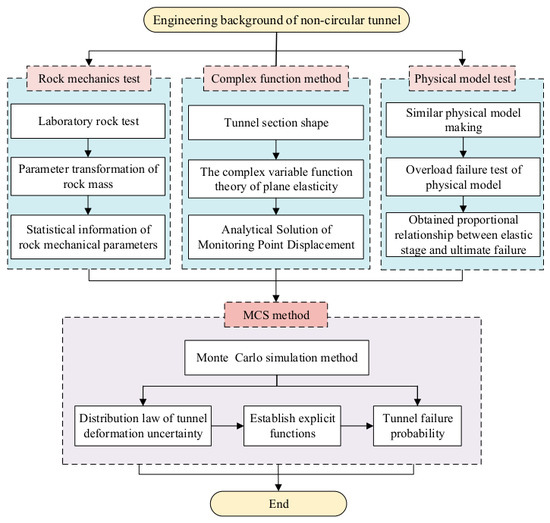
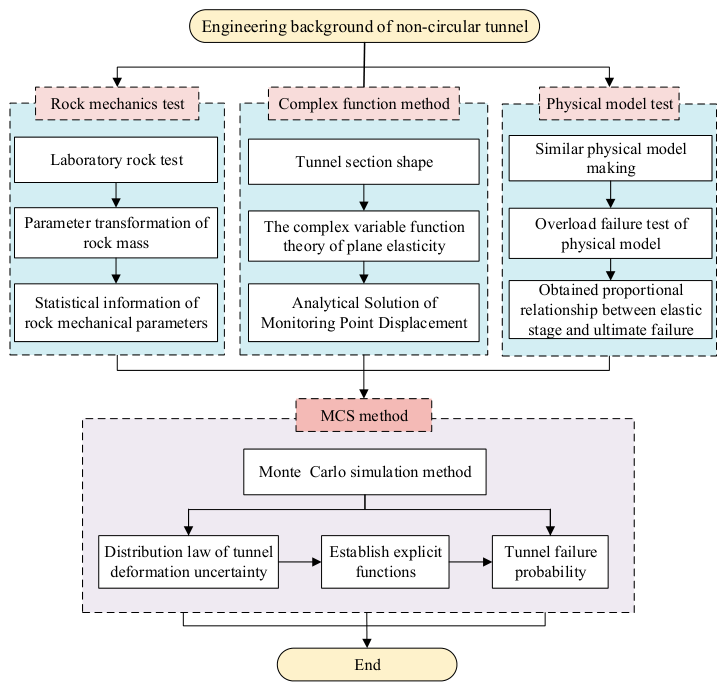
The complex function–MCS method combines the advantages of the laboratory test method, tunnel complex function theoretical analysis method and MCS uncertain analysis method, which can be used for deformation estimation and failure probability analysis of non-circular tunnels. The detailed calculation process is as follows: First, according to the shape of the tunnel cross section and based on complex function theory, the displacement analytical solution of representative monitoring points in the tunnel is deduced. Through many mechanical tests of rock, combined with the rock mass transformation formula, the probability distribution characteristics of the tunnel rock mass deformation parameters are analyzed. Through the similarity physical model test of tunnel, the elastic phase reduction coefficient is obtained. Then, combined with the above analytical solution of displacement and the probability distribution function of surrounding rock deformation parameters, multiple MCS sampling is conducted to analyze the distribution law of horizontal displacement, vertical displacement and combined displacement of each monitoring point. According to the distribution law of tunnel displacement, the most vulnerable failure points in the horizontal and vertical directions are determined. Combined with the elastic phase reduction coefficient, the display function of the deformation limit failure criterion of the failure point is established. Finally, the failure probability of the tunnel is analyzed by the MCS method using a series relationship, and the influence of rock mass parameter variability and cross-correlation on the failure probability of the tunnel are discussed. The detailed analysis process is shown in Figure 2.
Figure 2.
Complex function–MCS uncertainty analysis method for non-circular tunnel.
3. Engineering Application and Analysis
3.1. Engineering Background
The Baihetan Hydropower Station, located in the lower reaches of the Jinsha River, is another giant hydropower station of 10 million kilowatts planned to be built in China after Three Gorges and Xiluodu [32]. To ensure the demand for the construction of underground hydropower stations, a large number of traffic tunnels need to be built. The rock mass in these traffic tunnels is mainly composed of porphyritic basalt and amygdaloidal basalt. The integrity of rock mass is good, mostly in a slightly weathered or fresh state, and the RMR (rock mass rating) value of the surrounding rock is mainly in the range of 60~70.
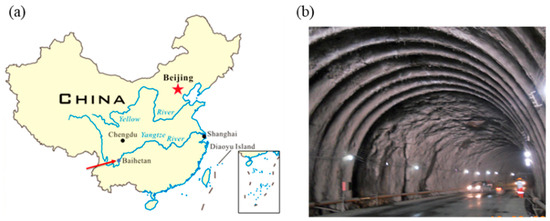
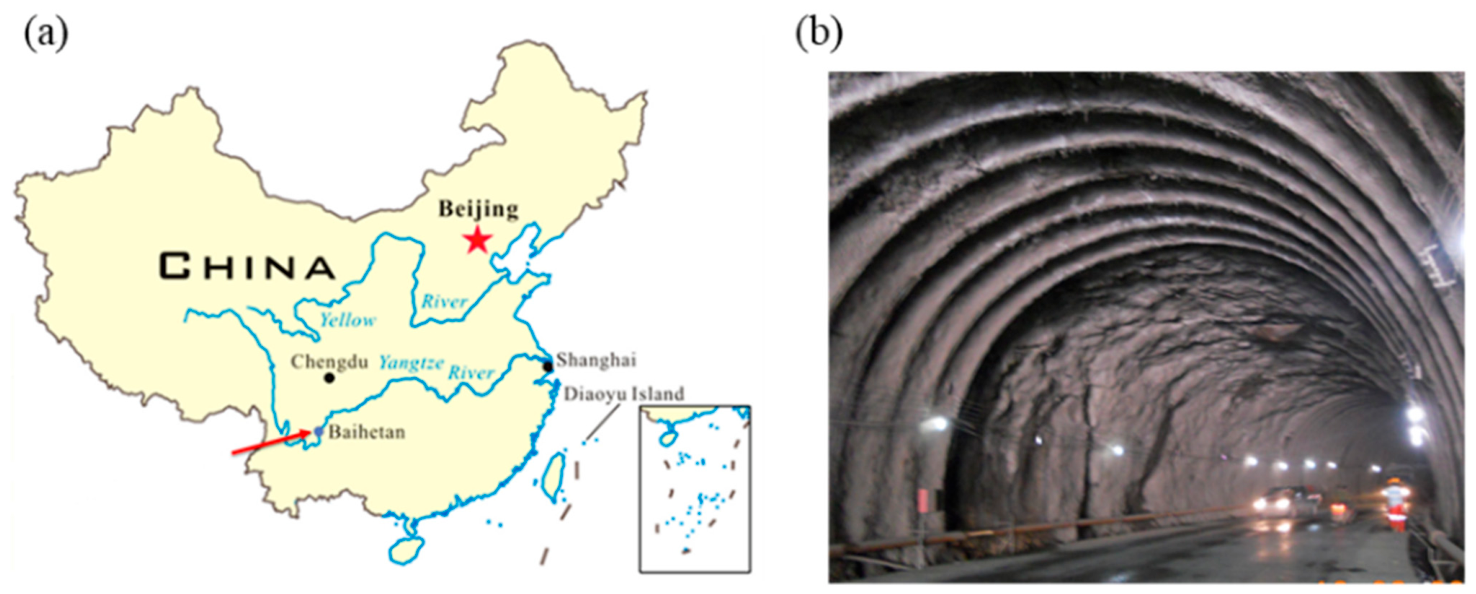
The traffic tunnel is the key channel to enter the underground powerhouse cavern of Baihetan, as shown in Figure 3, which is horseshoe-shaped, 9.8 m high and 12.5 m wide. To ensure the safety of the tunnel’s support structure and meet the functional requirements, it is necessary to fully estimate the influence of rock mechanic parameter variability on tunnel deformation and failure probability, which can provide the basis for tunnel lining thickness design. Therefore, the uniaxial compression test of amygdaloid basalt in the tunnel is performed, and then the distribution types of rock mass deformation parameters are obtained through the rock mass change formula and statistical method. The corresponding similar physical model is designed and made; through the overload failure test, the proportional relationship between the elastic stage and the elastic–plastic stage is obtained. Then, the above complex function–MCS method is used to analyze the deformation and failure probability of the tunnel, and the influence of the variation coefficient and cross-correlation coefficient of the rock mass on the failure probability of the tunnel is discussed.
Figure 3.
(a) The location of the Baihetan Hydropower Station. (b) Traffic tunnel photo of Baihetan Hydropower Station.
3.2. Statistical Analysis for Rock’s Deformation Parameter
Among the various parameters characterizing rock deformation, the elastic modulus (E) and Poisson’s ratio (ν) are the most fundamental and directly measured in uniaxial compression tests. They govern the linear elastic displacement response under far-field stresses, which is the basis for the elastic reduction method used herein. Other parameters (shear modulus, bulk modulus, softening modulus) are either derivable from E and ν or pertain to post-peak behavior, which is beyond the scope of this study. Therefore, E and ν serve as the key indicators of the basic deformation performance of rock and are necessary reference parameters for tunnel displacement elastic analysis, referred to as rock deformation parameters [33]. Because of the microscopic heterogeneity of the rock material itself, statistical analysis of these deformation parameters and their probability distribution forms is the basis for the uncertainty analysis of tunnels.
This paper selects an amygdaloid basalt section of the tunnel as the research object. The amygdaloid basalts are Permian igneous rock with an intergranular cryptocrystalline structure and hyalopilitic texture, and the main components are amygdala, glass and a small amount of pyroxene.
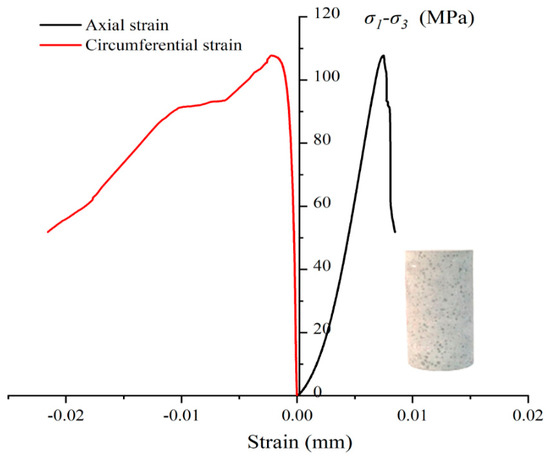
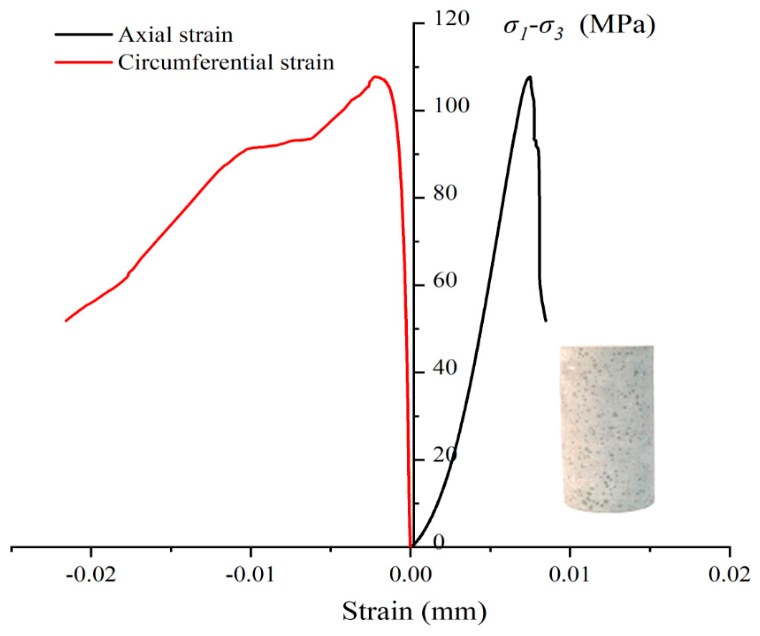
To obtain the statistical distribution of mechanical parameters of amygdaloid basalt, 40 samples of amygdaloid basalt are selected. Each specimen for the test is a cylinder that is 100 mm in height and 50 mm in diameter, following ISRM recommendations [34]. The triaxial compression tests are performed using an MTS-815 electrohydraulic system [35]. In the test, axial strain is measured using a linear variable differential transformer, and the lateral strain is measured using a ring chain gauge. The loading mode is controlled by axial deformation, and the loading rate is 0.001 mm/s. The full stress–strain curves of rock deformation and failure are obtained through experiments, as shown in Figure 4. The elastic modulus of rock is the ratio of stress increment to strain increment in the straight line of the stress–strain curve. Poisson’s ratio of rock is the ratio of the absolute values of transverse strain to circumferential strain .
Figure 4.
Typical stress–strain curves of amygdaloid basalt under uniaxial compression tests.
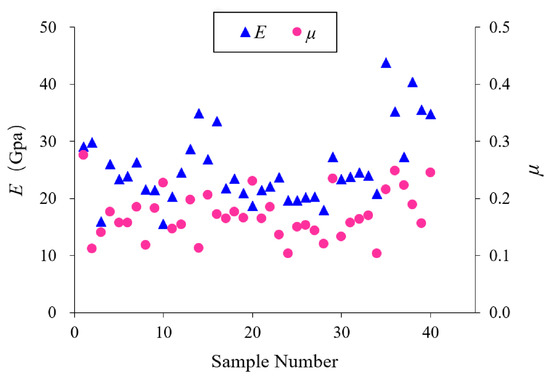
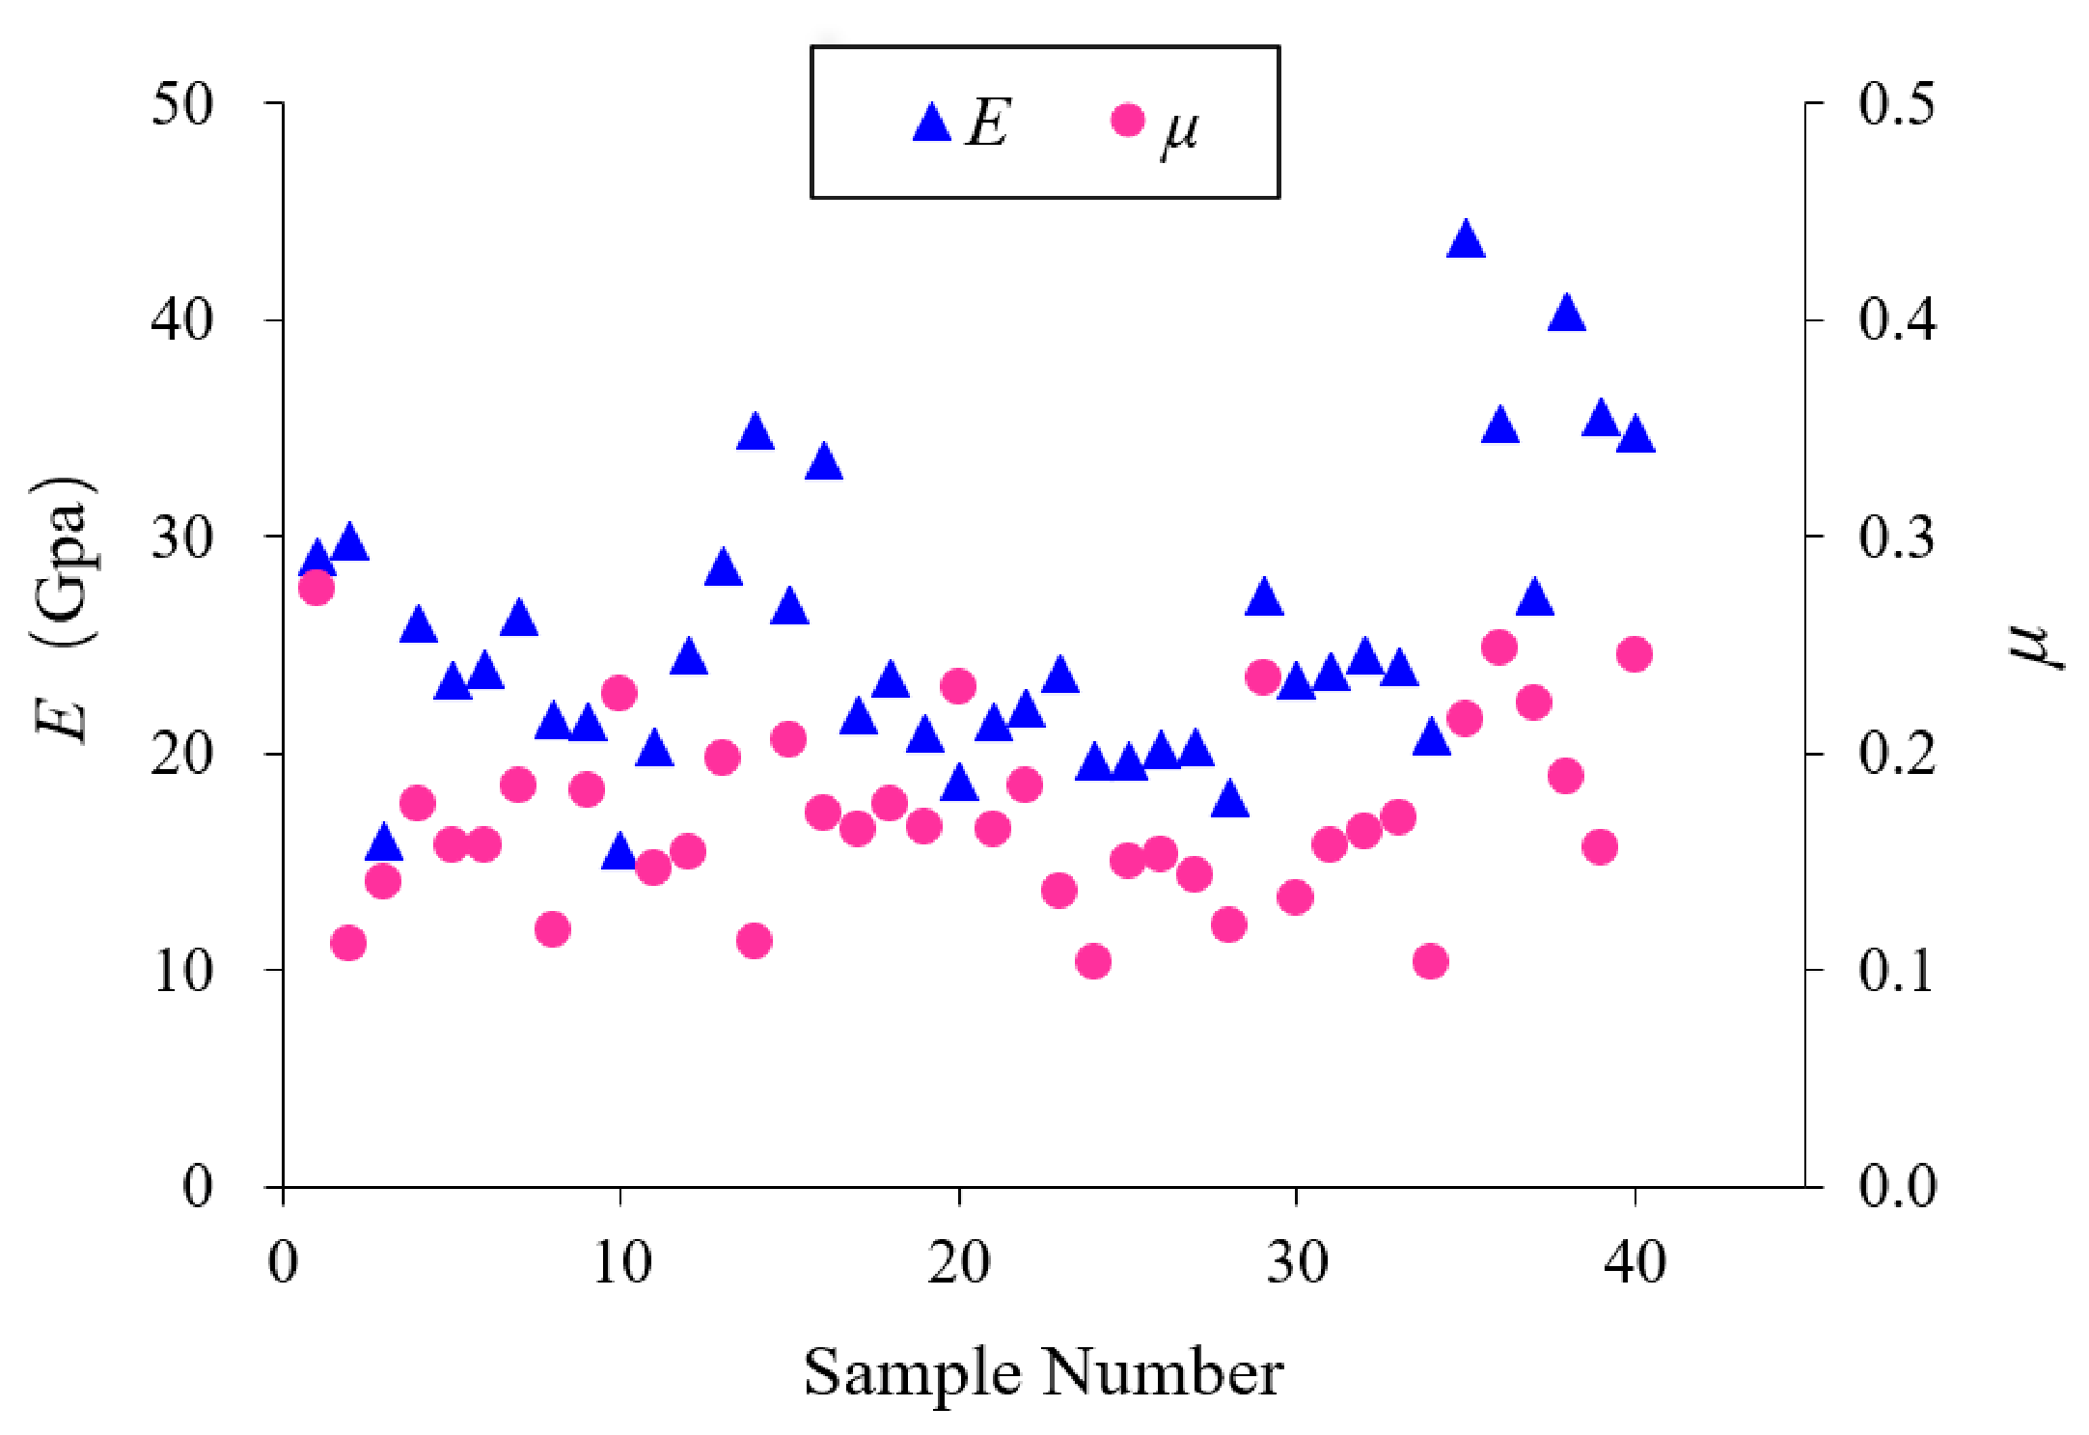
Through this experiment, 40 groups of effective data are obtained, and the elastic modulus and Poisson’s ratio parameters of amygdaloid basalt are shown in Figure 5.
Figure 5.
Results of the deformation parameters of almond basalt under the uniaxial compression test.
Because of the influence of joints and cracks on the rock mass, the elastic modulus of the rock is very different from the deformation modulus of the rock mass. To obtain the deformation modulus of the rock mass, the elastic modulus of the rock must be reduced [36]. This paper adopts the empirical formula Equation (21) of Nicholson and Bieniawski for reduction [37]. According to relevant data, the RMR value of the rock surrounding the tunnel is 66.
As the integrity of the rock mass is good, Poisson’s ratio of the rock and the rock mass are not much different, so the reduction in Poisson’s ratio of the rock mass is neglected.
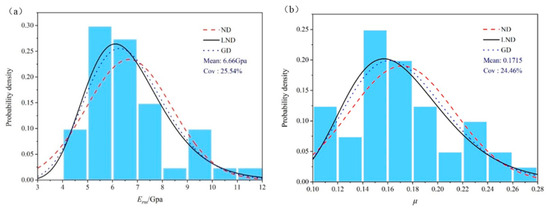
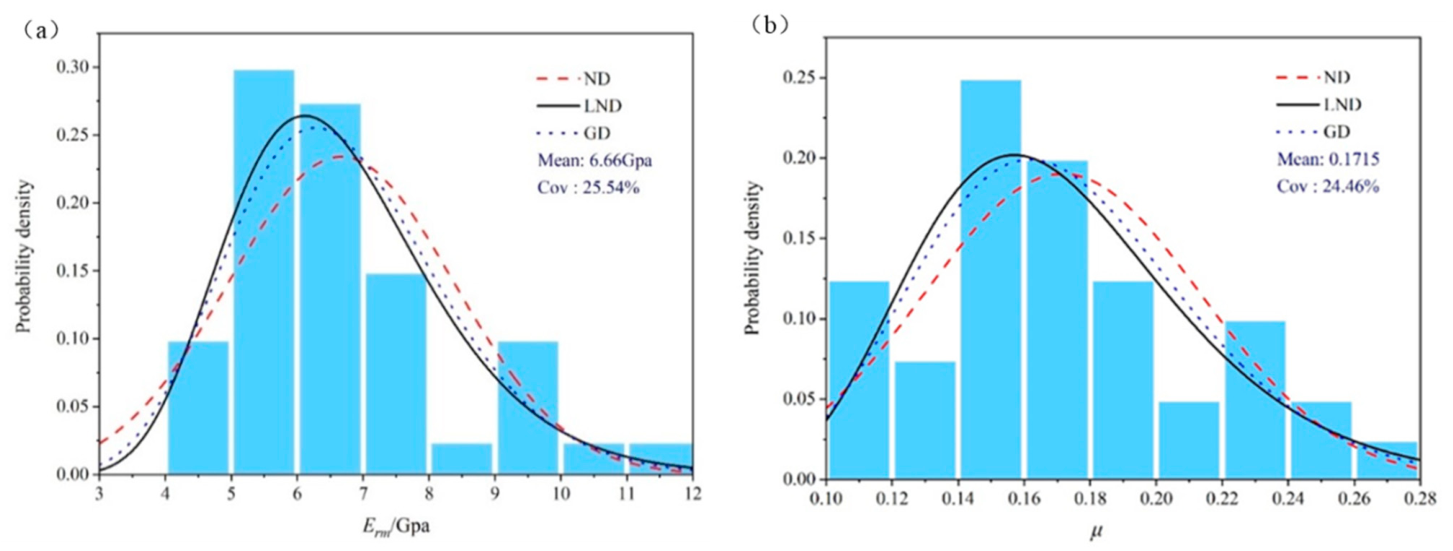
According to the existing research results and experience, the various mechanical parameters of rock masses have no definite probability distribution form, and the main possible distribution forms are normal distribution (ND), logarithmic normal distribution (LND) and gamma distribution (GD). To comprehensively analyze and determine the optimal probability distribution form of the rock mass deformation modulus and Poisson’s ratio, hypothesis testing of different distributions of variable samples must be performed. In this paper, the commonly used ND, LND and GD are used for histogram statistical analysis of rock deformation parameters. The analysis results are shown in Figure 6. According to the analysis results, the actual distribution types of the deformation modulus and Poisson’s ratio are similar to ND, LND and GD. To find the optimal distribution type, hypothesis testing is needed for the above distribution forms.
Figure 6.
Statistical distribution and corresponding probability density curves for the deformational parameters. ((a) deformation modulus, (b) Poisson’s ratio.)
The commonly used distribution hypothesis testing methods include binomial testing, kurtosis–skewness testing, χ2 testing, and Kolmogorov–Smirnov testing (K-S) [38]. The K-S test is often used for the distribution types of rock mass parameters because the K-S method is suitable for a small number of samples and has the advantages of good robustness, insensitivity to scale, being independent of the mean position, and making complete use of data.
Here, the K-S method is used to test the distribution hypothesis of the probability distribution of the deformation modulus and Poisson’s ratio. The calculation results are shown in Table 2. The results show that the distribution forms of the deformation modulus and Poisson’s ratio parameters are suitable for ND, LND and GD, but the K-S value corresponding to LND is the smallest, so LND is the optimal distribution form for both parameters.
Table 2.
Hypothesis testing of rock mass deformation parameters.
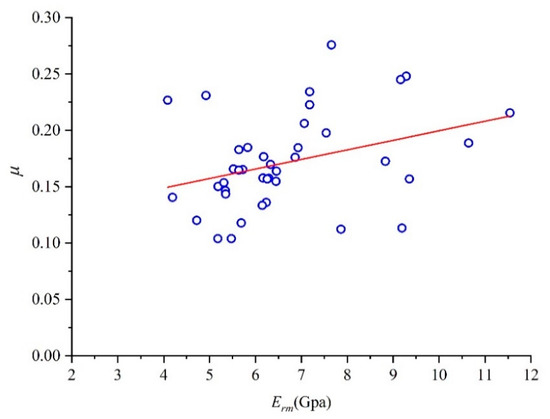
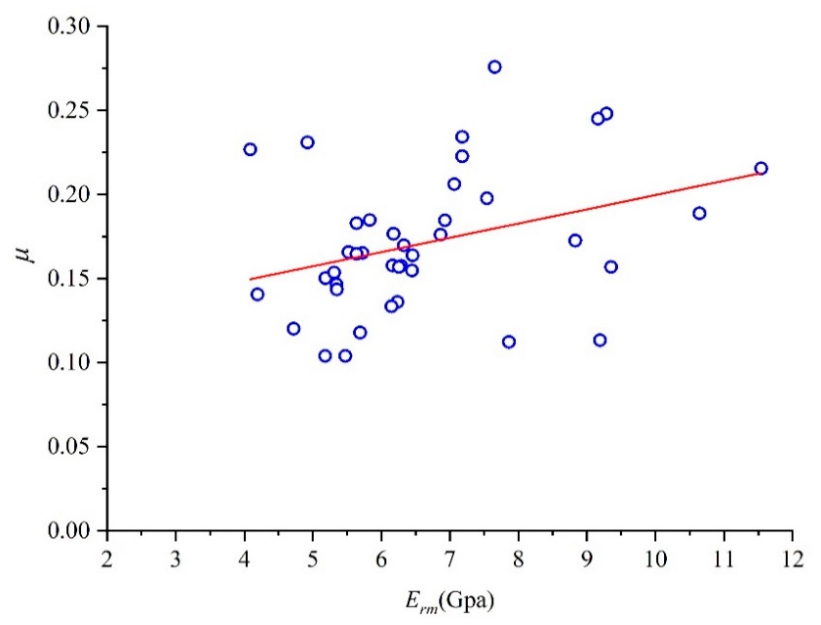
The cross-correlation coefficient between rock mechanical parameters is also an important factor affecting tunnel deformation and failure probability. Using the Pearson cross-correlation coefficient formula in Equation (22), the correlation between Poisson’s ratio and the deformation modulus is calculated, yielding a cross-correlation coefficient of 0.3438. The scatter diagram of the correlation between the deformation modulus and Poisson’s ratio is shown in Figure 7, from which it can be seen that there is a certain correlation between the two.
Figure 7.
Cross-correlation scatter plot of deformation parameters of test samples.
According to the above rock tests, the distribution types of the deformation modulus and Poisson’s ratio of the rock mass have logarithmic normal distributions. LND variables must be transformed into standard ND variables in the uncertainty analysis. The change in the cross-correlation coefficient of variables should be considered in the transformation process, and the Nataf transformation can be used [39]. When and are subject to LND, the analytical transformation formula of the cross-correlation coefficient between them can be calculated by Equation (23). After formula transformation, the cross-correlation coefficient between the deformation modulus and Poisson’s ratio is 0.3507.
Through the above test and calculation, the statistical law of rock mass deformation parameters can be obtained, as shown in Table 3.
Table 3.
Statistic information of rock mass deformation parameters.
3.3. Tunnel Physical Model Test and Analysis
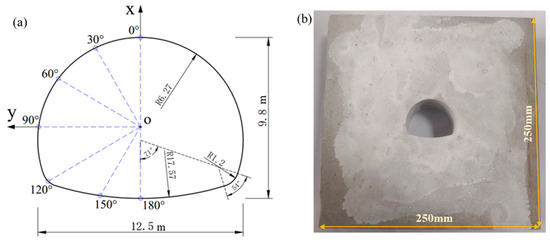
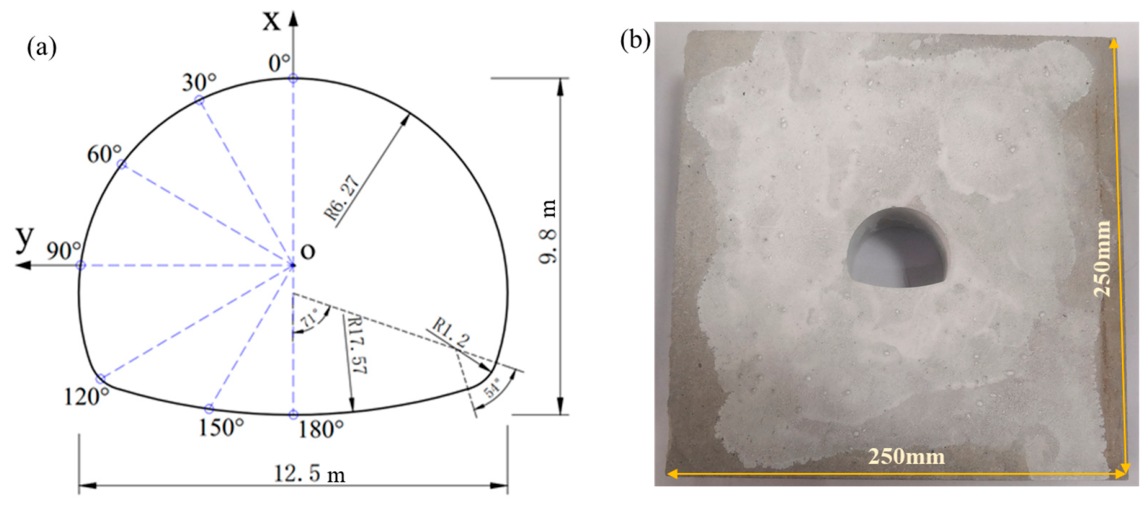
The tunnel engineering prototype is simplified into a plane strain tunnel physical model. According to the similarity theory, the model is prepared using cement-based materials, and the corresponding tunnel physical model is made at a scale of 1:250. The size of the tunnel section and monitoring points are shown in Figure 8a. Considering the influence range of 2 to 3 times the tunnel diameter, the outer boundary of the physical model is 250 mm × 250 mm × 40 mm, as shown in Figure 8b.
Figure 8.
(a) Tunnel engineering prototype size diagram, and (b) physical model diagram.
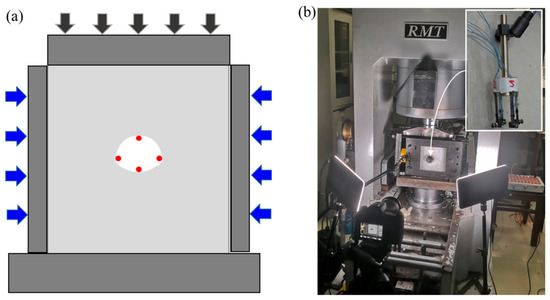
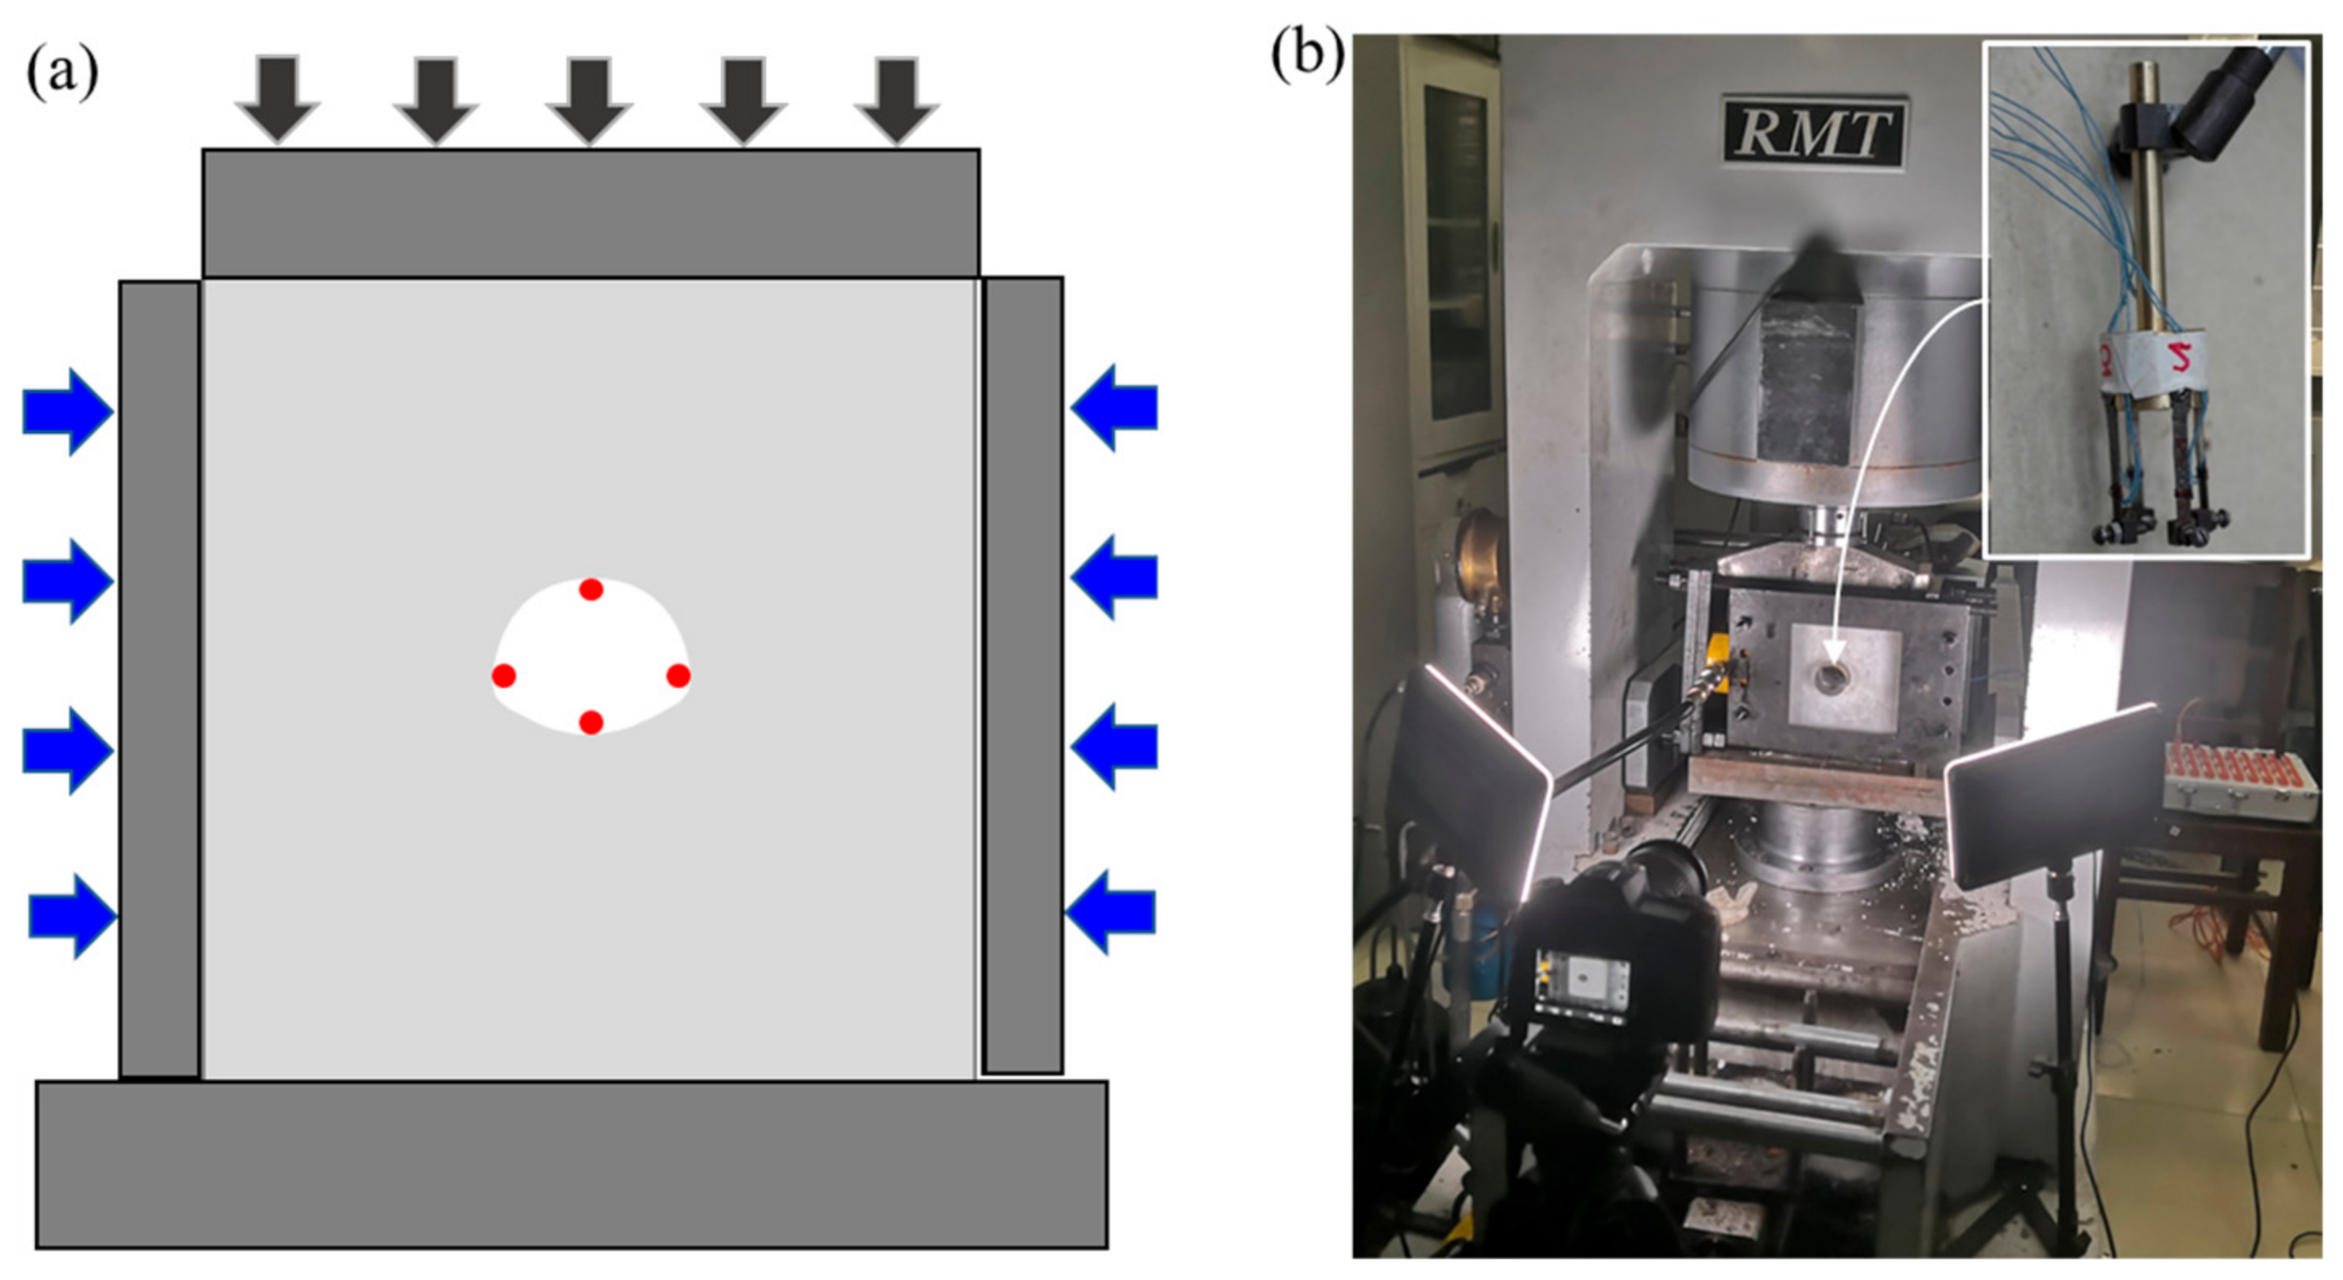
Preloading in the left and right directions of the model ensures that the stress of the physical tunnel model is similar to that of the actual project. Then, the overload failure test is carried out in the vertical direction with the loading rate of 0.002 mm/s. The deformation of the surrounding rock in the tunnel adopts a self-made displacement measuring device to test the horizontal and vertical displacement [40]. The mechanical behavior of tunnel deformation and failure at different stages under overload are analyzed. The whole experiment is completed on RMT-150C servo press developed by the Institute of Rock and Soil Mechanics, Chinese Academy of Sciences, as shown in Figure 9.
Figure 9.
Overload failure test of tunnel physical model. (a) Test scheme diagram, and (b) field test diagram.
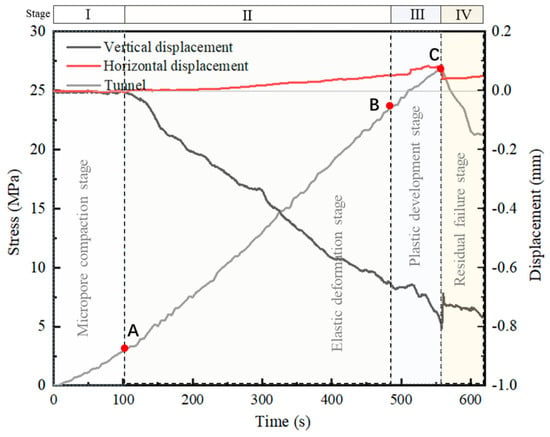
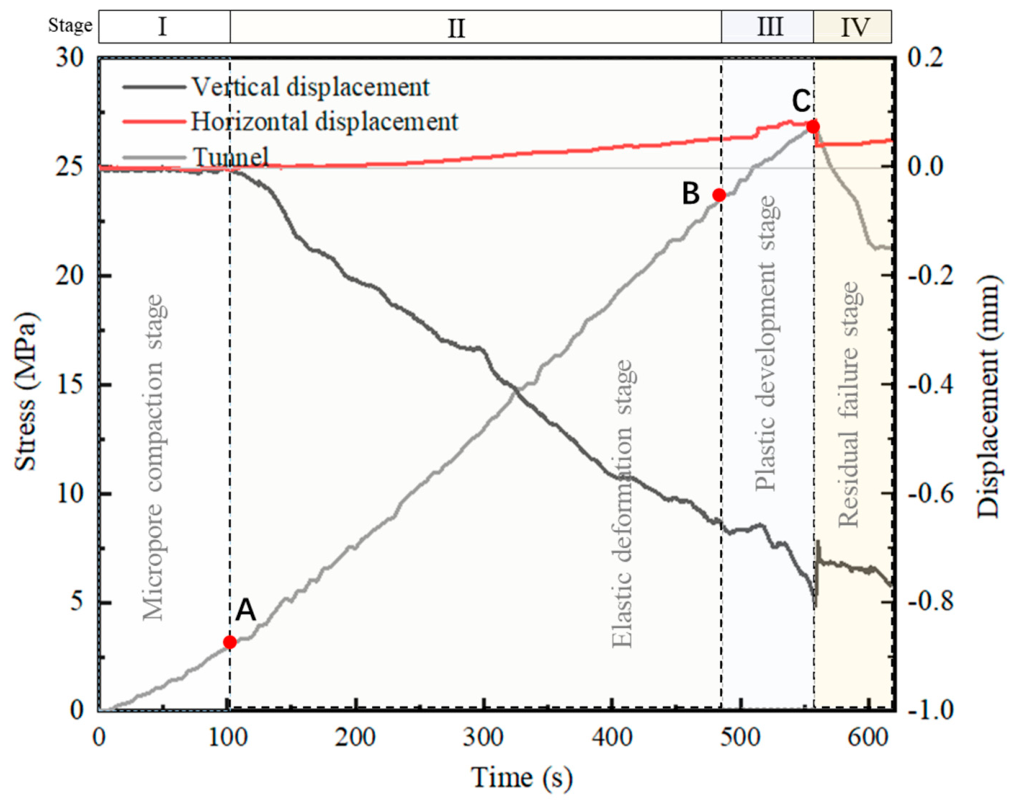
Through the overload failure test of the physical model, the stress time–history curve and the displacement deformation curve in the tunnel are obtained. Combined with the stress time–history curve and the photographic crack propagation process, the stress time–history curve can be divided into micro-pore compaction stage, elastic deformation stage, plastic development stage and residual failure stage, as shown in Figure 10. Quantitatively, the stage boundaries are determined by the evolution of the tangent modulus of the stress–time curve. The elastic stage is defined as the period during which the tangent modulus remains within ±5% of its initial value; the plastic stage is identified when the tangent modulus drops below 70% of the initial elastic modulus [41]. In the micro-pore compaction stage, the stress time–history curve rises with a small slope. In the elastic stage, the stress time–history curve increases linearly. In the plastic phase, the time–history curve increases nonlinearly; After reaching the peak point, the time–history curve has a certain residual strength after a sudden drop. Point A is the elastic starting point, point B is the elastic–plastic turning point, and point C is the peak failure point.
Figure 10.
Test results of tunnel physical model test.
Processing the data of the four measurement points in the tunnel, the displacement curves in the horizontal direction and the vertical direction are obtained. The horizontal displacement and the vertical displacement changed little in the micro-pore compaction stage. In the elastic stage, the horizontal displacement and vertical displacement in the tunnel change nearly linearly, and the vertical displacement is obviously larger than the horizontal displacement. In the plastic phase, the horizontal displacement and vertical displacement increase nonlinearly. Both the horizontal displacement and the vertical displacement in the peak point tunnel have a wide range of fluctuations. The whole process is consistent with the characteristics of tunnel failure, indicating that the four stages of tunnel deformation and failure are accurately divided.
The stress, time–history, vertical displacement and horizontal displacement data of points A, B and C in Figure 11 are extracted, and the data of elastic stage and elasto −plastic stage are calculated, respectively. Finally, the proportion of elastic stage in the whole elastoplastic stage is calculated through Equation (24), and the average value is calculated, as shown in Table 4; the elastic stag reduction coefficient is 0.83.
Figure 11.
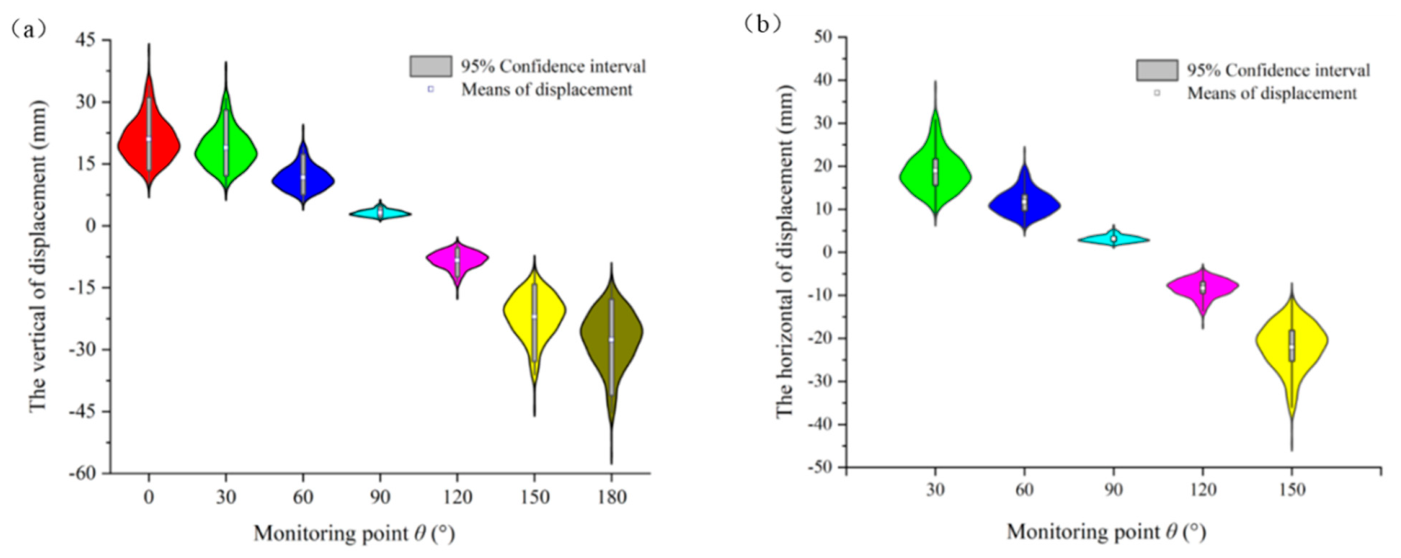
(a) Vertical displacements of the monitoring point violin distribution map, and (b) hori −zontal displacements of the monitoring point violin distribution map.
Table 4.
Elastic–plastic proportion analysis of tunnel physical model test.
3.4. Deformation Range Analysis
During the analysis, a monitoring point is selected every 30° on the inner surface of the tunnel for analysis. Because of the symmetry of the tunnel, only one side of the tunnel is arranged. According to the shape of the tunnel section, the conformal mapping function of the horseshoe tunnel can be obtained by the optimization method, as shown in Equation (25).
According to the relevant data [42], the vertical ground stress P is 15.9 MPa, and the lateral pressure coefficient is 0.9, without considering the shear stress. Through the above plane elastic complex function method, the vertical and horizontal displacement expressions corresponding to seven representative monitoring points of the tunnel were derived, as shown in Table 5.
Table 5.
Analytical equation of monitoring point displacement.
According to the distribution of deformation parameters of rock mass in Table 2, combined with the displacement expression of different monitoring points in Table 3, 1000 MCS random samplings were used to obtain 1000 groups of displacement data of different monitoring points, which were analyzed by violin diagram.
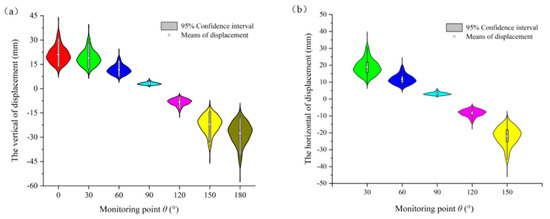
The vertical displacement analysis is shown in Figure 11a. The vault corresponds to the 0° monitoring point, and the average displacement is 20.94 mm. The inverted arch midpoint corresponds to the 180° monitoring point, and the average displacement is −27.64 mm. The mean absolute value, confidence interval and variation coefficient of the displacements are the largest at 0° or 180° monitoring points and the smallest at the monitoring point corresponding to 90°. However, the horizontal displacement violin in Figure 11b represents opposite results. The horizontal displacements of the mean value, confidence interval and coefficient of variation of the measuring point corresponding to 90° are the largest, and the displacement mean is 11.30 mm. The horizontal displacement of the vault and inverted arch midpoint is 0 mm. The external violin-like shape is the kernel density estimation which reflects the intensity of data. It can be found that the horizontal displacement and vertical displacement of each monitoring point have the following characteristics: from 0° monitoring point to 90°monitoring point, the displacement dispersion degree is from large to small; from 90°monitoring point to 180°monitoring point, the displacement dispersion degree is from small to large; and the direction of larger absolute displacement has greater dispersion.
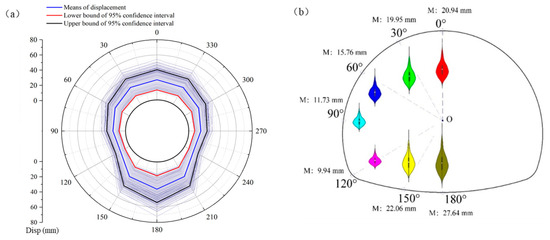
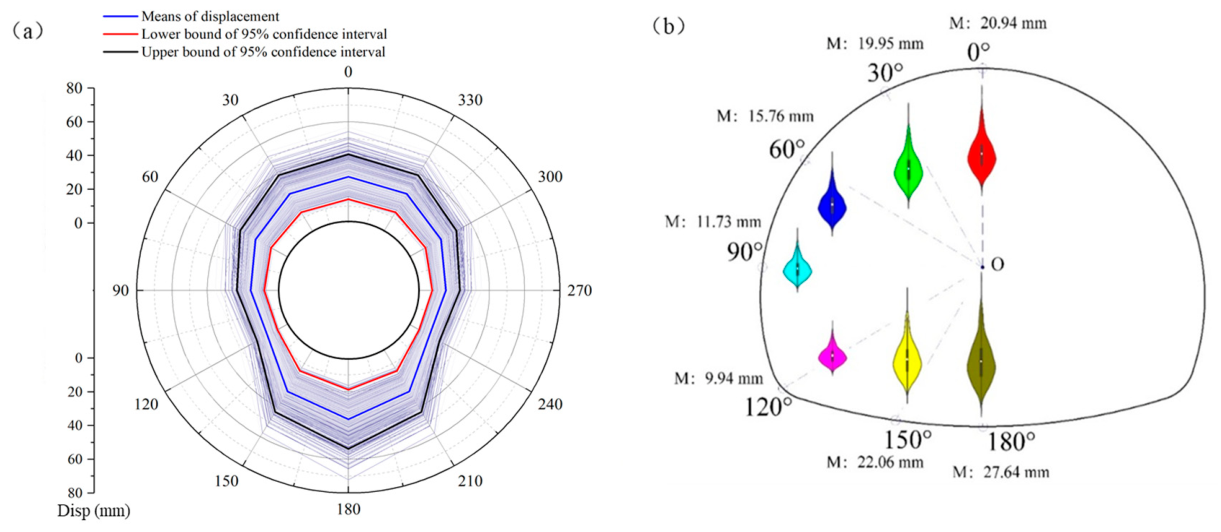
The vector sum of the above 1000 groups of horizontal and vertical displacements is calculated to obtain 1000 combined displacements, and the mean value of each monitoring point and the upper and lower bounds of the 95% confidence interval are calculated. Then, the spline curve is plotted, and the violin diagram is combined for analysis, as shown in Figure 12. The combined displacement variation trends at different monitoring points are similar. The corresponding displacement mean, variation coefficient and 95% confidence interval are larger at the vault and inverted arch midpoint and gradually reduced in the middle monitoring points, reaching a minimum near 110°. The combined displacement of seven monitoring points tends to be discrete in the direction of large displacement.
Figure 12.
(a) Combined displacement of monitoring points of 1000 MCS, and (b) combined displacement of the monitoring point violin distribution map.
3.5. Failure Probability Estimation
When the deformation of the surrounding rock is larger than its allowable value, instability failure will occur due to excessive deformation [43,44]. For the tunnel’s surrounding rock, the ultimate displacement depends on the stable ultimate strain rate , and the limit strain rate is the ratio of the excavation space convergence value to the diameter. Therefore, the functional function can be defined as Equation (26).
where corresponds to the maximum allowable strain rate. is the final radial displacement of the surrounding rock. R is the radius of the tunnel.
Many scholars have studied the ultimate strain rate of rock surrounding tunnels. is related not only to the physical and mechanical properties of the surrounding rock but also to the construction technology and safety requirements of tunnels [45]. Sakurail [46] suggests that the allowable value of surrounding rock deformation is 1%, believing that when the tunnel surrounding rock deformation exceeds 1%, the tunnel may have instability problems and support difficulties. Considering that the surrounding rock of this tunnel is hard, and combining with the evaluation criteria proposed by experts from various countries, the 1% is selected as the ultimate strain rate of the surrounding rock for analysis. The ultimate displacement at the elastic stage must be multiplied by an elastic reduction factor, as shown in Equation (27), and the elastic limit strain rate of surrounding rock is 0.83%.
Substituting the area of a horseshoe tunnel into a circular tunnel, the corresponding calculated radius R is 6.653 m. According to the above displacement distribution law, the vertical displacement of the two monitoring points of 0° and 180° is the largest. The average displacement of these two monitoring points is selected as the vault subsidence analysis object, and the vertical limit displacement function is established. Because the horizontal displacement of the 90° monitoring point is the largest and the tunnel is symmetrical, the horizontal displacement of the 90° monitoring point is selected as the peripheral convergence monitoring point to establish the horizontal displacement function. The two functions are considered in series because either failure mode—vault subsidence or peripheral convergence exceeding the elastic limit—would independently compromise tunnel serviceability (e.g., lining cracking, clearance reduction, or collapse). Thus, the occurrence of either mode is sufficient to define system failure under the serviceability limit state [46]. The calculation parameters are shown in Table 2. Therefore, the total failure probability is obtained as the probability of their union (series system). The MCS method is used for 10 million samplings, and the deformation failure probability of the tunnel system can be analyzed. The whole calculation process only costs 2.53 s, the coefficient of variation of failure probability is 0.0051, and the failure probability is 0.387%, which shows that the calculation results are accurate and efficient. The entire calculation process for 10 million MCS samples takes only 2.53 s on a standard personal computer (Intel Core i7, 2.6 GHz, 16 GB RAM). In contrast, a conventional finite element-based MCS analysis for the same tunnel geometry and number of samples would typically require several hours to days, as each finite element simulation takes minutes to hours depending on mesh density and nonlinearity [47,48]. Thus, the proposed complex function–MCS method achieves a speedup factor of approximately 103 to 105 compared to numerical methods, while maintaining high accuracy (coefficient of variation of failure probability = 0.0051, well below the 0.05 engineering threshold). This dramatic improvement in computational efficiency makes it feasible to perform parametric studies, sensitivity analyses, and real-time reliability assessments for non-circular tunnels.
4. Discussion
The mean value, coefficient of variation and correlation of the rock’s mechanical parameters have different effects on the failure probability of the tunnel. The basalts in the Baihetan Hydropower Station can be divided into porphyritic basalt, columnar jointed basalt, cryptocrystalline basalt and amygdaloid basalt according to their mineral composition, structure and formation environment. Thus, the mechanical properties of different types of basalt are very different. Therefore, the complex function–MCS method is further used to discuss the relationship between the basalt deformational parameters (i.e., mean value, variation coefficient and cross-correlation coefficient) and the failure probability of the traffic tunnel.
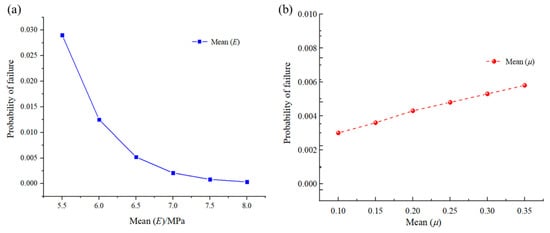
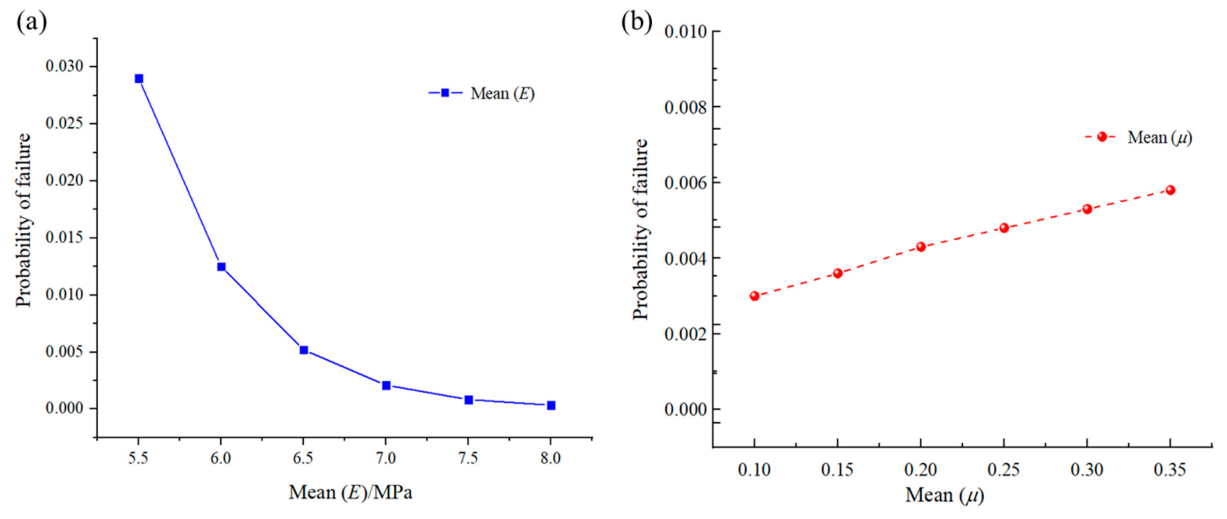
First, the influence of the mean change in the deformation modulus and Poisson’s ratio of basalt on the failure probability of a horseshoe tunnel is discussed. To analyze the corresponding relationship between the mean value of the deformation modulus and the failure probability of the tunnel, the mean value of the single-variable deformation modulus is set in the uniform range from 5.5 GPa to 8 GPa, and the corresponding relationship between the average deformation modulus and the failure probability of the tunnel is obtained, as shown in Figure 13a. Similarly, the average Poisson’s ratio of a single variable is set from 0.1 to 0.35, and the corresponding relationship between the average Poisson’s ratio and the failure probability of the tunnel is obtained, as shown in Figure 13b; the failure probability of the tunnel decreases with the increase in the mean value of the deformation modulus, showing a power exponential relationship, but it increases with the increase in the mean value of Poisson’s ratio, showing an approximate linear relationship.
Figure 13.
Relationship between the mean deformation parameters and probability of tunnel failure ((a) deformation modulus, (b) Poisson’s ratio).
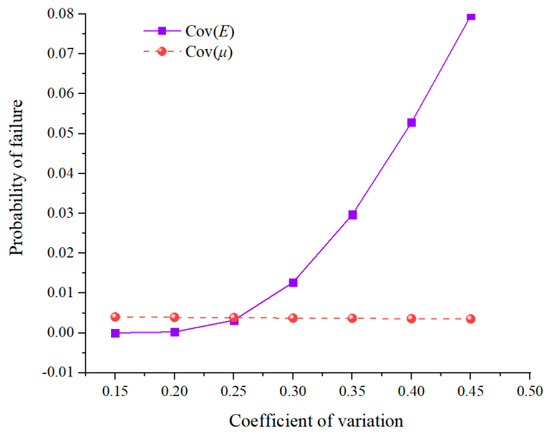
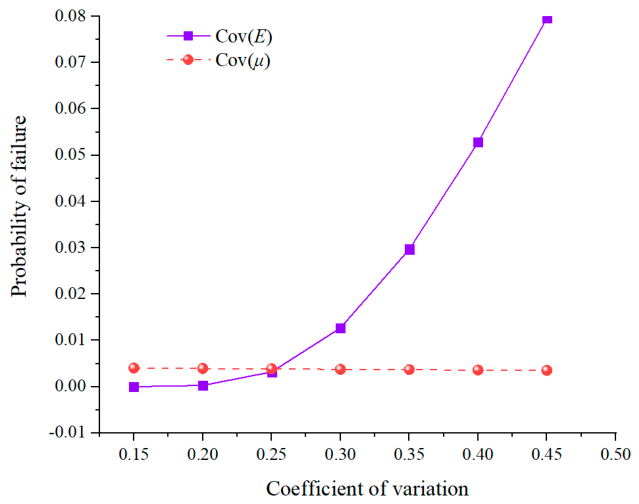
To discuss the influence of the coefficient of variation (Cov) of the deformation modulus and Poisson’s ratio on the tunnel failure probability, univariate variation coefficients are controlled from 0.15 to 0.45, and other parameters are shown in Table 2. The relationship between the variation coefficient of deformation parameters and the tunnel failure probability is obtained by calculation, as shown in Figure 14. According to the analysis results, the variation coefficient of the deformation modulus has a greater influence on the tunnel failure probability than that of Poisson’s ratio. The tunnel failure probability increases with the increase in the former parameter, while slightly decreasing with the increase in the latter parameter. The tunnel failure probability is much more sensitive to the deformation modulus than to Poisson’s ratio.
Figure 14.
Relationship between the coefficient of variation of deformation parameters and the probability of tunnel failure.
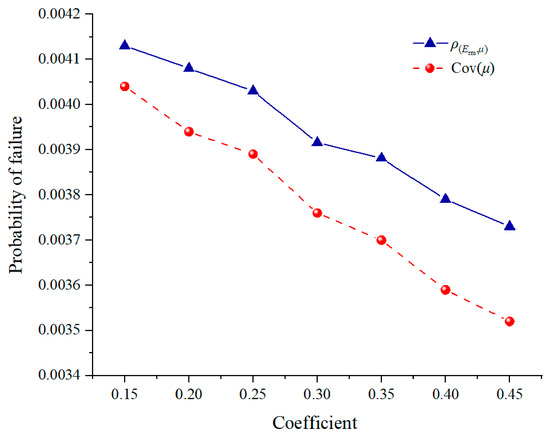
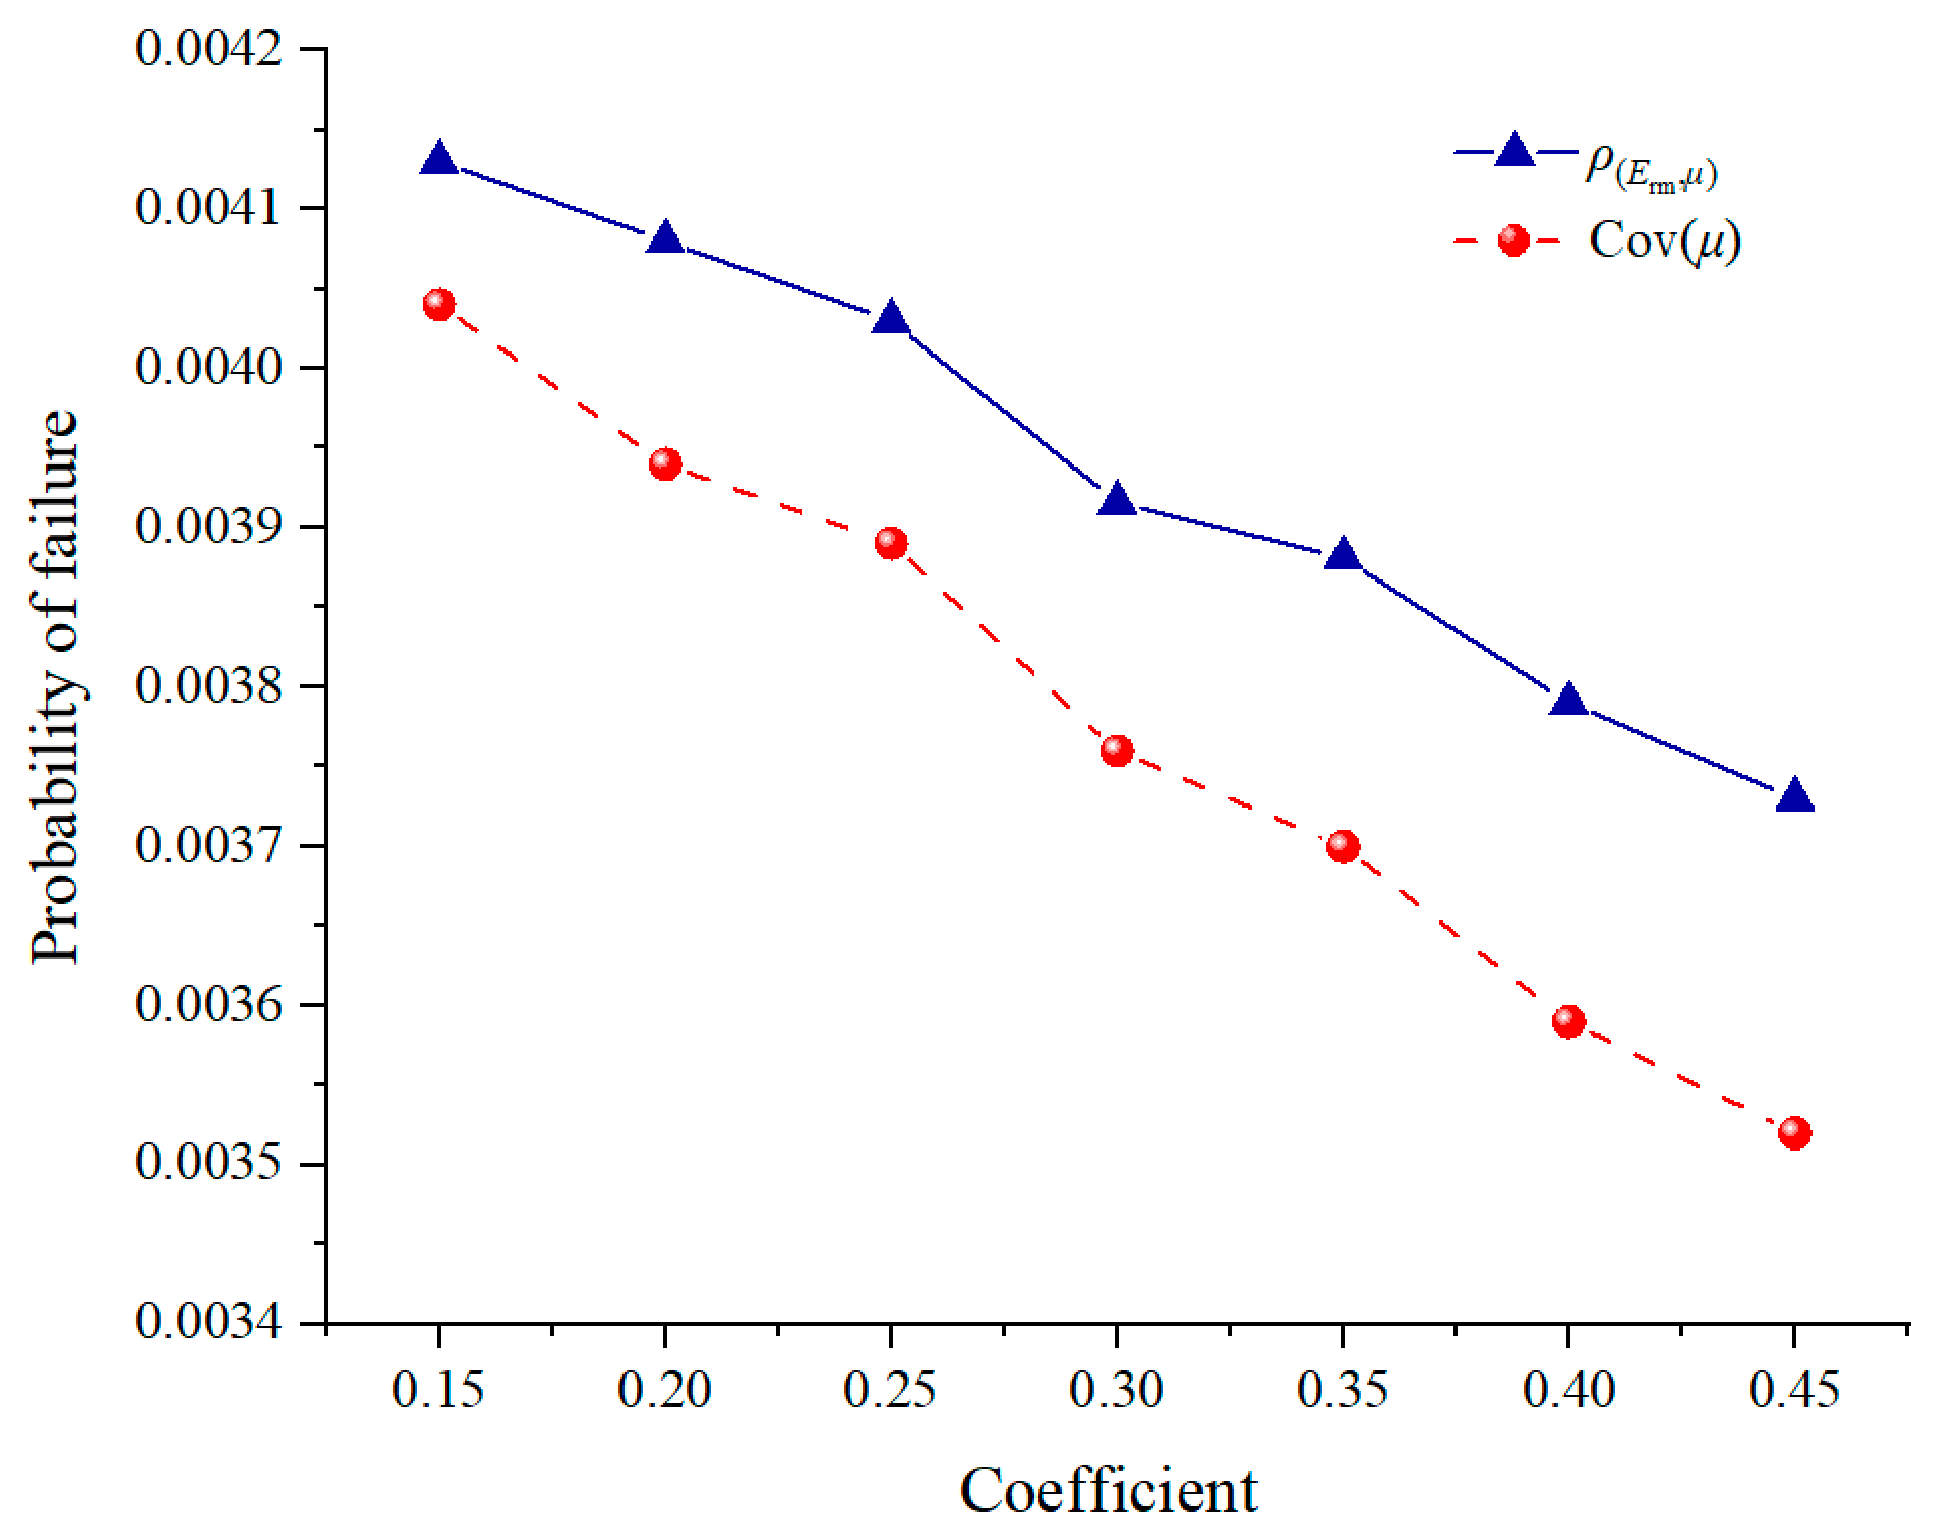
There is a certain correlation between geotechnical materials. To analyze the cross-correlation between parameters, the correlated normal random variable Y must be transformed into the independent normal random variable U through the Cholesky orthogonal transformation method [49]. Namely, the lower triangular matrix L can be obtained by Cholesky decomposition of the cross-correlation coefficient matrix , and the standard normal random variable U can be expressed as . To analyze the influence of the cross-correlation between the rock deformation modulus and Poisson’s ratio on the tunnel failure probability, the cross-correlation coefficient is controlled to change uniformly from 0.15 to 0.45. Other parameters are shown in Table 2. The relationship between the cross-correlation coefficient and tunnel failure probability is computed and compared with the sensitivity of Poisson’s ratio variation coefficient, as shown in Figure 15. The influences of the cross-correlation coefficient and Poisson’s ratio variation coefficient on the tunnel failure probability are similar, but the changing trend of the cross-correlation coefficient is smoother and the sensitivity is worse.
Figure 15.
Relationship between the cross-correlation coefficient of deformation parameters and tunnel failure probability.
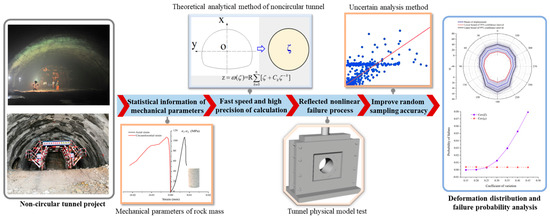
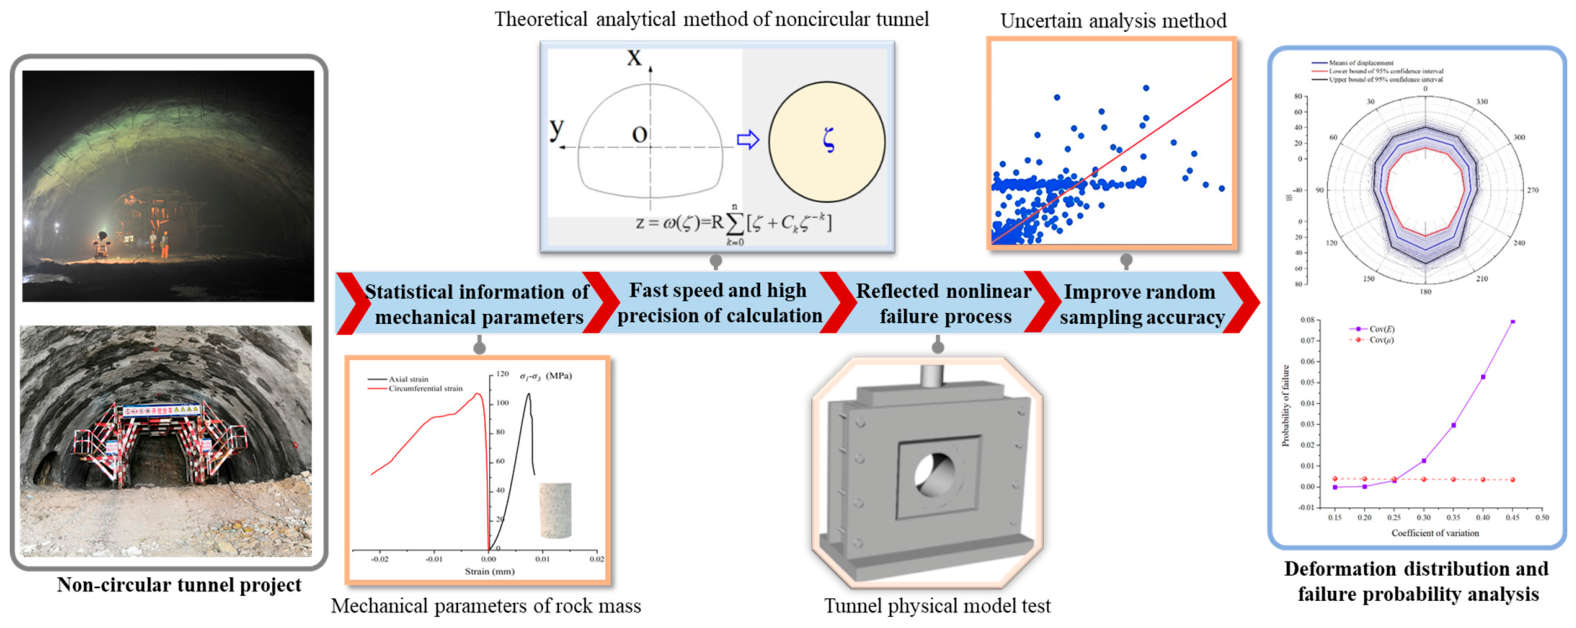
The theoretical analytical solution of the tunnel has the advantages of fast calculation speed and high calculation accuracy, but it is difficult to obtain accurate elastoplastic analytical solutions for non-circular tunnels. A similar physical simulation can show the whole process of continuous and discontinuous physical deformation and medium failure [50]. In this paper, the proportion of the elastic stage in the tunnel failure process is obtained through the tunnel similarity physical model test, the elastic stage reduction coefficient is obtained, and the analytical solution of non-circular tunnel displacement is obtained by complex variable function. The elastic displacement function after reduction can be established, and the failure probability of the non-circular tunnel can be quickly and accurately calculated by MCS sampling. The main innovation of the complex function–MCS uncertainty analysis method for the non-circular tunnel is that it combines the advantages of the theoretical analytical solution and the physical model test, which can realize the rapid calculation of non-circular tunnel failure probability, as shown in Figure 16. On the basis of this paper, the advantages of the physical model test can be further explored, and a more advanced uncertainty analysis method can be adopted to realize more accurate and faster calculation for non-circular tunnel failure probability.
Figure 16.
Complex function–MCS uncertainty analysis method and its advantages.
The analytical method combined with reliability analysis proposed in this paper computes the failure probability of non-circular tunnels in just 2.53 s. In contrast, Jiang et al. used the random finite element method (RFEM) together with Monte Carlo simulation (MCS) to analyze the stability of surrounding rock in a large underground cavern, requiring 8000 finite element calculations per case. Although their numerical method offers high accuracy, it comes at a significant computational cost. By comparison, the proposed method is more than two orders of magnitude (i.e., over a hundred times) faster than that of Jiang et al. [7]’s, greatly improving the efficiency of tunnel reliability analysis. This comparison highlights the distinct advantages of the complex function–MCS method, particularly its applicability to non-circular tunnels, high computational efficiency, and integration with physical model tests.
Overall, the proposed method occupies a unique niche: it combines the speed of analytical solutions with the realism of experimental calibration, making it particularly suitable for preliminary design and parametric studies of non-circular tunnels. However, its limitations (e.g., elastic reduction assumption, plane strain simplification, isotropic elasticity) should be carefully considered when applying it to complex geological conditions or detailed final design.
5. Conclusions
Based on the rock mechanics test, physical model test, theoretical analysis method and MCS method, a new deformation failure probability analysis method of the complex function–MCS method for non-circular tunnels is proposed. Taking the traffic tunnel of Baihetan Hydropower Station as the background, the analysis method is described in detail, and the following conclusions are drawn.
(1) Through the uniaxial compression test of 40 groups of amygdaloid basalt, the statistical information of elastic modulus and Poisson’s ratio of rock are obtained, and the best distribution type of rock deformation modulus and Poisson’s ratio is LND. According to the distribution type, the correlation coefficient between the deformation modulus and Poisson’s ratio is 0.3438.
(2) The overload failure test of the tunnel physical model is designed, the change characteristics of stress, time history and displacement in the tunnel failure process are obtained, the proportion of the elastic stage in the tunnel overload process is analyzed, and the elastic stage reduction coefficient is 0.83; this result is applied to the tunnel failure probability analysis.
(3) The distribution laws of vertical displacement, horizontal displacement and combined displacement of the tunnel are calculated and analyzed, indicating that the vertical displacement and combined displacement at the vault and inversion are the most vulnerable parts.
(4) The deformation failure probability of the tunnel is 0.387% using a series system. This study shows that the tunnel failure probability is most sensitive to the coefficient of variation of the deformation modulus, followed by that of Poisson’s ratio.
(5) This study provides a closed-form analytical framework for non-circular tunnel displacement that explicitly incorporates the statistical distributions of rock deformation parameters, retaining the physical interpretability of elasticity theory while enabling probabilistic analysis. The elastic reduction coefficient derived from physical model tests bridges the gap between pure elastic analytical solutions and elastoplastic behavior, offering a new paradigm for reliability analysis of tunnels with complex geometries.
(6) The proposed method enables rapid, high-precision failure probability assessment for non-circular tunnels, completing 10 million MCS samples in only 2.53 s, making it suitable for preliminary design, parametric studies, and sensitivity analyses. The finding that the failure probability is most sensitive to the coefficient of variation of the deformation modulus, followed by that of Poisson’s ratio, provides practical guidance for prioritizing parameter characterization efforts in site investigations, thereby supporting cost-effective decisions on tunnel lining and support measures under uncertain geological conditions.
Author Contributions
Conceptualization, D.X. and Q.L.; methodology, Y.X., D.X. and Q.J.; software, D.H. and X.C.; validation, Y.X., Q.J. and Y.Y.; formal analysis, Y.X. and D.H.; investigation, Y.X. and Q.J.; resources, D.X. and Q.L.; data curation, Y.X., X.C. and Y.Y.; writing—original draft preparation, Y.X.; writing—review and editing, D.X., Q.J. and Q.L.; visualization, Y.X. and D.H.; supervision, D.X. and Q.L.; project administration, D.X. and Q.L.; funding acquisition, D.X. and Q.L. All authors have read and agreed to the published version of the manuscript.
Funding
This research was financially supported by the financial support from National Science Foundation of China (52569021, 52278401 and 42177156), Science and Technology Program of Power China (DJ-HXGG-2023-04), the Postdoctoral Science Foundation of China (2025M783190) and Jiangxi Provincial Natural Science Foundation (20242BAB25312, 20242BAB23037, 20243BBG71034 and 20232BAB204072).
Data Availability Statement
The original contributions presented in the study are included in the article; further inquiries can be directed to the corresponding author.
Acknowledgments
The authors acknowledge the financial support provided by the National Natural Science Foundation of China (Grant Nos. 52569021, 52278401 and 42177156), the Science and Technology Program of Power China (Grant No. DJ-HXGG-2023-04), the Postdoctoral Science Foundation of China (Grant No. 2025M783190), and the Jiangxi Provincial Natural Science Foundation (Grant Nos. 20242BAB25312, 20242BAB23037, 20243BBG71034 and 20232BAB204072).
Conflicts of Interest
Authors Yong Xia and Dongqi Hou were employed by the company POWERCHINA Chengdu Engineering Corporation Limited. The remaining authors declare that the research was conducted in the absence of any commercial or financial relationships that could be construed as a potential conflict of interest.
References
- Wang, Y.C.; Jing, H.W.; Su, H.J.; Xie, J.Y. Effect of a Fault Fracture Zone on the Stability of Tunnel-Surrounding Rock. Int. J. Geomech. 2017, 17, 04016135. [Google Scholar] [CrossRef] [Scilit]
- Li, D.Q.; Ding, Y.N.; Tang, X.S.; Liu, Y. Probabilistic risk assessment of landslide-induced surges considering the spatial variability of soils. Eng. Geol. 2021, 283, 105976. [Google Scholar] [CrossRef] [Scilit]
- Liu, X.F.; Pan, P.Z.; Zhou, Y.Y.; Wang, Z.F.; Xu, D.P. Role of foliation occurrence and stress orientation on asymmetric failure in foliated rock tunnel: Insight from numerical simulation. Eng. Fail. Anal. 2024, 160, 108174. [Google Scholar] [CrossRef] [Scilit]
- Li, T.Z.; Yang, X.L. Reliability Analysis of Tunnel Face in Broken Soft Rocks Using Improved Response Surface Method. Int. J. Geomech. 2018, 18, 04018021. [Google Scholar] [CrossRef] [Scilit]
- Wang, Q.; Huang, T.C. Time-variant reliability analysis of underground structures against delayed failure based on the probability density evolution method. Eng. Fail. Anal. 2022, 142, 106695. [Google Scholar] [CrossRef] [Scilit]
- Tonini, M.; Pecoraro, G.; Romailler, K.; Calvello, M. Spatio-temporal cluster analysis of recent Italian landslides. Georisk 2022, 16, 536–554. [Google Scholar] [CrossRef] [Scilit]
- Jiang, Q.; Liu, J.; Zheng, H.; Wang, B.; Guo, Z.Z.; Chen, T.; Xiong, X.T. Bayesian Estimation of Rock Mechanical Parameter and Stability Analysis for a Large Underground Cavern. Int. J. Geomech. 2022, 22, 04022129. [Google Scholar] [CrossRef] [Scilit]
- Sari, M.; Karpuz, R.; Ayday, R.J.C. Geosciences. Estimating rock mass properties using Monte Carlo simulation: Ankara andesites. Comput. Geosci. 2010, 36, 959–969. [Google Scholar] [CrossRef] [Scilit]
- Hong, Q.Y.; Lai, H.P.; Liu, Y.Y. Failure analysis and treatments of collapse accidents in loess tunnels. Eng. Fail. Anal. 2023, 145, 107037. [Google Scholar] [CrossRef] [Scilit]
- Zeng, P.; Senent, S.; Jimenez, R. Reliability Analysis of Circular Tunnel Face Stability Obeying Hoek-Brown Failure Criterion Considering Different Distribution Types and Correlation Structures. J. Comput. Civil. Eng. 2016, 30, 04014126. [Google Scholar] [CrossRef] [Scilit]
- Gong, W.P.; Juang, C.H.; Martin, J.R.; Tang, H.M.; Wang, Q.Q.; Huang, H.W. Probabilistic analysis of tunnel longitudinal performance based upon conditional random field simulation of soil properties. Tunn. Undergr. Sp. Technol. 2018, 73, 1–14. [Google Scholar] [CrossRef] [Scilit]
- Azadi, M.; Ghasemi, S.H.; Mohammadi, M. Reliability analysis of tunnels with consideration of the earthquakes extreme events. Geomech. Eng. 2020, 22, 433–439. [Google Scholar] [CrossRef]
- Jiang, Q.; Zhong, S.; Cui, J.; Feng, X.T.; Song, L.B. Statistical Characterization of the Mechanical Parameters of Intact Rock Under Triaxial Compression: An Experimental Proof of the Jinping Marble. Rock Mech. Rock Eng. 2016, 49, 4631–4646. [Google Scholar] [CrossRef] [Scilit]
- Do, D.P.; Vu, M.N.; Tran, N.T.; Armand, G. Closed-Form Solution and Reliability Analysis of Deep Tunnel Supported by a Concrete Liner and a Covered Compressible Layer Within the Viscoelastic Burger Rock. Rock Mech. Rock Eng. 2021, 54, 2311–2334. [Google Scholar] [CrossRef] [Scilit]
- Dyson, A.P.; Tolooiyan, A. Comparative Approaches to Probabilistic Finite Element Methods for Slope Stability Analysis. Simul. Model. Pract. Theory 2020, 100, 102061. [Google Scholar] [CrossRef] [Scilit]
- Yang, X.L.; Li, W.T. Reliability analysis of shallow tunnel with surface settlement. Geomech. Eng. 2017, 12, 313–326. [Google Scholar] [CrossRef] [Scilit]
- Liao, P.; Wang, F.; Guo, C.J.E.F.A. Experimental analysis on the progressive failure mechanism of soft rock subjected to tunnel excavation. Eng. Fail. Anal. 2024, 164, 108636. [Google Scholar] [CrossRef] [Scilit]
- Meguid, M.A.; Saada, O.; Nunes, M.A.; Mattar, J. Physical modeling of tunnels in soft ground: A review. Tunn. Undergr. Sp. Technol. 2008, 23, 185–198. [Google Scholar] [CrossRef] [Scilit]
- Li, S.C.; Gao, C.L.; Zhou, Z.Q.; Li, L.P.; Wang, M.X.; Yuan, Y.C.; Wang, J. Analysis on the Precursor Information of Water Inrush in Karst Tunnels: A True Triaxial Model Test Study. Rock Mech. Rock Eng. 2019, 52, 373–384. [Google Scholar] [CrossRef] [Scilit]
- Li, J.Q.; Wang, Z.F.; Wang, Y.Q.; Chang, H.T. Analysis and countermeasures of large deformation of deep-buried tunnel excavated in layered rock strata:A case study. Eng. Fail. Anal. 2023, 146, 107057. [Google Scholar] [CrossRef] [Scilit]
- Verruijt, A. Deformations of an elastic half plane with a circular cavity. Int. J. Solids Struct. 1998, 35, 2795–2804. [Google Scholar] [CrossRef] [Scilit]
- Exadaktylos, G.E.; Stavropoulou, M.C. A closed-form elastic solution for stresses and displacements around tunnels. Int. J. Rock Mech. Min. 2002, 39, 905–916. [Google Scholar] [CrossRef] [Scilit]
- Westine, P.S.; Dodge, F.T.; Baker, W. Similarity Methods in Engineering Dynamics: Theory and Practice of Scale Modeling; Elsevier: Amsterdam, The Netherlands, 2012. [Google Scholar]
- Xu, H.; Liu, Y.; Li, F.; Wang, S.; Yang, S. Peridynamics modeling of underground borehole instability: Collapse mechanism and stabilization strategy. Simul. Model. Pract. Theory 2025, 145, 103203. [Google Scholar] [CrossRef] [Scilit]
- Niu, W.J.; Li, K.G.; Liu, X.F. Failure mode and intelligent prediction method of thin-layered rock mass tunnel. Environ. Earth Sci. 2025, 84, 100. [Google Scholar] [CrossRef] [Scilit]
- Rosenblueth, E. Point estimates for probability moments. Proc. Natl. Acad. Sci. USA 1975, 72, 3812–3814. [Google Scholar] [CrossRef] [Scilit] [PubMed]
- Yun, W.Y.; Lu, Z.Z.; Jiang, X.; Zhang, L.G.; He, P.F. AK-ARBIS: An improved AK-MCS based on the adaptive radial-based importance sampling for small failure probability. Struct. Saf. 2020, 82, 101891. [Google Scholar] [CrossRef] [Scilit]
- Zhang, B.; Ma, Z.Y.; Wang, X.; Zhang, J.S.; Peng, W.Q. Reliability analysis of anti-seismic stability of 3D pressurized tunnel faces by response surfaces method. Geomech. Eng. 2020, 20, 43–54. [Google Scholar] [CrossRef]
- Tu, H.L.; Zhou, H.; Gao, Y.; Lu, J.J.; Singh, H.K.; Zhang, C.Q.; Hu, D.W.; Hu, M.M. Probability Analysis of Deep Tunnels Based on Monte Carlo Simulation: Case Study of Diversion Tunnels at Jinping II Hydropower Station, Southwest China. Int. J. Geomech. 2021, 21, 04021243. [Google Scholar] [CrossRef] [Scilit]
- Engelund, S.; Rackwitz, R. A Benchmark Study on Importance Sampling Techniques in Structural Reliability. Struct. Saf. 1993, 12, 255–276. [Google Scholar] [CrossRef] [Scilit]
- Rubinstein, R.Y. Simulation and the Monte Carlo Method; Wiley: New York, NY, USA, 1981; pp. xv, 278p. [Google Scholar]
- Xu, N.W.; Wu, J.Y.; Dai, F.; Fan, Y.L.; Li, T.; Li, B. Comprehensive evaluation of the stability of the left-bank slope at the Baihetan hydropower station in southwest China. B Eng. Geol. Environ. 2018, 77, 1567–1588. [Google Scholar] [CrossRef] [Scilit]
- Shu, X.; Zhu, Z.; Qu, S.; He, L.; Zeng, H.; Zhang, C.; Tian, Y. Anisotropic characteristics and deformation behaviors of layered rocks surrounding tunnel: A review. J. Rock Mech. Geotech. Eng. 2025, 17, 8198–8223. [Google Scholar] [CrossRef] [Scilit]
- Hatheway, A.W. The complete ISRM suggested methods for rock characterization, testing and monitoring, 1974–2006. Environ. Eng. Geosci. 2009, 15, 47–48. [Google Scholar] [CrossRef] [Scilit]
- Liu, Q.; Zhang, X.; Jiang, Q.; Xia, Y.; Hou, D.; Li, L. Effects of nano-Al2O3, nano-MgO and nano-Fe2O3 on the properties of cement-based 3D printing: A comparative study. J. Build. Eng. 2025, 111, 113322. [Google Scholar] [CrossRef] [Scilit]
- Sari, M. An improved method of fitting experimental data to the Hoek-Brown failure criterion. Eng. Geol. 2012, 127, 27–35. [Google Scholar] [CrossRef] [Scilit]
- Nicholson, G.; Bieniawski, Z. A nonlinear deformation modulus based on rock mass classification. Int. J. Min. Geol. Eng. 1990, 8, 181–202. [Google Scholar] [CrossRef] [Scilit]
- Bermudez, V.; Tormos, B.; Olmeda, P.; Martin, J. Spreadsheet for Teaching Weibull Statistical Distribution Fitting in Maintenance Engineering. Int. J. Eng. Educ. 2008, 24, 1210–1216. [Google Scholar]
- Lebrun, R.; Dutfoy, A. A generalization of the Nataf transformation to distributions with elliptical copula. Probabilist Eng. Mech. 2009, 24, 172–178. [Google Scholar] [CrossRef] [Scilit]
- Liu, Q.; Jiang, Q.; Yu, Y.; Rong, Y.; Sun, Y.; Zhao, H.R. Extrusion 3D printing circular and horseshoe tunnel physical models: A comparative study of deformation and brittle failure. Theor. Appl. Fract. Mec. 2024, 129, 104229. [Google Scholar] [CrossRef] [Scilit]
- Gaff, M.; Babiak, M.J.C.S. Tangent modulus as a function of selected factors. Compos. Struct. 2018, 202, 436–446. [Google Scholar] [CrossRef] [Scilit]
- Zhao, Q.; Leng, X.L.; He, X. Research on the regional stress field of underground powerhouse at the right bank of Baihetan hydropower station. Appl. Mech. Mater. 2014, 580–583, 1042–1050. [Google Scholar] [CrossRef] [Scilit]
- Zhou, X.P.; Li, C.Q.; Zhou, L.S. The effect of microstructural evolution on the permeability of sandstone under freeze-thaw cycles. Cold Reg. Sci. Technol. 2020, 177, 103119. [Google Scholar] [CrossRef] [Scilit]
- Lü, Q.; Xiao, Z.P.; Zheng, J.; Shang, Y.Q. Probabilistic assessment of tunnel convergence considering spatial variability in rock mass properties using interpolated autocorrelation and response surface method. Geosci. Front. 2018, 9, 1619–1629. [Google Scholar] [CrossRef] [Scilit]
- Spackova, O.; Sejnoha, J.; Straub, D. Probabilistic assessment of tunnel construction performance based on data. Tunn. Undergr. Space Technol. 2013, 37, 62–78. [Google Scholar] [CrossRef] [Scilit]
- Sakurai, S. Displacement measurements associated with the design of underground openings. In Field Measurements in Geomechanics: Proceedings of the International Symposium; A.A. Balkema: Rotterdam, The Netherlands, 1984; pp. 1163–1178. [Google Scholar]
- Wang, Q.; Fang, H.; Shen, L.J.T.; Technology, U.S. Reliability analysis of tunnels using a metamodeling technique based on augmented radial basis functions. Tunn. Undergr. Space Technol. 2016, 56, 45–53. [Google Scholar] [CrossRef] [Scilit]
- Wang, Y.; Xing, C.; Yao, L.J.A.S. Reliability Analysis of High-Pressure Tunnel System Under Multiple Failure Modes Based on Improved Sparrow Search Algorithm–Kriging–Monte Carlo Simulation Method. Appl. Sci. 2024, 14, 10527. [Google Scholar] [CrossRef] [Scilit]
- Jiang, S.H.; Li, D.Q.; Zhang, L.M.; Zhou, C.B. Slope reliability analysis considering spatially variable shear strength parameters using a non-intrusive stochastic finite element method. Eng. Geol. 2014, 168, 120–128. [Google Scholar] [CrossRef] [Scilit]
- Kong, C.; Gao, X.; Ren, S.; Gu, S.; Gu, Y. Physical model test of tunnel complex surrounding rock progressive failure based on strength-reduction similar materials. Eng. Fail. Anal. 2023, 149, 107255. [Google Scholar] [CrossRef] [Scilit]

Disclaimer/Publisher’s Note: The statements, opinions and data contained in all publications are solely those of the individual author(s) and contributor(s) and not of MDPI and/or the editor(s). MDPI and/or the editor(s) disclaim responsibility for any injury to people or property resulting from any ideas, methods, instructions or products referred to in the content. |
© 2026 by the authors. Licensee MDPI, Basel, Switzerland. This article is an open access article distributed under the terms and conditions of the Creative Commons Attribution (CC BY) license.