


Abstract
Previous studies and current wind-load standards for low-aspect-ratio circular structures primarily consider external pressure and insufficiently address the combined effects of roof openings, internal–external-pressure interaction, and surface roughness. To overcome these limitations, this study investigates the net-pressure characteristics of such structures through wind-tunnel experiments conducted for two aspect ratios and four levels of surface roughness. The vertical variation in net pressure and its implications for wind-load estimation are systematically examined. For smooth surfaces, the net-pressure distribution exhibits pronounced height dependence due to the free-end effect. This dependence diminishes as surface roughness increases, indicating a significant modification of the flow structure around the cylinder. Neglecting this height-dependent behavior leads to substantial inaccuracies in drag-coefficient estimation. Comparisons with existing standards reveal that the drag coefficients specified in AS/NZS 1170.2 and AIJ-RLB overestimate values for smooth surfaces by up to 38.7% and 21.5%, respectively, whereas the AIJ-RLB provisions underestimate values for rough surfaces by approximately 4.7%. To improve predictive accuracy, a simplified model for the circumferential distribution of mean net-pressure coefficients is developed. The proposed model incorporates height-dependent aerodynamic parameters and demonstrates strong agreement with experimental data, with a maximum relative error below 8.6%. This model provides a practical reference for more reliable wind-load estimation in the structural design of low-aspect-ratio circular structures with roof openings.
1. Introduction
Low-aspect-ratio circular structures with roof openings are encountered in various engineering applications. Representative examples include cylindrical storage structures equipped with roof vents or openings, circular structures that remain partially open during construction prior to roof installation, and large-span facilities such as stadiums with retractable or open roofs. In such configurations, roof openings can alter internal-pressure conditions, and the interaction between internal and external pressures may induce wind loads that deviate from those predicted by conventional external pressure-based approaches. However, current wind-load standards for circular structures primarily address tall or slender forms, such as bins, silos, and tanks, and do not explicitly provide formulations for the net pressure distribution resulting from the interaction between external and internal pressures [1,2,3,4]. Consequently, the applicability of these standards to low-aspect-ratio circular structures with roof openings remains uncertain and warrants further investigation. Roof openings may be introduced not only for functional purposes, such as natural ventilation or retractable roof systems, but also temporarily during construction before roof installation. Structural failures have been reported in geometrically similar circular structures without roofs, such as cylindrical storage tanks [5]. These cases indicate that the absence of a roof can significantly alter the internal-pressure conditions and, consequently, the net pressure acting on the structure. Because structural wind loading is governed by the net pressure resulting from the interaction between external and internal pressures, a systematic investigation of the net-pressure distribution in such configurations is required.
The wind-pressure characteristics of circular structures are influenced by factors such as the aspect ratio, surface roughness, Reynolds number, and turbulence characteristics of the approaching flow. Although numerous studies have been conducted on slender or effectively two-dimensional cylinders, their findings are not directly applicable to low-aspect-ratio circular structures. As the aspect ratio decreases, the free-end effects become dominant, significantly altering the wind-pressure distribution. Okamoto and Sunabashiri [6] and Uematsu et al. [7] investigated finite-length cylinders with aspect ratios of 4 and lower, revealing that free-end effects significantly modify the flow characteristics compared to those of two-dimensional cylinders. Similarly, Sumner et al. [8] examined cylinders with aspect ratios between 3 and 9 under turbulent boundary-layer conditions and observed notable differences in the wake between cylinders with aspect ratios of approximately 3 and taller configurations. Wang et al. [9] investigated the drag coefficients and vortex-shedding characteristics of cylinders with aspect ratios from 2.65 to 5 and reported deviations from two-dimensional cylinder behavior. Although the reported critical aspect ratio varies among studies, it typically ranges from 3 to 4, depending on the flow conditions. Liu et al. [10] and Han et al. [11] reported that when the aspect ratio is less than approximately 0.5, the wind-pressure distribution exhibits distinct three-dimensional flow patterns around the structure owing to the free-end effect. These findings indicate that the aspect ratio and free-end effects play a dominant role in determining the wind-pressure characteristics of low-aspect-ratio circular structures. Research on the influence of roof openings has primarily focused on localized pressure effects, particularly on roof cladding, and has typically considered relatively small opening ratios (generally less than 10% of the roof area). Moreover, most existing studies have addressed non-cylindrical geometries and have concentrated on external-pressure distributions over roof surfaces, rather than on the net-pressure distribution resulting from internal–external-pressure interaction [12,13,14]. Consequently, a comprehensive and unified framework for evaluating wind loads on low-aspect-ratio circular structures with roof openings—accounting for both internal–external-pressure interaction and free-end effects—remains lacking.
Surface roughness is another important factor that influences wind loads and pressure distributions on circular structures. In practice, surface conditions vary depending on the material and environmental exposure, necessitating an understanding of how roughness modifies surface pressure. Previous studies have primarily examined the influence of roughness on two-dimensional or slender circular cylinders and dome-type structures, with this influence primarily discussed in relation to flow transition, wake characteristics, and vortex-shedding behavior [15,16,17,18,19]. As discussed in previous studies on low-aspect-ratio circular structures, free-end effects suppress periodic vortex shedding, and under atmospheric boundary-layer conditions, the wind-pressure distribution becomes relatively insensitive to the Reynolds number beyond a critical range. In such cases, the role of surface roughness is expected to be reflected primarily in the magnitude and distribution of the mean pressure and resulting drag coefficient. Nevertheless, prior studies on low-aspect-ratio circular structures have predominantly considered smooth surfaces, and the effects of surface roughness have not been systematically examined.
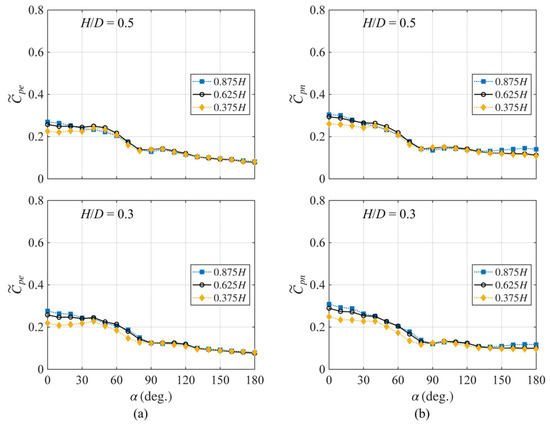
Considering these gaps, this study investigates the net-pressure distribution of low-aspect-ratio circular structures with roof openings by explicitly considering the combined effects of internal–external-pressure interaction, free-end effects, and surface roughness. Wind-tunnel experiments were conducted under turbulent boundary-layer conditions using rigid models with two aspect ratios (H/D = 0.5 and 0.3) and four levels of surface roughness. The resulting mean net-pressure distributions and corresponding drag coefficients were analyzed in detail. Based on these findings, a simplified model for net-pressure distribution is proposed to support practical wind-load estimation for low-aspect-ratio circular structures with roof openings.
2. Materials and Methods
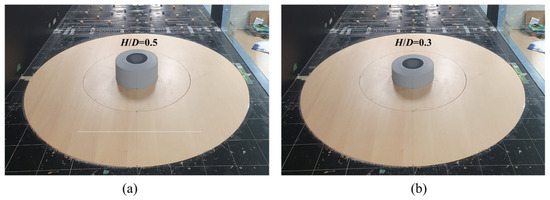
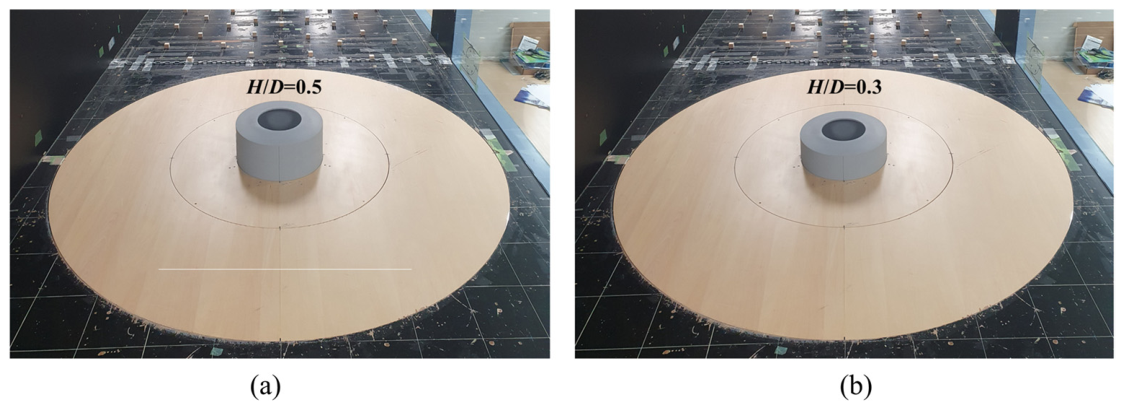
Wind-tunnel tests were conducted on two low-aspect-ratio circular structures with roof openings (Figure 1). The rigid models had diameters of 0.4 m and heights of 0.2 and 0.12 m, corresponding to aspect ratios (H/D) of 0.5 and 0.3, respectively. These configurations represent low-aspect-ratio conditions in which free-end effects dominate the flow field and the wind-pressure distribution becomes effectively independent of the Reynolds number beyond a critical range under atmospheric boundary-layer conditions. The selected aspect ratios are also consistent with those commonly observed in practical circular structures with roof openings [20,21,22,23]. Although structures with non-circular plan geometries (e.g., oval stadiums) exist, the present study is limited to circular configurations. In practical applications, such structures typically exhibit small roof curvature, with rise-to-span ratios (f/D) below 0.1, and a relatively large roof, generally ranging between 30% and 50%. Accordingly, the roof rise of the present models was set to 0.02 m (f/D = 0.05), and the diameter of the central roof opening was 0.2 m, corresponding to an opening ratio of 50%, which represents a typical upper-bound case. The models were constructed with a double-skin configuration to enable the simultaneous measurement of wind pressure on both the external and internal surfaces, and the model thickness was 6 mm. Portela and Godoy [5] reported that roof-rise variations had little influence on the external wall pressures of cylindrical tanks with dome roofs. Similarly, Uematsu et al. [22] found no significant differences between fully enclosed and open-roof conditions. These studies indicate that roof geometry has only a minor effect on external wall pressures.
Figure 1.
Test models used in wind-tunnel tests: (a) H/D = 0.5 and (b) H/D = 0.3.
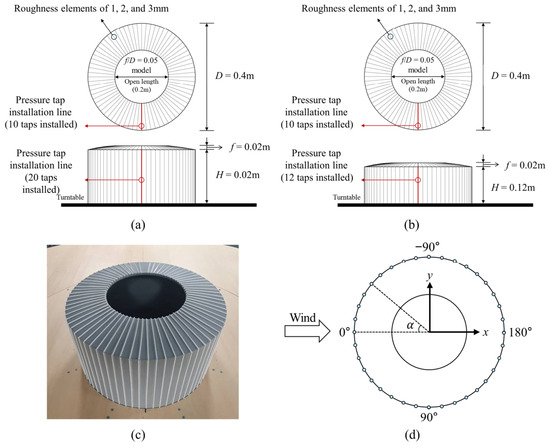
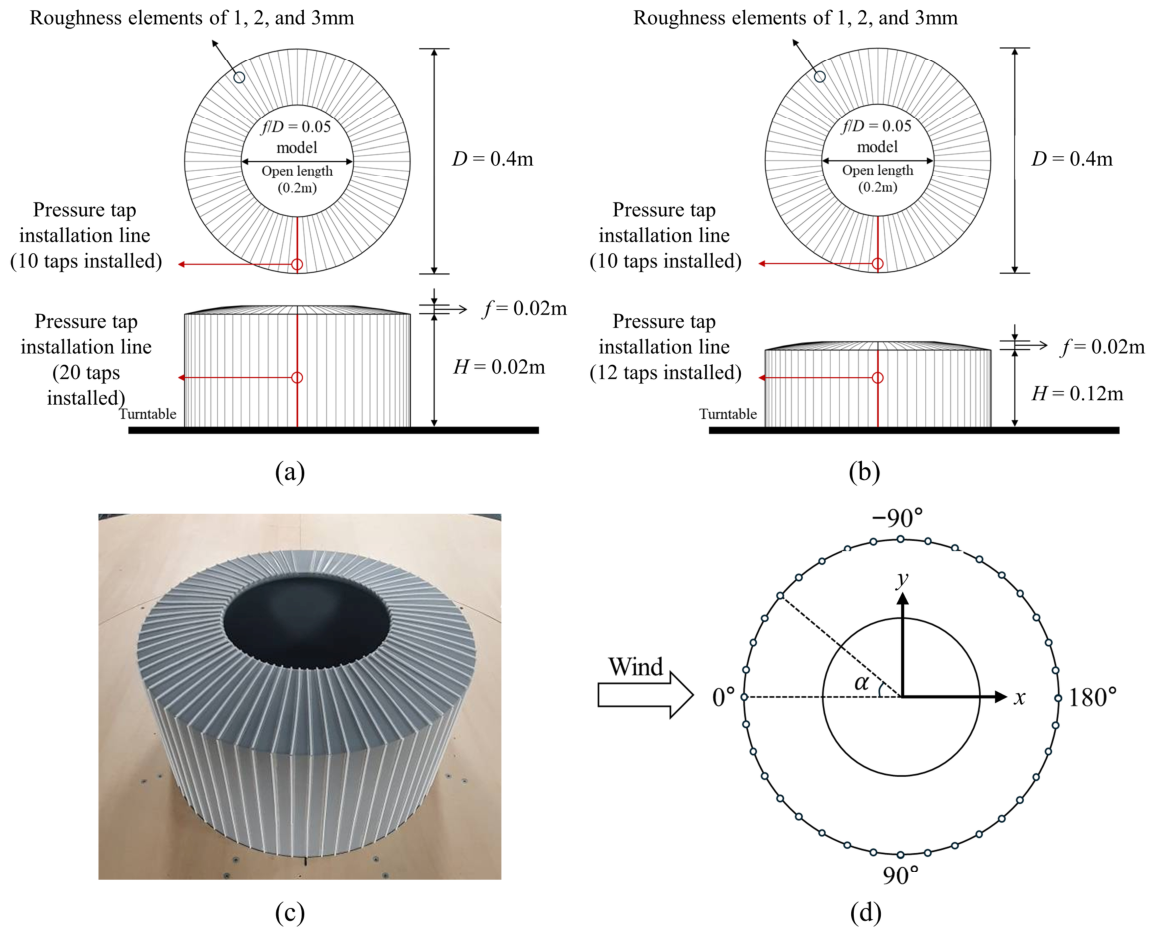
Figure 2 illustrates the arrangement of the pressure taps and surface-roughness elements, as well as the definition of the azimuth angle. As shown in Figure 2a,b, pressure taps were installed along a single vertical line on both the external and internal surfaces. For the H/D = 0.5 model, 20 taps were placed on the external surface, and 20 on the internal surface (40 in total), whereas for the H/D = 0.3 model, 12 taps were installed on each surface (24 in total). Additional taps were placed on the roof; however, these measurements were excluded from the present analysis, which focuses exclusively on net pressure acting on the wall surfaces. Surface roughness was introduced by attaching cylindrical plastic rods to the external roof and wall surfaces at 5° circumferential intervals, excluding the tap line. The model with attached roughness elements is shown in Figure 2c. Owing to geometric symmetry, pressure measurements were obtained along a single vertical line, and the circumferential pressure distribution was reconstructed by rotating the model in increments of 10°. To verify measurement reliability, the resulting circumferential distributions of mean external-pressure coefficients for both smooth and rough surfaces were compared with data reported for geometrically similar structures in previous studies, showing consistent trends [10,24]. The azimuth angle, , used to represent the pressure distribution is illustrated in Figure 2d, where the dashed line indicates the angular position of the pressure tap line. Previous studies have shown that for low-aspect-ratio circular structures (H/D ≤ 0.5), the mean lift coefficient remains close to zero even under uniform-flow conditions [10,11]. Therefore, the focus of this study was the distribution of the net pressure and the resulting drag coefficient.
Figure 2.
Experimental models and wind-direction definition: (a) H/D = 0.5, (b) H/D = 0.3, (c) model with attached roughness elements, and (d) definition of the azimuth angle.
Table 1 summarizes the ranges of surface-roughness parameters considered in previous studies on cylindrical and dome-type structures. Surface roughness is typically characterized using the ratio of roughness height to model diameter (k/D), and a variety of materials and configurations have been employed to represent rough surfaces. Previous investigations have generally considered k/D values in the range of approximately 0.001–0.03. In the present study, roughness elements were arranged uniformly, consistent with established experimental approaches, to examine their influence on flow structure and pressure distribution. In addition, the Japanese wind-load code [2] classifies surface conditions for cylindrical structures in terms of drag coefficients as smooth, rough (<1%), and very rough (<5%), based on relative roughness. Following this classification and prior experimental studies, surface roughness was introduced by attaching cylindrical plastic rods with diameters of 1, 2, and 3 mm to the external surface of the 0.4 m diameter models. These correspond to k/D values of 0.0025, 0.0050, and 0.0075, respectively. Assuming a geometric scale of 1/150, these values correspond to full-scale roughness heights of approximately 0.15 m, 0.30 m, and 0.45 m.
Table 1.
k/D ranges considered in previous studies on surface roughness [15,16,17,18,24,25,26].
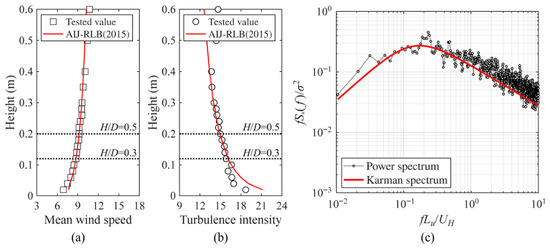
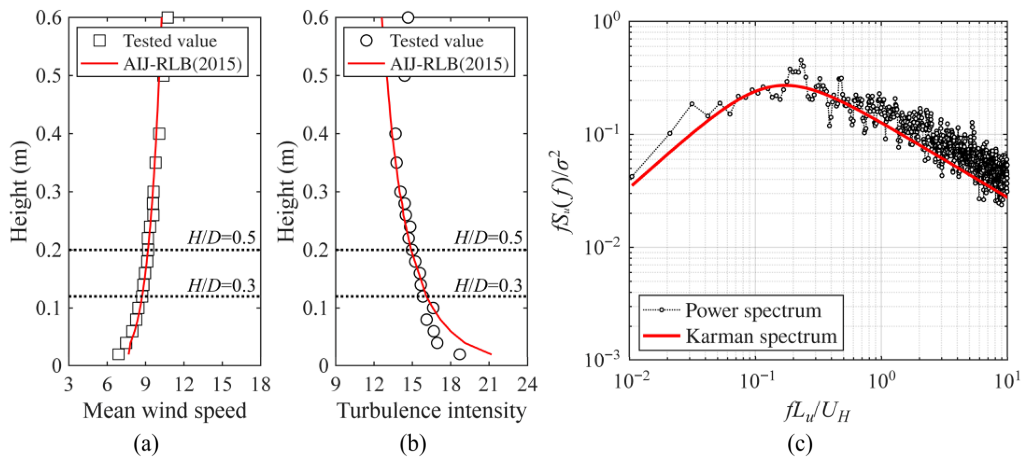
Wind-tunnel tests were conducted in a large boundary-layer wind tunnel at Tokyo Polytechnic University, Japan, with a width, height, and length of 2.2, 1.8, and 19 m, respectively. The maximum blockage ratio of the model was less than 3% of the wind-tunnel cross-sectional area, which falls within commonly accepted limits; therefore, no blockage correction was applied to the measured data. The flow conditions within the wind tunnel were configured according to the Japanese wind-load standard [2], using a power-law index of α = 0.10, corresponding to Terrain Category II (open terrain with few obstructions). Figure 3a,b show the characteristics of the approaching flow. The velocity scale was set to 1/3, and for the H/D = 0.5 model, the mean wind speed at the maximum height (H = 0.2 m) was approximately 9.1 m/s, with a turbulence intensity of 14.7%. Figure 3c shows the power spectrum of the fluctuating wind speed, which closely matched the von Kármán spectrum. Pressure measurements were acquired simultaneously using a multichannel pressure measurement system. A low-pass filter with a cutoff frequency of 250 Hz was applied to each channel to prevent aliasing. Tubing effects were corrected numerically based on the gain and phase characteristics of the measurement system. Data were sampled at a frequency of 1000 Hz, and ten independent time-history records were collected, corresponding to 10 min of full-scale time. Based on the scaling relationship between velocity and length, this duration corresponds to 12 s in model scale.
Figure 3.
Characteristics of oncoming flow: (a) Profile of mean wind speed, (b) profile of turbulence intensity, and (c) power spectrum [2].
The Reynolds number, , is a key parameter governing the aerodynamic behavior of cylindrical structures. Macdonald et al. [27] investigated wall-pressure distributions for circular cylinders with aspect ratios, H/D, ranging from 0.5 to 2.0 under turbulent boundary-layer flow at Reynolds numbers between and . Their results were compared with full-scale measurements by Cook et al. [28] at . The comparison showed that, for greater than approximately , wall-pressure distributions become effectively independent of Reynolds number under turbulent boundary-layer flow. The turbulence intensity of the approaching flow in the present study is comparable to that reported in these earlier investigations.
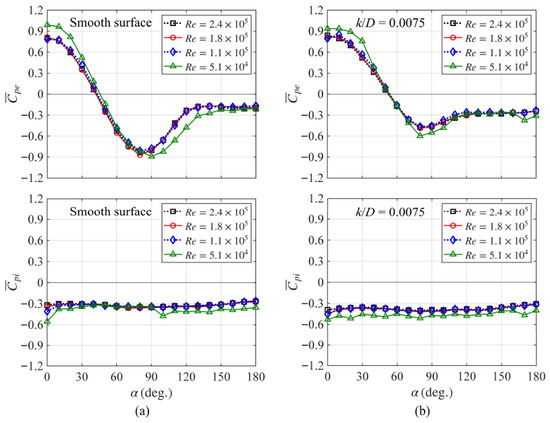
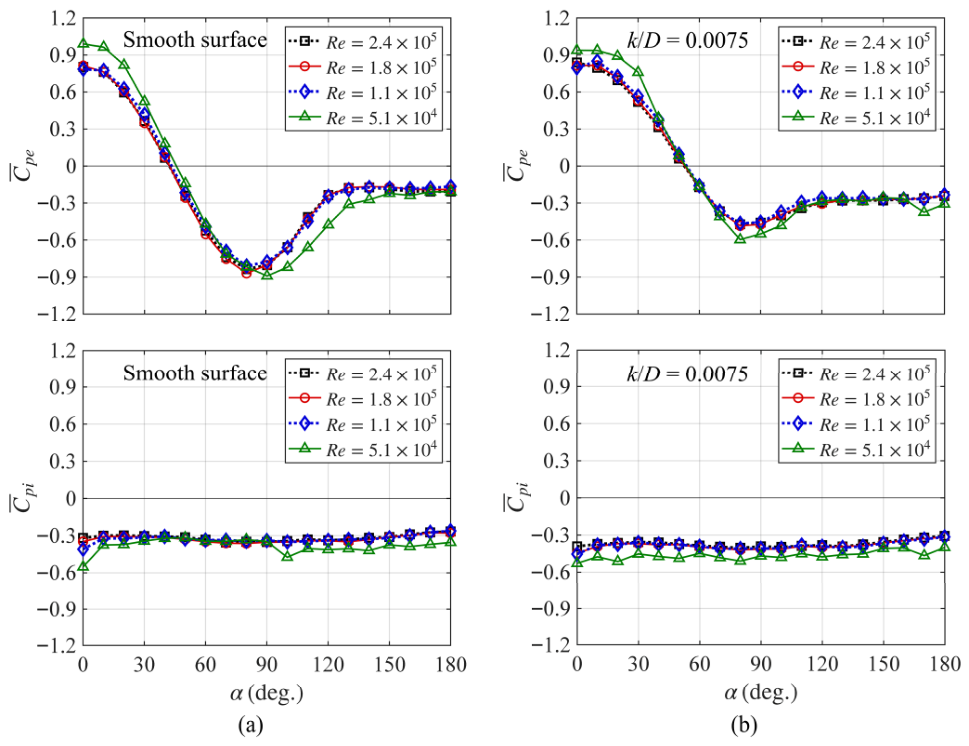
To verify Reynolds-number effects under the present conditions, preliminary tests were conducted at four different values of , which was defined as , where is the mean wind speed at the reference height, is the model diameter, and is the kinematic viscosity of air. The tested range of extended from to . Figure 4 presents the circumferential distributions of the mean external- and internal-pressure coefficients, and , respectively, evaluated at the stagnation height for different values. For the smooth-surface case (Figure 4a), the pressure distributions converged and became nearly identical when exceeded . A similar trend was observed for the rough-surface case (k/D = 0.0075) shown in Figure 4b. These results are consistent with those reported by Macdonald et al. [27]. In addition, Liu et al. [10] reported that, under turbulent boundary-layer flow, the drag coefficient of circular structures with H/D = 0.5–2.0 becomes nearly independent of for greater than approximately . Taken together, these findings indicate that the present experiments were conducted within the Reynolds number-independent regime. Accordingly, the case with was selected as the reference condition for subsequent analyses.
Figure 4.
Circumferential distributions of external- and internal-pressure coefficients at different Reynolds numbers: (a) Smooth surface and (b) rough surface.
The analysis focuses on the mean and standard deviation of net pressure, as well as the associated drag coefficient, as the primary objective of this study is wind-load estimation for structural design. The time histories of the external- and internal-pressure coefficients, and , were defined as
The time history of the net-pressure coefficient, , is
where and are the pressures measured at the th tap on the external and internal wall surfaces of the model, respectively; is the static pressure measured at the pitot tube located 1.2 m above the wind-tunnel floor; and is the reference velocity pressure at the maximum wall height (H) of the model. The time history of the net-pressure coefficient was computed as the difference between the co-located external and internal pressures simultaneously sampled at the same position.
Based on the time histories of the external-, internal-, and net-pressure coefficients, statistical and force-related quantities, including the mean, standard deviation, drag coefficient, and overturning-moment coefficient, were evaluated. The mean-pressure coefficient, , and the standard deviation of the pressure coefficient, , calculated from the corresponding wind-pressure coefficient are
The drag coefficient of net pressure, , can be determined by integrating the net-pressure coefficients:
where represents the tributary area for each pressure tap i, and is the azimuth angle of tap i (Figure 2). The variable n is the total number of pressure taps, which may represent a single section or the entire model, depending on the analysis. Additionally, denotes the projected area of each pressure tap in the downwind directions. The mean drag coefficient, , was obtained in the same manner as in Equation (4). In addition, the overturning-moment coefficient based on the net drag force was defined as
where ) denotes the net drag coefficients evaluated for layer j using Equation (6) restricted to the taps belonging to that layer; is the height of layer j; and is the total number of layers along the model height, . The mean overturning-moment coefficient was obtained in a similar manner. In this study, the mean and standard deviation of the wind-pressure and force coefficients were defined as the average values across ten ensembles.
3. Results and Discussion
3.1. Wind-Pressure Distribution for the Smooth Surface
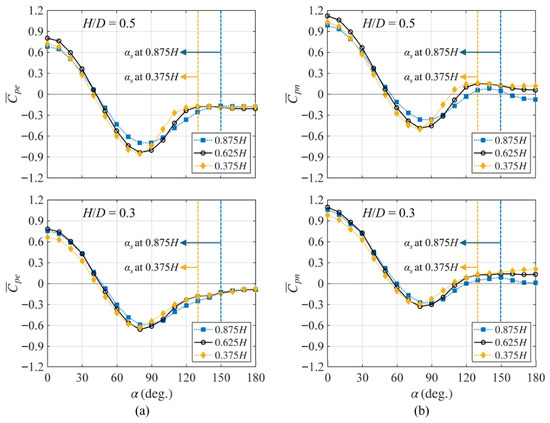
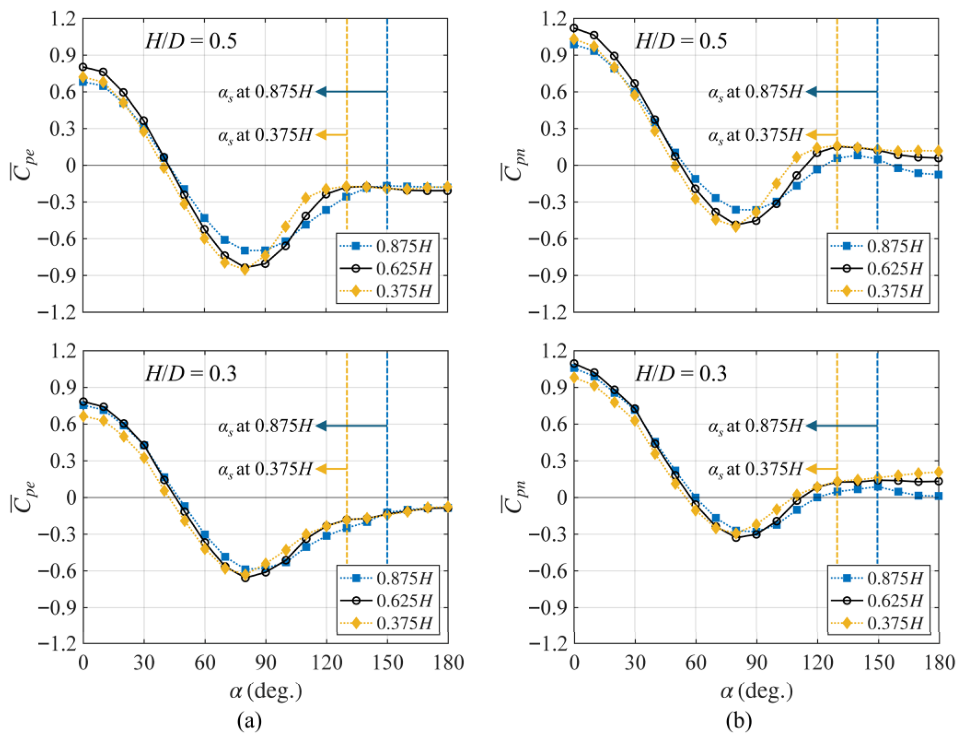
The figures presenting the circumferential distribution of wind-pressure coefficients show only the azimuth range of 0–180°, because the distribution is symmetrical at the centerline. Figure 5a illustrates the circumferential distribution of the external mean-pressure coefficient, , at various heights for the smooth-surface condition. For both H/D ratios, a greater height increased the azimuth angle, , corresponding to the minimum pressure coefficient, , as well as the separation angle, , defined as the azimuth angle beyond 120°, at which the gradient of the mean-pressure coefficient, , attains its minimum value. Within the vertical range from 0.375H to 0.875H, shifts from approximately ±80° to ±90°, whereas shifts from ±130° to ±150°. This progressive downstream shift reflects the increasing influence of the interaction between side vortex shedding and the downward flow induced by the free end [6]. For H/D = 0.5, the magnitude of decreases toward lower elevations, indicating a weakening of suction near the base. In contrast, for H/D = 0.3, the variation in with height is comparatively small, suggesting a more vertically uniform pressure field. In the leeward region beyond , the external-pressure coefficient, , exhibits minimal sensitivity to height for both aspect ratios. Overall, these trends are consistent with observations reported for closed circular cylinders, where free-end effects produce similar vertical variations in pressure distribution. The presence of a roof opening does not significantly alter the fundamental characteristics of the external-pressure field [10,11].
Figure 5.
Circumferential mean-pressure coefficients at different heights for the smooth surface: (a) and (b) .
Figure 5b shows the circumferential distribution of the mean net-pressure coefficient, . Because the internal wall pressure was predominantly negative, the windward positive pressure increased, and the side suction decreased. In the leeward region, the internal negative pressure exceeded the external pressure, resulting in a reversal of the pressure sign. Compared with the external-pressure distribution, the zero-pressure angle, , of the net pressure shifted slightly leeward, whereas and remained nearly unchanged. This result indicates that the internal pressure primarily modified the magnitude of the net pressure, whereas the circumferential distribution pattern governed by the external flow remained largely unaltered. Compared with the results shown in Figure 5a, the pressure variation in the 0–130° range preserved its overall shape, with changes primarily in the magnitude. Beyond 130°, where was nearly constant with height, exhibited noticeable height dependence.
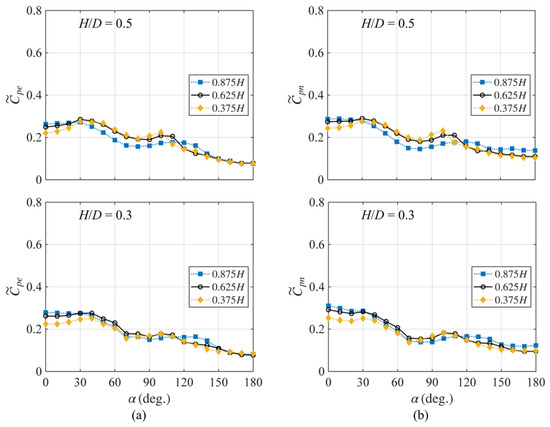
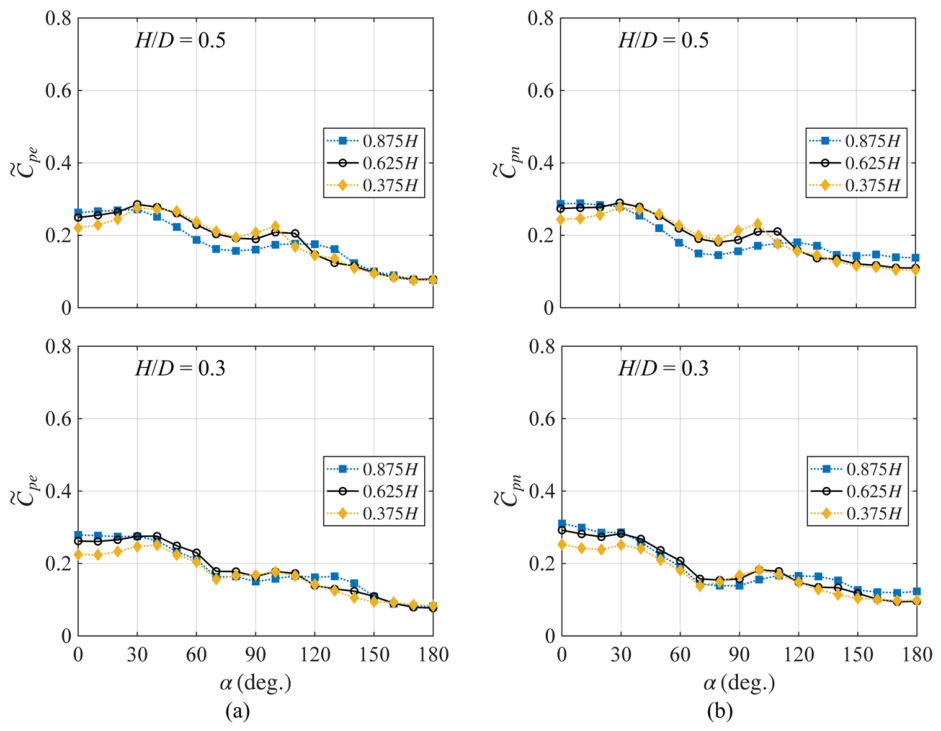
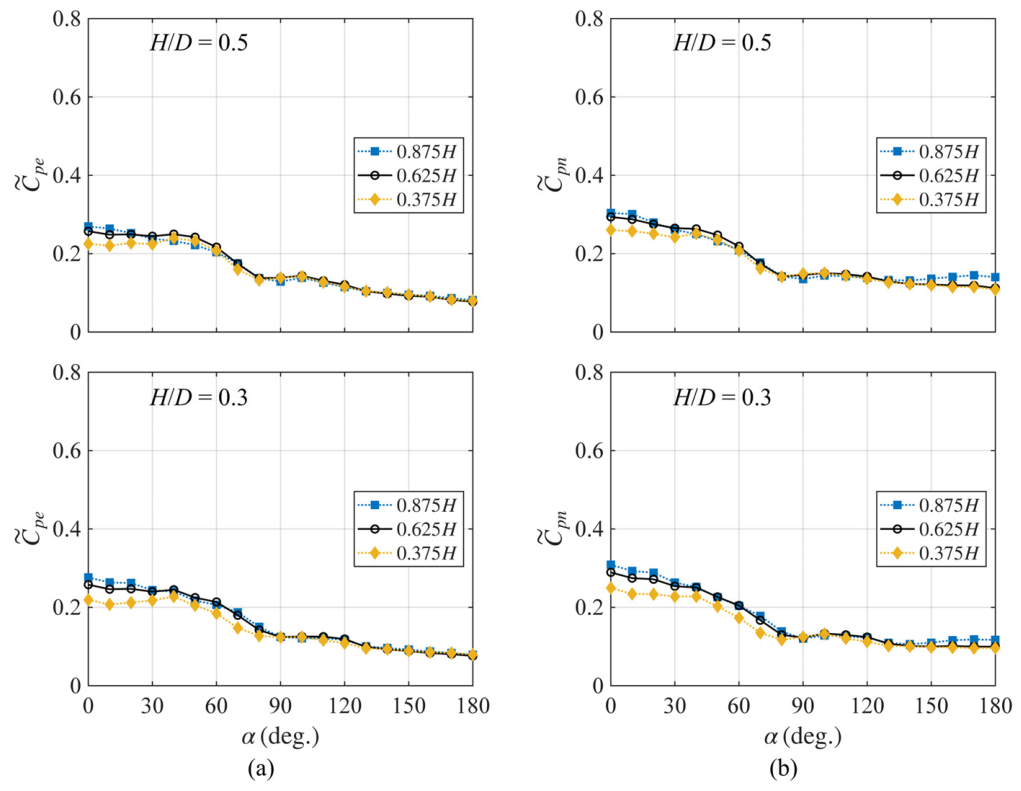
Figure 6 shows the circumferential distributions of the standard deviations of the external- and net-pressure coefficients, and , at different heights. For both aspect ratios (H/D), the distributions of and are nearly identical in shape and magnitude. This similarity indicates that internal-pressure fluctuations do not significantly modify the external-flow structure and instead primarily influence the overall pressure level.
Figure 6.
Circumferential distributions of pressure-coefficient standard deviation for the smooth surface: (a) external pressure and (b) net pressure.
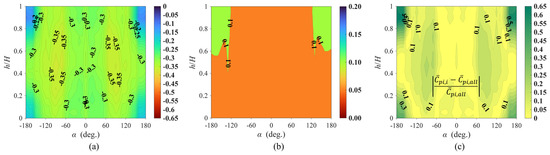
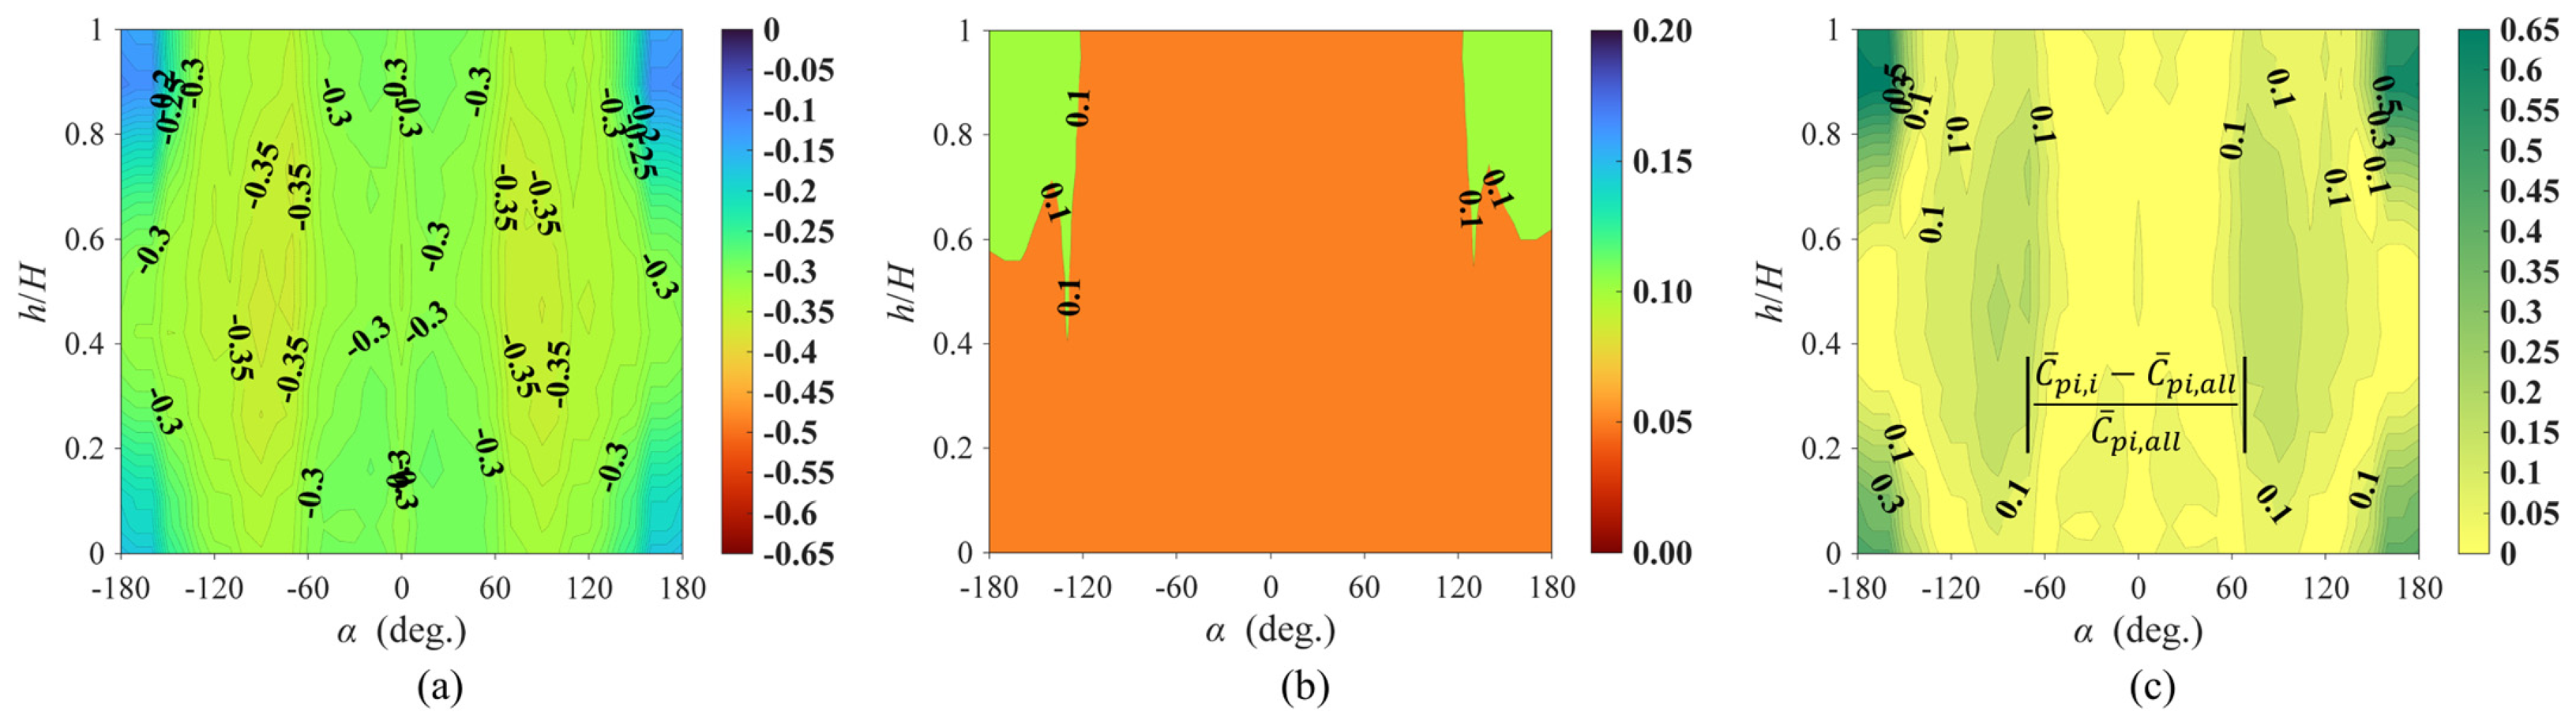
Figure 7a shows the distribution of the mean internal-pressure coefficient. Owing to the internal circulation induced by the flow entering through the opening, negative pressure was dominant, and the values were generally similar across the surface. However, beyond ±130°, the absolute magnitude decreased near the upper and lower regions owing to local flow stagnation [12]. Figure 7b shows the standard deviation of the internal-pressure coefficient. Overall, the standard deviation remains below approximately 0.1 across the entire surface, indicating that the fluctuations in internal pressure are relatively small and nearly uniform. Figure 7c shows the deviation ratio, which is defined as the absolute difference between the mean internal pressure at each tap and the overall mean value. The average deviation ratio was approximately 10%, indicating a nearly uniform internal pressure. However, beyond ±130°, it increased significantly in both the upper and lower regions, reaching 55%, which is consistent with the observation shown in Figure 7a. This difference in the magnitude of internal pressure may influence the drag coefficient calculated from the net pressure; a previous study on roofless circular structures assumed spatially uniform internal pressure and used a single representative value to calculate the net pressure [22]. To quantify the effect of assuming a spatially uniform internal pressure, the drag coefficient was recalculated using the area-averaged internal pressure. The resulting drag coefficient was approximately 10% lower than that obtained using Equation (3), indicating that neglecting the height-dependent magnitude of internal pressure in the leeward region may result in an inaccurate estimation of the drag coefficient. In addition, although Helmholtz resonance may occur in the internal cavity of enclosed structures with openings, no distinct resonance behavior was observed in the present study, likely due to the relatively large opening ratio [13].
Figure 7.
Internal-pressure coefficients for H/D = 0.5 with smooth surface: (a) Contour of the mean internal-pressure coefficient, (b) contour of the standard deviation of the internal-pressure coefficient, and (c) relative deviation of the mean internal-pressure coefficient.
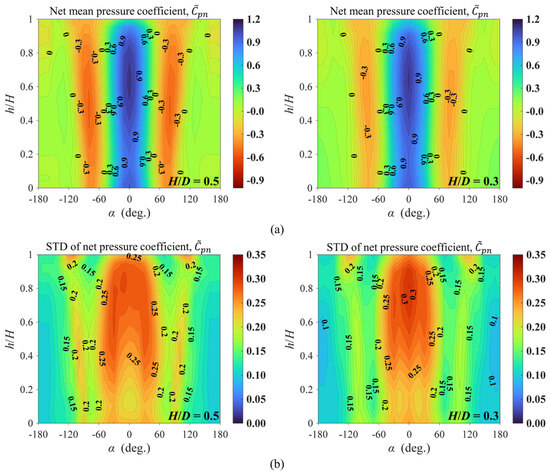
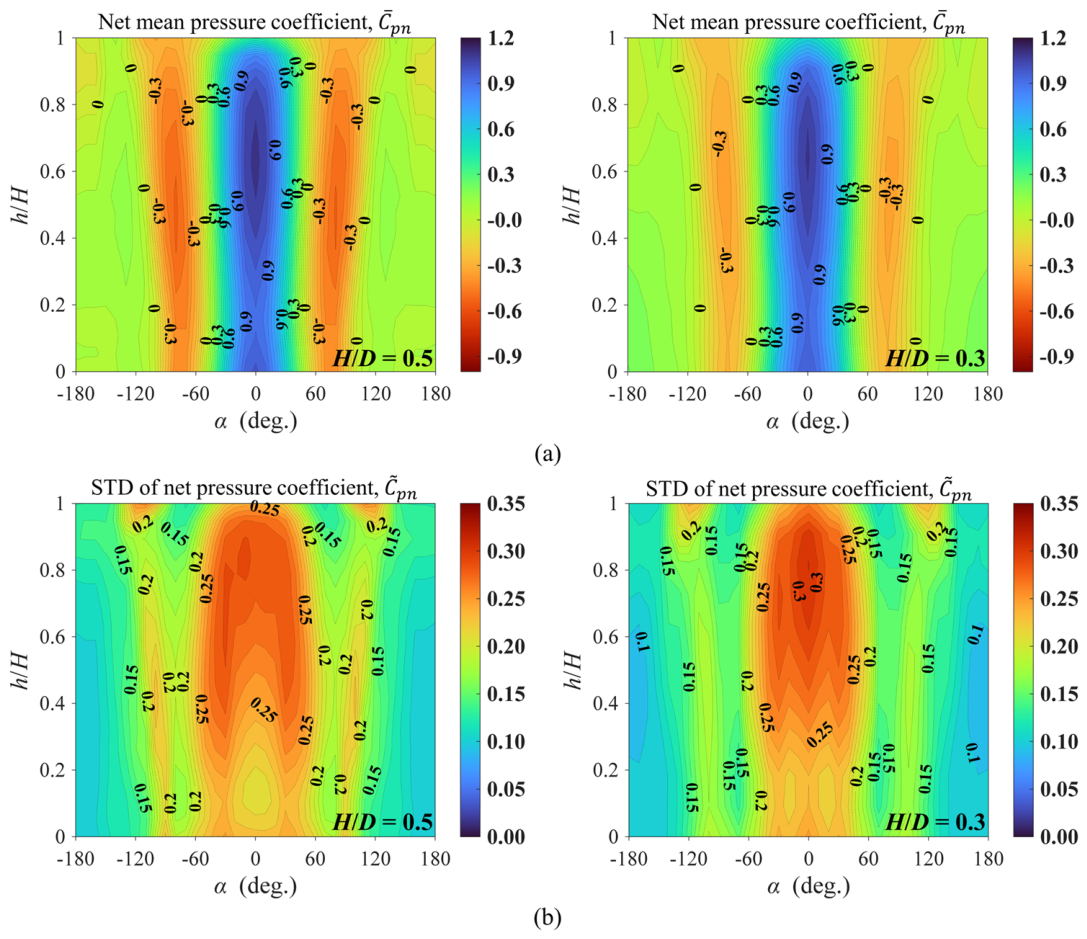
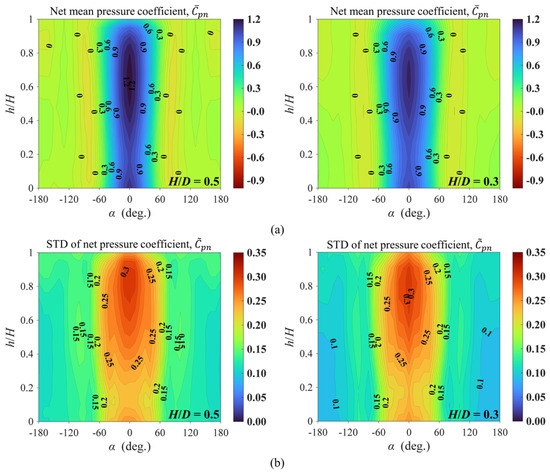
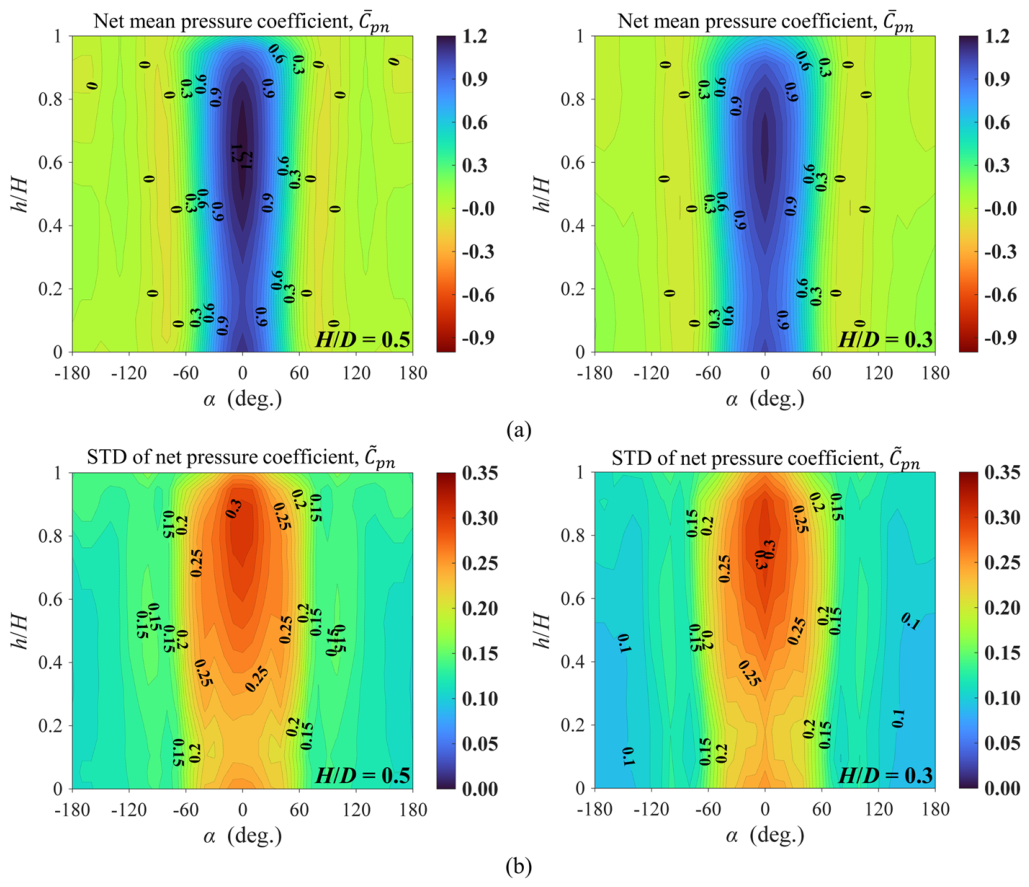
Figure 8 presents the distributions of the mean and standard deviation of the net-pressure coefficients. For both H/D cases, as shown in Figure 8a, the azimuth angles, and , shifted leeward with increasing height, consistent with the trend observed in Figure 5. As shown in Figure 8b, the standard deviation of the net-pressure coefficients was relatively large near 120° in the upper region, reflecting the influence of the free-end effect. These results indicate that even with a roof opening, the external-flow characteristics and free-end effect remain similar to those of the closed configuration. As a result, the net-pressure distribution varied with height in the side and leeward regions. Therefore, using the wind-pressure distribution at a single height to represent the entire model may not be appropriate.
Figure 8.
Distributions of the net-pressure coefficients for the smooth surface: (a) H/D = 0.5 and (b) H/D = 0.3.
3.2. Wind-Pressure Distribution for the Rough Surface
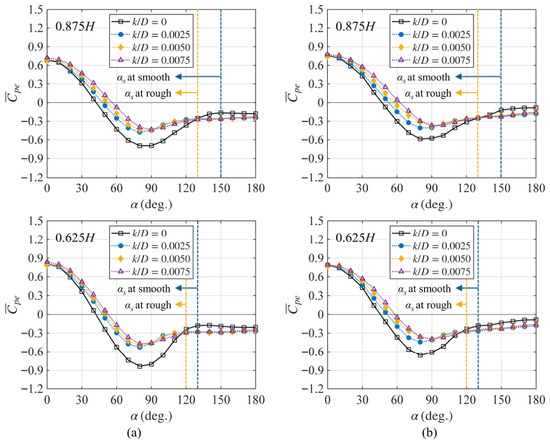
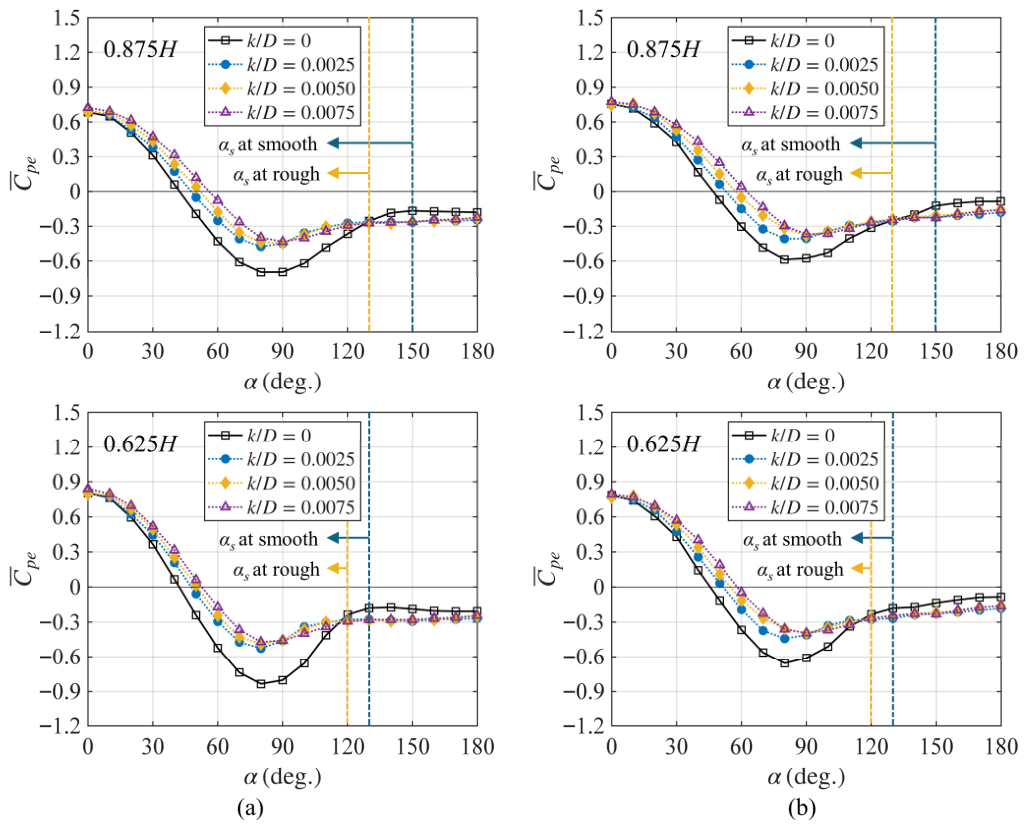
Figure 9 shows the circumferential distribution of at two upper heights for the rough surface, along with the smooth-surface case for comparison. As the surface roughness increased, the side suction decreased, resulting in a reduction in the absolute value of . This behavior is attributed to earlier flow separation induced by surface roughness, with the separation angle, , approximately ±120–130°. Consequently, the separation delay in the upper region associated with the free-end effect was partly offset. As a result, the pressure distribution was modified: the absolute value of increased slightly in the leeward region beyond , and it remained generally similar across different rough cases and heights beyond 90°. In contrast, the windward positive-pressure region became noticeably larger than that of the smooth surface, and its extent increased with increasing height and roughness. At k/D = 0.0075, increased to approximately 60°.
Figure 9.
Circumferential distributions of the external mean-pressure coefficients at different heights for different surface-roughness conditions: (a) H/D = 0.5 and (b) H/D = 0.3.
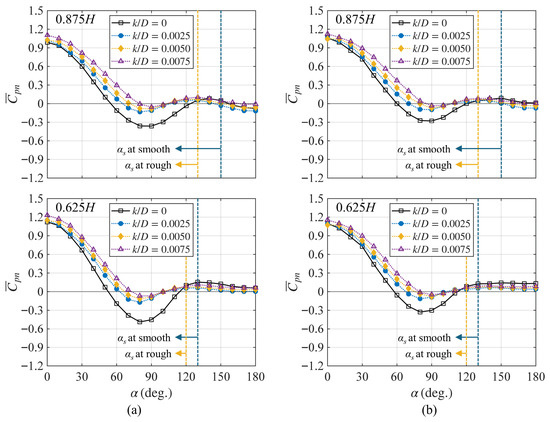
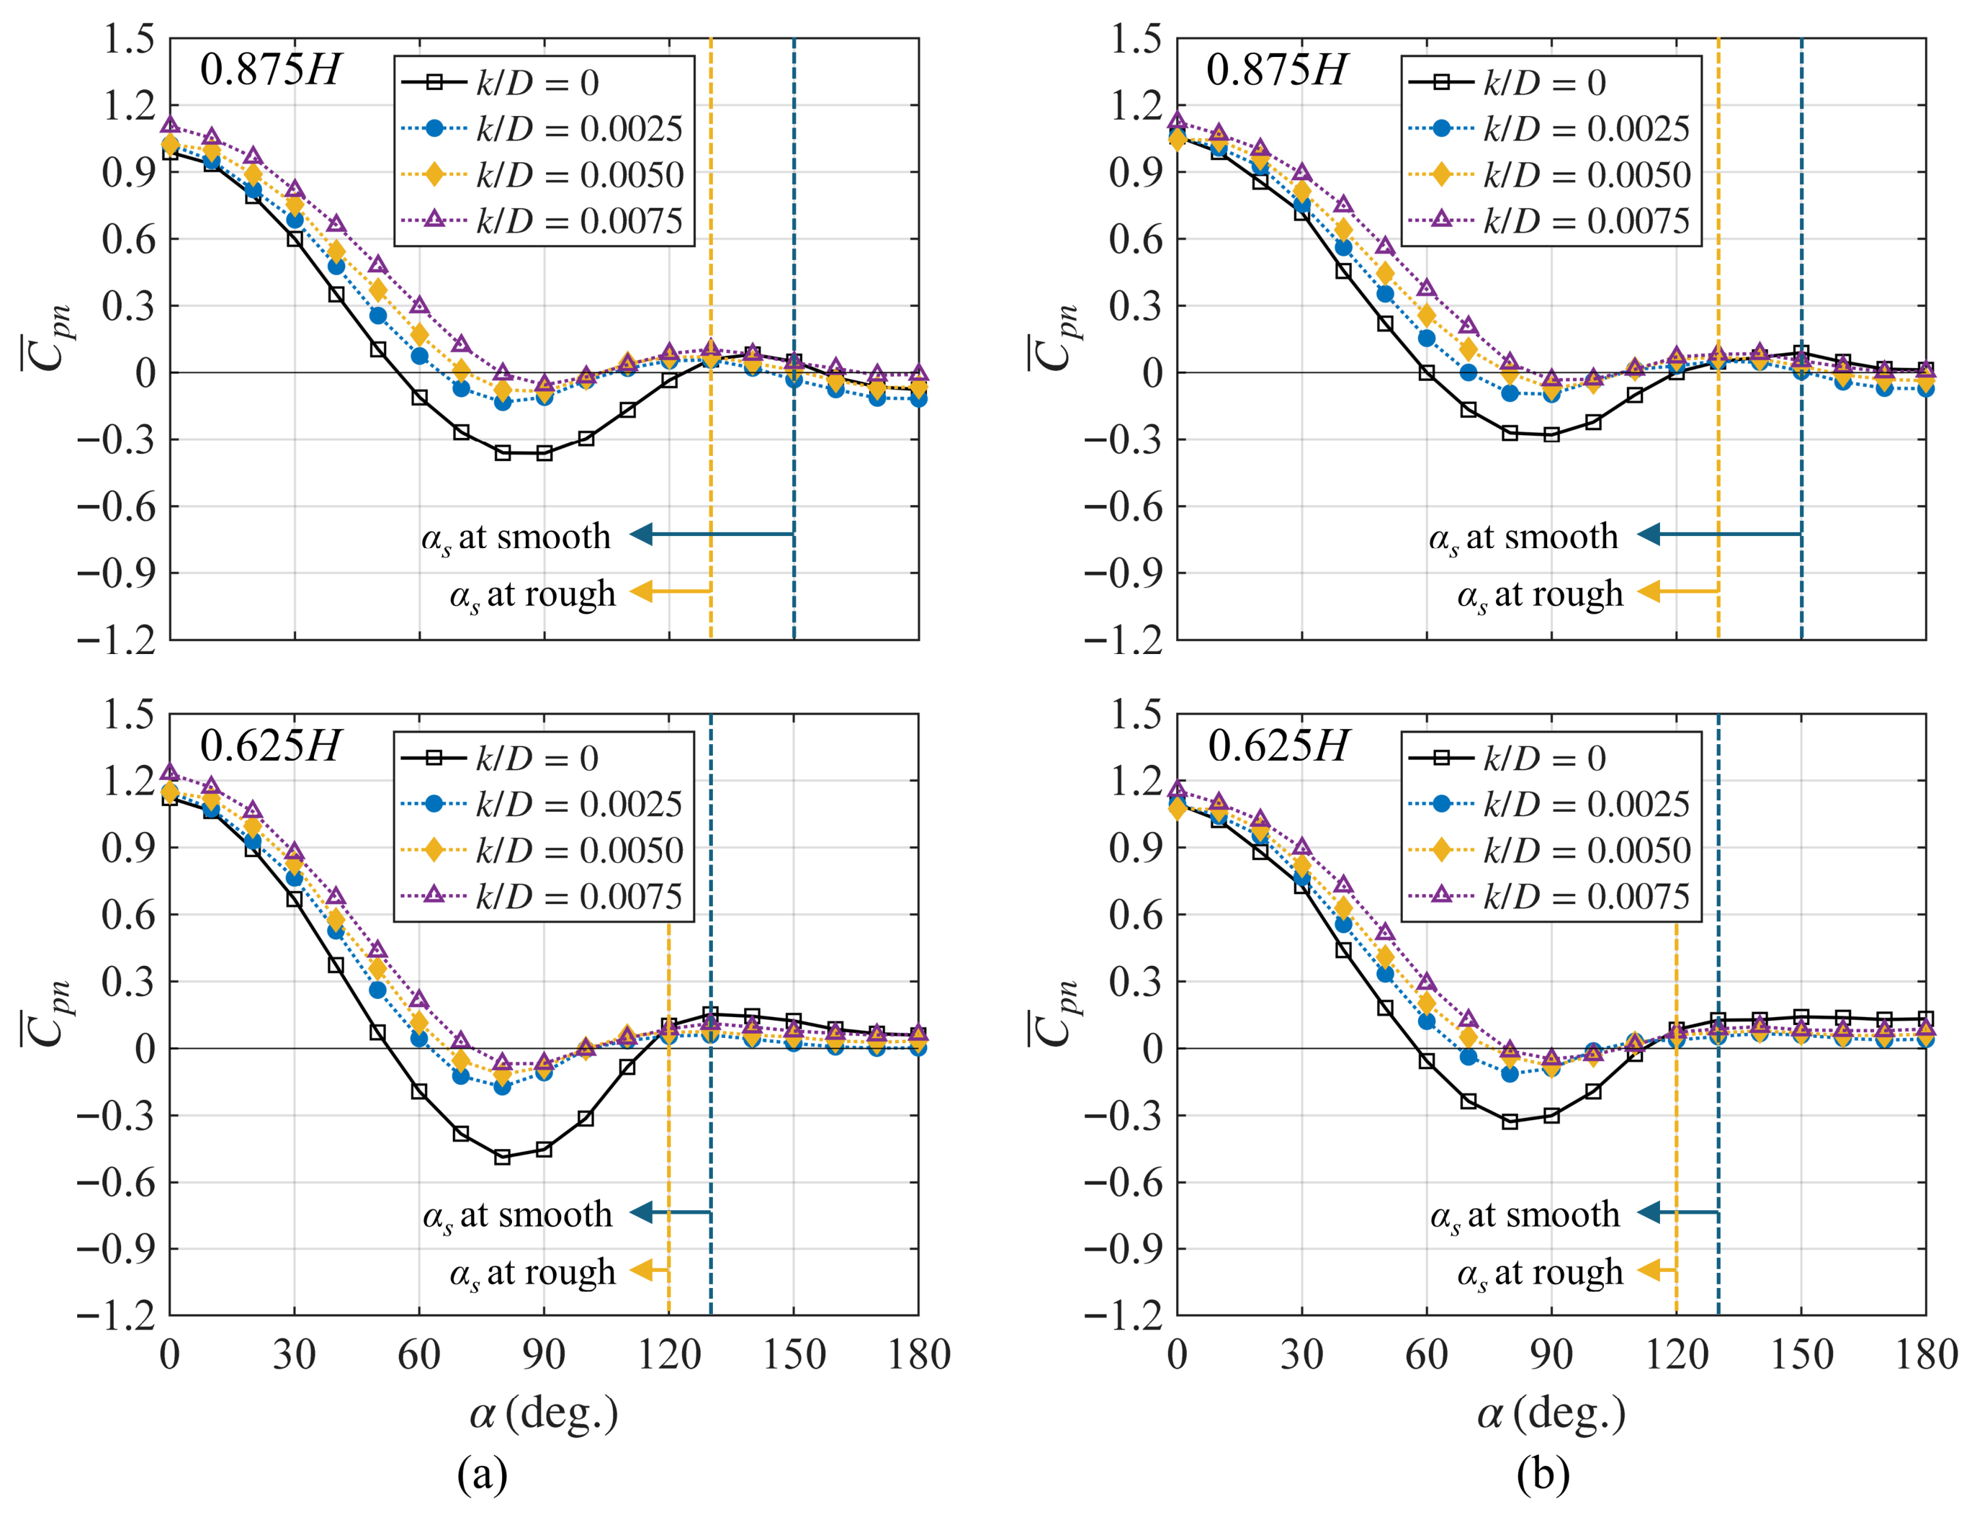
Figure 10 shows the circumferential distribution of at two upper heights for the rough surface. Similar to that of the smooth-surface case, generally followed the overall trend of the external-pressure distribution shown in Figure 9, whereas the internal pressure primarily affected the magnitude of the pressure coefficients. As discussed previously, surface roughness reduced the side suction and slightly increased the base suction. Consequently, the magnitudes of the external and internal pressures became comparable in the side and leeward regions, resulting in a value close to zero for both H/D cases, with only slight height-dependent variations. In contrast, the windward positive-pressure region became further expanded, with reaching approximately ±80° at k/D = 0.0075.
Figure 10.
Circumferential distributions of net mean-pressure coefficients at different heights for varying surface roughness: (a) H/D = 0.5 and (b) H/D = 0.3.
Figure 11 presents the circumferential distributions of the standard deviations of the external- and net-pressure coefficients, and , for the rough-surface case (k/D = 0.0075). As observed for the smooth surface, the distributions of and are nearly identical. This further confirms that internal pressure primarily affects the magnitude of the pressure response without significantly altering the external-flow structure.
Figure 11.
Circumferential standard deviation of pressure coefficients at different heights for the rough surface (k/D = 0.0075): (a) external pressure and (b) net pressure.
Figure 12 shows the distributions of the mean and standard deviation of the net-pressure coefficients for the rough surface (k/D = 0.0075). As shown in Figure 12a, for both H/D cases, the net pressure in the side and leeward regions approached zero. In contrast, the windward positive-pressure region expanded, and increased to approximately ±80°. The standard deviation distribution shown in Figure 12b reveals that the fluctuation near the upper region became slightly smaller than that of the smooth surface.
Figure 12.
Distributions of the net-pressure coefficients for the rough surface (k/D = 0.0075): (a) and (b) .
3.3. Comparison with the Drag Coefficients from Previous Studies and Wind-Load Standards
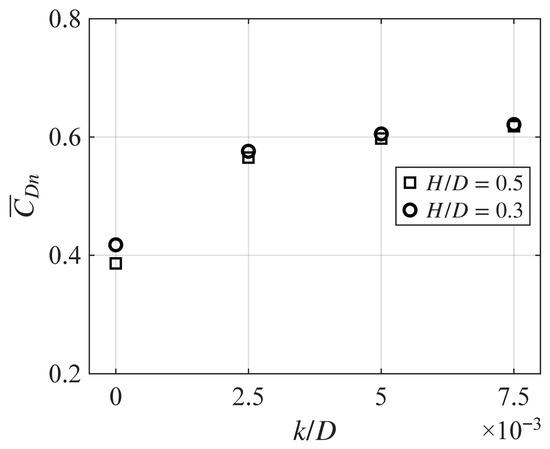
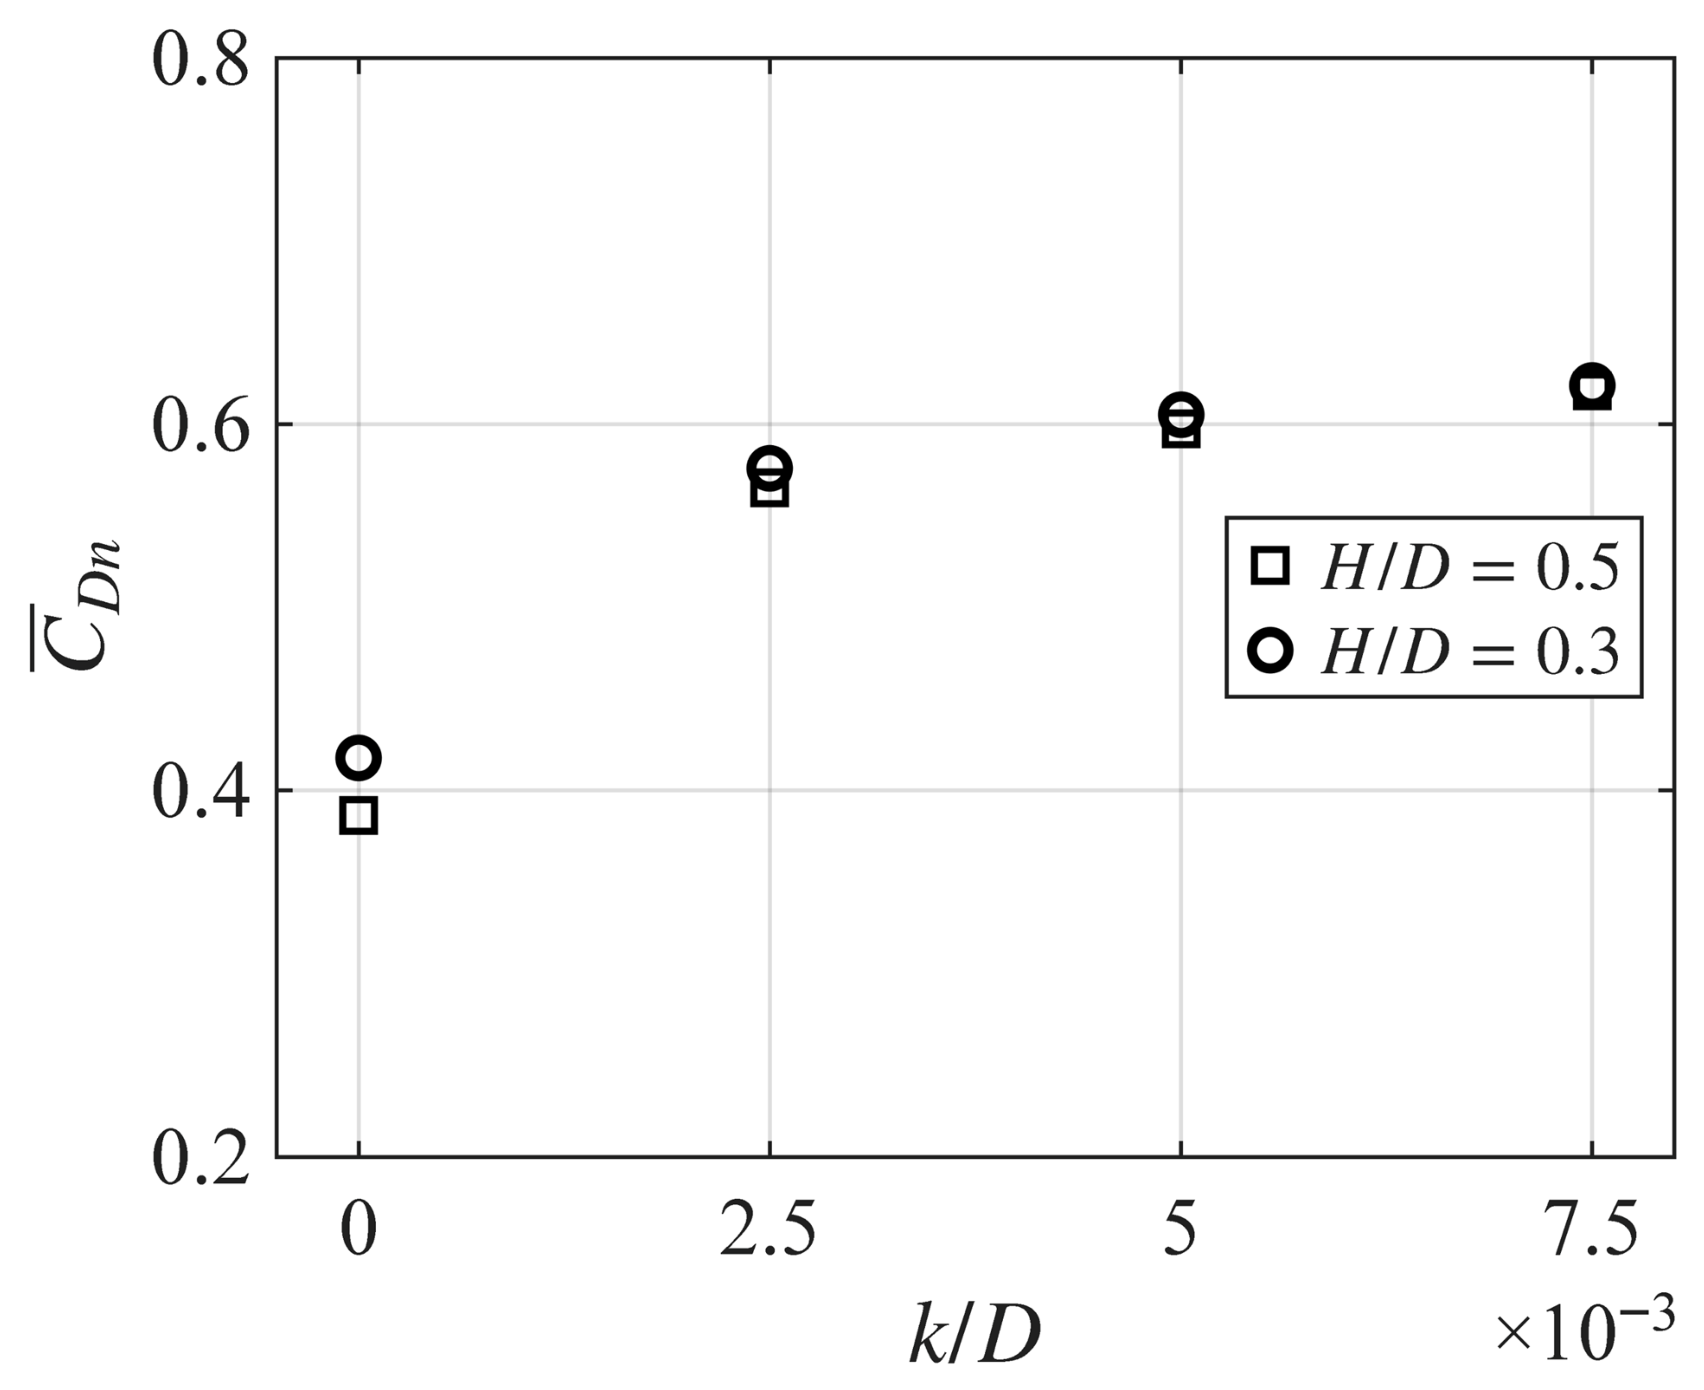
Figure 13 shows the mean drag coefficients () derived from the net pressure. The values of H/D and k/D are presented together. For the smooth surface, varied with H/D, indicating a noticeable difference between the two H/D cases, because the free-end effect became stronger as H/D decreased. In contrast, for the rough surface, the difference in between the two H/D cases became small. As discussed previously, this result was due to the reduced height dependence caused by the surface roughness. Compared with the smooth surface, the drag coefficient increased when the surface became rough. However, the change with increasing k/D was relatively small, because the net pressure in the side and leeward regions was not strongly affected by roughness, whereas differences primarily occurred in the windward positive-pressure region. When k/D increased from 0.0025 to 0.0075, increased by approximately 9%. Therefore, k/D = 0.0075 was adopted as the representative roughness condition for the following discussion.
Figure 13.
Mean drag coefficients for different surface-roughness conditions.
Among the wind-load standards considered (AS/NZS 1170.2 [1], AIJ-RLB [2], ASCE 7 [3], and EN 1991-1-4 [4]), only AIJ-RLB and AS/NZS 1170.2 provide drag coefficients for low-aspect-ratio circular structures (H/D < 1). Therefore, comparisons with experimental results are limited to these two standards. The results are summarized in Table 2. Because AS/NZS 1170.2 does not include roughness-dependent drag coefficients, comparisons for rough surfaces are made only with AIJ-RLB. Although internal-pressure coefficients associated with openings are provided in wind-load standards, they are not included in the calculation of drag coefficients for circular structures. For smooth surfaces, AS/NZS 1170.2 and AIJ-RLB overestimate the drag coefficient by up to 38.7% and 21.5%, respectively. When surface roughness is considered, the AIJ-RLB values underestimate the drag coefficient by approximately 4.7%. These discrepancies highlight the limitations of current wind-load standards, which are primarily developed for closed circular structures with relatively high aspect ratios and are largely based on two-dimensional flow assumptions. Consequently, their direct application to low-aspect-ratio circular structures with roof openings (where three-dimensional flow effects and internal–external-pressure interactions are significant) may lead to inaccurate wind-load predictions.
Table 2.
Comparison of measured drag coefficients for H/D = 0.5 with wind-load standards.
3.4. Model of the Circumferential Net-Pressure Distribution at Stagnation Height
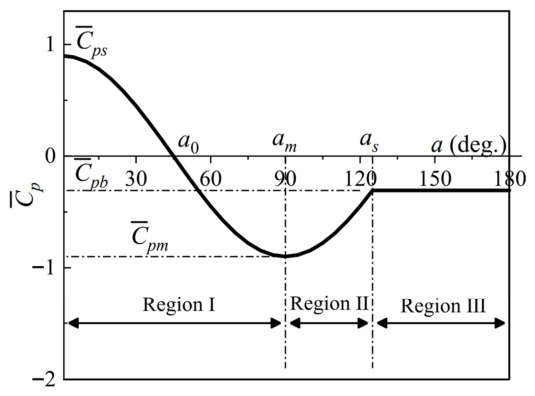
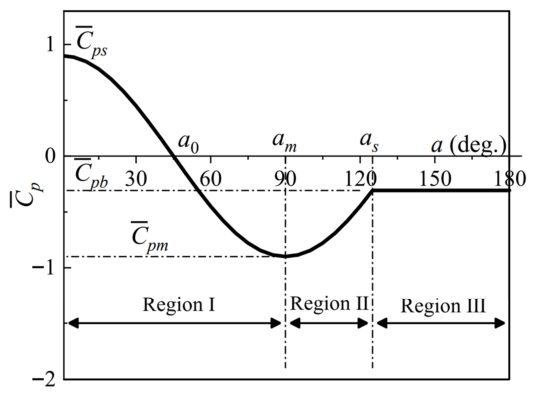
To facilitate practical engineering applications, a simplified model of the mean net-pressure coefficient that accounts for roof openings and surface roughness was developed. First, the circumferential distribution of the mean net pressure at the stagnation height (0.625H), where the maximum windward positive pressure occurs, was defined with reference to previous studies. As shown in Figure 7, assuming a single uniform internal pressure may underestimate the wind-force coefficients. Accordingly, the proposed model was constructed directly from the measured net-pressure data. The circumferential distribution of the wind pressure coefficients can be described using a three-region division based on the characteristic aerodynamic parameters (Figure 14). This piecewise model has been shown to be applicable to various cylindrical and spherical structures [10,19,22,29,30].
Figure 14.
Schematic of the piecewise model for the external mean-pressure coefficient.
Yeung [29] proposed a re-normalized model derived from potential-flow theory for cylindrical structures to represent the three regions defined in Figure 14. The corresponding expression is
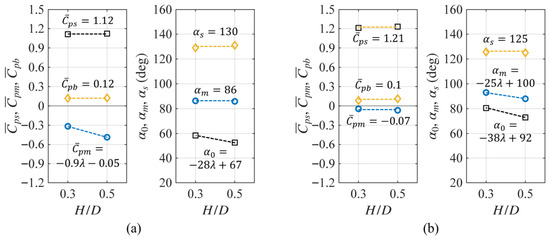
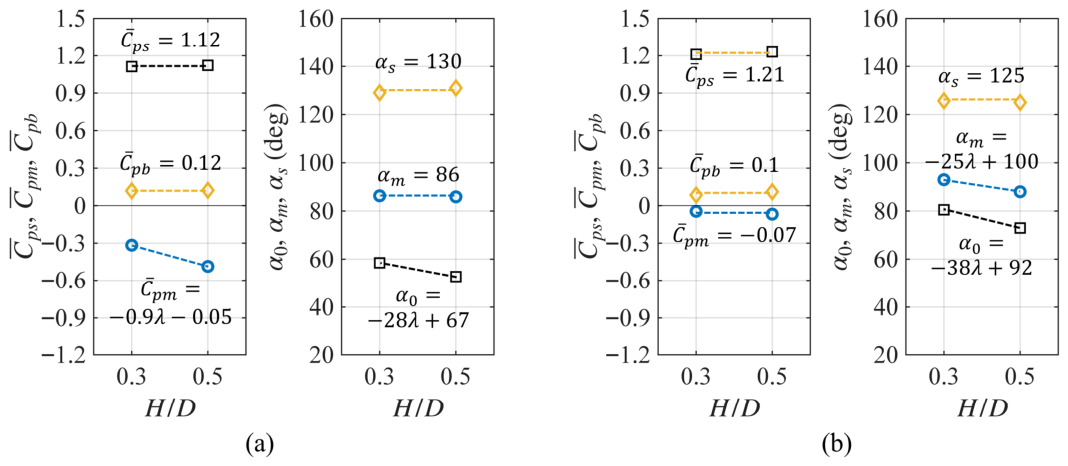
The aerodynamic parameters corresponding to Equation (8) were determined from the wind-tunnel test results presented in Figure 5 and Figure 10. Figure 15 summarizes the variation in these parameters with respect to H/D for both the smooth- and rough-surface conditions. For the smooth surface, the stagnation coefficient, ; base pressure coefficient, ; azimuth angle corresponding to the minimum pressure coefficient, ; and separation angle, , did not vary significantly with H/D within the investigated range. In contrast, the minimum pressure coefficient, , increased as H/D increased. This trend is consistent with the findings of previous studies on low-aspect-ratio circular structures [10,22]. For the rough surface, most parameters exhibited similar values for both aspect ratios, whereas only showed a noticeable increase with increasing H/D. The parameters influenced by H/D were approximated using linear functions within the tested range. However, the proposed parameter values are applicable only to low-aspect-ratio circular structures within the H/D range of 0.3–0.5, as considered in this study. Because the parameter values may change as the aspect ratio increases beyond this range, further experimental investigations covering a wider H/D range are required to generalize this formulation.
Figure 15.
Aerodynamic parameters of the circumferential net pressure model: (a) Smooth surface and (b) rough surface.
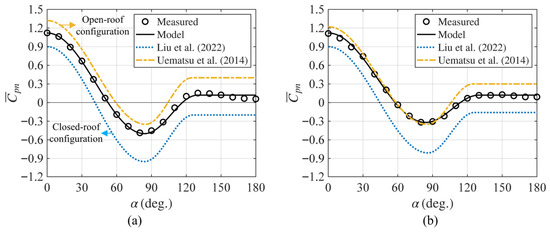
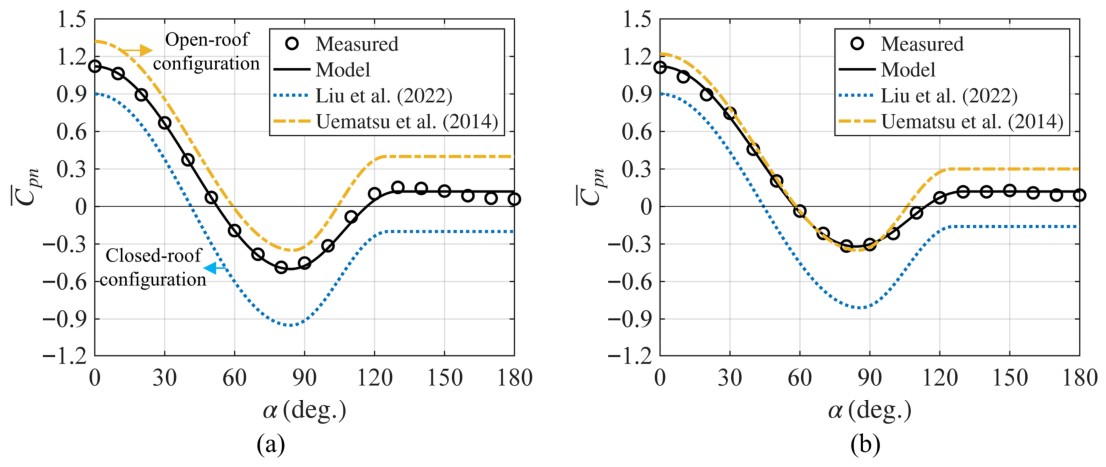
Figure 16 shows a comparison of the proposed circumferential distribution of the mean net-pressure coefficient, , for the smooth surface with the external- and net-pressure coefficient specifications reported in previous studies. The proposed mean net-pressure distribution model, represented by a solid black line, agrees closely with the experimental results. However, it shows noticeable differences when compared with the formulations presented in previous studies.
Figure 16.
Comparison among experimental values, models, and models from previous studies [10,22] for smooth surfaces at stagnation height (0.625H): (a) H/D = 0.5 and (b) H/D = 0.3.
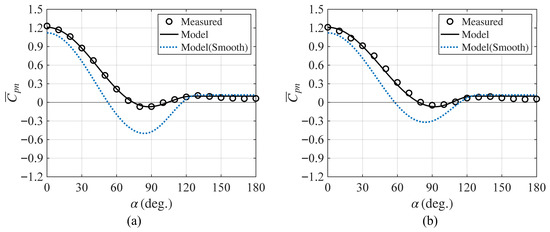
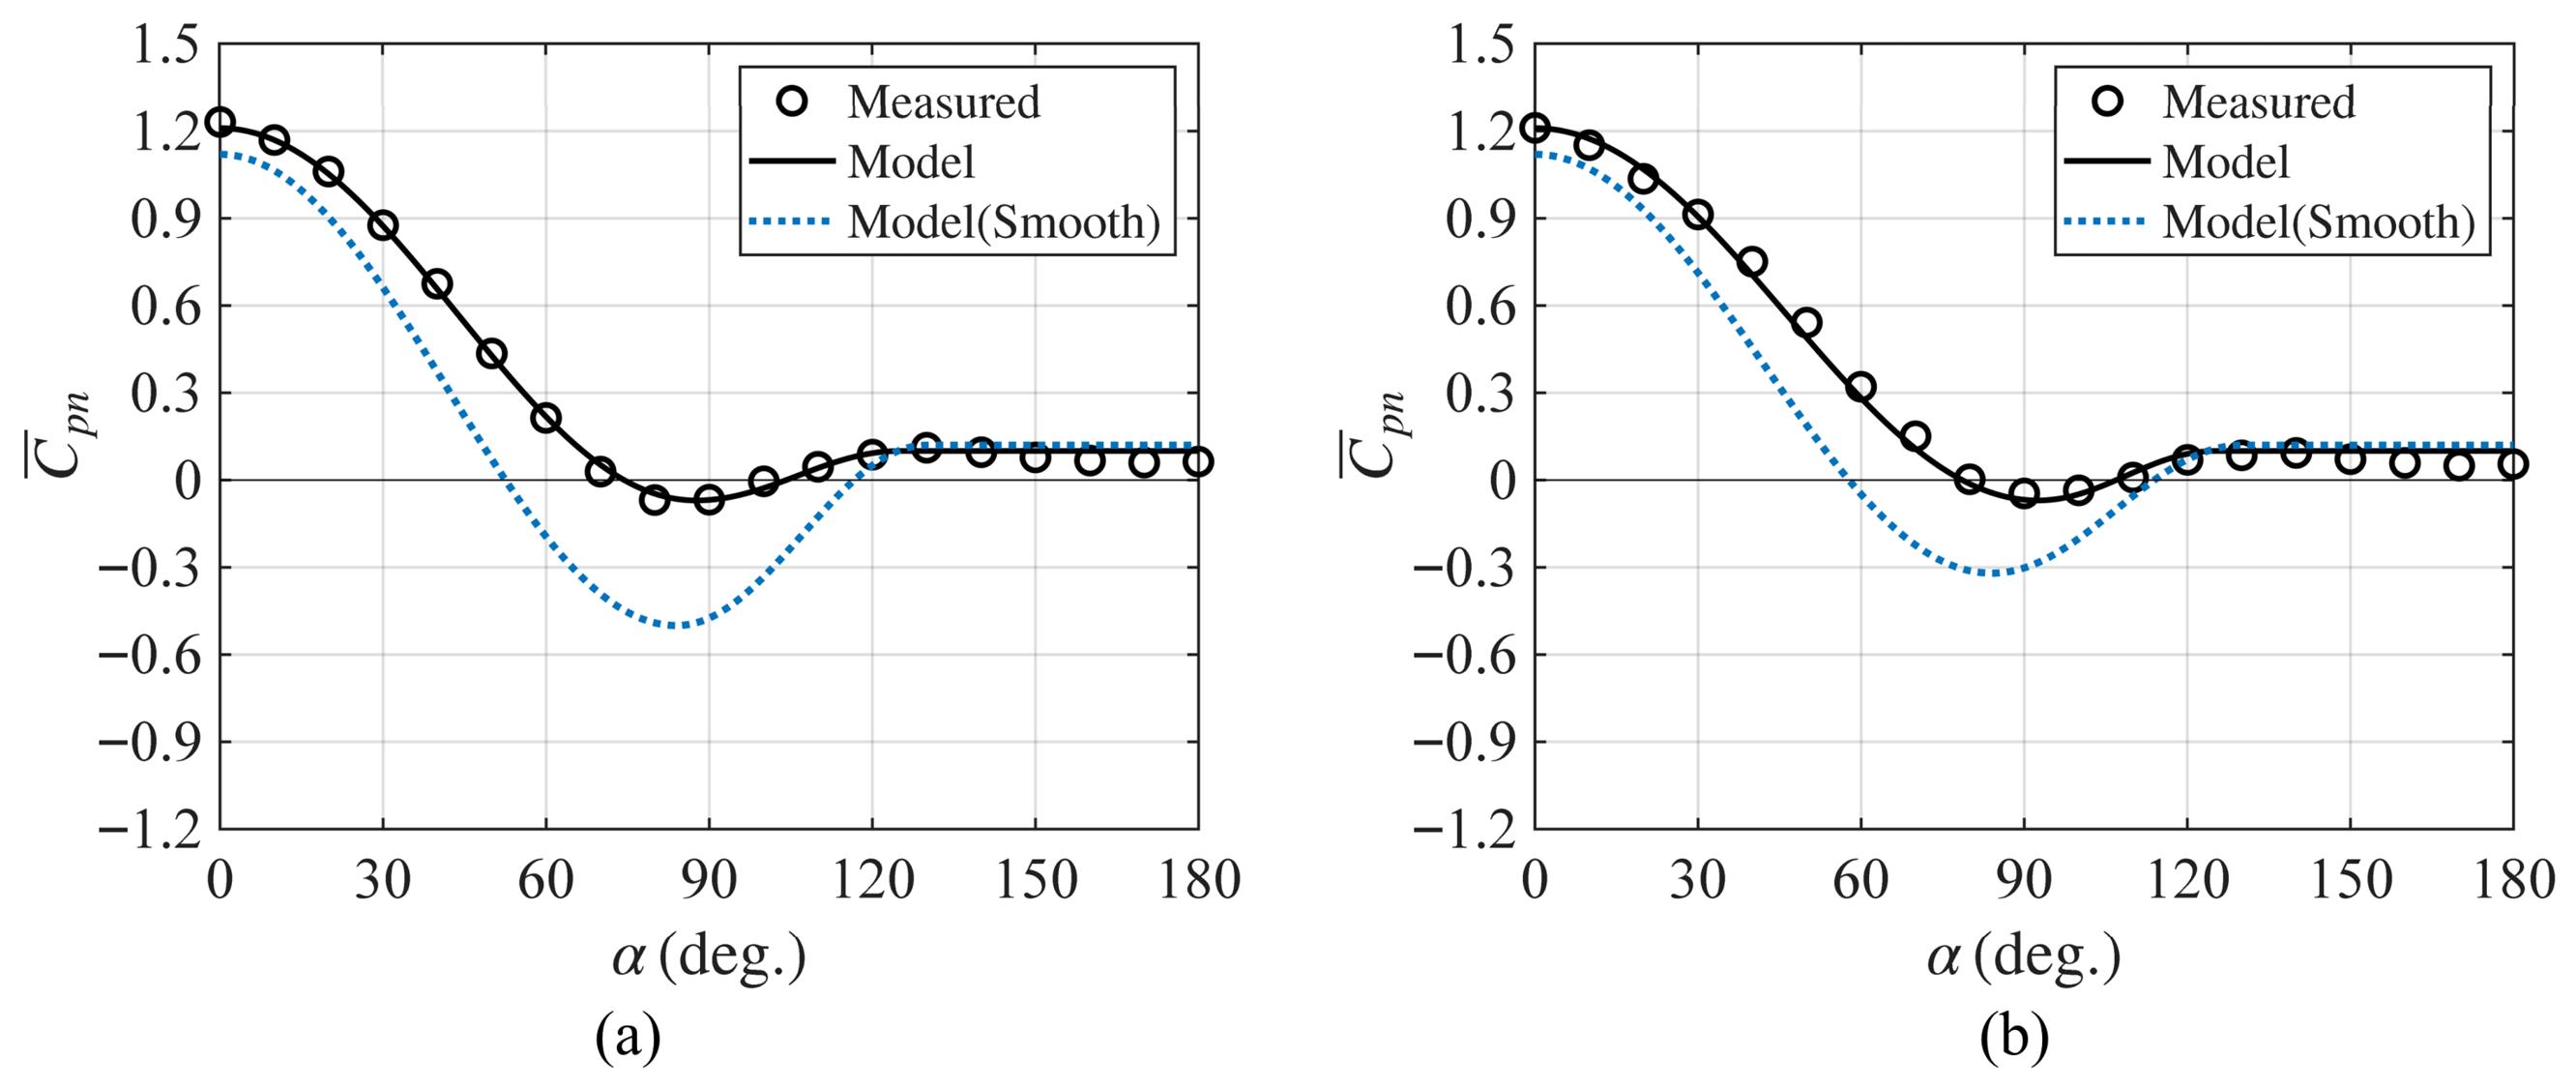
Figure 17 shows a comparison for the rough-surface case. For reference, the smooth-surface model is also included, represented by a dashed line. The proposed model captured the influence of surface roughness, particularly in the side and leeward regions, and showed close agreement with the experimental results.
Figure 17.
Comparison between the experimental values and model for rough surfaces at stagnation height (0.625H): (a) H/D = 0.5 and (b) H/D = 0.3.
Table 3 presents the mean net drag coefficient, , and mean net overturning-moment coefficient, , calculated under the assumption that the net-pressure distribution is invariant with height. The drag and overturning-moment coefficients were overestimated by up to 23.9% and 17.7%, respectively. Therefore, neglecting the height-dependent variation in the net-pressure distribution may lead to an excessively conservative evaluation of wind loads, resulting in an uneconomical structural design and inefficient material use.
Table 3.
Wind-force coefficients assuming height-uniform circumferential net-pressure distribution.
3.5. Height-Dependent Circumferential Net-Pressure Distribution Model
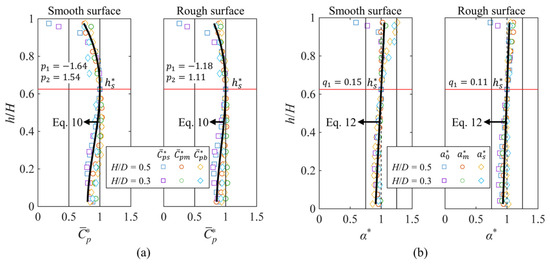
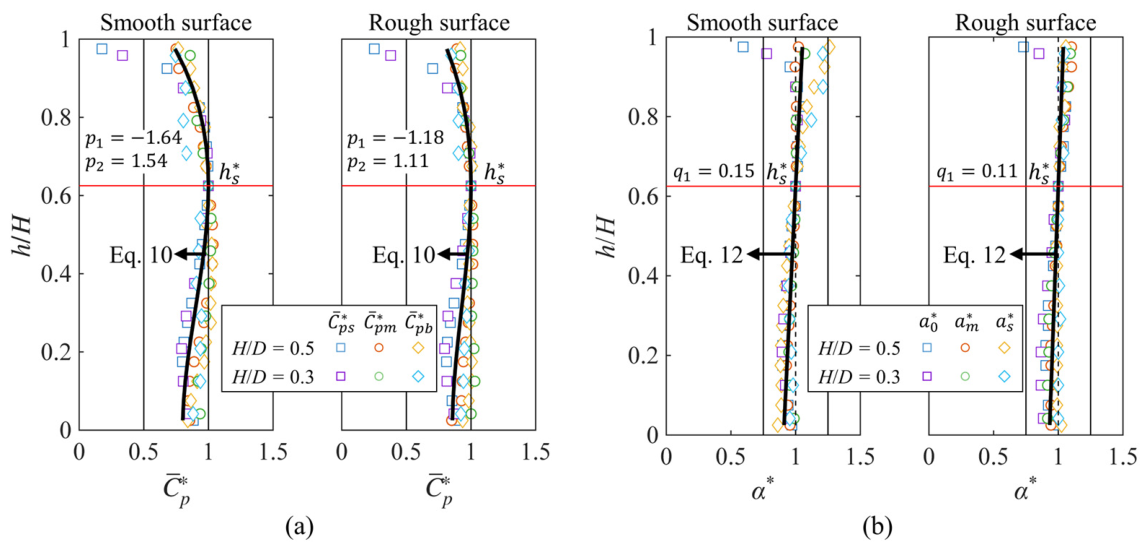
The procedure for calculating the height-dependent circumferential mean net-pressure distribution model was developed on the basis of the approach proposed by Liu et al. [10]. Figure 18 shows the height-dependent variations in the aerodynamic parameters for both smooth and rough surfaces. The symbols and indicate the ratios of the aerodynamic parameters at each height to their corresponding values at the stagnation height. The pressure-coefficient ratio, , generally decreased toward both the top and bottom relative to the stagnation height. In contrast, the angle ratio, , increased toward the upper region and decreased toward the lower region, resulting in an approximately linear variation with height. Similar variation patterns were observed for both H/D cases, and the height-dependent ratios were approximated using fitted curves. Quadratic, cubic, and quartic polynomials were examined to approximate the height-dependent pressure-coefficient ratio, . Although the quartic polynomial yielded slightly smaller errors, the improvement over the cubic polynomial was marginal; therefore, the cubic polynomial was adopted.
Figure 18.
Height-dependent variations in aerodynamic parameters: (a) Wind pressure-coefficient ratio and (b) azimuth angle ratio.
The formulation is expressed in dimensionless form, where the vertical coordinate is normalized as ( = h/H), and all aerodynamic parameters are defined relative to their values at the stagnation height. This normalization enables application of the model to geometrically similar low-aspect-ratio circular structures within the investigated range of H/D.
The height-dependent pressure-coefficient ratio, , is expressed as a cubic function:
where = h/H denotes the normalized height.
The function is constrained to attain a maximum value of 1 at the normalized stagnation height, such that and .
Applying these constraints, Equation (9) can be reformulated as follows:
The height-dependent azimuthal angle ratio, , is modeled using a linear function:
Enforcing the condition yields
The coefficients , , and were determined using a least-squares fitting procedure, and their values are summarized in Figure 18. For rough surfaces, the fitted coefficients are smaller in magnitude, indicating a weaker dependence of the aerodynamic parameters on height.
Using these relationships, the height-dependent circumferential distribution of the mean net-pressure coefficient can be obtained through the following procedure:
- (1)
- Determine the aerodynamic parameters at the stagnation height based on the definitions provided in Figure 15.
- (2)
- Calculate the height-dependent ratios, and , using Equations (10) and (12).
- (3)
- Compute the aerodynamic parameters at each height, , by multiplying the stagnation-height parameters determined in Step (1) by the corresponding height-dependent ratios.
- (4)
- Substitute the resulting parameters into Equation (8) to obtain the circumferential mean net-pressure distribution along the height.
This procedure enables reconstruction of the full height-dependent pressure distribution from the reference condition at the stagnation height, providing a consistent and unified representation of the vertical variation in net pressure.
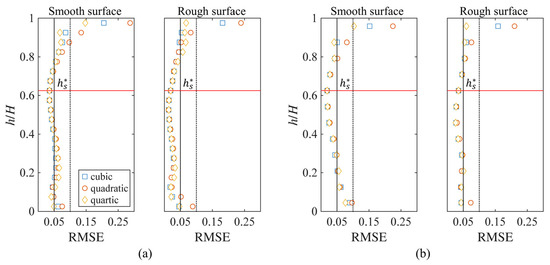
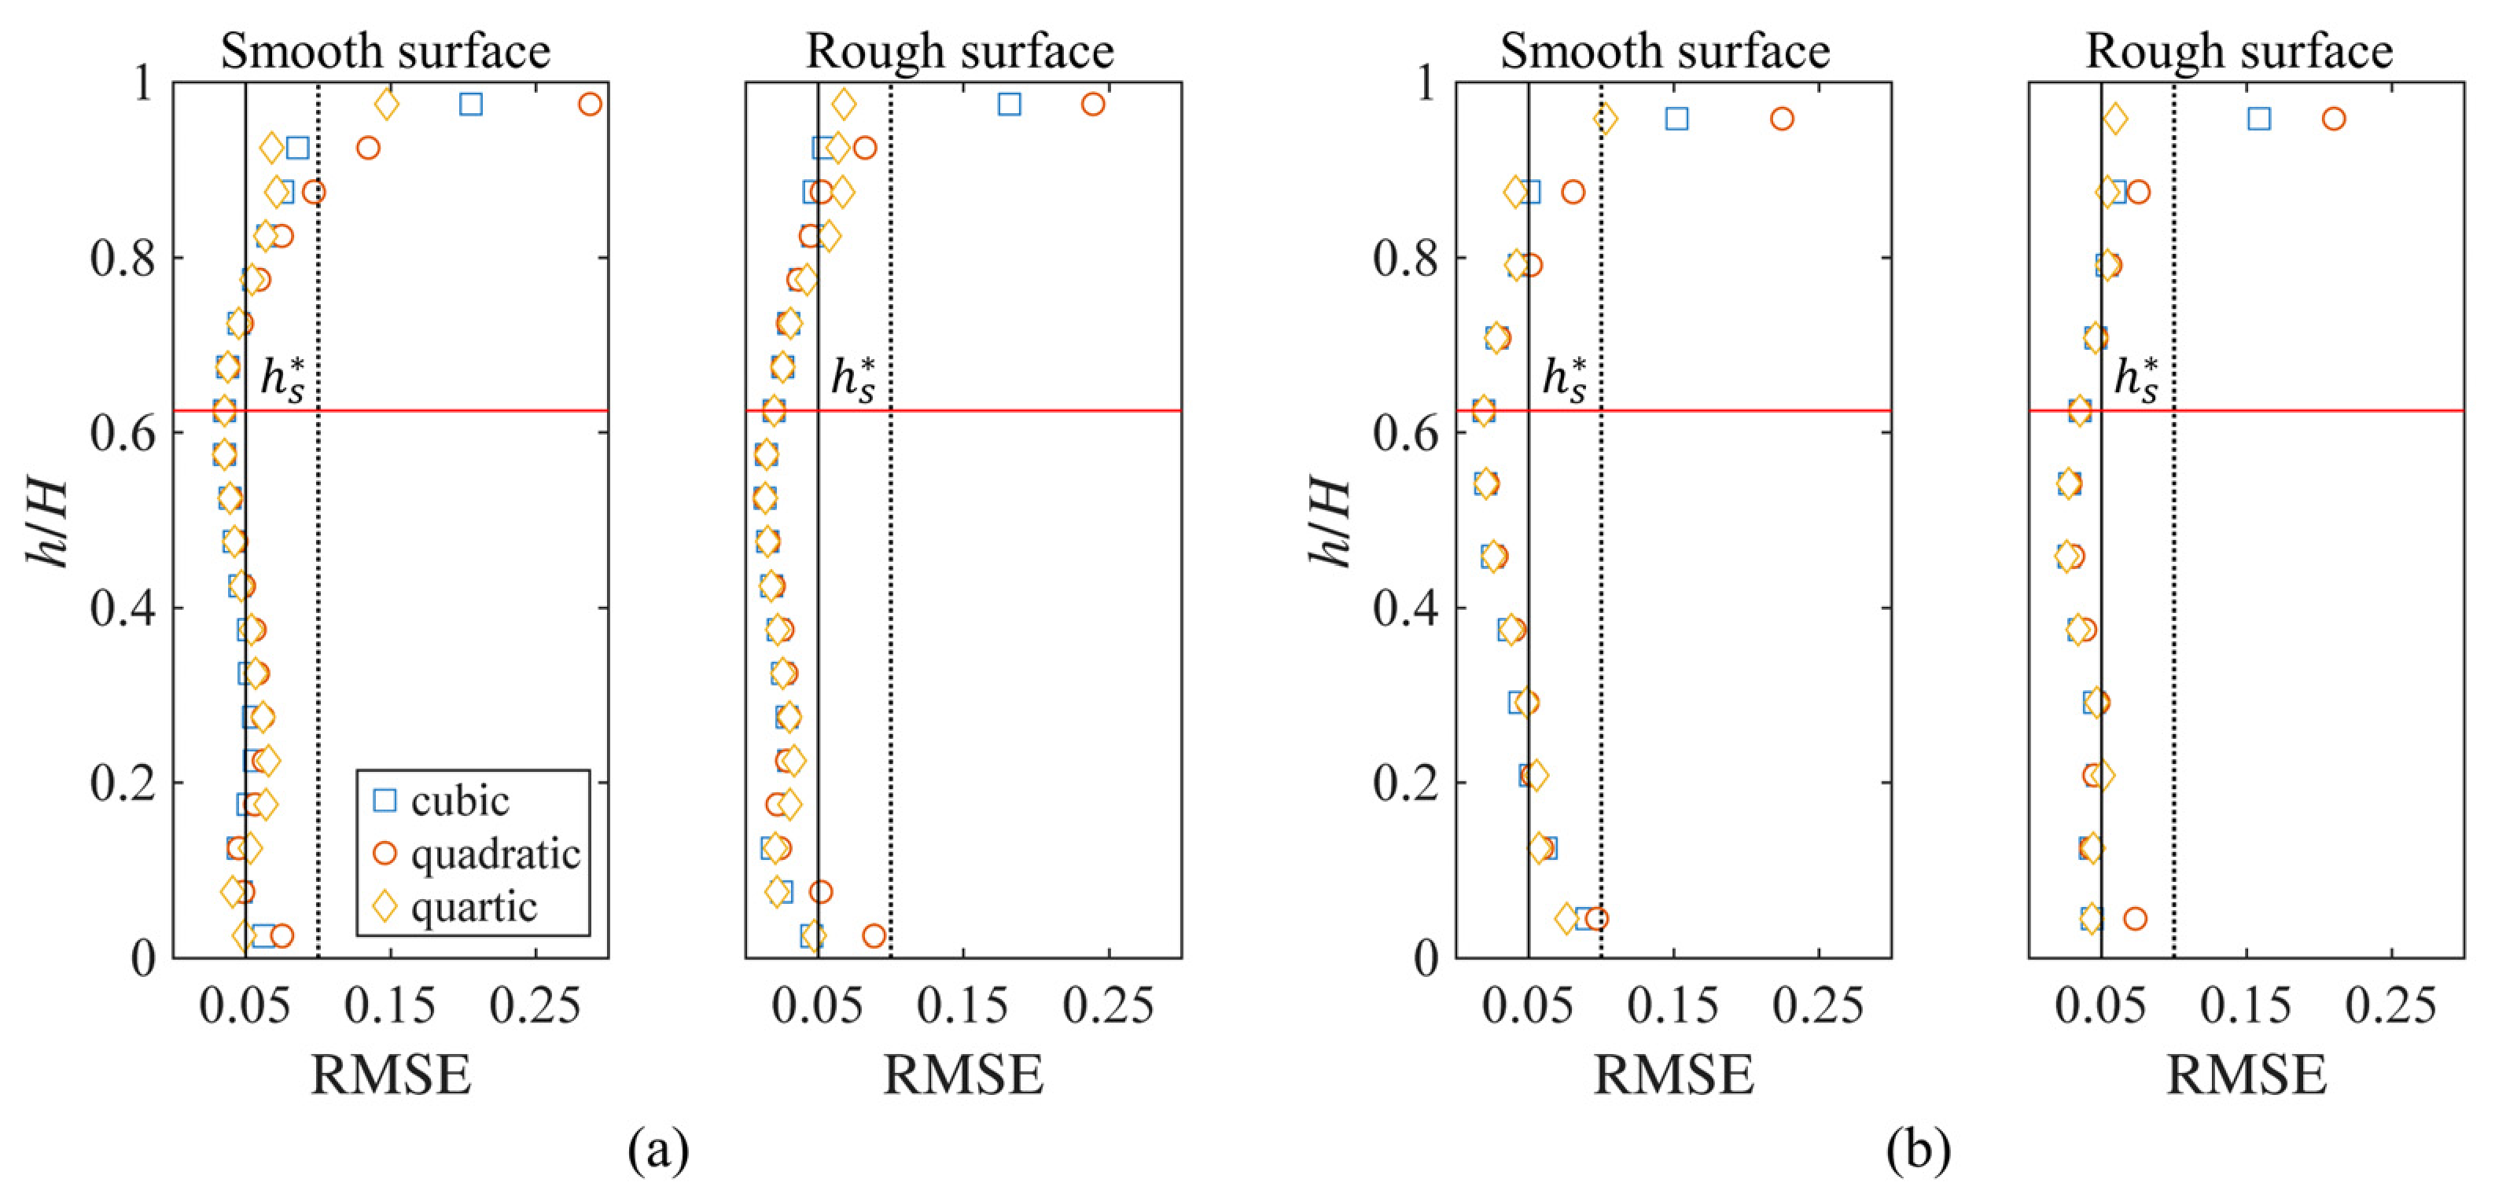
Figure 19 shows the height-wise root-mean-square error (RMSE) between the circumferential mean net-pressure distribution model calculated using Equations (8)–(12) and the experimental results. For comparison, the results obtained using the ratios estimated from the quadratic and quartic polynomials are included. Within the normalized height range of 0.15–0.85, the three polynomial orders exhibited highly similar trends, and the corresponding RMSE values remained below approximately 0.05. Noticeable differences appeared in the upper region above 0.85, where the quartic polynomial yielded the smallest errors. However, despite the slightly improved local accuracy, the cubic and quartic polynomials produced nearly identical drag coefficients. For example, in the smooth-surface case with H/D = 0.5, the drag coefficient was 0.420 for the quadratic polynomial and 0.404 for both the cubic and quartic polynomials.
Figure 19.
Height-wise RMSE of the circumferential mean net-pressure distribution model: (a) H/D = 0.5 and (b) H/D = 0.3.
The overall mean net-drag and overturning-moment coefficients, and , recalculated using the height-dependent model are summarized in Table 4. The maximum error was approximately 8.6% for and 6.8% for . These results indicate improved agreement compared with the height-independent assumption and suggest that incorporating height-dependent variations enhances the consistency between model predictions and experimental results. However, note that a limited range of conditions (0.3 ≤ H/D ≤ 0.5) was considered under the adopted experimental conditions, including surface roughness, turbulence intensity, and roof-opening ratio. Accordingly, the applicability of the proposed model is confined to the investigated range. Further experimental and analytical studies covering a wider range of geometric and aerodynamic conditions are required to generalize their applicability.
Table 4.
Wind-force coefficients based on a height-dependent net-pressure model.
4. Conclusions
In this study, the net-pressure characteristics of low-aspect-ratio circular structures with roof openings were investigated. Wind-tunnel tests were conducted with two aspect ratios and three levels of surface roughness to examine the net-pressure distribution and resulting wind-force coefficients. In addition, the height-dependent variation in the net pressure and its influence on wind-load estimation were evaluated. The main findings are as follows.
- The internal pressure was predominantly negative owing to the internal circulation induced by the roof opening. Although the internal pressure showed relatively similar values over most of the surface, the absolute values of the mean internal-pressure coefficient decreased near the upper and lower corners of the leeward region. When combined with the external-pressure distribution, this behavior caused the net pressure in the leeward region to vary with height. Consequently, this height-dependent variation in the net pressure in the leeward region was found to influence the estimation of the drag coefficient.
- For the smooth-surface case, even with a roof opening, the azimuth angles of the minimum pressure and separation point shifted toward the leeward direction with increasing height owing to the free-end effect. Consequently, the net-pressure distribution exhibited a height-dependent variation. As the surface roughness increased, the net-pressure distribution became more uniform along the height. The fluctuation of the net pressure slightly decreased in the upper region, and the height-dependent variation became less pronounced than that in the smooth-surface case.
- Comparisons of the drag coefficients with existing wind-load standards revealed systematic discrepancies. The drag coefficients specified in AS/NZS 1170.2 and AIJ-RLB significantly overestimated the smooth-surface results, with maximum deviations of 38.7% and 21.5%, respectively. For rough surfaces, the AIJ-RLB provisions underestimated the drag coefficient by approximately 4.7%.
- A simplified model for the circumferential distribution of mean net-pressure coefficients was developed to support practical wind-load estimation. The model is formulated based on the pressure distribution at the stagnation height and incorporates height-dependent aerodynamic parameters to capture vertical variations in the net-pressure field. The predicted drag coefficients show strong agreement with experimental results, with a maximum relative error below 8.6%.
The proposed model provides a practical framework for estimating wind loads in the structural design of low-aspect-ratio circular structures with roof openings. However, its applicability is restricted to the range of conditions investigated in this study (0.3 ≤ H/D ≤ 0.5) and to the specific experimental parameters considered, including surface roughness, turbulence intensity, and roof-opening ratio. Extension of the model to a broader range of geometric configurations and flow conditions will require further experimental and analytical investigation.
Author Contributions
Conceptualization, D.J.C.; methodology, Y.C.K.; software, D.J.C. and Y.C.K.; investigation, D.J.C. and Y.C.K.; resources, S.W.Y.; writing—original draft preparation, D.J.C.; writing—review and editing, Y.C.K. and S.W.Y. All authors have read and agreed to the published version of the manuscript.
Funding
This study was financially supported by the Seoul National University of Science and Technology.
Data Availability Statement
The data presented in this study are available upon request from the corresponding author.
Conflicts of Interest
The authors declare no conflicts of interest.
References
- AS/NZS 1170.2:2021; Structural Design Actions, Part 2: Wind Actions. Standards Australia: Sydney, Australia; Standards New Zealand: Wellington, New Zealand, 2021.
- AIJ-RLB. AIJ Recommendations for Loads on Buildings; Architectural Institute of Japan: Tokyo, Japan, 2015. [Google Scholar]
- ASCE 7-10; Minimum Design Loads for Buildings and Other Structures. American Society of Civil Engineers, Structural Engineering Institute: Reston, VA, USA, 2010.
- EN 1991-1-4:2005 +A1:2010; Eurocode 1—Actions on Structures—Part 1–4: General Actions—Wind Actions. CEN: Brussels, Belgium, 2010.
- Portela, G.; Godoy, L.A. Wind Pressures and Buckling of Cylindrical Steel Tanks with a Dome Roof. J. Constr. Steel Res. 2005, 61, 808–824. [Google Scholar] [CrossRef] [Scilit]
- Okamoto, S.; Sunabashiri, Y. Vortex Shedding From a Circular Cylinder of Finite Length Placed on a Ground Plane. J. Fluids Eng. 1992, 114, 512–521. [Google Scholar] [CrossRef] [Scilit]
- Uematsu, Y.; Yamada, M.; Ishii, K. Aerodynamics of a Circular Cylinder of Finite Length. Wind Eng. JAWE 1988, 1988, 27–43. [Google Scholar] [CrossRef] [Scilit]
- Sumner, D.; Heseltine, J.L.; Dansereau, O.J.P. Wake Structure of a Finite Circular Cylinder of Small Aspect Ratio. Exp. Fluids 2004, 37, 720–730. [Google Scholar] [CrossRef] [Scilit]
- Wang, H.F.; Zhou, Y.; Mi, J. Effects of Aspect Ratio on the Drag of a Wall-Mounted Finite-Length Cylinder in Subcritical and Critical Regimes. Exp. Fluids 2012, 53, 423–436. [Google Scholar] [CrossRef] [Scilit]
- Liu, L.; Sun, Y.; Su, N.; Wu, Y.; Peng, S. Three-Dimensional Reynolds Number Effects and Wind Load Models for Cylindrical Storage Tanks with Low Aspect Ratios. J. Wind Eng. Ind. Aerodyn. 2022, 227, 105080. [Google Scholar] [CrossRef] [Scilit]
- Han, Z.; Li, B.; Tian, Y.; Xue, M.; Shao, S. Investigation of Wind-Loads Acting on Low-Aspect-Ratio Cylindrical Structures Based on a Wind Tunnel Test. Appl. Sci. 2022, 12, 5891. [Google Scholar] [CrossRef] [Scilit]
- Liu, M.; Li, Q.-S.; Huang, S.-H.; Shi, F.; Chen, F. Evaluation of Wind Effects on a Large Span Retractable Roof Stadium by Wind Tunnel Experiment and Numerical Simulation. J. Wind Eng. Ind. Aerodyn. 2018, 179, 39–57. [Google Scholar] [CrossRef] [Scilit]
- Xu, H.; Lou, W. Wind-Induced Internal Pressures in Building with Dominant Opening on Hemi-Ellipsoidal Roof. J. Eng. Mech. 2018, 144, 04018041. [Google Scholar] [CrossRef] [Scilit]
- Li, M.; Zhang, X.; Bao, Y.; Lin, J.; Pei, C.; Cheng, X.; Ma, C. The Influence of Roof Opening and Closure on the Overall Wind Pressure Distribution of Airport Terminal Roof. Buildings 2025, 15, 735. [Google Scholar] [CrossRef] [Scilit]
- Kiu, K.Y.; Stappenbelt, B.; Thiagarajan, K.P. Effects of Uniform Surface Roughness on Vortex-Induced Vibration of Towed Vertical Cylinders. J. Sound Vib. 2011, 330, 4753–4763. [Google Scholar] [CrossRef] [Scilit]
- Zhou, B.; Wang, X.; Gho, W.M.; Tan, S.K. Force and Flow Characteristics of a Circular Cylinder with Uniform Surface Roughness at Subcritical Reynolds Numbers. Appl. Ocean Res. 2015, 49, 20–26. [Google Scholar] [CrossRef] [Scilit]
- Sun, C.; Zhou, T.; An, H.; Zhu, H.; Cheng, L. Experimental Studies on Wake Structures of a Circular Cylinder with Different Surface Roughness Heights. Int. J. Heat Fluid Flow 2022, 94, 108941. [Google Scholar] [CrossRef] [Scilit]
- Letchford, C.W.; Sarkar, P.P. Mean and Fluctuating Wind Loads on Rough and Smooth Parabolic Domes. J. Wind Eng. Ind. Aerodyn. 2000, 88, 101–117. [Google Scholar] [CrossRef] [Scilit]
- Qiu, Y.; Sun, Y.; Wu, Y.; Tamura, Y. Modeling the Mean Wind Loads on Cylindrical Roofs with Consideration of the Reynolds Number Effect in Uniform Flow with Low Turbulence. J. Wind Eng. Ind. Aerodyn. 2014, 129, 11–21. [Google Scholar] [CrossRef] [Scilit]
- Cheon, D.J.; Kim, Y.C.; Yoon, S.W. Non-Gaussian Properties and Extreme Values of Net Pressure on a Dome with a Central Opening. J. Build. Eng. 2025, 113, 114022. [Google Scholar] [CrossRef] [Scilit]
- Lee, J.H.; Kim, Y.C.; Cheon, D.J.; Yoon, S.W. Wind Pressure Characteristics of Elliptical Retractable Dome Roofs. J. Asian Archit. Build. Eng. 2022, 21, 1561–1577. [Google Scholar] [CrossRef] [Scilit]
- Uematsu, Y.; Koo, C.; Yasunaga, J. Design Wind Force Coefficients for Open-Topped Oil Storage Tanks Focusing on the Wind-Induced Buckling. J. Wind Eng. Ind. Aerodyn. 2014, 130, 16–29. [Google Scholar] [CrossRef] [Scilit]
- Kim, Y.C.; Yoon, S.W.; Cheon, D.J.; Song, J.Y. Characteristics of Wind Pressures on Retractable Dome Roofs and External Peak Pressure Coefficients for Cladding Design. J. Wind Eng. Ind. Aerodyn. 2019, 188, 294–307. [Google Scholar] [CrossRef] [Scilit]
- Qiu, Y.; Sun, Y.; Wu, Y.; San, B.; Tamura, Y. Surface Roughness and Reynolds Number Effects on the Aerodynamic Forces and Pressures Acting on a Semicylindrical Roof in Smooth Flow. J. Struct. Eng. 2018, 144, 04018140. [Google Scholar] [CrossRef] [Scilit]
- Duarte Ribeiro, J. Effects of Surface Roughness on the Two-Dimensional Flow Past Circular Cylinders I: Mean Forces and Pressures. J. Wind Eng. Ind. Aerodyn. 1991, 37, 299–309. [Google Scholar] [CrossRef] [Scilit]
- Uematsu, Y.; Yamada, M.; Ishii, K. Some Effects of Free-Stream Turbulence on the Flow Past a Cantilevered Circular Cylinder. J. Wind Eng. Ind. Aerodyn. 1990, 33, 43–52. [Google Scholar] [CrossRef] [Scilit]
- MacDonald, P.A.; Kwok, K.C.S.; Holmes, J.D. Wind Loads on Circular Storage Bins, Silos and Tanks: I. Point Pressure Measurements on Isolated Structures. J. Wind Eng. Ind. Aerodyn. 1988, 31, 165–187. [Google Scholar] [CrossRef] [Scilit]
- Cook, N.J.; Redfearn, D. Full-Scale Wind Pressure Measurements on Cylindrical Silos: A Preliminary Report; Building Research Establishment: Garston, Watford, UK, 1980. [Google Scholar]
- Yeung, W.W.H. Similarity Study on Mean Pressure Distributions of Cylindrical and Spherical Bodies. J. Wind Eng. Ind. Aerodyn. 2007, 95, 253–266. [Google Scholar] [CrossRef] [Scilit]
- Su, N.; Peng, S.; Uematsu, Y. Reynolds Number Effects on the Wind Pressure Distribution on Spherical Storage Tanks. J. Wind Eng. Ind. Aerodyn. 2021, 208, 104464. [Google Scholar] [CrossRef] [Scilit]

Disclaimer/Publisher’s Note: The statements, opinions and data contained in all publications are solely those of the individual author(s) and contributor(s) and not of MDPI and/or the editor(s). MDPI and/or the editor(s) disclaim responsibility for any injury to people or property resulting from any ideas, methods, instructions or products referred to in the content. |
© 2026 by the authors. Licensee MDPI, Basel, Switzerland. This article is an open access article distributed under the terms and conditions of the Creative Commons Attribution (CC BY) license.