


Abstract
Sometimes only a portion of the surface of a concrete element is loaded, which causes stress concentration in that region. To safely transfer concentric loads to concrete components such as column bases, short cantilevers, superstructure piers, post-tensioned elements, and support anchors, it is imperative to investigate the local compressive characteristics of concrete. To learn more about this subject, further research is required, as there are currently insufficient studies in this field. Therefore, the local compressive behavior of concrete under concentric stresses is the main focus of this work. Concrete is represented as block samples with dimensions of 200 × 200 × 250 mm. A stiff steel plate is used to apply concentric loading on the surface of the samples. The primary parameters are the bearing plate dimensions, shape (square, rectangle, and circular with varying areas), and rectangularity. Additionally, the bearing plate’s movement is examined. The stress-slip curves, ultimate bearing strengths, failures, and related slippages of the tested samples are discussed. The findings revealed that the upper surface of the concrete samples exhibited localized deterioration beneath the bearing plate. Additionally, the ultimate bearing strength of the sample loaded with the 6 × 6 cm square plate was 163% greater than that of the sample loaded with the 10 × 10 cm square plate. Furthermore, the sample loaded with the circular plate with a diameter of 4 cm had an ultimate bearing strength that was 181% greater than the sample loaded with the circular plate with a diameter of 11 cm. It is clear that the samples loaded with a circular plate of varying diameters had an ultimate bearing strength that was 8.5–11% higher than the samples loaded with a square plate of varying lengths.
1. Introduction
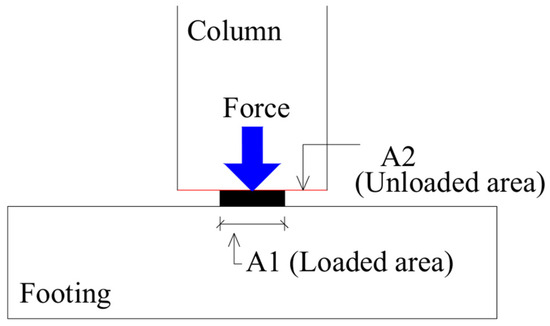
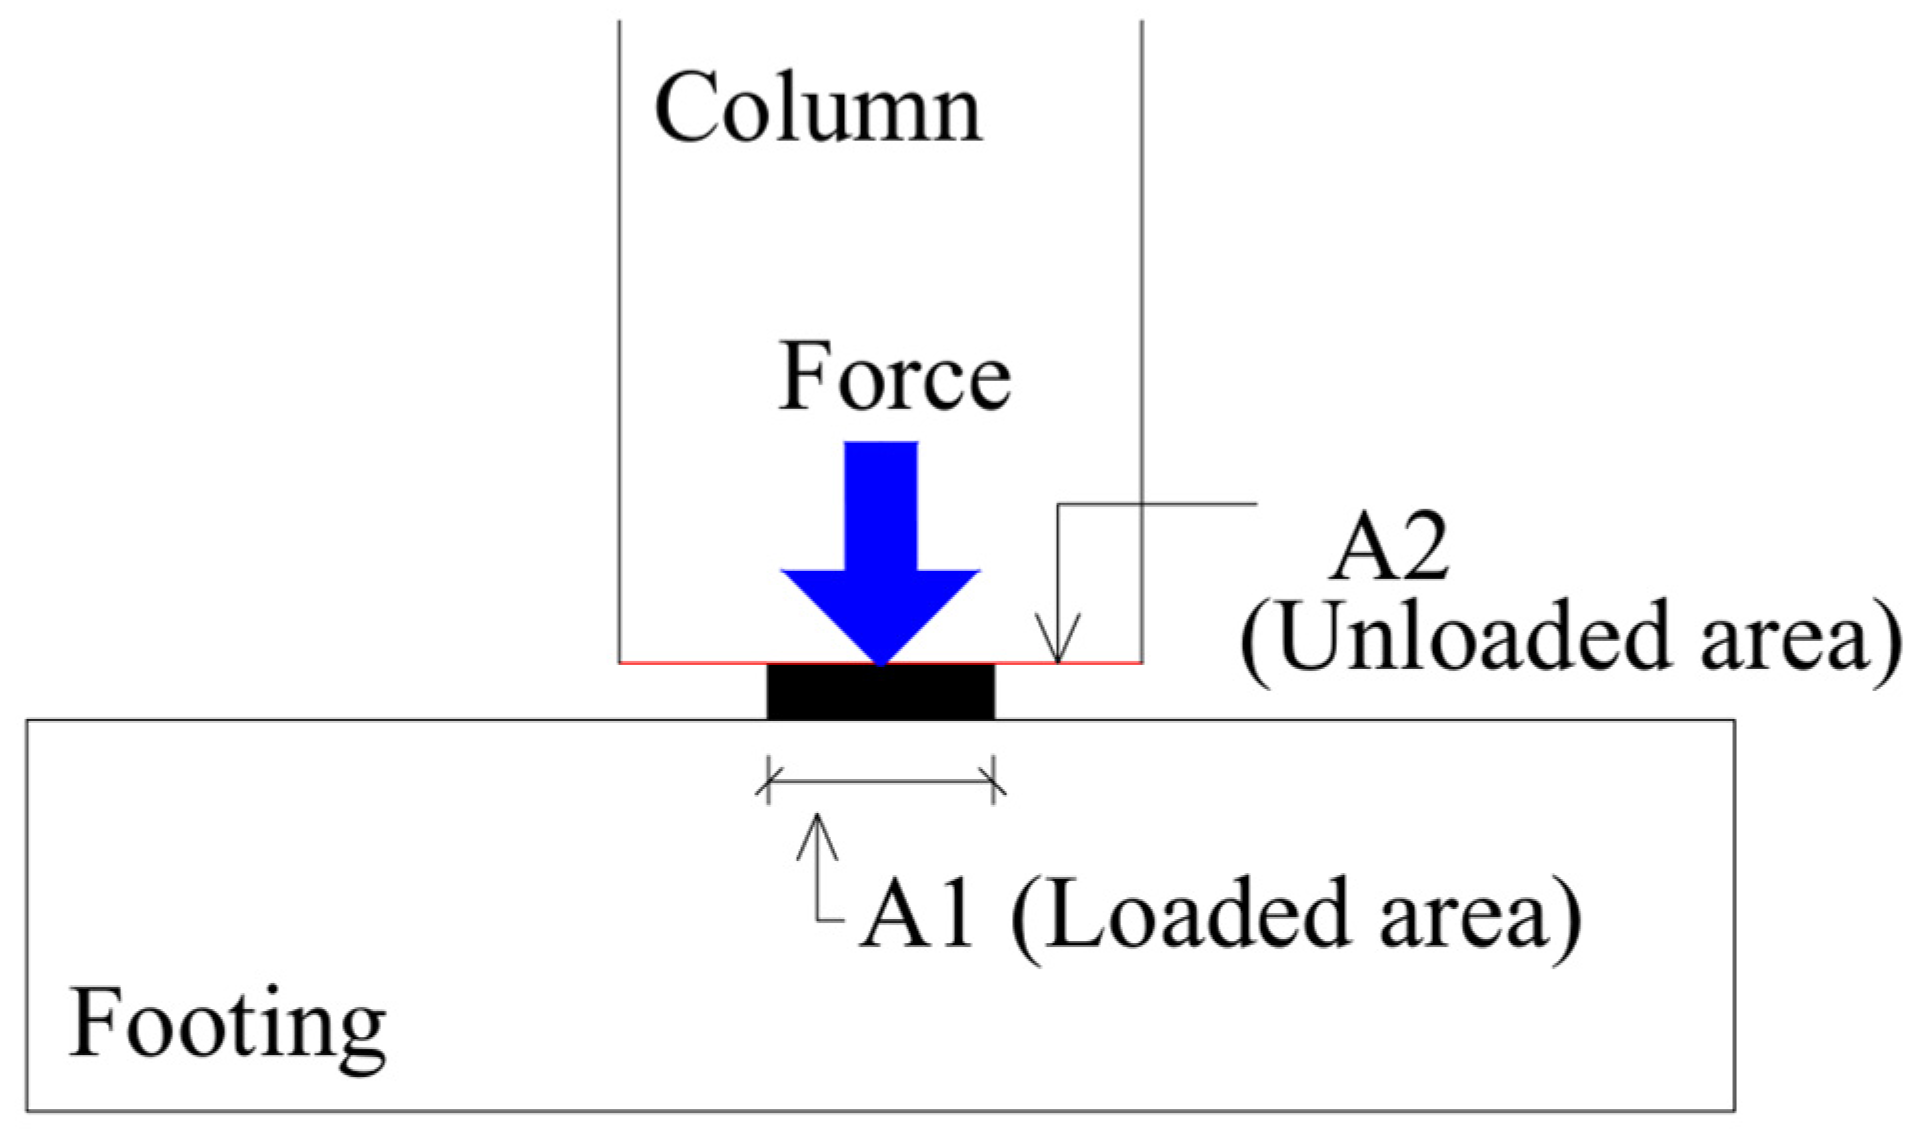
For the safe transmission of concentric loading to concrete components, such as column bases, short cantilevers, superstructure piers, post-tensioned elements, support anchors, and other kinds of superstructure elements, the concrete bearing strength is considered an essential design feature. These structural supports are subjected to large concentric loads, which might jeopardize the structural integrity of the building. Massive concentric loads acting on the surface of the concrete may cause an uneven distribution of the load. Figure 1 presents an example of a locally loaded concrete element. The concrete sample’s local compression characteristic is at its highest when a load is applied locally, or within a specific area on its top surface. Accurate evaluation of this kind of strength is necessary for designing load-bearing structures [1,2,3]. In order to ensure the safety of buildings in locally loaded areas, it is crucial to consider the bearing strength of concrete. There is very limited research on this subject reported, though.
Figure 1.
Example of a locally loaded concrete element.
During construction, this metric is crucial for preserving the structural integrity and load-bearing capability of those parts. Under strong compressive stress, plain concrete samples developed radial and vertical cracking, according to investigators [4,5,6]. Furthermore, previous research works [7,8,9,10,11,12] have found that the loaded area, the member’s cross-section under load, loading conditions, and compressive properties all have a major impact on concrete’s bearing resistance and failure process.
Bauschinger [13] was the first researcher to use the cube-root equation, which was based on a few studies on sandstone cubes and does not provide accurate results for concrete in assessing the bearing strength of construction materials. Concrete failure under concentric loading is comparable to that observed in triaxial compression tests, according to Shelson [8] and Meyerhof [7]. Au and Baird [9] proposed that an inverted pyramid forms beneath the bearing plate to explain bearing failure in concrete samples. They believed that the downward penetration of the inverted pyramid before its collapse would provide horizontal stresses. These pressures were thought to put the concrete sample under tension and combined bending strain. When the maximum tensile stress at the top of the sample exceeds the concrete’s tensile strength, failure occurs. Although this argument may have been reasonable before failure, its final failure makes it appear unjustified. Numerous studies have been conducted on the behavior of concrete under local compression [14,15,16,17,18,19,20,21,22] due to the significance of this topic.
It is important to study the bearing behavior of concrete elements. Studies in this area are still limited and need to be expanded to gain more knowledge on this topic. As a result, this study focuses on the local compressive behavior of concrete elements under concentric loading. The main parameters are the dimensions, shape, and rectangularity of the bearing plate. Also, the shifting of the bearing plate is studied. Concrete is represented in the form of block samples with dimensions of 200 × 200 × 250 mm. The concentric load on the surface of the samples is represented by a number of bearing plate shapes such as square, rectangle, and circular plates with different areas. Cracks, ultimate bearing strengths, and corresponding slippages, as well as stress-slip curves of the tested samples are discussed.
2. Experimental Work
2.1. Concrete Samples
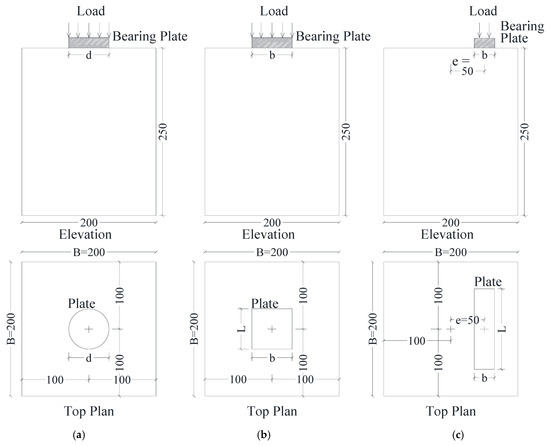
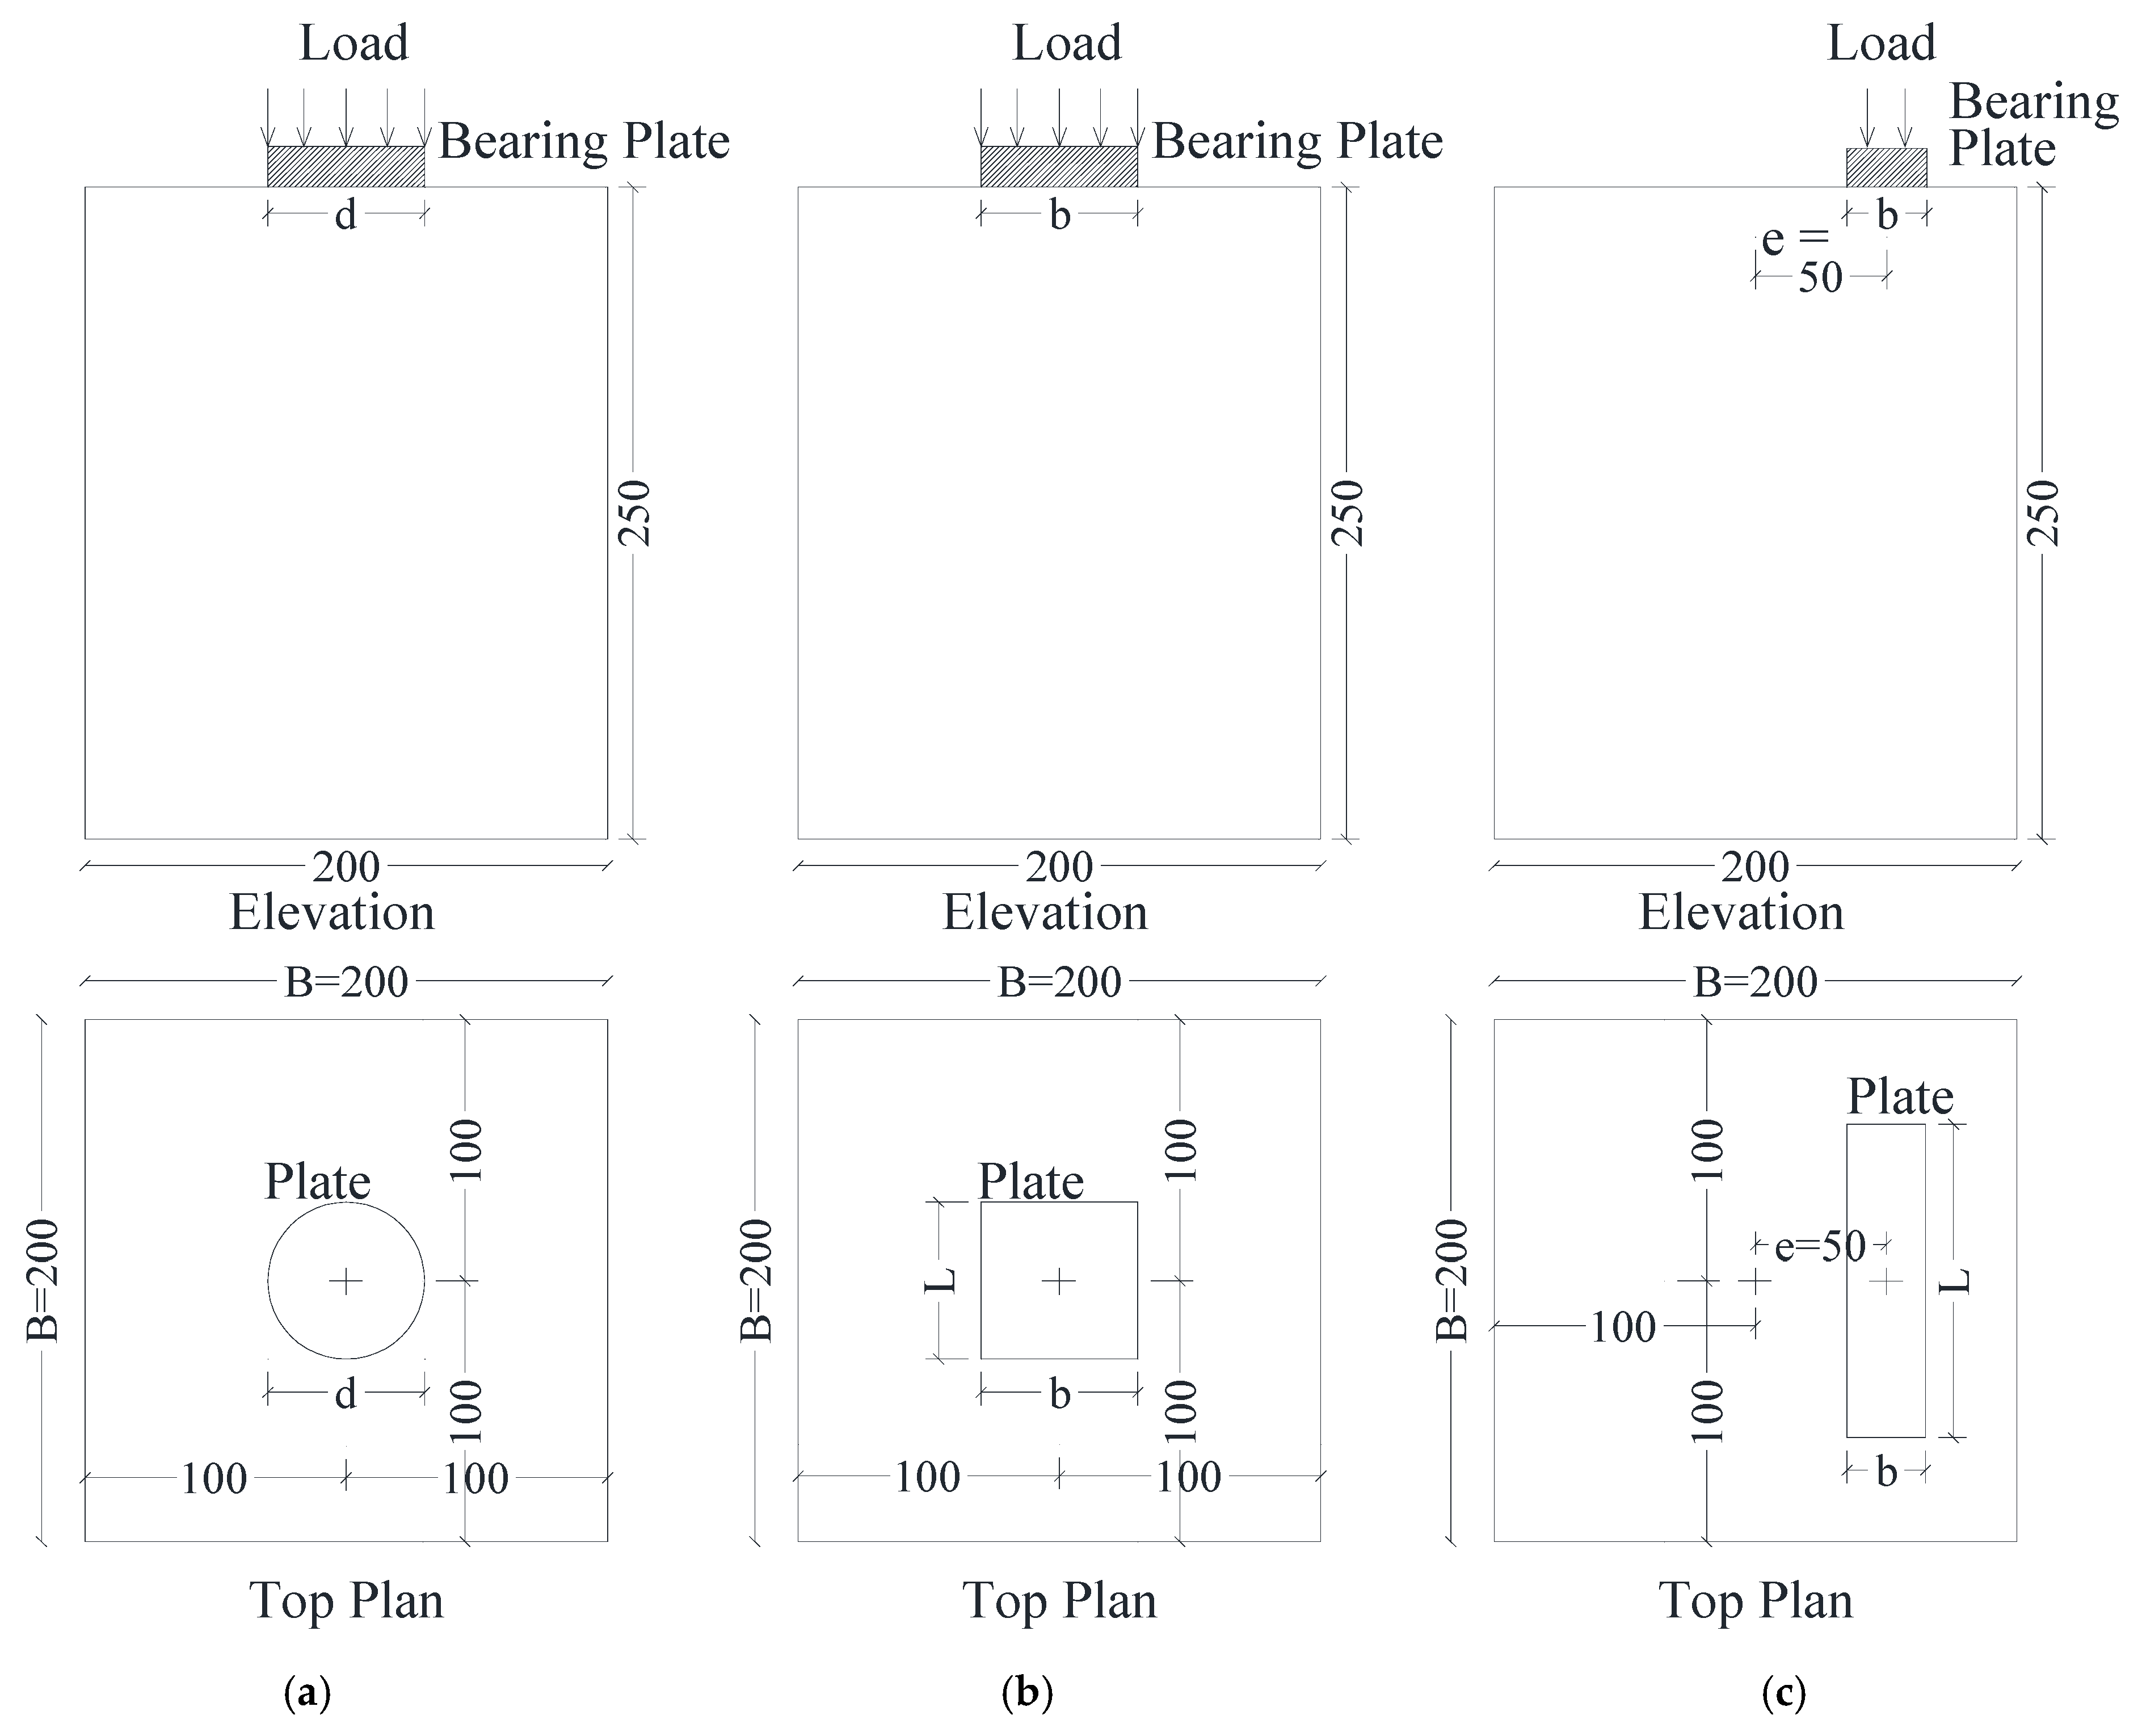
Details of the concrete samples are displayed in Figure 2 and Table 1. The primary focus of this work is the local compressive strength of the concrete samples at different areas, positions, aspect ratios, and bearing plates shapes. The composition and size of each concrete sample were identical. Each concrete sample was 250 mm in height and 200 × 200 mm in cross-section. The basis for choosing the sample dimensions was a simulation of a reinforced concrete base with dimensions of 1000 × 1000 × 1250 mm. To obtain the sample dimensions, a scale factor of 1/5 was applied. The size of the concrete samples was kept constant in this study, as it focuses solely on the effect of bearing plate characteristics.
Figure 2.
Details of tested samples (units: mm). (a) Circular model. (b) Square or rectangular model. (c) Eccentric model.
Table 1.
Configurations of samples.
The top surface of the sample (A2) was 200 × 200 mm. To apply the bearing load to the top surface of the sample, a steel bearing plate was placed there, sometimes in the center and sometimes off-center. The top surface of the concrete samples and the bearing plate were smooth to minimize friction between them. The current study did not focus on the friction between the bearing plate and the concrete surface, and this factor was kept constant across all samples.
In the samples, the area of the bearing plate (A1) varied. In group I, a square bearing plate was used in samples S10, S6, and S4. In these samples, plate width (b) was equal to the plate length (L), which led to the rectangularity ratio (r) of 1. Samples S10, S6, and S4 had a plate width of 100 mm, 60 mm, and 40 mm, respectively. The eccentricity of the plate was 0 in all three samples. The bearing plate area (A1) was 10,000 mm2, 3600 mm2, and 1600 mm2 in samples S10, S6, and S4, respectively.
The idea behind the designs of groups II and III was to maintain the same plate areas as those in group I (10,000 mm2, 3600 mm2, and 1600 mm2). In group II, a circular bearing plate was used in samples C11, C7, and C4, as shown in Figure 2a. Samples C11, C7, and C4 had plate diameters of 113 mm, 68 mm, and 45 mm, respectively. The eccentricity of the plates was 0 in all three samples. The bearing plate area (A1) was 10,000 mm2, 3600 mm2, and 1600 mm2 in samples C11, C7, and C4, respectively. The area was the same as that of samples S10, S6, and S4, respectively.
In samples R1.4, R2.2, and R4 of group III, a rectangular bearing plate was utilized. The plate length (L) in samples R1.4, R2.2, and R4 was 72 mm, 90 mm, and 120 mm, respectively, while the plate width (b) was 50 mm, 40 mm, and 30 mm, respectively. The plate length (L)-to-plate width (b) ratio was used to determine the rectangularity ratio (r) for each sample. Samples R1.4, R2.2, and R4 had r ratios of 1.4, 2.2, and 4, respectively. In all three samples, the plate’s eccentricity was zero, with the bearing plate positioned at the center of the sample. Samples R1.4, R2.2, and R4 had the same bearing plate area (A1) of 3600 mm2.
Group IV samples were exactly the same as those in group III except for the plate eccentricity (e). The bearing plates of group III samples were placed at 0 eccentricity, but the plates of group IV samples were positioned 50 mm from the center, as shown in Figure 2c. The eccentricity-to-sample width ratio (e/B) was 0.25 in the group IV samples. This group was composed of three samples R1.4E, R2.2E, and R4E, which were similar to their counterparts in group III. Three samples R1.4E, R2.2E, and R4E made up this group; they were comparable to those in group III.
For eliminating the influence of material variability on the experimental results, the scale was used to determine the proportions of the mixture components for all samples; the number of mixer turns used in mixing was kept constant for all samples, and the same pouring method was applied to all samples.
2.2. Materials
2.2.1. Concrete
All concrete samples were cast using the same composition. Portland cement, graded crushed basalt limestone up to 12 mm in size as the coarse aggregate, water, and local sand as the fine aggregate comprised the concrete mixture. The cement-to-water ratio was 50%. There were 1250 and 640 kg of coarse and fine aggregates per cubic meter, respectively. Portland cement content was 280 kg per cubic meter. After 28 days, the concrete compressive strength was 29 MPa.
2.2.2. Bearing Plate
To represent partial compression loading, steel plates were placed on the surface of the concrete samples. The steel plate used in this investigation was mild steel. Tension testing was employed to evaluate the mechanical properties of the steel material. These plates had an elastic modulus of 205 GPa and a yield strength of 257 MPa and an ultimate strength of 356 MPa.
2.3. Application of Local Pressure
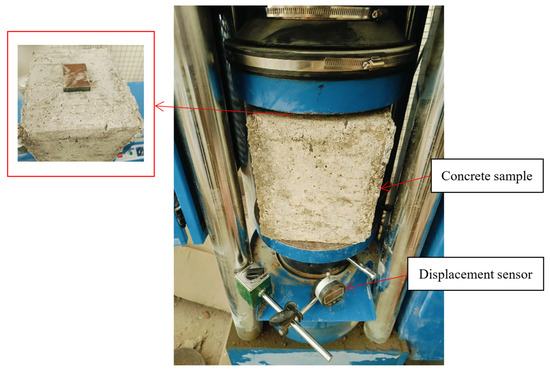
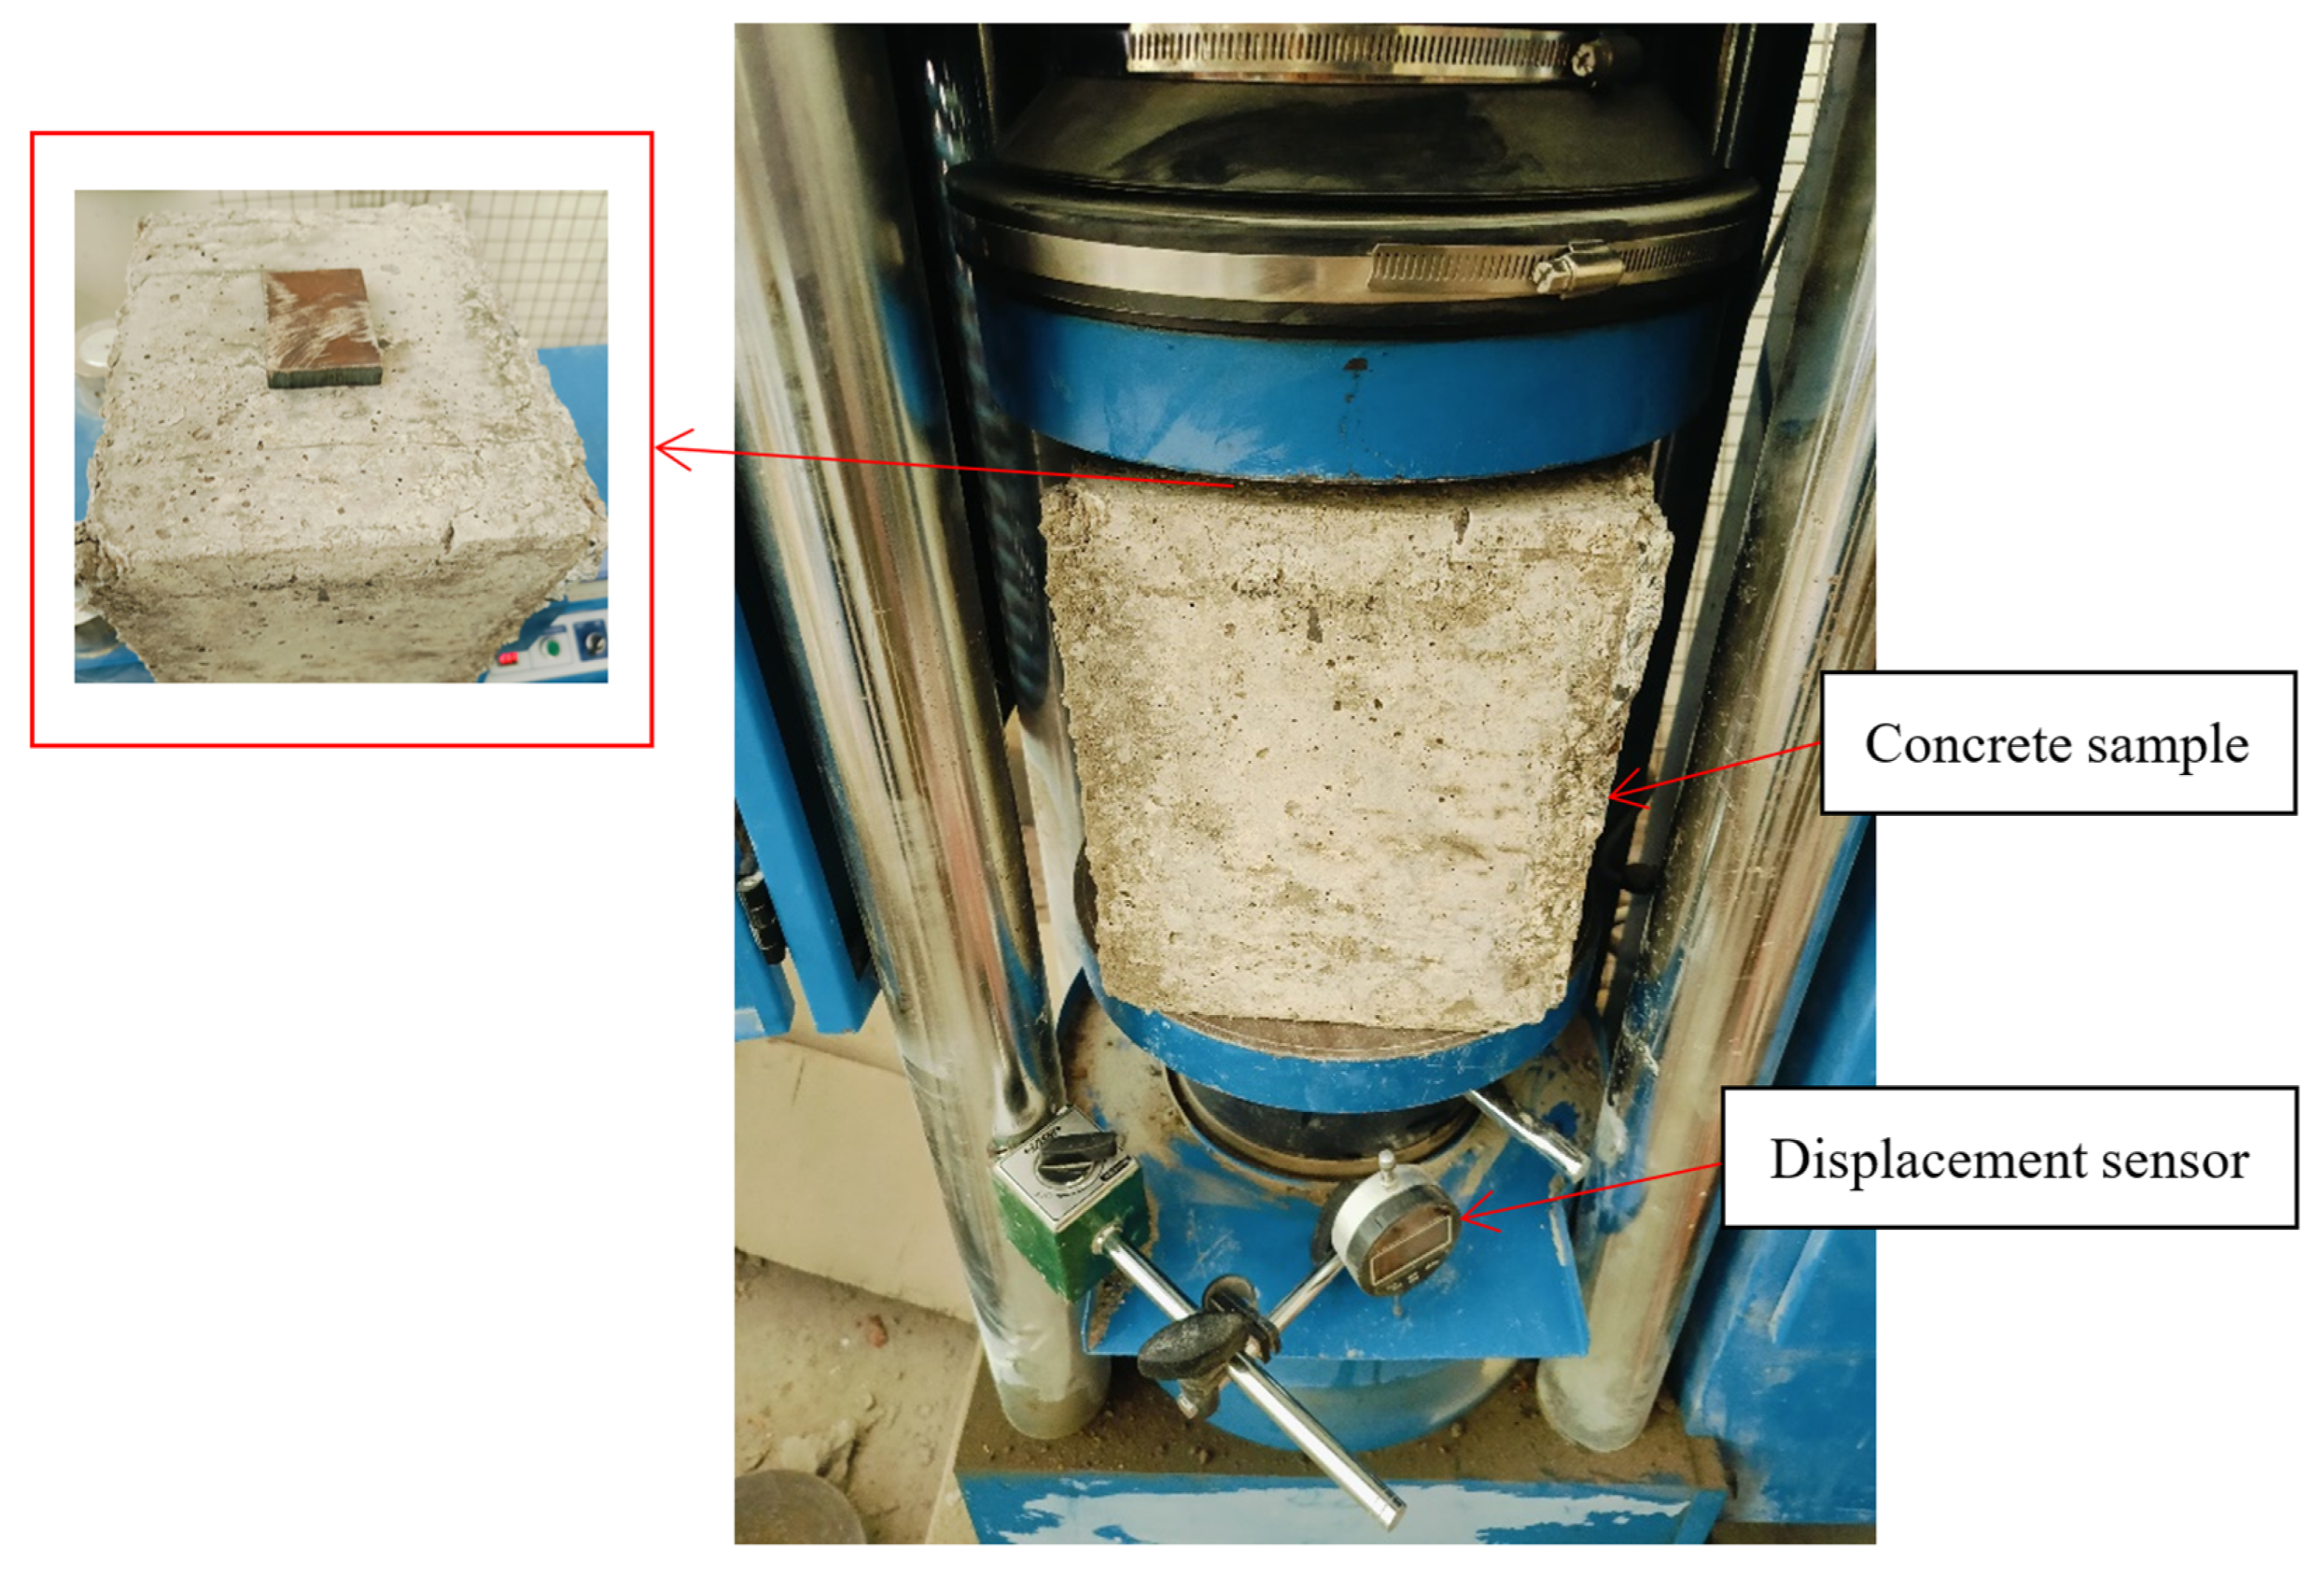
As seen in Figure 3, local pressure was applied to the top surface of the concrete samples using a compression testing machine with a 2000 kN capacity. A displacement gauge recorded the bearing plate’s penetration (slip) into the top surface of the concrete sample, while the device simultaneously measured the applied load. In connection with the applied load (P), the amount of slip beneath the bearing plate (δ) was noted. Additionally, cracks were observed and recorded during testing. To avoid loading misalignment and sample fabrication errors, the bearing plate was precisely located on the surface of the sample. The sample was also positioned consistently between the jaws of the testing machine every time.
Figure 3.
Concrete sample subjected to local pressure.
3. Test Results and Analysis
3.1. Cracks of Concrete Samples
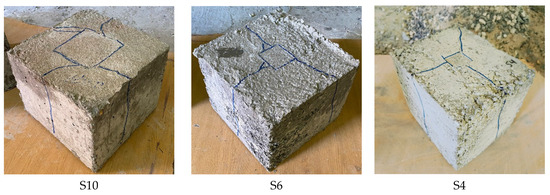
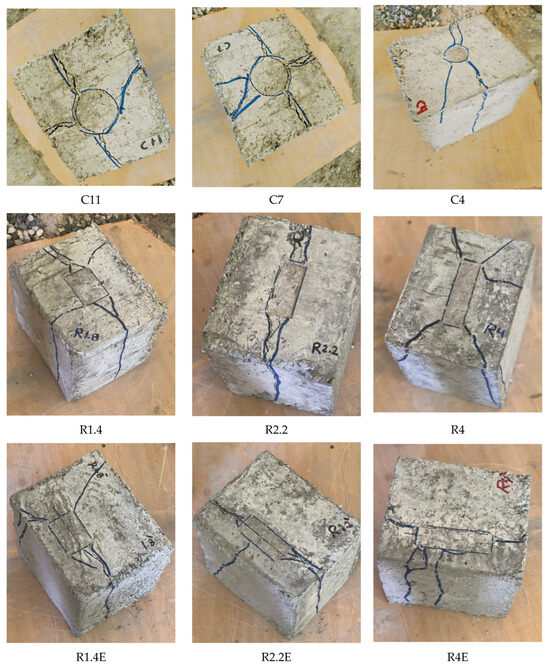
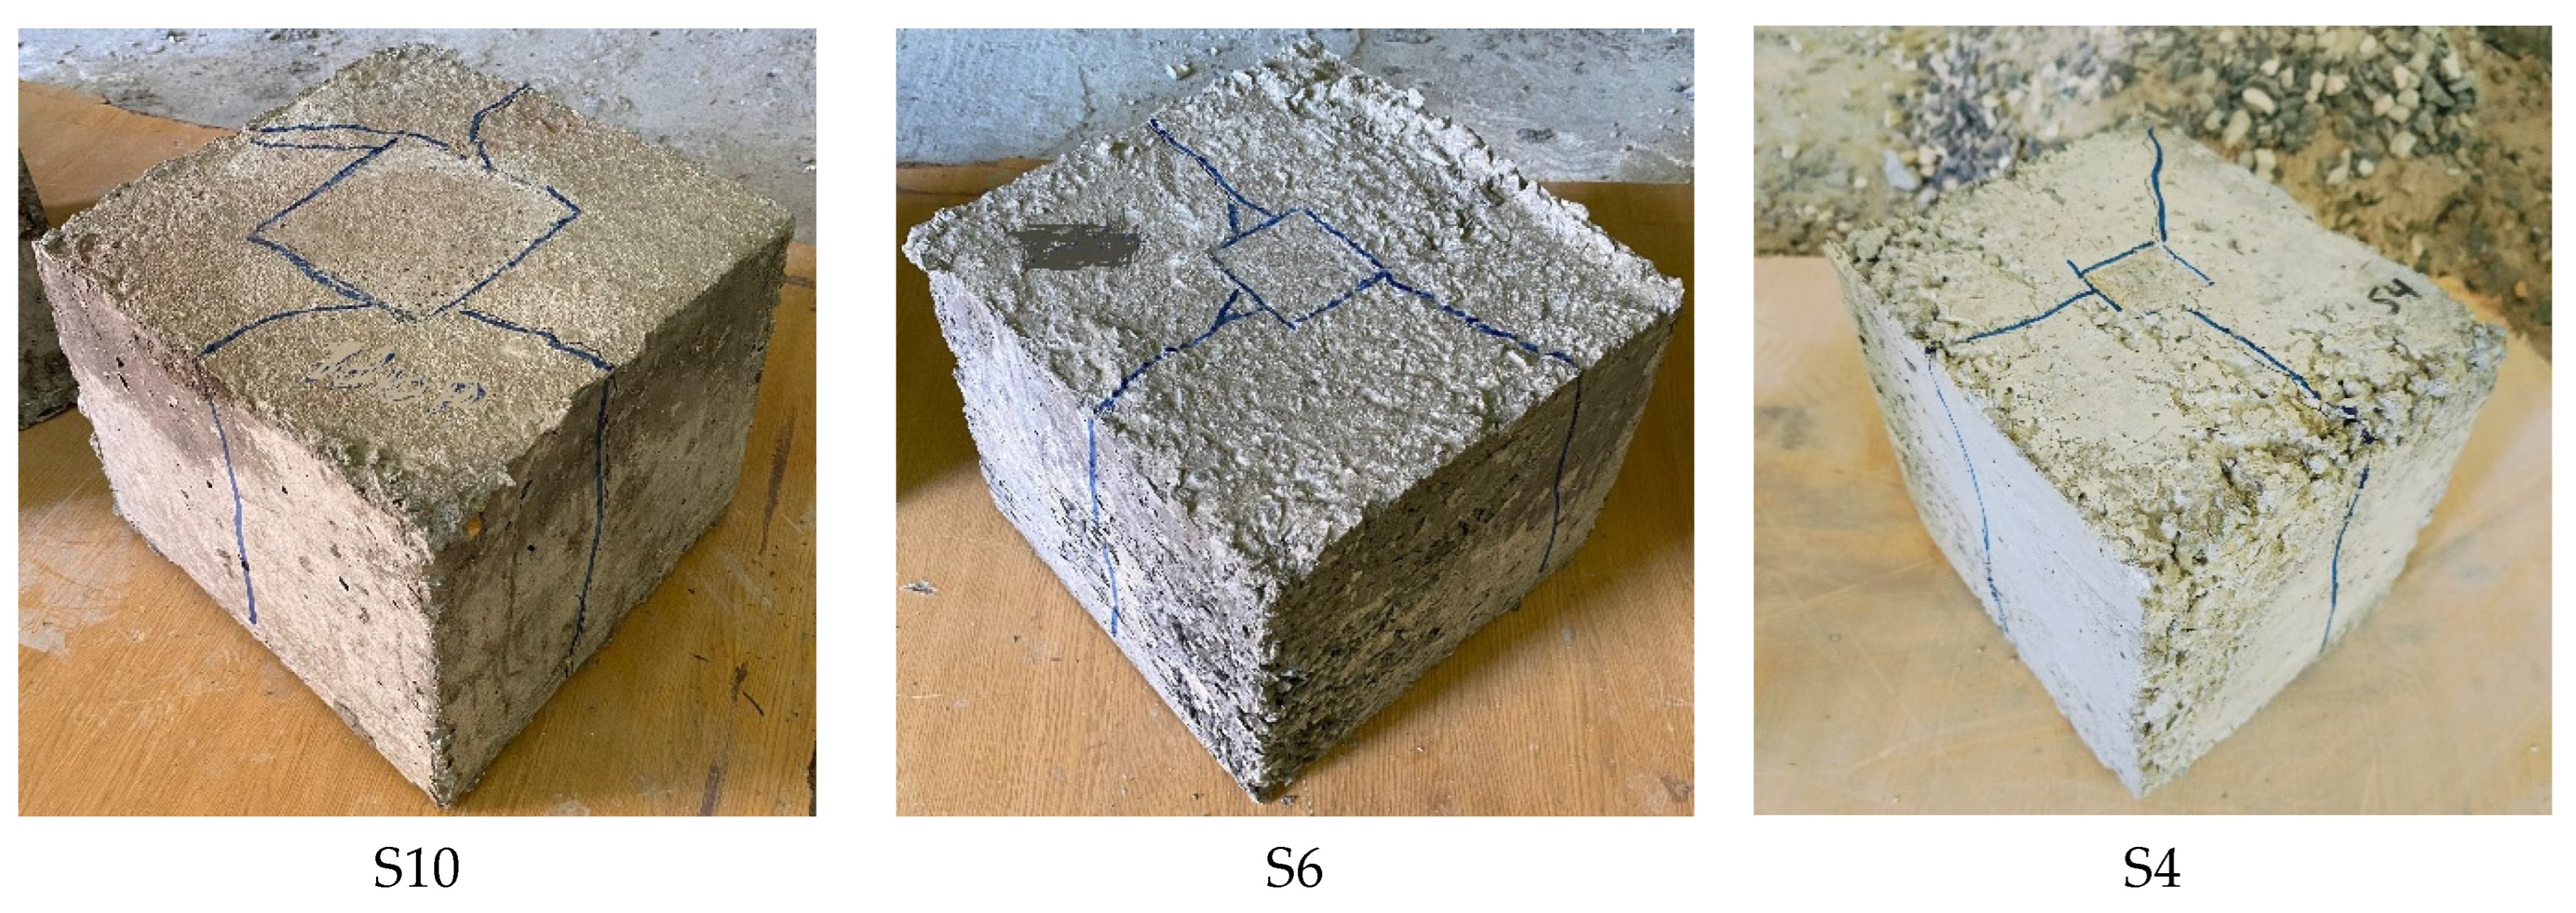
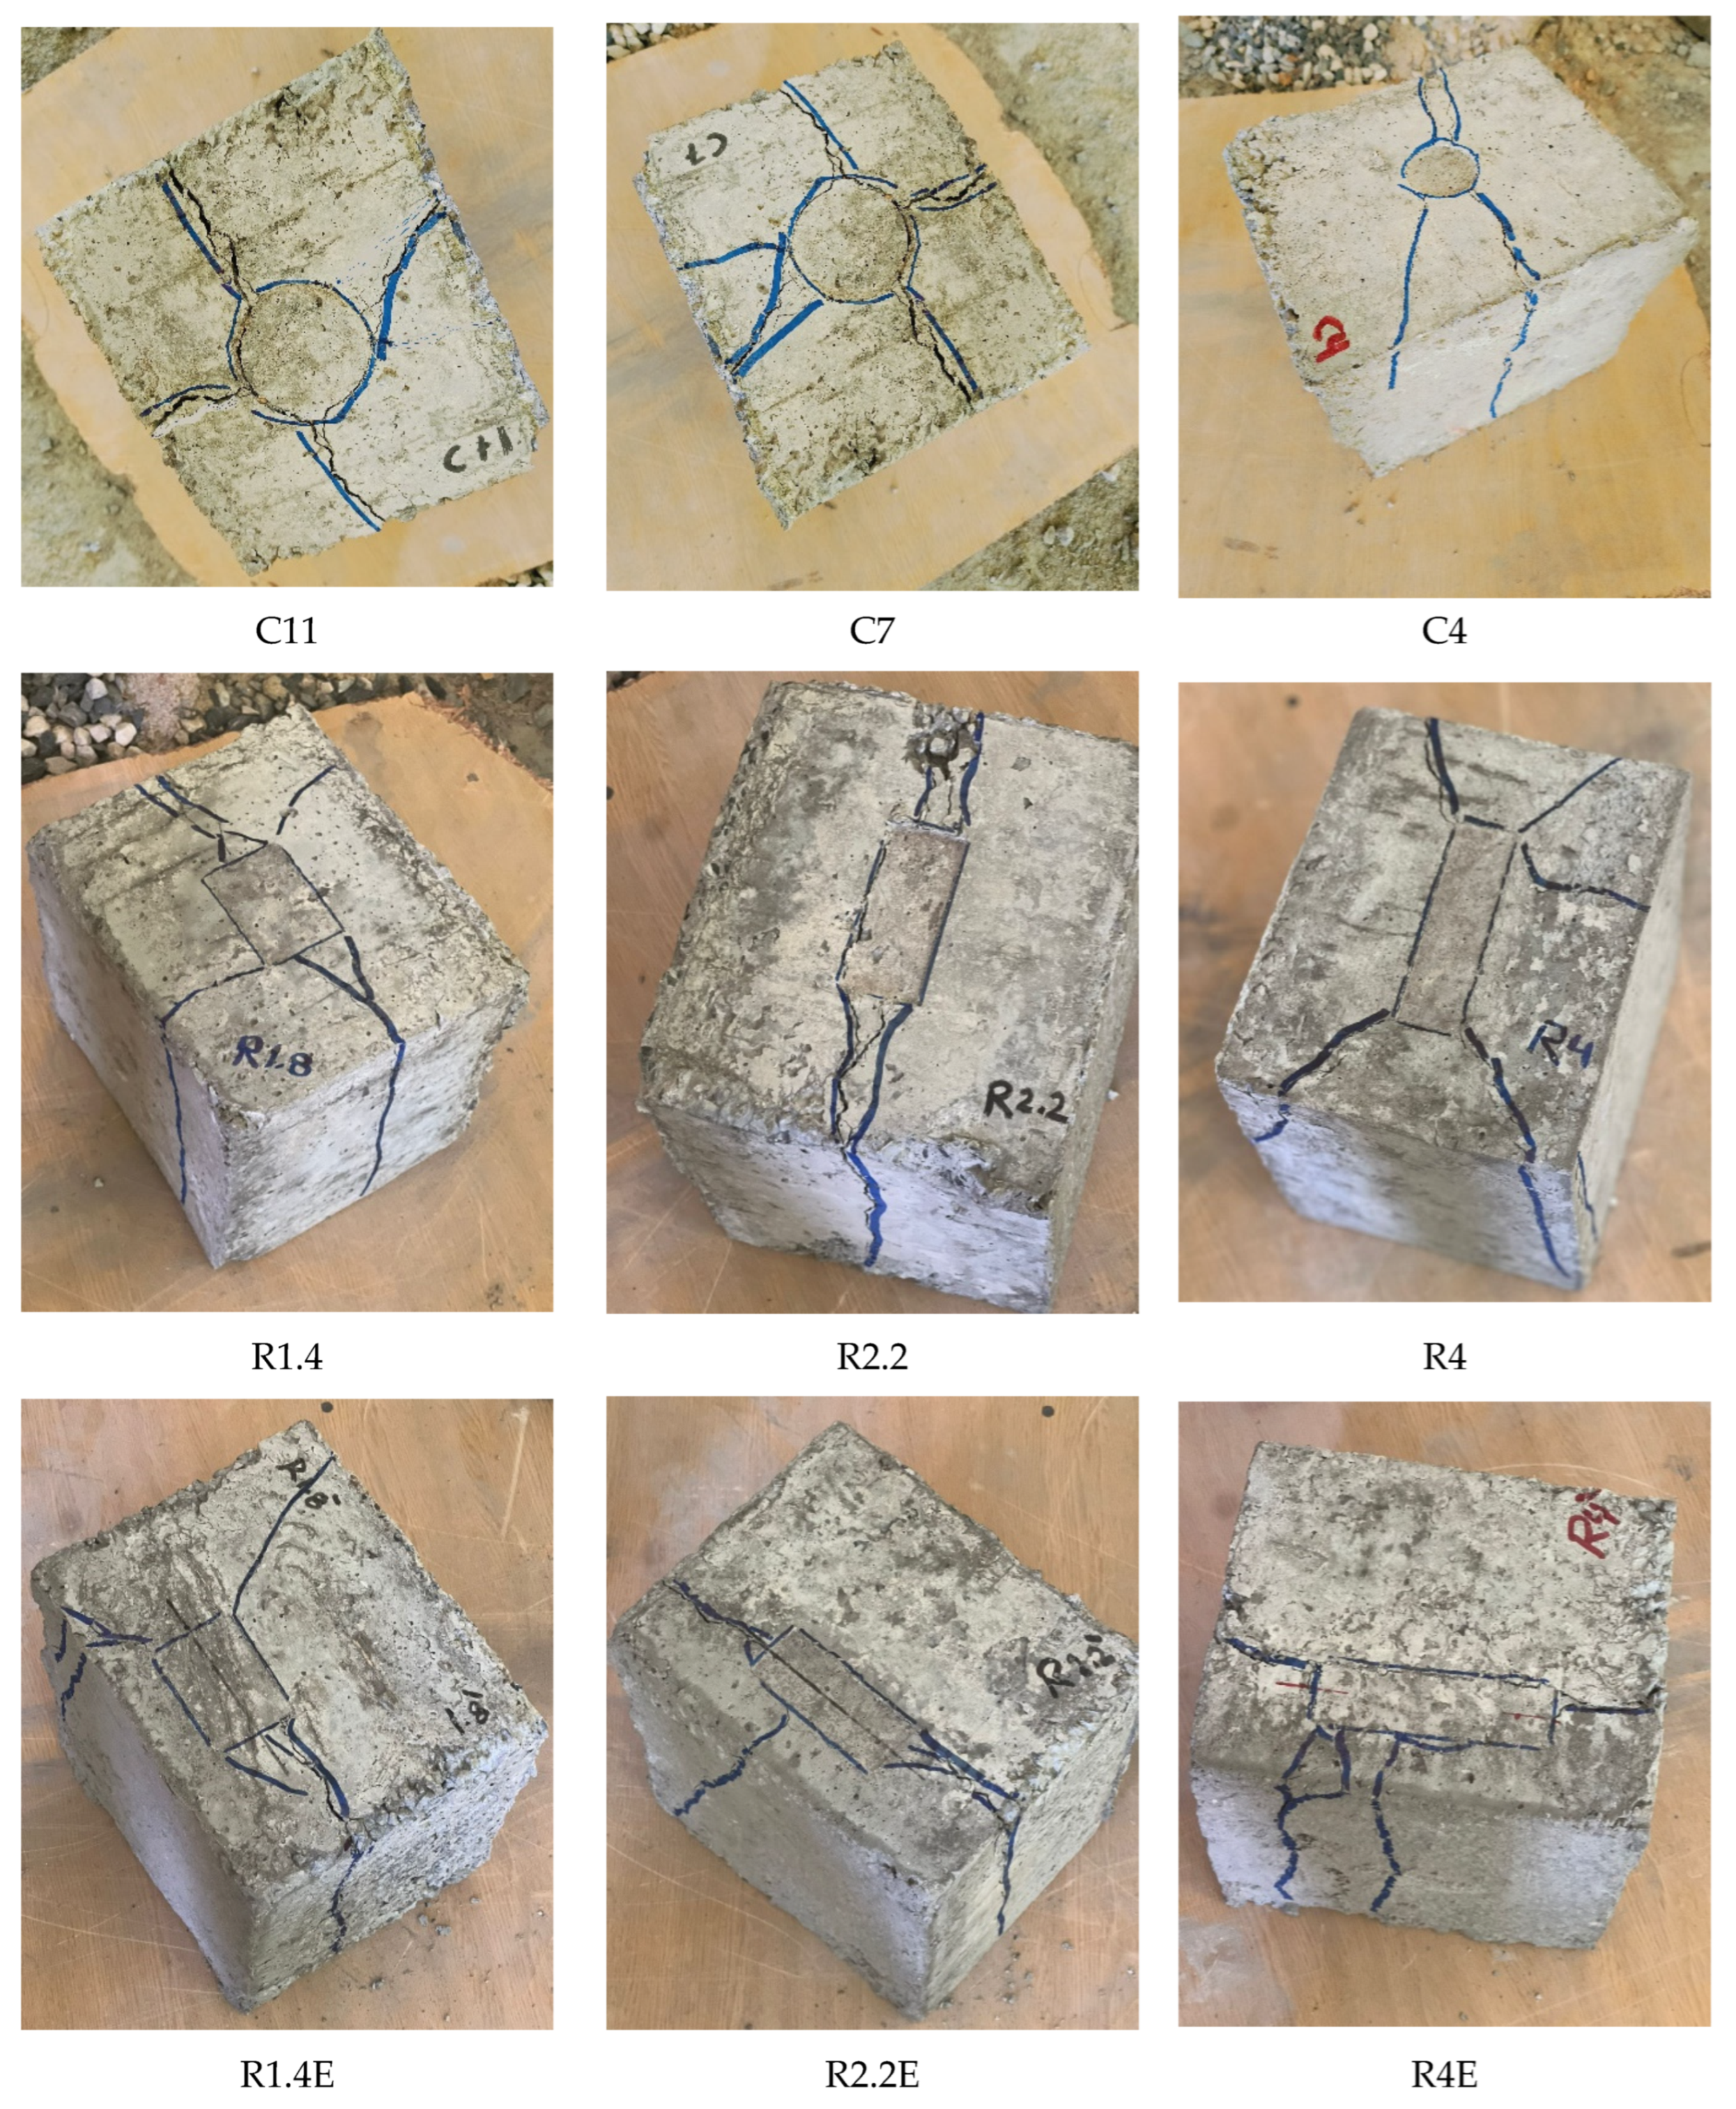
The usual mechanisms of failure for each tested sample under local compression are shown in Figure 4. The first crack started vertically on the side of the sample in the upper part. As the load continued to increase, the crack moved to the upper surface, reaching the edges of the bearing plate. Similar cracks appeared on all sides and the top surface of the sample. These cracks began to open as the bearing plate was lowered further, and then the sample suddenly broke. On the other hand, it was found during testing that the failure modes involved a localized damage pattern, which could be observed on the upper surface of the samples at the outer boundary of the locally compressed region. The sides of the samples developed many vertical cracks. In addition to the surface, the samples exhibited vertical fractures on their sides, and some of the surface cracks widened into vertical fissures. The bearing plate pierced the top surface of the samples in all cases, with the surface fracture width of nearly all samples being about 2 mm. The slippage was more noticeable in a small section of the bearing plate.
Figure 4.
Failure modes of samples under loads.
3.2. Stress–Slip Relationship
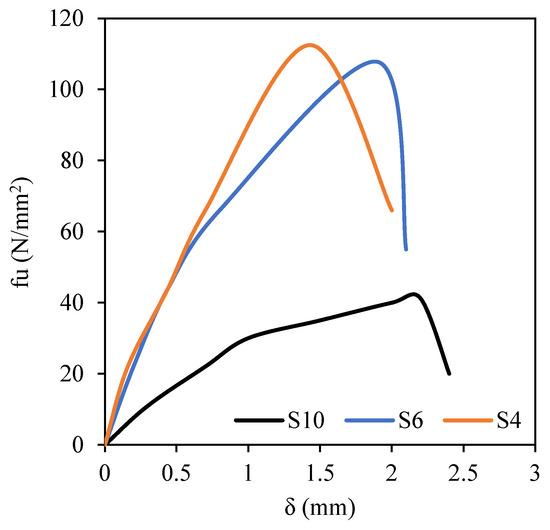
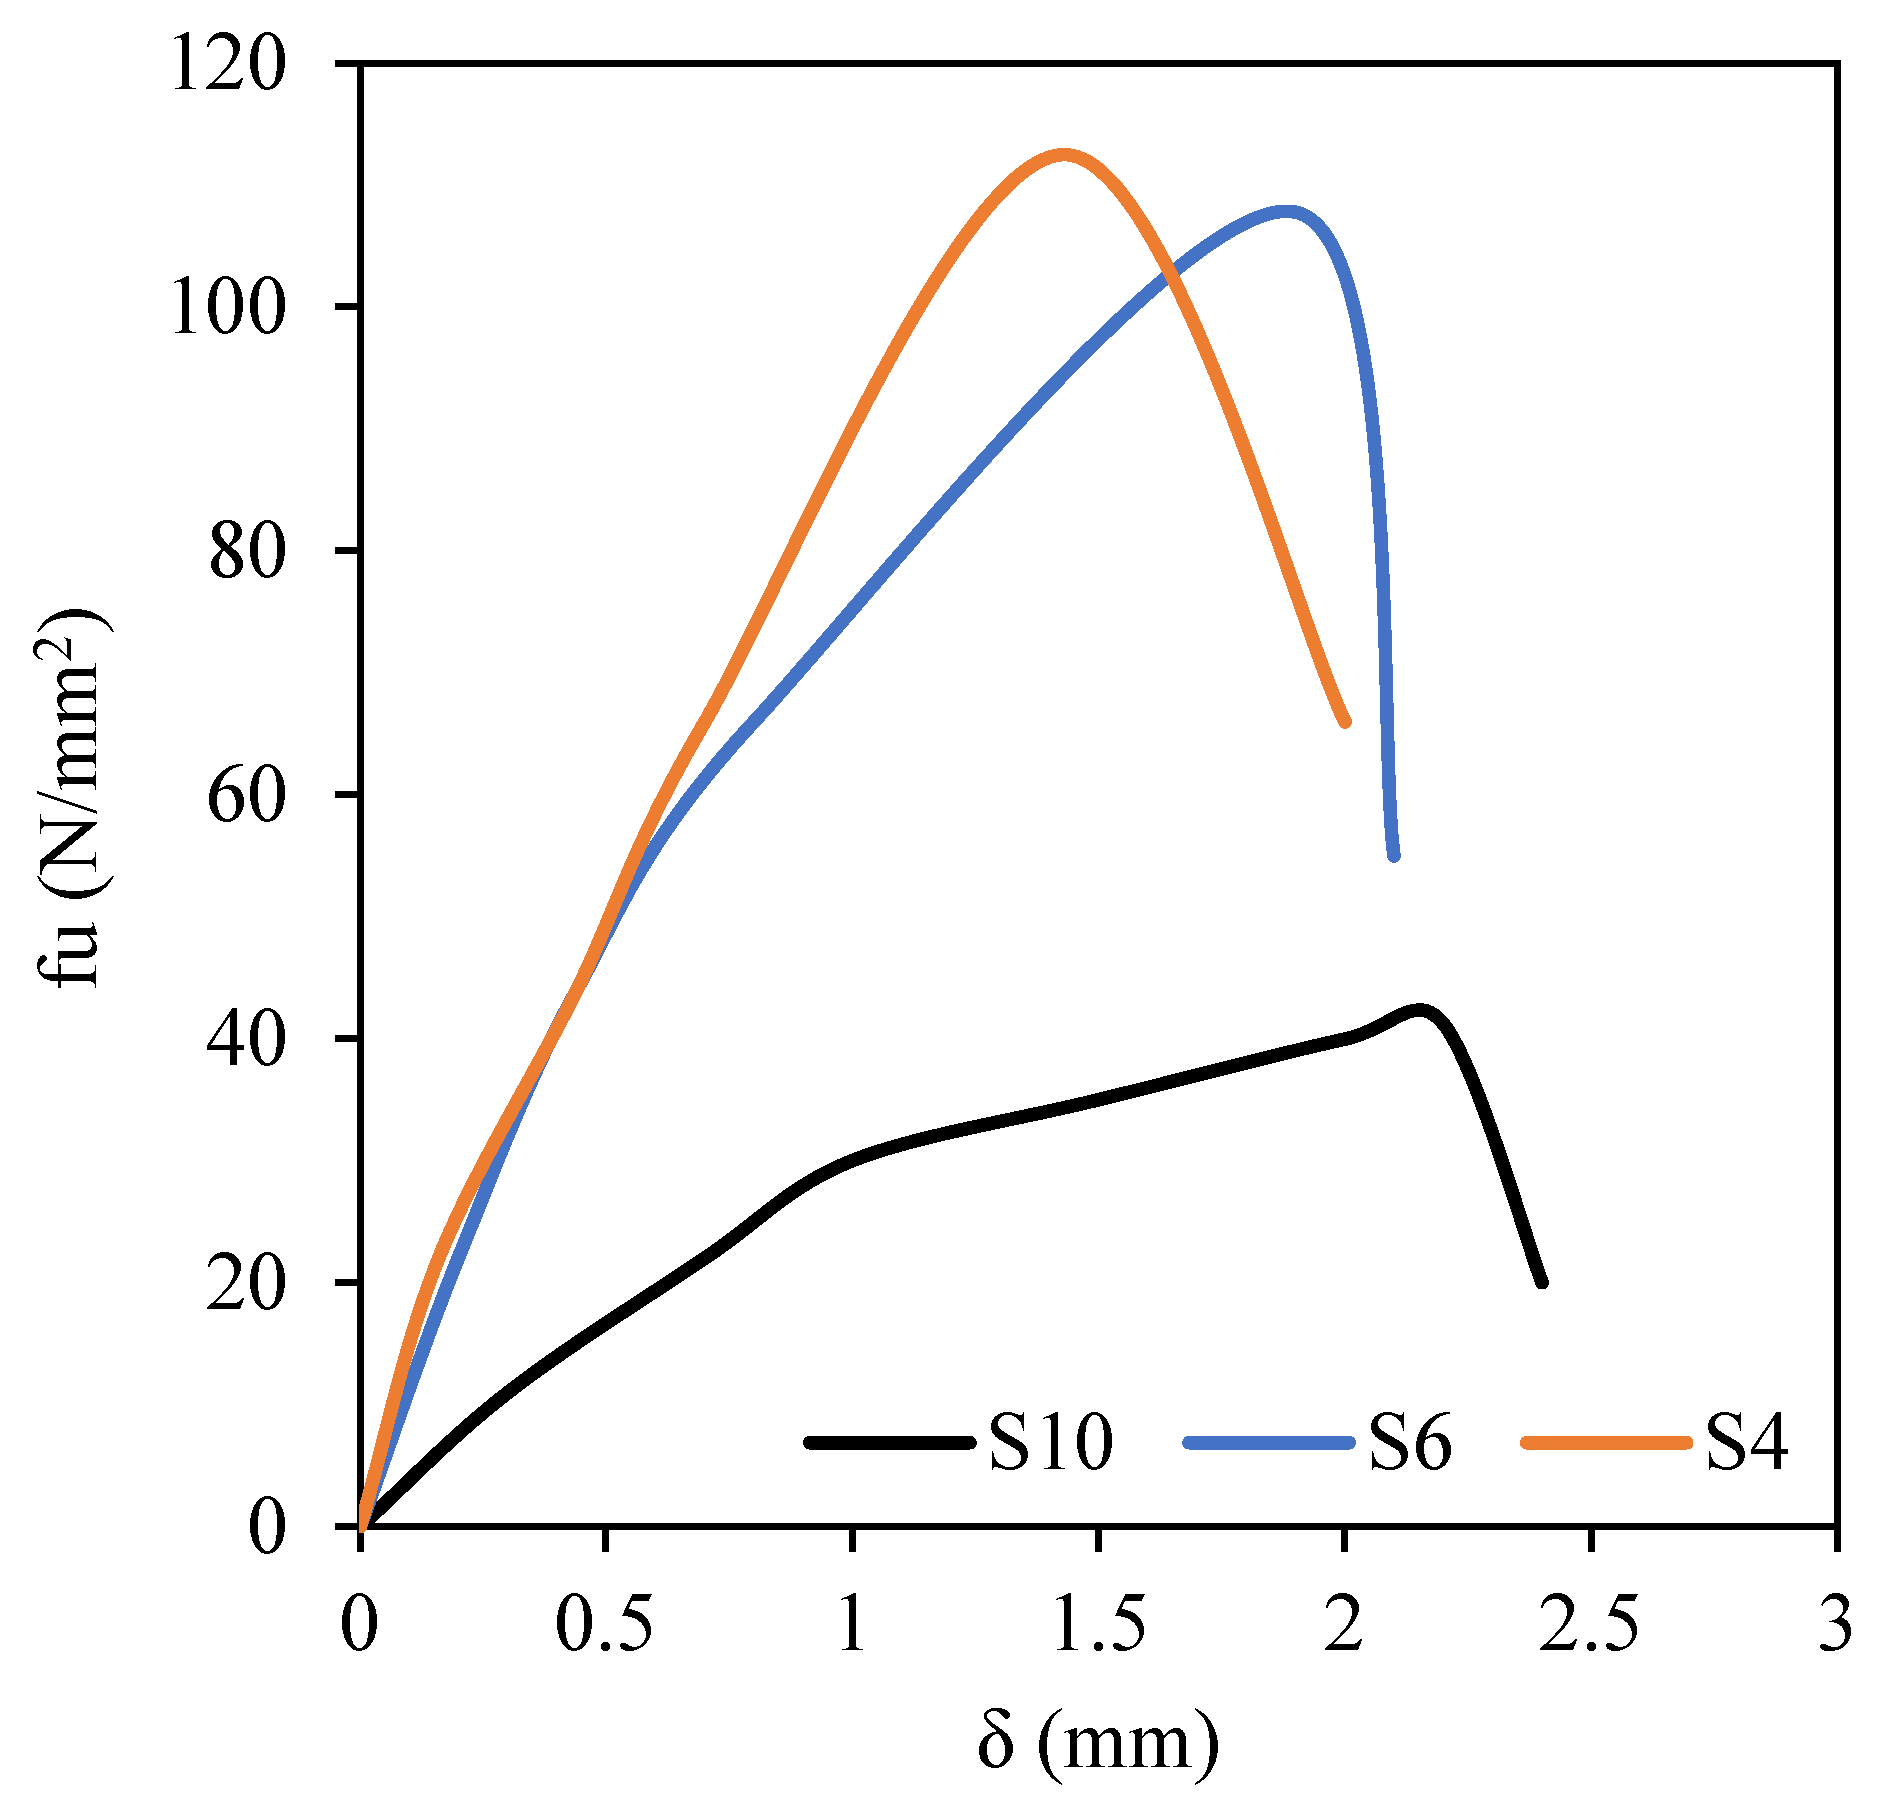
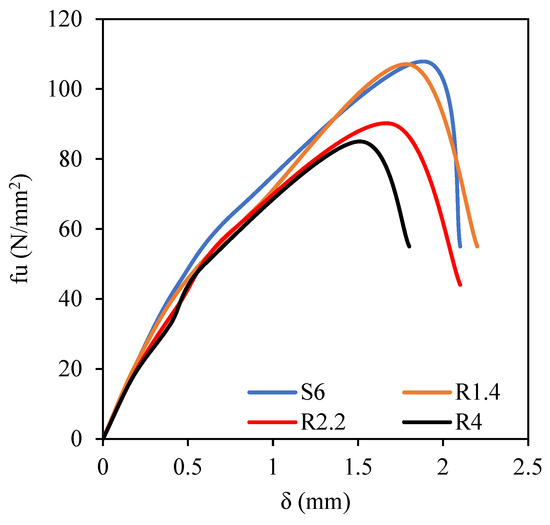
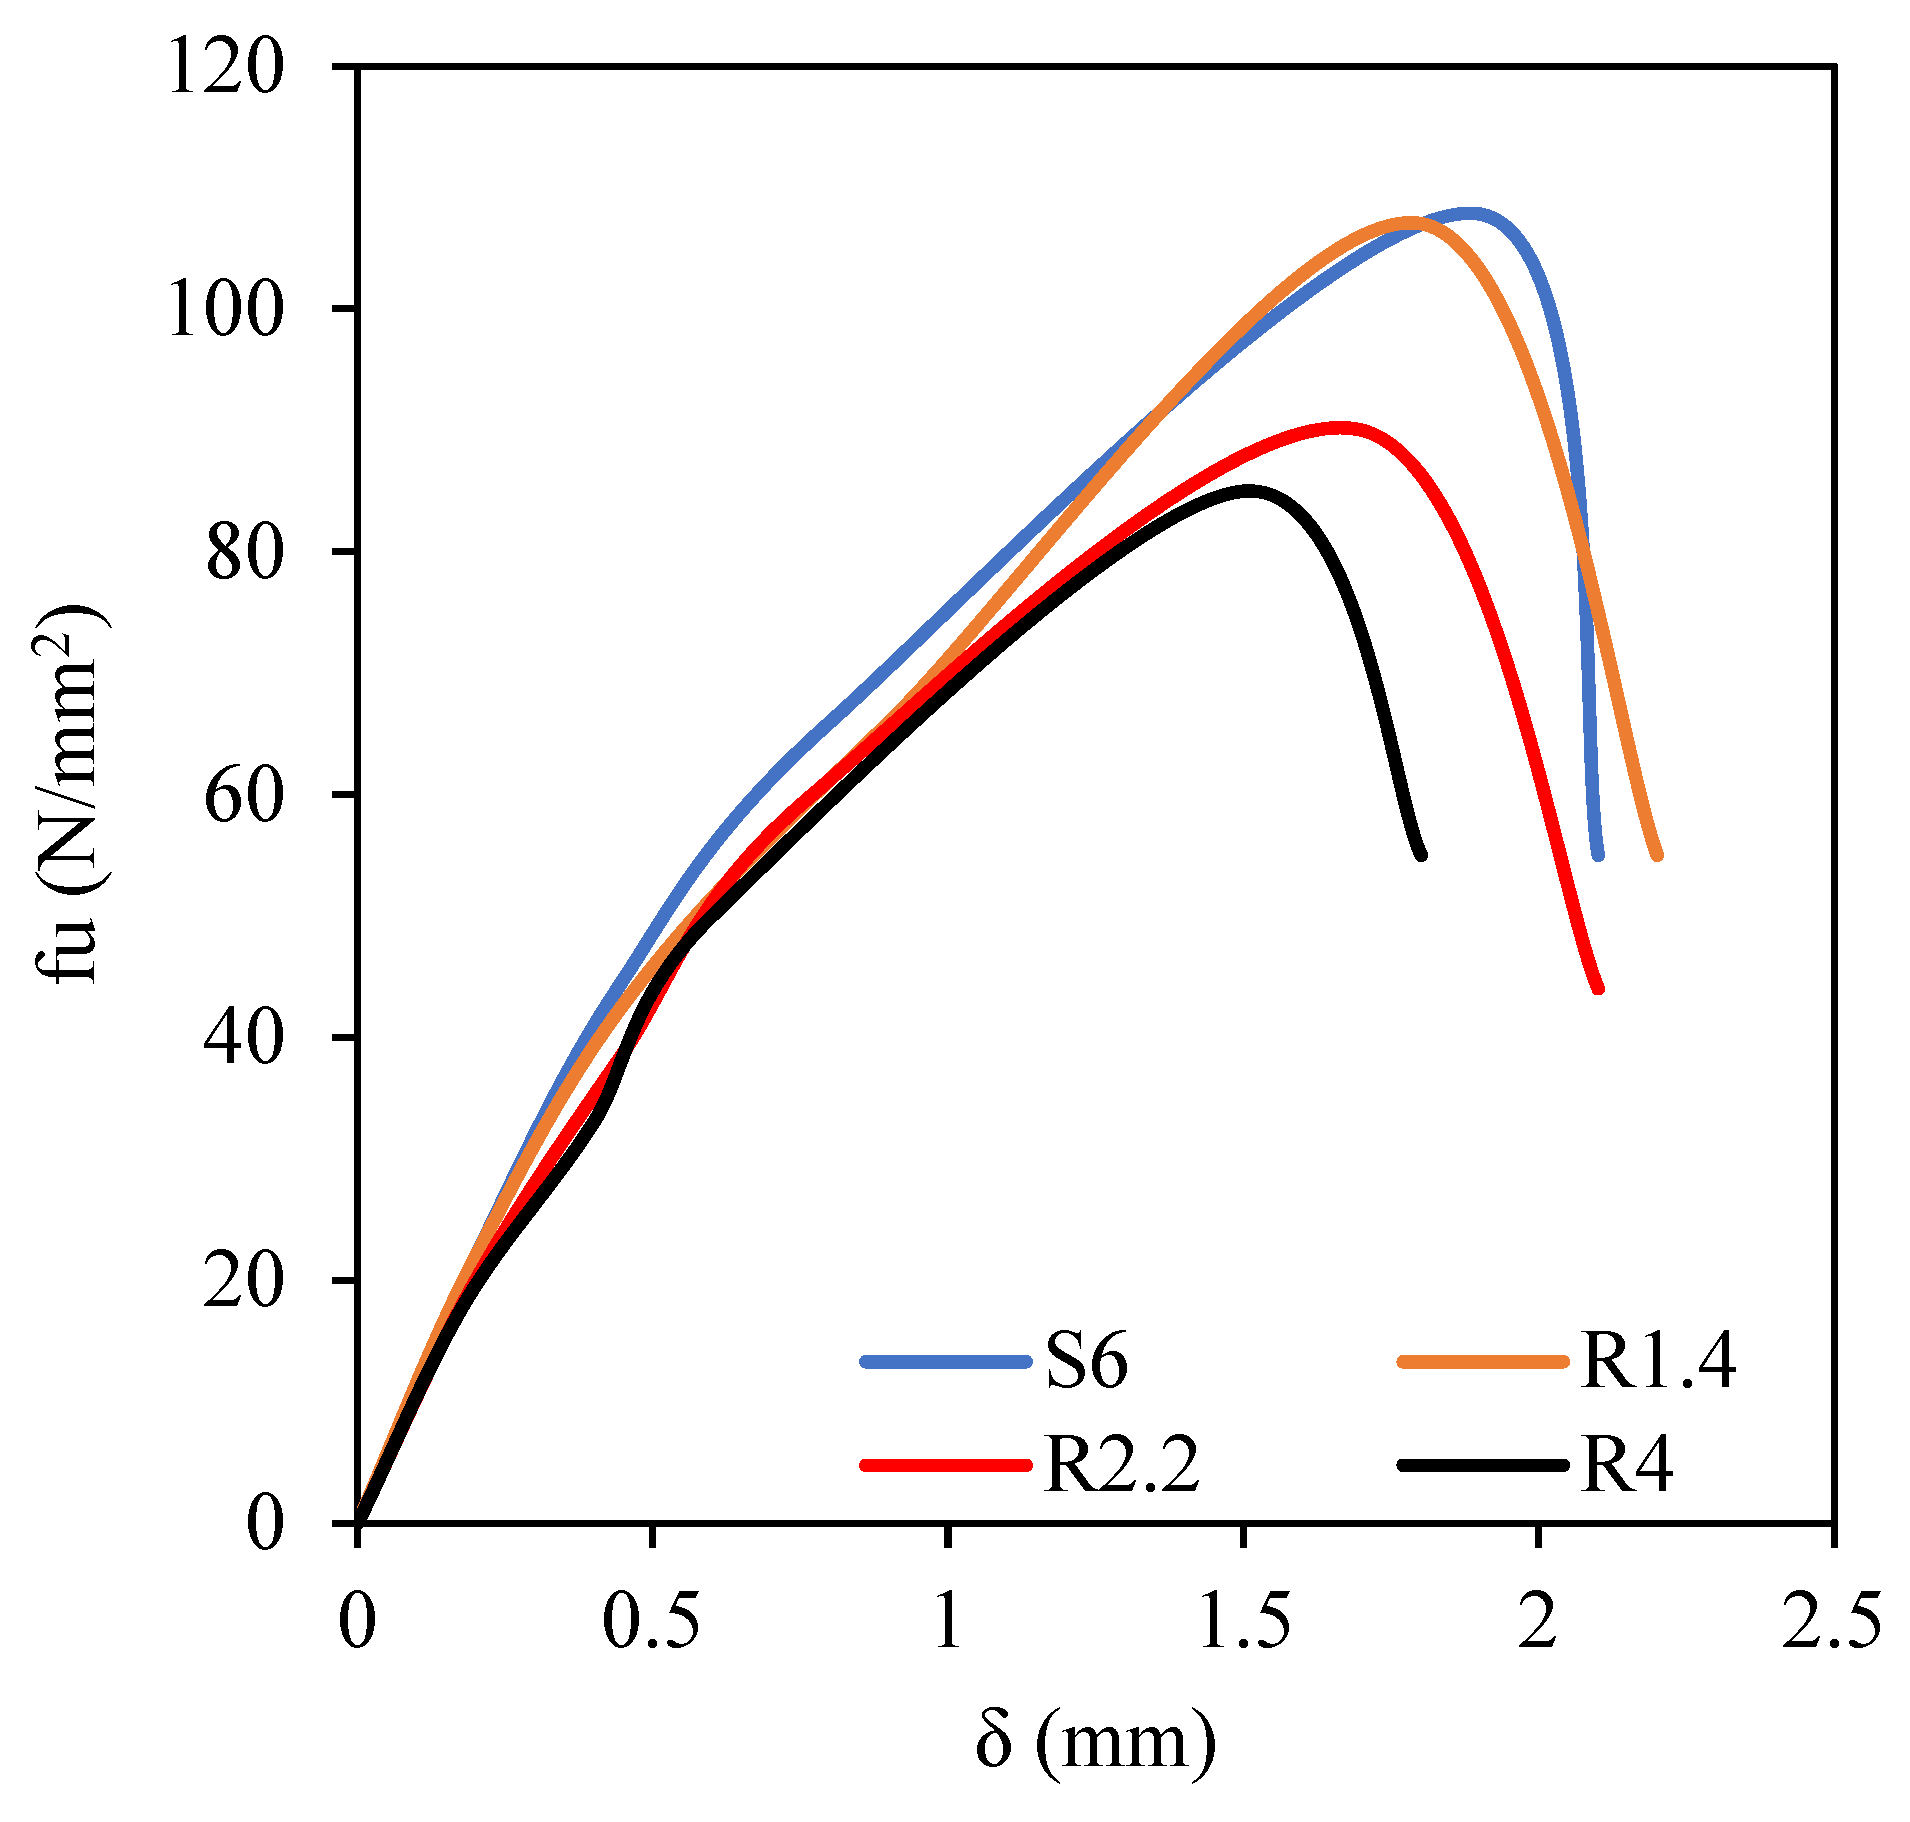
Bearing stress (f) was estimated by dividing the applied load by the area of the bearing plate. Slip (δ) was the penetration of the bearing plate into the upper surface of the concrete sample. Bearing stress–slip (f–δ) curves of the tested samples are presented in Figure 5, Figure 6, Figure 7, Figure 8 and Figure 9. In general, the curves were divided into four stages. The first stage was linear and occurred prior to 30% of the ultimate stress (fu). This stage was the most stable of the four, as the stress escalated quickly without a noticeable increase in the penetration of the bearing plate into the concrete sample. At this stage, the concrete strain was very small, as no crack occurred, and thus the sample’s collapse was not noticeable. Additionally, the first stage was characterized by a steep and rapidly increasing curve. This means that bearing stress rose steeply. The hardening of the contact surfaces between the bearing plate and the upper surface of the sample was the cause. The second stage was a linear increase (30–80% fu). This stage was after cracking, where the concrete strain grew, plate slip developed, and bearing stress growth was reduced. The boundary between the inner concrete under the plate and the surrounding concrete began to manifest in the second stage, and while the load increased rapidly, the deformation progressed more slowly. The third stage was a nonlinear rise (80–100% fu), and the decreasing branch (beyond fu) formed the fourth phase. The main type of deformation was elastic compressive deformation. This period corresponded to the service stage. After that, the load–displacement curve transformed into a nonlinear rising form, causing irreversible damage to the sample, rapid crack development, enhanced lateral deformation in the top part of the sample, and the gradual formation of a wedge pyramid that slid downward.
Figure 5.
Effect of increasing area of square bearing plate (L = b = 100, 60, 40 mm) (GI) on f–δ curves.
Figure 6.
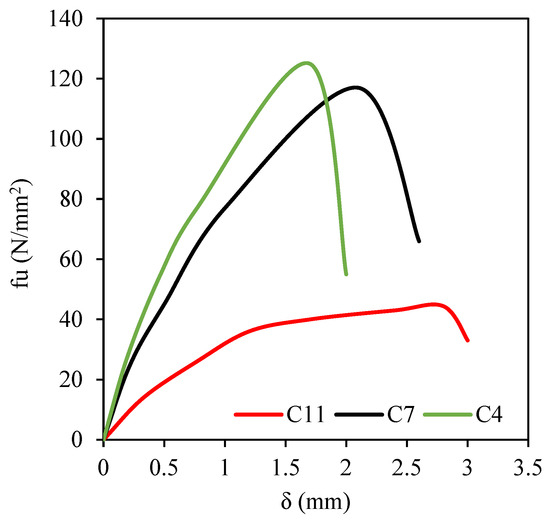
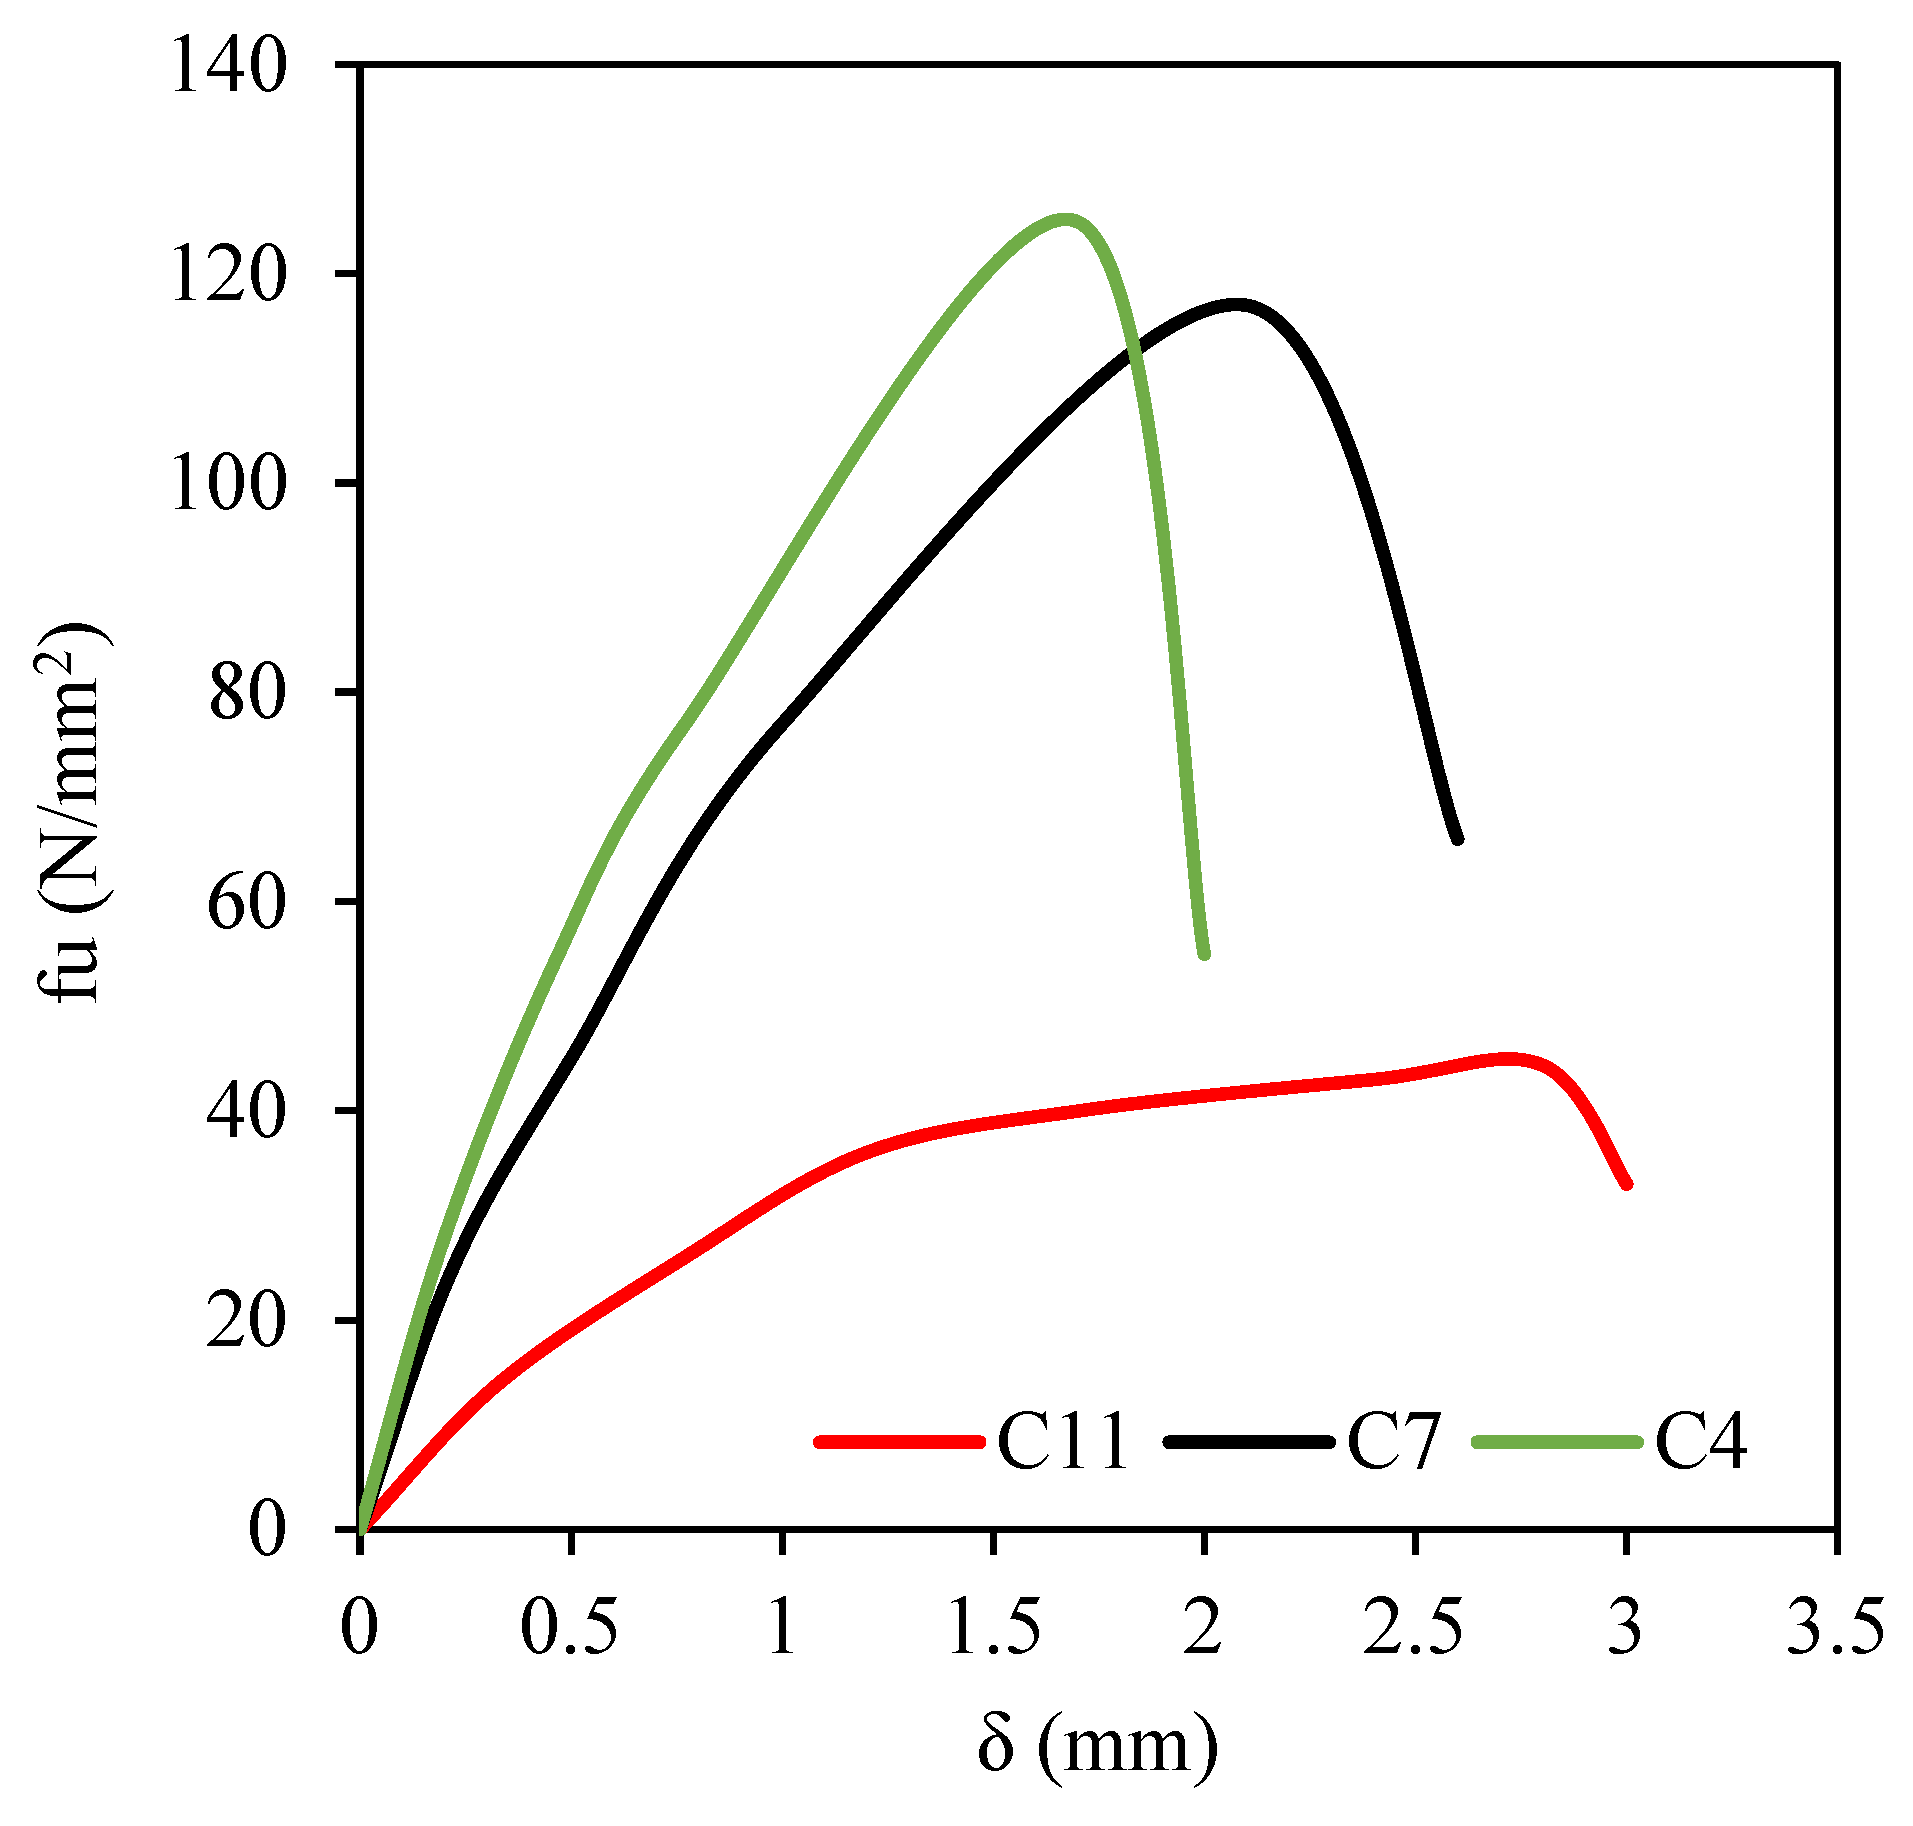
Effect of increasing area of circular bearing plate (dia. = 113, 68, 45 mm) (GII) on f–δ curves.
Figure 7.
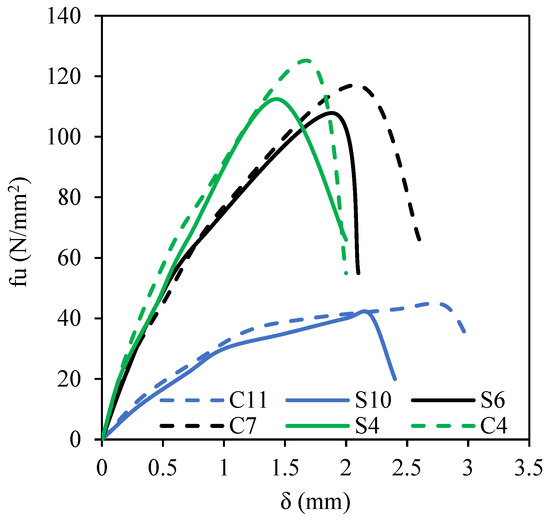
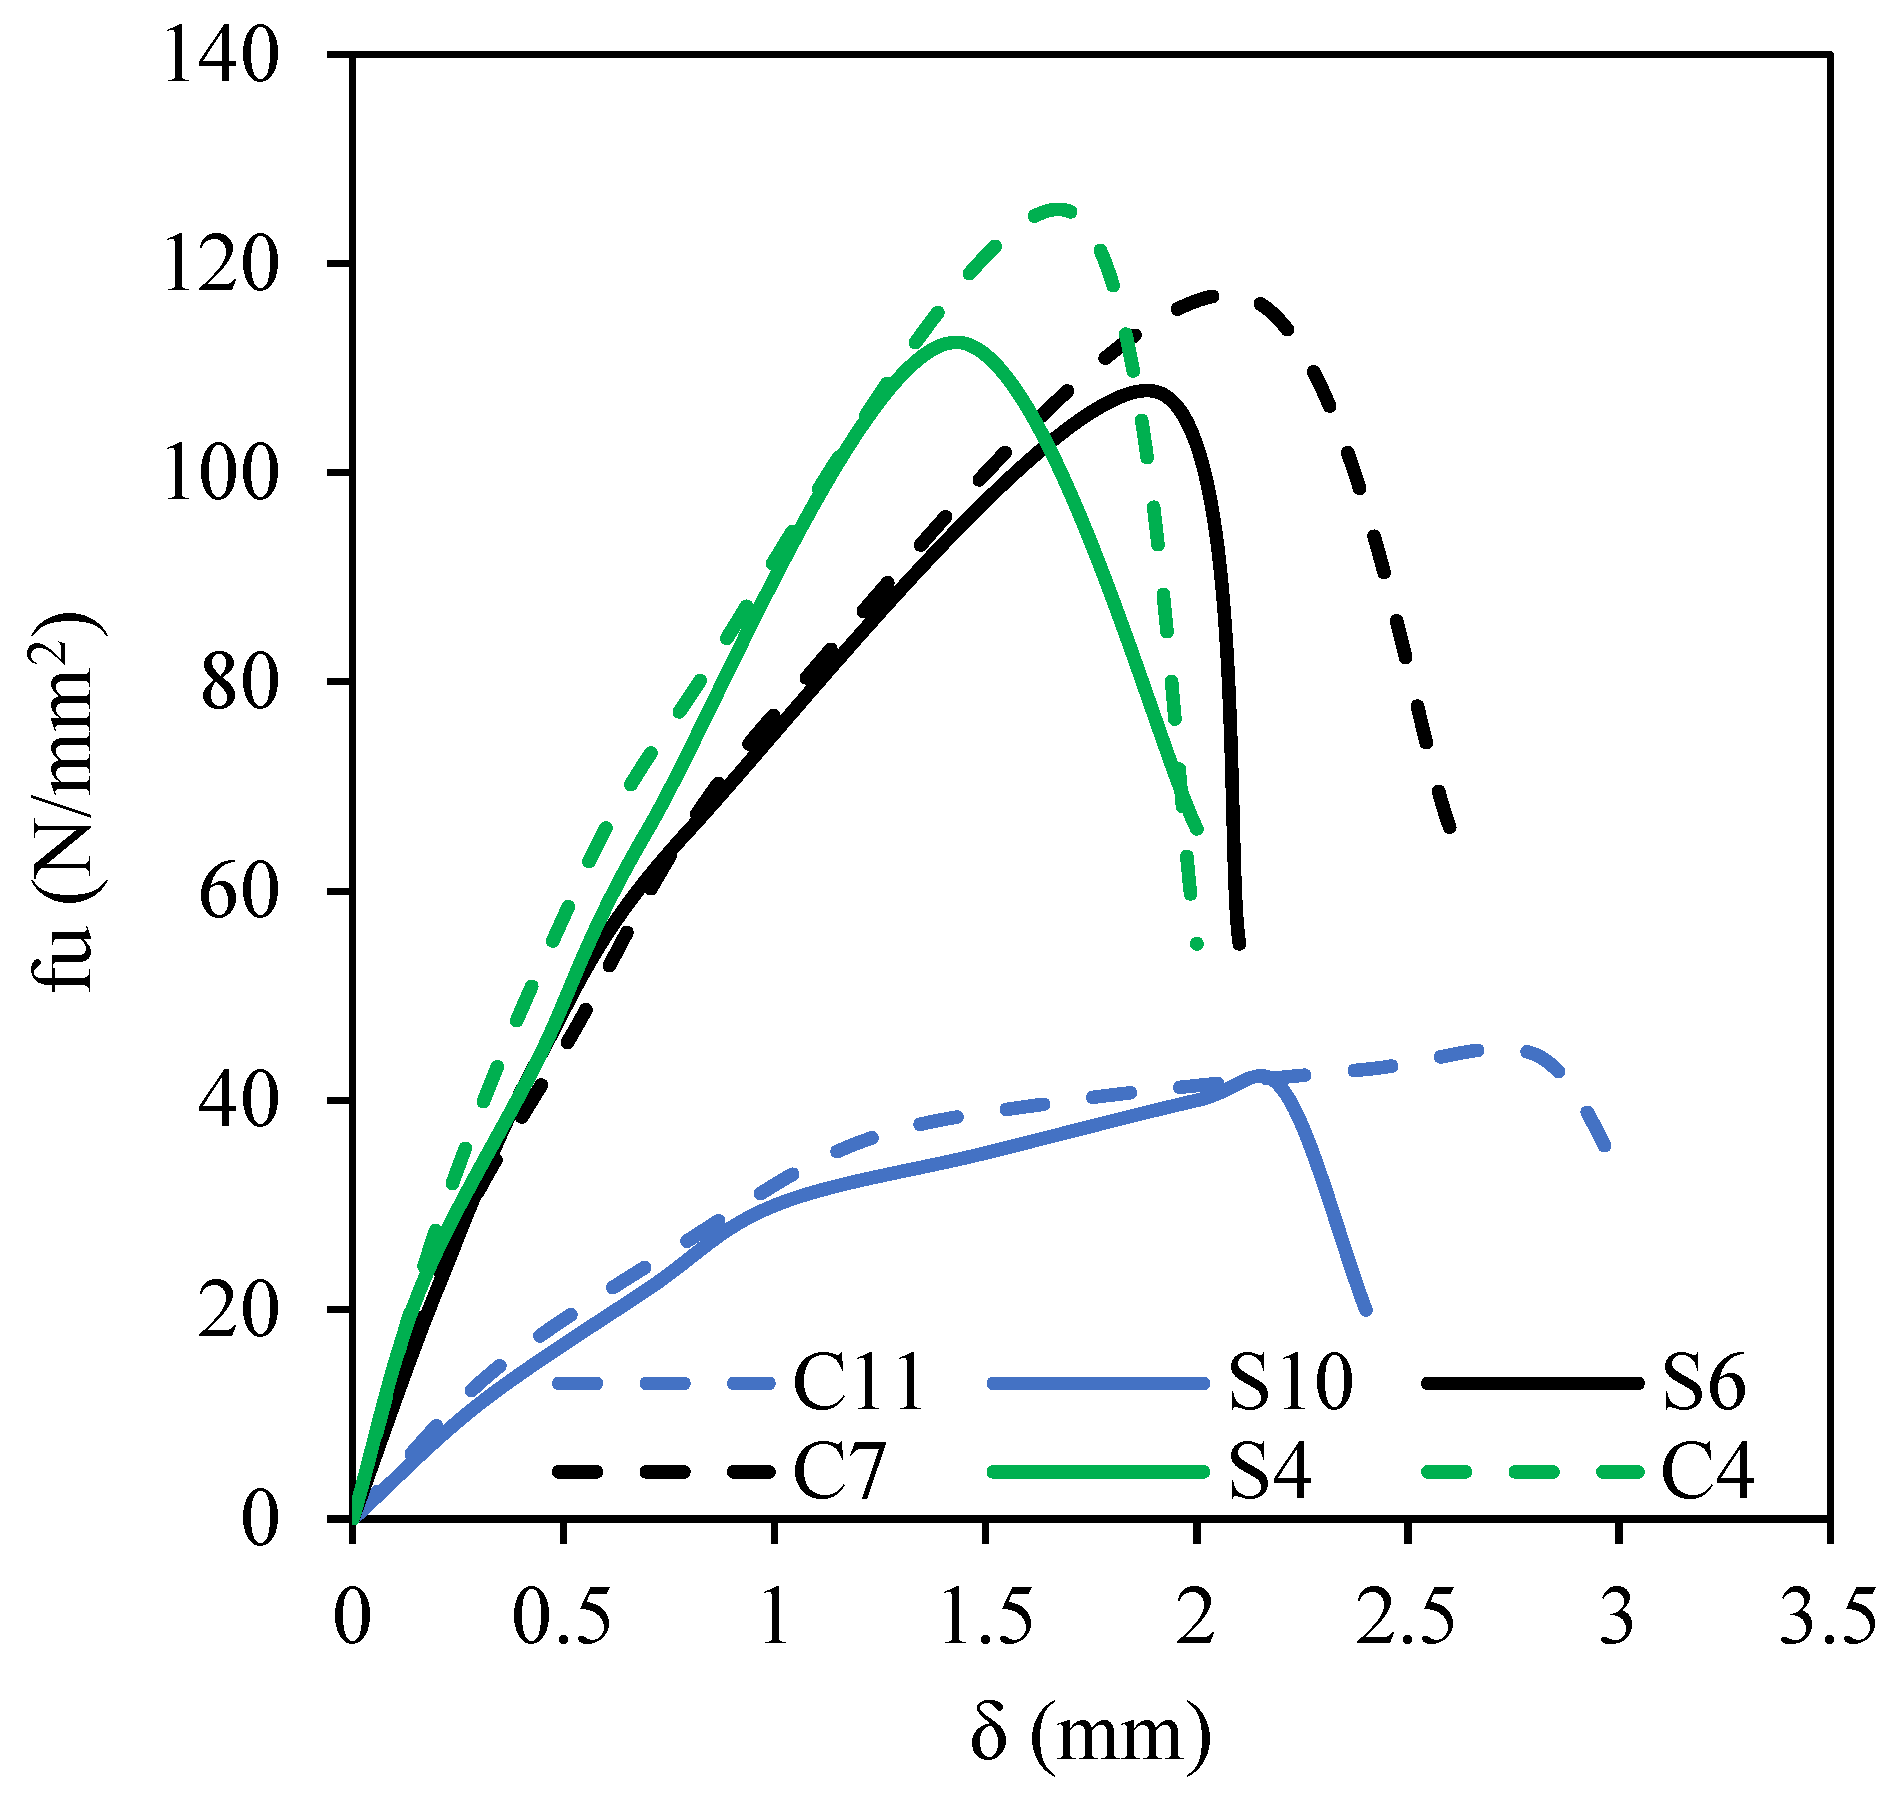
Effect of circular or square bearing plate shape on f–δ curves.
Figure 8.
Effect of rectangularity of bearing plate (r = 1, 1.4, 2.2, 4) (GIII) on f–δ curves.
Figure 9.
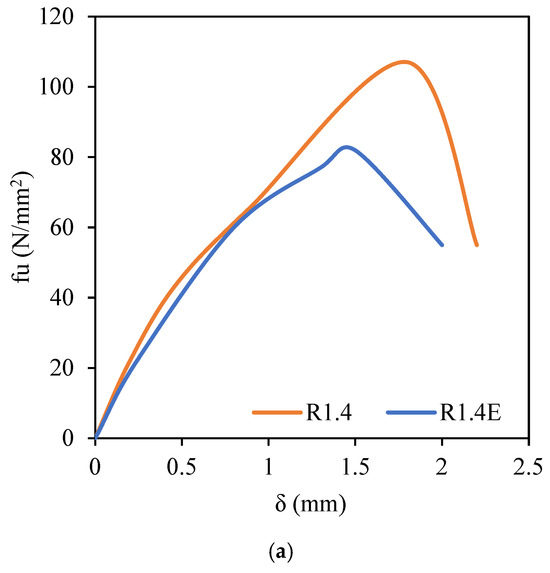
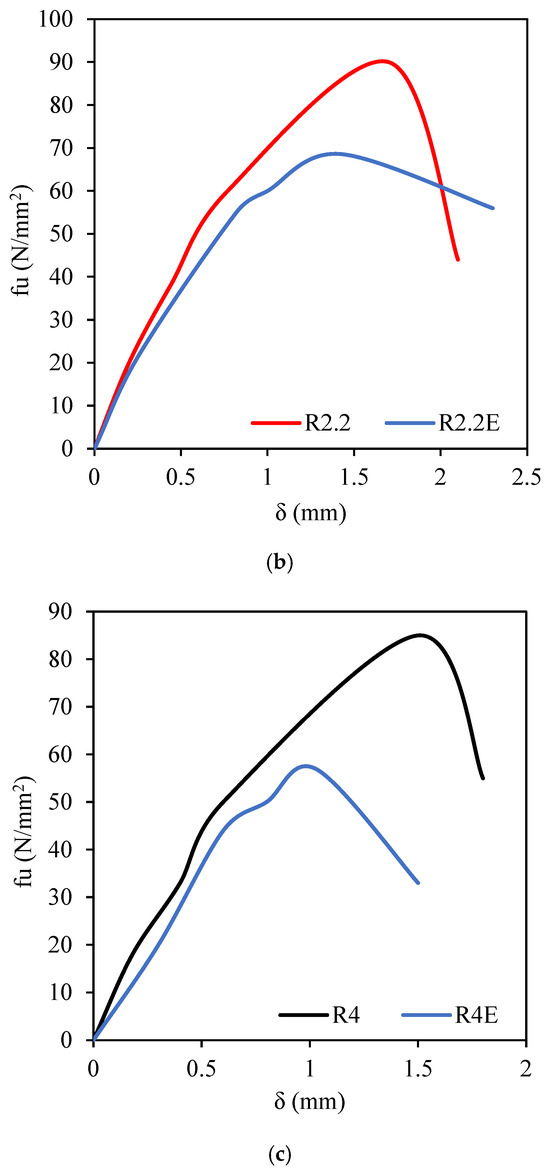
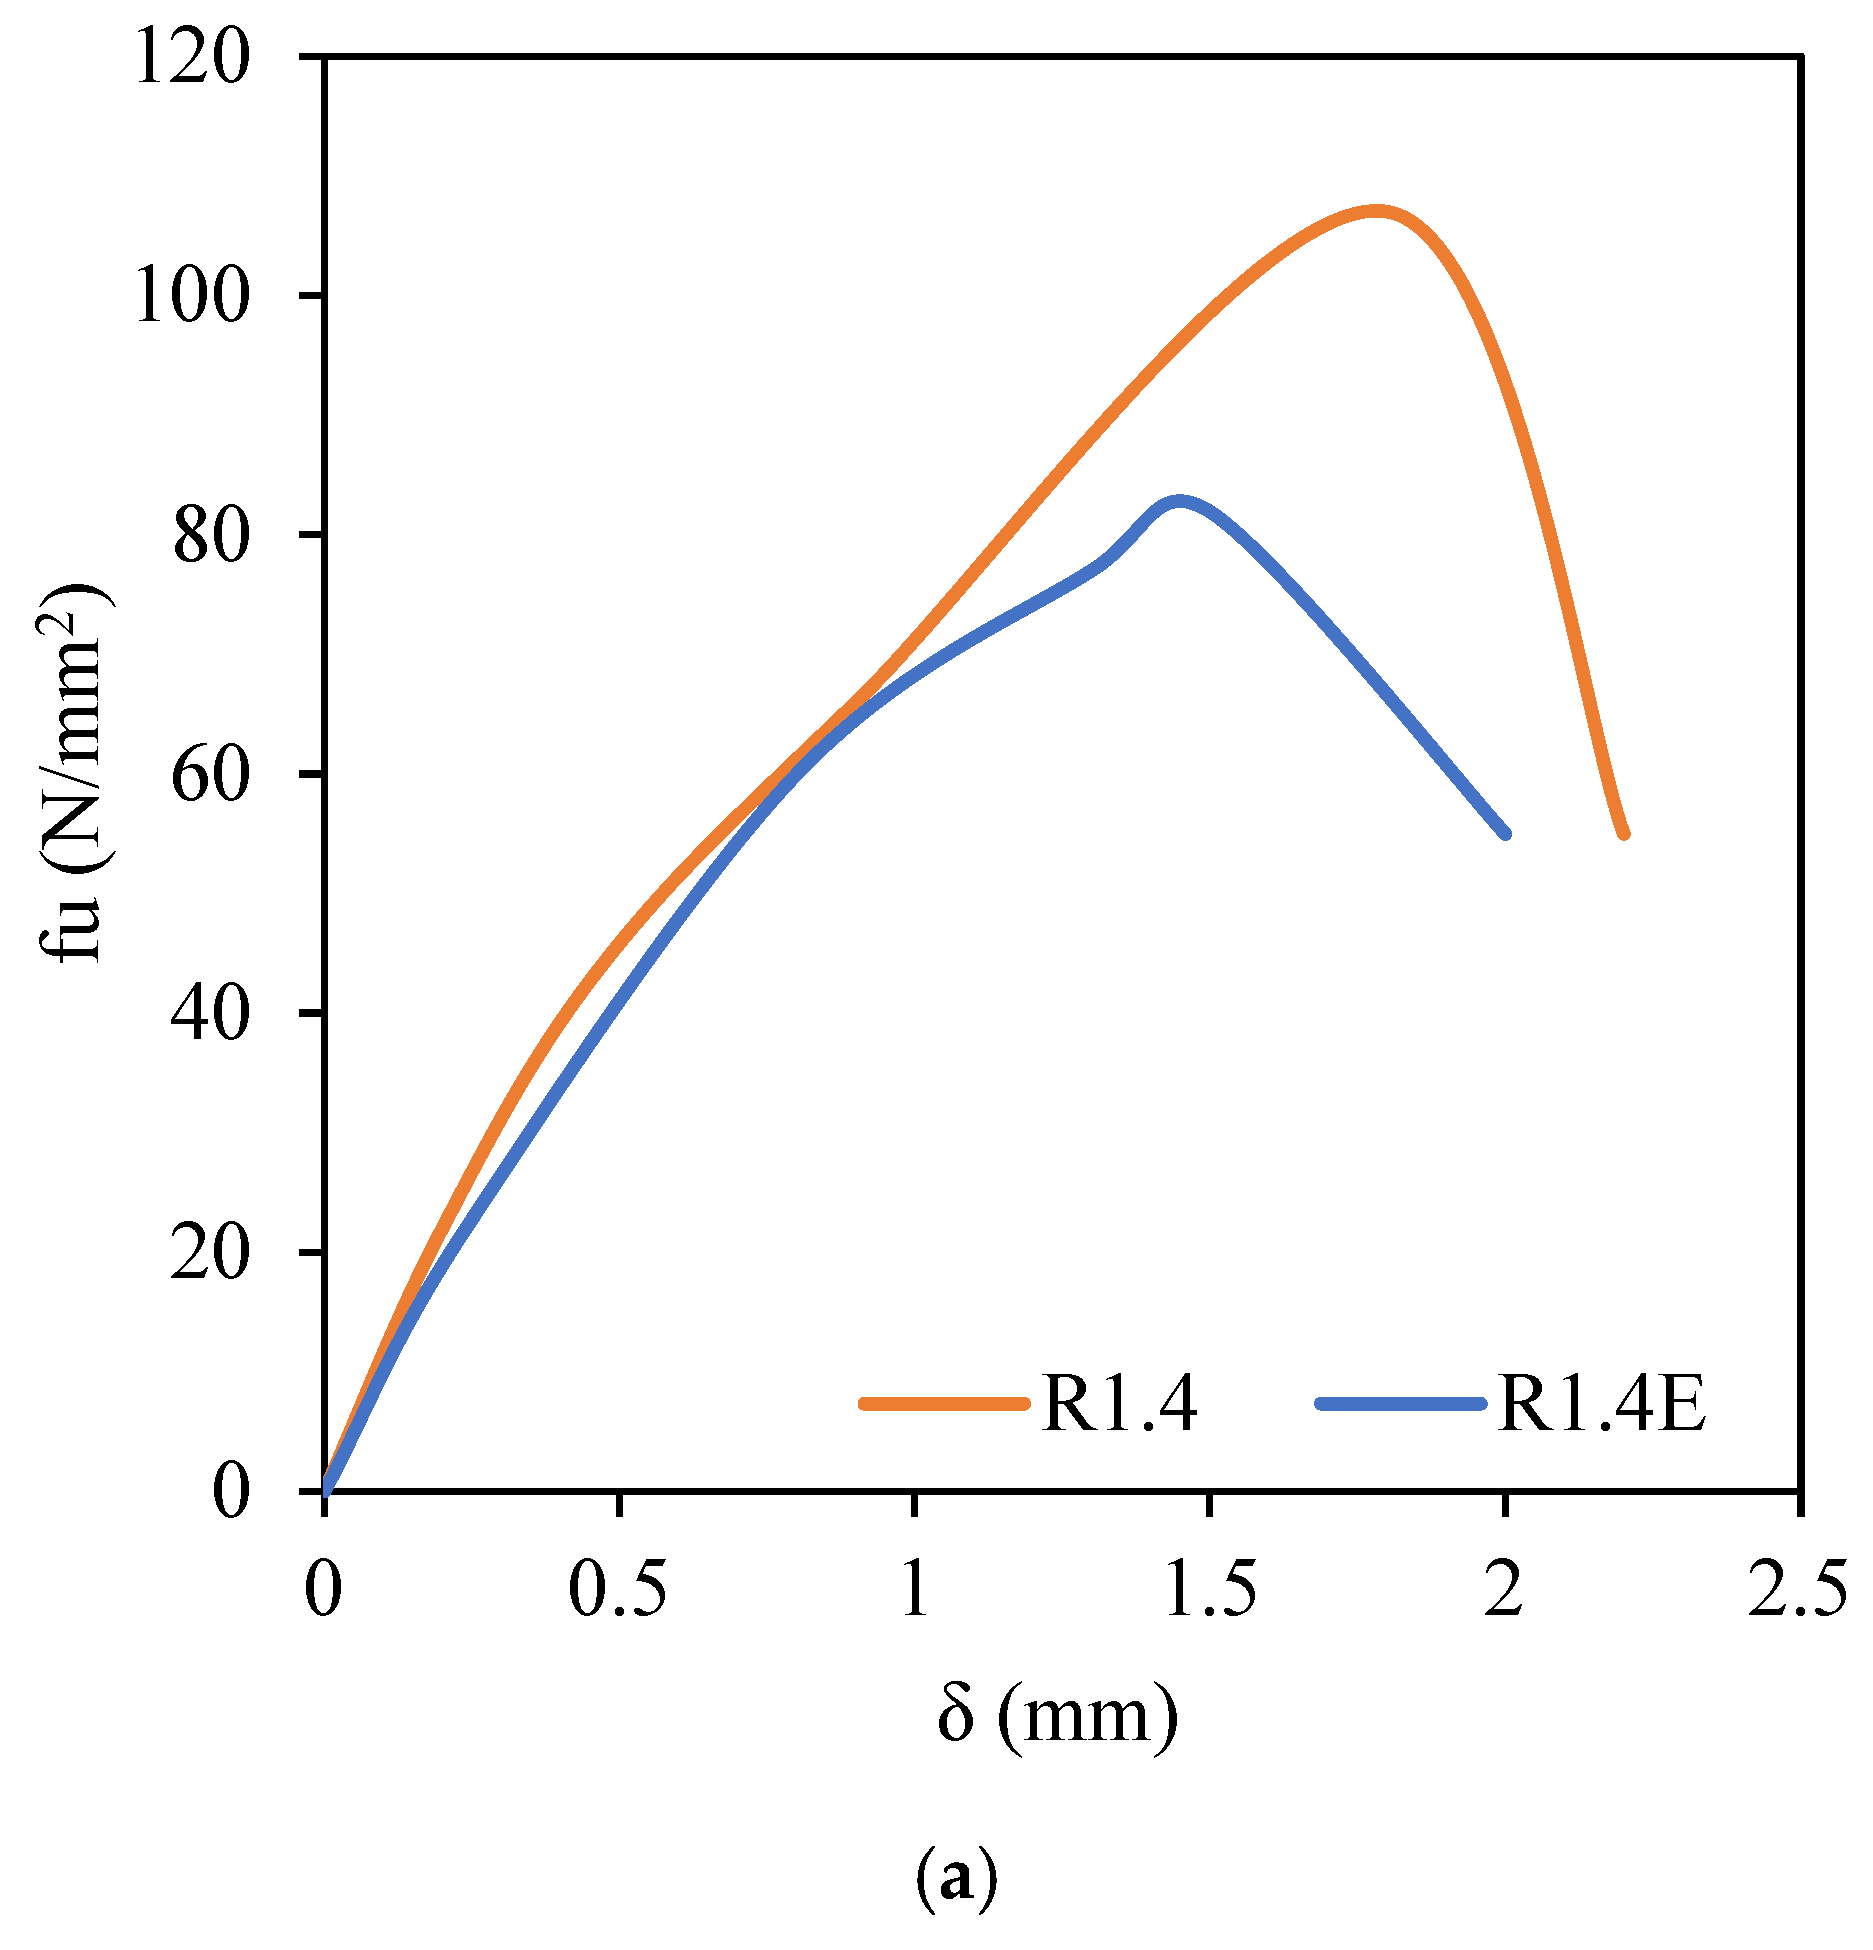
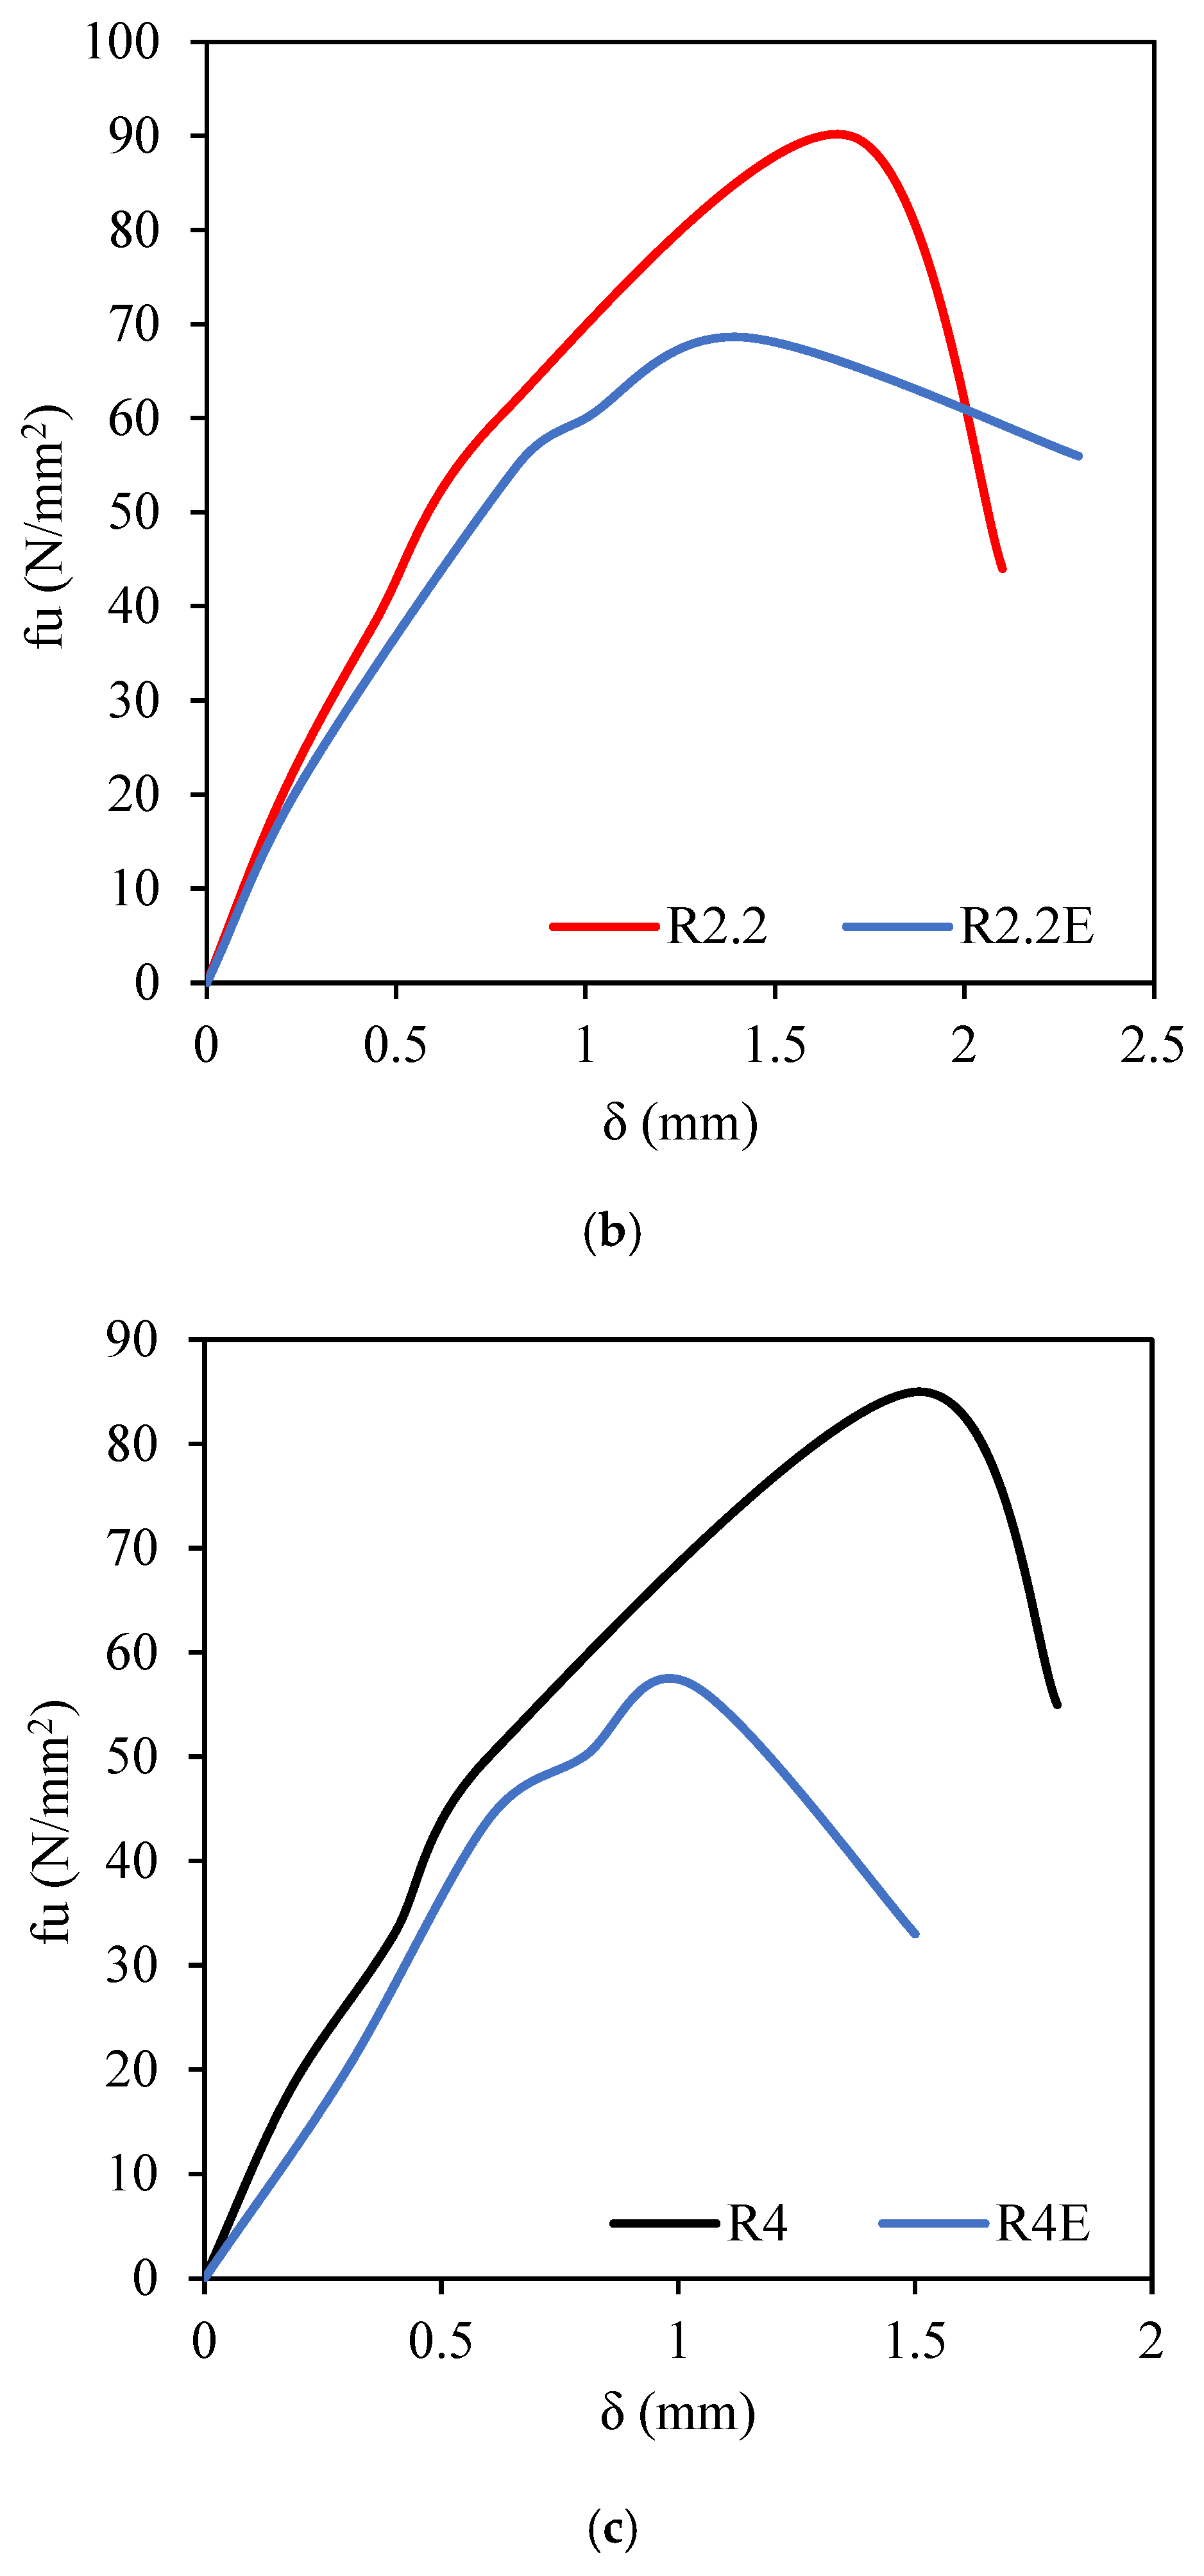
Effect of eccentricity of rectangular bearing plate (GIV) on f–δ curves. (a) r = 1.4. (b) r = 2.2. (c) r = 4.
Figure 5 shows the effect of increasing the area of the square bearing plate (GI) on f–δ curves. As the area decreased, the stress (f) clearly increased at the same value of the slip (δ). In this research, the sample area was kept constant (200 × 200 mm). When the area of the bearing plate was reduced, the thickness of the concrete outside the bearing plate increased. Concrete outside the loading area compressed the concrete under the bearing plate, which resulted in the better enclosure of the concrete under the loading area. This explains the significant improvement in stress for the samples loaded with the small plate, such as sample S4. Figure 6 displays the effect of increasing the area of the circular bearing plate (GII) on f–δ curves. Also, the decrease in the area of the circular bearing plate improved the stress (f) at the same value of the slip (δ). Figure 7 illustrates the effect of the circular or square bearing plate shape on f–δ curves. It is clear that the effect of the shape of the plate was small. Moreover, the curve of each pair of samples is identical, regardless of the plate type (circular or square) at the same area.
Figure 8 depicts the effect of the rectangularity (r) of the bearing plate (GIII) on f–δ curves. Although all samples of this group had the same area of the rectangular plates (3600 mm2), the f–δ curves were clearly affected by the rectangularity of the bearing plate. As the rectangularity of the bearing plate increased, the f–δ curve decreased more significantly. The highest curve occurred in sample S6, which was loaded with a plate with an r of 1.0, while the lowest curve was achieved in sample R4, which was loaded with a plate with an r of 4.0. When the length of the sides of the bearing plate was equal, the stress distribution was equal in all directions. In the case of a rectangular plate, there was a long side and a short side in the plate. This resulted in uneven stress distribution transmitted from the edges of the plate. Stress under the short side of the bearing plate caused failure more quickly than stress under the long side. For this reason, the sample that was loaded with a very elongated rectangular plate failed faster than the sample that was loaded with a less elongated rectangular plate.
Figure 9a–c demonstrates the effect of the eccentricity of the bearing plate (GIV) on f–δ curves. All samples of this group had the same area of the rectangular plate (3600 mm2), but the rectangularity ratio (r) of the bearing plate was varied. In Figure 9a, sample R1.4E that was subjected to an eccentric bearing plate was compared with sample R1.4 with a concentric plate. Both R1.4 and R1.4E samples had the same r of 1.4. It is clear that the curve of sample R1.4 is significantly higher than that of R1.4E. This happened because the bearing plate was shifted toward the sample edges. This caused the concrete thickness to decrease on one side compared with the other, which led to stress concentration. Therefore, sample R1.4E with the offset bearing plate failed faster than sample R1.4 with the plate in the middle. In Figure 9b, sample R2.2E that was subjected to an eccentric bearing plate was compared with sample R2.2 with a concentric plate. It is clear that the curve of sample R2.2 is higher than that of R2.2E. This occurred because the bearing plate was shifted toward the sample edges. Consequently, sample R2.2E with the offset bearing plate failed faster than sample R2.2 with the plate in the middle. As shown in Figure 9c, sample R4E with the offset bearing plate failed faster than sample R4 with the plate in the middle.
3.3. Effect of Increasing Area of Square Bearing Plate
3.3.1. Ultimate Bearing Strength
Ultimate bearing strength (fu) was estimated at the peak points of f–δ curves. Table 2 lists the fu values for each sample. According to the table, samples were considered for evaluating the effects of key parameters on the ultimate bearing strength of the samples. For each parameter, one sample was selected as a reference sample. After that, percentage increases were calculated.
Table 2.
Results of ultimate bearing response.
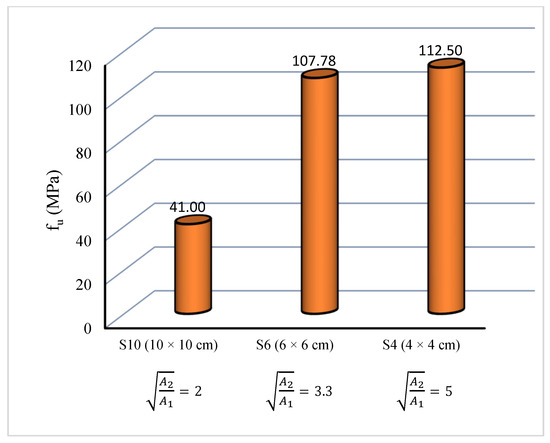
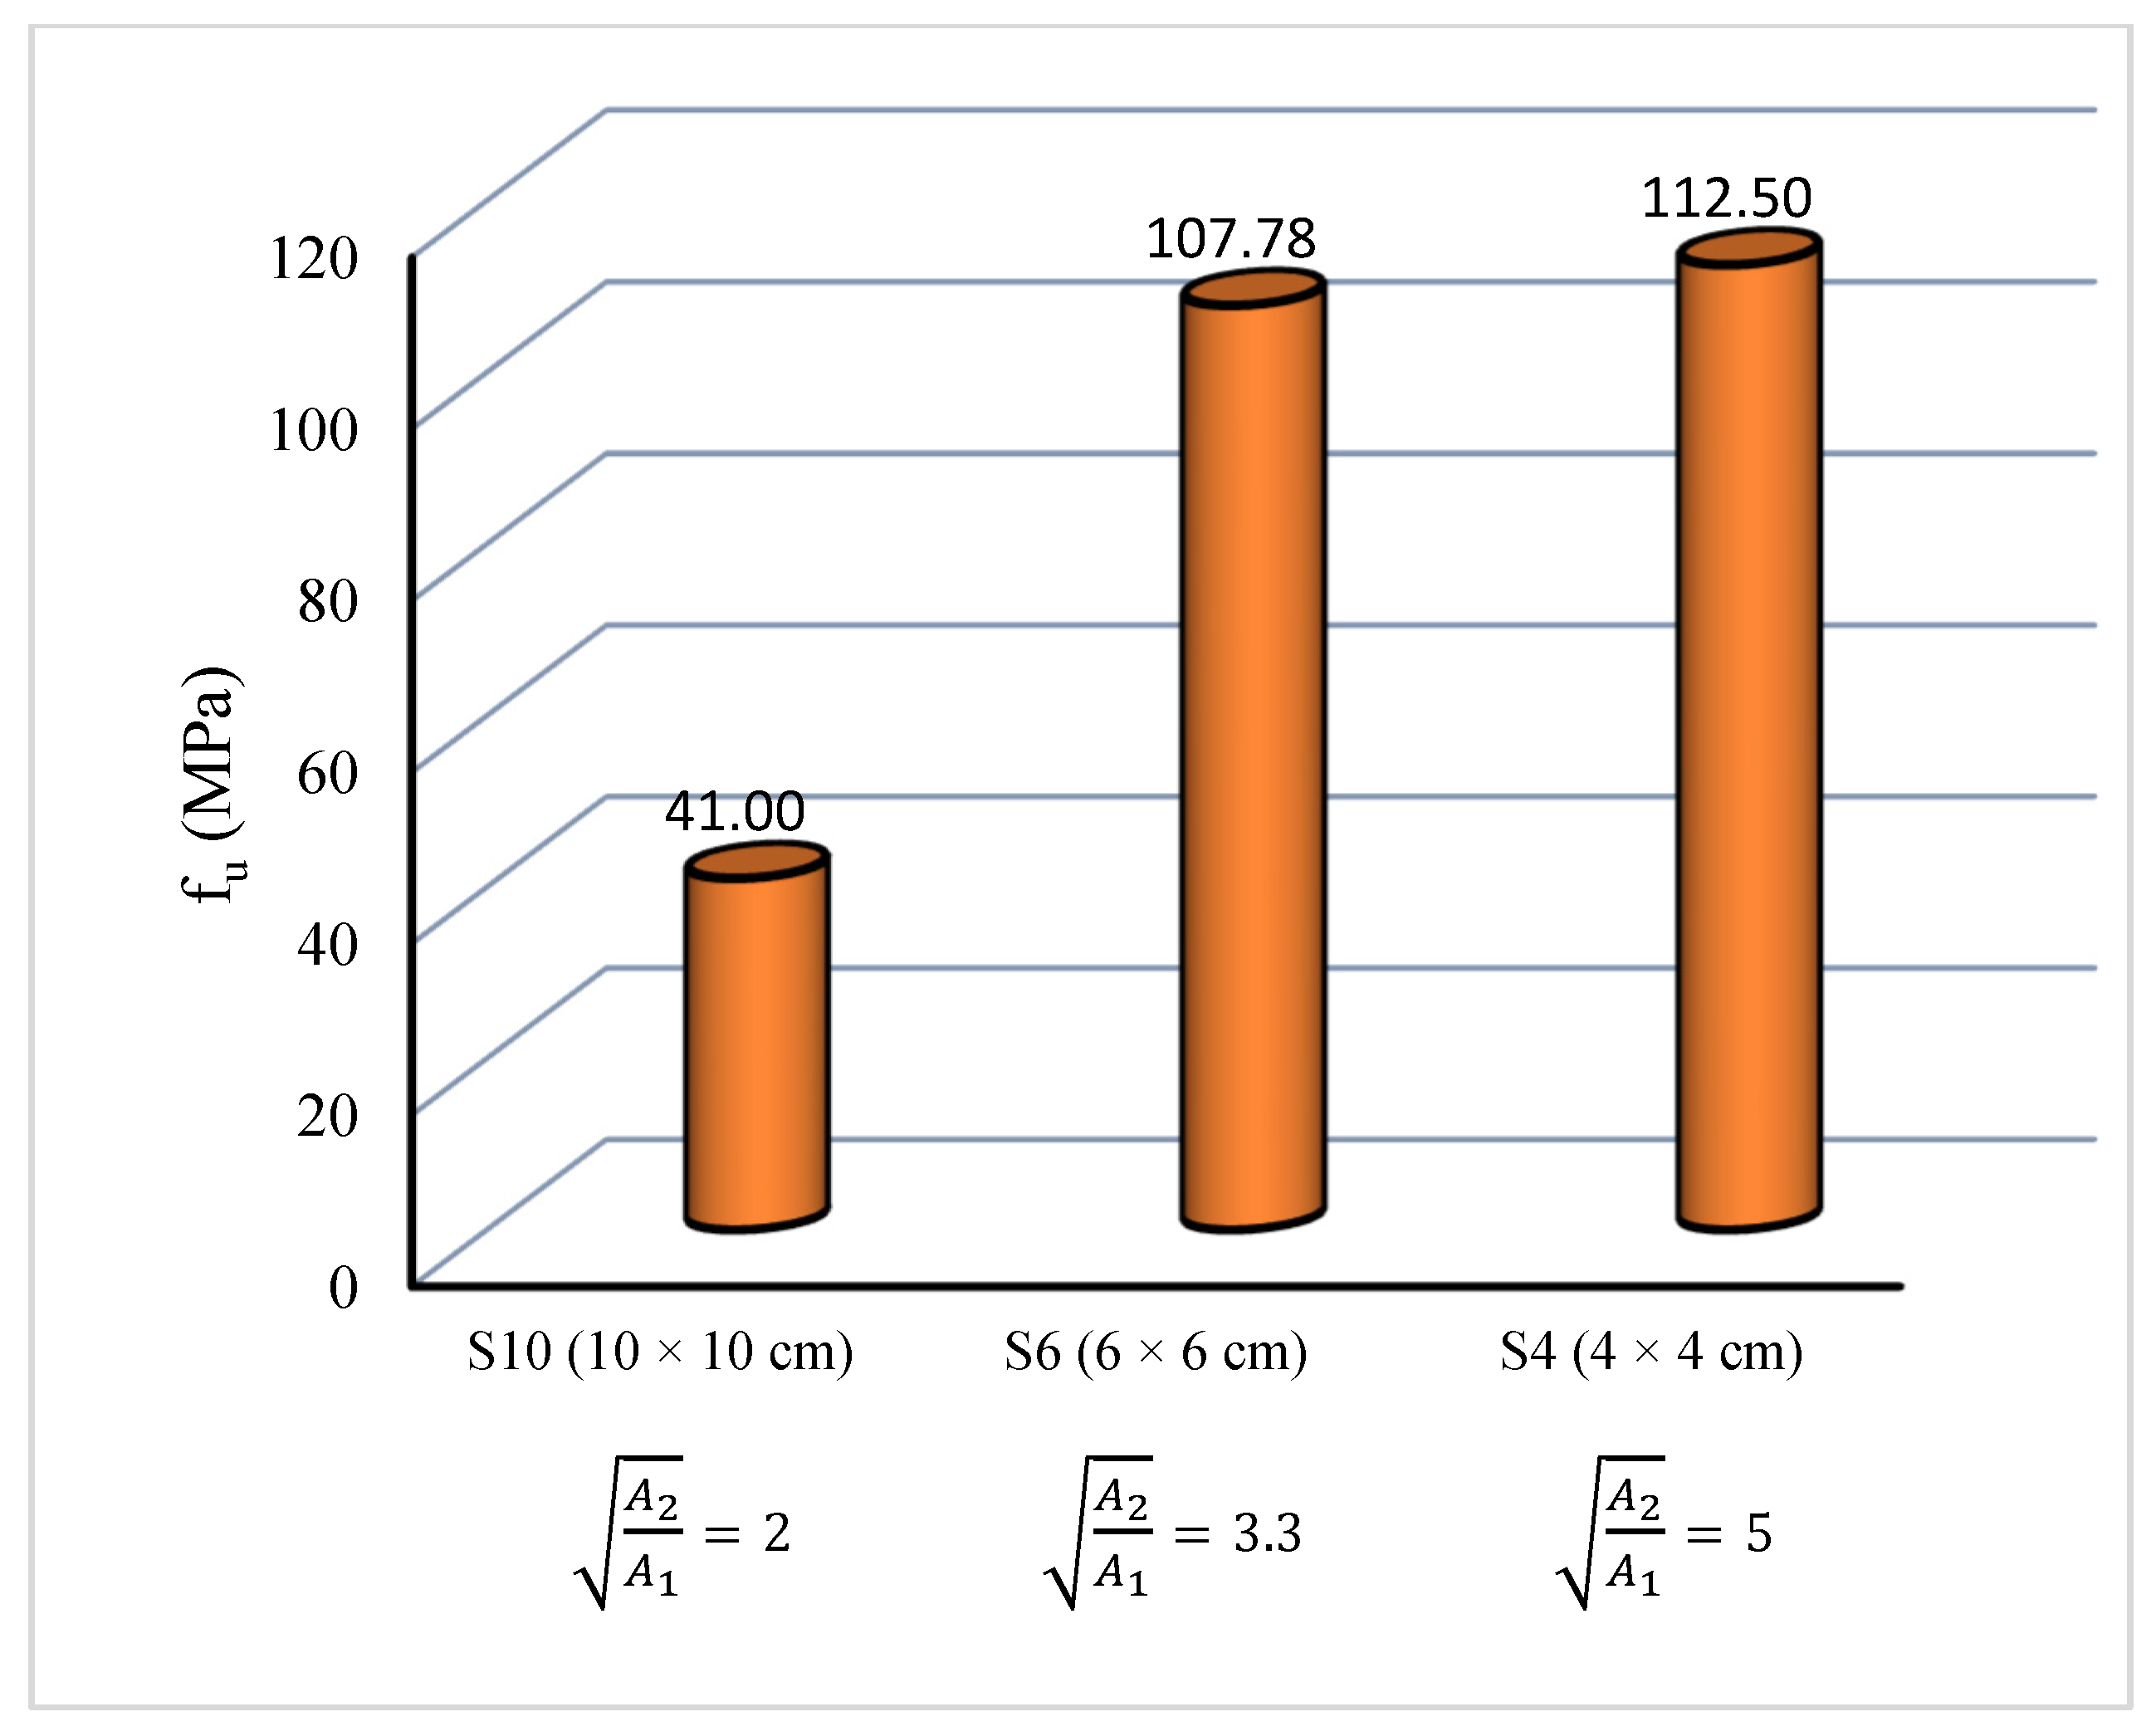
Figure 10 illustrates the effect of increasing the area of the square bearing plate on fu. This parameter consisted of three samples, S10, S6, and S4, which were loaded with plates of 10 × 10 cm, 6 × 6 cm, and 4 × 4 cm, respectively. The plate area (A1) was 10,000 mm2, 3600 mm2, and 1600 mm2 in three samples S10, S6, and S4, respectively. It is clear that as the plate area decreased, fu increased. The fu values were approximately 41 MPa, 108 MPa, and 112 MPa for samples S10, S6, and S4, respectively. Also, the fu values of samples S6 and S4 were 163% and 175% higher than that of sample S10. Compared with a plate area of 10,000 mm2, when the plate area decreased to 3600 mm2 and 1600 mm2, fu increased by 163% and 175%, respectively. The sample area was constant (A2 = 200 × 200 mm). The local aspect ratio of the loaded area (A2/A1) was 4, 11, and 25 for samples S10, S6, and S4, respectively. The square root of the ratio ( ) was 2, 3.3, and 5 for samples S10, S6, and S4, respectively. As increased, the bearing strength of concrete improved, as displayed in Figure 10. These improvements occurred because the thickness of the concrete outside the bearing plate increased as the plate area decreased. The concrete beneath the bearing plate was confined by the surrounding concrete, which enhanced the confinement effect and increased the bearing strength. This explains why samples loaded with smaller plates, such as sample S4, demonstrated a considerable reduction in stress.
Figure 10.
Effect of increasing area of square bearing plate on fu.
ACI 318-11 [23] suggests the design bearing strength as a function of the characteristic compressive strength of concrete and the square root of the ratio between the bearing area and the total surface area. ACI 318-11 states that the design bearing strength of concrete shall not exceed , except when the supporting surface is wider on all sides than the loaded area; in that case, the design bearing strength may be multiplied by , but not by more than 2 for unconfined concrete, as presented by Equation (1).
where is the design bearing stress of unconfined concrete (MPa); = 0.65 (strength reduction factor); is the characteristic compressive cylinder strength of unconfined concrete at 28 days (MPa); is the bearing load area (); and is the area of the lower base of the largest frustum of a pyramid, cone, or tapered wedge (). It is assumed that the load spreads into the concrete block sample at a slope of 2 horizontal to 1 vertical, up to the level at which spreading first reaches the edge of the sample.
After a re-evaluation of the ACI equation, it is clear that the results of this study were consistent with the American code.
3.3.2. Ultimate Slip
The f–δ curve’s peak was used to estimate the ultimate slip (δu). The δu values for each sample are listed in Table 2. GI investigated how increasing the square plate’s area affected δu. The three samples (S10, S6, and S4) were loaded using square bearing plates measuring 10 × 10 cm, 6 × 6 cm, and 4 × 4 cm, respectively. It is evident that δu reduced as the plate area decreased. In samples S10, S6, and S4, the δu values were 2.2 mm, 1.9 mm, and 1.43 mm, respectively. Additionally, compared with sample S10, the δu values of samples S6 and S4 were 13% and 35% lower, respectively. It is evident that δu decreased significantly, indicating a detrimental influence, as the plate area decreased.
3.4. Effect of Increasing Area of Circular Bearing Plate
3.4.1. Ultimate Bearing Strength
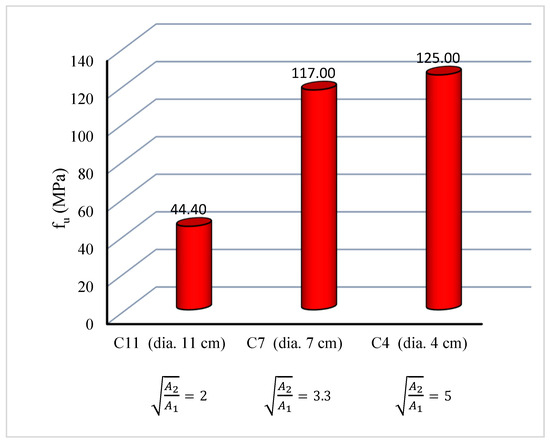
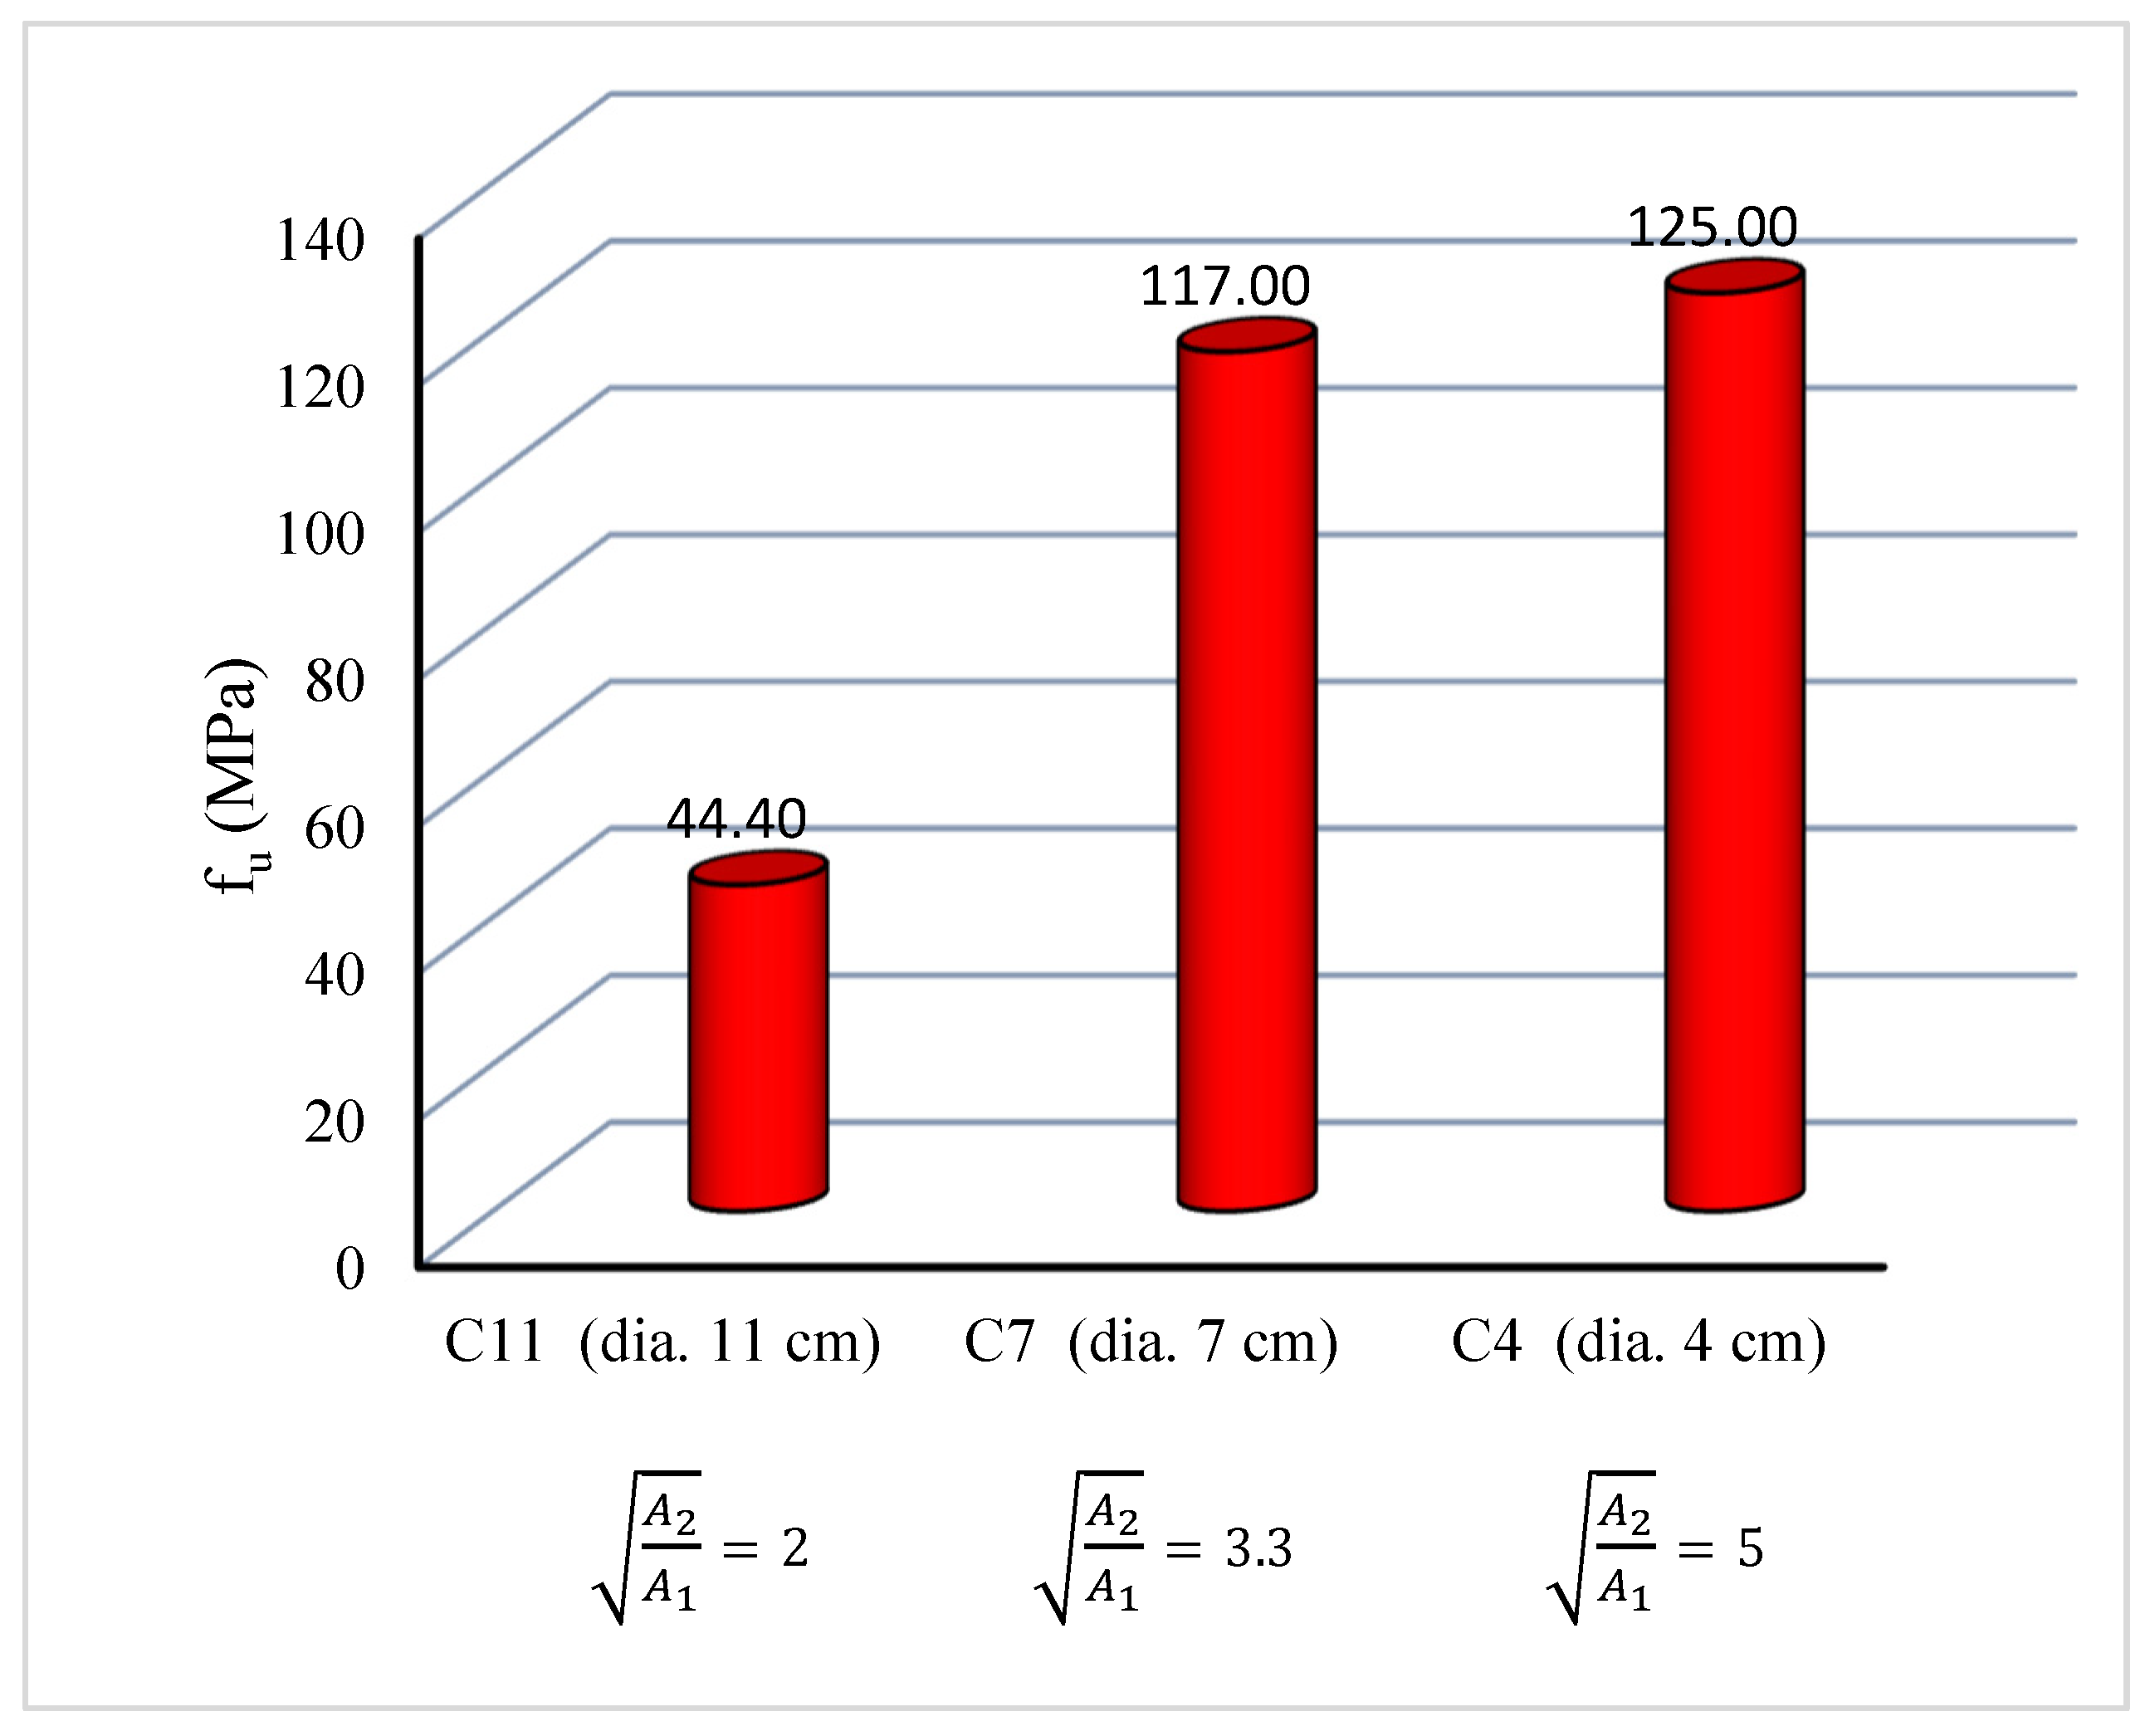
The impact of increasing the area of the circular bearing plate on fu is depicted in Figure 11. fu increased as the area of the circular bearing plate decreased. The three samples, C11, C7, and C4, were loaded using circular bearing plates with diameters of 11 cm, 7 cm, and 4 cm, respectively. For samples C11, C7, and C4, the plate area (A1) was 10,000 mm2, 3600 mm2, and 1600 mm2, respectively. In samples C11, C7, and C4, the fu values were 44 MPa, 117 MPa, and 125 MPa, respectively. It is evident that fu improved as the plate area decreased. Compared with sample C11, the fu values of samples C7 and C4 were 163.5% and 181% higher, respectively. In comparison with a plate area of 10,000 mm2, fu enhanced by 163.5% and 181% when the plate area decreased to 3600 mm2 and 1600 mm2, respectively. was 2, 3.3, and 5 for samples C11, C7, and C4, respectively. As increased, the bearing strength of concrete clearly improved, as illustrated in Figure 11. These increases occurred because, as the area of the bearing plate decreased, the thickness of the surrounding concrete outside the bearing plate increased. The surrounding concrete enhanced confinement of the concrete beneath the loaded area by providing lateral restraint. This explains the significant increase in bearing strength observed in samples loaded with smaller plates, such as sample C4.
Figure 11.
Effect of increasing area of circular bearing plate on fu.
3.4.2. Ultimate Slip
The impact of increasing the area of the circular plate on δu is presented in Table 2. Three samples, C11, C7, and C4, were loaded using circular bearing plates with diameters of 11 cm, 7 cm, and 4 cm, respectively. For samples C11, C7, and C4, the δu values were 2.8 mm, 2.1 mm, and 1.7 mm, respectively. It is evident that δu decreased as the circular plate area reduced. Compared with sample C11, the δu values of samples C7 and C4 were 25% and 39% lower, respectively.
3.5. Effect of Bearing Plate Shape
3.5.1. Ultimate Bearing Strength
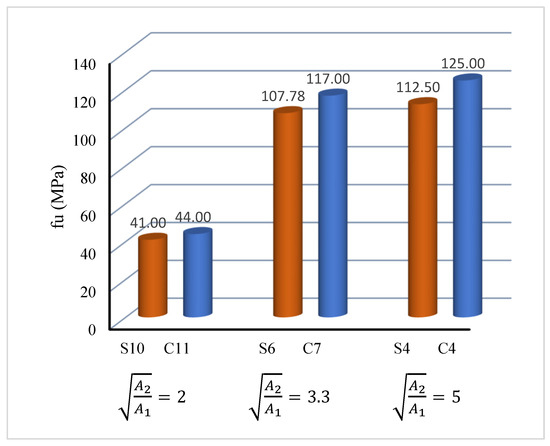
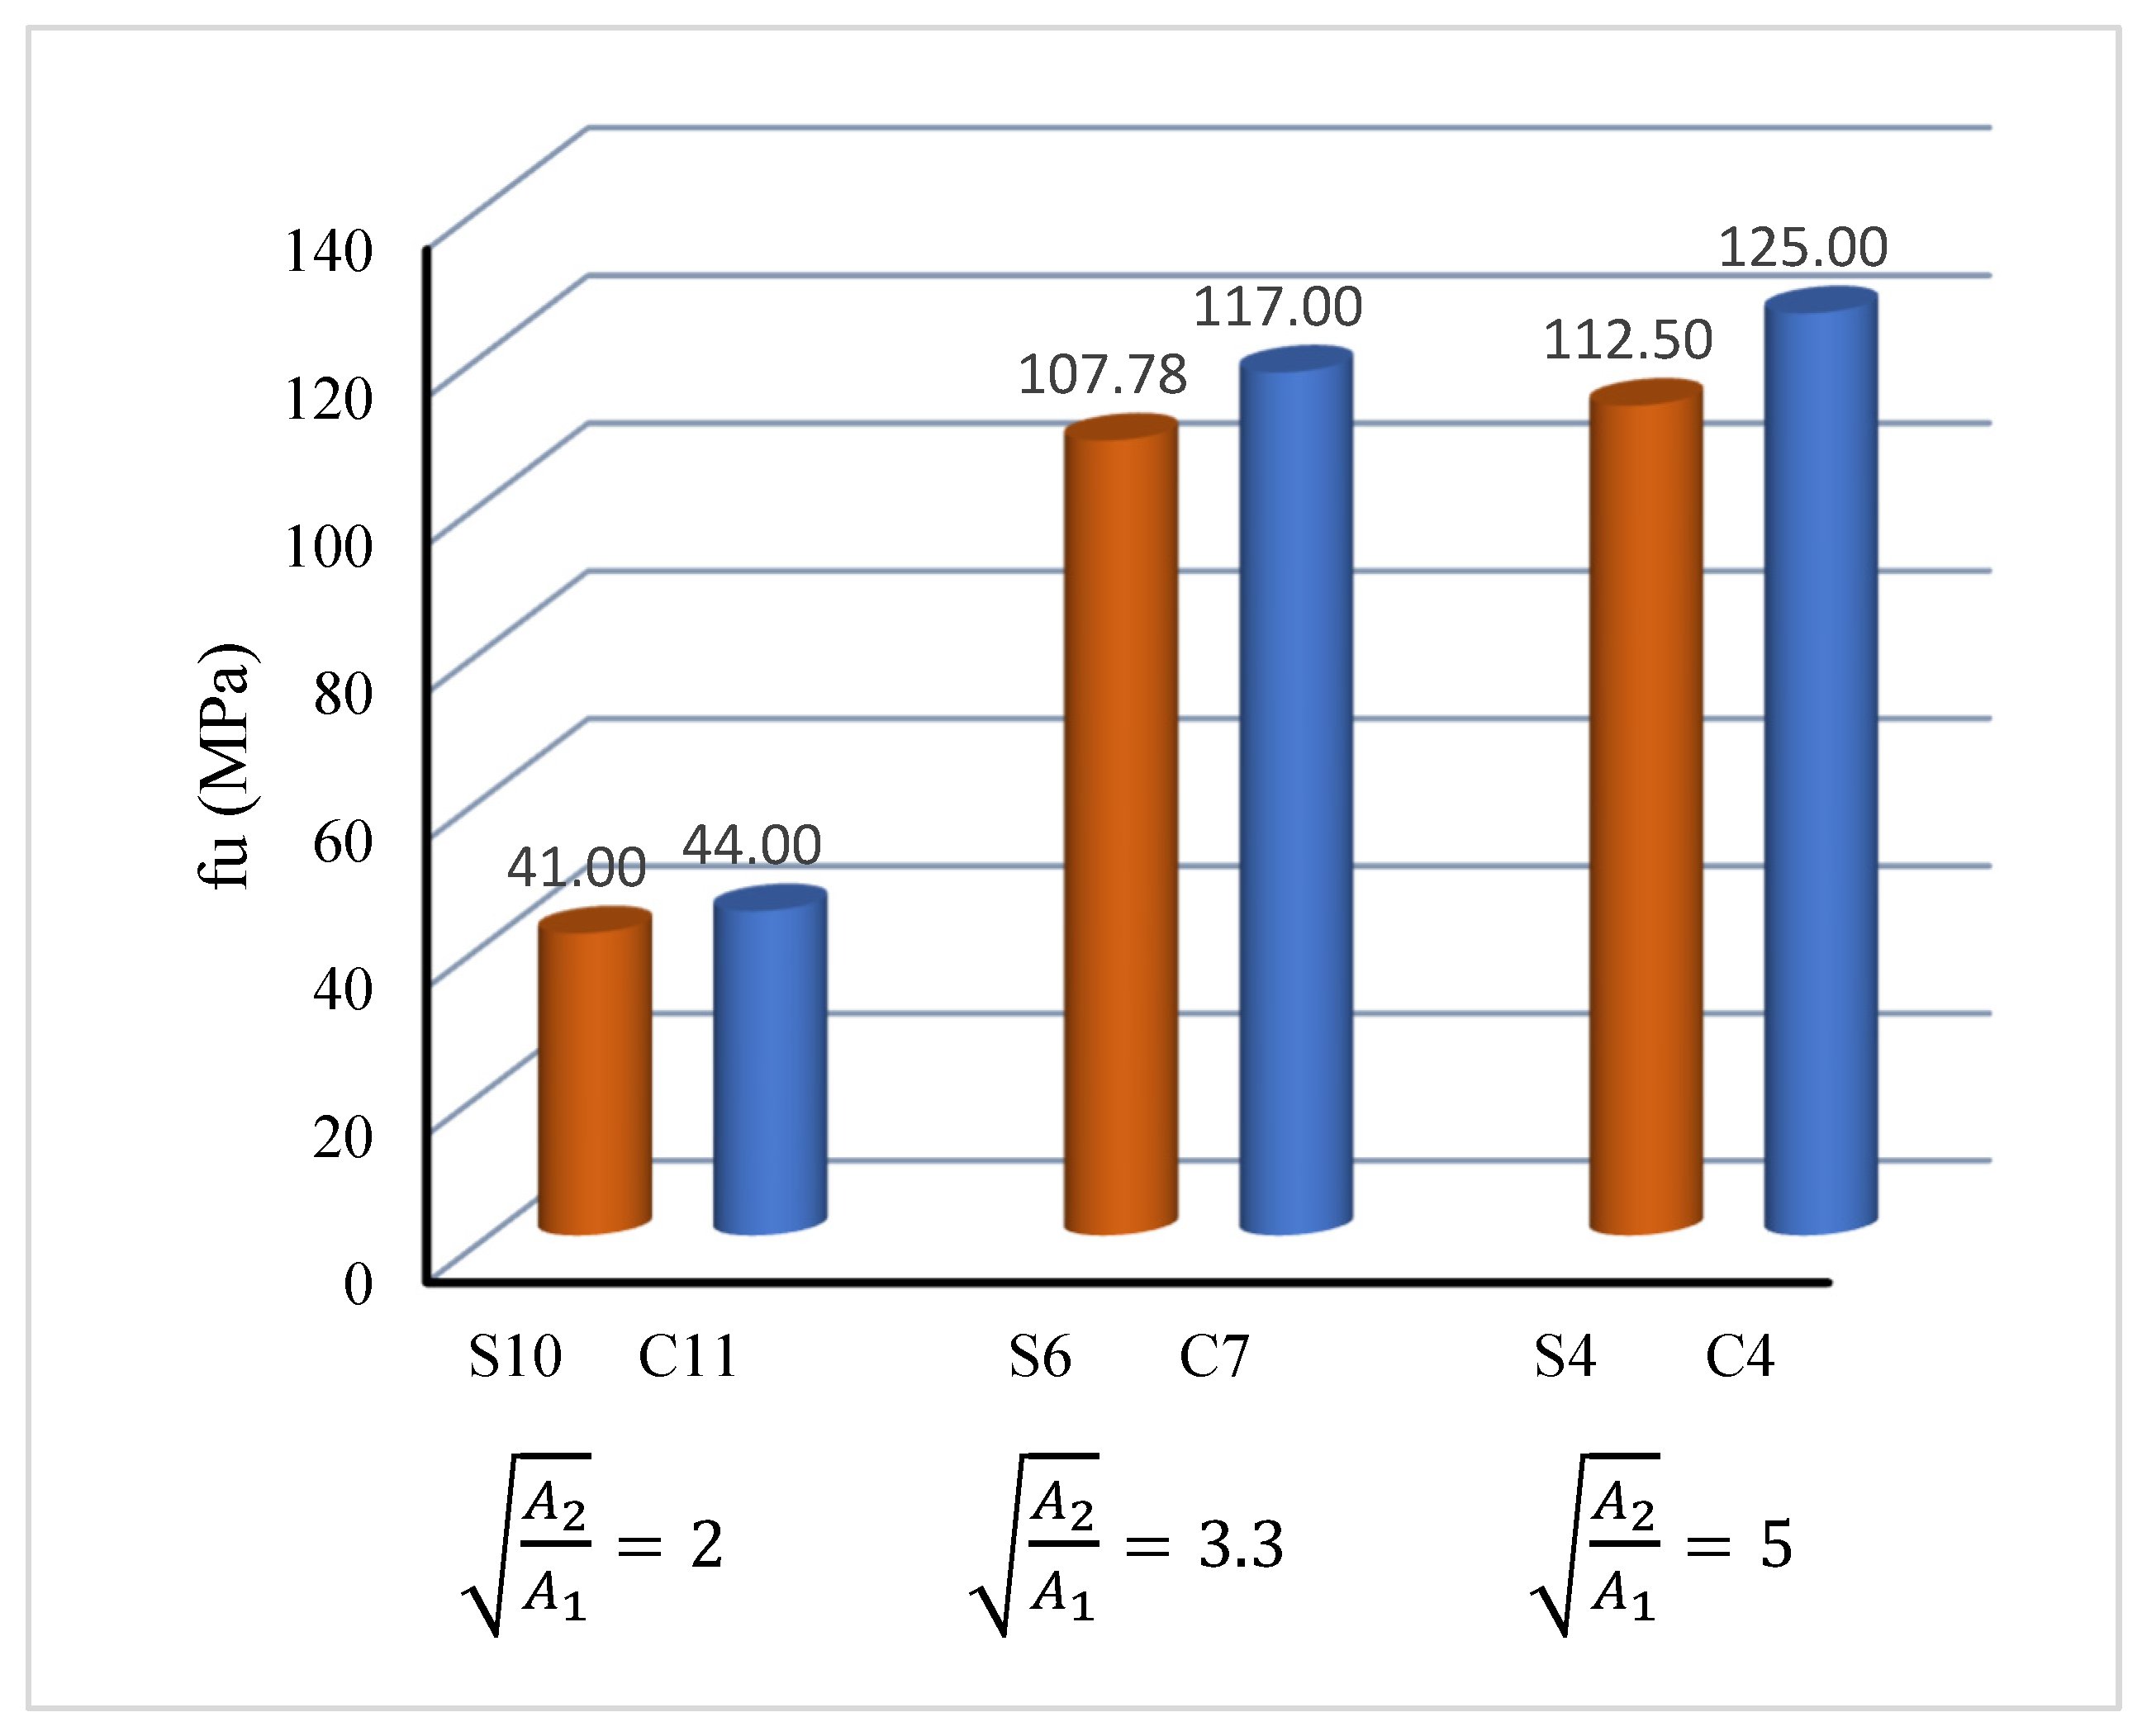
Figure 12 demonstrates the effect of the bearing plate shape on fu. It is evident that fu was slightly enhanced by the shape (circular or square). Three samples, C11, C7, and C4, were compared with their counterparts S10, S6, and S4, respectively. In each pair, the bearing plate area was constant. For samples S10 and C11, the plate area (A1) was 10,000 mm2, while for samples S6 and C7 it was 3600 mm2. For samples S4 and C4, A1 was 1600 mm2. was 2, 3.3, and 5 for C11/S10, C7/S6, and C4/S4, respectively. Compared with sample S10, fu of sample C11 was 7.3% higher. In comparison with sample S6, fu of sample C7 was 8.5% higher. However, compared with sample S4, fu of sample C4 was 11.1% higher. It is clear that the fu values of the samples that were loaded with a circular plate were slightly higher than those loaded with a square plate.
Figure 12.
Effect of bearing plate shape on fu.
The reason for these improvements is the difference in stress distribution within the samples. The circular plate is the most favorable shape because it has no corners, which allows stresses to be distributed along the circumference without stress concentration. This is in contrast to the square plate, which contains four corners. Concrete under the bearing plate in the corner regions fails more quickly. Also, the form of stress transfer and distribution under the bearing plate in the case of a circular plate is in the form of a cone. The diameter of this cone directly beneath the bearing plate was equal to the diameter of the circular plate. This diameter increased toward the bottom inside the sample. This stress distribution is more favorable for the concrete and does not cause rapid failure.
On the other hand, it is important to examine the effect of the plate perimeter on the bearing strength. The square and circular plates had the same area but different perimeters, which might result in distinct constraint effects when examining the impact of bearing plates with various shapes on the bearing strength. Table 3 shows the values of plate perimeters for all samples that were loaded using circular and square plates. Both samples S10 and C11 had the same plate area of 10,000 mm2 but the perimeter was 400 mm for S10 and 354.8 mm for C11. Although the circular sample C11 had a smaller perimeter compared with the square sample S10, it achieved a higher stress (fu) than the square sample. The same issue occurred with the rest of the samples with different areas (3600 and 1600 mm2). The superiority of the circular plate over the rectangular plate was due to the fact that the rectangular plate created stress concentrations at its four corners, and this did not occur for the circular plate, which distributed stresses more uniformly throughout its contact area.
Table 3.
Effect of bearing plate perimeter on fu.
3.5.2. Ultimate Slip
This section describes how plate shape affects δu. Three samples (C11, C7, and C4) were compared with their respective counterparts, S10, S6, and S4. The bearing plate’s area was constant in each pair, but its shape was altered from square to circular. It was demonstrated that the bearing plate’s shape influenced δu. In terms of bearing plate slip, circular plates performed better than square plates. δu of sample C11 with a circular plate was 27.3% greater than that of sample S10 with a square plate. Compared with sample S6, δu of sample C7 was 10.5% higher. Compared with sample S4, δu of sample C4 was 19% higher. It is evident that the δu values of the samples that were loaded with circular plates were higher than those of the samples that were loaded with square plates.
3.6. Effect of Rectangularity of Bearing Plate
3.6.1. Ultimate Bearing Strength
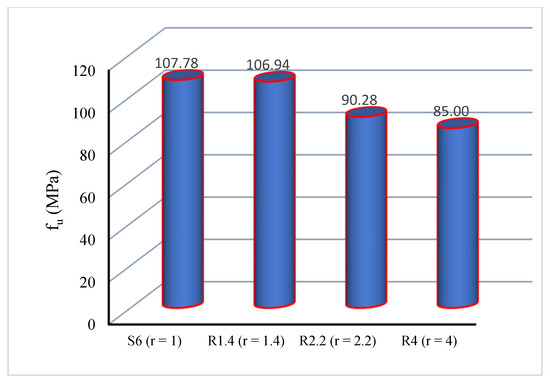
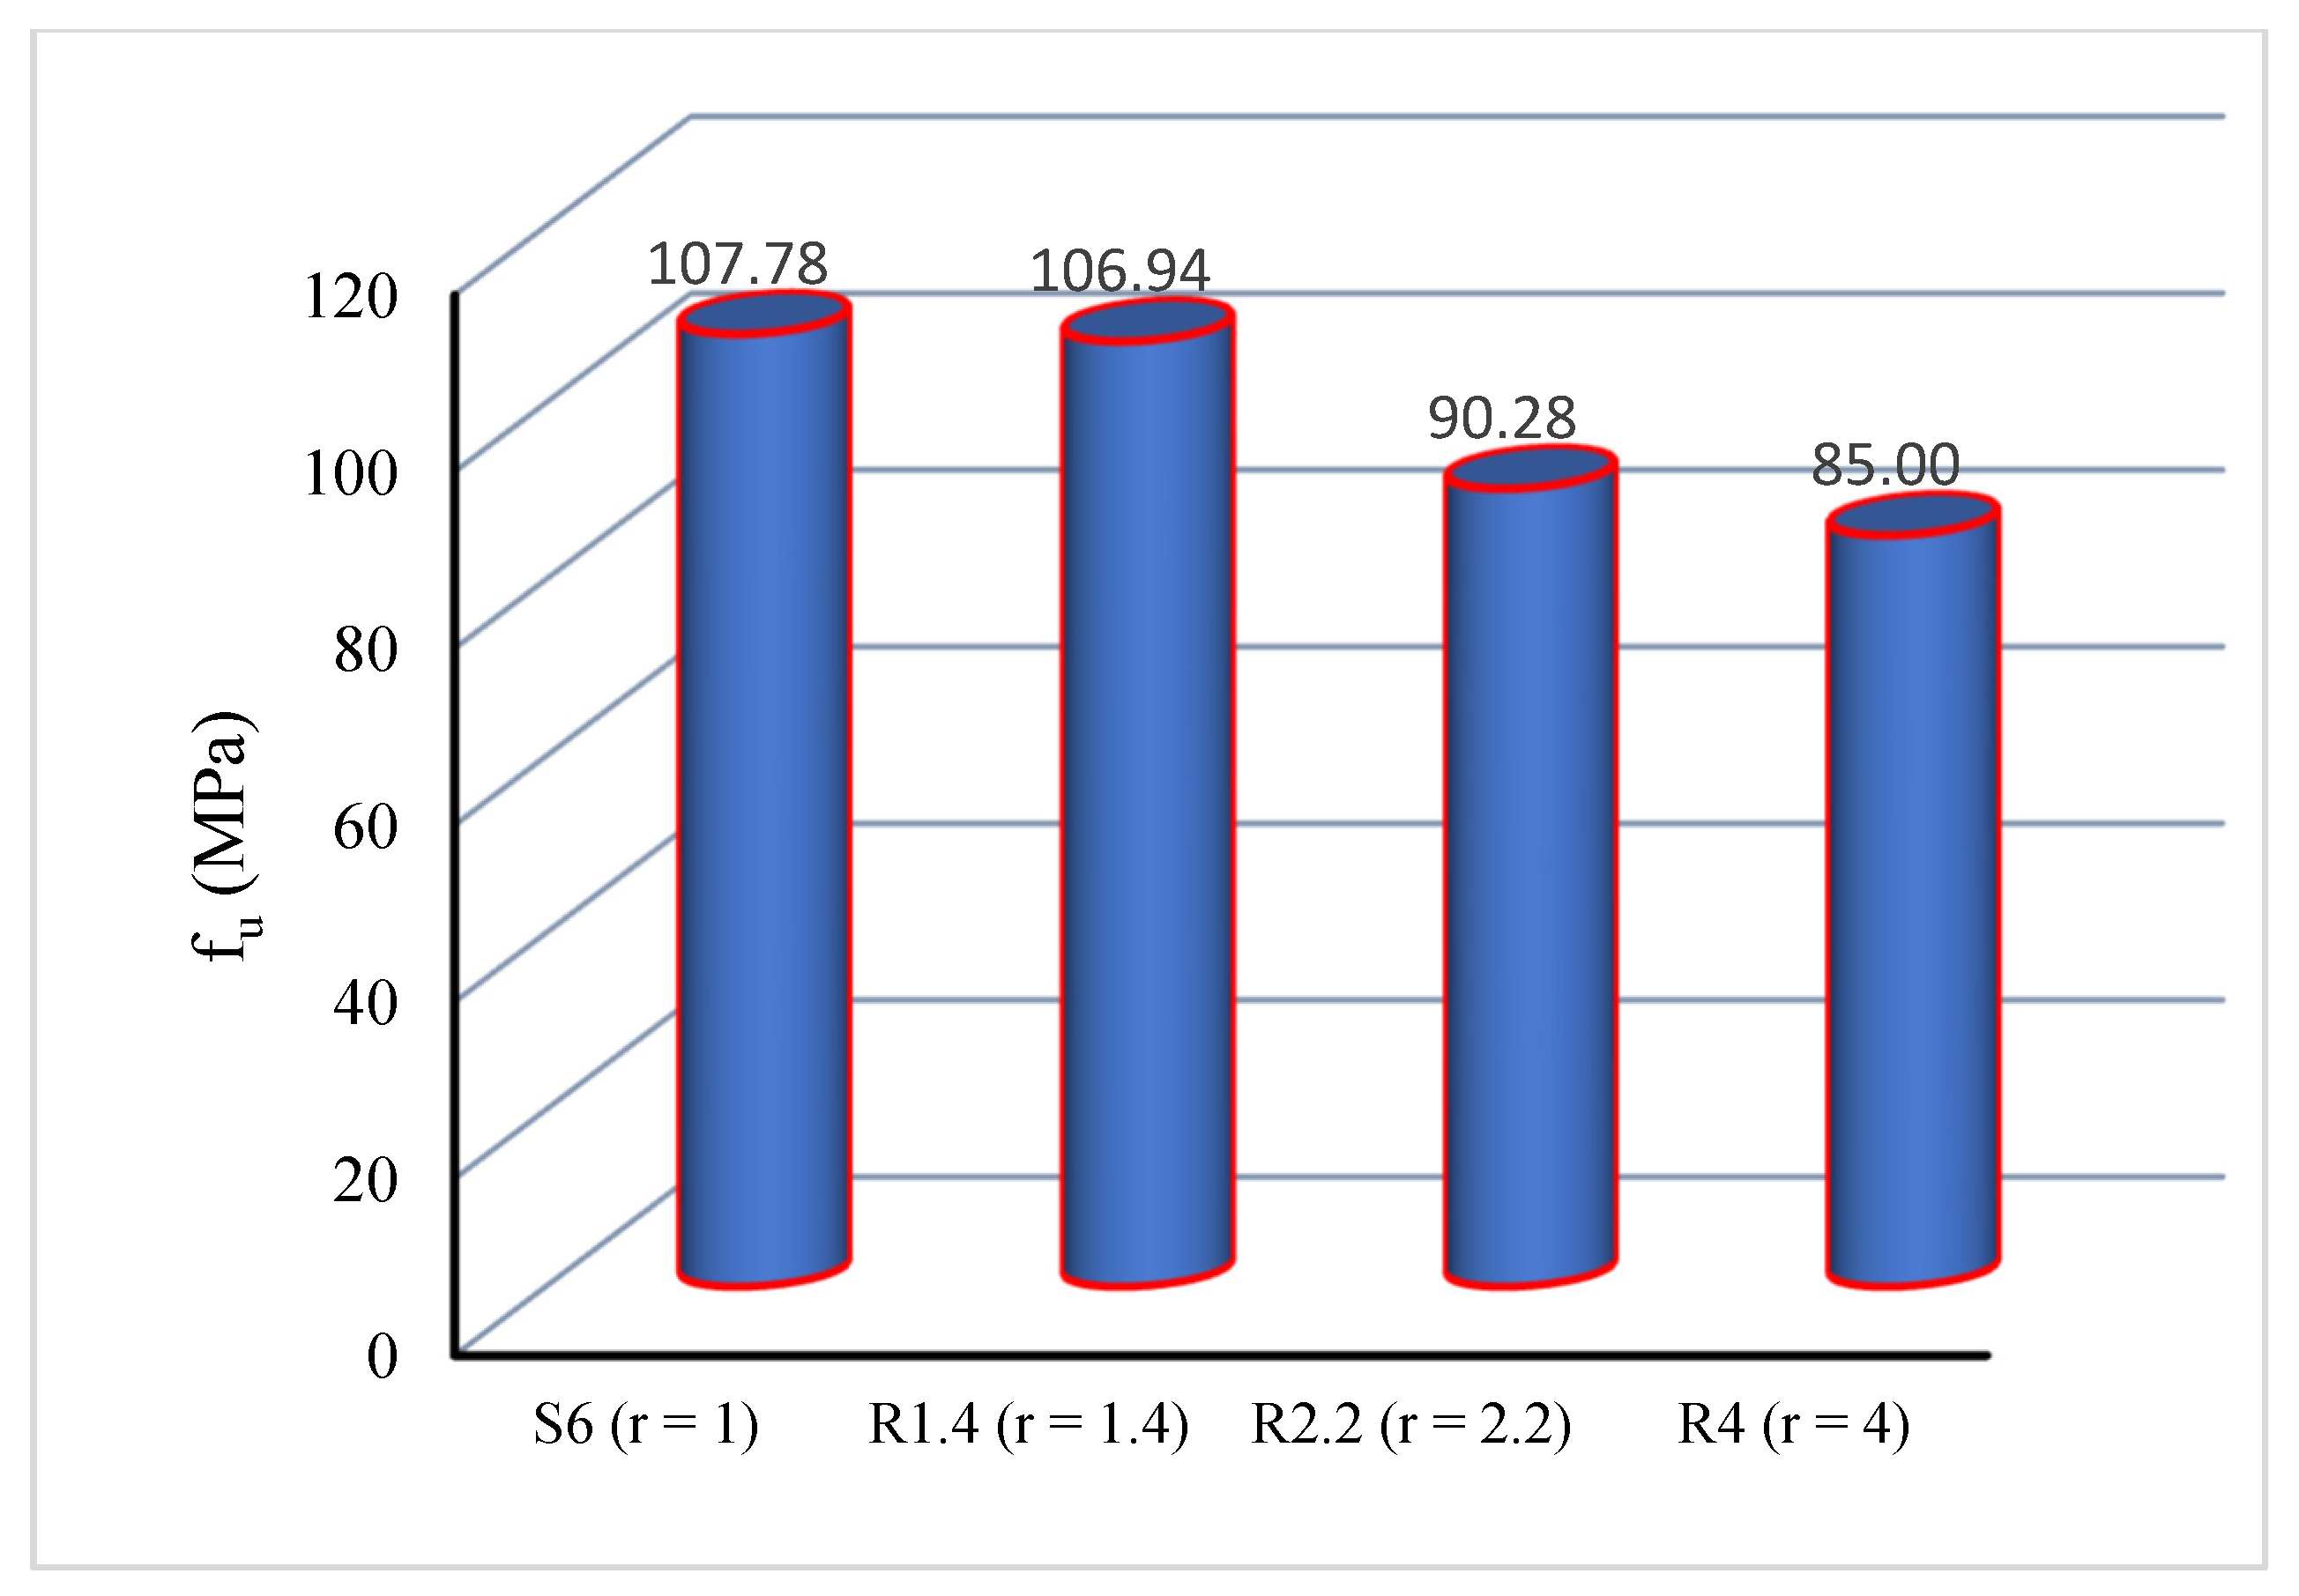
Figure 13 illustrates the effect of the rectangularity of the bearing plate on fu. This comparison consisted of four samples S6, R1.4, R2.2, and R4. All samples had the same area of rectangular plates (3600 mm2). Rectangularity (r) of the bearing plate was varied (1 in S6, 1.4 in R1.4, 2.2 in R2.2, and 4 in R4). As displayed in Figure 13, as the rectangularity of the bearing plate increased, fu decreased. The fu values of samples S6, R1.4, R2.2, and R4 were 107, 107, 90, and 85 MPa, respectively. The fu values of samples R1.4, R2.2, and R4 were 1, 16, and 21% less than that of the control sample S6 with an r of 1. The highest fu occurred in sample S6 that was loaded with a plate having an r of 1.0, while the lowest fu was achieved in sample R4 that was loaded with a plate having an r of 4.0. The distribution of stresses in all directions was equal when the bearing plate’s sides had the same length. The bearing plate had a long side and a short side in the case of a rectangular plate. As a result, the bearing plate’s edges distributed the load unevenly. The bearing plate failed more quickly under tensile stress on its short side than under stress on its long side. Because of this, a sample loaded with a very long rectangular plate failed more quickly than the one loaded with a less elongated rectangular plate.
Figure 13.
Effect of rectangularity of bearing plate on fu.
3.6.2. Ultimate Slip
How the bearing plate’s rectangularity (r) affected δu is discussed in this section. There are four samples for this parameter, namely S6, R1.4, R2.2, and R4. The rectangular plate area (3600 mm2) was the same for every sample. The bearing plate’s rectangularity (r) was changed from 1 in S6 to 1.4 in R1.4, 2.2 in R2.2, and 4 in R4. Table 2 indicates that δu decreased as the bearing plate’s rectangularity increased. Samples S6, R1.4, R2.2, and R4 had the δu values of 1.9, 1.8, 1.7, and 1.5 mm, respectively. Samples R1.4, R2.2, and R4 had the δu values that were 5%, 10%, and 21% lower than the control sample S6 (δu = 1.9 mm). Sample S6, which was loaded with a plate having an r of 1.0, had the highest δu, whereas sample R4, which was loaded with a plate having an r of 4.0, had the lowest δu.
3.7. Effect of Eccentricity of Bearing Plate
3.7.1. Ultimate Bearing Strength
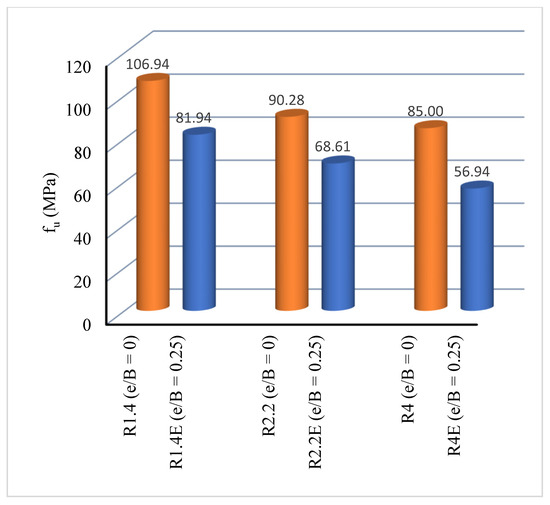
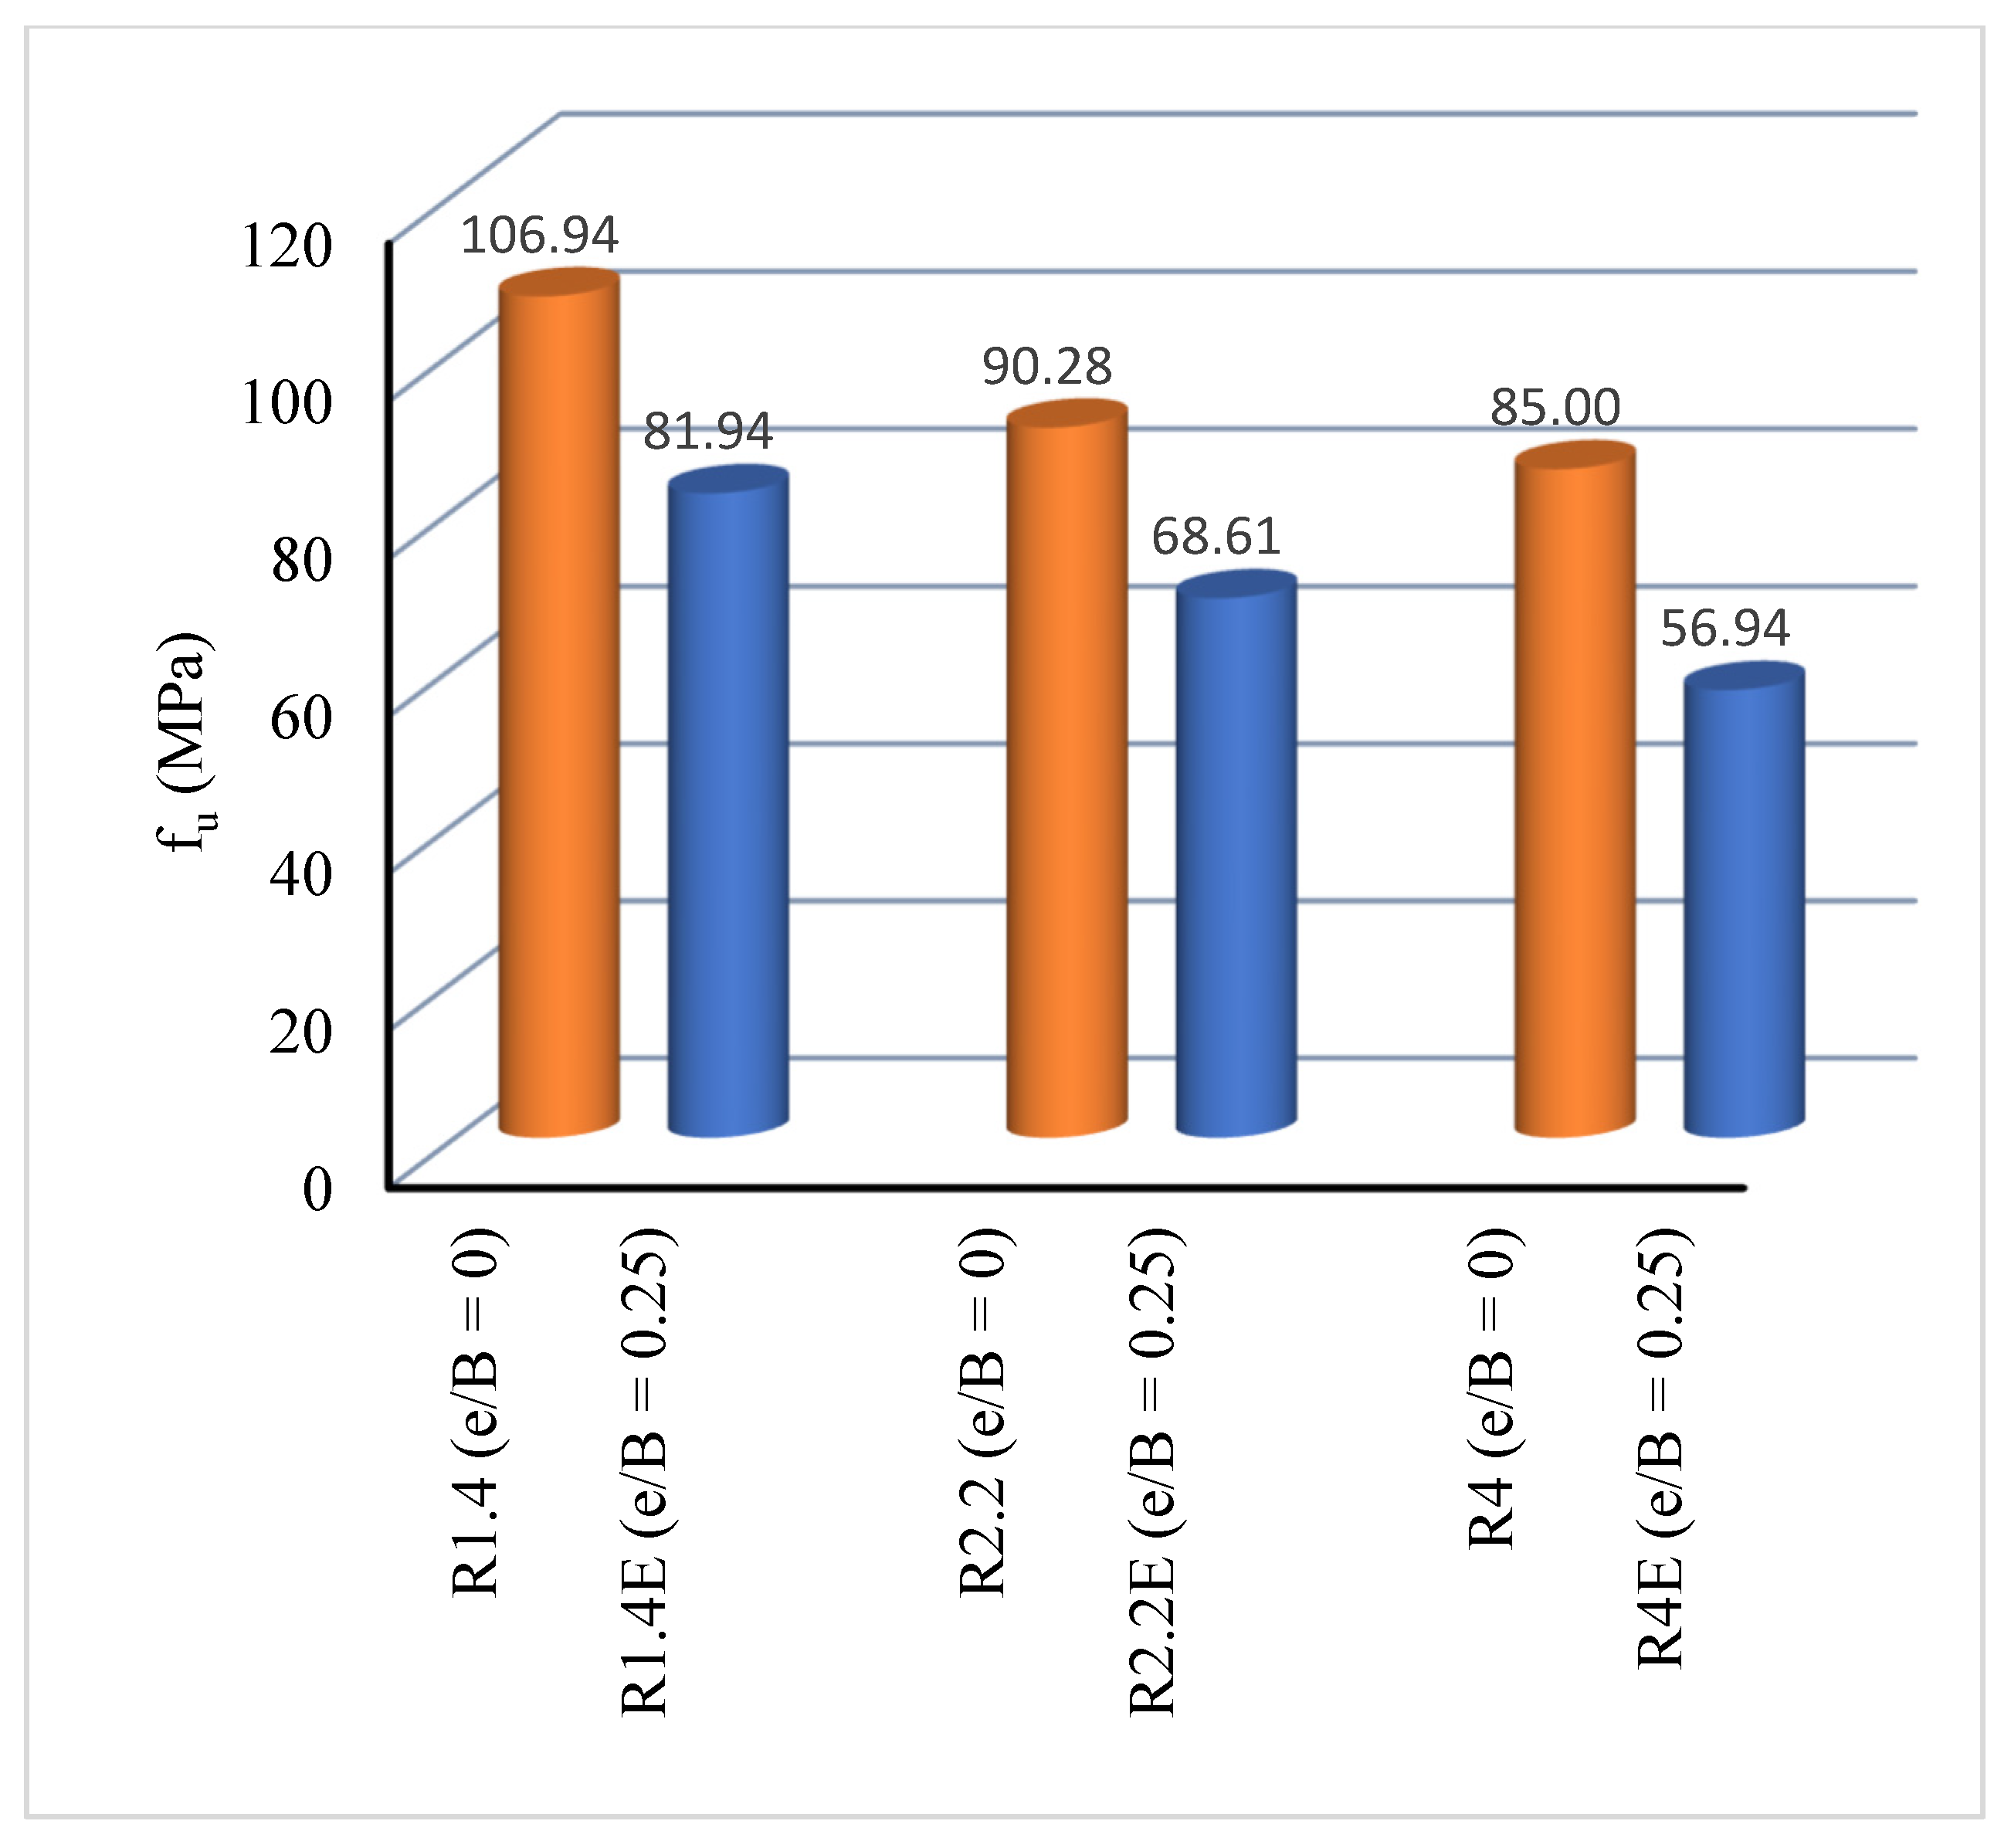
Figure 14 shows the effect of eccentricity of the bearing plate on fu. All samples for this parameter had the same area of the rectangular plate (3600 mm2) but the rectangularity (r) of the bearing plate was varied. Three samples, R1.4, R2.2, and R4, were compared with their counterparts R1.4E, R2.2E, and R4E, respectively. In each pair, the rectangularity (r) of the bearing plate was constant. In samples R1.4 and R1.4E, r was equal to 1.4 whereas it was 2.2 in samples R2.2 and R2.2E. In samples R4 and R4E, r was 4. The fu value of sample R1.4E that was loaded with an eccentric plate was 23% less than that of sample R1.4 that was loaded with a concentric plate. Also, the fu value of sample R2.2E that was loaded with an eccentric plate was 24% less than that of sample R2.2 that was loaded with a concentric plate. Additionally, the fu value of sample R4E that was loaded with an eccentric plate was 33% less than that of sample R4 that was loaded with a concentric plate. Sample R1.4 was obviously far better than sample R1.4E. The bearing plate was moved in the direction of the sample edges, which was why this occurred. As a result, one side of the concrete became thinner than the other, increasing tension on that side relative to the other. Consequently, compared with sample R1.4 with the plate in the middle, sample R1.4E with the offset bearing plate collapsed more quickly. For the reasons mentioned above, the two concentric samples, R2.2 and R4, were better than the two eccentric samples, R2.2E and R4E.
Figure 14.
Effect of eccentricity of bearing plate on fu.
During the tests, full contact was observed between the lower surface of the samples and the lower jaw of the testing machine throughout the loading period. Indeed, the contact between them remained from the beginning to the end in order to ensure that the samples did not rotate during the tests, especially the samples under eccentric loading.
3.7.2. Ultimate Slip
This section illustrates how the bearing plate’s eccentricity affects δu (Table 2). Although the bearing plate’s rectangularity (r) varied, each sample had the same rectangular plate area (3600 mm2). Three samples (R1.4, R2.2, and R4) were compared with their respective counterparts (R1.4E, R2.2E, and R4E). The bearing plate’s rectangularity (r) was constant in each pair. The eccentric-plate-loaded sample R1.4E had a δu that was 17% lower than the concentric-plate-loaded sample R1.4. δu of sample R2.2E that was loaded with an eccentric plate was 17% less than that of sample R2.2 that was loaded with a concentric plate. Also, δu of sample R4E that was loaded with an eccentric plate was 31% less than that of sample R4 that was loaded with a concentric plate. Sample R1.4 was obviously more favorable than sample R1.4E.
4. Prediction of Bearing Strength
In this section, the bearing strength of the current samples in this study is estimated using several proposed equations. ACI 318-11 [23] suggests the design bearing strength as a function of the characteristic compressive strength of concrete and the square root of the ratio between the bearing area and total surface area (see Equation (1) in Section 3.3.1).
Niyogi [11] introduced the following equation for the bearing strength of the samples loaded with bearing plates:
where a is the sample dimension and is the bearing plate length.
Shelson [8] provided an equation for determining the bearing strength of the concrete as follows:
in which denotes the maximum concrete bearing strength, A the total area of the concrete, the loaded area on top of the concrete, and the compressive (cube) strength of concrete (MPa).
Also, there are some previous studies that have introduced information on concrete properties related to this topic [24]. These equations are applied to the current samples of this study to estimate the bearing strength of the concrete. Table 4 presents the results of the ultimate bearing response predicted by the ACI, Niyogi, and Shelson equations. The average values of the experimental-to-predicted bearing strength ratio (fu,exp/fu,theo) were 1.07, 1.05, and 1.36 for ACI, Niyogi, and Shelson, respectively, indicating that the predicted bearing strengths were in good agreement with the experimental results.
Table 4.
Results of ultimate bearing response predicted by proposed equations.
5. Proposed Equation
New proposed Equation (4), which takes into account the effect of the loaded-to-unloaded area ratio () and the rectangularity of the bearing plate (r), is introduced in the current study as follows:
where represents the concrete bearing strength, the bearing plate area, the sample area, and the concrete compressive strength (MPa). r is the rectangularity of the bearing plate.
This equation is valid when the following limitations are met: (1) The area of the bearing plate (A1) varies (10,000 mm2, 3600 mm2, and 1600 mm2). (2) The plate length-to-width ratio is used to determine the rectangularity ratio (r) for each sample. The samples have ratios (r) of 1.4, 2.2, and 4. (3) The bearing plate has different shapes (circular, square, and rectangular). (4) The bearing plate is placed at the center of the sample. (5) The concrete compressive strength is 29 MPa. (6) The square root of A2/A1 is 2, 3.3, and 5.
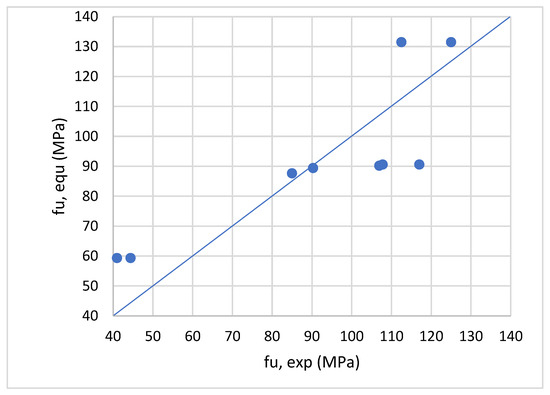
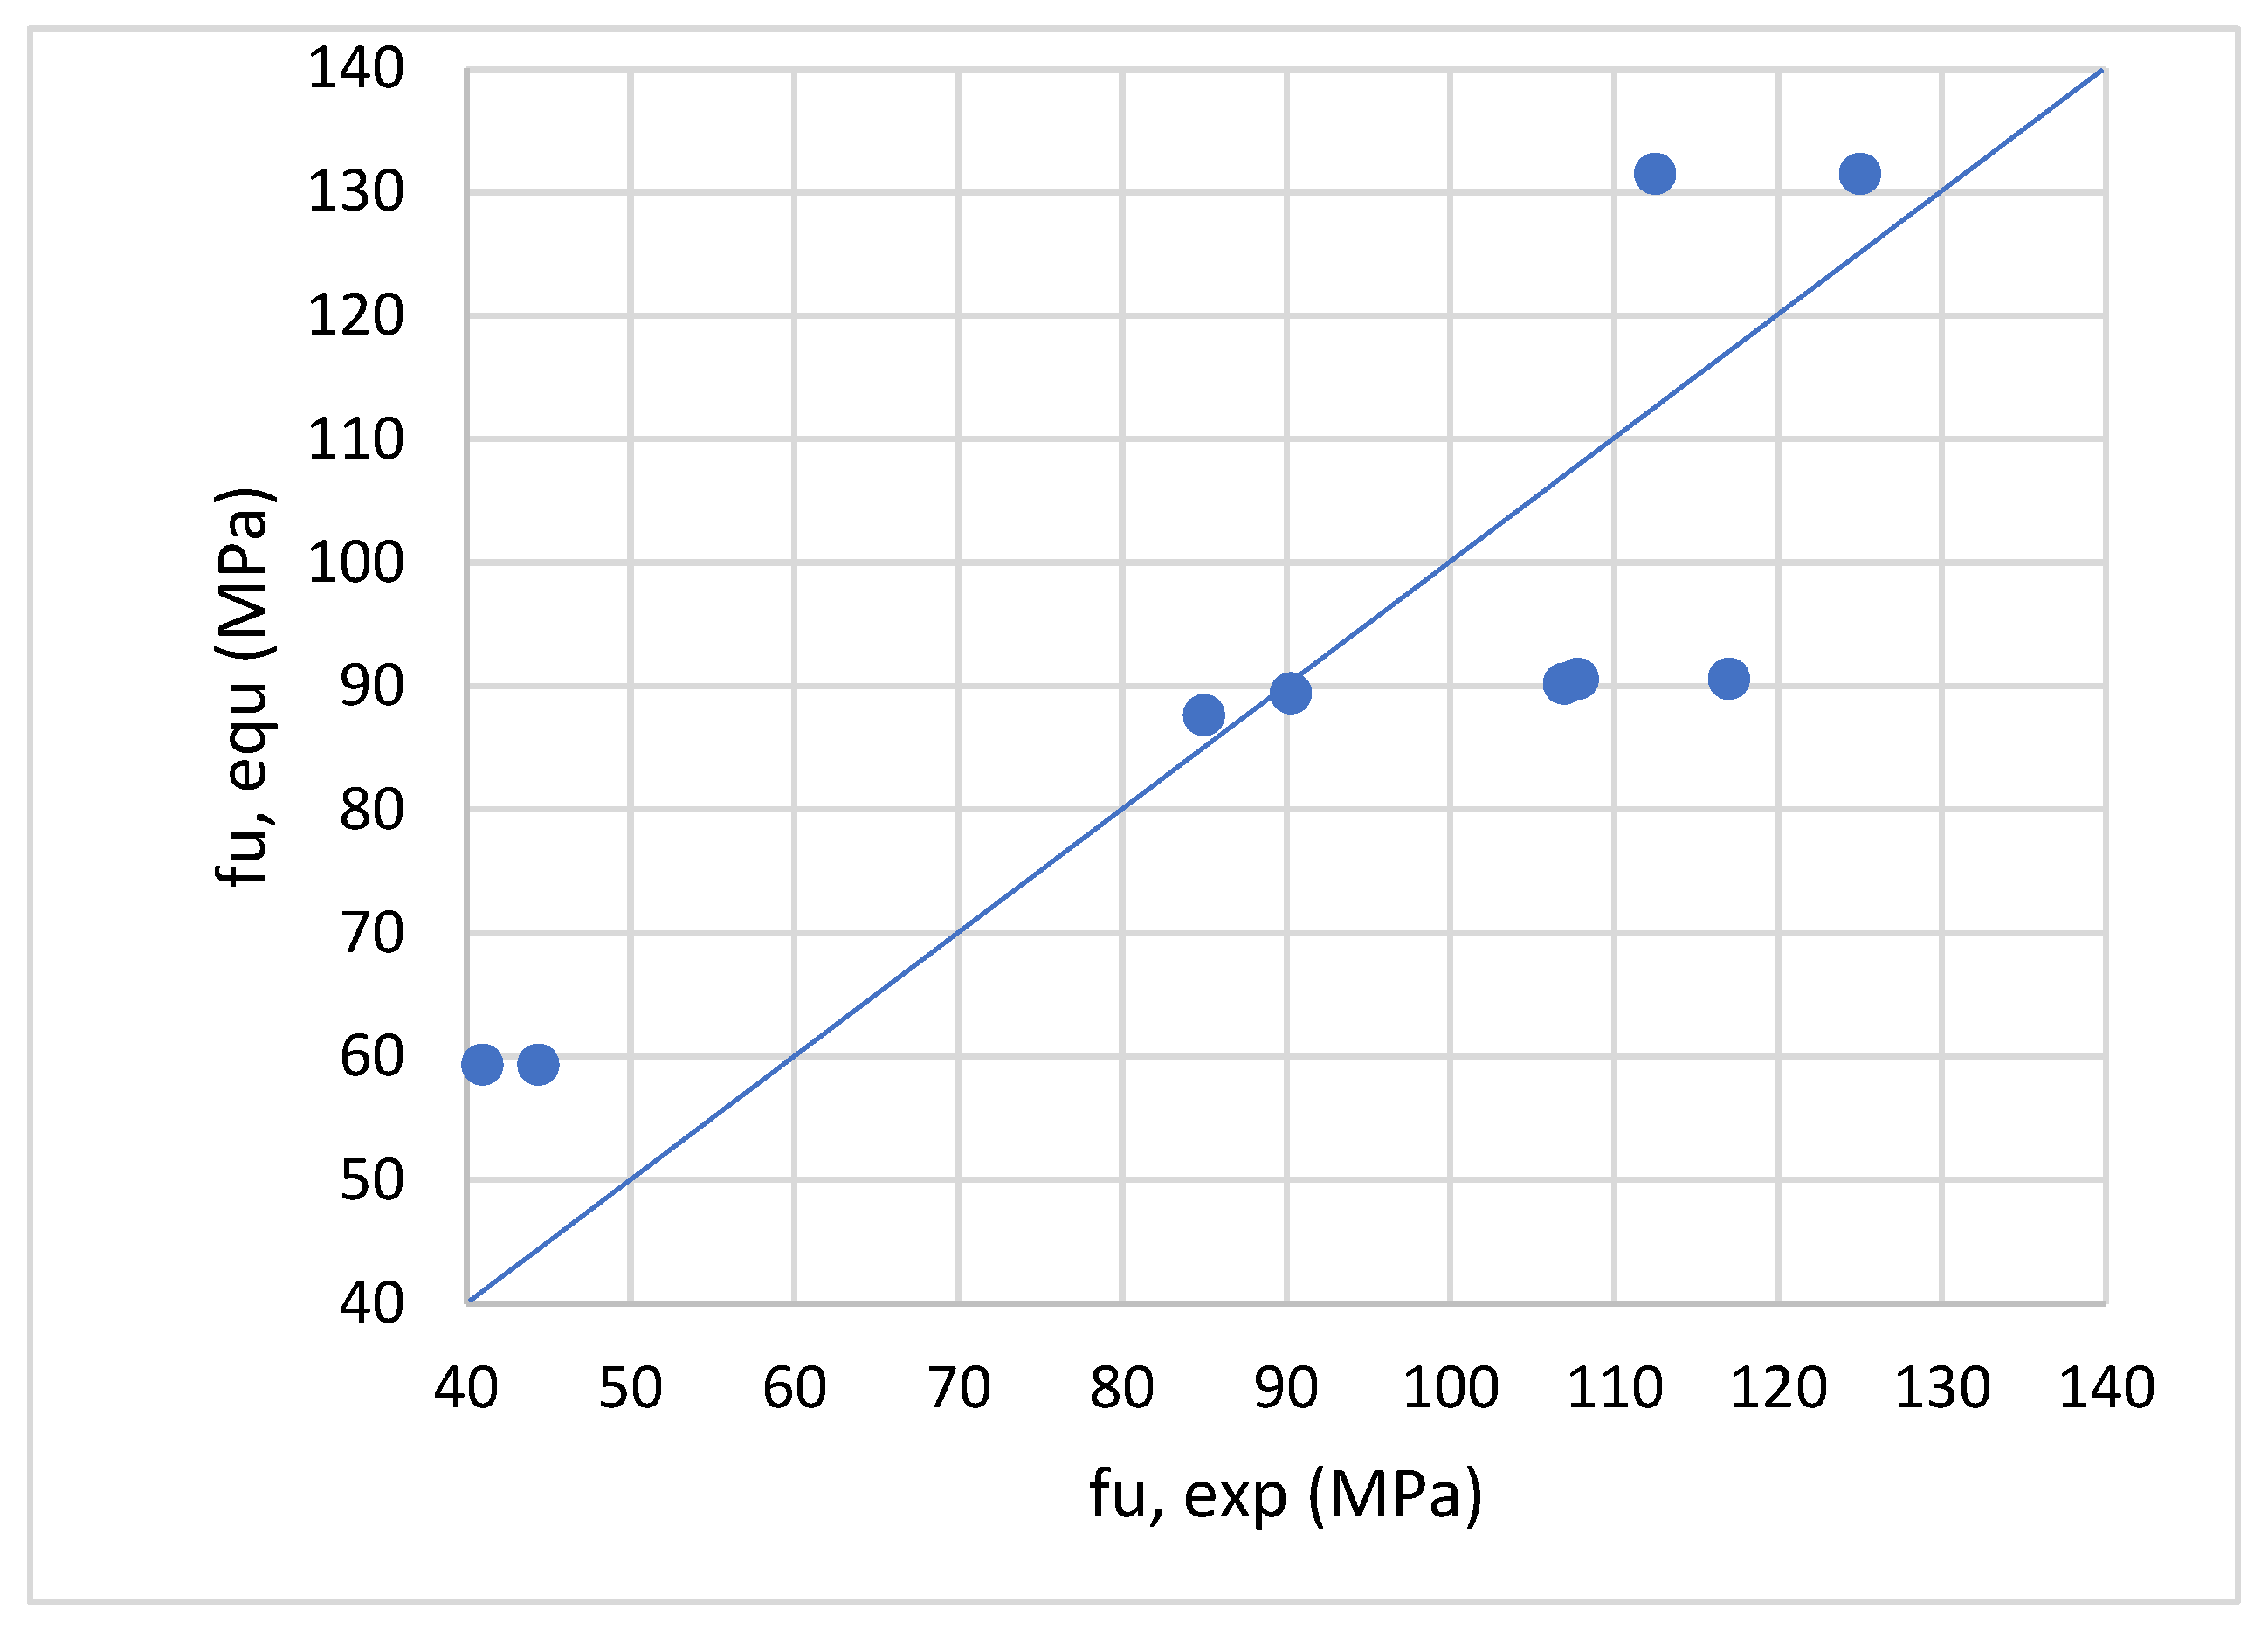
Equation (4) was applied to the samples of this study, and its results are plotted against the experimental bearing strengths in Figure 15, demonstrating that the experimental and empirical bearing strengths are in good agreement and that Equation (4) is valid for estimating the bearing strength of concrete samples, considering the effect of loaded-to-unloaded area ratio () and the rectangularity of the bearing plate (r).
Figure 15.
Comparison between fu obtained from experimental test and proposed equation.
6. Conclusions
The primary focus of this study was on the local compressive behavior of concrete materials under concentric loading. Concrete samples measuring 200 × 200 × 250 mm were tested. The concentric stress on the surface of each sample was applied using a rigid steel plate. The main parameters were the size, shape (square, rectangle, and circular with different areas), and rectangularity of the bearing plate. The effect of the loaded plate position relative to the edge of the samples was also examined. The stress–slip curves, ultimate bearing strength, failure modes, and associated slippage of the tested samples were discussed. The main findings are:
- The failure modes involved a localized damage pattern, which could be observed on the upper surface of the samples at the outer boundary of the locally compressed region.
- As the plate area, either square or circular, decreased, the ultimate bearing strength of the tested concrete samples clearly increased.
- Samples loaded with a square plate 6 × 6 cm and samples loaded with a square plate 4 × 4 cm had ultimate bearing strengths that were 163% and 175% higher, respectively, than the sample loaded with a square plate 10 × 10 cm. In contrast, when the area of the square plate was 6 × 6 cm and 4 × 4 cm in relation to a 10 × 10 cm plate, the ultimate slip of the plate decreased by 13% and 35%, respectively.
- The ultimate bearing strength of a sample loaded with a circular plate with a diameter of 7 cm and a sample loaded with a circular plate with a diameter of 4 cm was 163% and 181% higher, respectively, than that of the sample loaded with a circular plate with a diameter of 11 cm. In contrast, the ultimate slip of the circular plate decreased by 25% and 39% when the diameter of the circular plate was 7 cm and 4 cm, respectively, relative to a plate diameter of 11 cm.
- The ultimate bearing strength of the samples that were loaded with circular plates of different diameters was 8.5–11% higher than that of the samples that were loaded with square plates of different lengths.
- The ultimate bearing strength of the samples loaded with rectangular plates with a rectangularity of 1.4, 2.2, and 4 was 1, 16, and 21% lower, respectively, than that of the control sample loaded with a plate with a rectangularity of 1.
- This research is considered useful for practical applications in structural engineering, especially in concrete structures. The results of the current research are important for load-transferring elements, such as column bases, short cantilevers, superstructure piers, post-tensioned elements, support anchors, and column–footing connections.
7. Limitations of Work
The primary focus of this research work was the local compressive strength of the concrete samples under varying loading areas, positions, aspect ratios, and bearing plate shapes. Each concrete sample was 250 mm in height and had a 200 × 200 mm cross-section. The top surface of the samples (A2) was 200 × 200 mm. To apply the bearing load to the top surface of the samples, a steel bearing plate was placed there. The area of the bearing plate (A1) varied (10,000 mm2, 3600 mm2, and 1600 mm2). The ratio of plate length to plate width was used to determine the rectangularity ratio (r) for each sample. Samples had ratios (r) of 1.4, 2.2, and 4. The bearing plate had different shapes (circular, square, and rectangular). The eccentricity-to-sample width ratio (e/B) varied (0 or 0.25). After 28 days, the concrete compressive strength was 29 MPa. The square root of A2/A1 was 2, 3.3, and 5.
8. Future Work
Because the dimensions of the samples in this research are small and do not correspond to real dimensions, a study of the size effect should be conducted. In order to calculate the true stresses, a mathematical model should be derived that takes into account the dimensions of the samples. The Bažant model [25,26] is one of the most important studies that addresses the size effect. It is recommended to conduct a future study on the size effect and to determine the real bearing stresses in the case of real elements.
Author Contributions
S.F.: Conceptualization, methodology, investigation, validation, writing—original draft, writing—review and editing. A.B.: Conceptualization, methodology, formal analysis, visualization, writing—review and editing, project administration. R.I.S.: Methodology, validation, formal analysis, writing—review & editing. Y.I.: Visualization, validation, formal analysis. Y.M.B.M.: Validation, formal analysis, writing—review and editing. M.G.: Conceptualization, methodology, validation, writing—review and editing. All authors have read and agreed to the published version of the manuscript.
Funding
This research received no external funding.
Data Availability Statement
The experimental data can be obtained through email communication with the corresponding authors.
Conflicts of Interest
The authors declare no competing interests.
References
- Miao, T.M.; Chen, S.J.; Wang, H.L.; Zhang, L. Model for calculating local bearing capacity of concrete with spiral stirrups. Constr. Build. Mater. 2023, 389, 131762. [Google Scholar] [CrossRef] [Scilit]
- Fayed, S.; Mansour, W.; Tawfik, T.A. Bearing behavior of steel fiber reinforced recycled aggregate concrete blocks. Structures 2023, 57, 105249. [Google Scholar] [CrossRef] [Scilit]
- Fayed, S.; Mansour, W.; Tawfik, T.A.; Sallam, H.E.M. Effect of block size on bearing strength of steel fiber-reinforced recycled aggregate concrete. Arab. J. Sci. Eng. 2024, 49, 5287–5303. [Google Scholar] [CrossRef] [Scilit]
- Rao, C.K.; Swamy, R.N. Bearing strength of steel fibre reinforced concrete. Build. Sci. 1974, 9, 263–268. [Google Scholar] [CrossRef] [Scilit]
- Ince, R.; Arici, E. Size effect in bearing strength of concrete cubes. Constr. Build. Mater. 2004, 18, 603–609. [Google Scholar] [CrossRef] [Scilit]
- Escobar-Sandoval, E.D.; Whittaker, A.S.; Dargush, G.F. Concentrically loaded circular steel plates bearing on plain concrete. J. Struct. Eng. 2006, 132, 1784–1792. [Google Scholar] [CrossRef] [Scilit]
- Meyerhof, G.G. The bearing capacity of concrete and rock. Mag. Concr. Res. 1953, 4, 107–116. [Google Scholar] [CrossRef] [Scilit]
- Shelson, W. Bearing capacity of concrete. J. Am. Concr. Inst. Proc. 1957, 54, 405–414. [Google Scholar]
- Au, T.; Baird, D.L. Bearing capacity of concrete blocks. J. Am. Concr. Inst. Proc. 1960, 56, 869–880. [Google Scholar]
- Hawkins, N.M. The bearing strength of concrete loaded through rigid plates. Mag. Concr. Res. 1968, 20, 31–40. [Google Scholar] [CrossRef] [Scilit]
- Niyogi, S.K. Bearing strength of concrete—Geometric variations. J. Struct. Div. 1973, 99, 1471–1490. [Google Scholar] [CrossRef] [Scilit]
- Niyogi, S.K. Concrete bearing strength—Support, mix, size effect. J. Struct. Div. 1974, 100, 1685–1702. [Google Scholar] [CrossRef] [Scilit]
- Bauschinger, J. Tests with blocks of natural stone. Mech. Tech. Lab. Kgl. 1876, 6, 13. [Google Scholar]
- Cao, S.Y.; Yang, X.K. Working mechanism and strength theory of concrete under local pressure. J. Harbin Coll. Arch. Eng. 1982, 3, 47–56. (In Chinese) [Google Scholar]
- Cai, S.H.; Xue, L.H. Local bearing strength of high-strength concrete. J. China Civ. Eng. 1994, 27, 52–61. (In Chinese) [Google Scholar]
- Breen, J.E.; Burdet, O.; Roberts, C.; Sanders, D.H. Anchorage Zone Reinforcement for Post-Tensioned Concrete Girders; NCHRP Report; Transportation Research Board: Washington, DC, USA, 1994; Volume 356. [Google Scholar]
- Bonetti, R. Ultimate Strength of the Local Zone in Load Transfer Tests. Master’s Thesis, Virginia Polytechnic Institute and State University, Blacksburg, VA, USA, 2005. [Google Scholar]
- Kim, J.R.; Kwak, H.G.; Kim, B.S.; Kim, Y.J. Finite element analyses and design of post-tensioned anchorage zone in ultra-high-performance concrete beams. Adv. Struct. Eng. 2019, 22, 323–336. [Google Scholar] [CrossRef] [Scilit]
- Li, S.; Zheng, W.Z.; Xu, T.; Zhang, Y. Artificial neural network model for predicting the local compression capacity of stirrups-confined concrete. Structures 2022, 41, 943–956. [Google Scholar] [CrossRef] [Scilit]
- Zhou, W.; Hu, H.B.; Zheng, W.Z. Bearing capacity of reactive powder concrete reinforced by steel fibers. Constr. Build. Mater. 2013, 48, 1179–1186. [Google Scholar] [CrossRef] [Scilit]
- Zhou, W.; Hu, H.B. Bearing capacity of steel fiber reinforced reactive powder concrete confined by spirals. Mater. Struct. 2015, 48, 2613–2628. [Google Scholar] [CrossRef] [Scilit]
- Li, S.; Chen, J.J.; Wang, L.F.; Zhang, X. Local compression capacity of ultra-high performance concrete containing coarse aggregate: Testing and calculation method. J. Build. Eng. 2023, 76, 107411. [Google Scholar] [CrossRef] [Scilit]
- ACI318-11; Building Code Requirements for Structural Concrete and Commentary. American Concrete Institute: Farmington Hills, MI, USA, 2011.
- Wu, Y.Q.; Liu, J.; Zhang, H.; Wang, Z. Compressive strength prediction of sleeve grouting materials in prefabricated structures using hybrid optimized XGBoost models. Constr. Build. Mater. 2025, 476, 141319. [Google Scholar] [CrossRef] [Scilit]
- Bažant, Z.P. Size effect. Int. J. Solids Struct. 2000, 37, 69–80. [Google Scholar] [CrossRef] [Scilit]
- Bažant, Z.P. Size effect on structural strength: A review. Arch. Appl. Mech. 1999, 69, 703–725. [Google Scholar] [CrossRef] [Scilit]

Disclaimer/Publisher’s Note: The statements, opinions and data contained in all publications are solely those of the individual author(s) and contributor(s) and not of MDPI and/or the editor(s). MDPI and/or the editor(s) disclaim responsibility for any injury to people or property resulting from any ideas, methods, instructions or products referred to in the content. |
© 2026 by the authors. Licensee MDPI, Basel, Switzerland. This article is an open access article distributed under the terms and conditions of the Creative Commons Attribution (CC BY) license.