


Abstract
With global warming and accelerated urbanization, building air-conditioning (AC) releases more heat into the environment, exacerbating the urban heat island (UHI) effects and increasing building cooling energy consumption. Existing research has limited quantification of the impact of air-conditioning anthropogenic heat (ACAH) on the cooling energy consumption of different types. This study aims to explore the distribution characteristics of ACAH and its impact on residential building energy consumption. Firstly, typical residential buildings in the Pearl River Delta region were selected as a case study. Field experiments were conducted to measure temperature and humidity at 0.5 m, 1 m, 2 m, and 3 m from the outdoor unit, alongside ambient temperature and wind speed. Three grid densities were applied to verify the CFD model, with a prediction error of less than 0.3 °C at 0.5 m under a medium grid. The simulated temperature at 1 m from the outdoor unit under calm wind conditions was compared with field measurements to reveal the horizontal and vertical distribution characteristics of ACAH. Secondly, the effects of different building shapes, ambient temperatures, and wind speeds on the spatial distribution of ACAH were investigated. Finally, EnergyPlus (V23.1.0) was employed as the building energy simulation software, with its microclimate coupling interface implemented via Python scripts to quantify cooling energy consumption variations across different building floors under ACAH influence. Results indicated that ACAH exhibits significant horizontal non-uniformity, exerting the greatest impact within a 0.5 m radius (affected air temperature 4.3 °C higher than ambient). Vertically, localized heat accumulation occurs in the building’s central area, with air temperature 3.5 °C higher than at the bottom. Furthermore, compared to fixed meteorological conditions, the cooling energy consumption difference across floors considering ACAH reaches approximately 7.8%. This study provides accurate meteorological boundary conditions for building energy assessment and supports microclimate management in residential areas.
1. Introduction
1.1. Background
Air-conditioning (AC) energy consumption usually accounts for more than 40% of building energy consumption. By 2050, building AC energy consumption is expected to increase by about three times [1]. The waste heat released by AC systems, defined as air-conditioning anthropogenic heat (ACAH), not only gives rise to a local air temperature increase of 2–8 °C [2] near buildings, but also lowers the operational efficiency of the outdoor unit, thereby further raising cooling energy consumption. With the acceleration of global warming and urbanization [3,4], the energy demand of buildings will gradually increase, and AC will release more heat into the environment, exacerbating the urban heat island (UHI) effects [5,6]. This phenomenon seriously affects the quality of the urban environment and the comfort of residents, and also poses a challenge to the sustainable development of cities [7]. Therefore, studying the distribution law of building ACAH and its impact on building energy consumption is of great significance for creating a comfortable and healthy living environment.
The microclimate near buildings is affected by a variety of factors, including weather conditions (such as air temperature, humidity, and wind speed) and building anthropogenic heat dissipation [8]. High summer temperatures raise indoor cooling demand and reduce the efficiency of the outdoor unit, leading to higher building cooling energy consumption [9]. Meanwhile, waste heat from the outdoor unit worsens the microclimate around buildings. Especially in high-density building clusters, the shading effect of buildings makes the surrounding flow field complex, and stagnant airflow may form in the streets. This can lead to the accumulation of heat around buildings, thereby enhancing the UHI effects [10]. Especially against the backdrop of the increasing number and frequency of use of AC equipment, this will further deteriorate the microclimate of buildings, leading to increased building energy consumption [11].
1.2. Literature Review
Existing research has quantified the impact of ACAH on urban microclimate and building energy consumption. Hsieh et al. [7] found significant differences in ACAH among different building types, with residential buildings accounting for 74.5% of total waste heat emissions. Commercial buildings exhibited daytime ACAH intensity 10 times that of residential buildings, while the nighttime ACAH impact was more significant for residential buildings. Munck et al. [12] confirmed that ACAH has a greater impact on nighttime street temperatures; a 2 °C increase in street temperature during peak nighttime cooling load resulted in a UHI intensity increase from 4.5 °C to 6.4 °C after considering ACAH. Ohashi and Wang et al. [13,14] found that ACAH can raise the temperature around office buildings by 1–2 °C [15], with a 0.1–1.1 °C temperature rise on the windward side and an average temperature rise of 1.4 °C higher on the leeward side than on the windward side. Studies by Liu et al. [16] have shown that when the indoor set temperature is lowered from 28 °C to 22 °C, the AC airflow efficiency (ACAH) increases by 123 W/m2, the outdoor temperature rises by 0.336 °C, and the AC operating efficiency decreases by 1%. Yuan et al. [17] further pointed out that there are differences in room temperature on different floors in high-density tropical urban residences, and residents on higher floors face a higher risk of heat during heat waves.
The spatiotemporal distribution characteristics of ACAH around buildings vary significantly. Chow et al. [18] found that ACAH exacerbates air buoyancy, having a greater impact on the performance of upper-floor outdoor units; low-wind speeds exacerbate this effect, causing temperatures near the outdoor units to exceed 38 °C. Bojic et al. [19] found that the rising hot airflow and vortices formed within building recesses significantly affect the operation of high-rise outdoor units; in high-rise, high-density buildings, ACAH can cause a temperature rise of up to 11 °C, 4 °C higher than lower floors. Tong et al. [20] found that the location of ACs affects local heat dissipation, influencing heat accumulation intensity by 1.2%. Mei et al. [21] confirmed that heat is more likely to accumulate in high-density urban areas, thus exacerbating the UHI (Ultra-High Intensity Heat) effect.
Furthermore, the outdoor temperature rise caused by ACAH increases building energy consumption [22]. Hsieh et al. [23] found that ACAH raises the average temperature around a building by 1.89 °C compared to the environment, increasing building power consumption by approximately 10.7%. Zhong et al. [15] confirmed that ACAH increases indoor cooling load in the leeward zone of a building by 0.8–53.4 kW, three times that of the windward zone. Zhou et al. [24] quantified the positive correlation between anthropogenic heat emissions and building energy consumption using remote sensing technology, while Hong et al. [25] analyzed the impact of diurnal and seasonal variations in anthropogenic heat emissions on the energy consumption of different buildings, confirming a significant positive correlation. Simultaneously, ACAH worsens the outdoor environment and reduces AC efficiency: Abdullah et al. [26] found that when the temperature near the outdoor unit rises from 35 °C to 48 °C, the air-conditioning COP decreases by 25%. Han et al. [27] ‘s research indicates that split-type air conditioners have a more severe impact on the environment than central air-conditioning systems [28], and the most significant increase in energy consumption occurs when the outdoor unit is located in the middle of the building, where heat accumulation is more likely.
However, critical research gaps still exist. First, most studies concentrate on the horizontal distribution of ACAH and lack systematic quantification of vertical ACAH accumulation among different residential building forms. Second, the quantitative influences of building geometry, ambient temperature and wind speed on ACAH diffusion and accumulation have not been fully revealed. Third, traditional building energy simulation adopts uniform meteorological parameters and ignores the vertical temperature stratification caused by ACAH, making it difficult to accurately predict the cooling energy consumption differences among different floors.
1.3. Research Objectives and Structure
To address the aforementioned shortcomings, this study aims to explore the distribution characteristics of ACAH in residential buildings and its impact on building energy consumption. The research questions are: first, the horizontal and vertical spatial distribution patterns of ACAH in high-density residential buildings are not yet clear; second, the mechanisms by which ambient temperature, wind speed, and building morphology affect ACAH diffusion and accumulation lack quantitative explanation; and third, traditional energy consumption simulations often use uniform meteorological parameters, neglecting the vertical temperature stratification caused by ACAH, making it difficult to accurately reflect the energy consumption differences between different floors. Therefore, this study uses six typical residential building types in the Pearl River Delta region as research objects, employing a combination of experimental testing and numerical simulation to reveal the horizontal and vertical distribution patterns of ACAH. Simultaneously, the relationship between different building morphologies and outdoor heat storage effects is analyzed. Through simulation, the impact of different building shapes, ambient temperatures, and wind speeds on ACAH distribution is quantified. Finally, a building energy consumption model considering dynamic changes in local microclimates is constructed to study the impact of ACAH on cooling energy consumption in different areas of the building.
The main innovations of this study can be summarized as follows: (a) the distribution differences in ACAH in six typical residential building types were systematically quantified; (b) the vertical misalignment phenomenon between peak energy consumption and peak temperature was revealed; and (c) a refined floor-level energy consumption assessment method based on CFD–EnergyPlus dynamic coupling was established. This study provides more accurate meteorological boundary conditions for building energy consumption simulation and provides a basis and support for AC operation control strategies and microclimate management in high-rise buildings.
2. Research Methods
2.1. Case Study
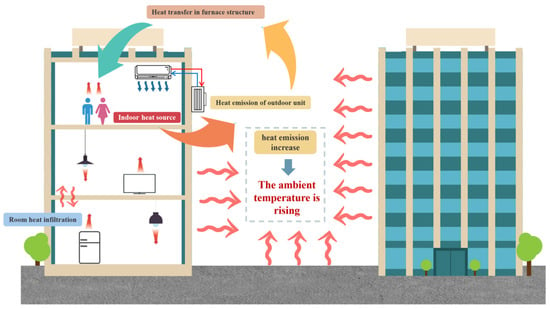
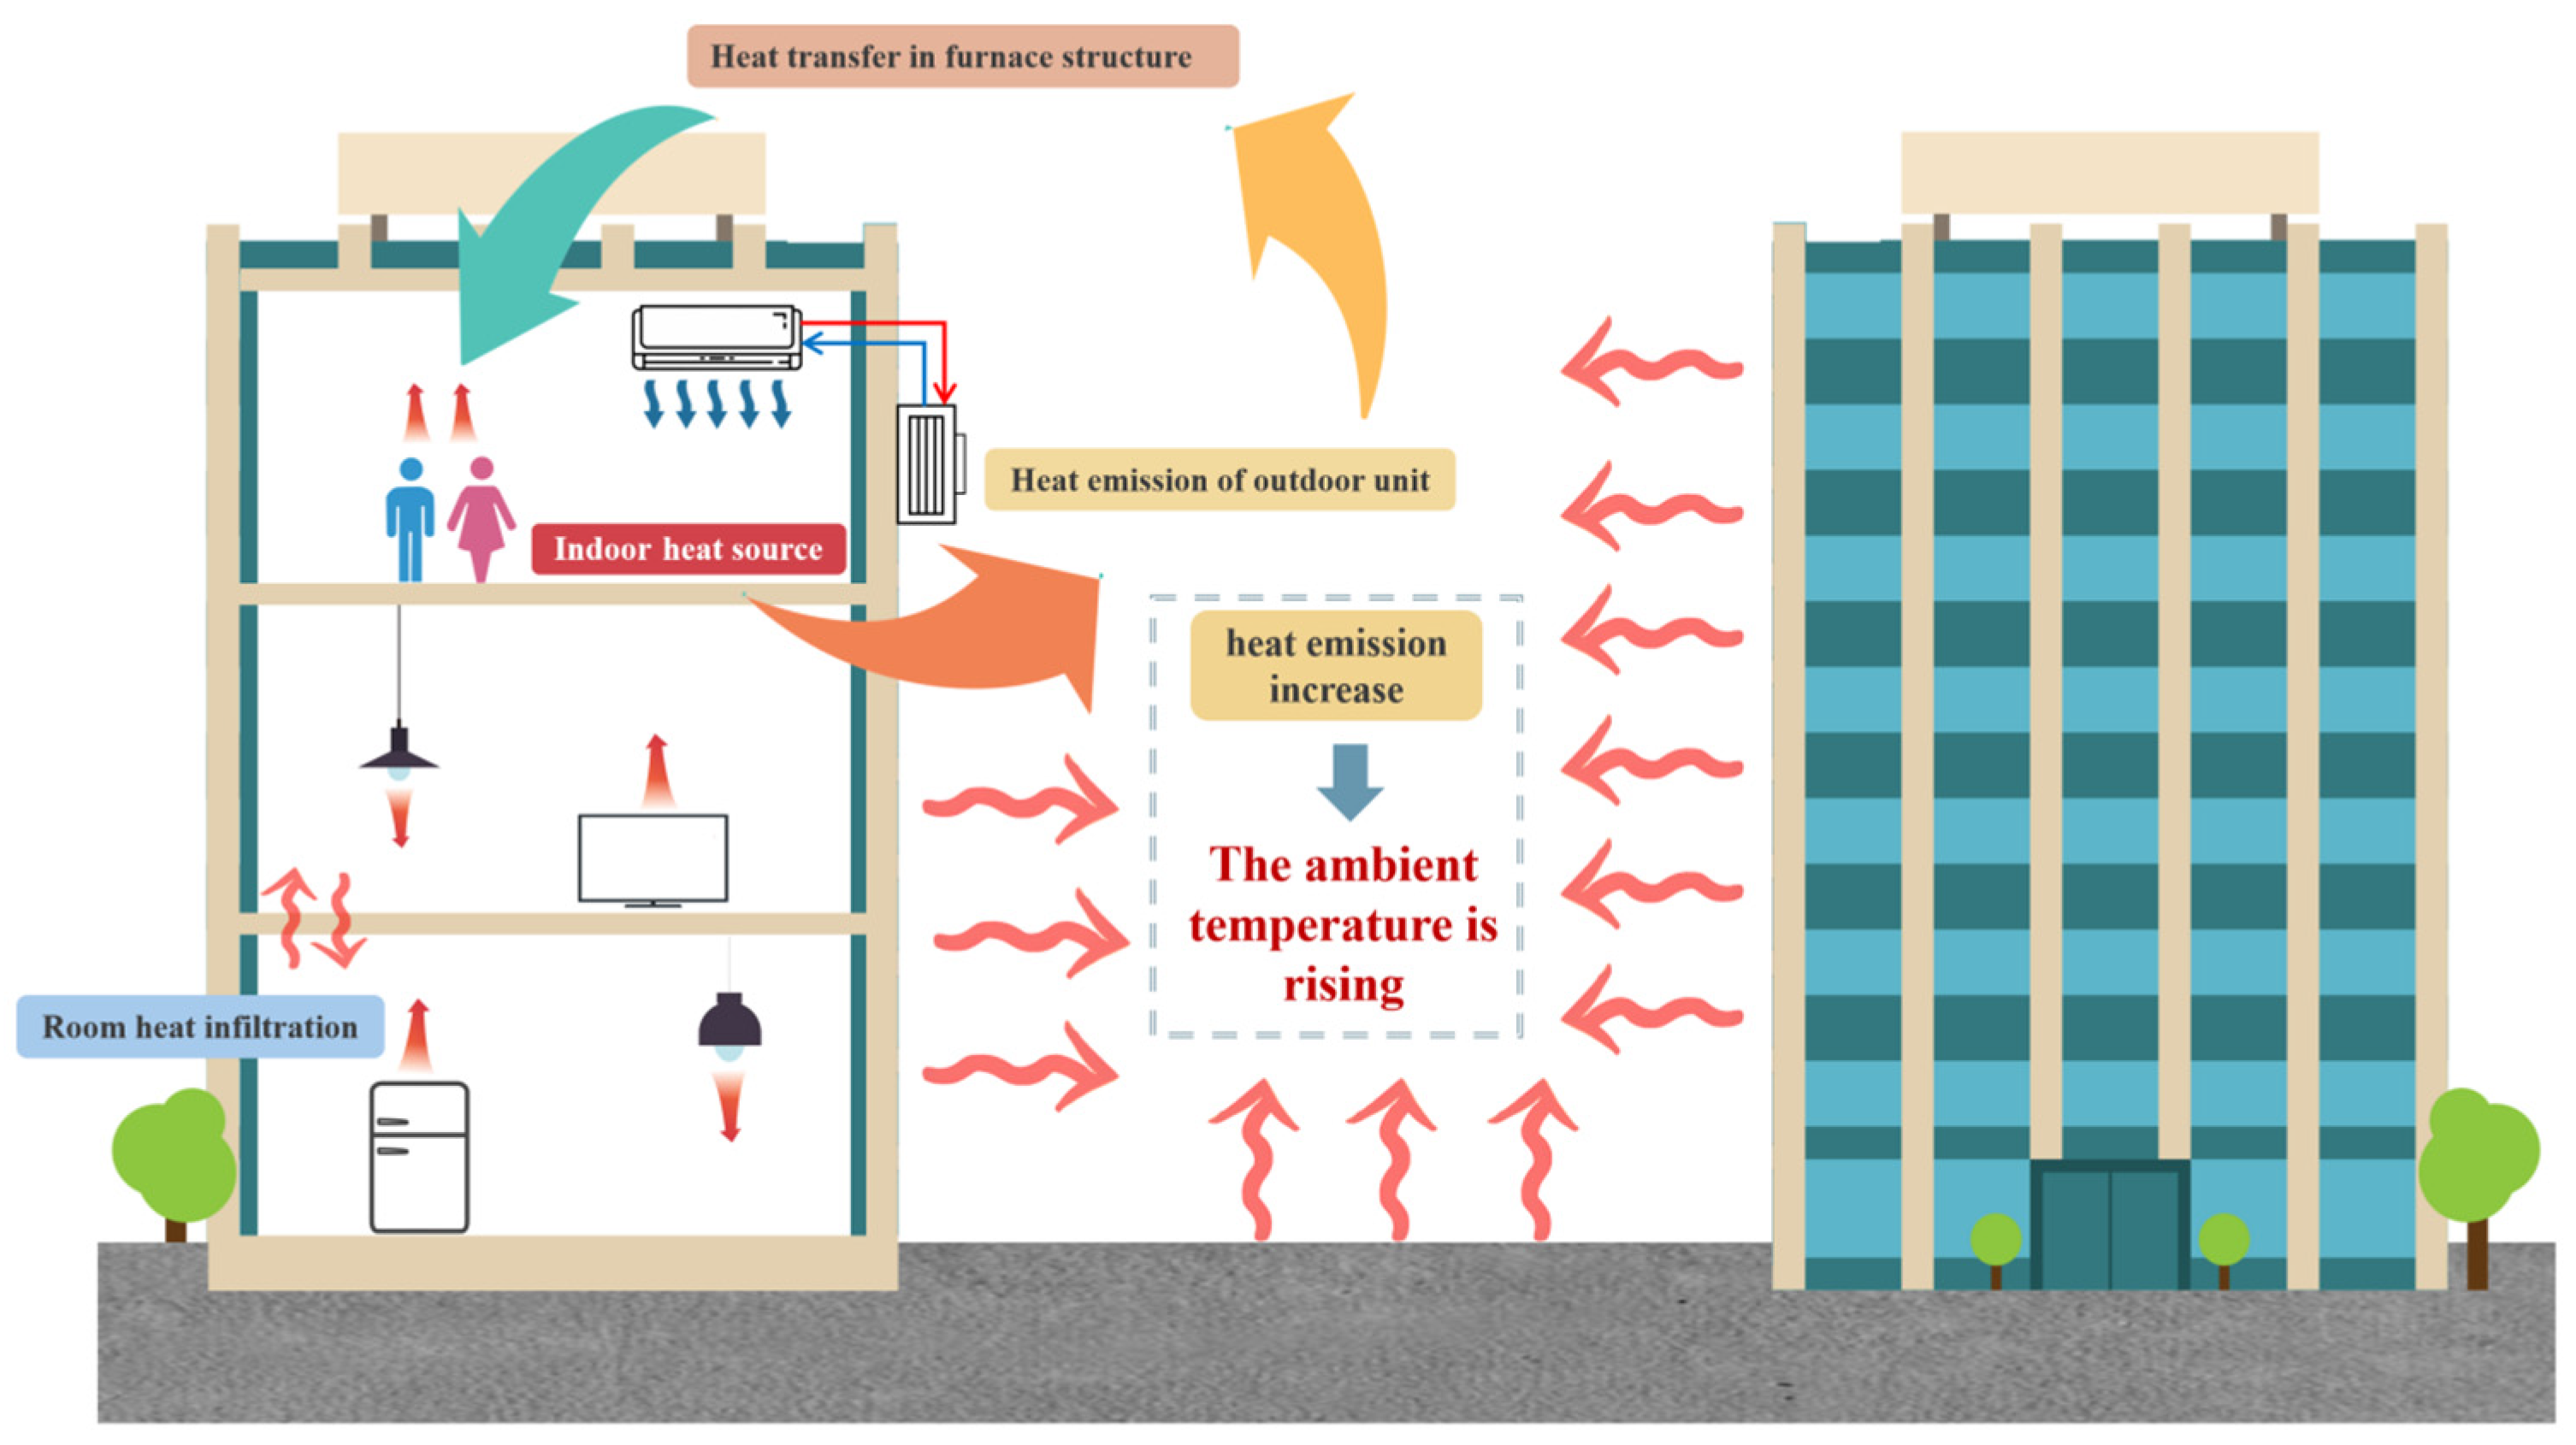
The principle of ACAH is based on the dynamic coupling of the refrigeration cycle and the heat transfer process [29]. Its core lies in transferring indoor heat to the outdoor environment through the AC system. This process involves not only heat absorption and emission, but is also closely related to various factors such as heat transfer in the building envelope, indoor heat sources, and room infiltration, as shown in Figure 1.
Figure 1.
The impact of building air-conditioning on microclimates.
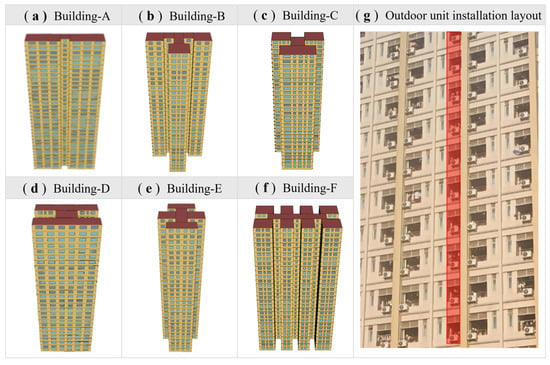
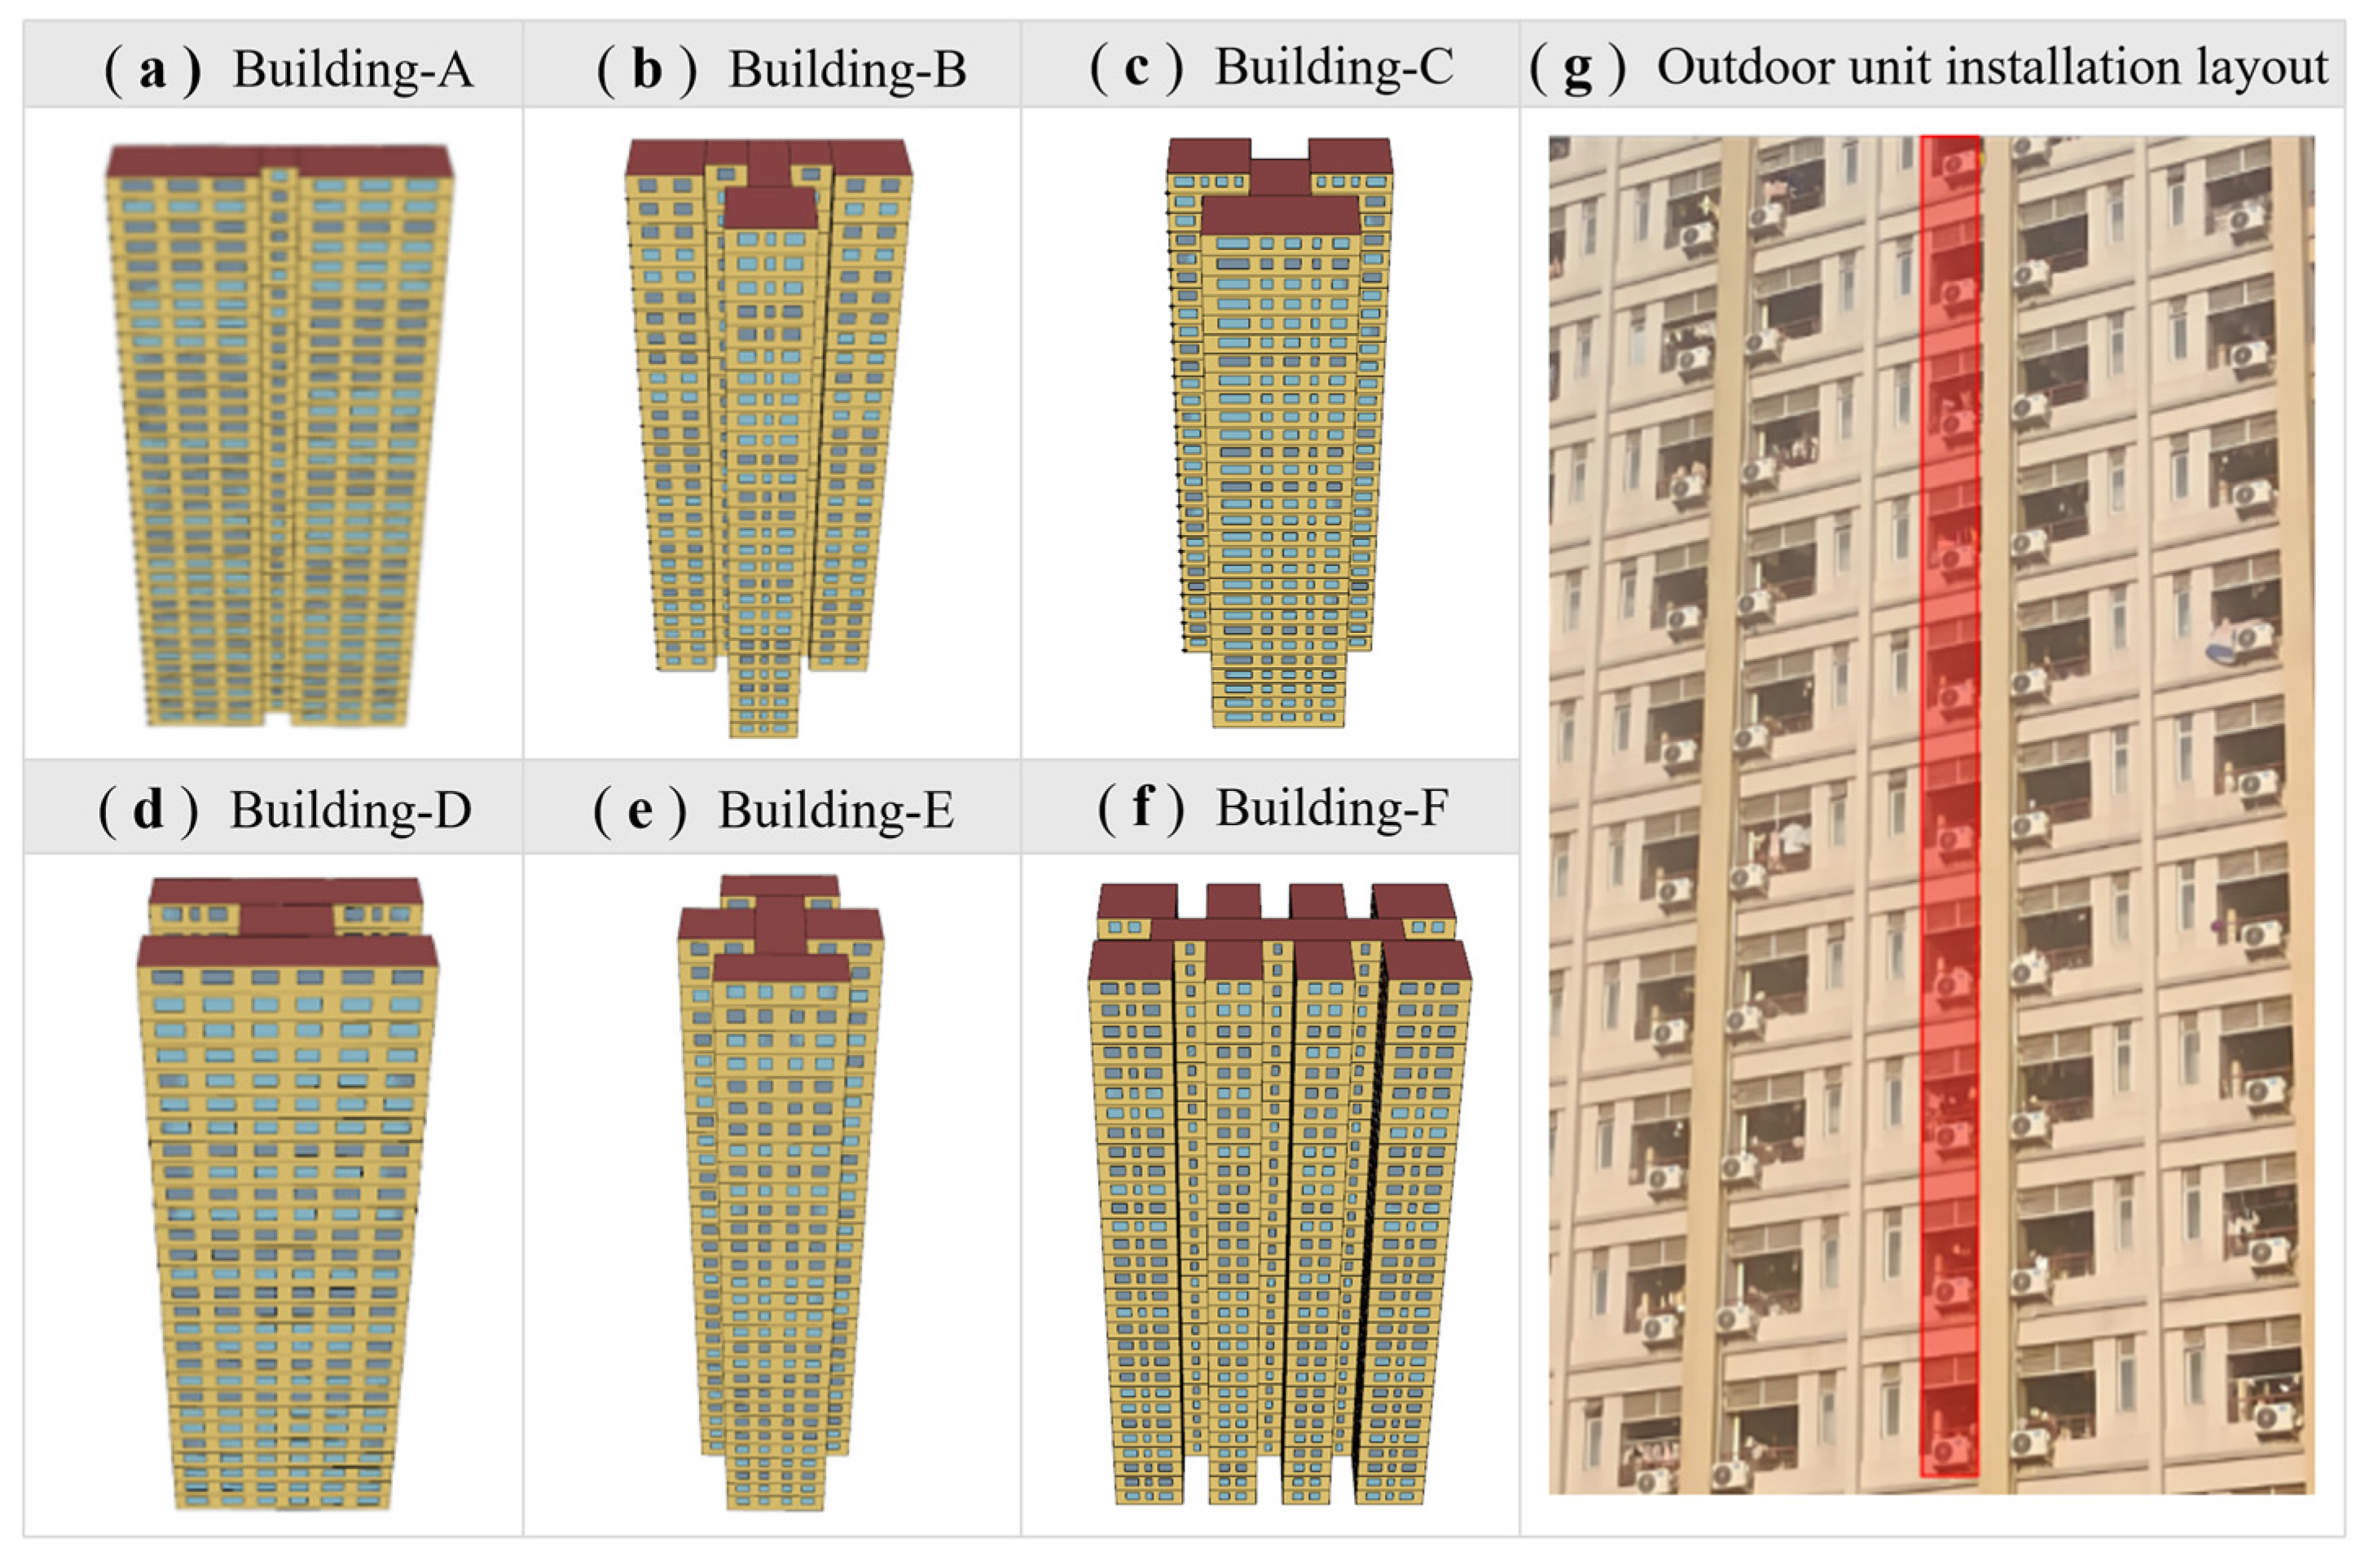
The case studies in this study are six typical residential buildings in Guangzhou city, China [30], as shown in Figure 2. Through statistical analysis of 350 types and a total of 1300 individual residential buildings in the region, combined with the cluster analysis results of key parameters such as building area, shape coefficient, and building height, six basic residential building types covering the mainstream residential characteristics of the Pearl River Delta region were extracted. The relevant parameters of the six types of typical residential buildings include building shape, number of floors, height, and spacing, as shown in Table 1. It is assumed that the simulated object is located on a flat reference horizontal plane, and the undulation of the terrain is not considered, so as to facilitate the analysis and understanding of the simulation results. In reality, the outdoor units are all arranged vertically on the exterior wall, and this paper only studies the impact of ACAH on the microclimate around the building. In order to improve the computational efficiency of the simulation and maintain the physical accuracy of the model, it is modeled as a vertical strip rather than a single outdoor unit model, as shown in Figure 2.
Figure 2.
Schematic diagram of a typical single-house building.
Table 1.
Relevant parameters of six typical residential building types.
2.2. Measurement of Air-Conditioning Anthropogenic Heat
2.2.1. Experimental Instruments
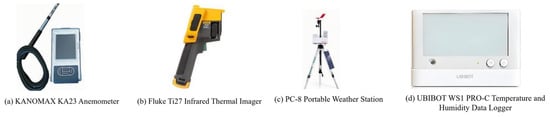
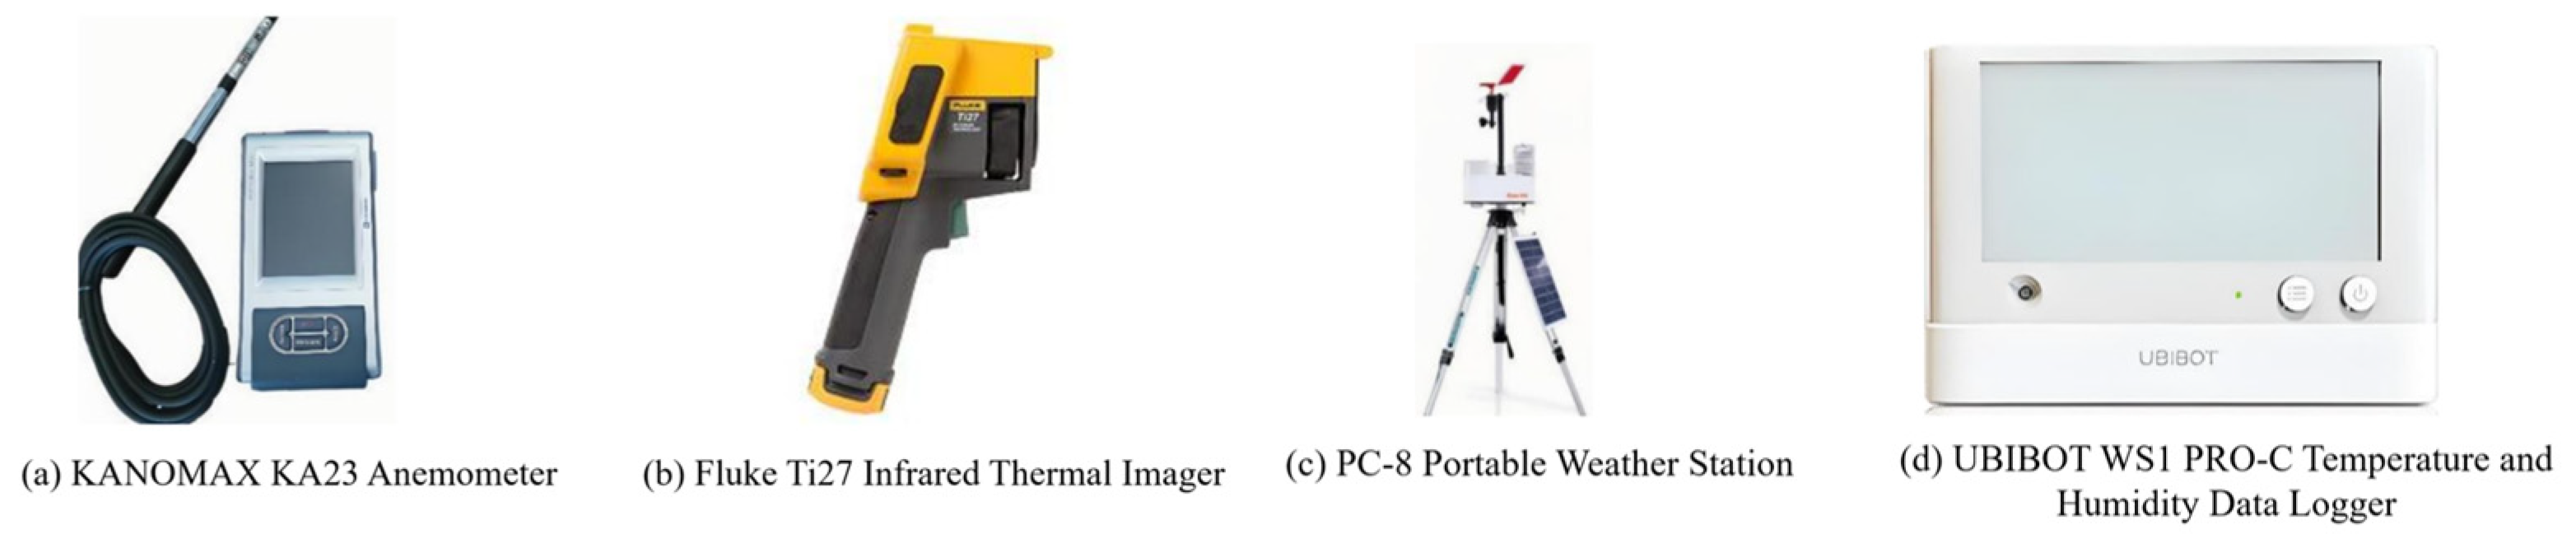
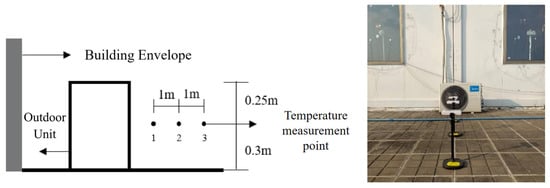
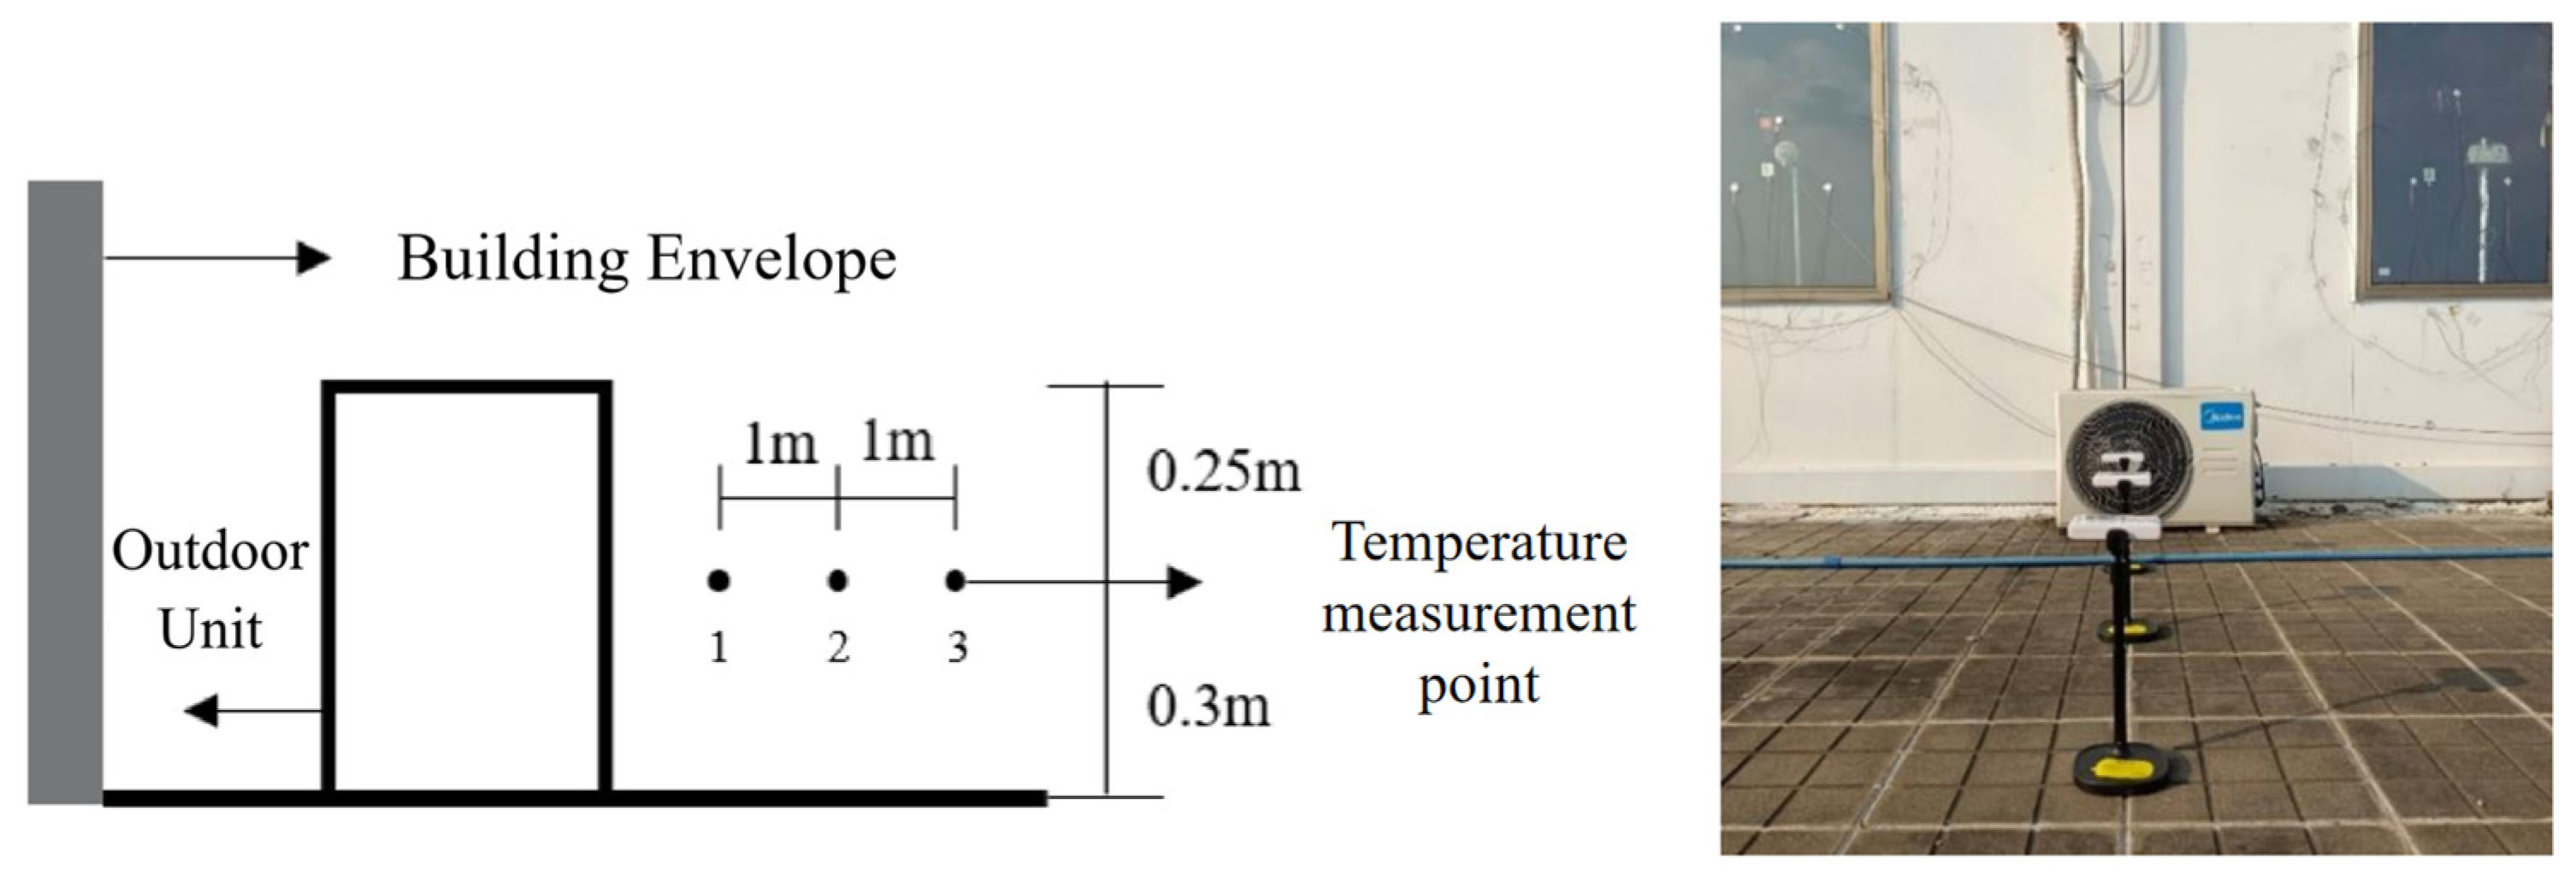
In this experiment, a series of key physical parameters of ACAH were measured in Guangzhou city, China, including the outdoor unit’s inlet and outlet air temperatures, the outdoor ambient temperature and wind speed, the laboratory temperature and humidity, and the wind speed at the outdoor unit’s exhaust surface. The instruments and equipment used in the experiment and their detailed performance parameters are shown in Figure 3 and Table 2.
Figure 3.
Experimental testing instrument.
Table 2.
Table of experimental instrument parameters.
2.2.2. Test Point Layout
(1) Outdoor Unit Exhaust Temperature Measurement
In this experiment, three measuring points were set at distances of 1 m, 2 m, and 3 m from the outdoor unit’s exhaust port, respectively, designated as measuring point 1, measuring point 2, and measuring point 3, to accurately assess the impact of the outdoor unit’s exhaust port on the surrounding environment. The measuring points were aligned horizontally with the center of the outdoor unit’s exhaust port to ensure data accuracy and comparability. As shown in Figure 4.
Figure 4.
Exhaust of temperature measurement points for outdoor unit heat and actual layout of outdoor unit heat exhaust temperature measurement points.
(2) Wind Speed Measurement Points
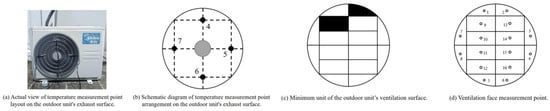
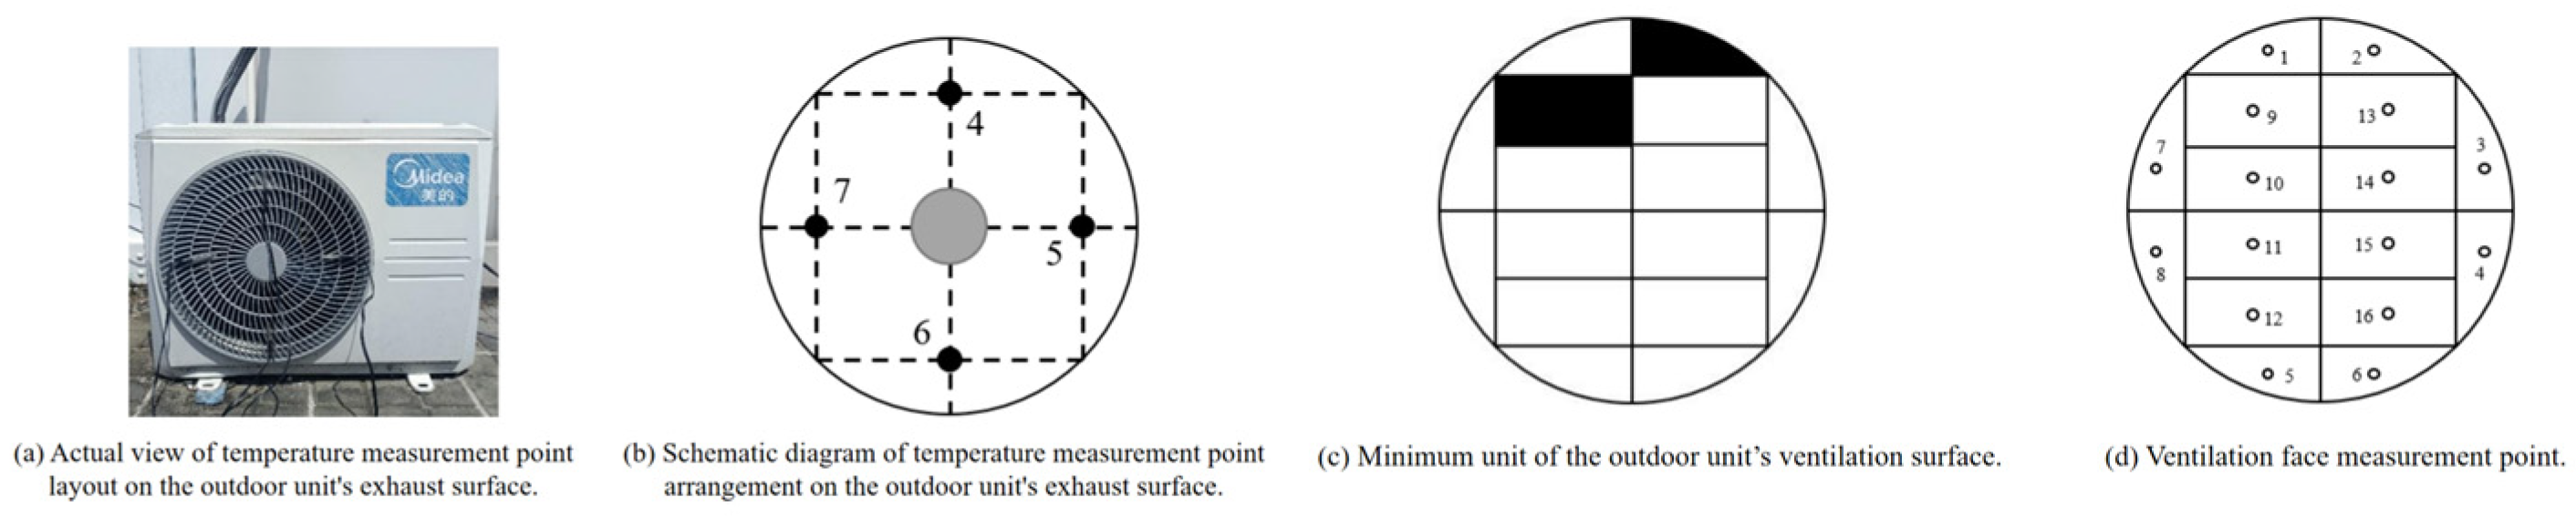
Four measuring points (4–7) were arranged at the outdoor unit’s exhaust surface to measure the exhaust temperature of the air conditioner’s outdoor unit, as shown in Figure 5.
Figure 5.
Wind speed measurement points of ACAH.
(3) Measurement of outdoor unit exhaust volume
Outdoor unit exhaust usually involves vortices of various sizes. These vortices are constantly breaking, merging and rebuilding, resulting in irregular and chaotic flow. This non-uniformity of the flow field makes the measurement of the outdoor unit’s exhaust volume very complicated. According to the existing literature, the exhaust volume can be measured by cross-sectional segmentation. The outdoor unit’s exhaust surface is divided into 16 small units using two shapes, as shown in Figure 5. The wind speed measuring point is arranged at the centroid of each unit. The exhaust volume of the outdoor unit is the product of the wind speed at each measuring point and the area of each unit, and then the sum is added together.
2.3. Simulation of Air-Conditioning Anthropogenic Heat
Computational fluid dynamics (CFD) methods covers a large number of physical models from various disciplines [31]. It can solve problems involving fluid mechanics and thermodynamics, and optimize traditional physical models such as turbulence and heat conduction. CFD has suitable numerical solutions for various types of physical problems. In the relevant research of ACAH, the CFD method has been widely used, and its reliability has been confirmed by the comparison of a large number of field measurements and numerical simulations conducted by most researchers [32].
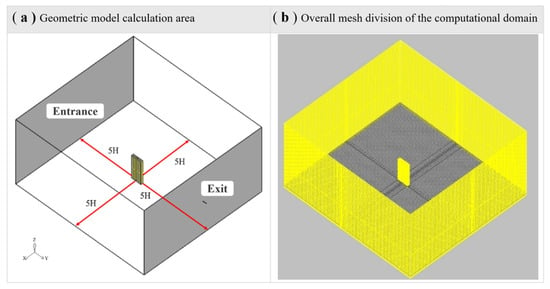
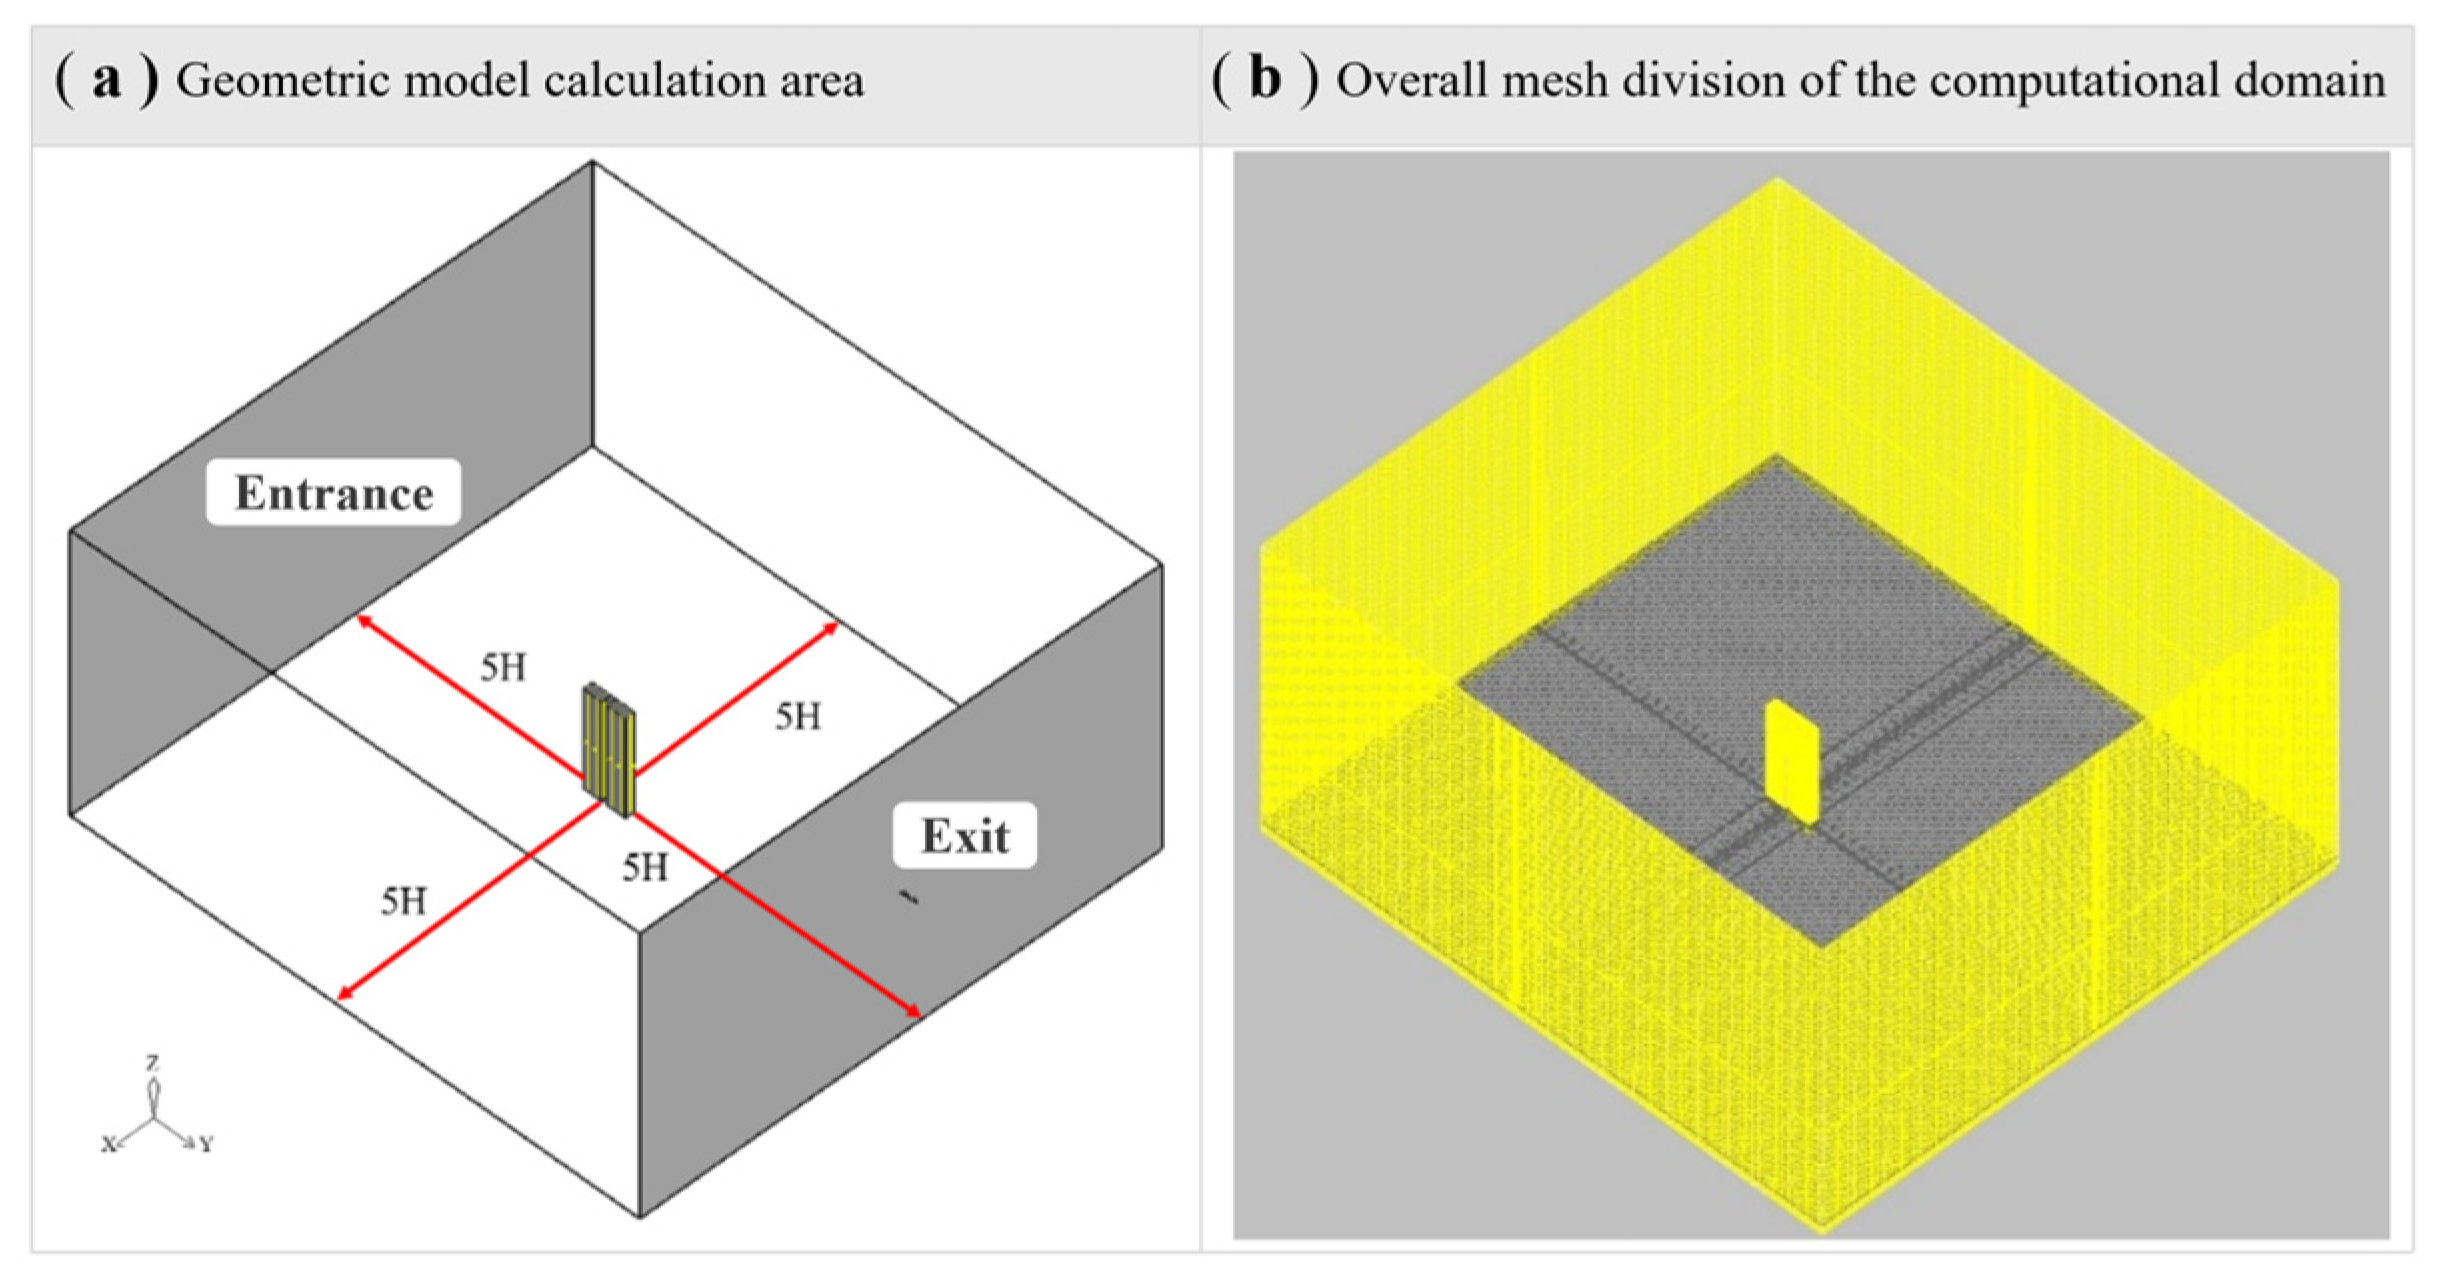
This study uses Airpak 2.0 software to conduct ACAH numerical simulation and selects the RNG k-ε turbulence model. The eddy viscosity coefficient of this model can accurately consider the influence of thermal buoyancy on turbulence. Compared with various models used by previous researchers, it has the smallest error in predicting vertical heat diffusion and is suitable for the flow scenario of natural convection and forced convection coupling in this study. First, the boundary conditions of the ACAH model are determined, including meteorological data parameters and building model parameters. The meteorological parameters include atmospheric temperature, relative humidity and wind speed. The building model parameters include the spatial morphology parameters of the building, the thermal characteristics of the building exterior walls and the ACAH situation. In order to balance simulation accuracy and computational efficiency, this study sets the computational domain size to 5H × 5H × 5H (H is the highest building height) to avoid boundary effect interference; the basic grid size is 1.0 m, and the building surface is refined to 0.1 m. After grid independence verification, the medium grid scheme is finally adopted (computational error < 1%, the efficiency is optimal). The boundary conditions were set as follows: the inlet was a velocity inlet with wind speeds of 0/0.5/1/1.5 m/s and an ambient temperature of 33–38 °C; the outlet was a pressure outlet with a static pressure of 0 Pa; the building and ground were non-slip walls; and the air-conditioning outdoor unit was a constant heat flux boundary to simulate the heat dissipation process.
Second, the ACAH was simulated to obtain the air temperature distribution around the building. This study adopted the residual convergence criterion, setting the continuity equation residual to <10−4 and the energy equation residual to <10−6. Temperature and velocity at key locations were monitored simultaneously, and convergence was determined when there were no significant fluctuations for 10 consecutive time steps (60 s). To eliminate initial condition interference, a 48 h simulation cycle was used: the first 24 h were used to establish thermal equilibrium, and the last 24 h were used for result analysis. This setting fully considered the building’s heat storage characteristics, ensuring that the results accurately reflected the heat transfer and flow field characteristics. Finally, the simulation results of the last 24 h were used as boundary conditions to simulate again, and the temperature velocity field around the building was obtained, which was used as the meteorological boundary condition for calculating the building’s cooling energy consumption.
The distribution of heat dissipation from building AC systems is affected by outdoor temperature and velocity. This paper ignores internal components such as the compressor and replaces the outdoor unit with a cuboid. The heat dissipation of the outdoor unit is considered constant. The process of ACAH research follows the laws of conservation of mass, momentum, and energy. The mass difference between the flow rate entering and leaving the control volume per unit time is equal to the mass increment caused by the density change in the fluid in the control volume (Equation (1)). When the fluid in the flow field is an incompressible fluid and is in a steady state, Equation (1) can be simplified to Equation (2).
where (kg/m3) is the density of the fluid; t (s) is time; u, v, and ω are scalars of velocity in the x, y, and z directions, respectively.
The simplest expression of the conservation of momentum is Newton’s second law. It can be described by the following equation [33].
where is the component of the velocity vector in the three coordinates; ∇ is the vector differential operator, , i = 1, 2, 3……; ) is the viscous force; P () is the pressure; is the source term of the fluid force.
The energy conservation equation in fluid mechanics is a mathematical tool used to describe the dynamic changes in energy within a fluid. This equation allows for a precise description of the energy conversion and transfer processes within a fluid.
where T (°C) is the temperature; () is the fluid heat transfer coefficient; ()) is the specific heat capacity; and is the viscous dissipation term.
Turbulence models are often used to simulate outdoor thermal processes. Simplified turbulence models include two-equation models, the renormalization group models (RNG) k-ε model, and large eddy simulations. Two-equation models can be further divided into the standard k-ε model, RNG k-ε model, and realizable k-ε model [34]. The RNG k-ε model corrects the viscosity coefficient and adds a term reflecting the time-averaged flow velocity change rate to the ε equation, making it more widely applicable and more accurate [35]. Therefore, this paper uses the RNG k-ε model to numerically simulate outdoor ACAH.
In order to ensure that the hot airflow emitted by the outdoor unit can undergo sufficient development, the computational domain is defined as a volume of 500 m × 500 m × 500 m. The boundaries of the computational domain include the inlet, outlet, left and right sides, which are located at a distance of five times the height (H) of the tallest building in the building model [36], as shown in Figure 6. This model helps to understand the impact of ACAH on the surrounding environment and can more realistically simulate the ACAH in actual conditions. CFD simulation provides strong data support for analyzing the distribution characteristics of ACAH and provides important reference data for further building energy consumption calculation.
Figure 6.
Geometric model calculation area.
2.4. Building Energy Consumption Simulation
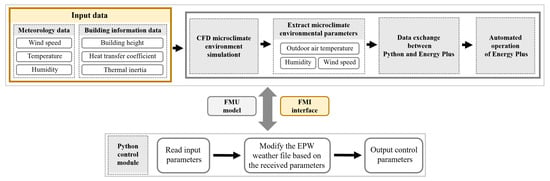
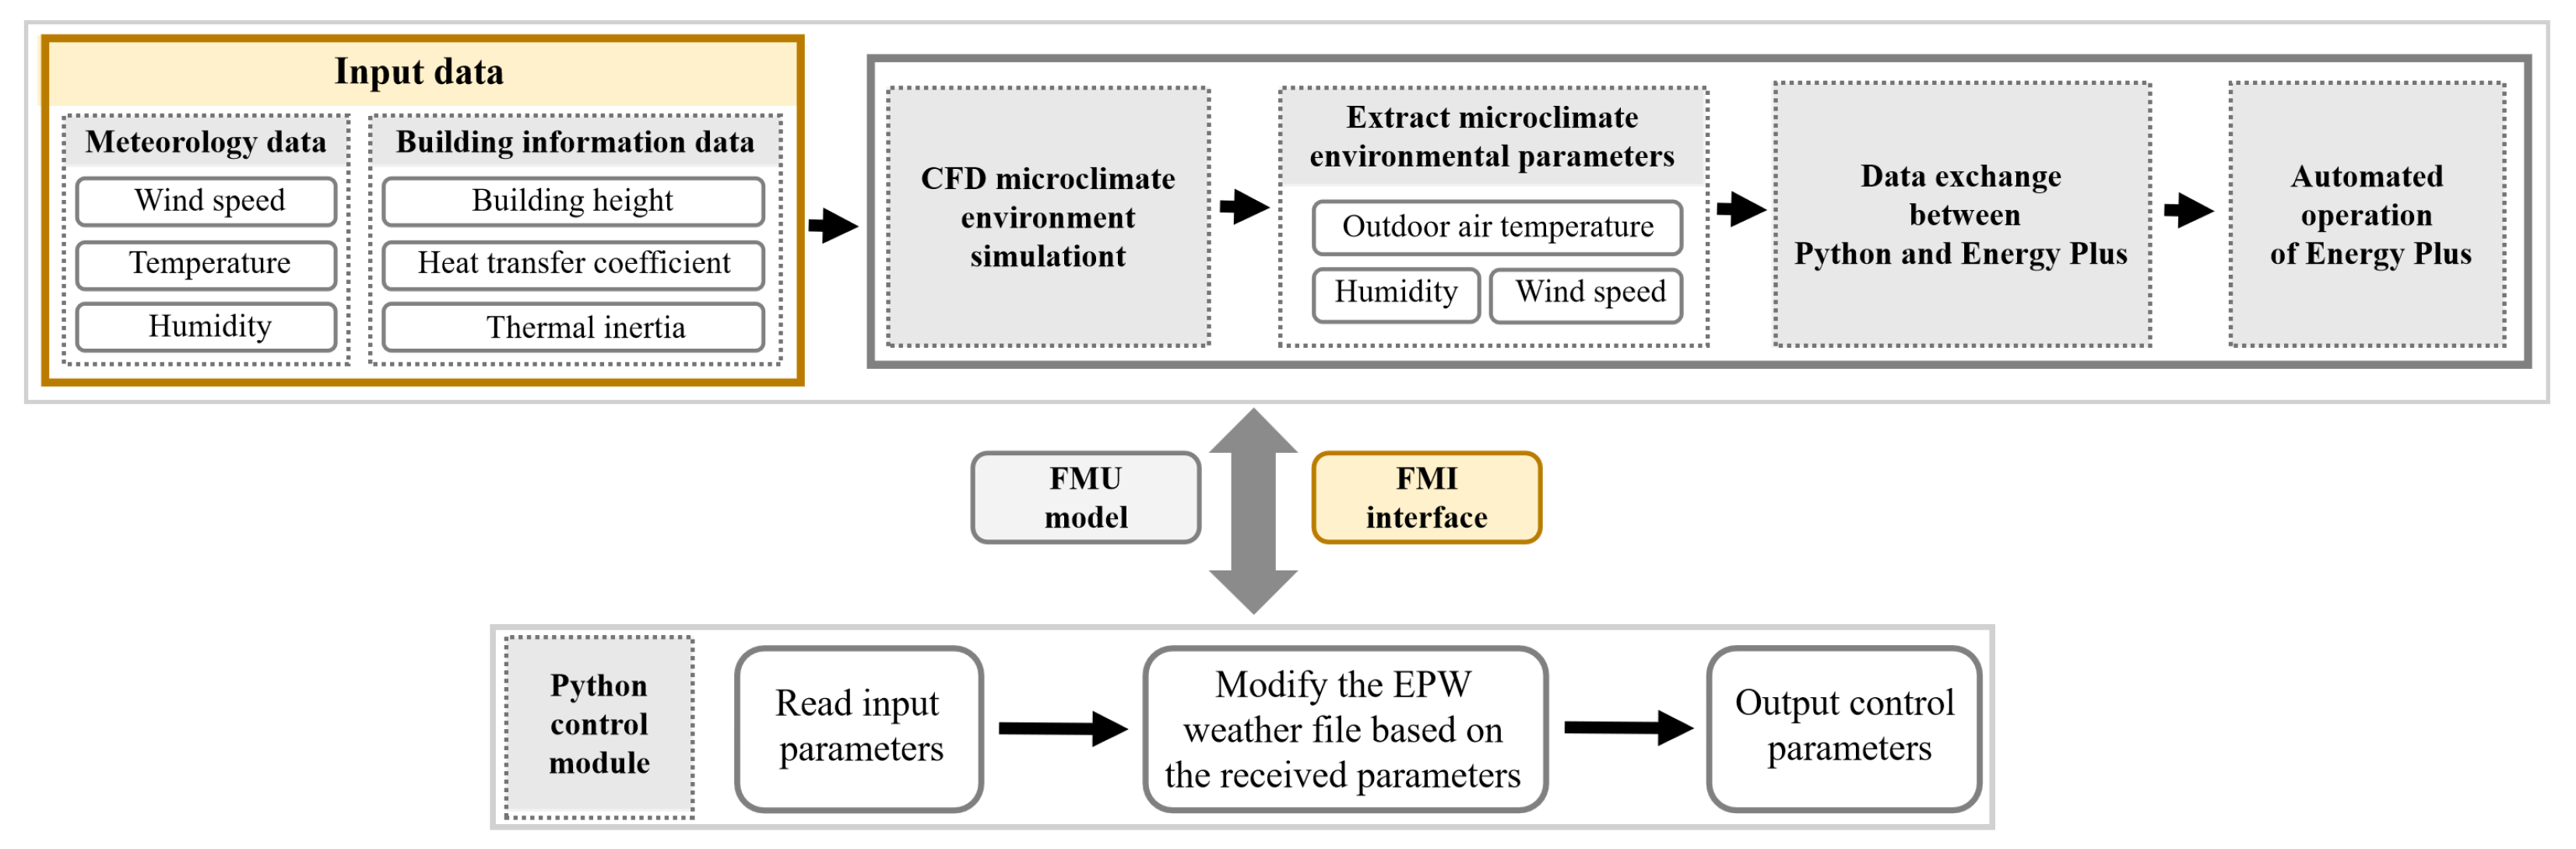
This study conducts CFD numerical simulations of microclimate parameters (wind speed, air temperature, and relative humidity) around buildings under both conditions, considering and not considering ACAH. The impact of ACAH on building cooling energy consumption is quantified through unidirectional coupling simulation between CFD and EnergyPlus. An automated interaction platform between CFD microclimate data and EnergyPlus is built using Python (V3.10) scripts, and the coupling process is shown in Figure 7.
Figure 7.
Methodology of joint simulation and modeling using EnergyPlus.
First, based on the CFD simulation results, hourly microclimate parameters, including outdoor air temperature, relative humidity, and wind speed, are extracted from the grid nodes on the target building’s outer surface. Then, an EnergyPlus-readable EPW meteorological file is automatically generated using Python scripts. The extracted microclimate parameters replace the corresponding meteorological fields in the original EPW file, achieving accurate transfer of CFD-derived microclimate data to EnergyPlus (V23.1.0). This coupling is unidirectional; that is, only the microclimate field around the building calculated by CFD is input into EnergyPlus as a boundary condition, without feeding back the energy consumption simulation results to the CFD flow field calculation, thus ensuring simulation efficiency and engineering practicality. Furthermore, the coupling time resolution is set to synchronize data hourly, perfectly matching EnergyPlus’s default time step, ensuring consistency between the microclimate data and the time scale of energy consumption calculations. In the boundary condition handling of the building-energy consumption model interface, the CFD side sets the building’s external surface as the coupling wall, while the EnergyPlus side uses a “Site:WeatherStation” object to cover the local microclimate parameters around the building. The thermal parameters of the building envelope are strictly set according to the “Energy Saving Standard for Hot Summer and Warm Winter Areas” to ensure the accuracy of the building thermal model.
This study uses the processed EPW file as the meteorological boundary condition in EnergyPlus to conduct building cooling energy consumption simulation. By comparing the building energy consumption results with and without considering ACAH, the study reveals the impact of ACAH on the cooling energy consumption of different floors.
3. Results
3.1. Analysis of the Distribution Characteristics of ACAH
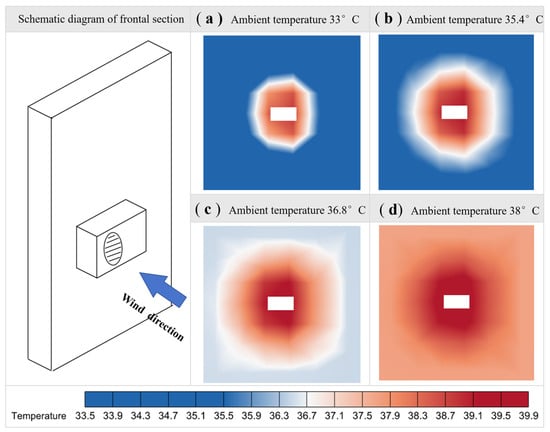
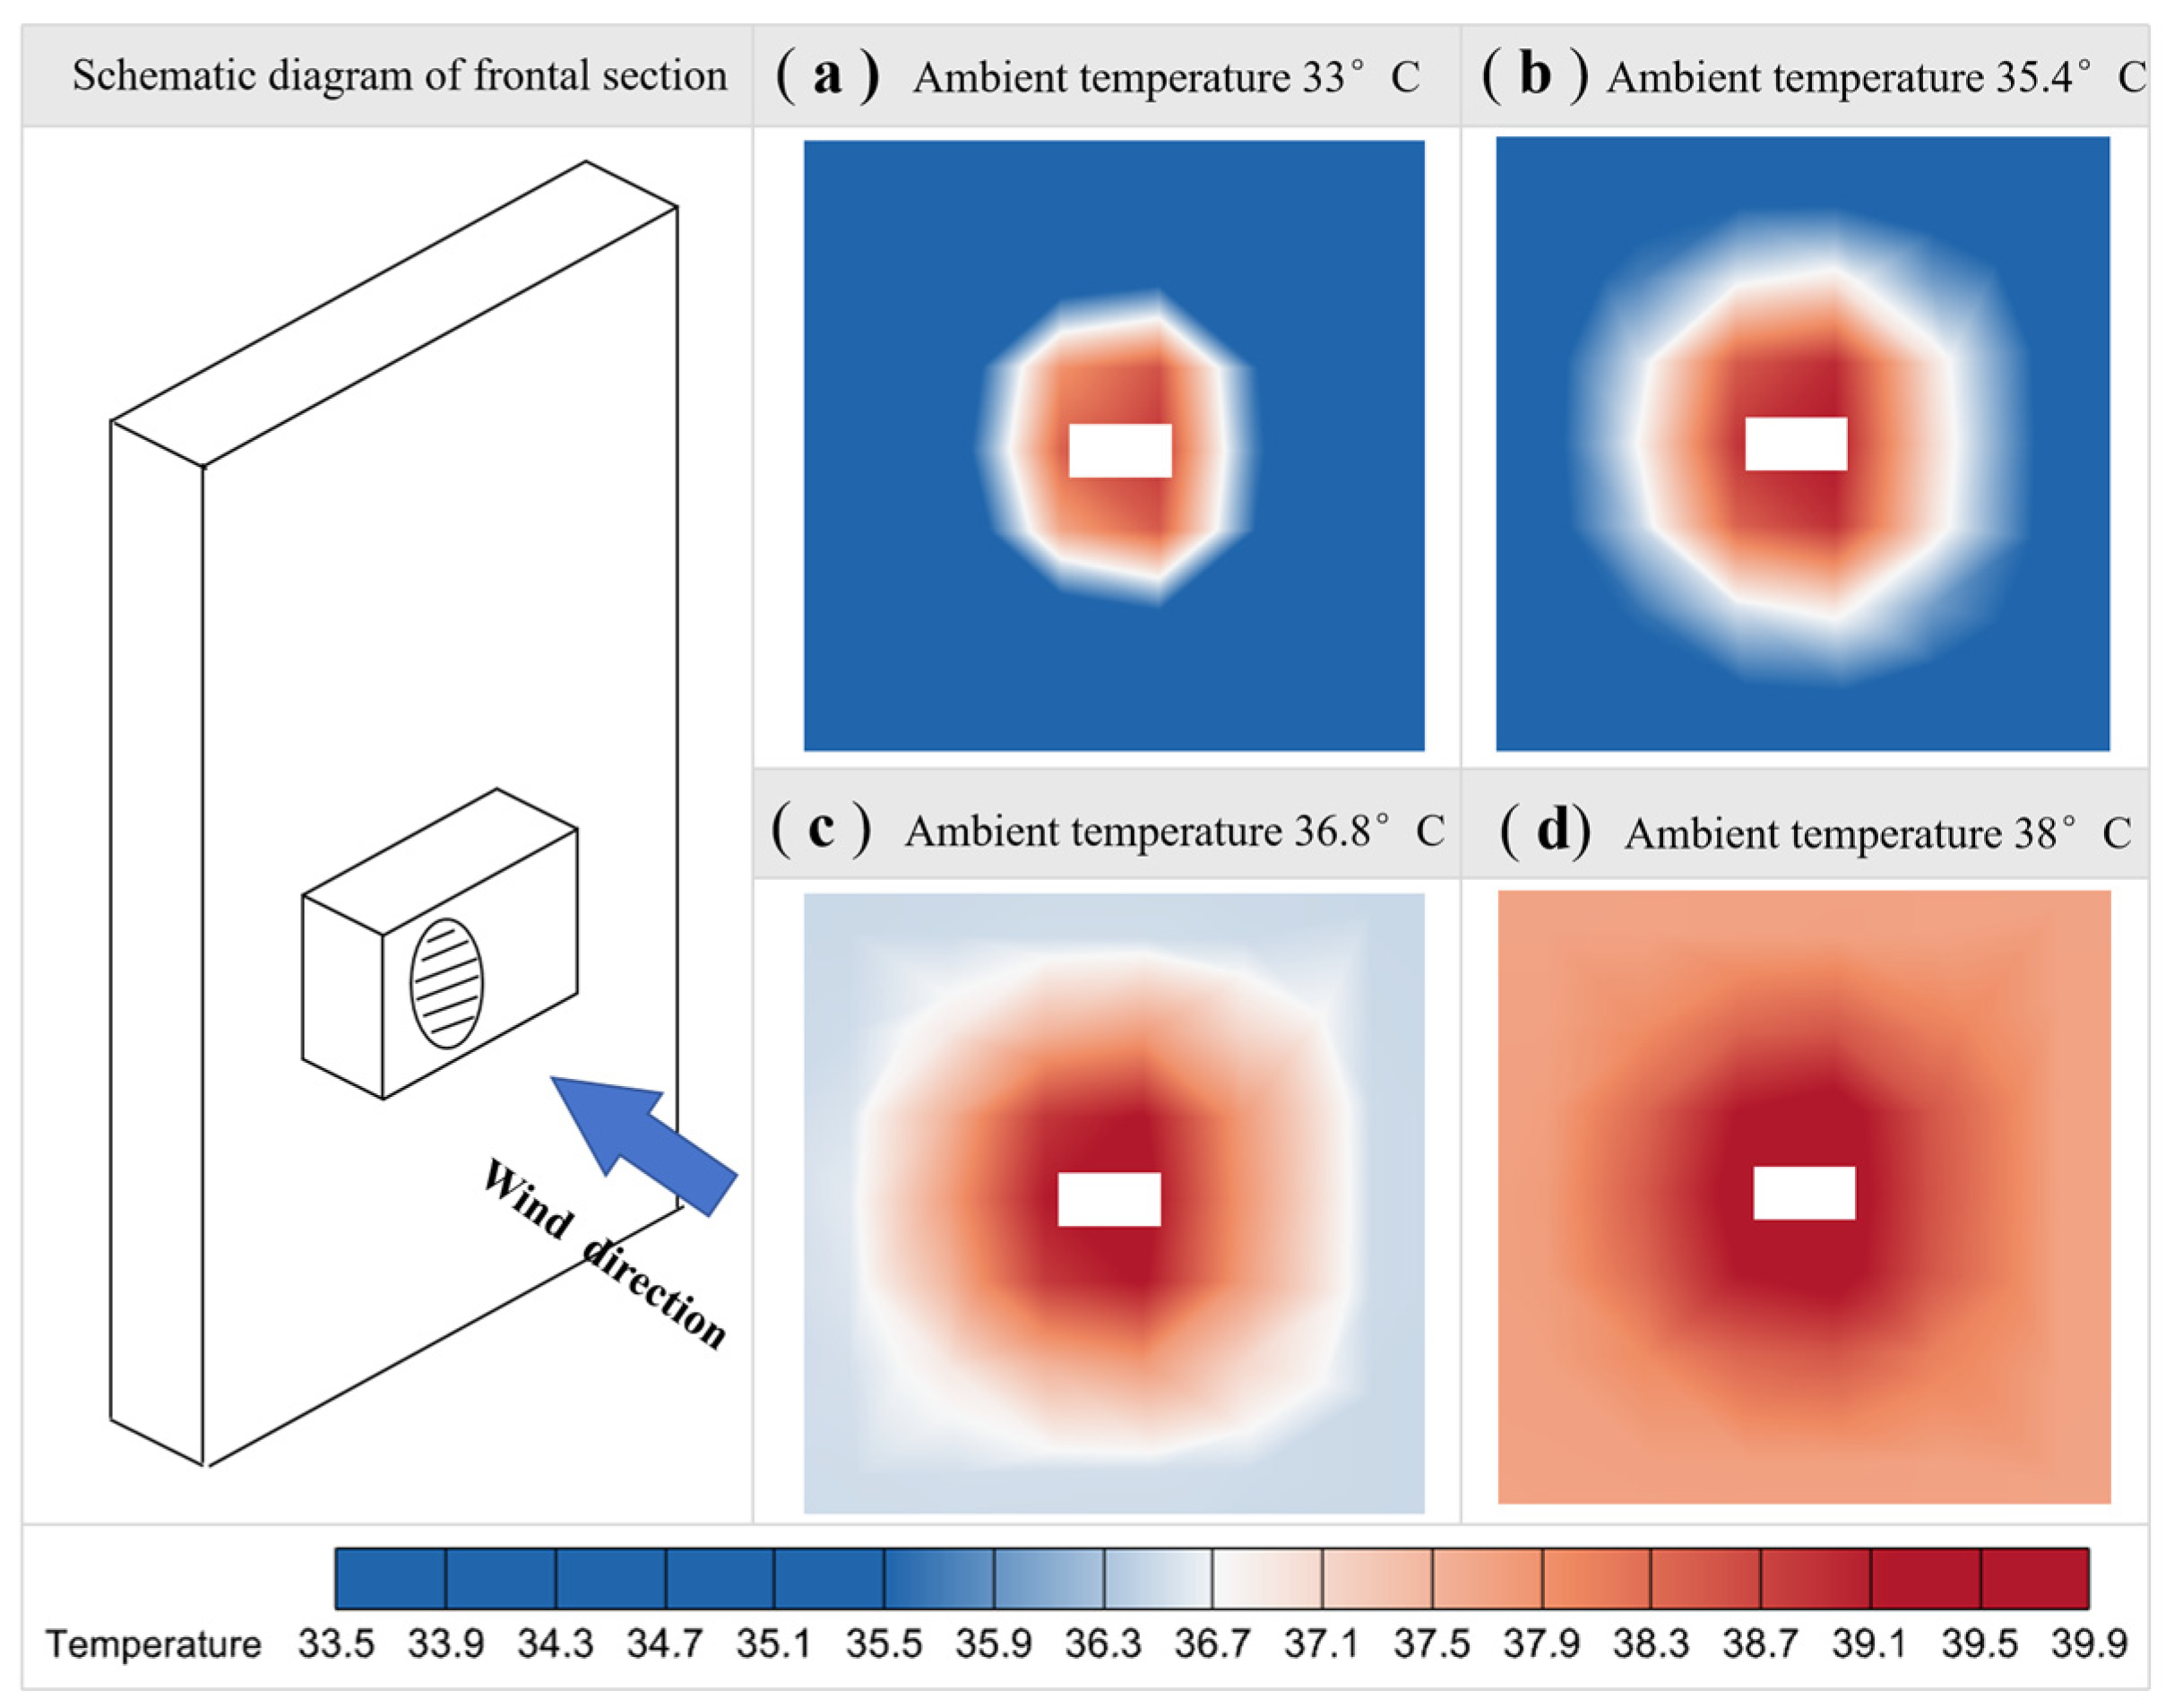
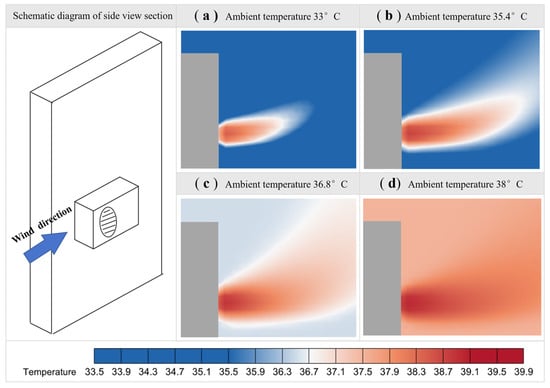
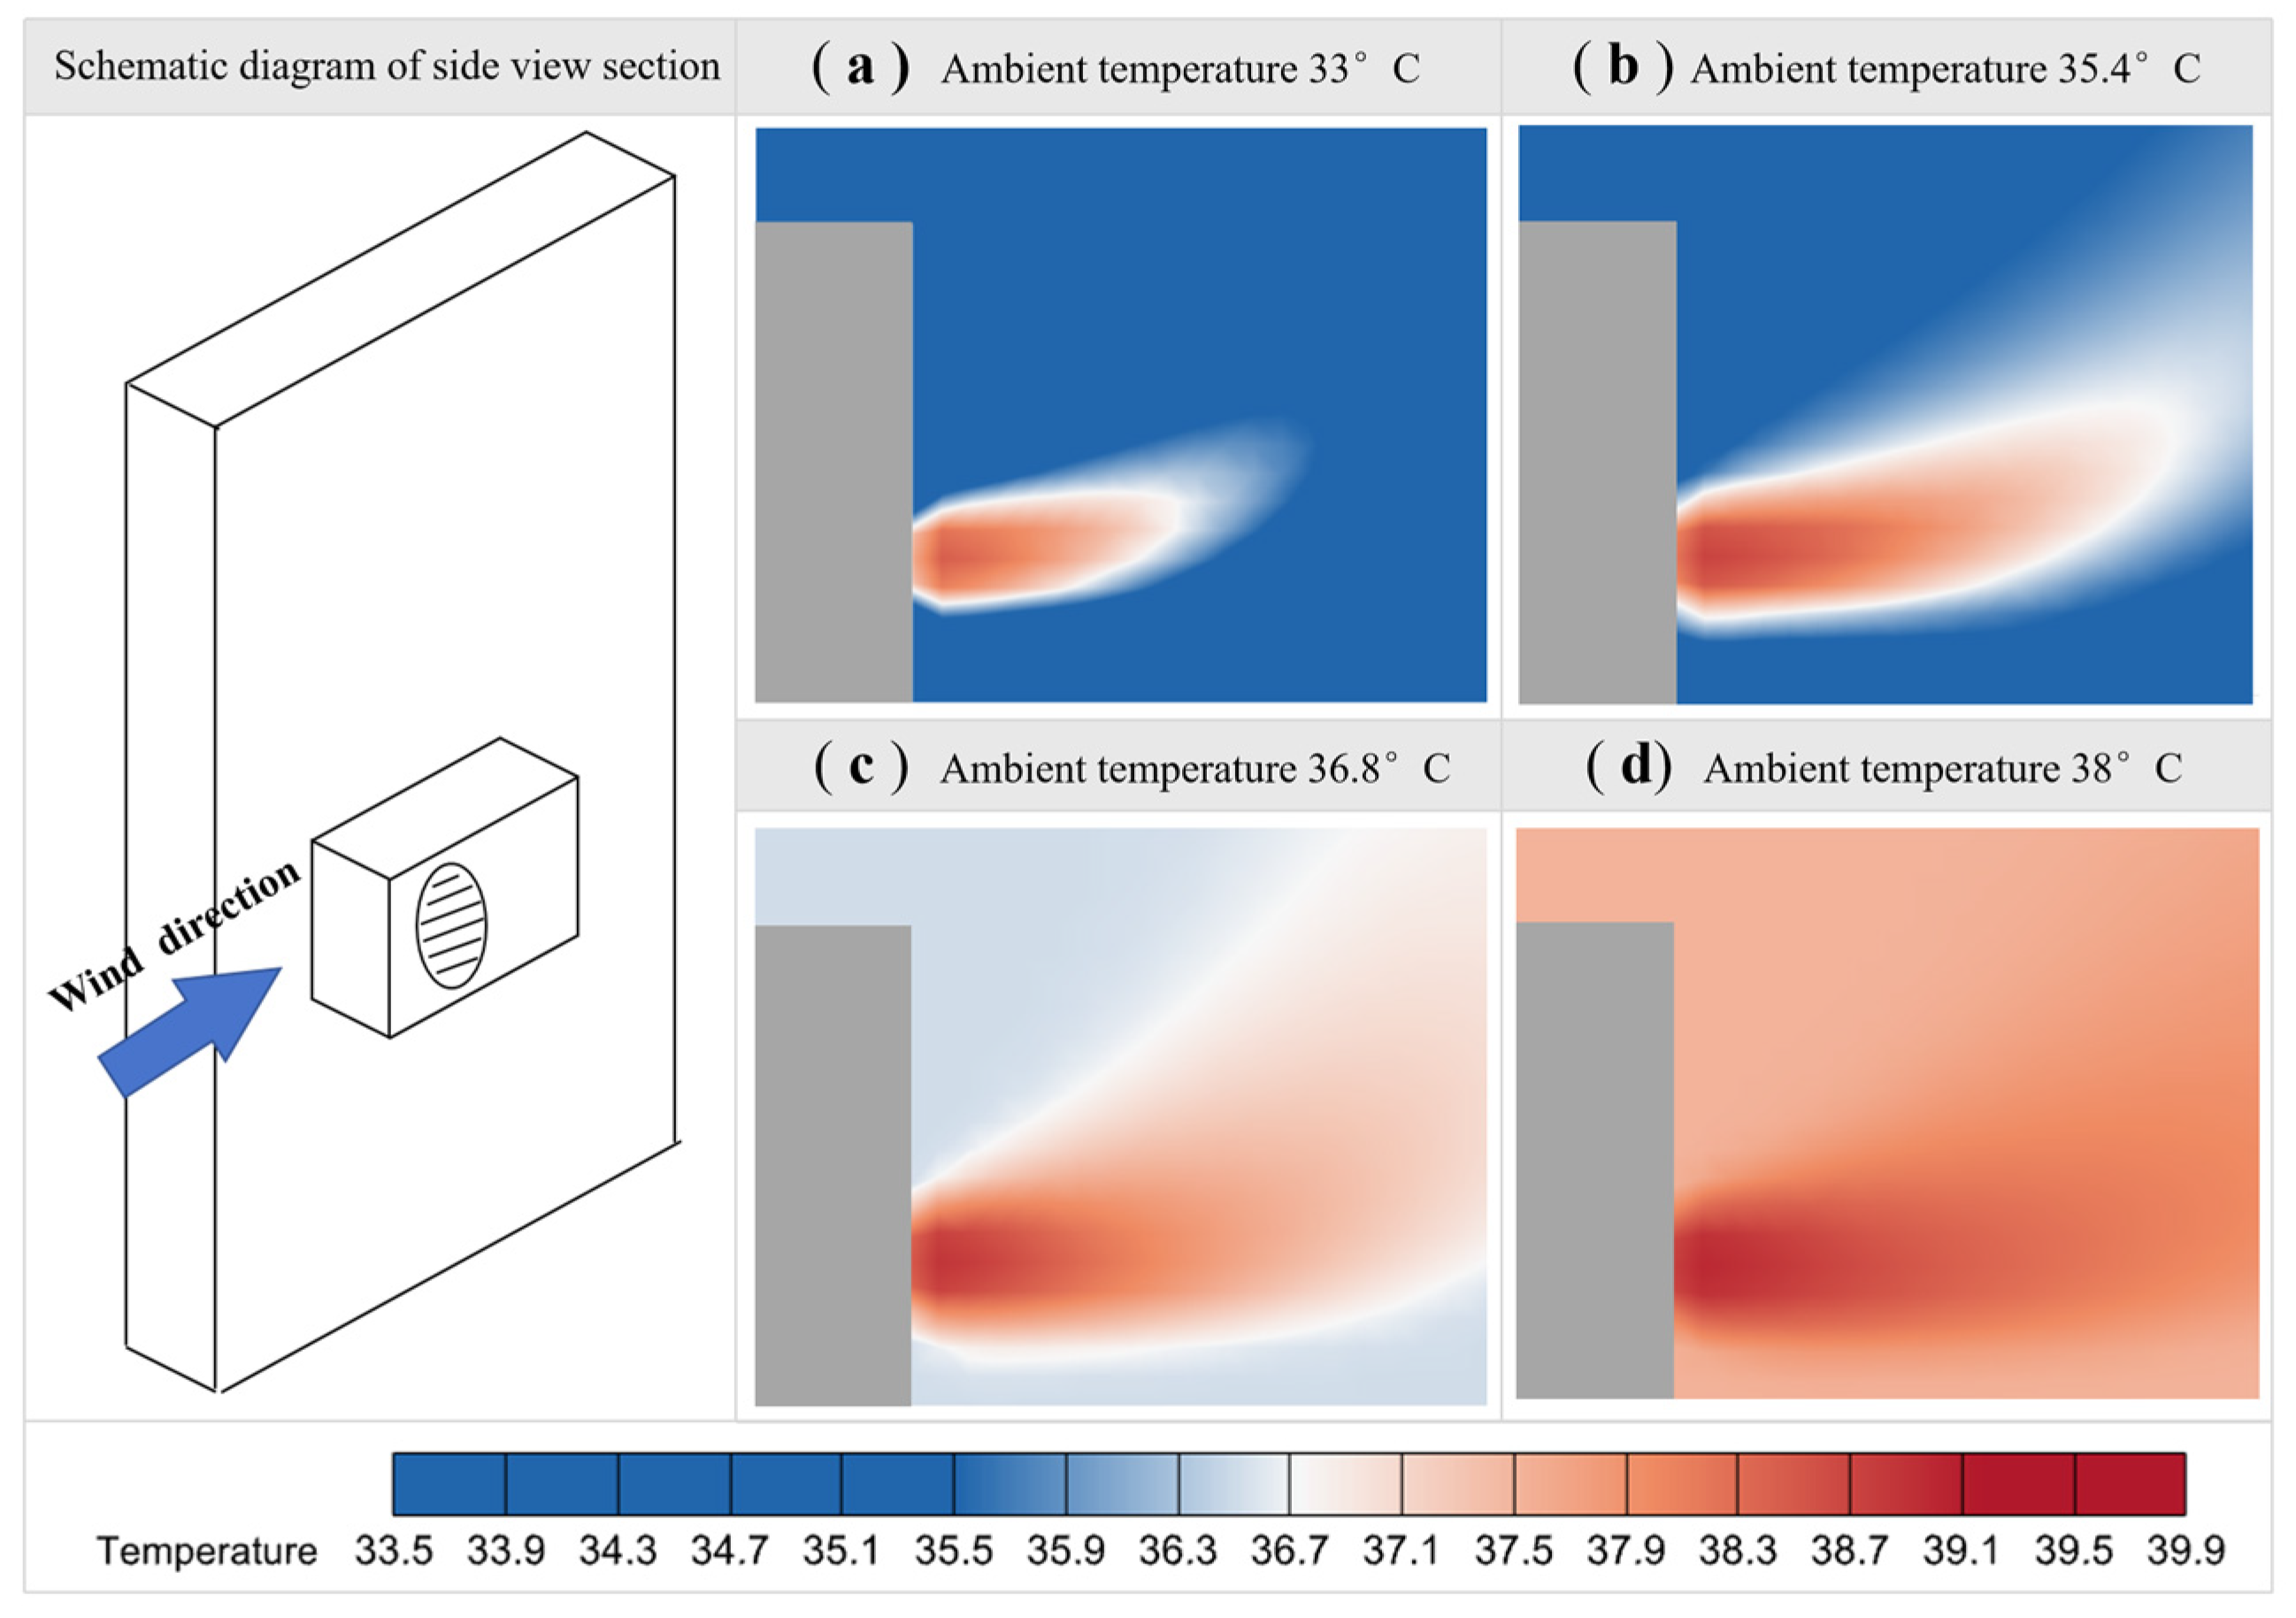
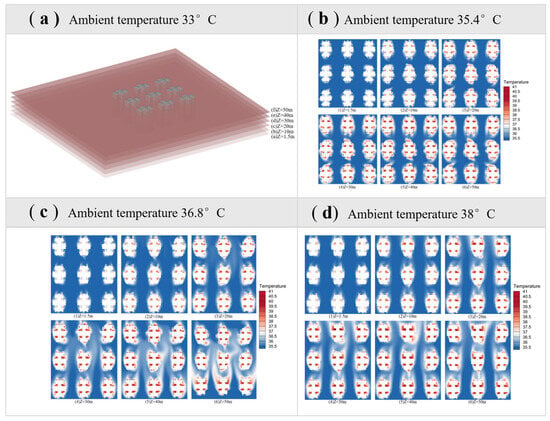
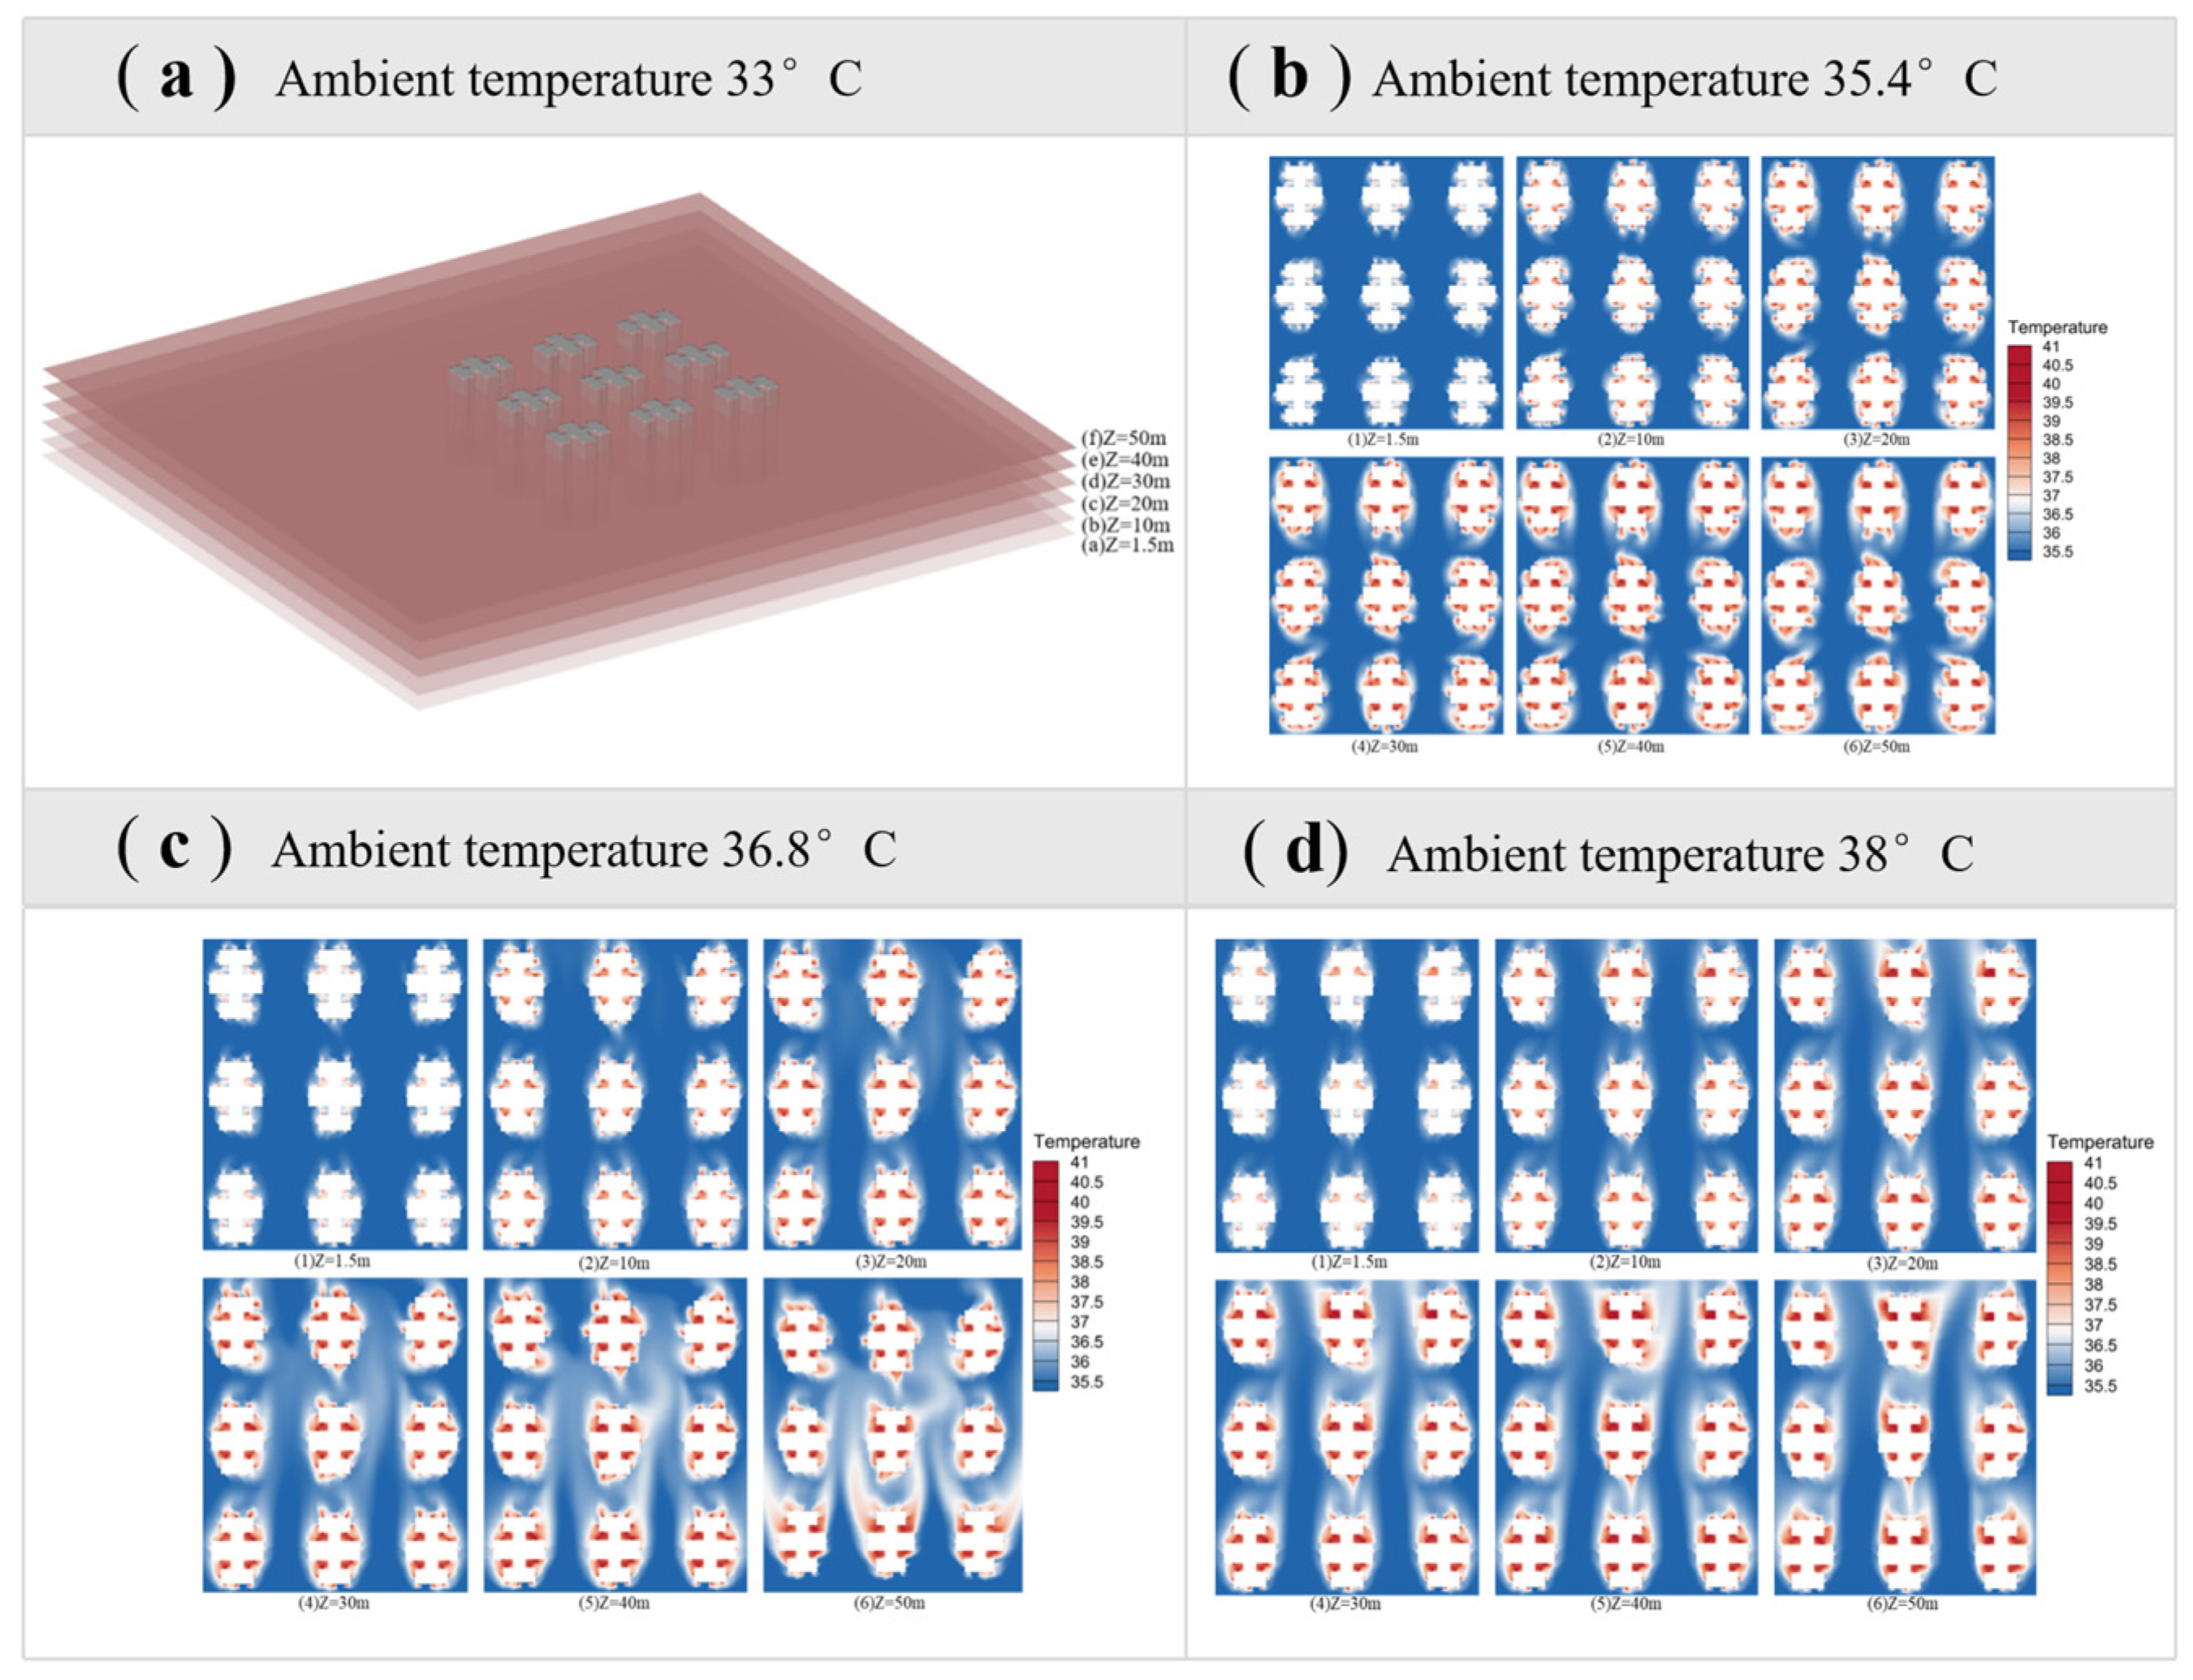
Figure 8 shows the temperature distribution at the outdoor unit’s air outlet under different ambient temperatures. Horizontally, the temperature distribution of ACAH around the building is uneven. As the ambient temperature gradually increases, the impact of the ACAH on the surrounding environment also increases accordingly.
Figure 8.
Horizontal distribution of air-conditioning anthropogenic heat at different temperatures.
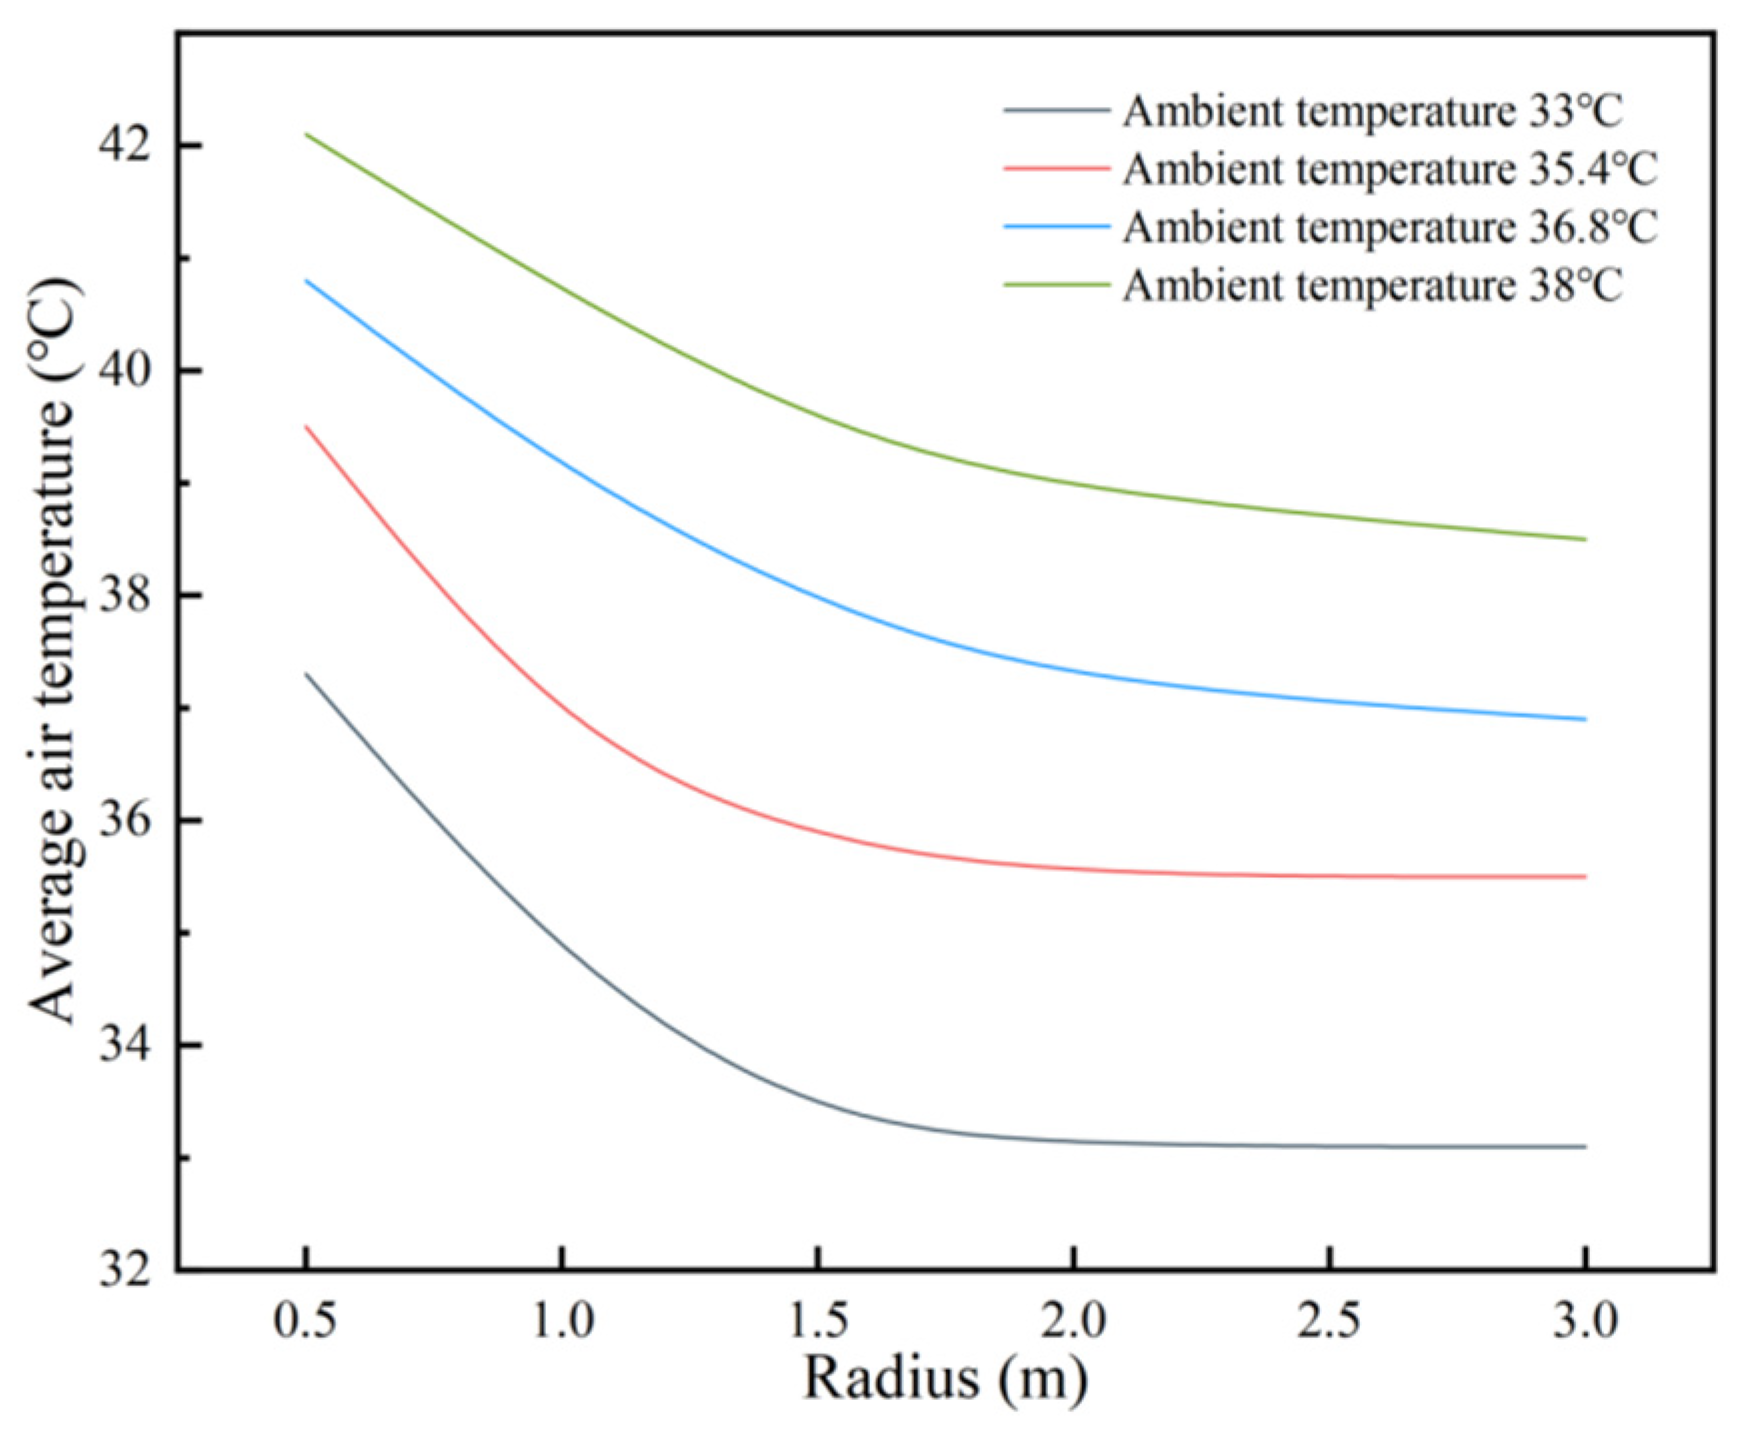
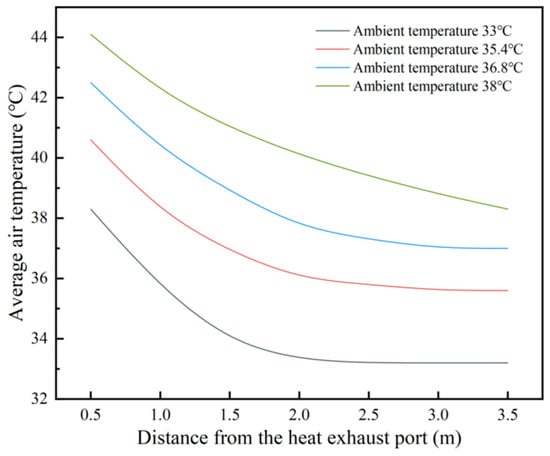
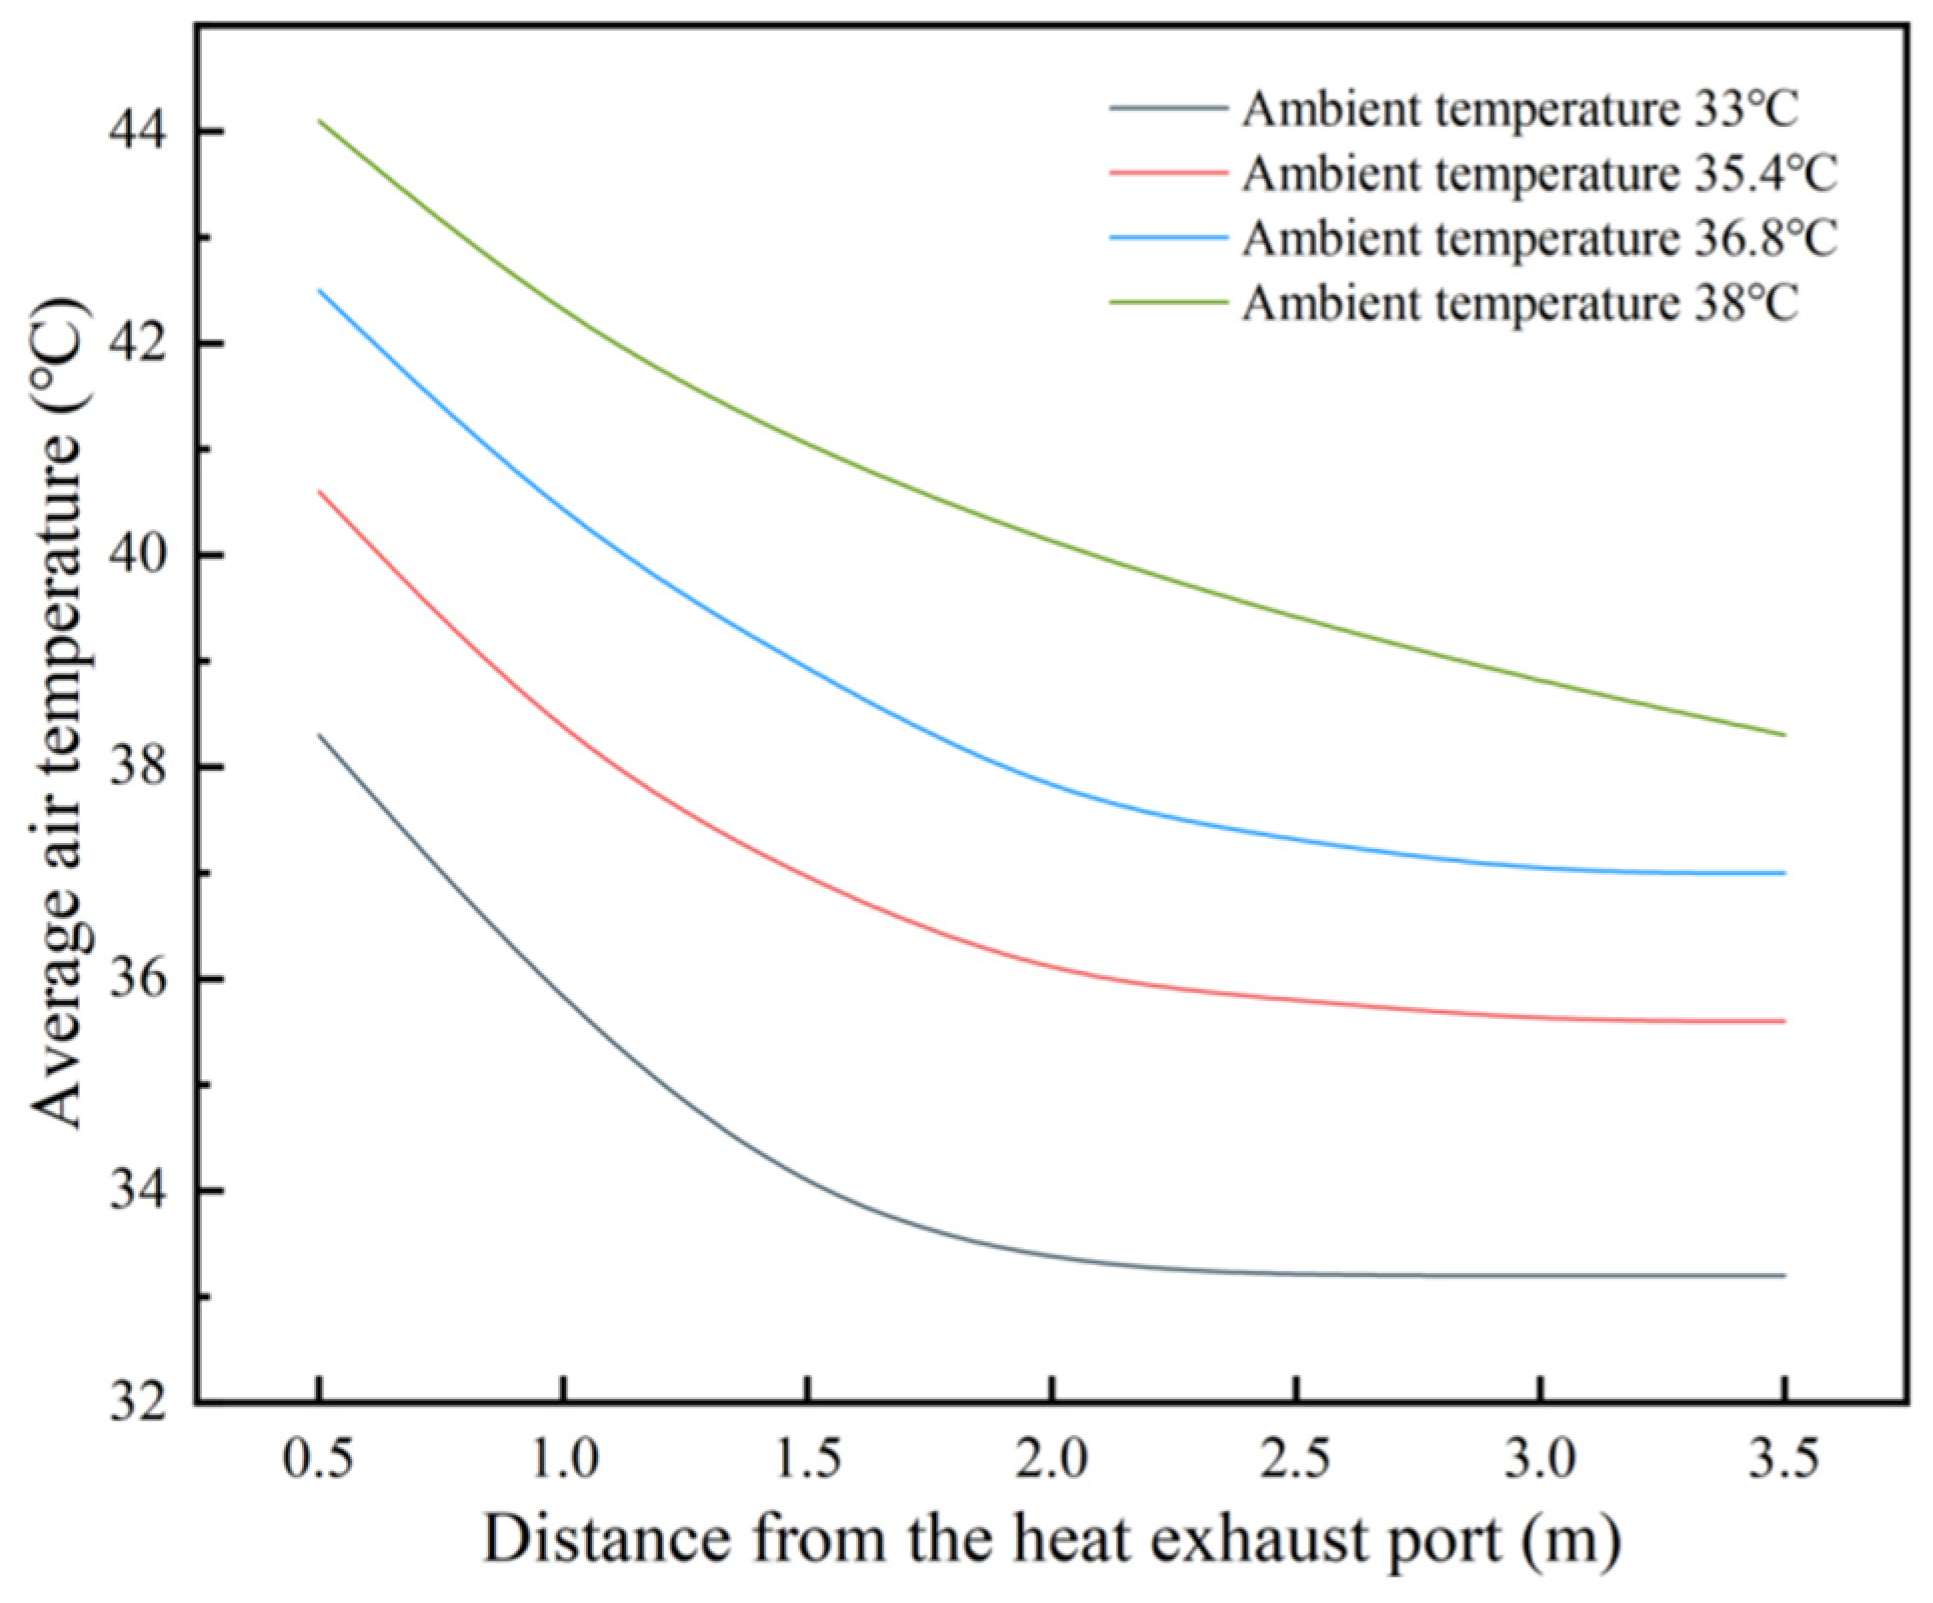
The temperature variations within different ranges are shown in Figure 9. The ACAH has the greatest impact within a radius of 0.5 m. The CFD simulation results show that, under windless conditions and an ambient temperature of 33 °C, the air temperature in the affected area is approximately 4.3 °C higher than the ambient temperature. As the distance increases, the temperature at 1 m rapidly drops to 34.7 °C, with a temperature rise of 1.7 °C. At 1.5 m, the temperature approaches the ambient temperature, with an average temperature of 33.3 °C, and the heat influence range is limited to within 1.5 m. When the ambient temperature rises to 38 °C, the ACAH’s influence distance reaches 3 m. The average temperature at 0.5 m from the ACAH port reaches 42.1 °C, a 4.1 °C increase; at 1 m, it is 40.7 °C, a 2.7 °C increase; at 2 m, it drops to 39.5 °C, a 1.5 °C increase; and at 3 m, the average temperature is 38.5 °C, still showing a 0.5 °C temperature rise. This phenomenon confirms the rule that heat diffusion efficiency decreases with increasing ambient temperature [37], and high temperature results in reduced heat capacity [38]. Under high-temperature conditions (≥35 °C), the thermal impact range can reach 3 m, and the temperature gradient within this range tends to be gentle, indicating that the impact range of ACAH on the microclimate around the building is mainly concentrated at about 3 m, and the intensity of thermal interference decreases with increasing distance.
Figure 9.
Changes in air temperature in the horizontal direction.
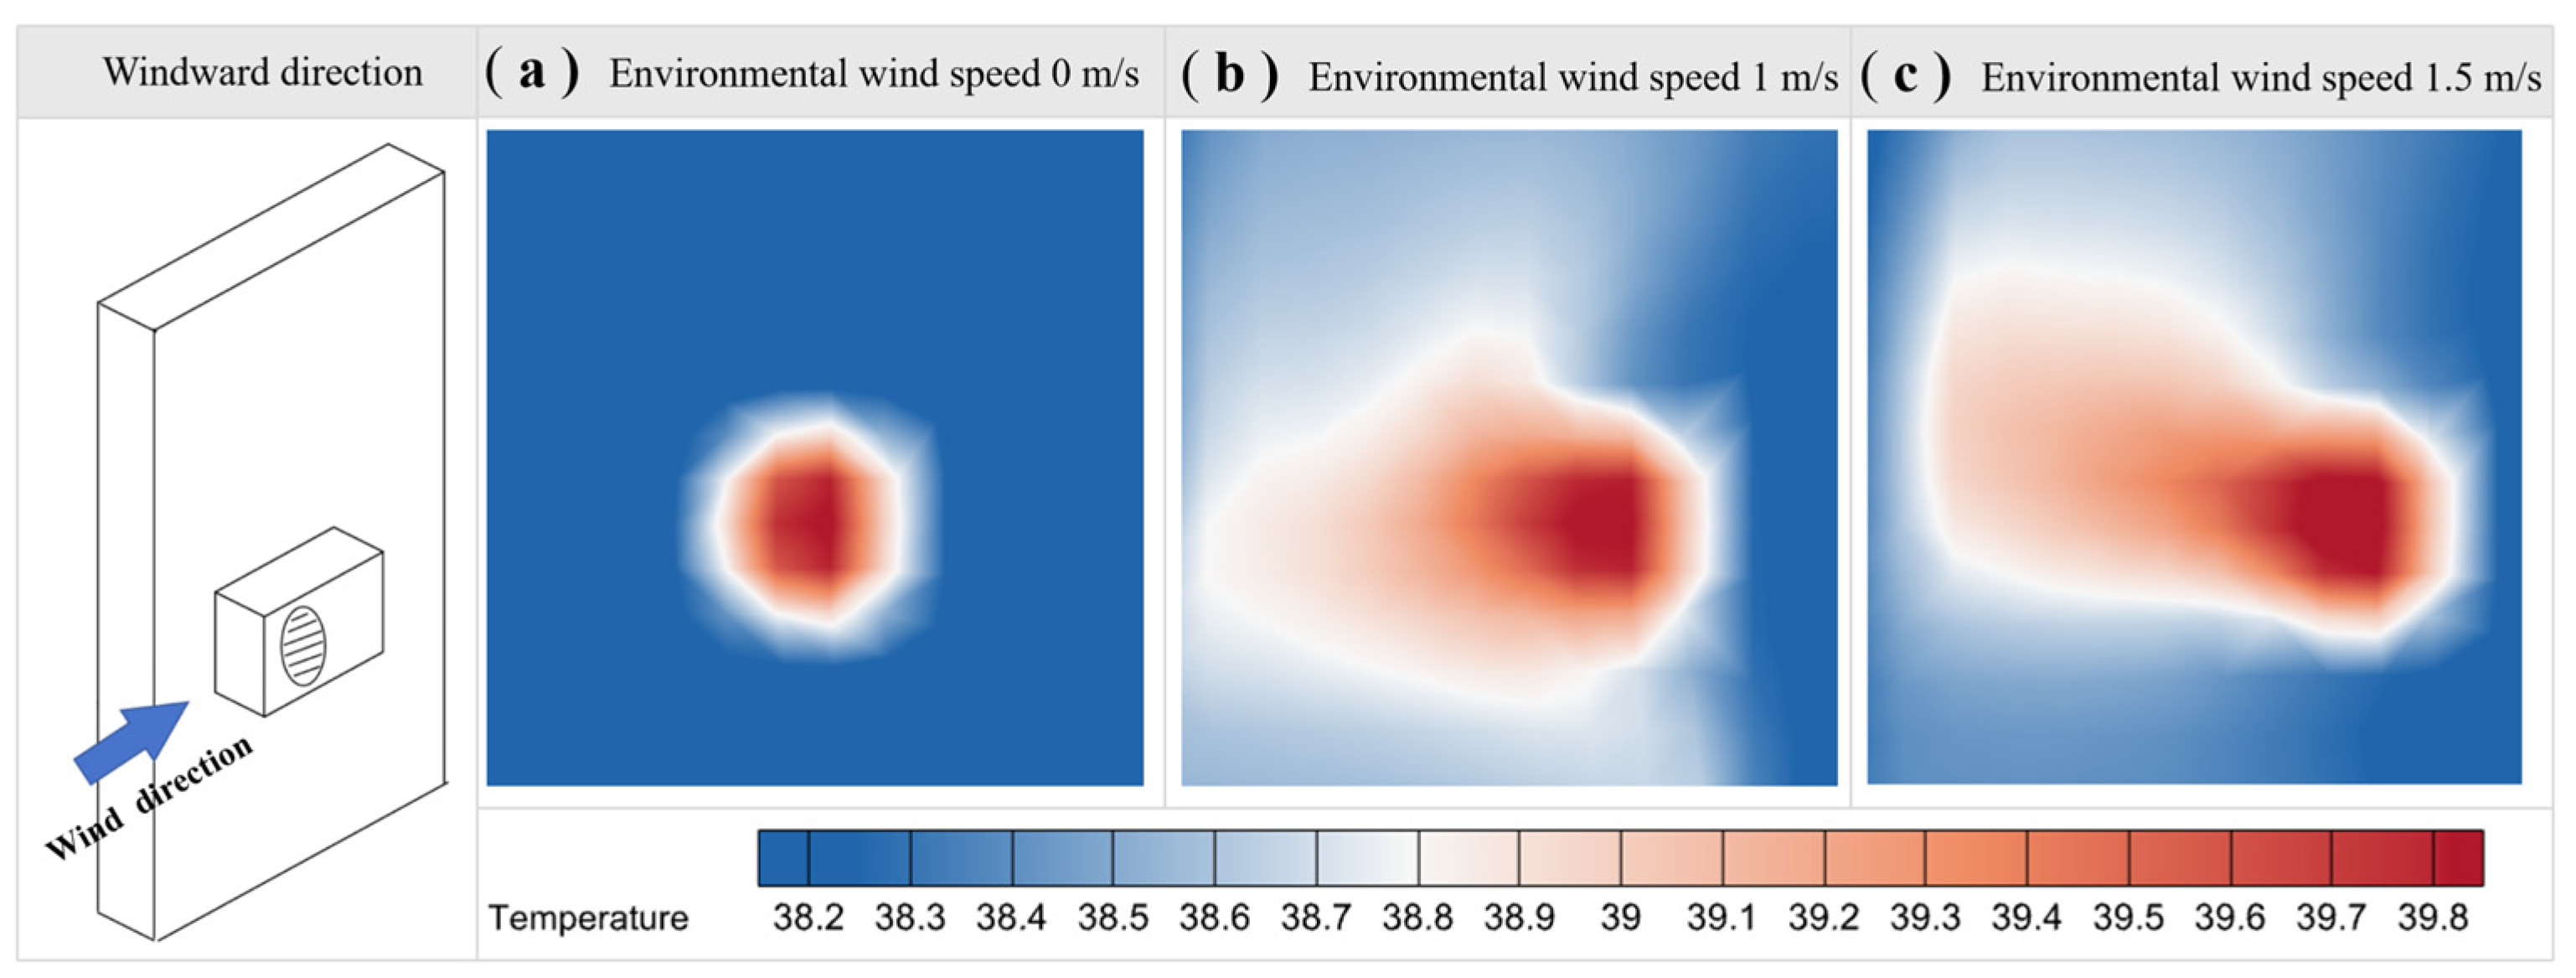
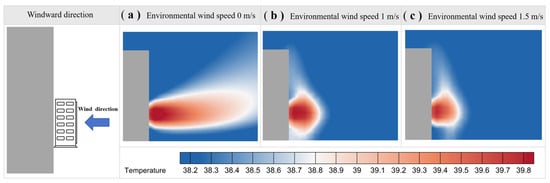
During the operation of an AC system, the impact range of the heat discharged by the outdoor unit on the surrounding environment is not constant. The impact range of ACAH varies significantly with different wind speeds, as shown in Figure 10. In a calm environment, the ACAH is mainly concentrated in the area near the AC. Heat accumulates in a localized space, causing a significant temperature increase in that area, forming a relatively stable high-temperature zone with a relatively small and concentrated impact range. As the wind speed gradually increases, the heat discharged by the AC unit is carried away by the rapidly flowing air. The impact range of the ACAH expands, no longer limited to the vicinity of the AC unit, but extending further along the wind direction. It is worth noting that at a wind speed of 1 m/s, the impact range of ACAH is larger, and the heat distribution is relatively uniform, gradually spreading along the direction of the wind speed. At a wind speed of 1.5 m/s, the impact range of ACAH is smaller than at 1 m/s, but the heat tends to rise with the wind direction, resulting in an uneven vertical distribution.
Figure 10.
Distribution characteristics of air-conditioning anthropogenic heat under different ambient wind speeds.
The physical mechanism behind this phenomenon is that at lower wind speeds, the airflow is more stable, and heat tends to accumulate locally, giving the heat expelled by the AC unit more time to exchange and mix with the surrounding air. This results in a more even distribution of heat over a larger area, creating a larger and more uniformly distributed area of influence. At medium wind speeds, convection plays a dominant role; at higher wind speeds, enhanced mixing may lower peak temperatures, and the heat expelled by the AC unit is guided by the wind direction, making it easier for the heat to concentrate and flow along the wind direction. This affects the horizontal diffusion range of the heat, reducing the area of influence but creating a more noticeable heat accumulation in the same direction as the incoming wind.
Further investigation into the vertical distribution characteristics of ACAH revealed a non-uniform distribution. Figure 11 shows the vertical distribution characteristics of ACAH at different temperatures. As the ambient temperature gradually increased from 33 °C to 38 °C, the impact of ACAH on the surrounding microenvironment gradually increased with distance. This indicates that rising ambient temperature exacerbates the impact of ACAH on the surrounding space. Figure 12 shows the average temperature variation at different distances.
Figure 11.
Vertical distribution of air-conditioning anthropogenic heat at different temperatures.
Figure 12.
Average air temperature at different distances from the exhaust port.
At an ambient temperature of 33 °C, the average temperature within 0.5 m of the ACAH vent reaches 38.3 °C, indicating a significant heat accumulation near the vent and the formation of a distinct high-temperature zone. As the distance increases, the heat loss becomes more pronounced. At 1 m from the vent, the average temperature drops to 35.7 °C, a decrease of 2.6 °C compared to 0.5 m. Continuing to increase the distance, at 1.5 m from the vent, the average temperature further decreases to 33.9 °C, at which point the temperature difference with the ambient temperature gradually narrows.
When the ambient temperature rises to 38 °C, the average temperature within 1 m of the ACAH vent reaches 42.2 °C, an increase of 3.9 °C compared to the same distance at 33 °C. Under high-temperature conditions, the high-temperature zone formed by the ACAH is more pronounced, and the heat accumulation effect is more significant. When the distance to the ACAH vent is 2 m, the average temperature drops to 40.1 °C, a decrease of 2.1 °C compared to the temperature at 1 m. With increasing distance, the rate of heat attenuation slows down. When the distance to the ACAH vent is 3 m, the average temperature further decreases to 38.8 °C, at which point the temperature difference with the ambient temperature gradually narrows. When the distance reaches 3.5 m, the average temperature is 38.3 °C, basically consistent with the initial ambient temperature. Beyond 3.5 m, its influence on the ambient temperature gradually disappears.
The vertical distribution of ACAH is affected not only by ambient temperature but also by wind speed. Simulations under different wind speed conditions revealed that wind speed has a significant impact on the rising path of hot air, the intensity of thermal stratification, and the height of heat accumulation. Figure 13 shows the characteristic distribution under different wind speeds, using an ambient temperature of 38 °C as an example.
Figure 13.
Vertical distribution characteristics of air-conditioning anthropogenic heat under different wind speeds.
Under calm conditions, hot air rises slowly primarily due to buoyancy. Forced convection from the ACAH vent further propels the rising air, causing the heat to gradually rise away from the building. In this case, the impact distance of the ACAH is 3.5 m. During this process, the rising speed of the hot air is relatively slow, and the vertical diffusion of heat is also limited. The average temperature at a distance of 1 m from the exhaust vent reaches 39.8 °C.
When the ambient wind speed increases to 1 m/s, heat accumulates at a distance of about 1 m from the ACAH vent, forming a high-temperature zone. The force of the wind obstructs the upward movement of hot air near the building, preventing it from rising as smoothly as it would under calm conditions, causing heat to accumulate there. At this point, the average temperature at a distance of 1 m from the ACAH vent reaches 40.4 °C, significantly higher than the temperature level under calm conditions.
When the ambient wind speed further increases to 1.5 m/s, the heat is attenuated to some extent due to the influence of wind speed. Although heat still accumulates in the area near the building, the intensity of the accumulated heat is weaker compared to the condition under a wind speed of 1 m/s. This is because the increased wind speed carries away some heat, reducing the degree of heat accumulation near the building and thus causing a temperature drop. At this point, the average temperature at 1 m from the heat outlet is 39.3 °C, which is lower than the temperature level under calm wind conditions. Although the intensity of heat accumulation weakens with increasing wind speed, the influence of wind speed on ACAH still exists, to some extent, and alters the heat distribution pattern.
Finally, to verify the accuracy and reliability of the CFD numerical model in simulating the uneven distribution of ACAH in this study, a comparative verification of the field measurement and simulation results was conducted. The experimental values, simulated values, and corresponding errors of the ACAH temperature at different distances are shown in Table 3. The results show that at different distances of 1 m, 2 m, and 3 m from the outdoor unit, the experimental and simulated values of the ACAH temperature are in good agreement, with errors all controlled within 2.2 °C. Furthermore, the error gradually decreases with increasing distance, with a maximum error of only 2.2 °C and a minimum error of only 0.8 °C. The overall error level is small, fully verifying the reliability of the numerical model in this study and laying a solid foundation for subsequent analysis of ACAH distribution characteristics and energy consumption impact.
Table 3.
Error of the AC heat exhaust simulation results.
3.2. Distribution of ACAH at Different Building Heights
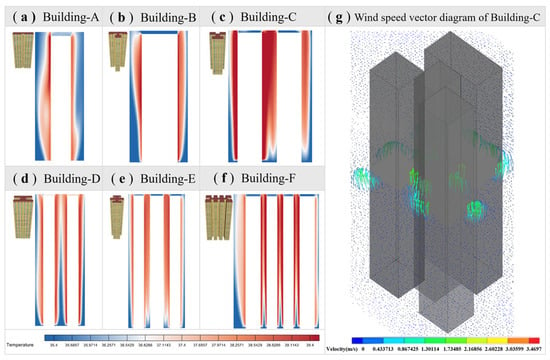
Under windless conditions and an ambient temperature of 35 °C, a comparative analysis of the surrounding environment of a single building was conducted, and the ACAH in the vertical direction of the building was analyzed. The distribution of ACAH at different building heights is shown in Figure 14. The waste heat generated by AC operation mainly accumulates in the upper and middle areas of the building, leading to an increase in temperature in these areas. A clear stratification phenomenon is observed in the vertical direction. Especially in buildings with narrow spacing, the ACAH exacerbates the deterioration of the surrounding thermal environment. When analyzing the thermal environment of different building types, significant differences in the waste heat accumulation effect were found. The waste heat accumulation effect is particularly significant in buildings C and F. The minimum spacing for building F is 4 m, and for building C is 5 m. The highest temperature for both buildings C and F reaches 38.7 °C, with the highest temperature for building C occurring on the 26th floor and for building F on the 23rd floor. The lowest temperature is 35.2 °C for both types of buildings. The lowest temperature for building C occurs on the 4th floor, while the lowest temperature for building F occurs on the 3rd floor. The difference between the highest and lowest temperatures for both types of buildings is 2.6 °C.
Figure 14.
Vertical distribution of air-conditioning anthropogenic heat in a typical single building.
For other building types, the highest temperature in building A was 37.8 °C on the 21st floor, and the lowest temperature was 35.2 °C on the 3rd floor. The highest temperature in building B was 38.1 °C on the 25th floor, and the lowest temperature was 35.2 °C on the 4th floor. The highest temperature in building D was 38.2 °C on the 28th floor, and the lowest temperature was 35.3 °C on the 2nd floor. Vertical distribution analysis results show a clear correlation between building geometric parameters and heat accumulation characteristics. First, building spacing is a key factor affecting the intensity and height of heat accumulation: the smaller the building spacing, the more restricted the lateral ventilation, and the enclosed space formed hinders the diffusion of air-conditioning waste heat, thus leading to a stronger vertical heat accumulation effect and a higher heat storage height. This temperature trend is consistent with the results found by Adelia [10].
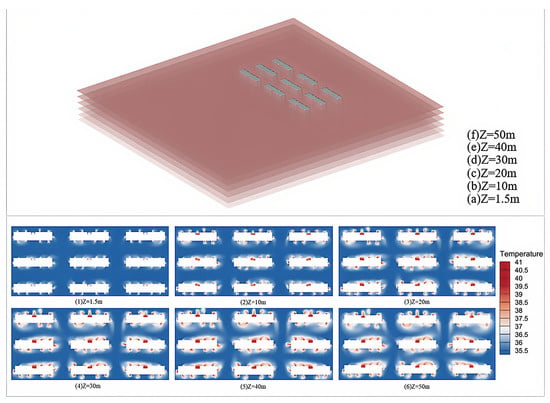
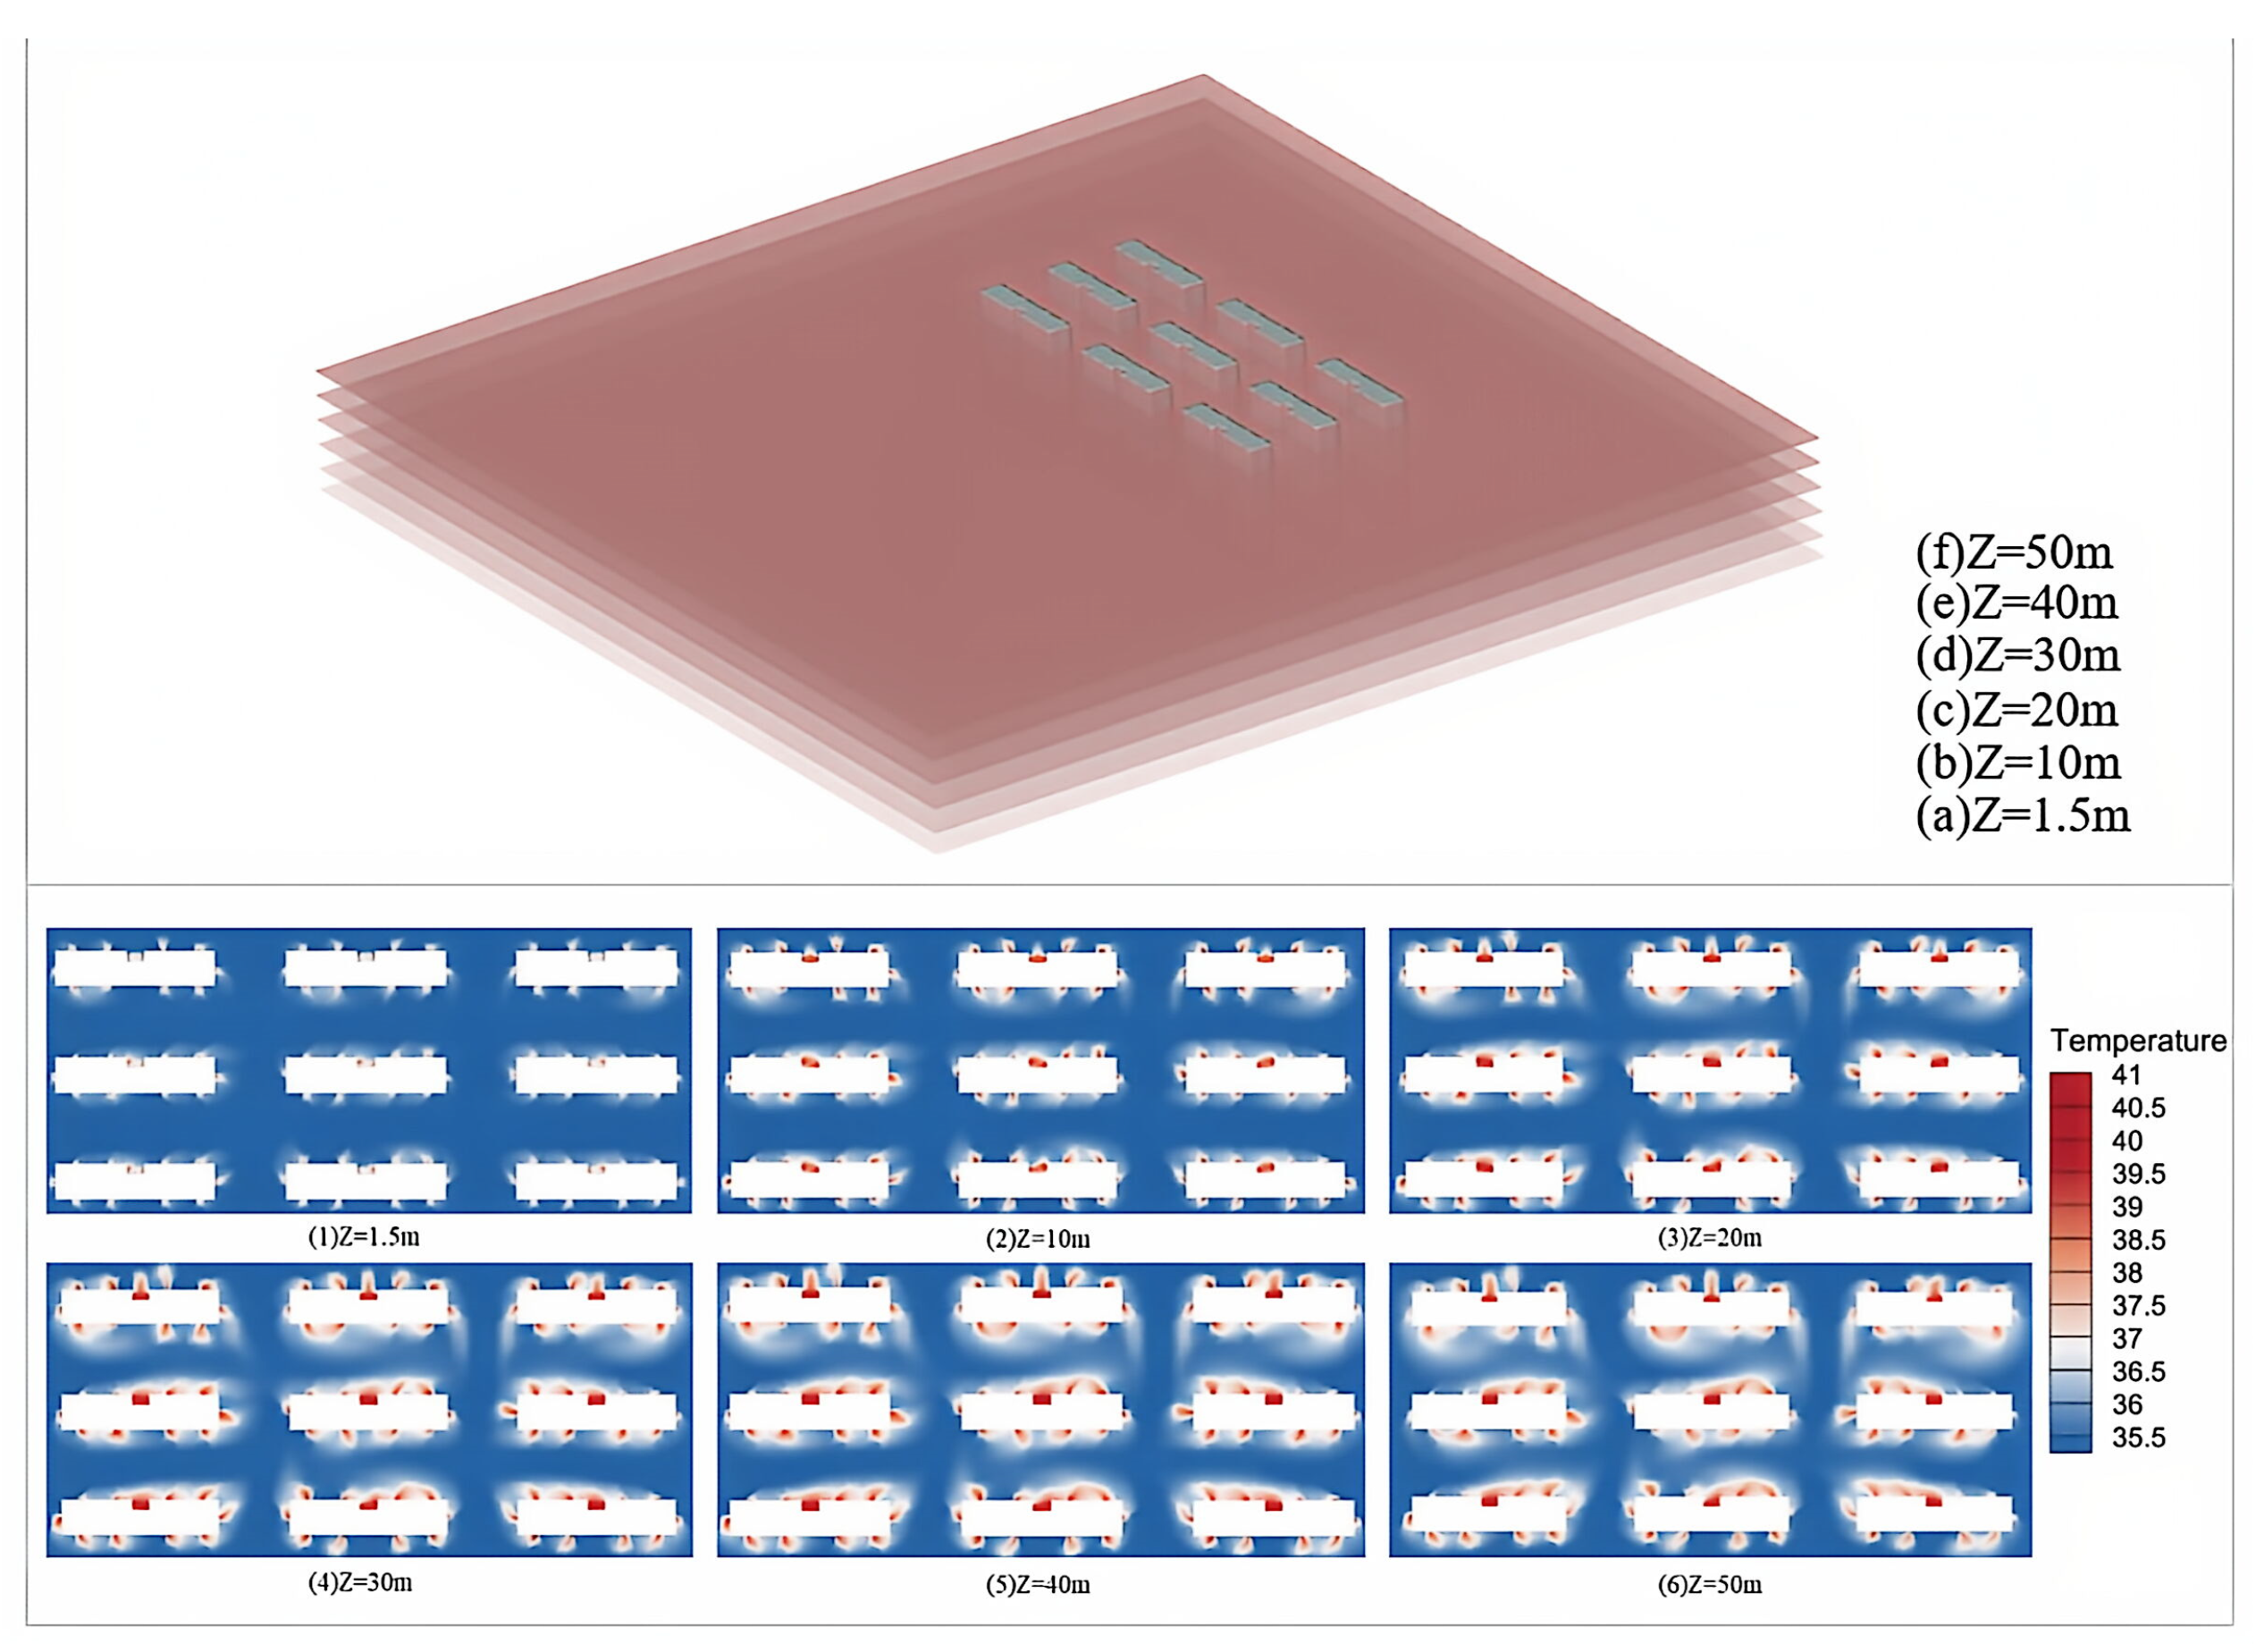
Around the building, the AC unit generates hot air that ascends to the building’s upper–middle parts, while cool air replenishes from below, thus creating a circular process. During this process, the hot air in the upper and middle areas continuously accumulates, leading to a rise in temperature, as shown in Figure 15. For high-rise buildings, the upper and middle floors, being farther from the ground, have relatively less air circulation, making heat less likely to dissipate. Simultaneously, due to the shading effect on the building C and building F sections of the building, eddies are more easily generated, making it easier for heat to accumulate in these areas, resulting in a rise in temperature.
Figure 15.
Distribution of air temperature at different heights in the horizontal direction.
There are obvious differences in the vertical air temperature distribution. Taking building A as an example, the temperature distribution along the horizontal direction under calm wind conditions at different building heights is analyzed, as shown in Figure 15. As the building height increases, the ambient air temperature shows a trend of first increasing and then decreasing. Initially, the waste heat released from the AC will heat the surrounding air, and the density of the air will decrease after being heated. Due to buoyancy, the hot air will naturally rise to a higher level of space. However, in the middle and upper part of the building, the ACAH still exists. Although the hot air is propelled by thermal buoyancy, its rising process is also constrained by gravity. When the hot air rises to a certain height, the gravity it experiences will gradually increase, hindering its further rise. In addition, the hot air will gradually exchange heat with the surrounding cooler air during the rising process, resulting in a decrease in temperature and an increase in density, further affected by gravity [39]. This will cause the waste heat generated by the AC to accumulate in the middle and upper part of the building, rather than being evenly distributed throughout the entire building space.
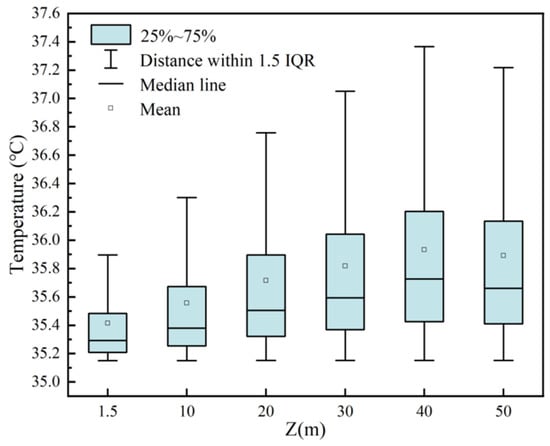
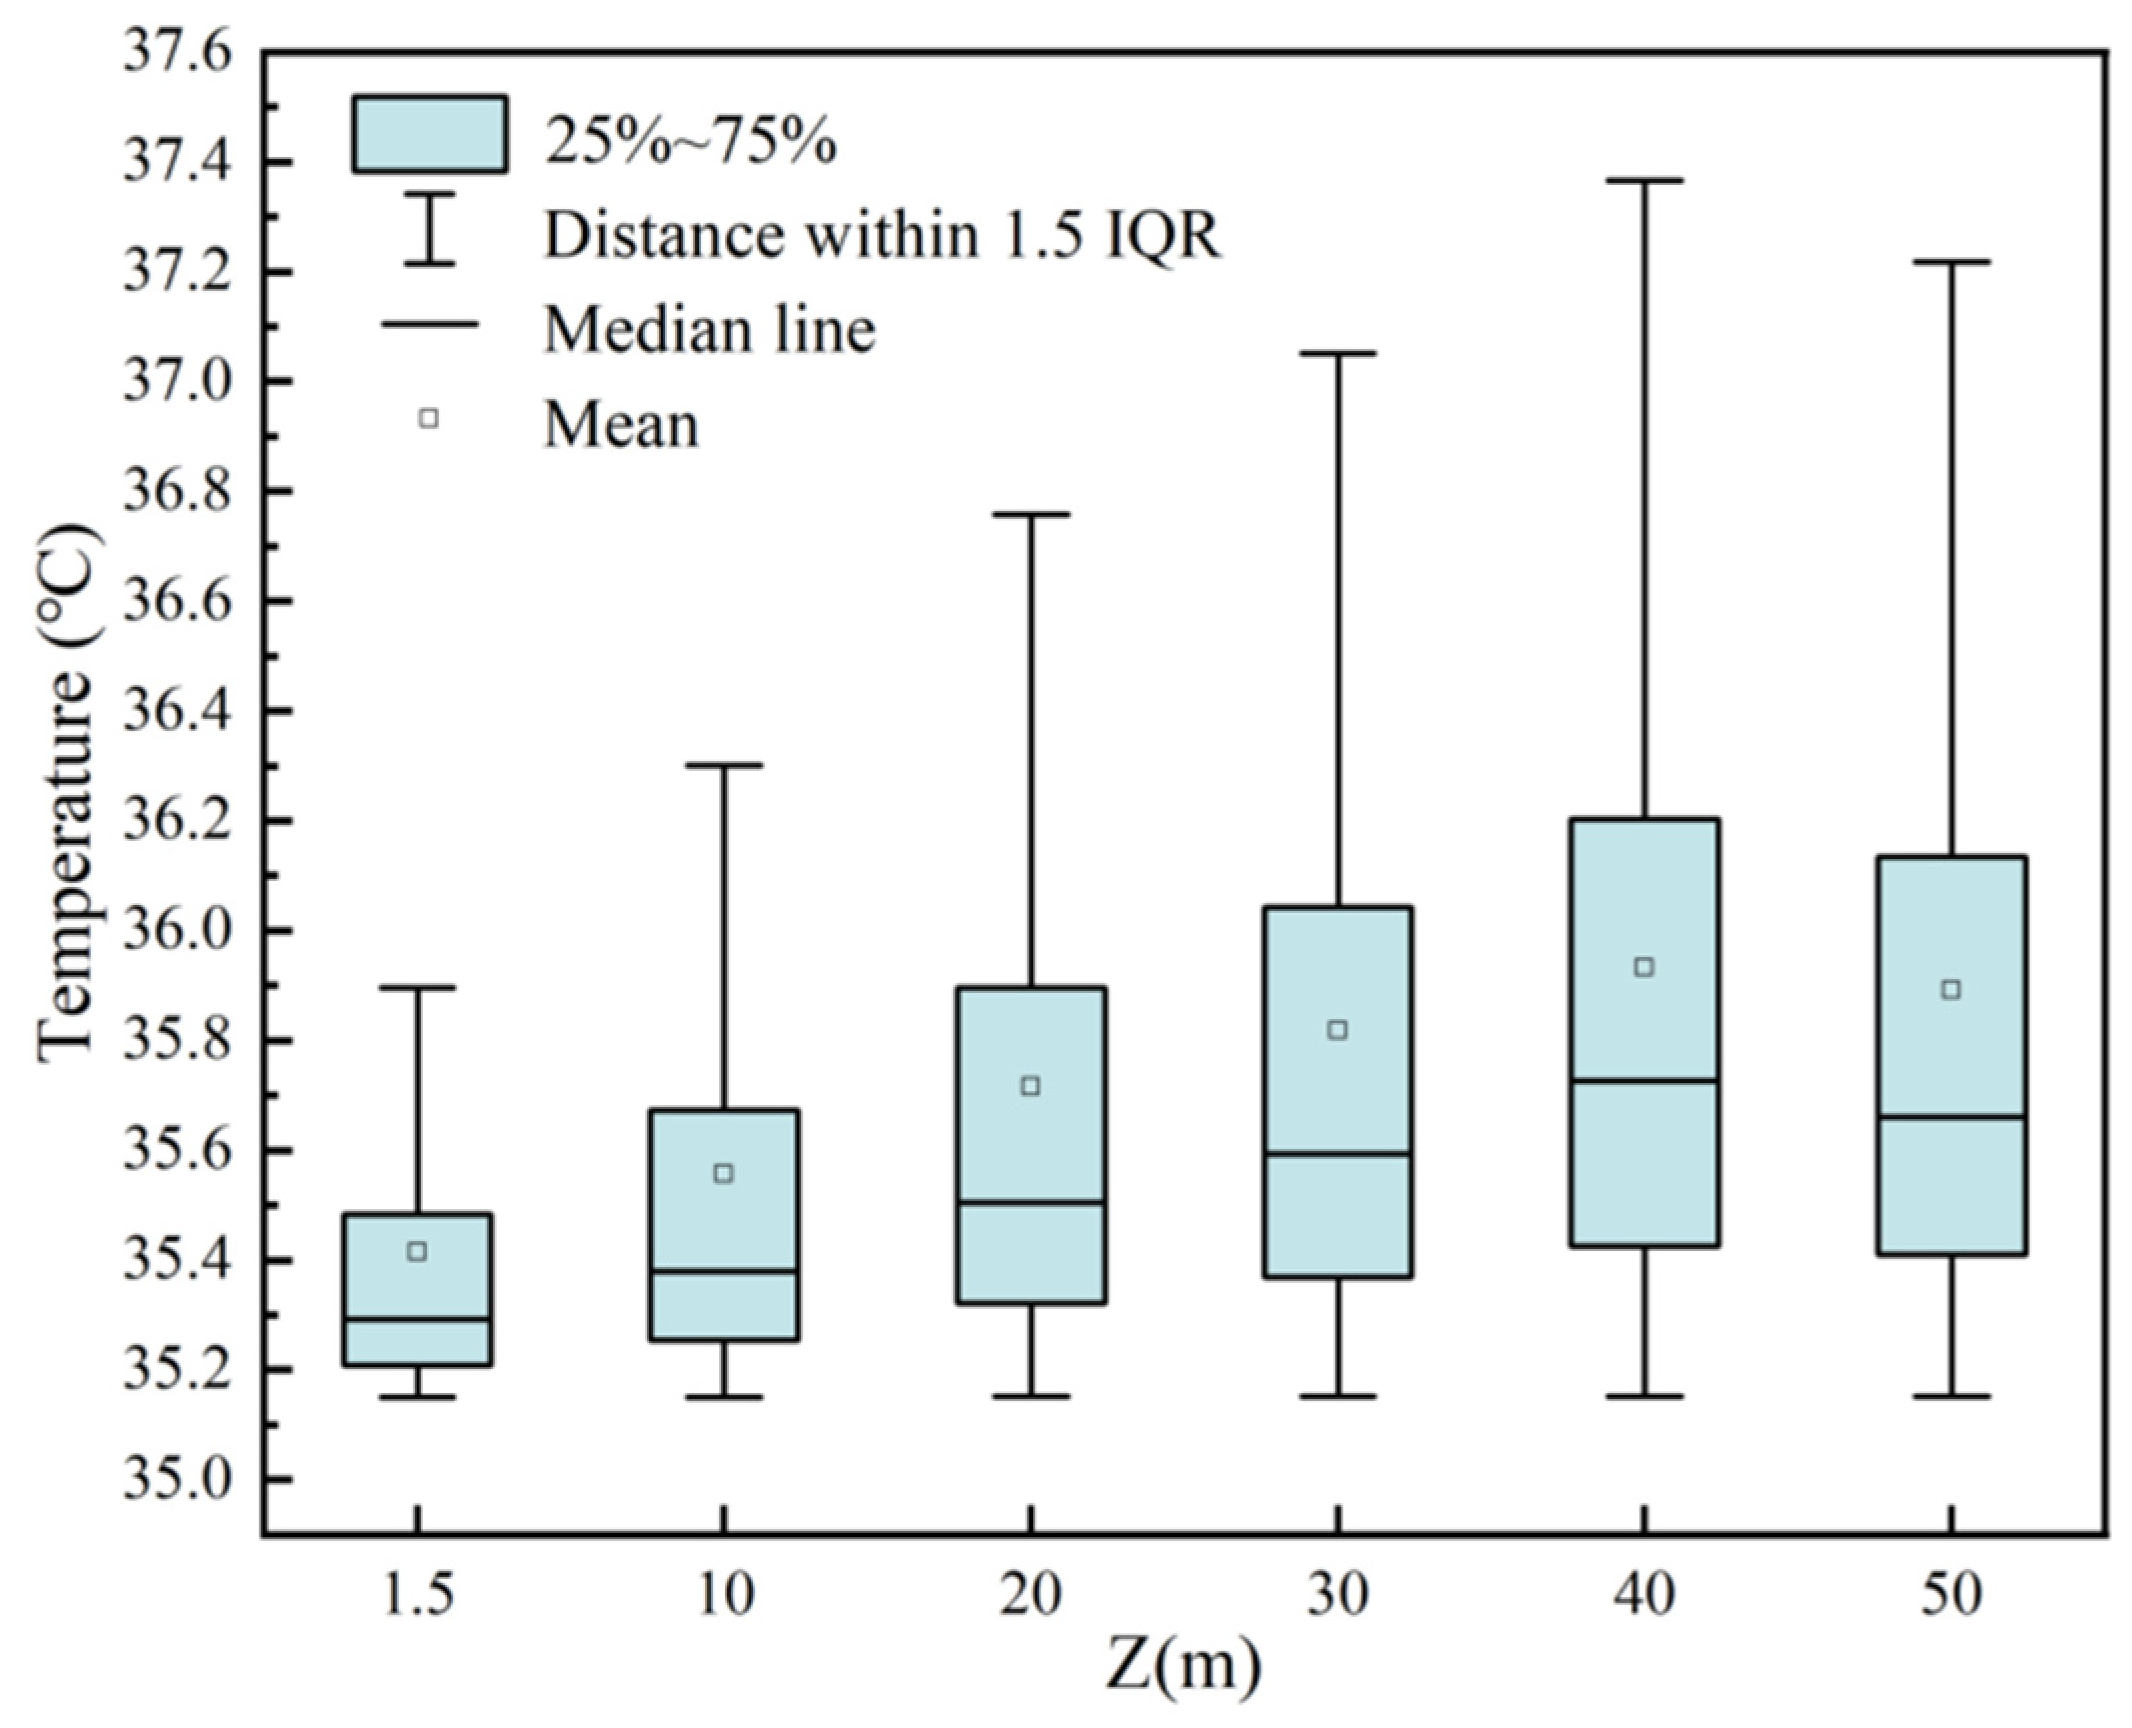
Furthermore, building height directly determines the vertical position of the heat accumulation peak: the higher the total building height, the higher the vertical position of the heat accumulation peak, and the heat storage height of all building types exhibits a “rising then falling” vertical distribution pattern. This is because the density of the air decreases after the waste heat from air-conditioning heats the air, causing it to rise naturally under the action of thermal buoyancy; when it rises to the middle and upper floors, the airflow circulation weakens, and the building’s obstruction easily forms vortices, which, combined with the continuous ACAH, causes a large amount of heat to remain at this height, forming the highest heat storage height; in the upper areas of the building, the heat storage effect is weakened due to the influence of high-altitude ventilation. For building A, at a height of Z = 40 m, the average peak temperature Tmax on the horizontal plane reaches 35.7 °C, as shown in Figure 16. At this height, both the average and median ambient temperatures reach their highest values. Within building A, the temperature is mainly concentrated between 35.1 °C and 36.8 °C. Therefore, it can be considered that at a height of Z = 40 m, ACAH has the greatest impact on the thermal environment within the building area. Due to fluctuations in wind pressure, the heat output of buildings at different heights exhibits inconsistency in the horizontal direction. ACAH has a greater impact on the temperature of buildings in the middle row, resulting in a relatively large heat storage area for these buildings.
Figure 16.
Box plot of ambient air temperature at different heights in building A.
Specifically, buildings C, D, and F are located at 60~75 m, while buildings A, B and E are located at 45~60 m, fully demonstrating the law that the heat accumulation peak shifts upward with the increase in building height; among them, building A has a temperature peak at Z = 40 m, which is the core heat storage height of this building type.
3.3. The Influence of Different Ambient Wind Speeds on ACAH
In different buildings, the influence of wind speed on ambient temperature is a crucial factor that cannot be ignored. Lower wind speeds hinder rapid heat diffusion, causing ACAH to tend to stagnate in the upper parts of the building, leading to increased temperature. This study investigated the thermal environment distribution of a building under calm winds, wind speeds of 0.5 m/s, and 1 m/s, using building E as an example for specific analysis, as shown in Figure 17. Under calm conditions, the average ambient temperature within the building’s area was relatively low, at 36.1 °C. When the ambient wind speed increased to 0.5 m/s, the average ambient temperature within the building’s area showed a significant increase, reaching 36.5 °C, a change most pronounced under all simulated wind speed conditions. When the ambient wind speed continued to increase to 1 m/s, the average ambient temperature within the building’s area decreased again, to 36.2 °C. This trend indicates that the average ambient temperature of the building area reached its highest value under a wind speed of 0.5 m/s, suggesting that under this wind speed condition, the impact of ACAH on the regional thermal environment was particularly significant, with its negative effects reaching a peak.
Figure 17.
Distribution of regional environmental air temperature under different wind speeds.
This is because, for the building complex as a whole, without the influence of external wind speed, the heat distribution is relatively uniform and cannot spread to locations relatively far from the buildings, thus having a relatively small impact on the overall thermal environment of the area. When there is a calm, light breeze, this weak wind speed not only fails to play a positive role in promoting the dissipation of waste heat from air-conditioning, but also acts as a certain obstacle, causing the ambient temperature in the area to rise instead of fall, further exacerbating the deterioration of the thermal environment.
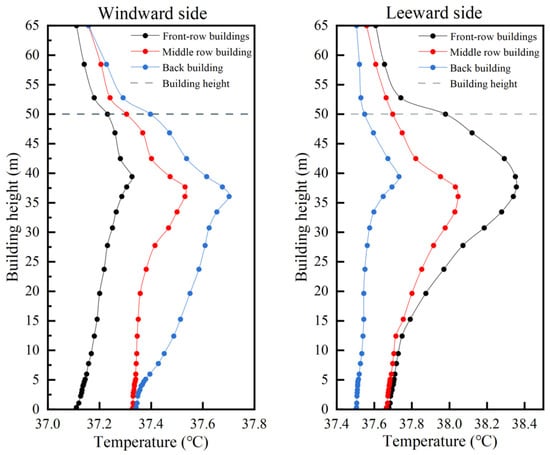
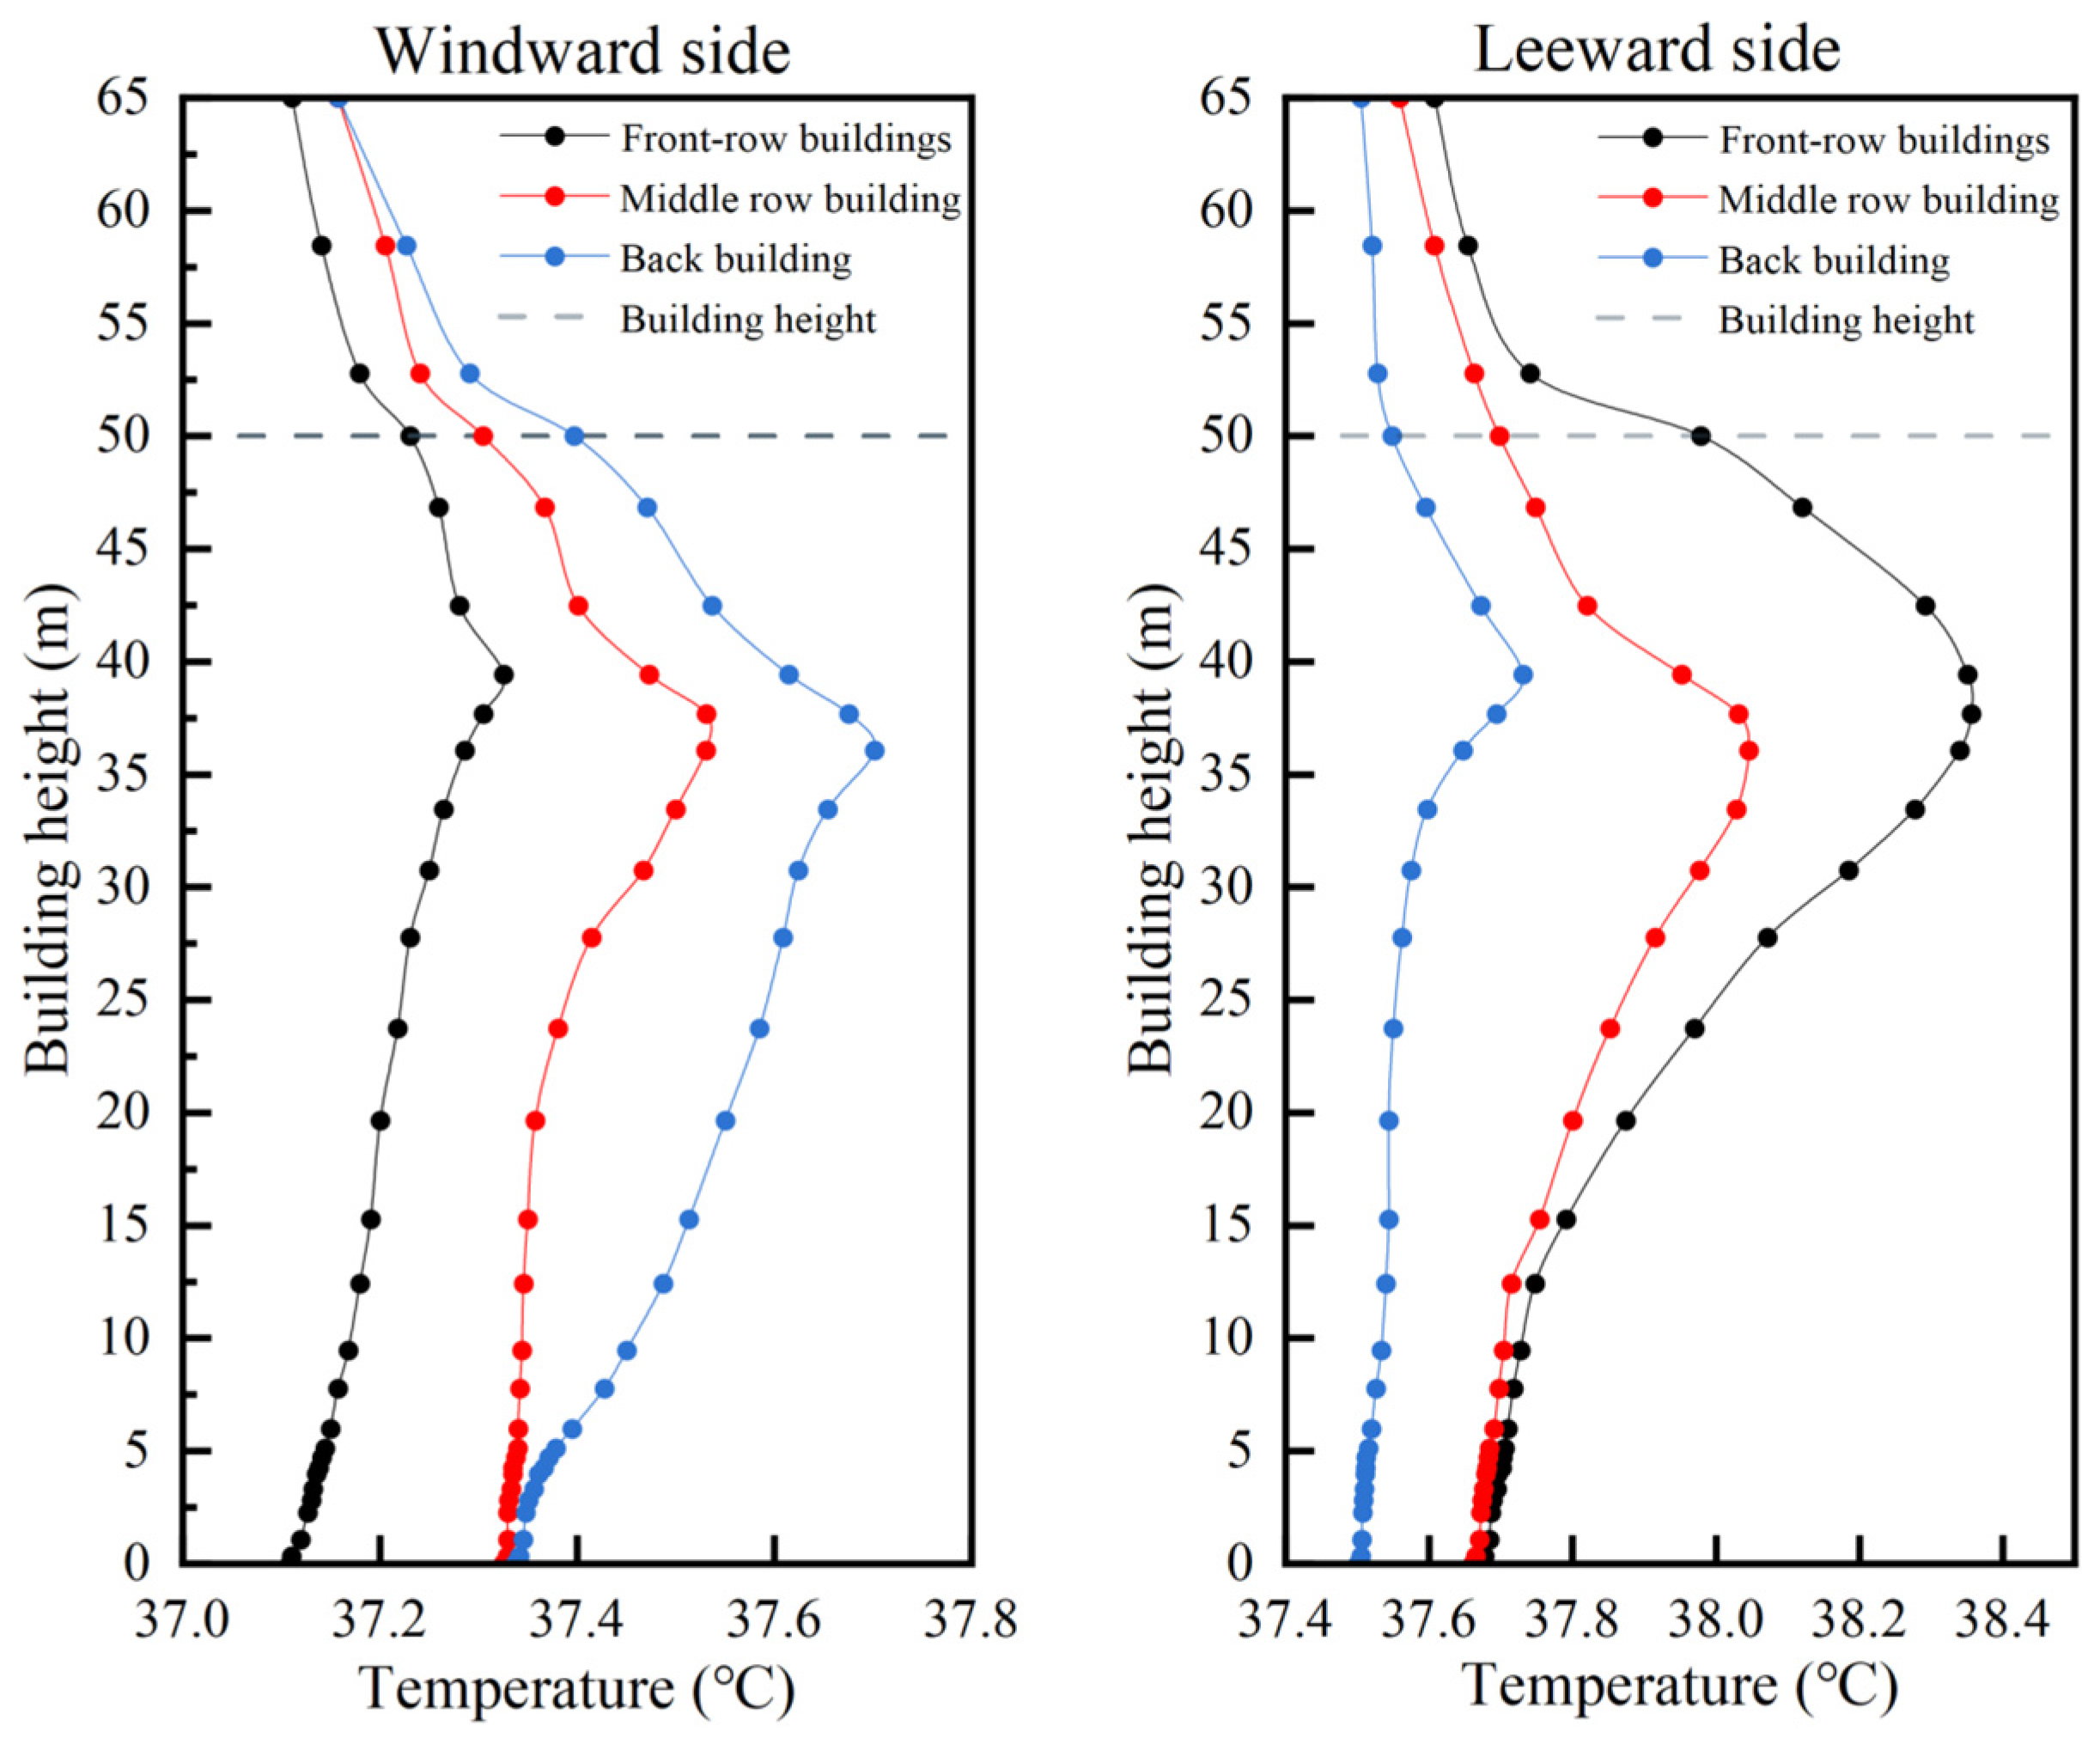
When the outdoor unit of an AC is placed on the windward side, the wind speed effectively removes the waste ACAH, lowering the temperature on the windward side, as shown in Figure 18. When the outdoor wind speed is 1 m/s, the average temperature on the windward side of the building is 37.3 °C. The increased wind speed effectively promotes the diffusion of waste heat, resulting in a relatively low temperature on the windward side. When the outdoor wind speed decreases to 0.5 m/s, the average temperature on the windward side of the building rises slightly, reaching 37.5 °C. The reduced wind speed leads to a decrease in waste heat diffusion efficiency, causing the temperature to rise again. When the outdoor conditions are calm, the average temperature on the windward side of the building further increases to 37.8 °C. Due to the lack of wind, the waste heat cannot dissipate in time, causing the temperature on the windward side to reach its highest value.
Figure 18.
Temperature around different building heights (windward/leeward).
When the outdoor unit is located on the leeward side, there is a significant accumulation of ACAH around the middle and rear rows of buildings. At an outdoor wind speed of 1 m/s, the average temperature on the leeward side of the building is 38.1 °C. Despite the presence of wind, the heat accumulation is still severe on the leeward side due to its specific location, resulting in a higher temperature than the windward side under the same wind speed conditions. At an outdoor wind speed of 0.5 m/s, the average temperature on the leeward side of the building is 37.9 °C, showing a slight decrease. Under calm conditions, the average temperature on the leeward side is the same as that on the windward side, 37.8 °C. This indicates that in the absence of wind, the temperature on both the windward and leeward sides is affected by ACAH to a similar degree.
The above research results show that for the windward side of a building, higher wind speeds can more effectively remove waste heat from AC, thereby reducing the local temperature. However, for the leeward side of a building, even under windy conditions, the air temperature is still higher than that of the windward side. This phenomenon highlights the severity of waste heat accumulation on the leeward side. Therefore, ambient wind facilitates heat dissipation on the windward side; it also leads to the accumulation of waste heat from AC on the leeward side.
3.4. Cooling Energy Consumption at Different Building Heights
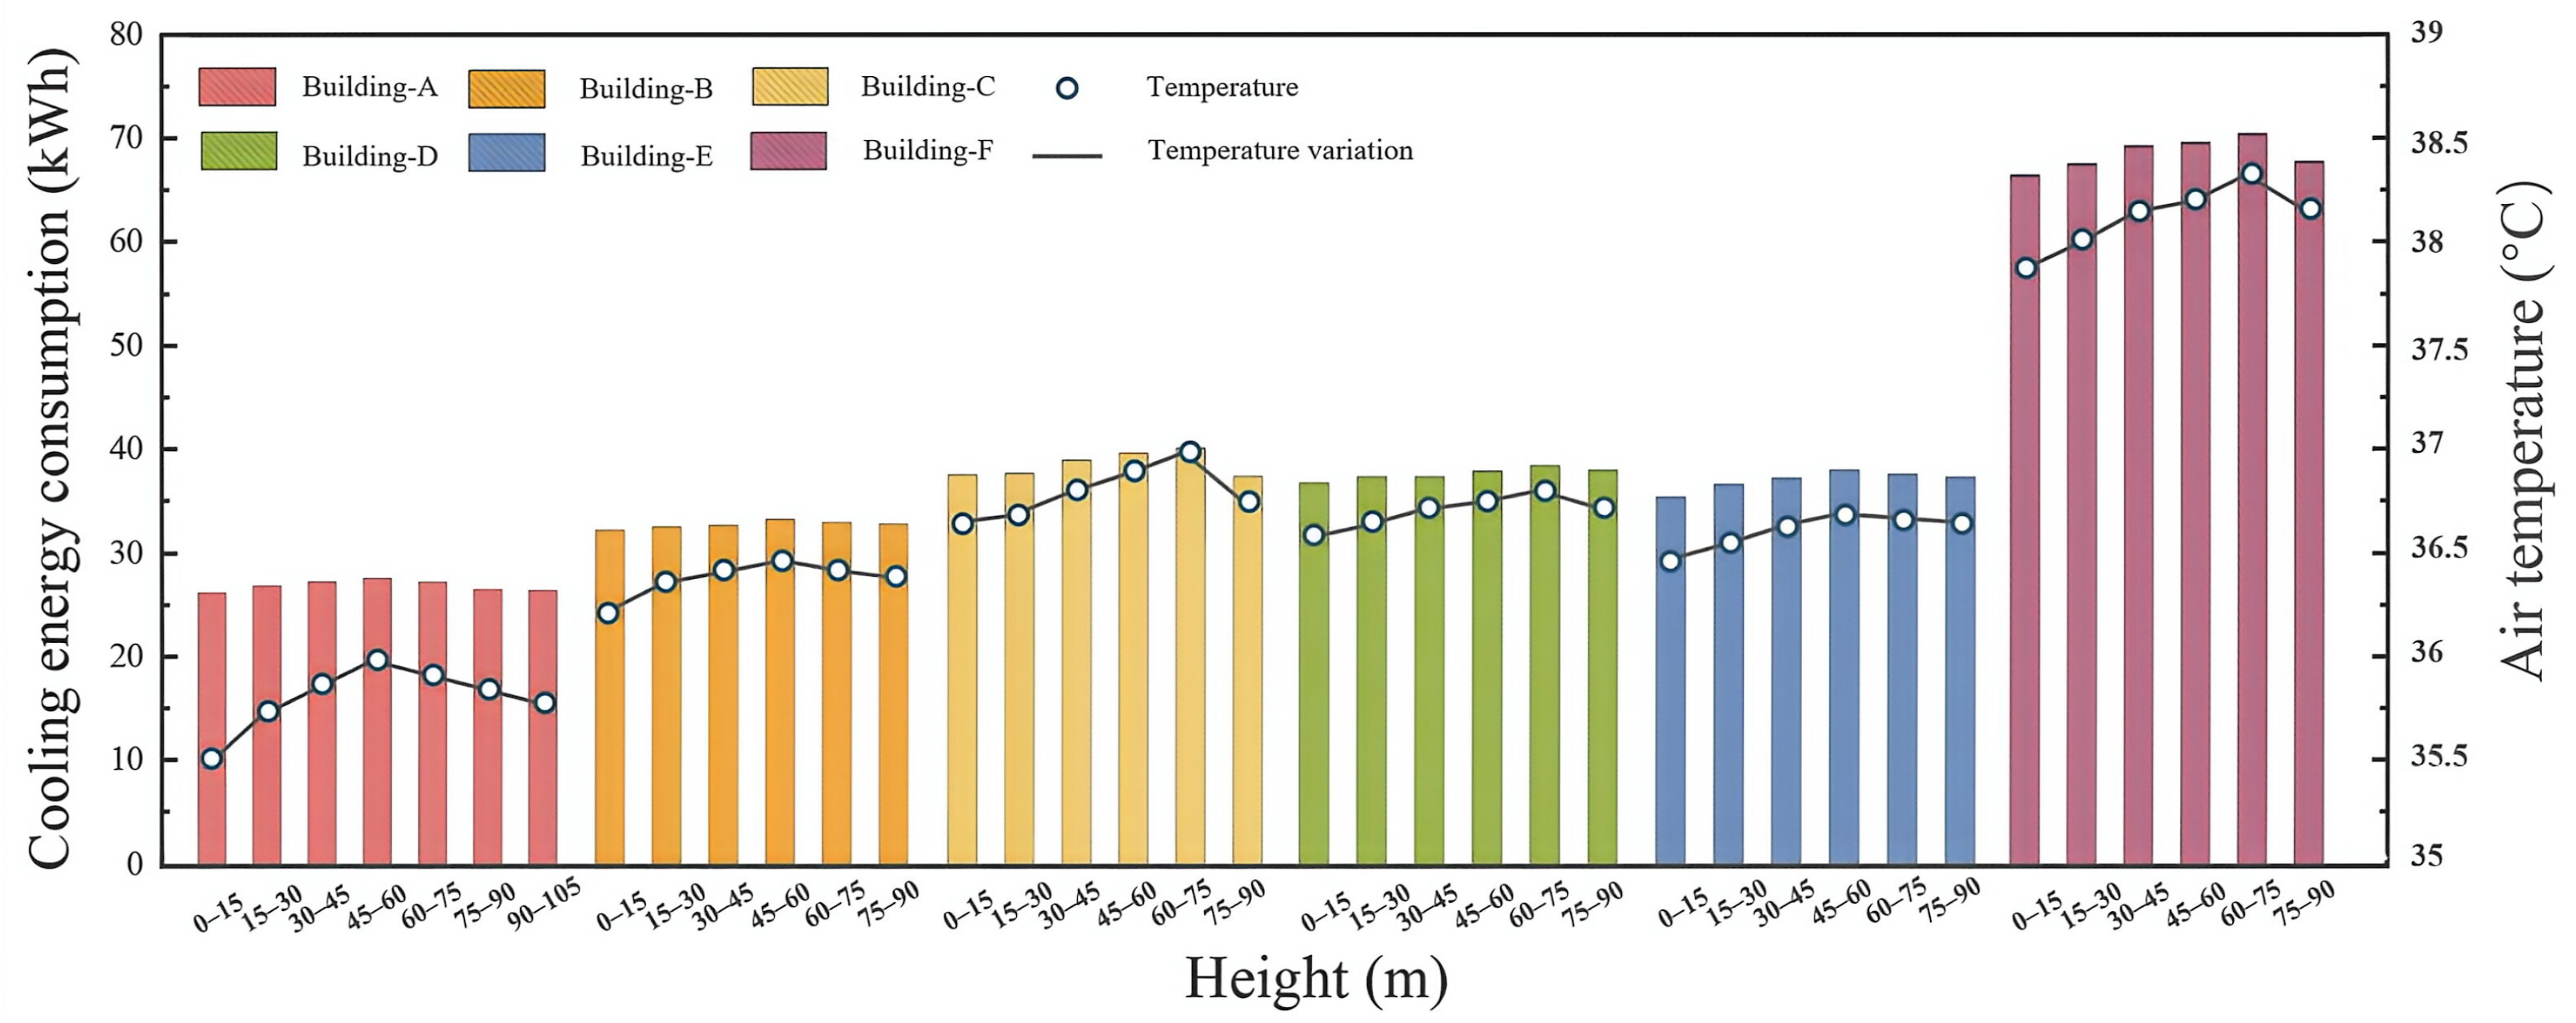
The effect of ACAH on the cooling energy consumption of six typical buildings at different floor heights was quantified, as shown in Figure 19. The cooling energy consumption of buildings exhibits a clear distribution pattern in the vertical direction and is highly correlated with the thermal stratification phenomenon of ACAH in the vertical direction. The cooling energy consumption of buildings A–F shows a parabolic trend of first increasing and then decreasing with increasing height. The peak cooling energy consumption of buildings A, B, and E occurs between 45 and 60 m, while that of buildings C, D, and F occurs between 60 and 75 m. Taking building C as an example, its energy consumption peak occurs on the 23rd floor, while the peak temperature in the vertical direction occurs on the 26th floor. This difference is due to the spatial and temporal lag in heat transfer: heat accumulation on lower floors immediately increases the AC load, while the upward transfer of heat has a delayed impact on higher floors. In high-rise buildings, ACAH on lower floors is transferred upwards due to thermal buoyancy, but this process takes time and introduces a certain delay. When heat accumulates on the 23rd floor due to ACAH, the cooling system needs to increase its load to maintain thermal balance. As heat is transferred upwards to the 26th floor through natural convection and thermal pressure, some of the heat on the 23rd floor has already dissipated. At this point, the peak temperature and peak energy consumption are misaligned in the vertical direction. This time delay causes the peak energy consumption and peak temperature to occur on different floors.
Figure 19.
Distribution of cooling energy consumption in different heights of typical buildings.
From the perspective of energy consumption distribution gradient, the energy consumption of buildings in the 60–75 m height range is 1.2% and 7.3% higher than that of the two adjacent height ranges. The total building energy consumption is 187.40 kWh, 198.18 kWh, 234.14 kWh, 227.92 kWh, 223.96 kWh and 413.73 kWh. Compared with the building energy consumption simulation using only one temperature, the uneven temperature distribution in the vertical direction of the building will lead to differences in cooling energy consumption of different floors, with this difference being about 7.2% to 7.8%. This result has clear practical significance: if the vertical temperature gradient caused by ACAH is ignored, the traditional uniform temperature assumption will lead to a systematic underestimation of the cooling load in the middle and upper floors, while the cooling load in the lower floors will be systematically overestimated. This will cause systematic deviations in building energy consumption simulation, affecting the rationality of the design and operation strategies of the air-conditioning system.
4. Discussion
4.1. Suggestion
This study investigates the spatial distribution and energy consumption impact of ACAH in high-density residential buildings in the Pearl River Delta region. Based on simulation results, it proposes engineering optimization suggestions for building design and operation, providing practical guidance for mitigating heat accumulation and reducing building energy consumption. For high-density residential buildings similar to those in the Pearl River Delta, it is recommended to place the outdoor unit on the windward side of the building to enhance heat diffusion through wind pressure ventilation and reduce the intensity of local heat accumulation. The installation distance between the outdoor unit should be at least 1.5 m to reduce thermal interference between the outdoor unit and avoid the superposition of local temperature rises. In terms of building layout, it is recommended that the minimum building spacing be no less than 5 m to ensure lateral ventilation efficiency and suppress the vertical heat accumulation effect. A staggered building layout or the addition of ventilation corridors can be adopted to accelerate heat diffusion using natural wind and effectively reduce the temperature accumulation on the leeward side of the building. At the same time, the vertical distribution characteristics of ACAH should be fully considered during the building design stage, and the ventilation design of high-rise areas should be optimized to alleviate the heat accumulation problem in mid-to-high-rise buildings and improve the overall thermal comfort and energy efficiency of the building.
4.2. Limitation
This study still has certain limitations and requires further improvement in future research. First, this study adopted the constant ACAH dissipation assumption, failing to consider the impact of load fluctuations and start–stop conditions on heat dissipation intensity during actual air-conditioning operation, resulting in some deviation from real-world scenarios. Second, to improve computational efficiency, this study modeled the outdoor unit as a vertical strip equivalent structure rather than an outdoor unit, simplifying building geometry and potentially slightly affecting the simulation accuracy of local flow and temperature fields. Third, this study used steady-state analysis methods for simulation, failing to consider the spatiotemporal variation characteristics of ACAH under dynamic conditions, and thus cannot fully reflect the dynamic evolution of the thermal environment in real-world environments. Fourth, the model validation in this study was based only on limited field measurement data, with limitations in the validation scenario and sample size. Further research with a wider scope and longer duration is needed to further validate the model’s reliability. Finally, this study used typical residential buildings in the Pearl River Delta region as the research object, and the conclusions are based on the specific climatic conditions and architectural characteristics of this region. Its universality needs further validation in other climate zones and different building types. Future research can expand the scope to improve the generalizability of the conclusions.
5. Conclusions
This paper uses six typical building types in the Pearl River Delta as case studies and employs CFD methods to conduct a simulation study on ACAH. The influence of different building shapes and environmental parameters on ACAH is analyzed. Based on the EnergyPlus co-simulation method and combined with building microclimate data obtained from CFD simulation, the impact of ACAH on building energy consumption is investigated. The main results are as follows:
(1) ACAH exhibits non-uniformity in the horizontal direction. Under windless conditions, when the ambient temperature is within the range of 33–38 °C, the influence of ACAH is most significant within a radius of 0.5 m, with the air temperature in the affected area being approximately 4.3 °C higher than the ambient temperature. As the distance increases to 1.5 m, the air temperature approaches the ambient temperature. With the ambient temperature rising to 38 °C, the distance of influence of ACAH gradually increases. Air temperature rises by 4.1 °C at 0.5 m from the outdoor unit, and there is still a 0.5 °C temperature rise at 3 m from the outdoor unit. The study also shows that wind speed has a significant impact on the heat diffusion from the AC. As wind speed gradually increases, heat is diluted and diffused further, leading to a wider range of influence from ACAH. Vertical heat accumulation occurs due to localized ACAH. In buildings of types C and F, air temperature peaks of 38.7 °C are observed at the 26th floor (Z = 80 m) and 23rd floor (Z = 70 m), 3.5 °C higher than the bottom air temperature.
(2) There is a non-linear relationship between ambient temperature and ACAH. Building’s ACAH temperature reaches 40.2–40.9 °C as the ambient temperature rises to 38 °C. Wind speed has different effects on the diffusion of ACAH. When the ambient wind speed is 0.5 m/s, the air temperature near the building reaches 36.5 °C. While under a wind speed of 1 m/s, the diffusion of ACAH will be accelerated, causing the air temperature on the windward side of the building to drop to 36.2 °C. But the leeward side of the building is always 1.0–1.3 °C higher than the windward side. Under calm and low-wind conditions, the air temperature near the building can reach 36.4 °C due to the heat accumulation of ACAH.
(3) Vertical cooling energy consumption exhibits a parabolic trend of first increasing and then decreasing with building height, with the peak energy consumption lagging behind the temperature peak by one to three floors. It reflects the spatiotemporal delay characteristics of heat transfer. Compared with building energy consumption simulation using only one temperature, the air temperature distribution in the vertical direction of the building leads to differences in cooling energy consumption on different floors, with these differences ranging from approximately 7.2% to 7.8%.
Author Contributions
Conceptualization: C.F.; data curation: P.Y., C.F. and J.C.; formal analysis: P.Y., J.C. and C.F.; methodology: P.Y., J.C. and C.F.; writing—original draft preparation: P.Y., C.F. and J.C.; writing—review and editing: C.F.; funding acquisition: C.F.; resources: C.F.; supervision: C.F. All authors have read and agreed to the published version of the manuscript.
Funding
This study was supported by Guangdong Basic and Applied Basic Research (No. 2024A1515510001), Guangzhou Philosophy and Social Science Planning Project (No. 2025GZQN38).
Data Availability Statement
The datasets generated and analyzed during the current study are available from the corresponding author on reasonable request.
Conflicts of Interest
The authors declare that they have no known competing financial interests or personal relationships that could have appeared to influence the work reported in this paper.
References
- Agency, I.E. Air Conditioning Use Emerges as One of the Key Drivers of Global Electricity-Demand Growth. Available online: https://www.iea.org/news/air-conditioning-use-emerges-as-one-of-the-key-drivers-of-global-electricity-demand-growth (accessed on 27 March 2026).
- Mohajerani, A.; Bakaric, J.; Jeffrey-Bailey, T. The Urban Heat Island Effect, Its Causes, and Mitigation, with Reference to the Thermal Properties of Asphalt Concrete. J. Environ. Manag. 2017, 197, 522–538. [Google Scholar] [CrossRef] [Scilit]
- Yue, X.-L.; Gao, Q.-X. Contributions of Natural Systems and Human Activity to Greenhouse Gas Emissions. Adv. Clim. Chang. Res. 2018, 9, 243–252. [Google Scholar] [CrossRef] [Scilit]
- Dhakal, S.; Hanaki, K.; Hiramatsu, A. Estimation of Heat Discharges by Residential Buildings in Tokyo. Energy Convers. Manag. 2003, 44, 1487–1499. [Google Scholar] [CrossRef] [Scilit]
- Kang, S.; Lee, D.; Park, J.; Jung, J. Exploring Urban Forms Vulnerable to Urban Heat Islands: A Multiscale Analysis. Sustainability 2022, 14, 3603. [Google Scholar] [CrossRef] [Scilit]
- Martilli, A.; Krayenhoff, E.S.; Nazarian, N. Is the Urban Heat Island Intensity Relevant for Heat Mitigation Studies? Urban Clim. 2020, 31, 100541. [Google Scholar] [CrossRef] [Scilit]
- Hsieh, C.-M.; Aramaki, T.; Hanaki, K. Estimation of Heat Rejection Based on the Air Conditioner Use Time and Its Mitigation from Buildings in Taipei City. Build. Environ. 2007, 42, 3125–3137. [Google Scholar] [CrossRef] [Scilit]
- Cui, Y.; Zhou, X.; He, H.; Fan, C.; Ye, L. Assessing the Coupled Exposure Risks of Heatwaves and Particulate Matter: Based on the Empirical Analysis of 347 Cities in China. J. Clean. Prod. 2026, 541, 147575. [Google Scholar] [CrossRef] [Scilit]
- Hsieh, C.-M.; Aramaki, T.; Hanaki, K. Managing Heat Rejected from Air Conditioning Systems to Save Energy and Improve the Microclimates of Residential Buildings. Comput. Environ. Urban Syst. 2011, 35, 358–367. [Google Scholar] [CrossRef] [Scilit]
- Adelia, A.S.; Yuan, C.; Liu, L.; Shan, R.Q. Effects of Urban Morphology on Anthropogenic Heat Dispersion in Tropical High-Density Residential Areas. Energy Build. 2019, 186, 368–383. [Google Scholar] [CrossRef] [Scilit]
- Liu, L.; Wang, S.; Dou, J.; Chen, G.; Hang, J.; Yang, X. Modeling the Vertical Air Temperature Rise Patterns of Densely-Built Urban Canyons under Building Anthropogenic Heat via a Scaled Outdoor Experiment. Build. Environ. 2025, 290, 114133. [Google Scholar] [CrossRef] [Scilit]
- De Munck, C.; Pigeon, G.; Masson, V.; Meunier, F.; Bousquet, P.; Tréméac, B.; Merchat, M.; Poeuf, P.; Marchadier, C. How Much Can Air Conditioning Increase Air Temperatures for a City like Paris, France? Int. J. Climatol. 2013, 33, 211–227. [Google Scholar] [CrossRef] [Scilit]
- Wang, L.; Li, B.; Zhao, X.; He, J. A Water Spraying Box and Its Improving Effect on the Thermal Environment around Multi-Story Residential Buildings to Reduce Released Heat from Air-Conditioning Units. Energy Build. 2023, 297, 113484. [Google Scholar] [CrossRef] [Scilit]
- Ohashi, Y.; Genchi, Y.; Kondo, H.; Kikegawa, Y.; Yoshikado, H.; Hirano, Y. Influence of Air-Conditioning Waste Heat on Air Temperature in Tokyo during Summer: Numerical Experiments Using an Urban Canopy Model Coupled with a Building Energy Model. J. Appl. Meteorol. Climatol. 2007, 46, 66–81. [Google Scholar] [CrossRef] [Scilit]
- Zhong, X.; Zhang, Z.; Zhang, R.; Wu, Z. Combined Effects of Exterior Shading and a/C Heat Rejection on Building Energy Consumption and Indoor Air Pollution Exposure. Buildings 2023, 13, 2440. [Google Scholar] [CrossRef] [Scilit]
- Liu, J.; Ma, F.; Li, Y. The Effect of Anthropogenic Heat on Local Heat Island Intensity and the Performance of Air Conditioning Systems. Adv. Mater. Res. 2011, 251–253, 2975–2978. [Google Scholar] [CrossRef] [Scilit]
- Yuan, C.; Zhu, R.; Tong, S.; Mei, S.; Zhu, W. Impact of Anthropogenic Heat from Air-Conditioning on Air Temperature of Naturally Ventilated Apartments at High-Density Tropical Cities. Energy Build. 2022, 268, 112171. [Google Scholar] [CrossRef] [Scilit]
- Chow, T.-T.; Lin, Z.; Wang, Q.-W. Applying CFD Simulation in Analysing Split-Type Air-Conditioner Performance at Buildings. Archit. Sci. Rev. 2000, 43, 133–140. [Google Scholar] [CrossRef] [Scilit]
- Bojic, M.; Lee, M.; Yik, F. Flow and Temperatures Outside a High-Rise Residential Building Due to Heat Rejection by Its Air-Conditioners. Energy Build. 2001, 33, 737–751. [Google Scholar] [CrossRef] [Scilit]
- Tong, L.-G.; Zhang, Z.; Wang, L.; Yin, S.-W.; Yu, J.; Liu, C. Numerical Simulation for Thermal Distribution of Air-Conditioner Outdoor Units. J. Therm. Sci. 2012, 21, 269–275. [Google Scholar] [CrossRef] [Scilit]
- Mei, S.-J.; Yuan, C. Analytical and Numerical Study on Transient Urban Street Air Warming Induced by Anthropogenic Heat Emission. Energy Build. 2021, 231, 110613. [Google Scholar] [CrossRef] [Scilit]
- Wan, Y.; Xue, T.; Huang, Z.; Soh, A.; Liu, H.; Chua, K.J. Comparative Study on Performance of Counter-Flow Dew-Point Indirect Evaporative Cooling Systems via a More Realistic and Experimentally Validated Three-Dimensional Model. J. Build. Eng. 2024, 82, 108408. [Google Scholar] [CrossRef] [Scilit]
- Hsieh, C.-M.; Aramaki, T.; Hanaki, K. The Feedback of Heat Rejection to Air Conditioning Load during the Nighttime in Subtropical Climate. Energy Build. 2007, 39, 1175–1182. [Google Scholar] [CrossRef] [Scilit]
- Zhou, Y.; Weng, Q.; Gurney, K.R.; Shuai, Y.; Hu, X. Estimation of the Relationship between Remotely Sensed Anthropogenic Heat Discharge and Building Energy Use. ISPRS J. Photogramm. Remote Sens. 2012, 67, 65–72. [Google Scholar] [CrossRef] [Scilit]
- Hong, T.; Ferrando, M.; Luo, X.; Causone, F. Modeling and Analysis of Heat Emissions from Buildings to Ambient Air. Appl. Energy 2020, 277, 115566. [Google Scholar] [CrossRef] [Scilit]
- Abdullah, K.A.; Barwari, R.R.I. CFD simulation of thermal plume of VRF air conditioners for cooling season in Semi-Closed spaces for Erbil climate conditions. Int. J. Heat Technol. 2022, 40, 1079–1085. [Google Scholar] [CrossRef] [Scilit]
- Han, M.; Chen, H. Effect of External Air-Conditioner Units’ Heat Release Modes and Positions on Energy Consumption in Large Public Buildings. Build. Environ. 2017, 111, 47–60. [Google Scholar] [CrossRef] [Scilit]
- Du, Y.; Zhang, G.; Tian, Z.; Zheng, H.; Wei, J.; He, J.; Kwok, K. Characterizing Dynamic Pollutant Dispersion Mechanism under Time-Dependent Inflows in an Idealized Two-Dimensional Street Canyon. Urban Clim. 2026, 65, 102812. [Google Scholar] [CrossRef] [Scilit]
- Wan, Y.; Xue, T.; Huang, Z.; Cui, X.; Huang, D.; Chua, K.J. Energy, Economic and Environmental Assessment of a Photovoltaic-Driven Dew-Point Evaporative Cooling System. Appl. Therm. Eng. 2026, 289, 129799. [Google Scholar] [CrossRef] [Scilit]
- Peng, H. Research on Typical Building Energy Modelsof Commercial and Residential Buildings in the Pearl River Delta Region. Master’s Thesis, Guangzhou University, Guangzhou, China, 2020. [Google Scholar]
- Peng, S.; Chen, Y.; Yan, H.; Pan, Y. Dynamic Thermal Performance Study of Moisture-Conducting Fiber-Type Indirect Evaporative Cooler Based on CFD Method. Appl. Therm. Eng. 2026, 292, 130291. [Google Scholar] [CrossRef] [Scilit]
- Han, G.; Chen, H.; Yuan, L.; Cai, Y.; Han, M. Field Measurements on Micro-Climate and Cooling Effect of River Wind on Urban Blocks in Wuhan City. In Proceedings of the 2011 International Conference on Multimedia Technology, Hangzhou, China, 26–28 July 2011; IEEE: New York, NY, USA, 2011; pp. 4446–4449. [Google Scholar]
- Zhao, Q.; Gao, L.; Meng, Q.; Zhu, M. Climate warming will exacerbate unequal exposure to compound flood-heatwave extremes. Earth’s Future 2024, 12, e2024EF005179. [Google Scholar] [CrossRef] [Scilit]
- Huo, H.; Chen, F.; Geng, X.; Tao, J.; Liu, Z.; Zhang, W.; Leng, P. Simulation of the Urban Space Thermal Environment Based on Computational Fluid Dynamics: A Comprehensive Review. Sensors 2021, 21, 6898. [Google Scholar] [CrossRef] [Scilit]
- Deng, Y.; Feng, J.; Wan, F.; Shen, X.; Xu, B. Evaluation of the Turbulence Model Influence on the Numerical Simulation of Cavitating Flow with Emphasis on Temperature Effect. Processes 2020, 8, 997. [Google Scholar] [CrossRef] [Scilit]
- Tominaga, Y.; Mochida, A.; Yoshie, R.; Kataoka, H.; Nozu, T.; Yoshikawa, M.; Shirasawa, T. AIJ Guidelines for Practical Applications of CFD to Pedestrian Wind Environment around Buildings. J. Wind Eng. Ind. Aerodyn. 2008, 96, 1749–1761. [Google Scholar] [CrossRef] [Scilit]
- Kominek, J.; Zachar, M.; Guzej, M.; Bartuli, E.; Kotrbacek, P. Influence of Ambient Temperature on Radiative and Convective Heat Dissipation Ratio in Polymer Heat Sinks. Polymers 2021, 13, 2286. [Google Scholar] [CrossRef] [Scilit] [PubMed]
- Michalak, P. Ventilation Heat Loss in a Multifamily Building under Varying Air Density. J. Mech. Energy Eng. 2020, 4, 97–102. [Google Scholar] [CrossRef] [Scilit]
- Allegrini, J.; Carmeliet, J. Coupled CFD and Building Energy Simulations for Studying the Impacts of Building Height Topology and Buoyancy on Local Urban Microclimates. Urban Clim. 2017, 21, 278–305. [Google Scholar] [CrossRef] [Scilit]

Disclaimer/Publisher’s Note: The statements, opinions and data contained in all publications are solely those of the individual author(s) and contributor(s) and not of MDPI and/or the editor(s). MDPI and/or the editor(s) disclaim responsibility for any injury to people or property resulting from any ideas, methods, instructions or products referred to in the content. |
© 2026 by the authors. Licensee MDPI, Basel, Switzerland. This article is an open access article distributed under the terms and conditions of the Creative Commons Attribution (CC BY) license.