


Abstract
Desert sand concrete (DSC) cube and beam (DSCB) specimens were prepared to investigate the influence of desert sand from Ningxia, China, on the flexural behavior of concrete beams. Specimens were produced with different desert sand replacement ratios (DSRRs), and the cubic compressive strength (CCS) of DSC cubes were measured. Digital image correlation (DIC) was applied during four-point bending tests to characterize full-field strain distributions and to track crack initiation and propagation. The results indicate that CCS peaked at a DSRR of 25%. This value represented a 6% increase relative to natural sand concrete (NSC). The ultimate flexural capacity of DSCBs reached its maximum at this DSRR. This corresponded to a 2.5% increase relative to a natural sand concrete beam (NSCB). The cracks in DSCBs developed more significantly. Failure mode of DSCBs transformed from ductile to brittle at a DSRR of 50%. The current Chinese code can provide a reference for the engineering design of DSCBs, and appropriate modifications considering the DSRR are recommended for different stress stages. These findings provide a theoretical basis and technical support for the practical application of DSC.
1. Introduction
The application of desert sand in concrete has been extensively studied [1,2,3,4]. Mechanical properties of concrete depend strongly on the desert sand replacement ratio (DSRR). The compressive strength peaks at a 25% DSRR and decreases at a 50% DSRR [5,6]. Several studies have assessed the suitability of desert sand from different regions for structural applications. Lv et al. [7] demonstrated the feasibility of using desert sand from Xinjiang, China, for masonry by testing compressive performance. Liu et al. [8] examined basalt fiber-reinforced desert sand concrete columns and found that specimens with a fiber content of 0.1% exhibited superior mechanical properties compared to those with other fiber contents. Luo et al. [9] investigated the shear damage evolution process of desert sand concrete beams using acoustic emission technology and fractal theory. They quantitatively analyzed the laws governing the damage evolution of shear beams and various variable factors and established a shear damage model based on acoustic emission parameters and the fractal dimension of surface cracks in test beams. Qin et al. [10] explored the flexural mechanical properties of steel fiber desert sand concrete beams. The “filling effect” of desert sand compacts the concrete and makes the overall performance of the component present a good state. Bekey et al. [11] investigated the effect of desert sand on the flexural behavior of reinforced concrete beams and reported that China’s current design codes remain applicable. Li et al. [12] studied the flexural behavior of a reinforced beam fabricated with sand from Gurbantunggut desert in northwest Xinjiang, China. They proposed an empirical formula for the flexural strength of desert sand concrete beams (DSCBs). Yu et al. [13] explored the influence of the desert sand replacement ratio in concrete on the seismic performance of concrete-filled steel tubular column–composite beam space frame structures. The seismic performance of desert sand concrete structures with stirrups was better than that of ordinary concrete structures.
Digital image correlation (DIC) is a non-contact optical measurement method. DIC determines full-field displacement and strain with high precision by capturing grayscale images of the specimen surface and comparing them across different loading levels [14,15]. The technique enables a systematic investigation of crack initiation, propagation, branching, and fatigue damage in concrete materials [16,17,18]. Ashraf et al. [19] investigated the fracture evolution of polyolefin fiber-reinforced concrete (PFRC) and steel fiber-reinforced concrete (SFRC) specimens under three-point bending tests through digital image correlation (DIC). Menna et al. [20] investigated the flexural response of hooked-end superelastic shape memory alloy (SMA) fiber-reinforced concrete beams under cyclic loading, and DIC techniques were used to measure the cracking behavior of the SMA FRC beams. Kadhom et al. [21] verified the suitability of digital image correlation (DIC) technology in evaluating the flexural behavior of as-built and carbon-fiber-reinforced polymer (CFRP)-strengthened reinforced concrete beams through four-point bending tests. Hemalatha et al. [22] employed DIC to monitor the mechanical response of composite reinforced beams during the four-point bending test. The method accurately reproduced the load–displacement curve and moment–deflection curve, tracked crack propagation, and identified failure mode.
Although studies have examined desert sand concrete components in different regions, none of the literature has addressed the flexural behavior of DSCBs in Ningxia, China, which is one of the vital sources of desert sand in the country. This research gap restricts the popularization and application of local desert sand resources in concrete structures within the region. This study investigated concrete beams with different DSRRs using four-point bending tests. DIC was employed for full-field, real-time monitoring of surface strain and damage evolution. This study characterized the flexural behavior and damage evolution of DSCBs. The findings provide experimental data and theoretical support for the application of DSCBs in engineering components.
2. Materials and Experimental Methods
2.1. Materials
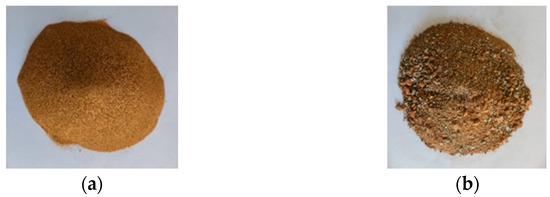
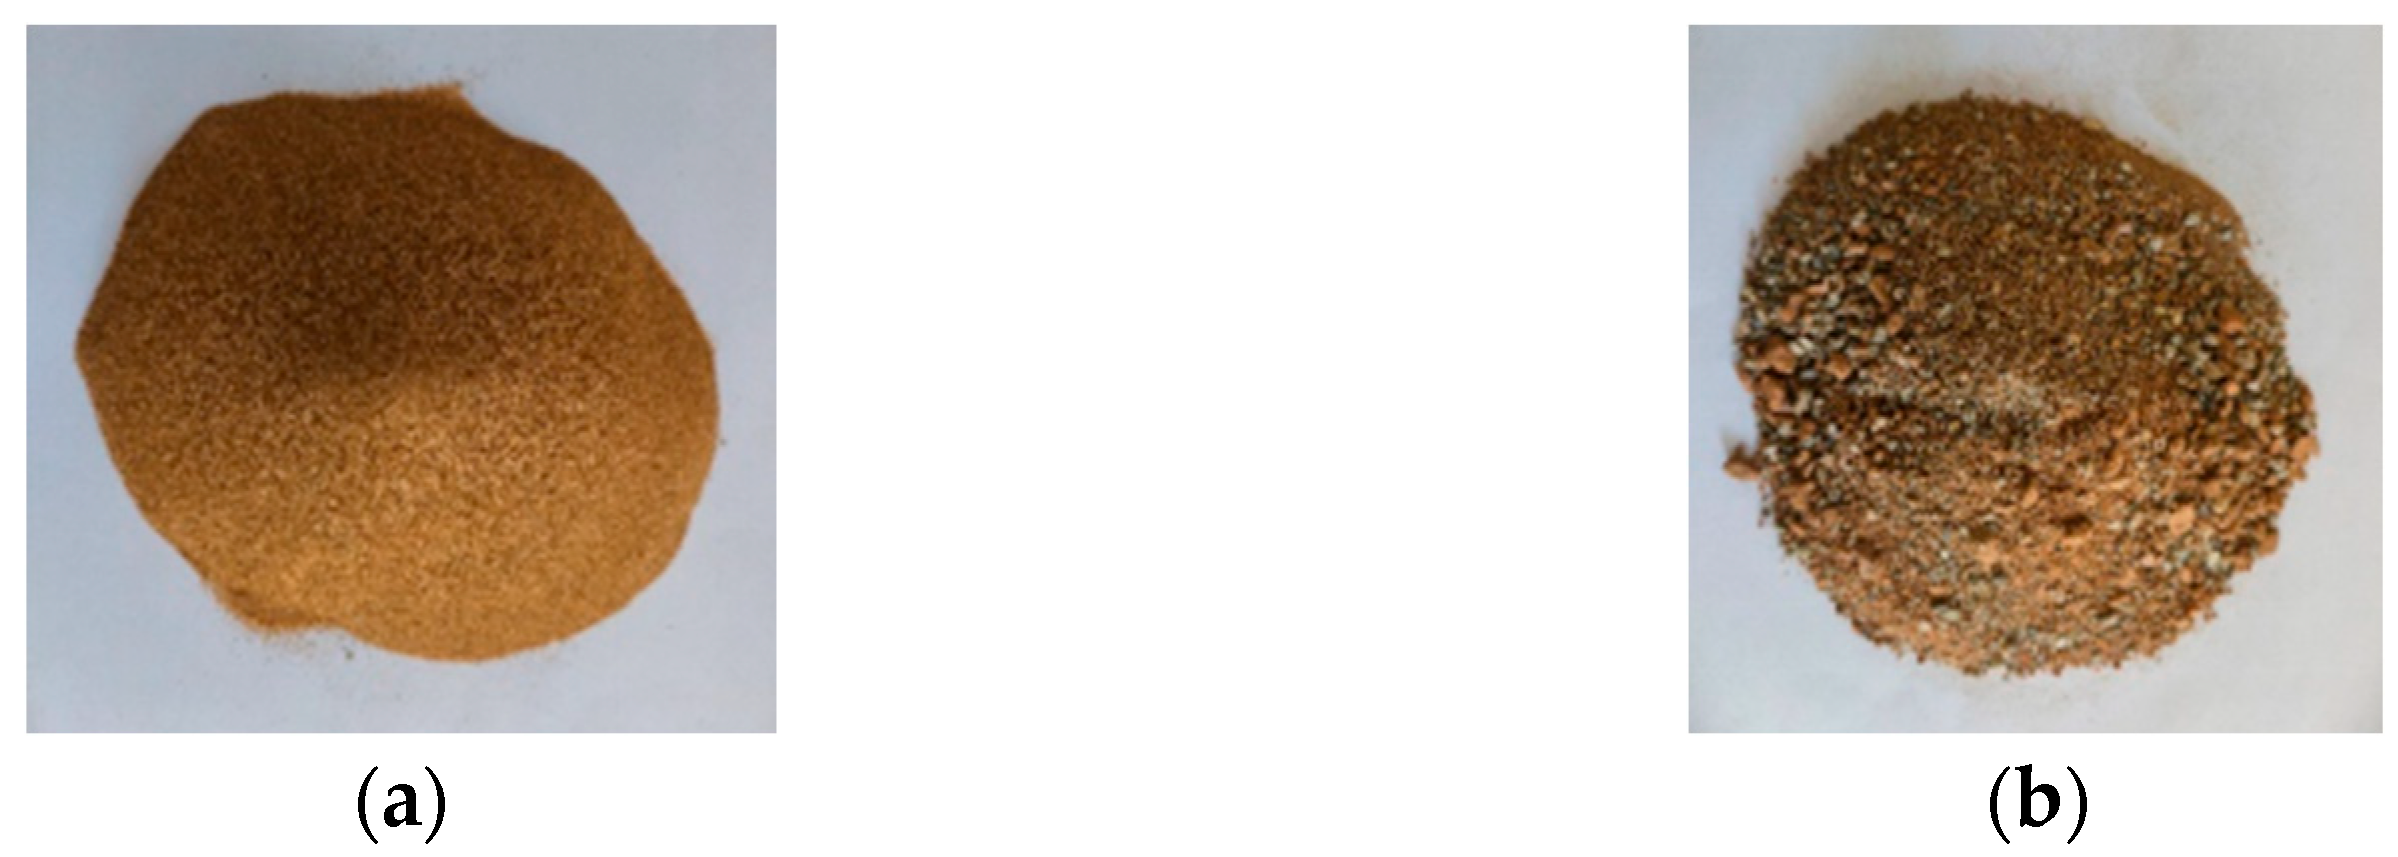
42.5R ordinary Portland cement (Ningxia Guoda, Ningxia, China) was used. Grade I fly ash was supplied by Ningxia Thermal Power Plant, Ningxia, China. The coarse aggregate consisted of artificial crushed stone from Zhenbeibao, Ningxia, China. It was a two-graded blend of 5–10 mm and 10–20 mm fractions at a mass ratio of 7:3. The fine aggregate was artificially washed river sand produced in Zhenbeibao. Desert sand was collected from the Maowusu Sandy Land in Yanchi County, Ningxia, China. Its appearance is illustrated in Figure 1. The physical properties of the fine aggregates are summarized in Table 1. A polycarboxylate-based high-performance superplasticizer produced by Suzhou Xingbang Chemical Building Materials Co., Ltd., Jiangsu, China., was adopted. Local tap water served as mixing water.
Figure 1.
Appearance of fine aggregates: (a) desert sand; (b) river sand.
Table 1.
Physical properties of fine aggregates.
2.2. Mix Ratio Design and Specimen Preparation
The concrete mix design conformed to the Chinese code JGJ 55–2011 [23]. C30-grade concrete specimens were prepared under five DSRR conditions: 0%, 25%, 50%, 75%, and 100%. Nine standard cubic specimens were cast for each condition. The mix proportions are presented in Table 2.
Table 2.
Specific mix ratio of concrete produced with desert sand.
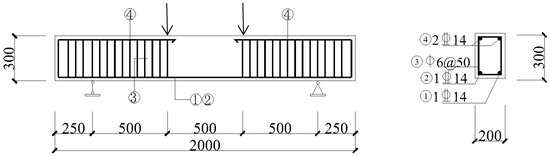
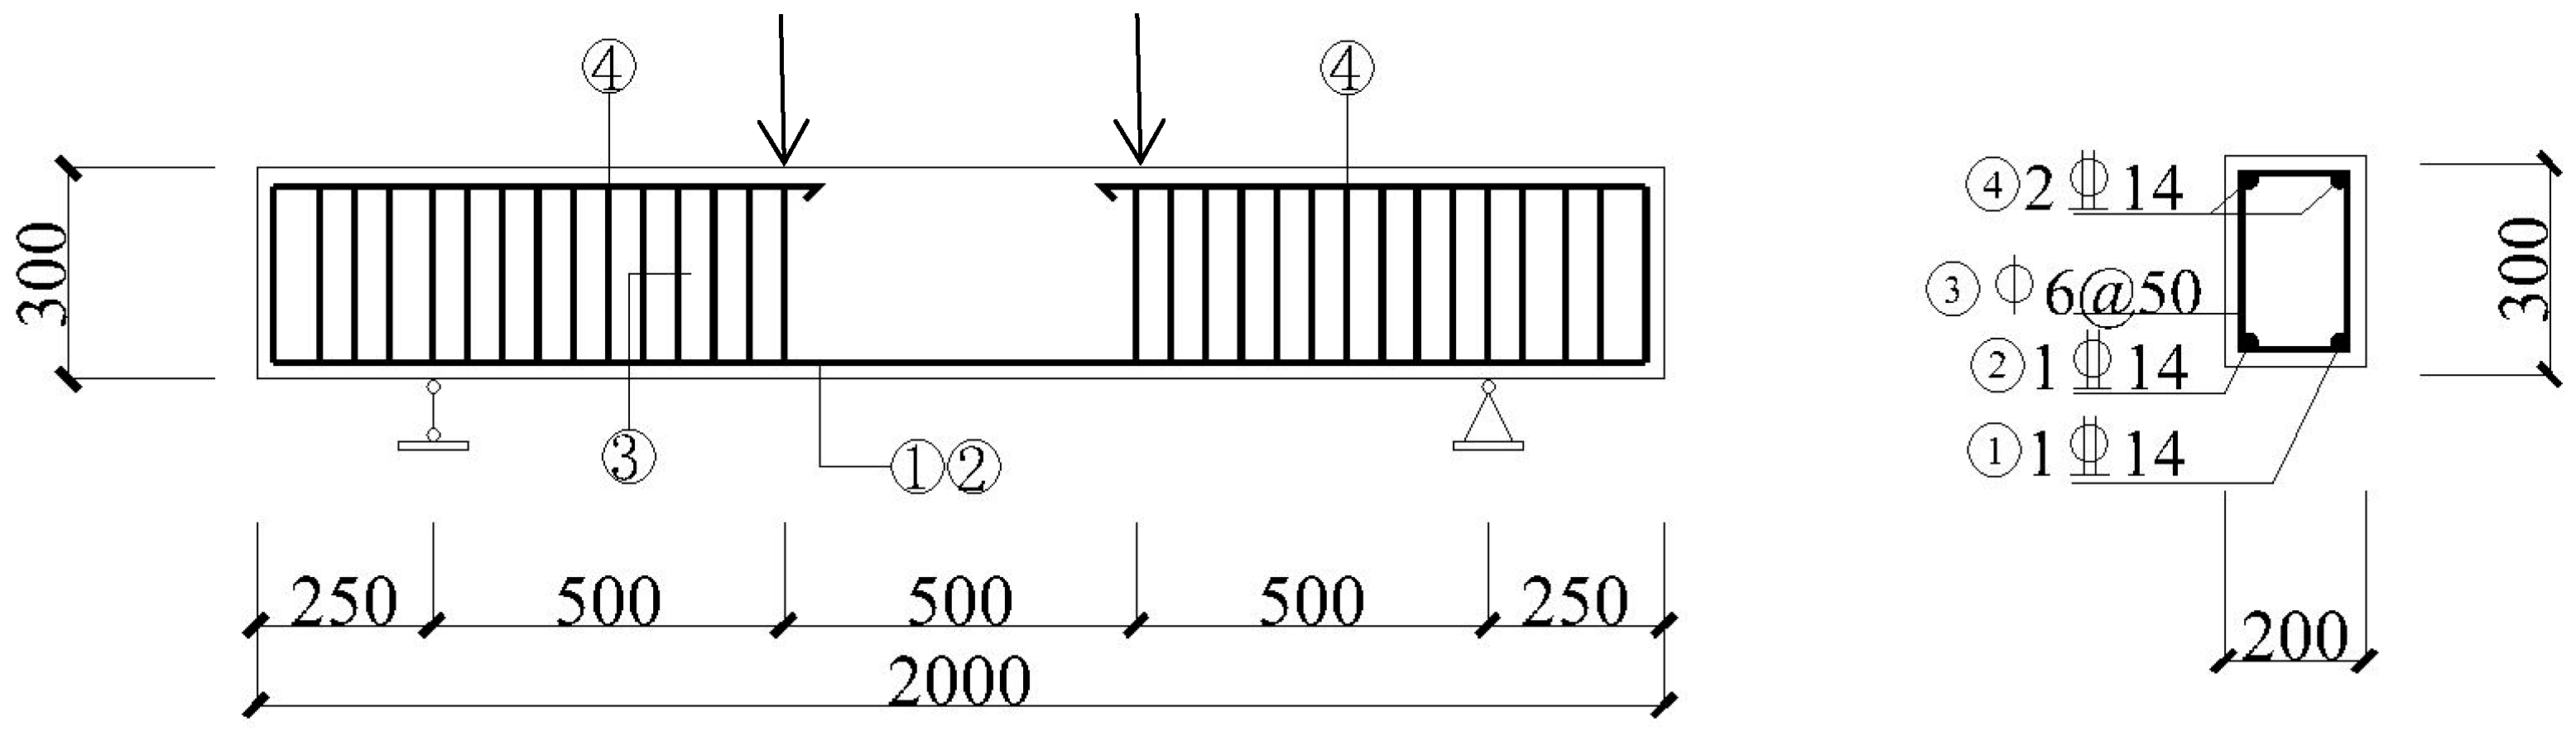
Beam specimens were fabricated using desert sand concrete (DSC). The beam parameters are presented in Table 3. The longitudinal tensile reinforcement consisted of HRB400 steel bars (Yongfeng Decoration Co., Ltd., Ningxia, China) with a diameter of 14 mm. Additional erection reinforcement also used HRB400 steel bars with a diameter of 14 mm. These bars were terminated at the central pure-bending region. The stirrups were HPB300 steel bars (Yongfeng Decoration Co., Ltd., Ningxia, China) with a diameter of 6 mm. They were spaced at 50 mm. No stirrups were arranged within the pure bending region. The properties of longitudinal reinforcement and stirrups were obtained by a tensile test, as shown in Table 4.
Table 3.
Beam specimen parameters.
Table 4.
Properties of longitudinal reinforcement and stirrups.
The concrete-cover thickness was 25 mm. All beams were simply supported. Their dimensions and reinforcement details are presented in Figure 2.
Figure 2.
Detailed dimensions and reinforcement diagram of the beam specimen. Note: ➀–➃ indicates the reinforcement number; ↓ denotes the loading point; 2 14 denotes two HRB400 with a diameter of 14;
 6@200 refers to HPB300 with a diameter of 6 mm and a spacing of 200.
14 denotes two HRB400 with a diameter of 14; 6@200 refers to HPB300 with a diameter of 6 mm and a spacing of 200.
2.3. Test Setup and Instrumentation
The cubic compressive strength (CCS) of concrete with different DSRRs was determined in accordance with GB/T 50081-2019 [24] at curing ages of 14 and 28 days.
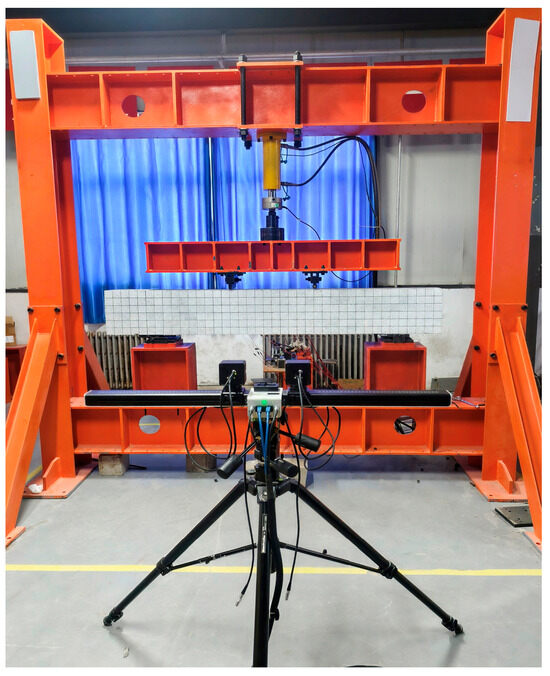
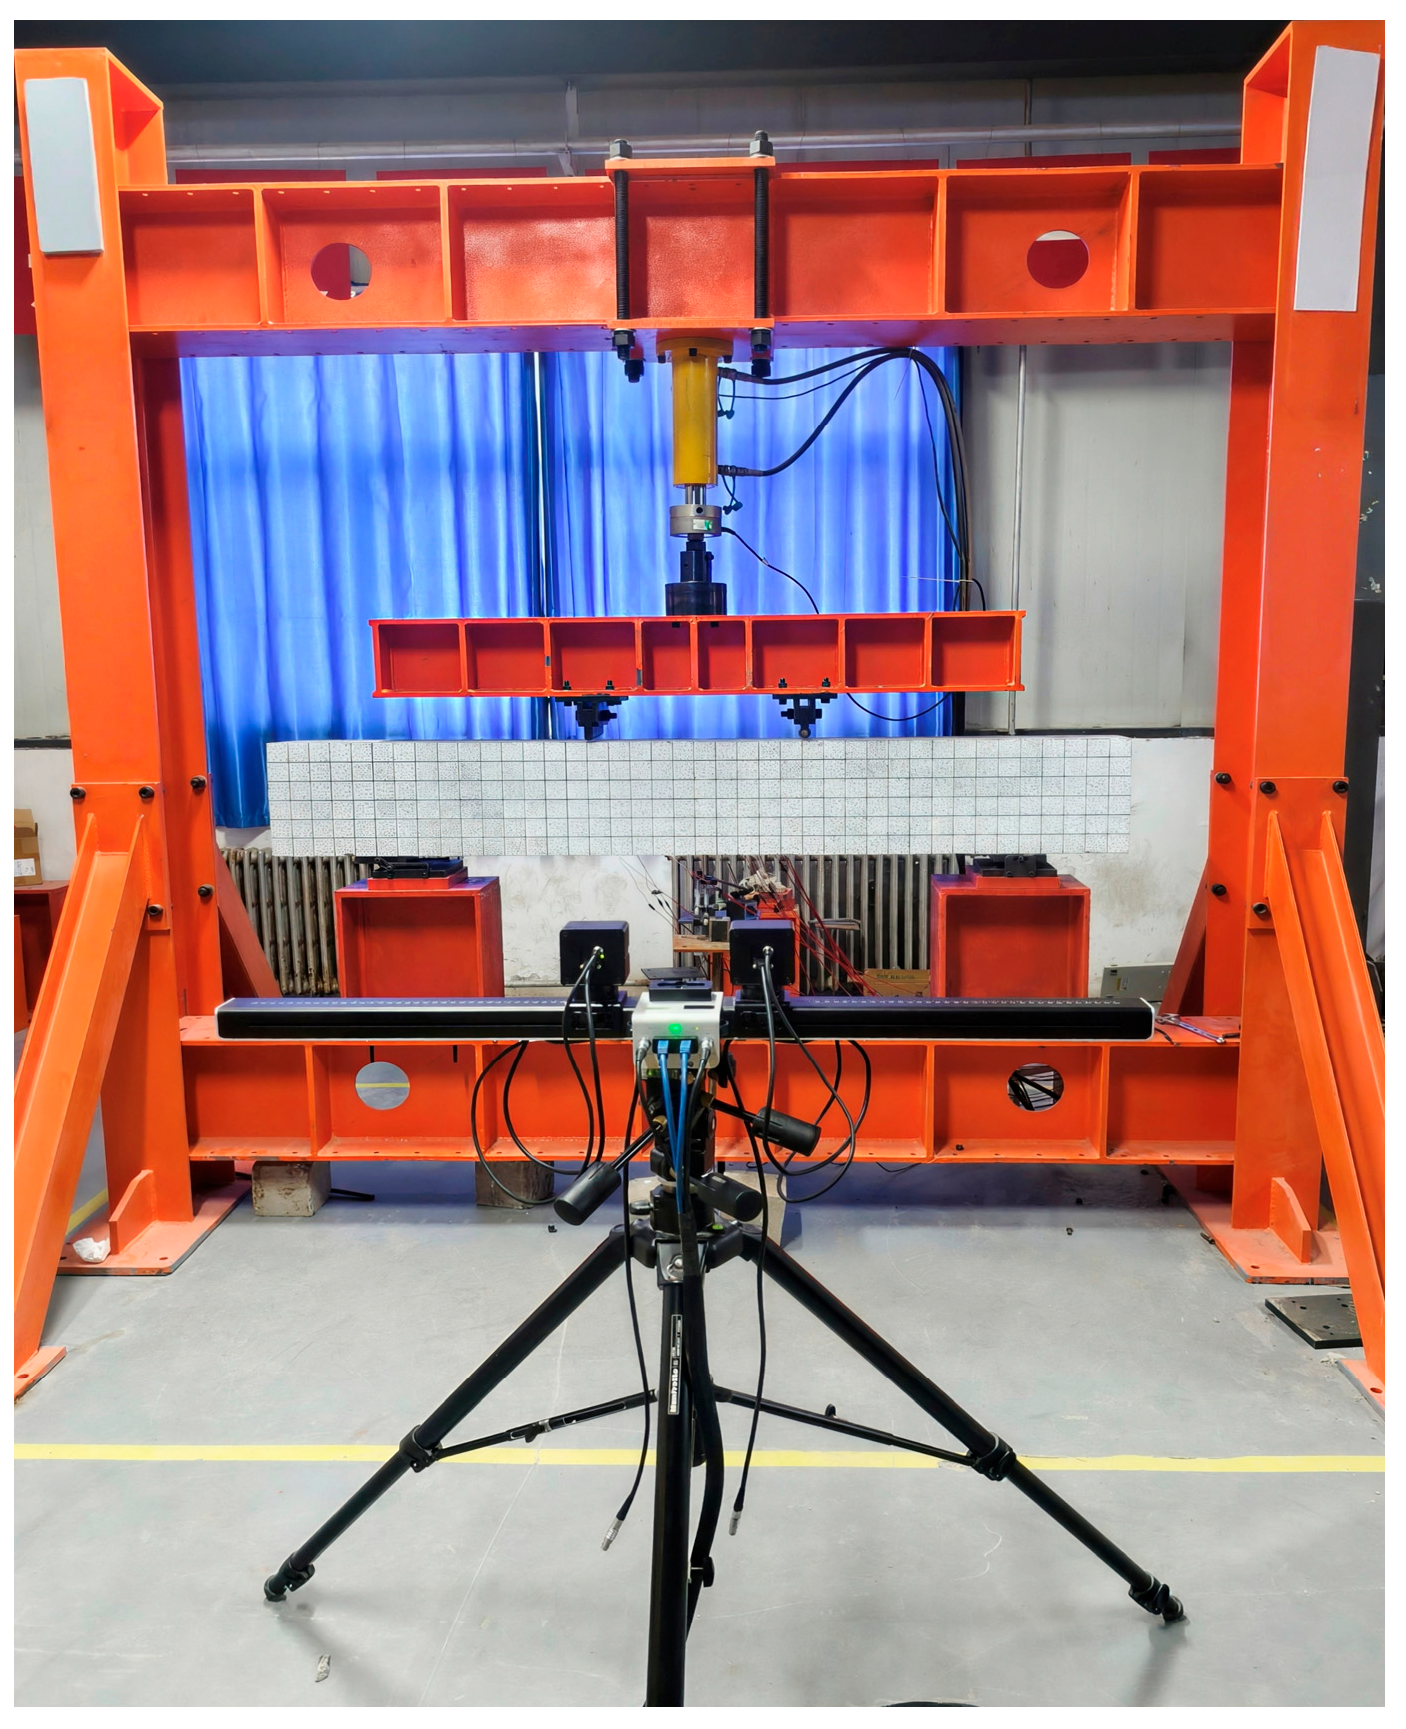
Four-point bending tests were performed using a 200 kN electro-hydraulic servo loading system (Jinan Hengle Xingke Intrusment Co., Ltd., Shandong, China) [25]. A hybrid control loading mode was employed: load control initially, followed by displacement control. Switching to displacement control was implemented when any of the following criteria were met: the applied load reached 90 kN (estimated yield load = 102.08 kN) [26]; reinforcement strain reached 2000 με; or a distinct inflection point appeared in the load–displacement curve of the loading device [27,28,29,30]. The test termination criteria were defined as follows. A specimen was considered to have failed when the load–displacement curve exhibited a sudden drop or when the midspan deflection reached 30 mm (L0/50, where L0 is the length of the span). Loading was then stopped, and the specimen was fully unloaded [25].
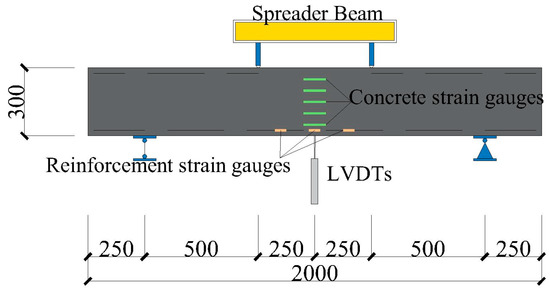
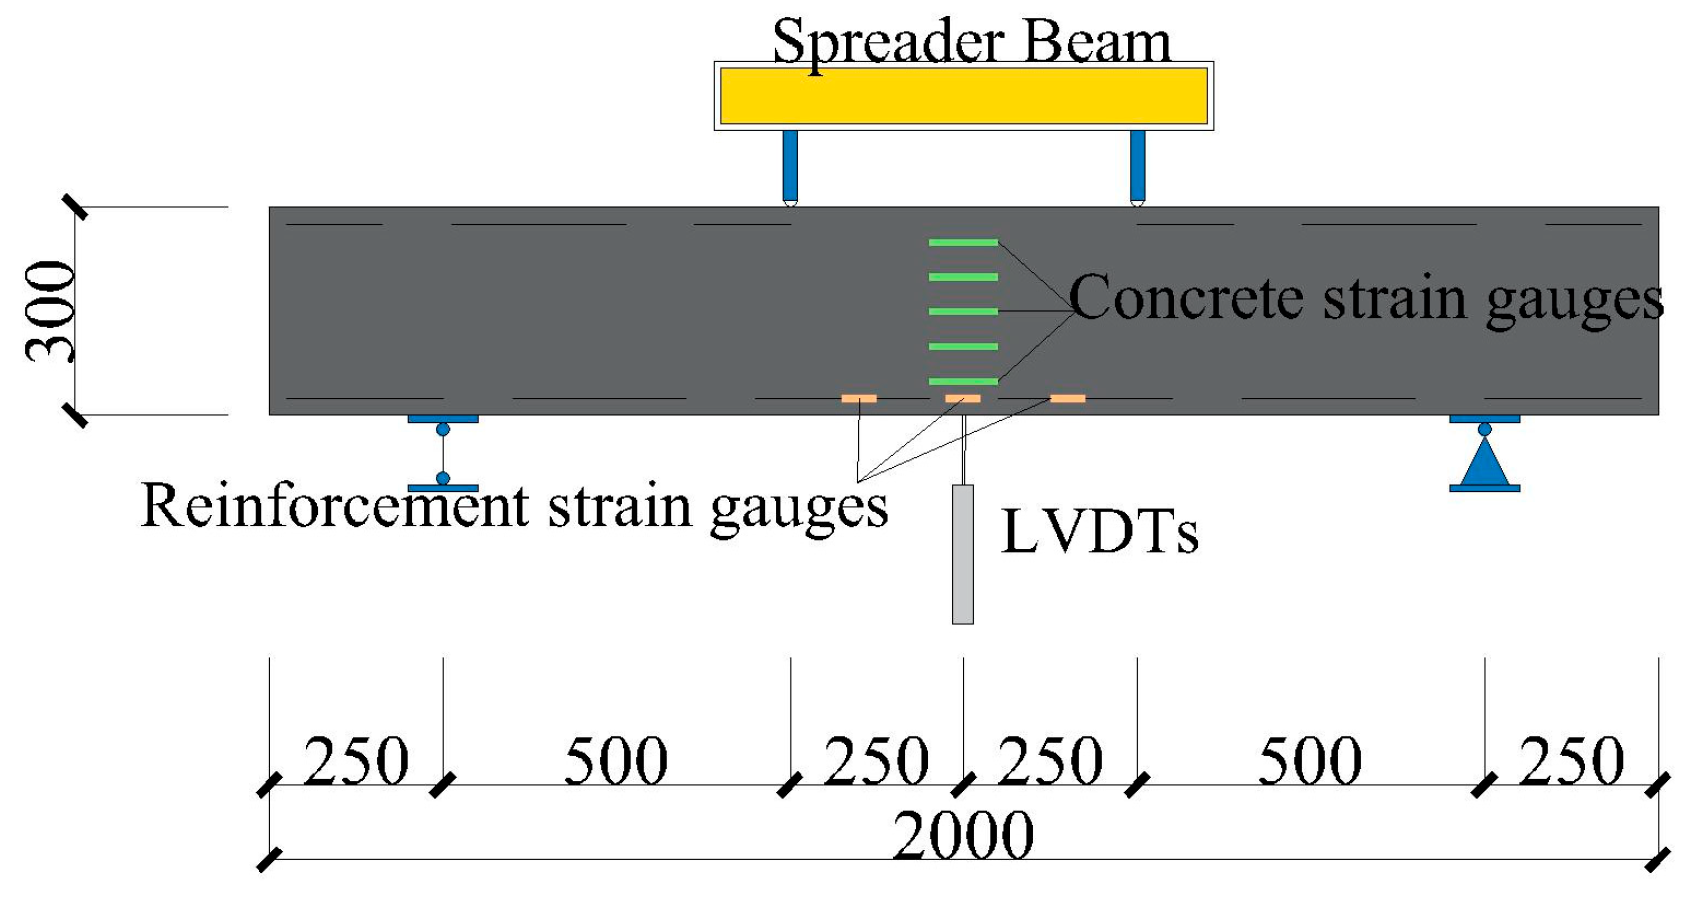
DIC and traditional displacement gauges were used for data acquisition. DIC monitored full-field surface strain, crack development and midspan deflection throughout the loading process. A high-definition camera (Dajiang Innovation Technology Co., Guangdong, China) recorded visible specimen features at different loading stages. Real-time strain data were acquired with a DH3818Y static strain tester (Jiangsu Donghua Testing Technology Co., Ltd., Jiangsu, China). Five concrete strain gauges were mounted along the height of the midspan face, and six strain gauges were attached to the longitudinal tensile reinforcement in the pure bending region. Two displacement gauges were installed at the beam midspan to monitor deflection changes [31,32,33,34]. The characteristics of the employed strain gauges and LVDTs are shown in Table 5 and Table 6, respectively. The test setup and instrument layout are illustrated in Figure 3 and Figure 4, respectively.
Table 5.
The characteristics of strain gauges.
Table 6.
The characteristics of LVDTs.
Figure 3.
Test setup.
Figure 4.
Layout of test points.
3. Results and Analysis
3.1. Mechanical Properties of DSC
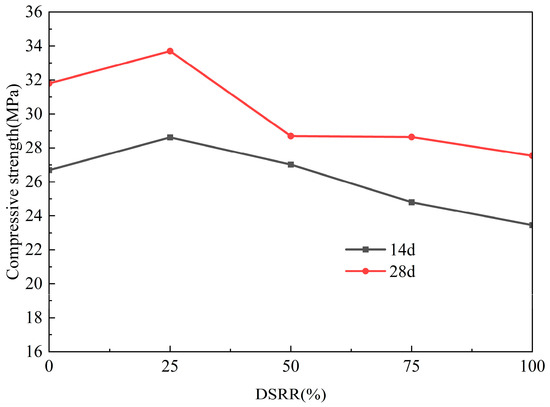
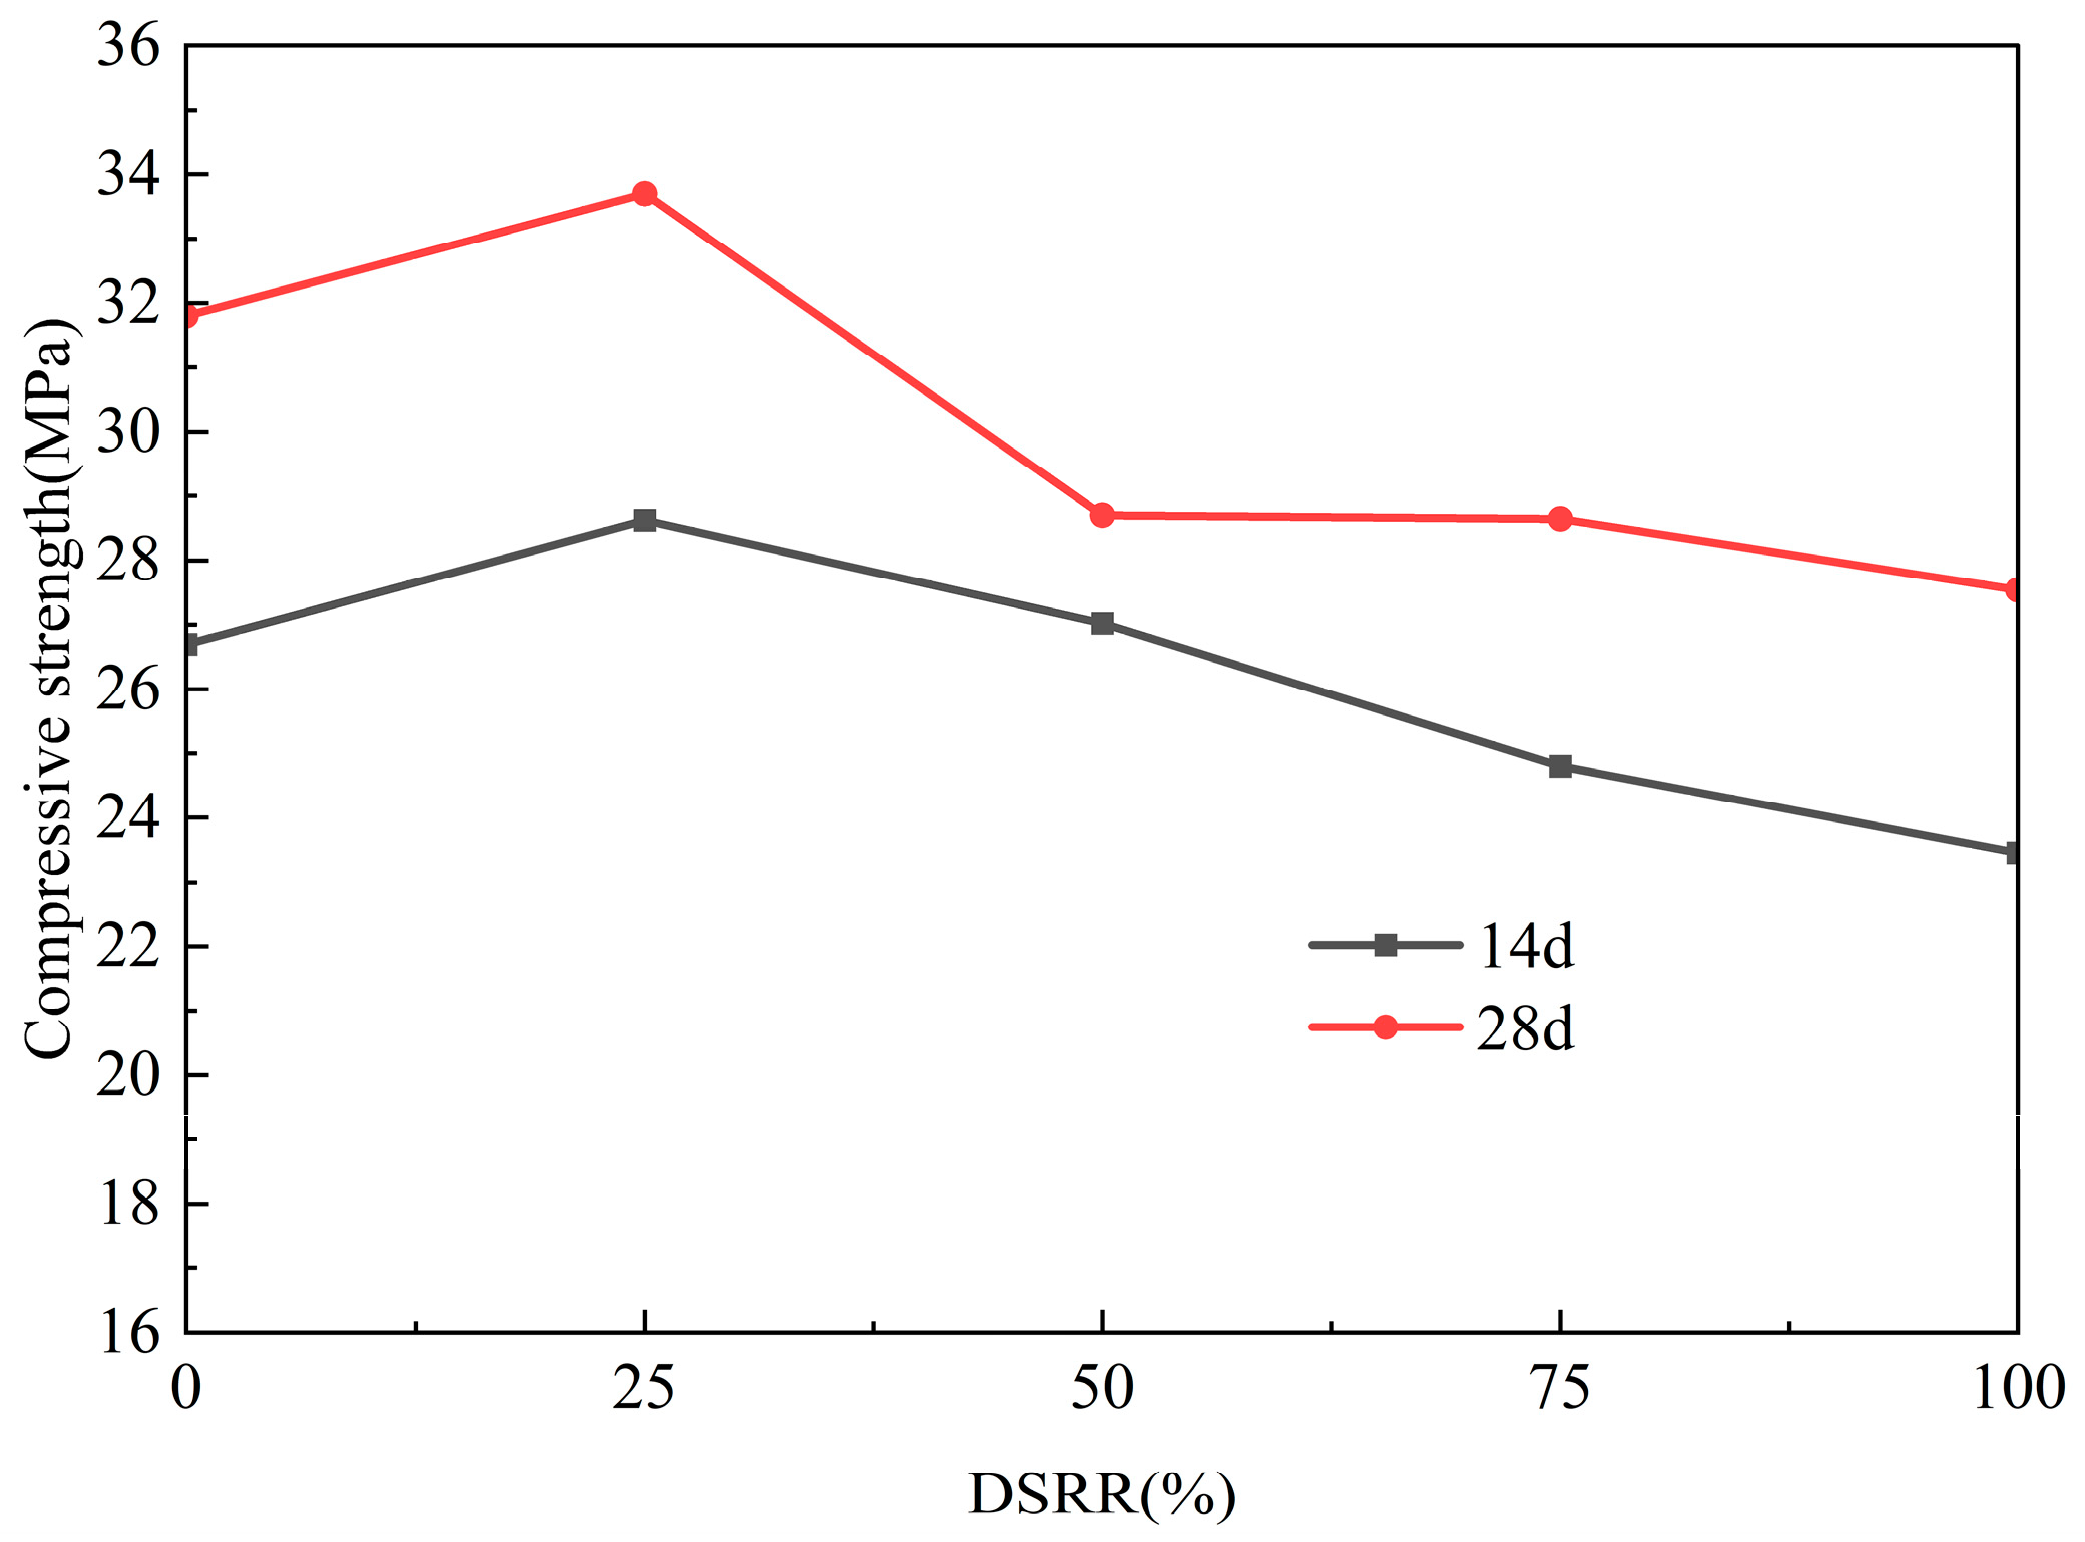
Figure 5 presents the 14- and 28-day CCSs of concrete specimens. The CCS of DSC first increased and then decreased with an increasing DSRR. CCS reached a maximum at 25% DSRR. This value was 6% higher than that of natural sand concrete (NSC). This improvement is attributed to improved aggregate gradation and the filling of aggregate voids by desert sand, which increases concrete compactness. When DSRR reached 50%, higher water demand and reduced interface bonding strength led to a decrease in CCS [35].
Figure 5.
The relationship between the cubic compressive strength of concrete and DSRR.
Figure 6 presents the compressive failure modes of the cubic specimens. The main penetrating cracks formed rapidly near the peak stress and propagated along the diagonal direction. The specimens exhibited an overall conical failure mode. The NSC specimen showed a concentrated crack pattern with a distinct main crack. The overall integrity was largely maintained, and only minor spalling was observed at the corners and edges. Increasing DSRR caused a marked rise in surface microcracking and a more distributed crack pattern. When DSRR reached 75% or greater, specimens exhibited local flake spalling and occasional detachment of large blocks. These damage modes indicated a substantial loss of specimen integrity.
Figure 6.
Concrete failure modes: (a) NSC; (b) DSC25; (c) DSC50; (d) DSC75; (e) DSC100.
3.2. Failure Modes of DSCBs
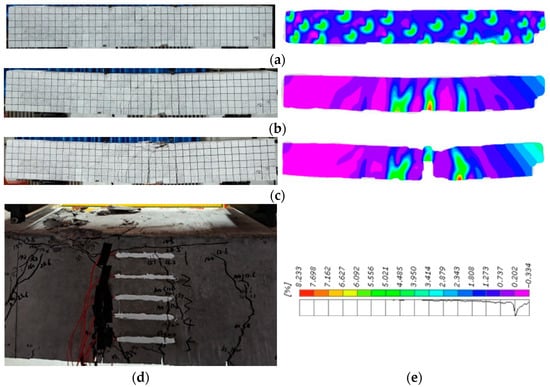
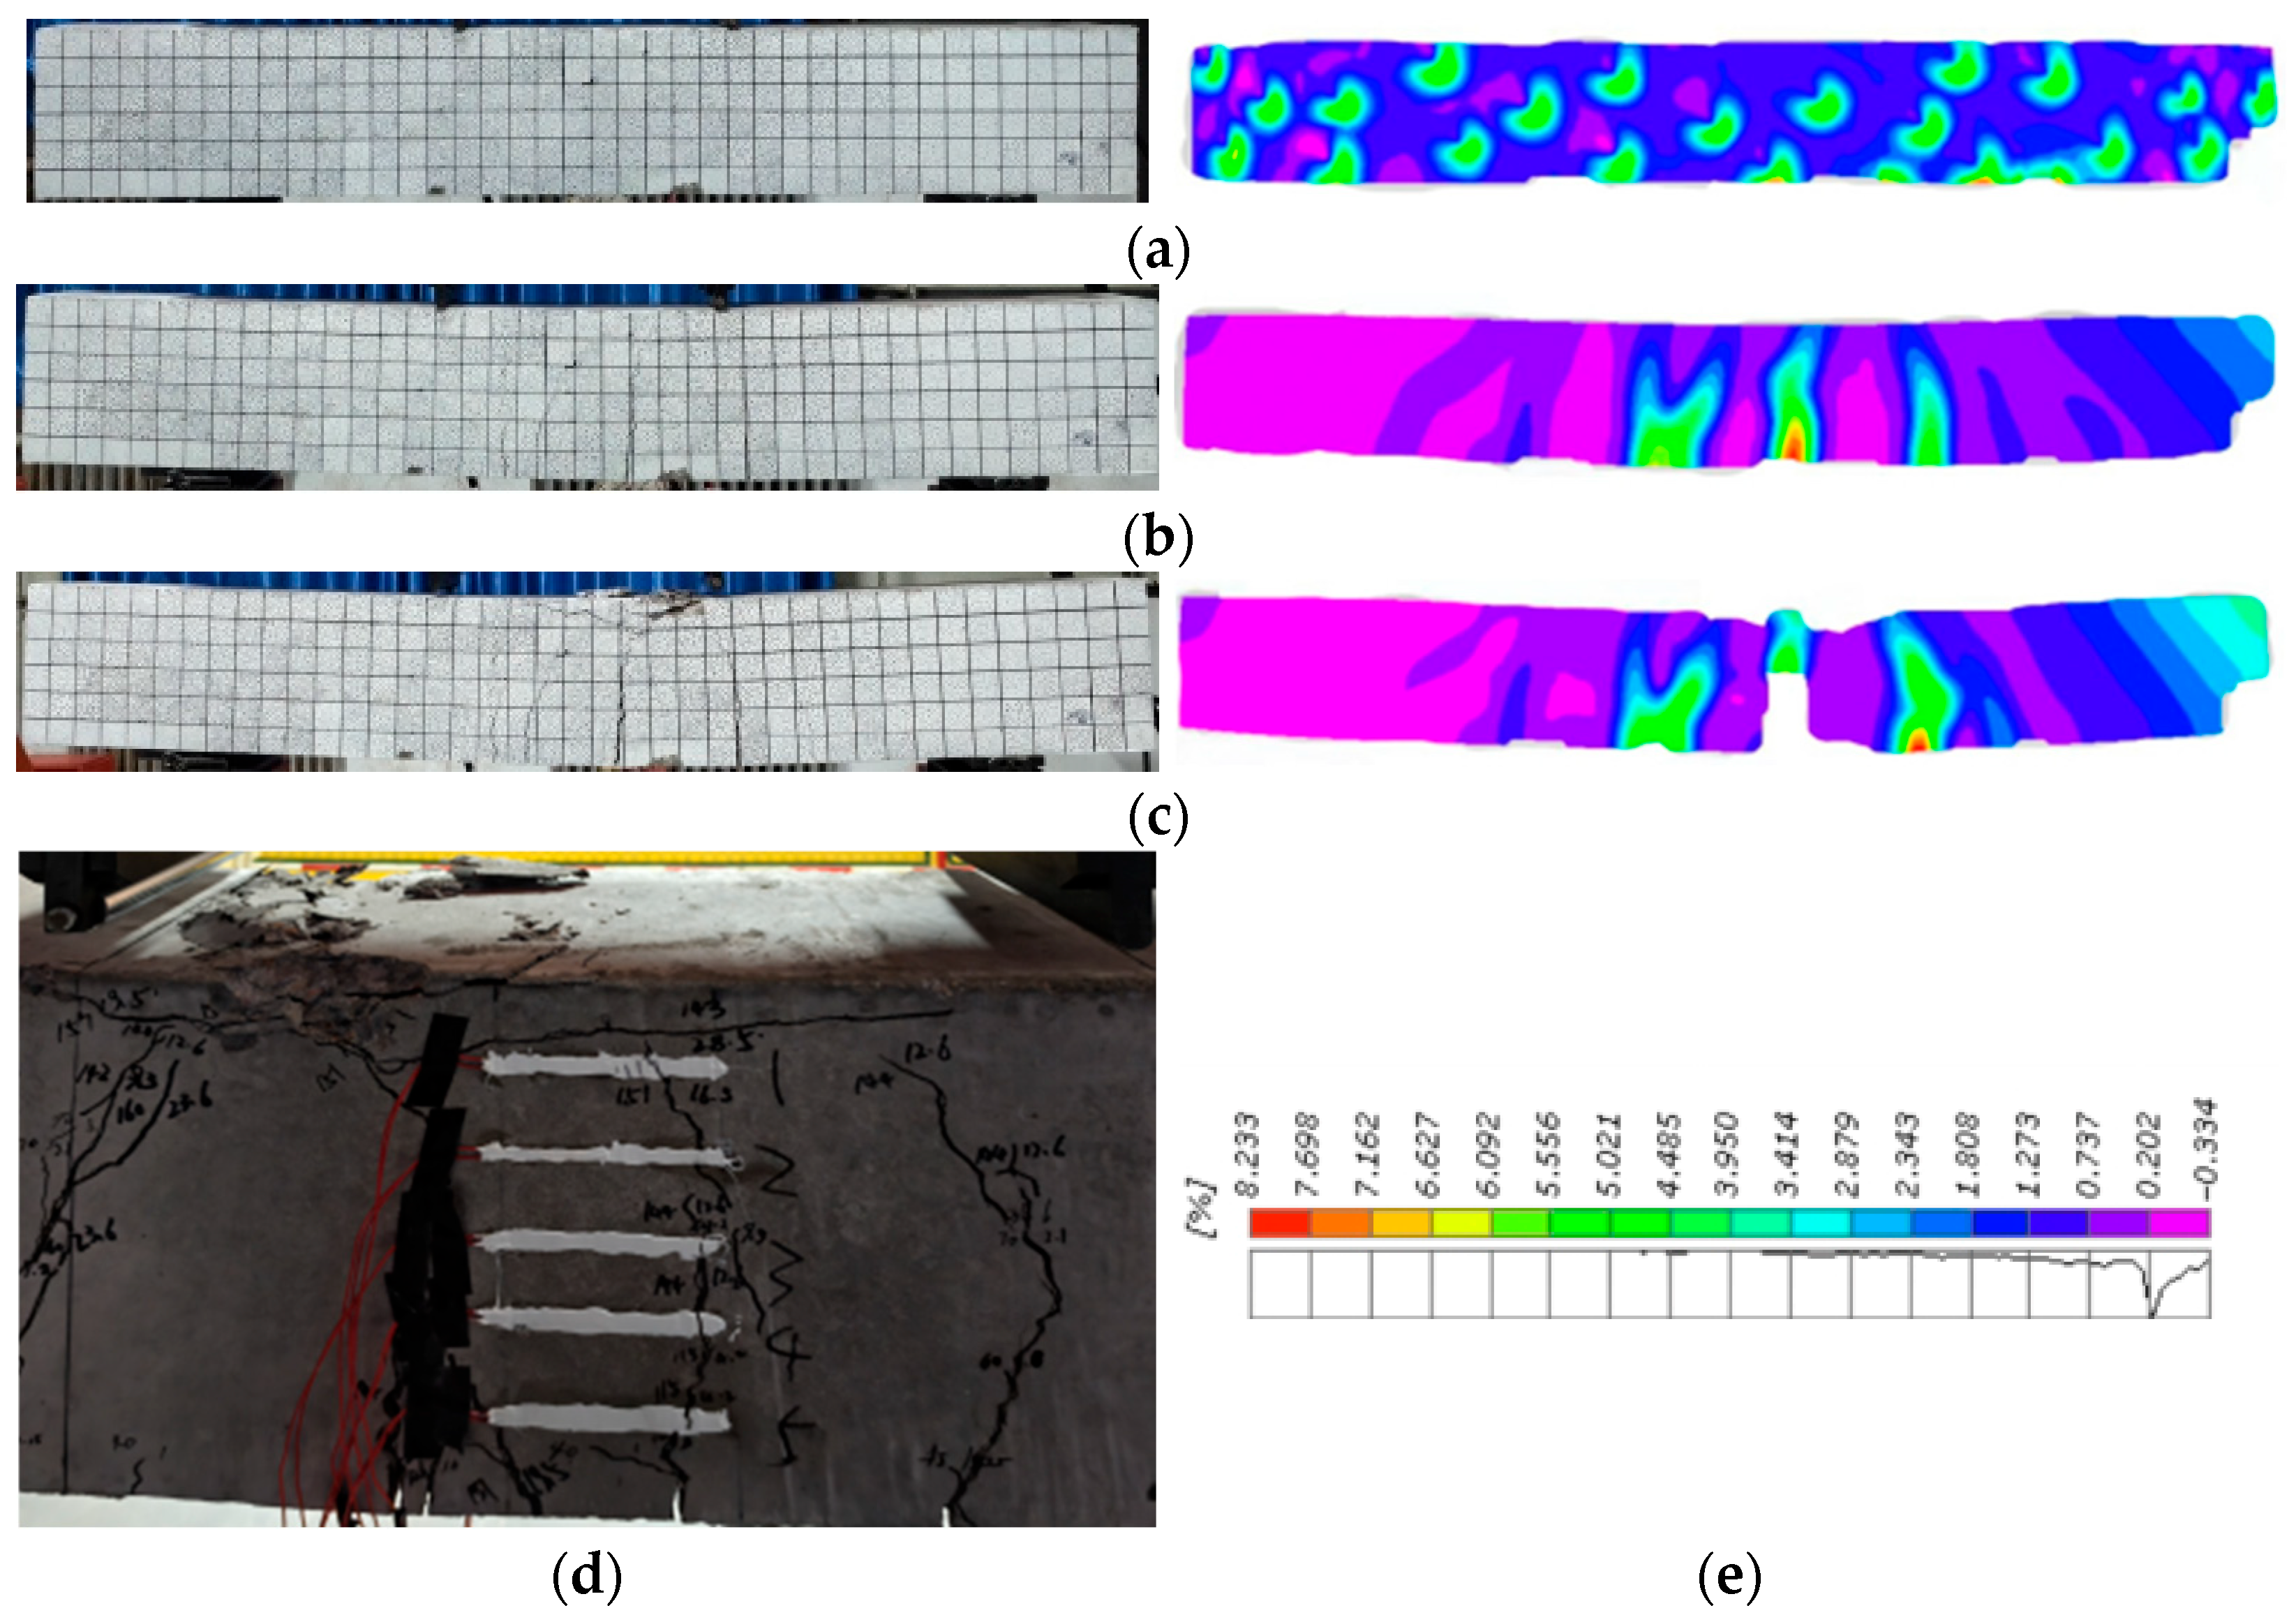
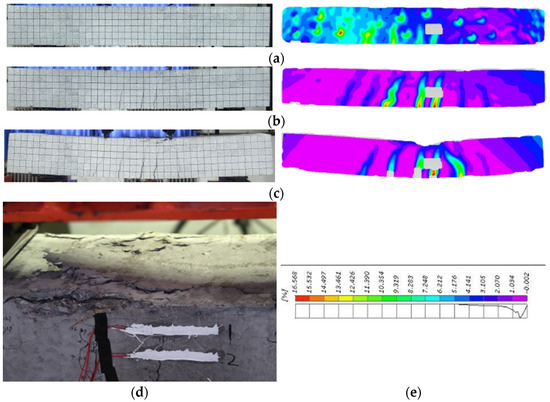
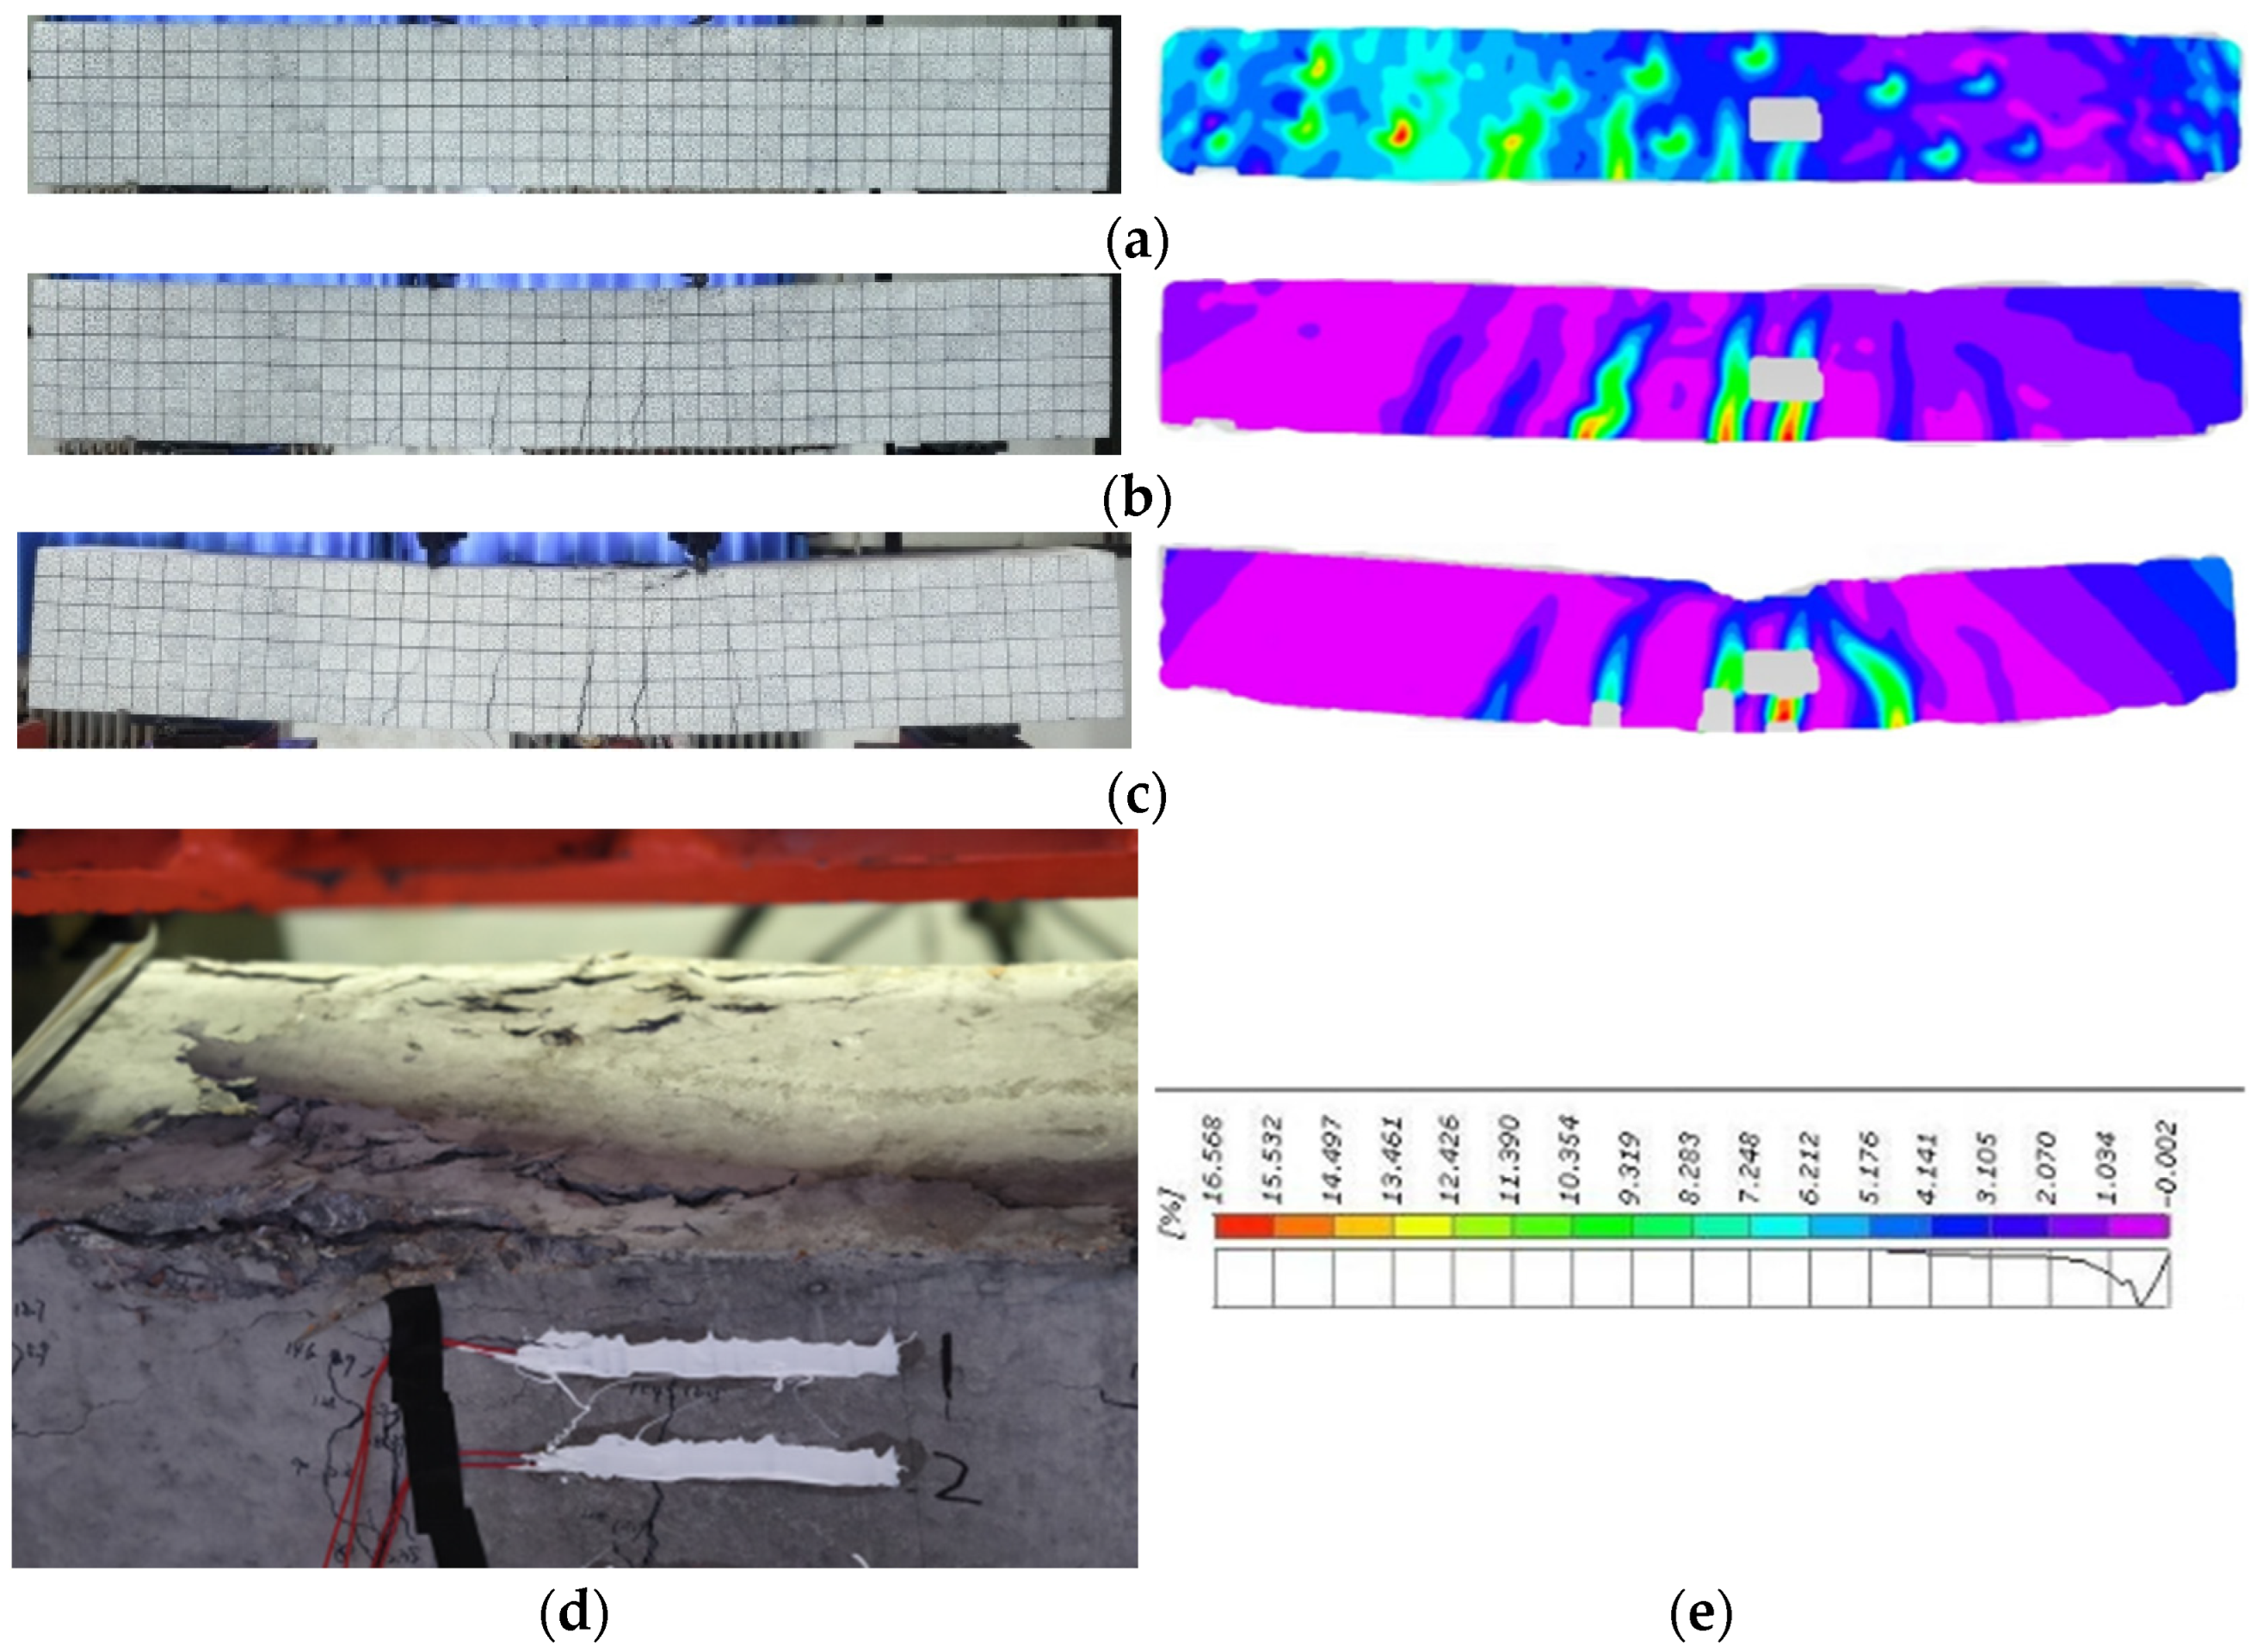
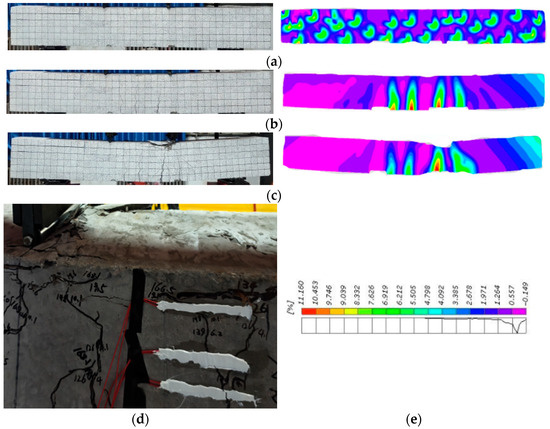
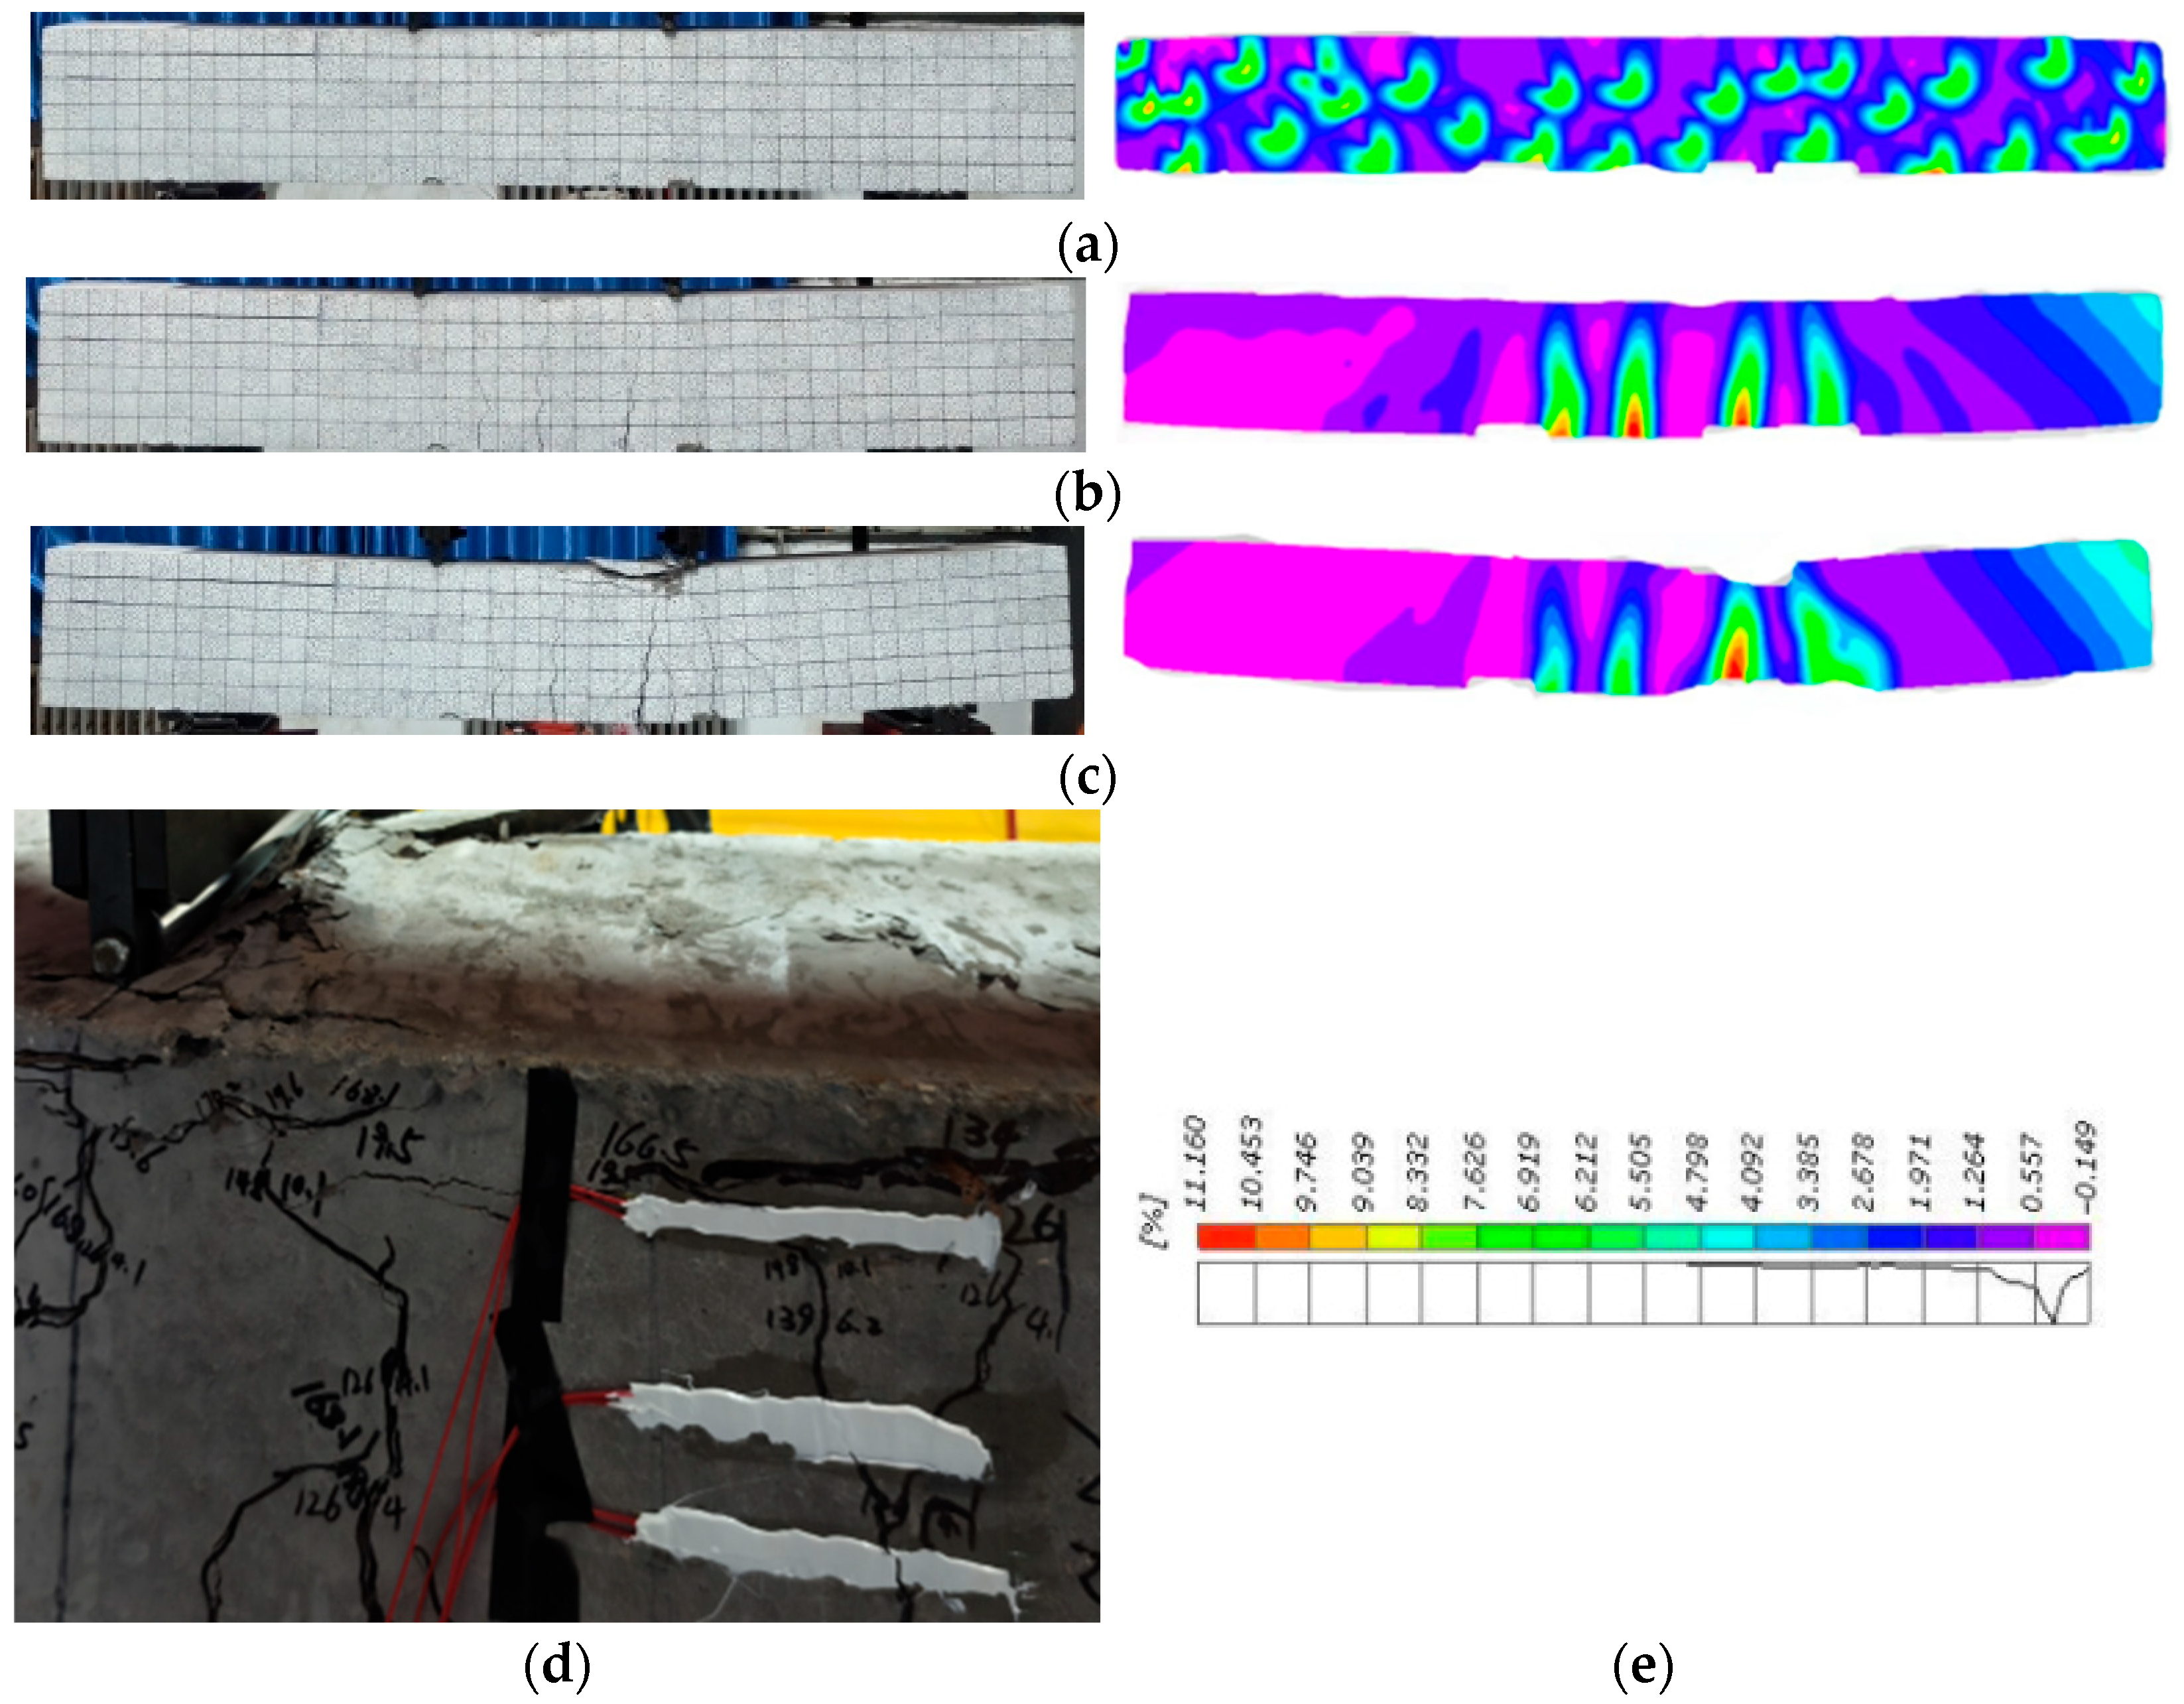
The failure process is shown in Figure 7, Figure 8 and Figure 9. All beams were suitably reinforced and underwent three stages: elastic, cracked (working), and failure. All specimens exhibited essentially consistent failure modes, but their mechanical properties varied across different stages. All specimens exhibited the linear elastic behavior in the elastic stage. Cross-sectional strain distribution conformed to the plane-section assumption [36]. No visible cracks appeared on the beam surfaces. In the cracked stage, vertical cracks first appeared at the midspan bottom of each beam. The cracks then increased and propagated upward along the section height. The concrete in the tension zone progressively ceased to carry tensile forces, which were sustained by the reinforcement, while compressive forces were borne by the concrete in the compression zone. These behaviors are typical of flexural cracking. Compared with NSCBs, DSCB25 specimens exhibited only minor increases in cracks. DSCB50 specimens exhibited more obvious crack development and more significant overall deformation. All specimens ultimately displayed flexural failure. The failure was characterized by crushing and spalling of concrete in the compression zone and by penetrating cracks in the tension zone. The failure mode of the DSCB25 specimen was comparable to that of the NSCB specimen. The crushed zone of DSCB50 was relatively concentrated, and spalling was severe. The main crack propagation in the tension zone was more significant. The specimen exhibited markedly reduced ductility. These observations indicated a predominantly brittle failure mode. In summary, the failure mode of DSCB25 was similar to that of NSCBs, indicating that an appropriate amount of desert sand effectively fills aggregate voids and improves the pore structure. In contrast, when the DSRR reached 50%, the smooth surface and poor angularity of the desert sand particles led to reduced interface bonding strength, increased internal weak interfaces, and intensified stress concentration, accelerating crack propagation. These factors resulted in reduced plastic deformation capacity and increased brittleness of DSCB50.
Figure 7.
Failure characteristics of the NSCB specimen: (a) elastic stage; (b) cracked working stage; (c) failure stage; (d) failure diagram of the compression zone after failure; (e) color chart of major horizontal strains.
Figure 8.
Failure characteristics of the DSCB25 specimen: (a) elastic stage; (b) cracked working stage; (c) failure stage; (d) failure diagram of the compression zone after failure; (e) color chart of major horizontal strains.
Figure 9.
Failure characteristics of the DSCB50 specimen: (a) elastic stage; (b) cracked working stage; (c) failure stage; (d) failure diagram of the compression zone after failure; (e) color chart of major horizontal strains.
3.3. Load–Deflection Curves of DSCBs
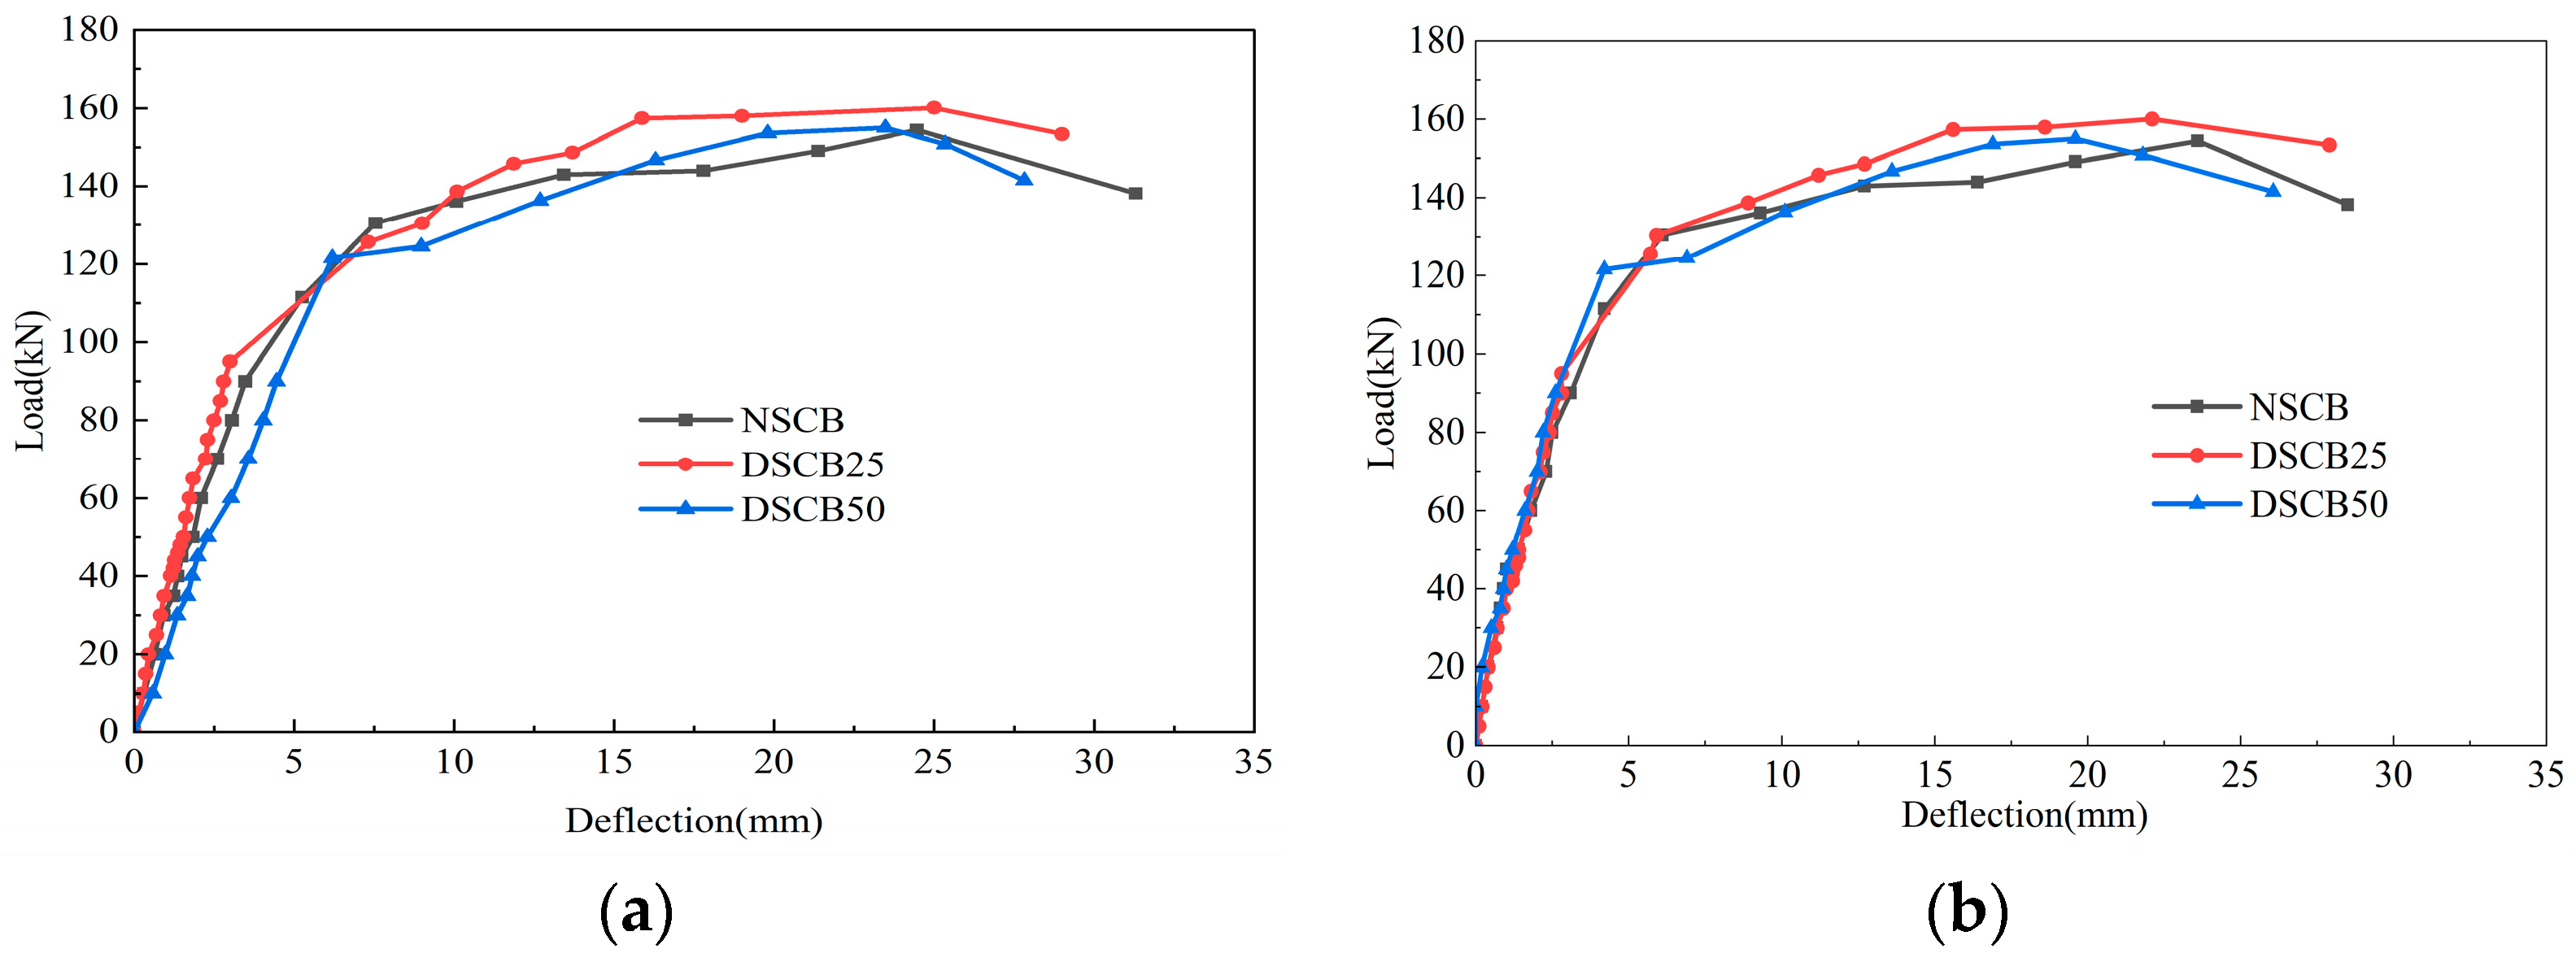
Figure 10 presents the load–deflection curves at the midspan of the beam specimens. In the elastic stage, the curve of the DSCB25 specimen nearly coincided with that of the NSCB specimen and exhibited a linear distribution. This result indicates comparable initial stiffness between the DSCB25 and NSCB specimens, while the DSCB50 specimen exhibited lower initial stiffness. It indicates that an appropriate amount of desert sand effectively filled aggregate voids and improved the pore structure, enhanced compactness, and resulted in initial stiffness comparable to that of NSCBs. In contrast, when the DSRR reached 50%, the excessive amount of desert sand led to deterioration of the interfacial transition zone bonding performance and an increase in micro-defects, thereby reducing the initial stiffness. In the cracked stage, the curve of the DSCB25 specimen was basically consistent with that of NSCBs. The DSCB50 specimen exhibited a markedly faster deflection increase than the NSCB specimen. This observation indicated more pronounced stiffness degradation. In the failure stage, the ultimate load-bearing capacities of the NSCB, DSCB25, and DSCB50 specimens were 158 kN, 162 kN, and 157 kN, respectively. The ultimate load-bearing capacity of the DSCB25 specimen was 2.5% higher than that of the NSCB specimen. The mechanism is the same as that for the increase in CCS of DSC25. Midspan deflections measured using displacement gauges and DIC showed consistent variations. Specifically, the deflections of the NSCB, DSCB25, and DSCB50 specimens measured by DIC were 31.3 mm, 29.0 mm, and 27.8 mm, respectively. Corresponding readings from displacement gauges were 28.5 mm, 27.9 mm, and 26.0 mm, respectively. Increasing DSRR reduced the midspan deflection of the specimens at failure and decreased the overall deformation capacity. The descending segment of the load–deflection curves was gentle for the NSCB and the DSCB25 specimens. This indicated substantial post-peak deformation and favorable ductility. In contrast, the DSCB50 specimen showed a short, steep descending segment. This observation reflected markedly reduced ductility and a more brittle failure mode. Overall, the stiffness degradation of the DSCB25 specimen was basically consistent with that of the NSCB specimen. Due to the effective filling of aggregate gaps by the appropriate incorporation of desert sand, the micro-compaction effect enhanced the material uniformity and delayed the initiation of microcracks. However, when the DSRR reached 50%, the interfacial transition zone was weakened, leading to significant stiffness degradation of the DSCB50 specimen.
Figure 10.
Load–deflection curves of beam specimens: (a) DIC technology; (b) displacement gauges.
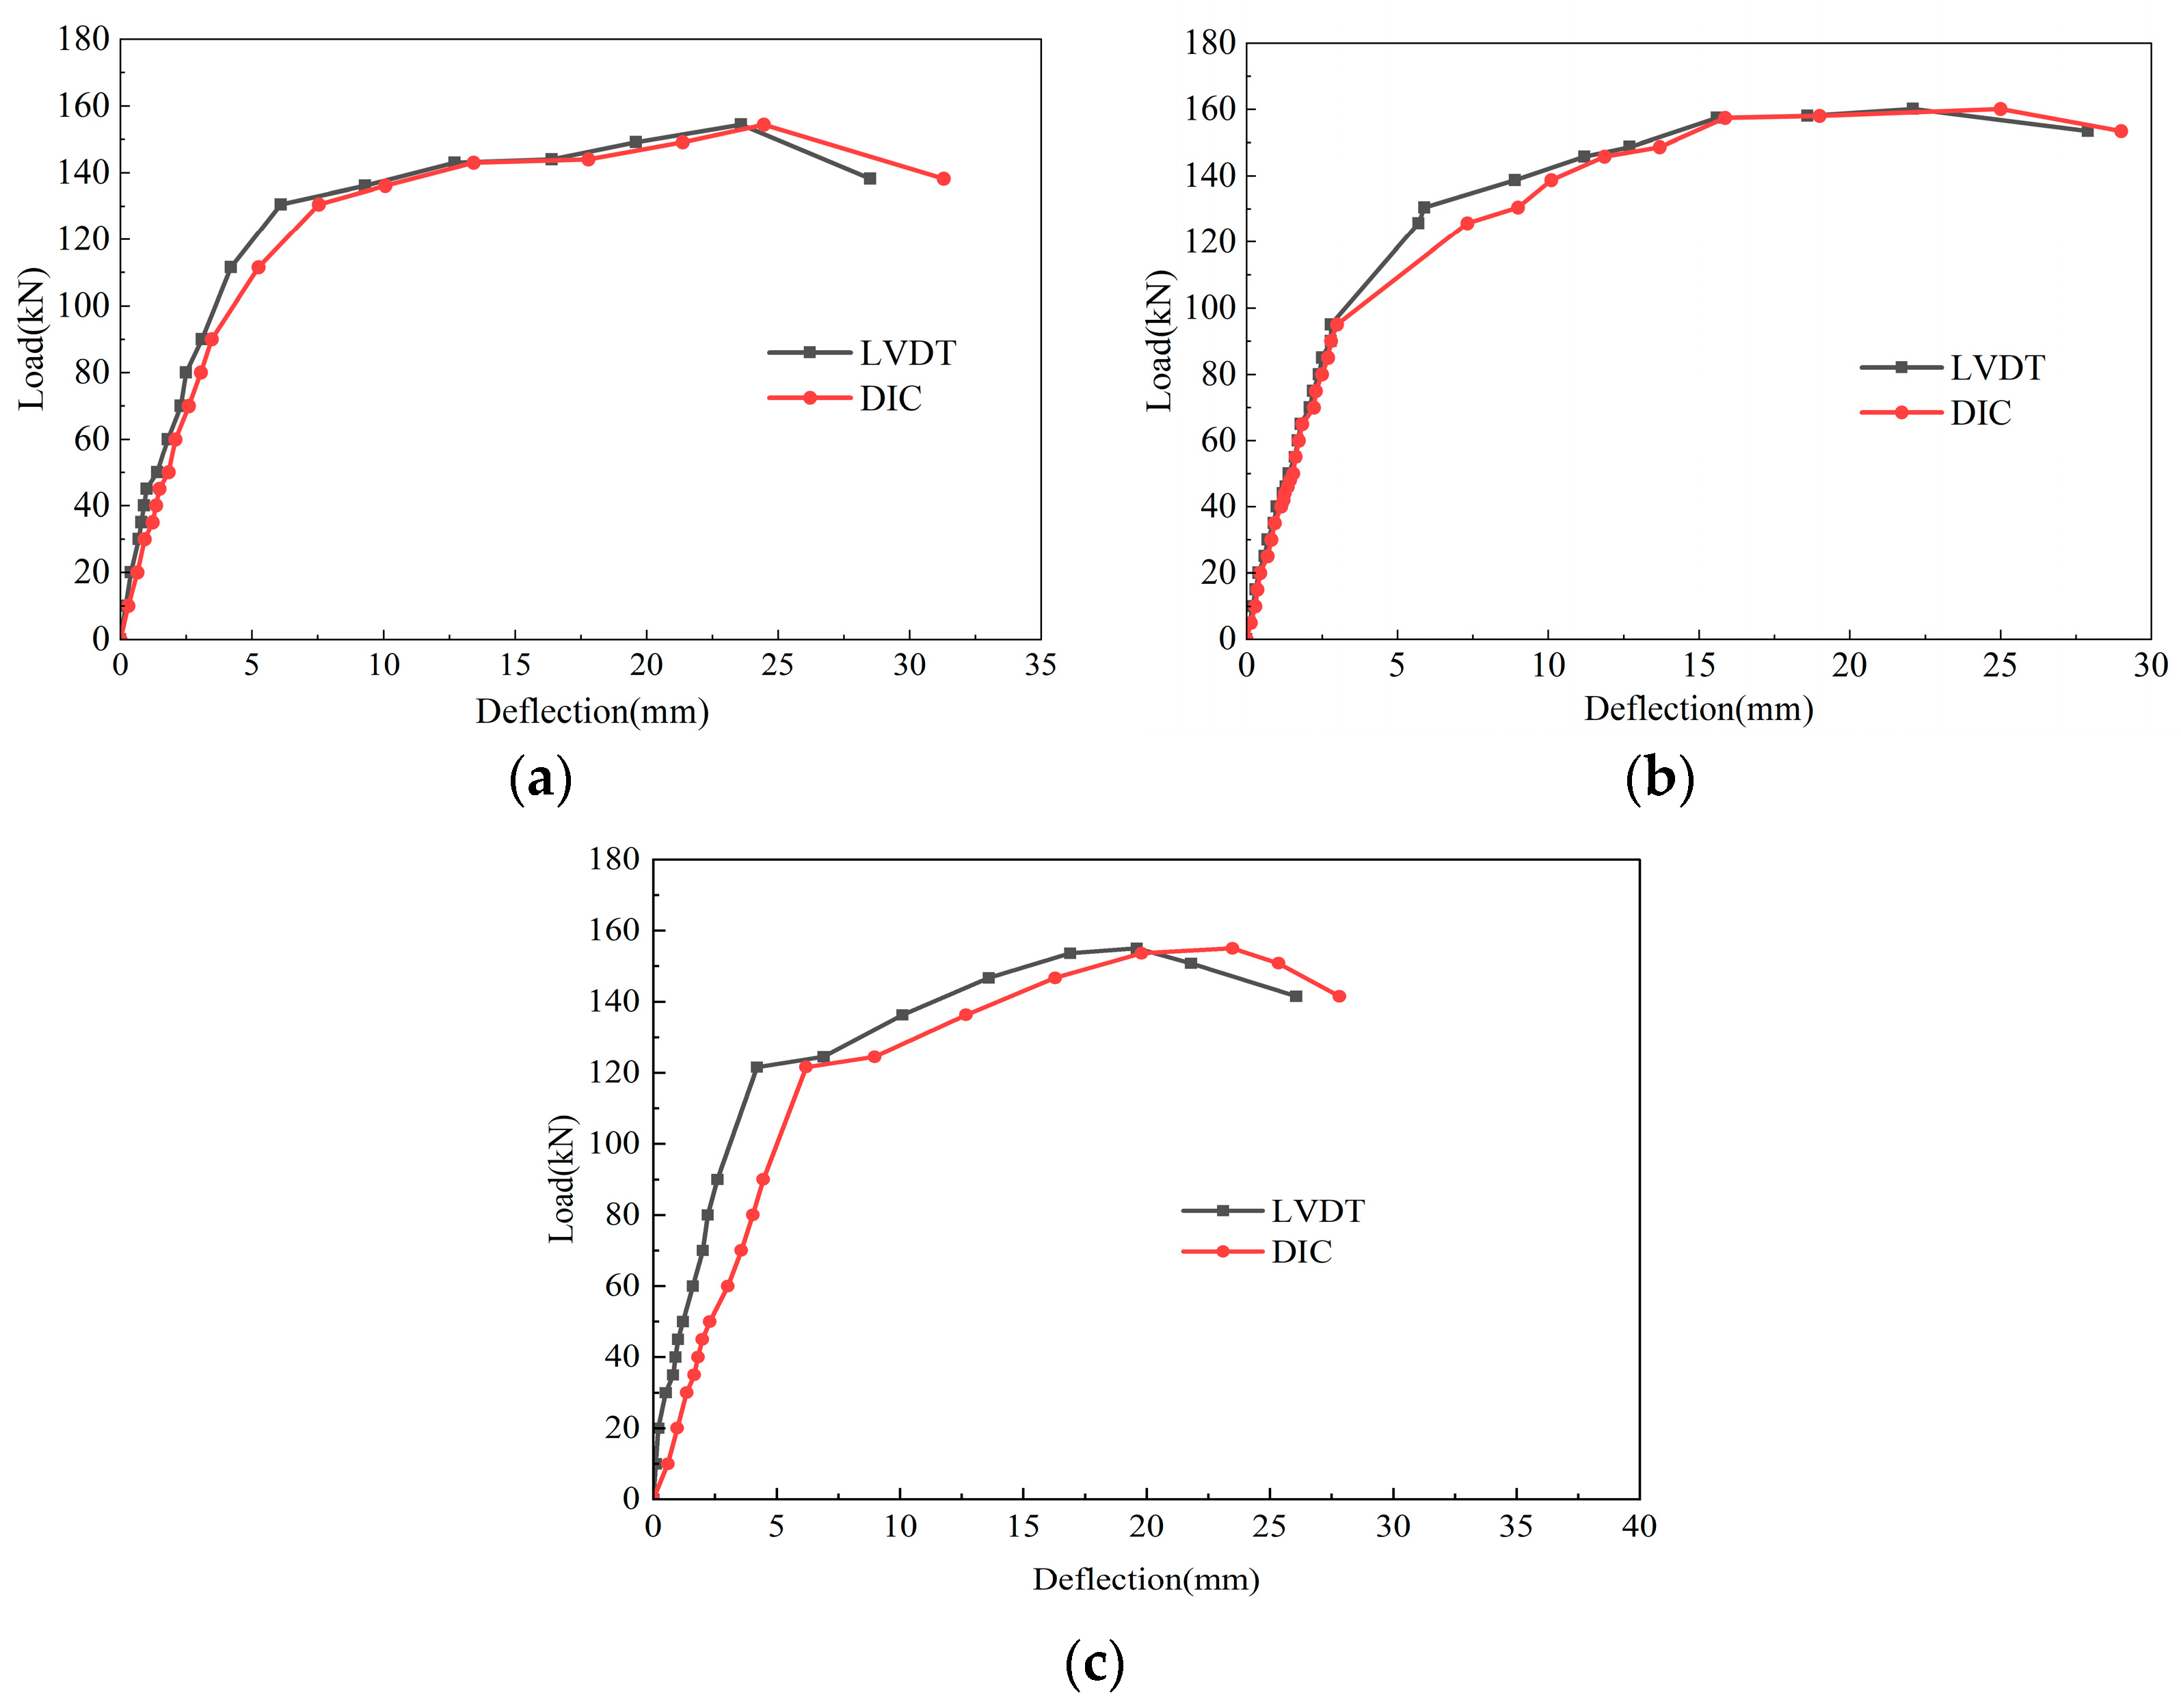
Figure 11 compares midspan load–deflection curves measured using displacement gauges and DIC. The two methods showed some discrepancies during initial loading. As the load increased, the load–deflection curves from both methods progressively converged. At the later stage of loading, the specimen underwent large deformations and localized spalling, yet the non-contact DIC technique continued to capture deformation data. Thus, DIC produced more complete response curves and demonstrated greater stability and reliability across the loading range. Displacement gauges were sensitive to installation and environmental conditions. They were prone to data collection interruption or distortion under large deformations or localized spalling conditions.
Figure 11.
Load–deflection curves of beam specimens: (a) NSCB; (b) DSCB25; (c) DSCB50.
3.4. Strain Analysis of DSCBs
3.4.1. Concrete Strain
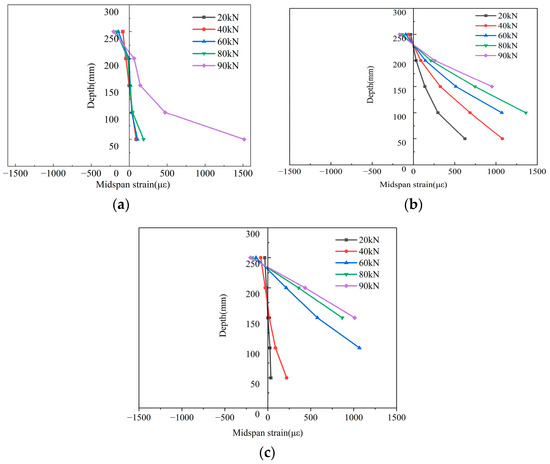
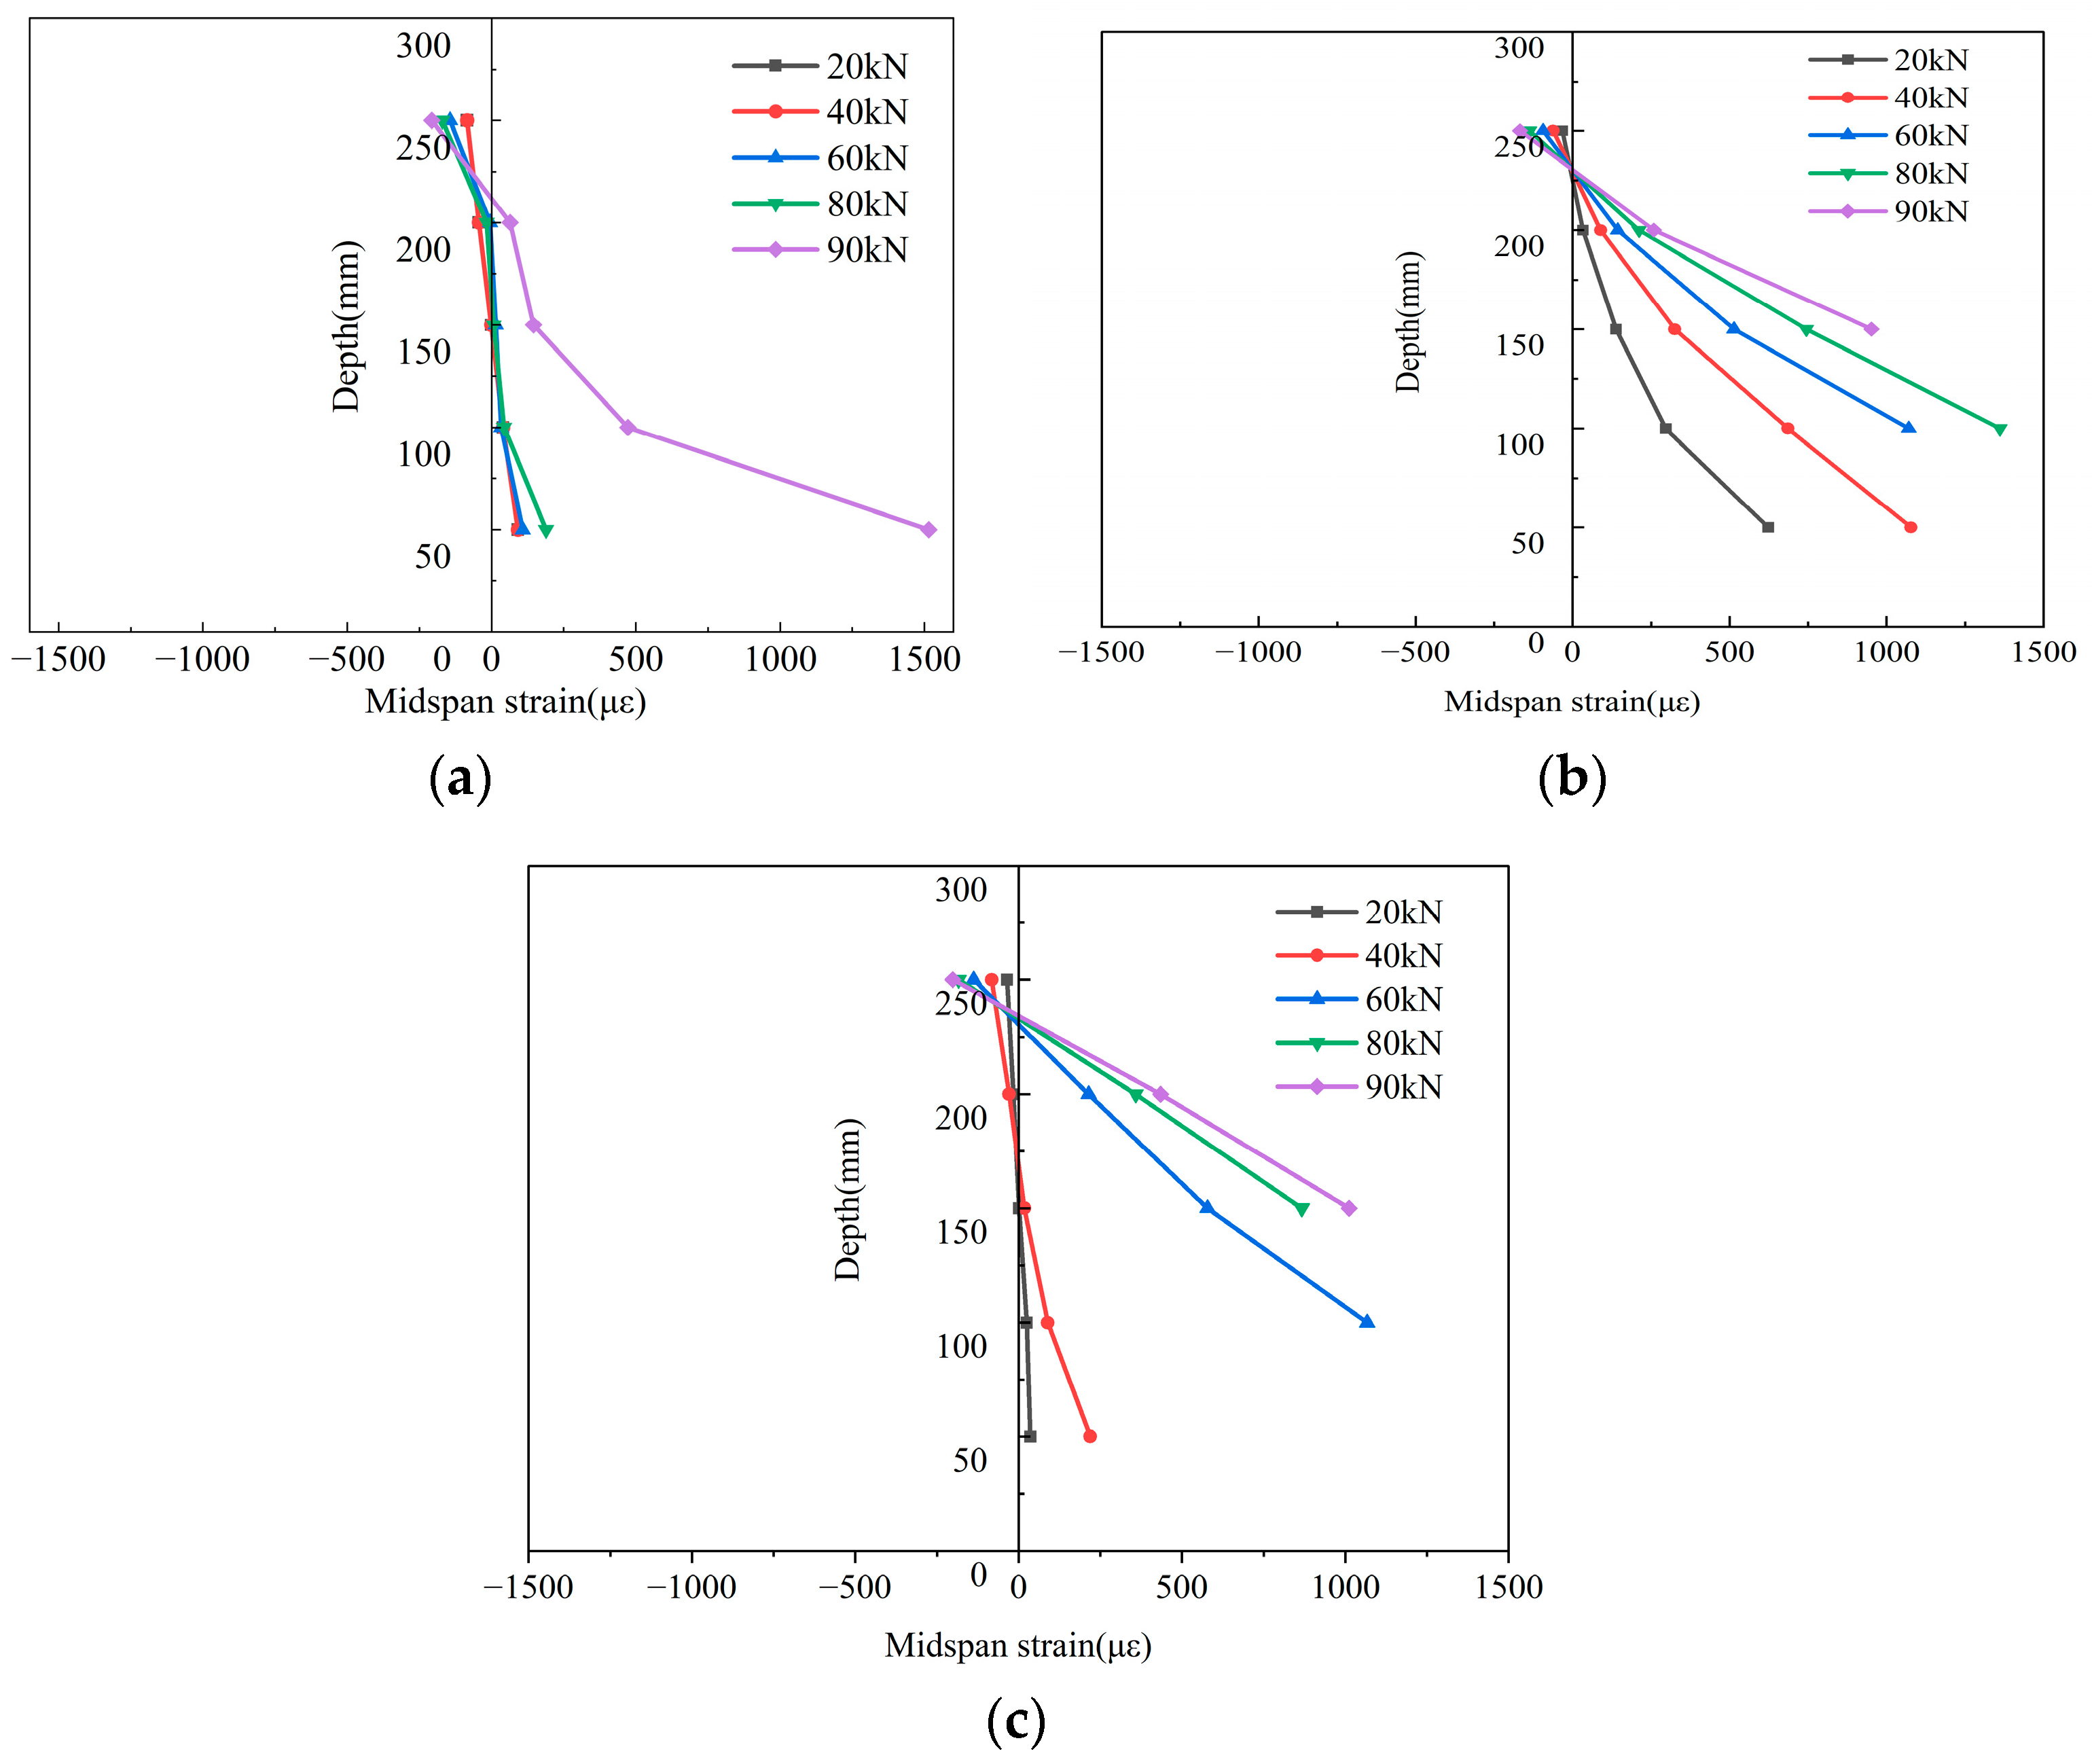
Figure 12 shows the concrete strain distribution at different heights across the midspan section of the beam specimen. The strain profile remained linear before cracking as the load increased. The concrete in the tensile zone lost its tensile capacity due to cracking. Consequently, the strain at the neutral-axis location increased from nearly zero to a stable positive value. This observation indicated an upward shift of the neutral axis. This behavior is consistent with internal force redistribution theory for reinforced beams [37,38]. The findings support the applicability of the plane-section assumption to DSC structures in terms of deformation mechanisms.
Figure 12.
Distribution of concrete strain along the section height in the midspan section of beam specimens: (a) NSCB; (b) DSCB25; (c) DSCB50.
3.4.2. Reinforcement Strain
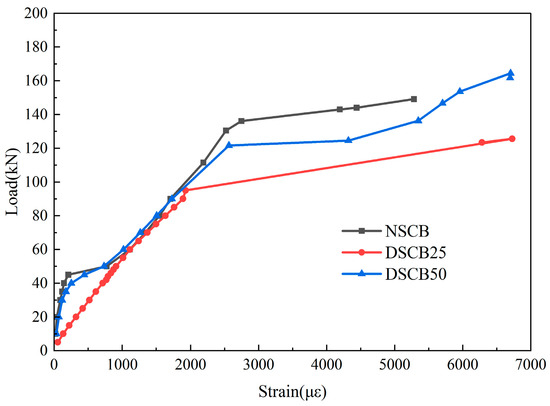
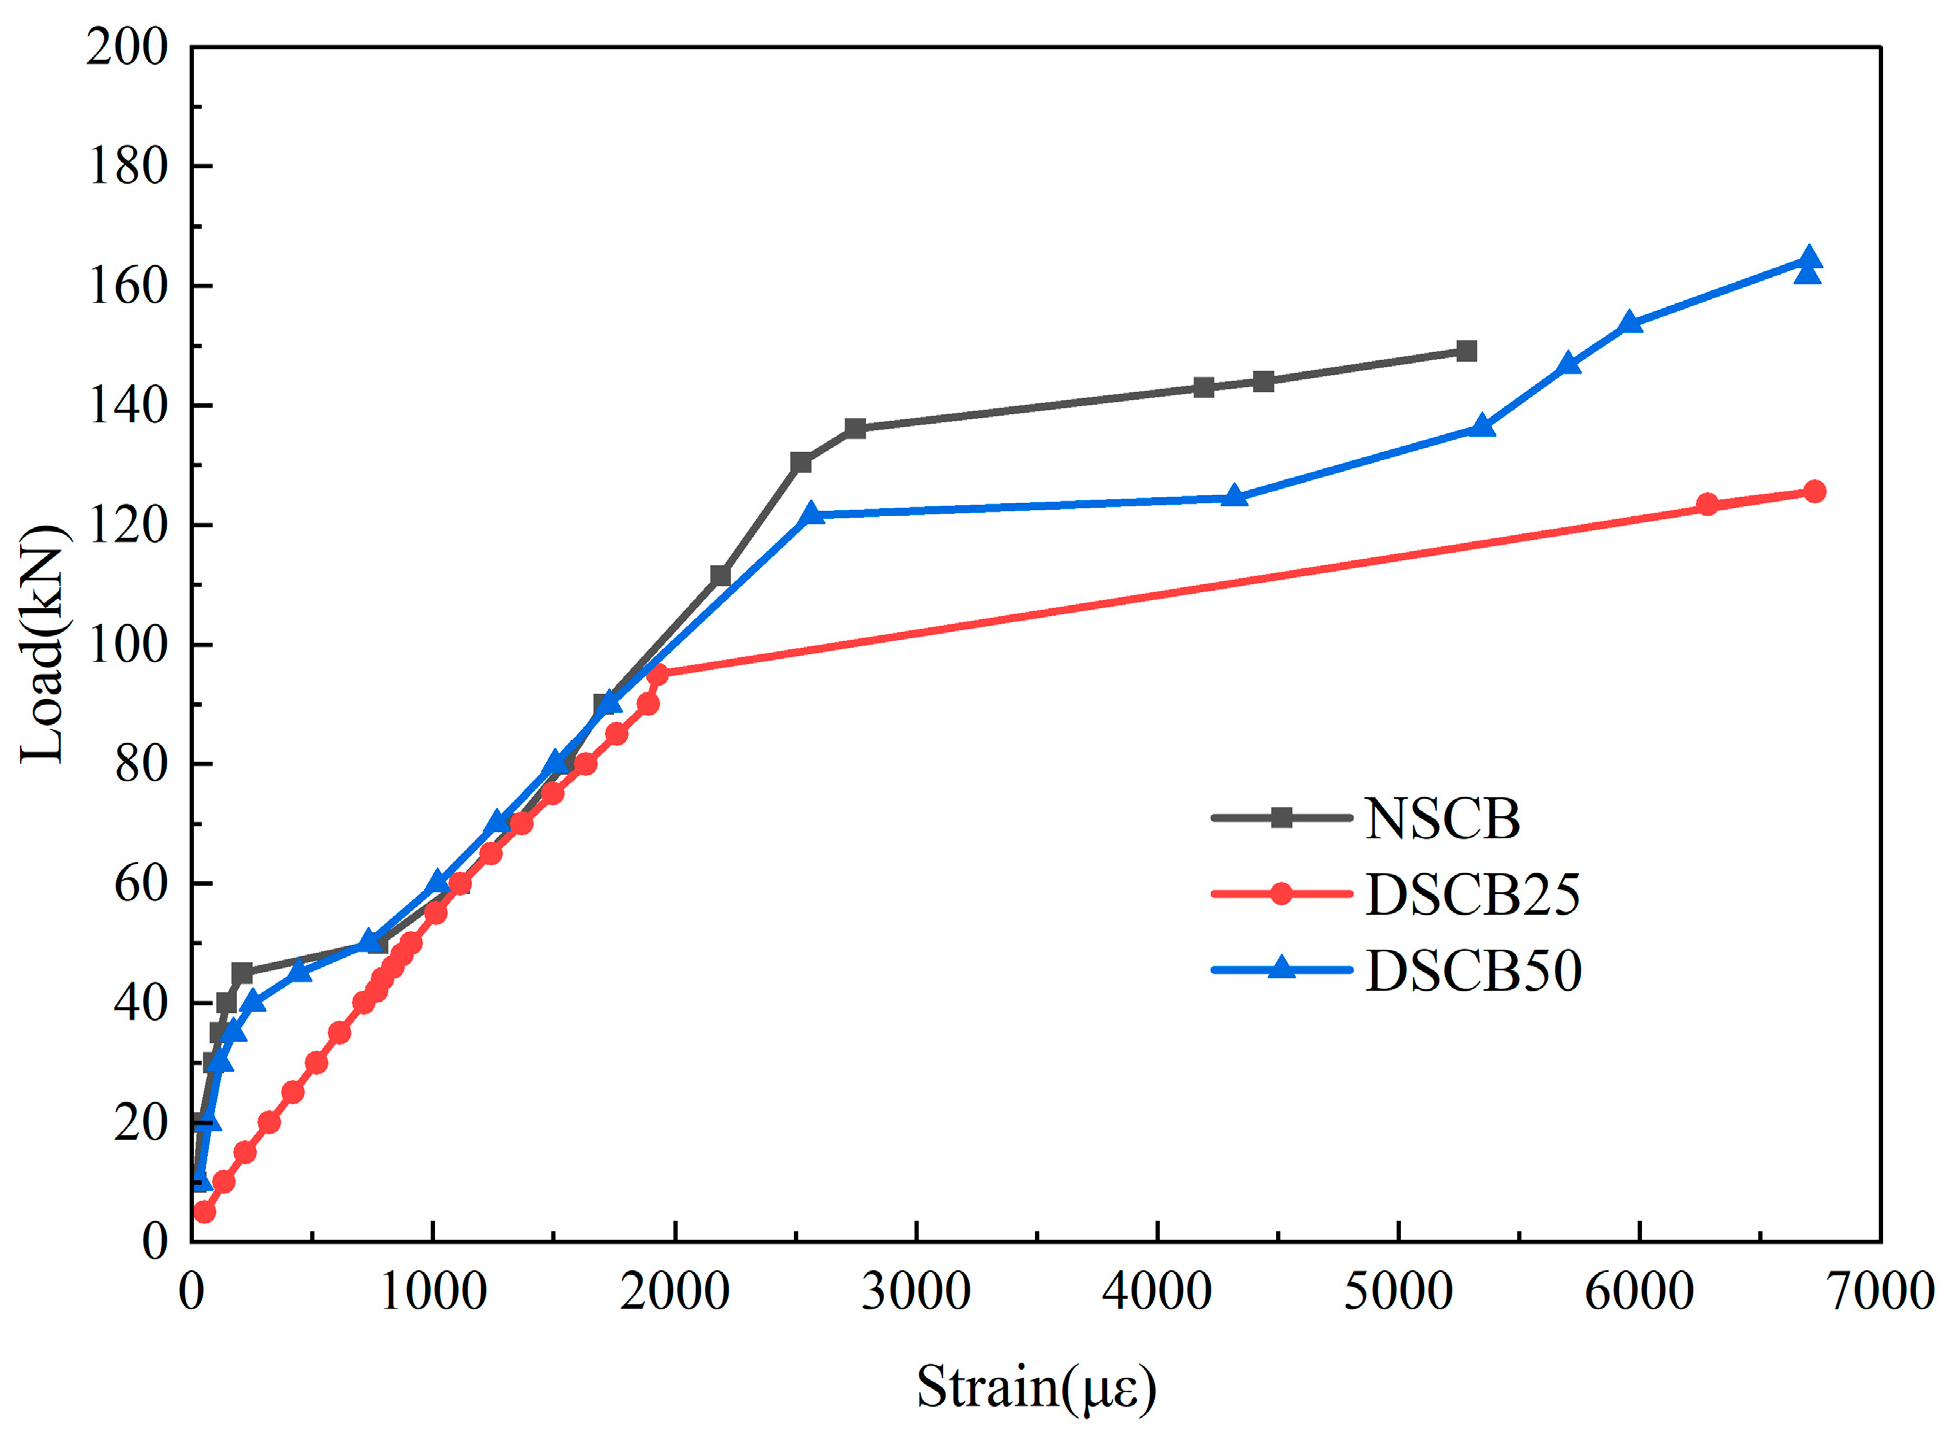
Figure 13 presents the load–strain curves for reinforcement in the pure bending section of the beam specimens. The reinforcement exhibited the typical three-stage stress–strain response. In the elastic stage, the reinforcement and concrete deformed cooperatively. The curves exhibited a linear stress–strain relationship. Reinforcement stress remained below yield strength. The initial slope of the DSCB25 specimen differed from those of the NSCB and DSCB50 specimens, primarily due to minor deviations in strain gauge installation and differences in the measurement system response during the early loading stage. This difference is attributed to random experimental errors that are difficult to completely avoid, rather than indicating any systematic material behavior anomaly. In the cracked stage, the concrete in the tension zone lost its load-bearing capacity due to cracking. Tensile force was transferred to the reinforcement. Consequently, the reinforcement experienced an abrupt increase in stress. Reinforcement stresses at different locations in the pure bending region all approached the yield strength of reinforcement. The slope of the load–strain curve decreased markedly, while the stress–strain relationship remained approximately linear. The appearance of a distinct horizontal segment on the load–strain curve indicated that the reinforcement had yielded, and the specimen had entered the plastic failure stage. During exploitation, the beam is expected to behave mainly elastically with limited plastic deformation to avoid excessive cracking and deflection.
Figure 13.
Load–strain curves for the reinforcement in the pure bending section of beam specimens.
3.5. Comparative Analysis of Theoretical and Experimental Bending Moments of DSCBs
Theoretical cracking, yield, and ultimate moments of the beams were calculated following the literature [11] and the Chinese code GB50010-2010 [26]. These theoretical values were then compared with the corresponding experimental values.
The cracking moment is defined as the bending moment at which the first cracks initiate in the beam. It is determined using the following equation:
where is the tensile strength of the concrete specimens, and ; b is the cross-sectional width of the beam; h is the cross-sectional height of the beam; is the effective depth of the beam cross-section; is the depth of the concrete compression zone, and ; is the ratio of the elastic modulus of steel to that of concrete; and is the cross-sectional area of the longitudinal tensile reinforcement.
The yield moment of the beam is defined as the bending moment at which the longitudinal tensile reinforcement reaches its yield strength. It is calculated according to the following equation:
where is the yield strength of the longitudinal tensile reinforcement; is the depth of the concrete compression zone, and ; and ρ is the reinforcement ratio of the longitudinal tensile reinforcement.
The ultimate moment is defined as the bending moment at which the compressive stress in the beam’s upper concrete compression zone attains the concrete compressive strength. It is calculated as follows:
where is the compressive strength of the concrete specimens, and , with and (see Table 7). is the equivalent rectangular stress factor for the concrete in the compression zone.
Table 7.
Compressive strength of the concrete specimens.
Based on Equations (1)–(3), the theoretical values of the DSCBs were calculated and compared with the experimental results, as summarized in Table 8, Table 9 and Table 10. Statistical indicators of the ratio of theoretical-to-experimental moments are shown in Table 11.
Table 8.
The values of cracking moment.
Table 9.
The values of yield moment.
Table 10.
The values of ultimate moment.
Table 11.
Statistical indicators for the ratios of theoretical-to-experimental moments.
The experimental cracking moments of the specimens were all higher than the calculated values. The average ratio of the calculated cracking moments to the experimental cracking moments was 0.620, the standard deviation was 0.104, and the coefficient of variation was 16.8%. This indicates that the code calculations are conservative, and the experimental results exhibit moderate dispersion. Due to the micro-filling effect of desert sand, the actual tensile strength of concrete in the DSCB25 specimen was improved. The cracking moment ratio increased to 0.74 compared with the NSCB specimen. When the DSRR was 50%, the deterioration of interfacial bonding led to a decrease in tensile capacity, and the ratio of cracking moment dropped to 0.56. The current code provides a safe prediction of the cracking load, helping to mitigate the risk of early-age cracking, but its prediction accuracy is significantly affected by DSRR.
The experimental yield moments of the specimens were slightly lower than the calculated values. The average ratio of the calculated yield moments to the experimental values was 1.103, the standard deviation was 0.090, and the coefficient of variation was 8.2%. This indicates that the code calculation tends to be non-conservative, and the experimental results show small dispersion. As the DSRR increased, the calculated values progressively exceeded the experimental values. As the DSRR increased, the concrete in the tension zone withdrawing from work accelerated. Consequently, the reinforcement grew faster, leading to a decrease in the experimental yield moment.
The experimental ultimate moments of all specimens were higher than the calculated values. The average ratio of the code-calculated ultimate moments to the experimental values was 0.743, the standard deviation was 0.012, and the coefficient of variation was 1.6%. This indicates that the code calculation tends to be conservative. The ultimate loading capacity is primarily governed by the yield strength of the reinforcement, and the influence of the desert sand replacement ratio is limited, resulting in minimal scatter in the moment ratios.
The predicted values from the existing design formula are in relatively good agreement with the experimental results at the yielding moment stage, while certain deviations exist at the cracking moment and ultimate moment stages. The current code formulas can provide a reference for the engineering design of DSCBs, and appropriate modifications considering the DSRR are recommended for different stress stages.
4. Conclusions and Recommendations for Future Research
4.1. Conclusions
To investigate the influence of desert sand from Ningxia, China, on the flexural behavior of concrete beams, five groups of C30 DSC cubes with replacement ratios of 0%, 25%, 50%, 75%, and 100%, as well as three groups of desert sand concrete beam (DSCB) specimens with replacement ratios of 0%, 25%, and 50%, were prepared. The CCS of DSC was measured. Based on DIC technology, four-point bending tests were conducted to investigate the flexural performance, full-field strain distribution characteristics, and crack propagation evolution of the beams during loading. The main conclusions are as follows:
- (1)
- The CCS of DSC first increased and then decreased with an increasing DSRR. CCS reached its maximum at a DSRR of 25%.
- (2)
- The ultimate flexural capacity of DSCBs attained its maximum at a DSRR of 25% and was comparable to that of NSCBs. Desert sand from Ningxia, China, is suitable for producing concrete beam components.
- (3)
- The incorporation of desert sand altered the crack initiation and propagation patterns in the beams. Both the number and width of cracks in DSCBs developed more significantly (this conclusion was derived based on qualitative analysis only). At a DSRR of 25%, the ductility of the beams was largely unaffected. The failure mode transformed from ductile to brittle at a DSRR of 50%.
- (4)
- The calculation results of cracking moments and ultimate moments are conservative, and the calculation results of yield moments are non-conservative. The current Chinese code can provide a reference for the engineering design of DSCBs, and appropriate modifications considering the DSRR are recommended for different stress stages.
4.2. Recommendations for Future Research
Based on the findings of this study and the limitations of existing research, future research should focus on the following areas:
- (1)
- Future research should combine scanning electron microscopy (SEM) and other technologies to quantitatively analyze the micro-morphology and pore structure of the interfacial transition zone (ITZ) of DSC under different DSRRs. A quantitative correlation model linking these microstructural parameters to macroscopic mechanical behavior can then be established.
- (2)
- To conduct a quantitative crack analysis of DSCBs based on DIC technology, the effects of different DSRRs and loading stages on crack evolution will be clarified. This will provide a quantitative basis for crack resistance design and durability prediction of DSCBs.
- (3)
- Future research should expand the range of DSRRs, with a focus on the flexural behavior of DSRRs at high replacement ratios of 75% and 100%. The failure mechanism, loading capacity, and ductility variation patterns of members under high replacement ratios should be clarified. Furthermore, the flexural strength calculation formula for DSCBs should be refined to provide more comprehensive data support for the engineering application of desert sand concrete with various replacement ratios.
- (4)
- The mix design of DSC should be optimized by incorporating mineral admixtures and modifiers to improve the interfacial bonding between desert sand and cement paste. This approach is expected to enhance the ductility of DSCBs with high DSRRs and reduce the risk of brittle failure.
Author Contributions
Conceptualization, L.H. and H.L.; methodology, L.H. and Q.C.; software, L.H. and S.L.; validation, L.H., H.L. and Z.J.; formal analysis, L.H.; investigation, S.L. and F.Z.; resources, Q.C.; data curation, L.H. and S.L.; writing—original draft preparation, L.H.; writing—review and editing, L.H. and H.L.; visualization, S.L.; supervision, H.L.; project administration, L.H.; funding acquisition, L.H. All authors have read and agreed to the published version of the manuscript.
Funding
This research was funded by the Scientific Research Project of Higher Education Institutions of Ningxia Hui Autonomous Region in 2024, grant number NYG2024271; the Scientific Research Project of Yinchuan Energy College in 2023, grant number 2023-KY-Z-8; and the Scientific Research Project of Yinchuan Energy College in 2022, Research and innovation team of efficient utilization of green engineering materials; and the Autonomous Region Key R&D Program Talent Introduction Special Project in 2024, grant number 2024BEH04054.
Institutional Review Board Statement
Not applicable.
Informed Consent Statement
Not applicable.
Data Availability Statement
The data used to support the findings of this study are available from the corresponding authors upon request.
Conflicts of Interest
The authors declare no conflicts of interest.
Abbreviations
The following abbreviations are used in this manuscript:
| DSC | Desert sand concrete |
| DSCB | Desert sand concrete beam |
| DSRRs | Desert sand replacement ratios |
| CCS | Cubic compressive strength |
| DIC | Digital image correlation |
| NSC | Natural sand concrete |
| NSCB | Natural sand concrete beam |
References
- Kazmi, S.M.S.; Munir, M.J.; Wu, Y.F. Development of sustainable high-performance desert sand concrete: Engineering and environmental impacts of compression casting. Resour. Conserv. Recycl. 2025, 212, 108002. [Google Scholar] [CrossRef] [Scilit]
- Merniz, M.; Bederina, M.; Meddah, A. An alternative sustainable desert-sand concrete incorporating industrial waste fillers: Physic mechanical and microstructural insights. Innov. Infrastruct. Solut. 2025, 10, 396. [Google Scholar] [CrossRef] [Scilit]
- Rennani, F.Z.; Zaouai, S.; Makani, A. Enhancement of high-performance concrete properties with crushed dune sand addition: A sustainable approach for desert regions. Mater. Sci. 2025, 43, 173–188. [Google Scholar] [CrossRef] [Scilit]
- Akhtar, M.N.; Albatayneh, O.; Bani-Hani, K.A. Performance of modified desert sand concrete: An experimental case study. Case Stud. Constr. Mater. 2024, 21, e03465. [Google Scholar] [CrossRef] [Scilit]
- Akhtar, M.N.; Bani-Hani, K.A.; Malkawi, D.A.H. Suitability of sustainable sand for concrete manufacturing—A complete review of recycled and desert sand substitution. Results Eng. 2024, 23, 102478. [Google Scholar] [CrossRef] [Scilit]
- Chen, Q.L.; Liu, H.F.; Han, L. Comparative studies of dynamic mechanical properties of desert sand concrete and ordinary concrete. Shock Vib. 2022, 2022, 8680750. [Google Scholar] [CrossRef] [Scilit]
- Lv, Z.S.; Bekey, S.; Dong, C. Experimental study on axial compression performance of brick masonry using natural desert sand mortar. J. Xinjiang Univ. (Nat. Sci. Ed.) 2017, 2017, 373–378. [Google Scholar] [CrossRef]
- Liu, F.C.; Qin, Y.J.; Feng, B.S. Study on compressive mechanical property of basalt fiber desert sand concrete column. Henan Univ. Sci. Technol. (Nat. Sci. Ed.) 2025, 42, 85–94. [Google Scholar] [CrossRef]
- Luo, L.; Li, T.; Liu, X.M. Damage model of shear beam of basalt fiber high-strength desert sand concrete based on acoustic emission and fractal theory. Henan Univ. Sci. Technol. (Nat. Sci. Ed.) 2023, 44, 38–45. [Google Scholar] [CrossRef]
- Qin, Y.J.; Zhang, L.L.; Qu, C.W. Flexural mechanical properties of steel fiber desert sand concrete beams. Acta Mater. Compos. Sin. 2022, 39, 5599–5610. [Google Scholar] [CrossRef]
- Bekey, S.; Dong, C.; Saipidin, M. Experimental study on flexural behavior of basalt fibers admixing desert sand RC beam. Build. Struct. 2024, 54, 131–135. [Google Scholar] [CrossRef]
- Li, Z.Q.; Yang, S.; Luo, Y. Experimental evaluation of the effort of dune sand replacement levels on flexural behaviour of reinforced beam. J. Asian Archit. Build. Eng. 2020, 19, 480–489. [Google Scholar] [CrossRef] [Scilit]
- Yu, J.; Wu, D.W.; Ding, F.X. Seismic performance of desert sand concrete filled steel tubular column-composite beam space frame structure. J. Railw. Sci. Eng. 2025, 22, 5105–5118. [Google Scholar] [CrossRef]
- Ma, W.; Gao, D.Y.; Ding, C. Whole process analysis on splitting tensile behavior and damage mechanism of 3D/4D/5D steel fiber reinforced concrete using DIC and AE techniques. Constr. Build. Mater. 2024, 457, 139295. [Google Scholar] [CrossRef] [Scilit]
- Wang, Y.G.; Gao, S.; Li, W. Study on compression deformation and damage characteristics of pine needle fiber-reinforced concrete using DIC. Materials 2022, 15, 1654. [Google Scholar] [CrossRef] [Scilit] [PubMed]
- Liu, X.F.; Zhou, X.; Wang, X.R. Time-varying damage evolution of concrete under cyclic disturbance loading- an experimental observation utilizing AE and DIC. Case Stud. Constr. Mater. 2024, 20, e03219. [Google Scholar] [CrossRef] [Scilit]
- Shang, D.W.; Wang, Z.P.; Zhang, J.Z. Dynamic data fusion analysis method for crack tracking in reinforced concrete based on DIC and AE. Res. Nondestruct. Eval. 2025, 36, 144–158. [Google Scholar] [CrossRef] [Scilit]
- Huang, J.J.; She, Y.H.; Xie, Y.Q. Compression damage analysis of GFRP-steel fiber reinforced concrete composite structures based on AE and DIC techniques. Nondestruct. Test. Eval. 2025, 2025, 1–36. [Google Scholar] [CrossRef] [Scilit]
- Ashraf, S.; Rucka, M. Microcrack monitoring and fracture evolution of polyolefin and steel fibre concrete beams using integrated acoustic emission and digital image correlation techniques. Constr. Build. Mater. 2023, 395, 132306. [Google Scholar] [CrossRef] [Scilit]
- Menna, D.W.; Genikomsou, A.S.; Green, M.F. Flexural performance and crack closing capacity of double-hooked-end superelastic shape memory alloy fibre-reinforced concrete beams under cyclic loading using digital image correlation. Constr. Build. Mater. 2023, 409, 133744. [Google Scholar] [CrossRef] [Scilit]
- Kadhom, B.; Simova, E.; Zhang, J. Suitability of DIC in capturing flexural behaviour of as-built and CFRP-strengthened RC beams. Can. J. Civ. Eng. 2024, 51, 977–988. [Google Scholar] [CrossRef] [Scilit]
- Hemalatha, K.; Prasad, D.R. Assessment of flexural behaviour and a novel deformability approach of concrete beams reinforced with GFRP and steel bars—A digital image correlation technique. Structures 2025, 73, 108412. [Google Scholar] [CrossRef] [Scilit]
- JGJ55-2011; Specification for the Design of Mixing Ratio of Ordinary Concrete. The Professional Standard Compilation Group of the People’s Republic of China: Beijing, China, 2011.
- GB/T50081-2019; Standard of Test Methods for Physical and Mechanical Properties of Concrete. The Professional Standard Compilation Group of the People’s Republic of China: Beijing, China, 2019.
- GB/T50152-2012; Standard of Test Methods for Concrete Structures. The Professional Standard Compilation Group of the People’s Republic of China: Beijing, China, 2012.
- GB/T50010-2010; Code for Design of Concrete Structures. The Professional Standard Compilation Group of the People’s Republic of China: Beijing, China, 2024.
- Liu, Y.Z.; Du, P.W.; Tan, K.H. Experimental and analytical studies on residual flexural behaviour of reinforced alkali-activated slag-based concrete beams after exposure to fire. Eng. Struct. 2024, 298, 117035. [Google Scholar] [CrossRef] [Scilit]
- Deng, Y.; Li, Z.Z.; Zhang, H.X. Experimental and analytical investigation on flexural behaviour of RC beams strengthened with NSM CFRP prestressed concrete prisms. Compos. Struct. 2021, 257, 113385. [Google Scholar] [CrossRef] [Scilit]
- Rabi, M.; Shamass, R.; Cashell, K.A. Experimental investigation on the flexural behaviour of stainless steel reinforced concrete beams. Struct. Infrastruct. Eng. 2022, 19, 1847–1859. [Google Scholar] [CrossRef] [Scilit]
- Santorsola, J.; Butler, L.J. Material behaviour and flexural performance of low carbon concrete beams containing very high quantities of recycled and secondary materials. Constr. Build. Mater. 2023, 407, 133350. [Google Scholar] [CrossRef] [Scilit]
- Sryh, L.; Forth, J. Long-Term Flexural Behaviour of Cracked Reinforced Concrete Beams with Recycled Aggregate. Int. J. Concr. Struct. Mater. 2022, 16, 19. [Google Scholar] [CrossRef] [Scilit]
- Khan, M.I.; Sial, S.U.; Fares, G.; ElGawady, M.; Mourad, S.; Alharbi, Y. Flexural performance of beams strengthened with a strain-hardening cementitious composite overlay. Case Stud. Constr. Mater. 2022, 17, e01645. [Google Scholar] [CrossRef] [Scilit]
- Yuan, F.; Liu, P.; Li, H.H. Experimental investigations on the flexural behavior of compression-cast seawater sea-sand concrete beams reinforced with CFRP bars. Constr. Build. Mater. 2024, 445, 137754. [Google Scholar] [CrossRef] [Scilit]
- El Fakhrany, M.H. Experimental study on the flexural behaviour of lap-spliced rapid hardening concrete beams. Eng. Struct. 2024, 313, 118255. [Google Scholar] [CrossRef] [Scilit]
- Cao, A.L.; Ma, Y.W.; Li, Z.Q. Study of the Influence of Desert Sand-Mineral Admixture on the Abrasion Resistance of Concrete. Materials 2025, 18, 446. [Google Scholar] [CrossRef] [Scilit] [PubMed]
- Yi, G.X.; Song, Y.Y.; Wang, J. Corrosion Characteristics and Flexural Performance of Carbonated Recycled Aggregate Concrete Beams in Corrosive Environments. Buildings 2024, 15, 58. [Google Scholar] [CrossRef] [Scilit]
- Carmo, R.; Ferreira, M. Influence of using moment redistribution and high-strength steels on crack width and deformations. Adv. Struct. Eng. 2025, 28, 2677–2692. [Google Scholar] [CrossRef] [Scilit]
- Luo, D.; Zhang, Z.; Li, B. Moment redistribution of RC continuous beams: Re-examination of code provisions. Struct. Eng. Mech. 2023, 85, 679–691. [Google Scholar] [CrossRef]



Disclaimer/Publisher’s Note: The statements, opinions and data contained in all publications are solely those of the individual author(s) and contributor(s) and not of MDPI and/or the editor(s). MDPI and/or the editor(s) disclaim responsibility for any injury to people or property resulting from any ideas, methods, instructions or products referred to in the content. |
© 2026 by the authors. Licensee MDPI, Basel, Switzerland. This article is an open access article distributed under the terms and conditions of the Creative Commons Attribution (CC BY) license.