


Abstract
This study experimentally investigated the shear mechanical properties of heterogeneous concrete surfaces during freeze–thaw cycles. Artificial concrete joint specimens with identical morphologies were subjected to direct shear tests under varying freeze–thaw cycles (0, 5, 10, 20, and 30 cycles) and normal stresses (2 to 4 MPa), and the changes in the porosity of the specimens were observed. The results demonstrated that an increase in the number of freeze–thaw cycles resulted in a continuous decrease in the peak shear strength, pre-peak shear stiffness, and residual shear strength of the structural surface, with reductions of 11.5–44.4%, 15.7–31.7%, and 14.5–38.5%, respectively; the increase in porosity exhibited a pattern of rapid growth initially, followed by a slower rate as the number of freeze–thaw cycles increased. The enhancement of normal stress can, to a certain extent, suppress freeze–thaw damage; however, its strengthening effect weakens as the number of freeze–thaw cycles increases. Based on the experimental data, the degradation models of peak shear strength, pre-peak shear stiffness, and residual shear strength considering the influence of freeze–thaw cycles, both the peak shear strength and residual shear strength models were developed based on the Mohr–Coulomb criterion. Strength and stiffness expressions based on porosity increments were also derived and a piecewise constitutive model capable of fully describing the entire shear process was further established. Model predictions showed good agreement with experimental data, with correlation coefficients exceeding 0.91, validating its high predictive accuracy. These findings provide a theoretical basis for the durability design and safety assessment of heterogeneous concrete structural surfaces in water conservancy projects within seasonal freeze zones.
1. Introduction
In large-scale water conservancy projects within cold regions and areas experiencing severe seasonal cold, the quality of concrete has a direct impact on engineering safety [1]. Heterogeneous concrete, characterized by differentiated material and mechanical properties, serves as a key technology for ensuring structural stability under complex environmental conditions. Exemplified by the Guanmenzuizi Reservoir in Heilongjiang Province, heterogeneous concrete is widely used in critical sections of conventional concrete gravity dams such as dam body joints and foundation connections. Adjusting the mix proportions and construction techniques reduces the stress concentration caused by freeze–thaw cycles, enhances the dam’s deformation resistance, and significantly reduces the risk of crack propagation [2,3].
Under self-weight, reservoir water pressure, or seismic loads, shear stress exceeding the shear strength of rock and soil on either side of a weak plane can trigger shear sliding along that plane [4]. The influence of shear on interface stability is clear; numerous experiments and theoretical analyses have examined the structural planes of heterogeneous materials.
Yi [5] conducted numerical shear tests on three heterogeneous interfaces between mudstone and sandstone, with varying levels of roughness, under wet–dry cycling conditions, revealing the mechanism by which roughness degrades shear strength at heterogeneous interfaces: higher roughness yields greater shear strength, but this strength degrades more significantly under wet–dry cycling. Zhang et al. [6] performed shear tests to examine how moisture content affects the peak shear strength at the loess–mudstone interface. The results show that the shear strength of the surface layer at this interface is lower than that of loess or mudstone alone. As moisture content rises, both the peak shear strength and internal friction angle decline notably, increasing the likelihood of slip formation zones. Shen et al. [7] conducted inclined shear tests on heterogeneous interfaces between concrete and granite, analyzing the effects of the interfacial roughness coefficient (JRC) and hydrophilicity (CA) on bond strength. The results indicate that bond strength increases with higher JRC, revealing a coupled enhancement effect between the two parameters. Based on this, an interfacial shear model was developed that accounts for the combined influence of roughness and wetting characteristics. Zhao et al. [8] conducted an experimental study of the mechanical properties of heterogeneous rock–mortar structural plane specimens, with and without anchors, under triaxial compression. They examined how bolt-anchoring and confining pressure influence the mechanical behavior and failure modes of these specimens in the in-plane direction. Zhang et al. [9] developed heterogeneous interface specimens with various rock strength combinations utilizing gypsum of differing strengths. They conducted direct shear tests under varying normal stresses and introduced an empirical criterion for the shear strength of heterogeneous structural planes, incorporating the effects of friction angle-correction morphology. Liu et al. [10] employed gypsum to create artificial samples of heterogeneous structural planes and performed two series of direct shear tests. These tests aimed to investigate the influence of roughness and normal stress on the shear strength, deformation behavior, and damage characteristics of heterogeneous structure planes. Pan et al. [11] conducted direct shear tests on the silty clay–concrete interface under both freezing and ambient temperature conditions, with three distinct water contents. They examined the mechanical properties of the silty clay–concrete interface across varying water contents, temperatures, and normal loads, elucidating how alterations in water content and temperature environments impact the contributions of interfacial bonding and friction, thereby affecting peak strength and deformation characteristics. Liu et al. [12] designed a novel dynamic direct shear apparatus and confirmed, through calibration experiments, its suitability for precisely examining the dynamic properties of frozen soil and the interfacial behavior between various materials. Sun et al. [13,14] conducted shear tests on the interface between frozen soil and concrete under different boundary conditions. It is believed that the stress and deformation characteristics of the interface layer between frozen soil and concrete are significantly influenced by normal stress, water content, frozen soil temperature, and other factors.
Furthermore, to investigate patterns of change in the shear strength of materials during freeze–thaw cycles, researchers in China and abroad have conducted extensive direct shear testing on a variety of engineering materials.
Zhang et al. [15] studied jointed rock masses in cold regions and, by combining freeze–thaw cycle–shear coupling tests with damage model analysis, demonstrated that freeze–thaw action weakens the strength of rock bridges; the revised shear strength criteria significantly improved prediction accuracy. Shi et al. [16] studied the soil–root systems of herbaceous plants. Combining discrete element modeling with laboratory tests, they found that roots significantly enhance shear strength through anchoring and three-dimensional reinforcement. Freeze–thaw damage was primarily caused by the destruction of particle bonding due to water–ice phase transitions, which reduced root–soil synergy. Liang et al. [17] studied fly ash-modified silty clay, combining shear tests with constitutive model analysis, and found that freeze–thaw cycles and fly ash content jointly influence interfacial strength, with mechanical properties being optimal at a 10% fly ash content. Liu et al. [18] studied frozen glacial till and, through a combination of freeze–thaw direct shear tests and regression model analysis, found that freeze–thaw cycles significantly affect shear strength, with cohesion exhibiting an exponential relationship with the comprehensive parameter K. Quan et al. [19] studied Tibetan clay, combining freeze–thaw cycle direct shear tests with piezoelectric ceramic monitoring, and found that shear strength deteriorates in a stepwise manner under freeze–thaw action, and that strength deterioration indices can effectively reflect the extent of deterioration. Gu et al. [20] studied biopolymer-modified soil and, using direct shear tests, DEM simulations, and microscopic analysis, demonstrated that freeze–thaw cycles weaken intergranular bonding and expand the shear zone, while biopolymer modification can, to some extent, enhance the soil’s resistance to freeze–thaw shear instability. Hou et al. [21] studied granite in Yanqiao, combining compression-shear tests with digital image correlation methods, and found that freeze–thaw cycles weaken the load-bearing capacity of Yanqiao granite and alter the processes of crack initiation, propagation, and penetration, thereby significantly influencing the evolution of shear failure in rock masses containing interlocked segments. Han et al. [22] studied remolded loess and, combining direct shear tests with scanning electron microscopy analysis, pointed out that the deterioration of loess shear strength under different freeze–thaw and wet–dry cycling pathways is primarily controlled by the decay of cohesion, while changes in the angle of internal friction are relatively minor; the evolution of pores from small and medium-sized to large pores is an important microstructural mechanism underlying this strength degradation. Liu et al. [23] studied root–soil complexes and, combining freeze–thaw cyclic direct shear tests with theoretical analysis, pointed out that freeze–thaw cycles significantly influence the evolution of shear strength in root–soil complexes; cohesion continuously decreases with increasing cycle numbers, while the root system can, to some extent, inhibit the increase in porosity and strength decay during freeze–thaw processes. Zhang et al. [24] studied dispersed soils and, combining direct shear tests, particle size distribution analysis, and SEM observations, noted that freeze–thaw cycles led to an overall decrease in the cohesion and angle of internal friction of dispersed soils, accompanied by particle fragmentation, pore structure reorganization, and microstructural degradation.
In recent years, relevant research has also revealed the multi-field coupling characteristics of damage evolution in brittle materials from the perspective of broader environmental disturbances and complex stress paths. For example, studies have shown [25] that cyclic thermal loading and cryogenic impact with liquid nitrogen significantly promoted crack propagation in granite and weakened its mechanical properties. Other studies have indicated [26] that the permeability of coal under unconfined conditions correlates well with energy evolution; the material damage process can be effectively characterized through energy evolution. The aforementioned studies, from the perspectives of crack evolution, mechanical degradation, and flow–energy coupling, provide a reference for understanding the relationship between internal damage accumulation and macroscopic performance degradation in freeze–thaw environments.
Building on research into the relationship between mechanical degradation and direct shear behavior of materials under the aforementioned freeze–thaw cycles, scholars both in China and abroad have further extended their focus to heterogeneous interfaces, such as soil–concrete and rock–concrete interfaces, with a particular emphasis on investigating the mechanisms by which freeze–thaw damage affects the shear resistance of these heterogeneous interfaces.
Wang et al. [27] conducted direct shear tests on silt-clay–concrete interfaces subjected to varying freeze–thaw cycles. Combining micromechanical analysis, the relationship between freeze–thaw damage in the interface zone and the macro-scale degradation of shear strength was examined. The research further demonstrated that normal stress and initial moisture content alter the extent of freeze–thaw damage, thereby influencing the degree of interface strength deterioration and failure characteristics. Guo et al. [28] fabricated three concrete–sandstone composite specimens with varying roughness profiles. They conducted freeze–thaw cycles, direct shear tests, and SEM to analyze mass loss rates, shear mechanical parameter variations, and microdamage at shear failure interfaces after different freeze–thaw cycles. Tang et al. [29] performed direct shear tests on the soil–rock mixture–concrete interface, examining the effects of freeze–thaw cycles, stone content, and normal stress. They observed how the interface strength and pore structure evolved, revealing that freeze–thaw cycles notably alter the interface microstructure and cause shear strength to decrease performance. Deng [30] developed a peak shear strength degradation model based on interfacial direct shear tests. The results showed that interfacial shear strength diminishes linearly as freeze–thaw cycles increase, while higher interfacial roughness leads to increased shear strength. This degradation mechanism is primarily due to the combined influence of external freeze–thaw conditions, inherent interfacial roughness, and material properties strength. Chou et al. [31] studied how contact surface strength and matrix suction change with freeze–thaw cycles using direct shear tests on unsaturated loess-concrete specimens of different moisture contents, and developed a model for shear stress-displacement at the interface during freeze–thaw cycles. Long et al. [32] designed three granite–concrete composites with varying levels of interface roughness, conducted experiments under different freeze–thaw cycle counts, and analyzed post-freeze–thaw changes in composite appearance, mass loss, flexural strength loss, crack initiation toughness, and fracture energy. Zhang et al. [33] investigated the behavior of a sandstone–concrete interface under freeze–thaw cycles using direct shear tests and numerical simulations of granular flow. The results showed that interface strength decreased with increasing freeze–thaw cycles but increased with higher roughness leves, revealing the complete failure process from microcrack initiation at the interface to propagation, forming macroscopic shear zones. Shen et al. [34] employed 3D laser scanning, oblique shear tests, and novel shear fracture morphology analysis to evaluate the impact of freeze–thaw cycling on concrete–granite interfaces. The findings indicated that interface strength was positively correlated with roughness and bonding force, while freeze–thaw cycles significantly reduced bonding performance by weakening cementation. Peng et al. [35] investigated how freeze–thaw cycles influence shear behavior at the frozen soil–concrete interface through direct shear tests. They discovered that freeze–thaw cycles encourage ice film formation, leading to reduced peak strength cohesion and increased residual friction angle. These changes notably affected interface performance. Wang et al. [36] examined the shear behavior of the soil–concrete interface under freeze–thaw cycles and direct shear tests. They discovered that freeze–thaw cycles substantially decrease shear strength by 21–25% and developed a hyperbolic model. Pan et al. [37] investigated the mechanical properties of the silt-clay and concrete interface subjected to freeze–thaw cycles using direct shear tests, particle image velocimetry, and SEM analysis. The findings indicated that freeze–thaw cycles and higher water content notably lowered the interfacial shear strength and altered the microstructure at the shear interface band. The degradation of shear performance of heterogeneous material structural planes under freeze–thaw cycles was due to the synergistic evolution of interface contact and material damage. The freezing of pore water increased the concentration of freeze–thaw stress, while the migration of unfrozen water exacerbated the redistribution of pore pressure, promoting the initiation, propagation, and connectivity of microcracks in the interface transition zone and in weak side materials. As the freeze–thaw process progressed, rough peak crushing wear, increased porosity, and a reduced effective contact area collectively weakened interfacial bonding, biting, and friction, ultimately resulting in a sustained decline in peak shear strength, residual shear strength, and pre-peak shear stiffness.
Existing research has mostly focused on heterogeneous interfaces, such as soil concrete and rock concrete, while there is insufficient research on the mechanical response of heterogeneous structural surfaces composed of two different types of concrete under freeze–thaw conditions. Unlike soil or rock interfaces, the interface of heterogeneous concrete is coupled by differences in material strength, pore structure, water-absorption characteristics, and frost resistance on both sides. Its freeze–thaw damage evolution and shear mechanism exhibit more significant material differences and engineering-specificity. Further research is needed on the related strength, stiffness, and constitutive behavior throughout the entire process.
Based on this, this article uses manual replication technology to prepare heterogeneous concrete structure test samples with the same rough morphology. Direct shear tests are conducted with different freeze–thaw cycle times (0, 5, 10, 20, 30 cycles) and normal stress levels (2, 2.5, 3, 3.5, 4 MPa). The evolution laws of peak shear strength, residual shear strength, pre-peak shear stiffness, and porosity increment are systematically analyzed. In terms of model development, this paper does not simply adopt existing complete models; instead, based on experimental results, it establishes a peak shear-strength degradation model, a residual shear-strength degradation model, and an expression for pre-peak shear stiffness that accounts for the number of freeze–thaw cycles. Both the peak and residual strength models are based on the Mohr–Coulomb criterion. Furthermore, a four-stage piecewise shear constitutive model was developed to describe the full-process shear response of heterogeneous concrete structural surfaces under freeze–thaw damage conditions. Compared with existing studies, the main innovations of this paper lie in: focusing on heterogeneous structural surfaces composed of two different types of concrete; systematically revealing the synergistic degradation patterns of strength, stiffness, and porosity under freeze–thaw cycles; and establishing a four-stage piecewise shear constitutive model to describe the full-process response. The research findings can provide a theoretical basis and technical support for the construction of hydraulic engineering facilities in cold regions.
The remainder of this paper is organized as follows: Section 2 introduces specimen preparation, the acquisition of joint morphology parameters, testing equipment, and the experimental protocol; Section 3 presents the results of direct shear tests under different numbers of freeze–thaw cycles and normal stress conditions; Section 4 analyzes the evolution patterns of peak shear strength, residual shear strength, pre-peak shear stiffness, and the increase in porosity; Section 5 establishes degradation models for peak shear strength, residual shear strength, and pre-peak shear stiffness that account for the influence of freeze–thaw cycle counts, and analyzes the relationship between the increase in porosity and macroscopic mechanical parameters; Section 6 constructs a four-stage segmented shear constitutive model for freeze–thaw damage and validates it; and Section 7 presents the conclusions of the paper and discusses the applicability and limitations of the model.
2. Materials and Methods
2.1. Specimen Preparation
Due to the destructive nature of direct shear tests, which limits the study of multiple loading conditions on the same joint, this study employs artificial replication techniques to prepare 50 × 100 mm cylindrical concrete joint specimens with identical morphology. The specific preparation process is as follows [38]: using the Brazilian splitting method, a half-section of a standard cylindrical granite specimen is obtained, serving as the replication matrix; this copy interface is used to implement uniform roughness boundary conditions. After grinding the joint surfaces, high-strength sulfoaluminate rapid-setting cement produced by Shandong Bo Kai Company, Weifang, China (mainly composed of 62% rapid-setting cement, 3% filler, 34% quartz sand, and 1% setting accelerators) and high-strength self-compacting concrete produced by Jiangsu Weili Company, Zhenjiang, China (mainly composed of 50% cement, 32% fine crushed stone, 8% fine sand, and 10% admixtures such as water-reducing agents and defoamers) as raw materials, were mixed and stirred separately at a water–cement ratio of 0.25. During preparation, the replication master was first placed at the bottom of a silicone mold. Prior to pouring, a diluted release agent was applied to the master’s joint surface. The high-strength sulfoaluminate rapid-setting cement slurry was then poured into the mold. After cooling and setting, the specimen was removed and separated to obtain the upper joint. Similarly, using the other half of the replication master as the base, high-strength self-compacting concrete slurry was poured using the same method to obtain the lower joint. Ultimately, using the silicone mold and the two-stage pouring process, concrete joint specimens with consistent morphology were produced (see Figure 1 for the preparation process). After 28 days of standard curing, the specimens were used for direct shear tests (see Figure 2).
Figure 1.
Concrete joints specimen preparation process.
Figure 2.
Concrete joint specimens with identical morphology.
After standard curing, the basic mechanical properties of the two materials were tested; the results are shown in Table 1. Following the recommended methods of the International Society for Rock Mechanics (ISRM) and relevant rock mechanics testing standards, the specimens were prepared as standard cylinders, with dimensions of Φ50 mm × H100 mm. The end faces were ground flat to ensure that the upper and lower load-bearing surfaces were level and parallel, thereby meeting the requirements for uniform loading in mechanical testing. In Table 1, σc represents uniaxial compressive strength, E represents the elastic modulus, Rt represents tensile strength, and μ represents Poisson’s ratio; φ and c are the interfacial strength parameters obtained through regression based on the corresponding strength envelope relationships.
Table 1.
Fundamental mechanical properties of concrete specimens.
2.2. Acquisition of Joint Appearance Parameters
Once the concrete joints were fabricated, the surface of the node was scanned using a Tianyuan OKIO-400 3D topography scanner (Beijing Tianyuan 3D Technology Co., Ltd., Beijing, China) [39]. This scanner employs a global error control module to maintain scanning accuracy, achieving an average of 0.02–0.03 mm, a point spacing of 0.15–0.31 mm, and a maximum scanning area of 400 mm × 300 mm. A Tianyuan OKIO-400 3D scanner was used to scan rock joint surfaces, capturing their topography and extracting 3D coordinate data for the cross-sectional lines. Figure 3a displays the scanner data and the results of the joint surface scanning. The method for setting the joint profile lines is as follows: First, select a profile line passing through the center of the irregular joint surface, then rotate it clockwise around the center to form additional profile lines. The angle between adjacent profile lines was 10°, and a total of 18 profile lines were set, as shown in Figure 3b.
Figure 3.
OKIO-400 scanner, joint surfaces, and section line selection: (a) OKIO-400 scanner (left) and joint surfaces (right); and (b) schematic diagram of section line selection.
Exported point cloud data allowed for calculation of the root mean square slope Z2j of the j-th section line [40]. The formula for calculating Z2j is as follows:
In the formula, Zi denotes the height (mm) of the i-th sampling point on the section line, where i is the point’s serial number; m is the total sampling points; and Δx is the sampling interval (mm). Substitute Z2j of each section line into the formula [40,41] to calculate the joint roughness coefficient (JRCj):
JRCj represents the roughness coefficient of the j-th section profile. The overall JRC is the average of all contour lines on the joint surface, indicating the joint’s roughness coefficient based on its three-dimensional morphology [42]. After calculation, the JRC value of the sample structural plane used in this paper is 13.69.
2.3. Experimental Facilities
The freeze–thaw cycle experiment was conducted using a rock material pressure and freeze–thaw test system (as shown in Figure 4), with temperature control via a compressor. The temperature range was −40 °C to 100 °C; the maximum axial pressure of the specimen was 50 MPa.
Figure 4.
Rock material pressure freeze–thaw test system.
The RDS-200 rock direct shear apparatus [39], developed by GCTS Company, Tempe, AZ, USA, was employed for concrete joint shear tests, as illustrated in Figure 5. This device utilizes an electro–hydraulic servo control system and can conduct shear tests under both CNL and CNS conditions. The shear actuator has a maximum load capacity of 10 t and the standard actuator’s maximum load is 5 t, with a measurement accuracy of 0.01 KN. The maximum shear and normal strokes are 25 mm and 24 mm, respectively, both with an accuracy of 0.001 mm.
Figure 5.
RDS-200 direct shear system and shear box three-view diagram: (a) RDS-200 rock direct shear system, 1—norm actuator; 2—shear actuator; 3—upper shear box; 4—lower shear box; 5—upper shear ring; 6—spacer; 7—lower shear ring; and (b) three-view drawing of shear box, 1—shear ring; 2—shear load; 3—normal load; 4—indenter; 5—test specimen; 6—shear box.
2.4. Experimental Scheme
Based on the variables in the experiment, a total of 25 samples were prepared and tested. They were divided into 5 groups, based on the number of freeze–thaw cycles, with 5 samples in each group. Each freeze–thaw cycle corresponded to 5 different normal stress conditions (2, 2.5, 3, 3.5, 4 MPa). The specimen numbering Fx-Ny followed the following rules: F represents the number of freeze–thaw cycles, x indicates the number of freeze–thaw cycles, N represents the normal stress, and y indicates the magnitude of the normal stress, with the unit being MPa. For example, F10-N2 indicates a shear test with a normal stress of 2 MPa after 10 freeze–thaw cycles. The grouped samples were placed in an oven and dried at 100 °C for 24 h until they reached a constant weight. After cooling, the dried samples were weighed and the natural water absorption method was used to immerse them in water for saturation treatment until the sample mass remained unchanged. The samples were removed and the surface moisture dried to measure the mass of the fully saturated samples. The frost resistance test of concrete was conducted in accordance with the “Standard Test Methods for Long-term Performance and Durability of Ordinary Concrete” (GB/T50082-2009 [43]). The Heilongjiang region experiences a cold, continental climate influenced by monsoon patterns, with long, harsh winters and temperatures dropping to an extreme minimum of −44.5 °C, and spring and summer warming up. The concrete of the dam body is subjected to significant freeze–thaw cycles throughout the year. To simulate this engineering background, the temperature range for the freeze–thaw cycle test was set to −20 °C to 20 °C. The number of freeze–thaw cycles set was 0, 5, 10, 20, and 30, with each freeze–thaw cycle lasting 12–14 h. The freezing process takes 8–10 h, and the melting process takes 3–4 h. Once the target number of freeze–thaw cycles was achieved, shear tests were performed under normal stress conditions. Normal stresses were set at 2, 2.5, 3, 3.5, and 4 MPa for each set of joint specimens. Normal loading was applied using a stress-control method at 1 MPa/min, while tangential loading was carried out via a displacement control method at 1 mm/min. The shear testing procedure involves first applying the normal stress at a rate of 1 MPa/min to reach the desired level. Then, with the normal stress maintained, shear loading is performed at a shear rate of 1 mm/min until the shear displacement reaches 8 mm, at which point the shear test ends. Data were recorded promptly throughout the process. The experimental protocol flowchart is shown in Figure 6.
Figure 6.
Research methodology flowchart.
3. Results of Direct Shear Tests
Through direct shear tests conducted with varying counts of freeze–thaw cycles and normal stresses, a comprehensive shear stress-displacement curve for the structural plane was developed. The curve demonstrates a typical four-stage progression, commencing with a compaction phase, followed by an approximately linear elastic segment, a post-peak softening phase, and ultimately a residual stable stage. This pattern is consistent with existing scholarly research on direct shear tests of freeze–thaw interfaces [29,44,45], corroborating that a “near-linear before the peak, post-peak softening, residual plateau” [36,46] constitutes a common response mode for such damaged interfaces.
Figure 7 displays the shear stress–shear displacement curves for heterogeneous concrete subjected to various freeze–thaw cycle counts.
Figure 7.
Shear stress–shear displacement curve of heterogeneous concrete subjected to various freeze–thaw cycles.
Figure 8 presents the shear stress–shear displacement curves of heterogeneous concrete subjected to various normal stresses.
Figure 8.
Shear stress–shear displacement curve of heterogeneous concrete under different normal stresses.
4. Analysis of Experimental Results
4.1. Peak Shear Strength
The variation pattern of the peak shear strength of heterogeneous concrete structural planes under different freeze–thaw cycle counts and normal stresses is depicted in Figure 9. With increasing freeze–thaw cycles, the peak shear strength of hetero-concrete structural planes exhibits significant attenuation, as verified under various normal stress conditions. The test results show that after 5, 10, 20, and 30 freeze–thaw cycles, the average decrease in peak shear strength is 11.5%, 22%, 35.9%, and 44.4%, respectively, indicating that freeze–thaw damage significantly affects the peak failure stage of structural planes. As shown in Figure 9a, the peak shear strength exhibits an exponential relationship with the number of freeze–thaw cycles, with a correlation coefficient of 0.9879. The strength declines swiftly at the onset of the freeze–thaw cycles. The mean reduction in peak shear strength over the initial 10 freeze–thaw cycles is approximately 22%, signifying that repeated phase transitions of water within the pores and the concentrated frost-heaving stress during the initial cycles induce rapid initiation and propagation of microcracks; this process subsequently diminishes the abrasive and occlusive effects of rough peaks, as the freeze–thaw cycles progress, the rate of decrease in peak shear strength gradually decelerates. Over the last 20 freeze–thaw cycles, the average decrease in strength per 10 cycles is approximately 14.3%, indicating that internal damage gradually stabilizes, undamaged areas gradually bear the load, and the material’s damage-tolerance mechanism begins to take effect.
Figure 9.
Relationship between peak shear strength and the times of freeze–thaw cycles and normal stress. (a) Relationship between peak shear strength and the times of freeze–thaw cycles; (b) Relationship between peak shear strength and the normal stress.
As shown in Figure 9b, the peak shear strength curves under different normal stresses gradually level off as the number of freeze–thaw cycles increases, reflecting the overall trend that the internal friction angle at the interface decreases with freeze–thaw damage. Additionally, normal stress has a certain inhibiting effect on freeze–thaw damage, as evidenced by the fact that, for the same number of freeze–thaw cycles, higher normal stress results in higher peak shear strength; however, as freeze–thaw damage becomes more severe, this strengthening effect diminishes significantly.
4.2. Residual Shear Strength
Residual shear strength pertains to the mean shear stress level of the horizontal asymptote associated with the stable slip condition attained during the post-peak phase of the shear stress-displacement curve in direct shear testing. It indicates the shear resistance solely attributable to friction following the macroscopic failure of the structural plane. Figure 10 depicts the pattern of variation in residual shear strength of heterogeneous concrete structural planes under varying numbers of freeze–thaw cycles and normal stresses.
Figure 10.
Relationship between residual shear strength and the times of freeze–thaw cycles and normal stress. (a) Relationship between residual shear strength and the times of freeze–thaw cycles; (b) Relationship between residual shear strength and the normal stress.
As demonstrated in Figure 10a, residual shear strength exhibits an exponential relationship with the number of freeze–thaw cycles, with a correlation coefficient of 0.9427. The residual shear strength of the structural plane, under the effect of freeze–thaw cycles, exhibits a continuous downward trend overall, with relatively smooth variations. The test results show that after undergoing 5, 10, 20, and 30 freeze–thaw cycles, the decrease in residual shear strength is 14.5%, 22.3%, 29%, and 38.5%, respectively. The freeze–thaw cycle gradually loosens the surface layer of the weak side material and induces the propagation of microcracks, making it easier for the interface micro protrusions to be crushed, worn, and peeled off during the shear process. At the same time, the increase in pore connectivity and the decrease in surface degradation reduce the effective rough interlocking effect at the interface, resulting in a continuous weakening of the frictional impedance in the post-peak stage. Therefore, residual strength declines as the freeze–thaw cycles increase. On heterogeneous concrete structural surfaces, differences in stiffness and frost resistance between the materials on both sides further exacerbate this degradation process.
Meanwhile, in Figure 10b, the phenomenon closely resembles that observed in the peak shear strength curve. The residual shear strength curve also exhibits a gradual deceleration as the number of freeze–thaw cycles increase. The increase in normal stress enhances residual shear strength; however, this effect diminishes markedly with increasing numbers of freeze–thaw cycles. From the morphological evolution of the shear stress-displacement curve, it is evident that as the number of freeze–thaw cycles advances, the residual shear strength plateau on the shear stress-displacement curve gradually shifts downward, signifying that the freeze–thaw process diminishes interfacial bonding, leading to a more rapid transition of the structural plane to a force mechanism primarily governed by friction failure.
4.3. Pre-Peak Shear Stiffness
The gradient of the approximate straight-line segment preceding the peak in the shear stress-displacement curve signifies the pre-peak shear stiffness [47], a parameter indicative of the joints’ capacity to withstand shear deformation. Due to the consistent surface roughness of the specimens, their initial pre-peak shear stiffness is mainly controlled by the material’s mechanical properties and the normal stress.
Figure 11 illustrates the variation in pre-peak shear stiffness of heterogeneous concrete structural planes under different freeze–thaw cycle times and normal stresses. As shown in Figure 11a, the pre-peak shear stiffness is exponentially related to the number of freeze–thaw cycles, with a correlation coefficient of 0.8685. The freeze–thaw cycle has a significant detrimental effect on stiffness: after 5, 10, 20, and 30 freeze–thaw cycles, the average pre-peak shear stiffness decreases by 15.7%, 20.6%, 26.1%, and 31.7%, respectively. This degradation follows a “fast initially and then slow” pattern, mainly due to the phase change of pore water during the initial freeze–thaw cycle, which loosens the mortar structure and rapidly forms a microcrack network, resulting in a decrease in overall stiffness, whereas the freeze–thaw cycle continues, the undamaged concrete matrix gradually becomes the main component resisting deformation, and the rate of stiffness decay also slows down, accordingly.
Figure 11.
Relationship between pre-peak shear stiffness and the times of freeze–thaw cycles and normal stress. (a) Relationship between pre-peak shear stiffness and the times of freeze–thaw cycles; (b) Relationship between pre-peak shear stiffness and the normal stress.
From Figure 11b, it can be observed that the shear stiffness before the peak increases as the normal stress increases stress, indicating that normal compaction promotes the fitting of structural planes and improves contact stiffness; however, as the number of freeze–thaw cycles increases, the pre-peak shear stiffness curves for each group move downward as a whole, indicating that freeze–thaw damage weakens the shear deformation resistance of structural planes. At the same time, the curves for different freeze–thaw cycles are denser in the high normal-stress range, indicating that higher normal stress mitigates freeze–thaw degradation.
4.4. Porosity Change Analysis
To quantitatively evaluate the impact of freeze–thaw cycles on the internal pore structure of heterogeneous concrete specimens, this study is based on the fundamental principles of the saturated water-absorption method. By measuring the dry mass and saturated masses, the change in porosity of the specimens is deduced. The formula for calculating porosity is as follows:
The formula is as follows: η represents porosity (%); ms represents saturated mass (g); md represents mass after drying to constant weight (g); ρw represents water density (taken as 1.0 g/cm3); and V represents specimen volume (cm3).
During the freeze–thaw cycle, pore water repeatedly freezes and thaws, expanding internal microcracks and increasing pore connectivity, thereby enhancing the water-holding capacity of the specimen. Due to differences in the preparation and curing processes of the specimens, the initial porosity of each group is not fully consistent. If the porosity after freeze–thaw is used directly for analysis, non-monotonic behavior is prone to occur, making it difficult to accurately reflect the evolution of freeze–thaw damage. Therefore, this paper introduces the increment in porosity as an indicator to characterize the degree of freeze–thaw damage:
In the formula: ∆ηN represents the increment in porosity after undergoing N freeze–thaw cycles, whereas ηN denotes the porosity after the freeze–thaw cycles. η0 signifies the porosity before the freeze–thaw cycles, and N represents the number of cycles after the freeze–thaw (in units of time).
The mass parameters of the specimens subjected to various freeze–thaw cycles, along with the computed porosity and porosity increment, are presented in Table 2.
Table 2.
Porosity variation of heterogeneous concrete under freeze–thaw cycles.
As shown in Figure 12, the increase in porosity follows a growth pattern of “initially rapid and then slowing down, tending towards stability” as the number of freeze–thaw cycles increase. In the early stages of freeze-thaw, the frost heave pressure caused by the phase-change expansion of pore water promotes the rapid initiation of microcracks and their connection to primary pores, leading to a rapid increase in open pores. As the freeze–thaw cycle continues, the internal fracture network of the specimen gradually develops and tends towards stability. The expansion effect of new fractures on the pore space gradually weakens, resulting in a change in the porosity increment curve characterized by a gradual slowdown in growth rate and eventual stabilization. The evolution law of this pore structure, which increases rapidly and then gradually with the freeze–thaw process, is consistent with the conclusions about the development of concrete pore structure in existing studies on freeze–thaw damage [48,49].
Figure 12.
Change pattern of porosity increment with the number of freeze–thaw cycles under freeze–thaw cycles.
The experimental results indicate that the increase in porosity exhibits an evolutionary pattern, initially rapid and then slowing, as the number of freeze–thaw cycles increase. The relationship between the increment of porosity and the number of freeze–thaw cycles can be characterized by a logarithmic function:
In the formula, ∆η represents the increase in porosity (%), where a denotes the amplitude coefficient of porosity increment; b signifies the growth rate; and N stands for the number of freeze–thaw cycles (times).
Regression results: a = 0.6057, b = 7.0552.
Substitute the parameters into Equation (5) and perform inversion to obtain:
As shown in Figure 13, the fitted porosity increment values from Equation (6) are extremely close to the experimental results, with the data points concentrated near the y = x line; the correlation coefficient is 0.9955. This indicates that the model possesses good predictive ability and reliability.
Figure 13.
Comparison of fitting and experimental values of porosity increment.
Figure 14 illustrates the surface damage morphology of the specimens after different freeze–thaw cycles (0, 5, 10, 20, and 30 cycles in sequence). As shown in the figure, as the number of freeze–thaw cycles increase, the number of surface cracks on the specimens gradually increases, and their lengths increase as well. The freeze–thaw cracks are mainly concentrated on the side of the sulfoaluminate rapid-setting concrete, while there is no obvious cracking on the side of the self-compacting concrete, indicating a significant difference in the anti-freeze damage response of the materials on both sides. Based on relevant studies [50,51], it is known that the pore structure characteristics of sulfoaluminate-based rapid-hardening systems are closely related to their early hydration process, water-to-cement ratio, and the state of free water under low-temperature or freeze–thaw conditions. If the material contains a significant amount of water susceptible to freezing or sensitive pores, freeze–thaw cycles are more likely to cause deterioration of the pore structure and the propagation of microcracks. Therefore, this paper posits that rapid-hardening concrete may be more prone to forming pore structures sensitive to freeze–thaw cycles under rapid-hardening conditions and may be more susceptible to stress concentration and crack propagation during saturated freeze–thaw cycles. In contrast, self-compacting concrete powder has a more optimized gradation, a relatively dense matrix structure, fewer open pores, and a certain degree of suppression of water infiltration and freezing expansion, thereby exhibiting stronger resistance to freeze–thaw cracking. It should be noted that the above analysis is mainly based on reasonable explanations of macroscopic damage morphology and material characteristics, and is not empirical evidence directly obtained in this paper; the relevant microscopic mechanisms still need to be further verified by combining SEM, MIP, CT, and other tests.
Figure 14.
Surface damage morphology of samples under different freeze–thaw cycle numbers.
5. Construction of a Shear Constitutive Model for Heterogeneous Concrete Structural Surface Under Freeze–Thaw Damage
5.1. Mohr–Coulomb Criterion for Peak Shear Strength Considering Freeze–Thaw Cycles
Existing research has shown that at lower normal stress levels, the peak shear strength of various rock–soil interfaces still approximately follows a linear relationship with normal stress; their strength envelopes can be well described by the Mohr–Coulomb criterion [27,29,31,52]. The environmental effects of freeze–thaw, dryness, and wetness primarily alter the size of interfacial cohesion and friction angle, but do not significantly change the overall shape of the damaged envelope. Therefore, a large number of freeze–thaw interfacial shear tests were conducted to fit the τ-σₙ line at different freeze–thaw cycles—the degradation relationship between c(N) and φ(N) was established based on this [7,43,53]. In this experiment, the data of τp–σₙ under various freeze–thaw conditions also showed a good linear correlation, indicating that the peak strength of heterogeneous concrete structural surfaces can still be considered to meet the Mohr–Coulomb criterion within the normal stress range of 2–4 MPa.
Based on the above understanding, this article introduces the freeze–thaw cycle number N as the freeze–thaw degradation index on the basis of the traditional Mohr–Coulomb criterion:
In the formula: τp represents the peak shear strength (MPa); C(N) denotes the equivalent cohesive force (MPa); φ(N) signifies the equivalent internal friction angle (°); σn indicates the normal stress (MPa); and N corresponds to the number of freeze–thaw cycles (times).
Using Equation (7) to uniformly characterize the peak shear strength: on the one hand, maintaining the basic form of a linear increase in peak shear strength with normal stress ensures compatibility with the strength index system widely used in engineering. Conversely, the impact of freeze–thaw action on the interface roughness, aggregate bite, and microcrack propagation is equivalent to an exponential decay of the friction term, reducing the number of model parameters and clarifying their physical meanings, making it easier to compare with existing research results on different materials and working conditions [28,29,32,35].
With the same number of freeze–thaw cycles, linear least squares regression was performed on all experimental points to obtain:
The regression results are shown in Figure 15.
Figure 15.
Mohr–Coulomb parameter regression results of peak shear strength under freeze–thaw cycles.
As shown in Figure 15, the peak internal friction angle decreases significantly with the number of freeze–thaw cycles, while cohesion fluctuates within a certain range. Statistical analysis of cohesion values across various freeze–thaw cycles yielded a coefficient of variation of 4.99%, which is less than 10% [54]; this indicates that the number of freeze–thaw cycles has no significant effect on peak cohesion. Therefore, freeze–thaw cycles primarily destroy the microscopic biting and rough peaks at the interface, significantly weakening the friction term, which is consistent with existing studies on freeze–thaw interfaces [35,36,55]. As shown in Figure 9a, the peak shear strength drops quickly during the initial stages and then levels off as the number of freeze–thaw cycles grows. This pattern aligns with the development of rough convex damage on structural planes, the slow growth of microcracks, the ongoing reduction in the particle bite effect, and eventual saturation due to freeze–thaw cycles. Therefore, this article uses an exponential degradation function to fit φ (N):
In the formula, φ0 is the peak internal friction angle (°) before freeze–thaw, where a is the freeze–thaw degradation coefficient and N is the number of freeze–thaw cycles (times).
From the experimental regression at N = 0, φ0 = 47.48°, substituting φ0 into Equation (9), and by performing nonlinear least squares regression on all experimental data, the study obtained the following:
Simultaneously, take C (N) ≈ C0. Therefore:
Substituting Equations (10) and (11) into Equation (7) yields the final degradation formula for peak shear strength:
The fitting results indicate that Equation (7) accurately reproduces the test peak intensity across various operating conditions, demonstrating that the M–C expression remains applicable and has promotional value under freeze–thaw damage conditions.
As illustrated in Figure 16, the peak shear strength fitting value obtained from Equation (12) is highly consistent with the experimental value; the data points are closely distributed around the y = x baseline and the correlation coefficient is 0.9946, indicating that the model has reliable predictive performance accuracy.
Figure 16.
Comparison between peak shear strength fitting values and experimental values.
5.2. Mohr–Coulomb Criterion for Residual Shear Strength Considering Freeze–Thaw Cycles
This article defines residual strength as the shear stress at the horizontal asymptote of the post-peak deformation curve. This unified criterion can significantly improve the comparability and fitting quality of residual segments, which has been one of the recommended practices for interface freeze–thaw shear research in recent years [42,56].
The shear strength in the residual stage still approximately satisfies the Mohr–Coulomb criterion:
In the equation, τr(N, σn) is the residual shear strength (MPa); cr(N) is the equivalent residual cohesive strength at the interface after N freeze–thaw cycles (MPa); φr(N) is the equivalent residual internal friction angle at the interface after N freeze–thaw cycles (°); σn is the normal stress (MPa); and N is the number of freeze–thaw cycles (times).
The regression results are presented in Figure 17.
Figure 17.
Mohr–Coulomb parameter regression results of residual shear strength under freeze–thaw cycles.
As illustrated in Figure 16, the residual internal friction angle typically diminishes as the number of freeze–thaw cycles increases, with the rate of decline gradually decreasing. The residual cohesion fluctuates within a certain range and does not show a significant monotonic degradation trend. Statistical analysis of the cohesion values under each freeze–thaw cycle shows a coefficient of variation of 4.32%, which is less than 10% [54]. This indicates that in the macroscopic slip stage, the contribution of bonding components to residual strength is relatively limited and less affected by freeze–thaw. This phenomenon is consistent with the analysis in Section 4.2, which indicates that residual strength primarily depends on interfacial friction.
Based on this, when establishing the residual shear strength degradation model in this article, the residual cohesive force is approximated as a constant and the residual internal friction angle is fitted with an exponential function to reflect its progressive degradation with increasing freeze–thaw cycles:
In the formula, φr0 is the residual internal friction angle before freeze–thaw (°); ar is the freeze–thaw degradation coefficient; and N is the number of freeze–thaw cycles (times).
Regression results: cr = 1.57 MPa, φr0 = 30.80°, ar = 0.036.
Substituting Equation (13) yields the final degradation formula for residual shear strength:
As shown in Figure 18, the fitted value of Equation (15) for residual shear strength is in good agreement with the experimental value. The data points cluster around the y = x line, the prediction accuracy is high, and the correlation coefficient is 0.96, indicating that the model can be used to effectively predict residual shear strength.
Figure 18.
Comparison between residual shear strength fitting values and experimental values.
5.3. Expression of Pre-Peak Shear Stiffness Considering Freeze–Thaw Cycles
The pre-peak shear stiffness is characterized as the gradient of the approximately linear segment of the curve:
In the formula, Ks is the pre-peak shear stiffness (MPa/mm); ∆τ is the relative shear strength (MPa); and ∆d is the relative shear displacement (mm).
Based on experimental data, it is observed that, under identical numbers of freeze–thaw cycles, the pre-peak shear stiffness exhibits an overall increasing trend as the normal stress escalates. Additionally, under constant normal stress, an increase in the number of freeze–thaw cycles results in a decay pattern characterized by an initial rapid decrease followed by a slower decline, ultimately approaching stabilization at higher cycle counts.
Considering that freeze–thaw damage will alter the contact closure and interlocking effects of structural surfaces, causing the effect of normal stress on enhancing stiffness to vary with the degree of freeze–thaw, this paper adopts a coupled model that includes both normal stress and freeze–thaw degradation terms to fit the pre-peak shear stiffness. The expression is as follows:
In the formula, Ks(N, σn) is the pre-peak shear stiffness (MPa/mm); A is the baseline of pre-peak shear stiffness in the initial state; B is the freeze–thaw damage coefficient; C is the normal stress coefficient; σn is the normal stress (MPa); and N is the number of freeze–thaw cycles (times).
Fitting all data using the least squares method yields:
Substituting the parameters into Equation (17), the final form of the pre-peak shear stiffness degradation model can be obtained:
Figure 19 compares the experimental pre-peak shear stiffness values with the fitted values from Equation (19). The data points are uniformly dispersed along the line y = x, and the correlation coefficient is 0.9223, indicating that the predictive performance of this equation is good, with an average relative error of only 3.66%, which can be used to estimate the pre-peak shear stiffness.
Figure 19.
Comparison between pre-peak shear stiffness fitting values and experimental values.
5.4. The Relationship Between Porosity Increment and Peak Shear Strength, Residual Shear Strength, and Pre-Peak Shear Stiffness
After substituting Equation (6) into Equations (12), (15), and (19), the expressions for peak shear strength, residual shear strength, and pre-peak shear stiffness based on porosity increment are obtained:
The porosity increment characterizes the overall freeze–thaw damage of the specimen rather than the mesoscopic parameters of the local failure zone at the interface. Therefore, the relationships established in Equations (20)–(22) are empirical correlations between the increment of porosity and the macroscopic shear parameters; their physical significance is to indirectly reflect the influence of freeze–thaw damage on the interface strength and stiffness through the evolution of the overall pore structure.
Figure 20 compares fitted and experimental values of peak shear strength, residual shear strength, and pre-peak shear stiffness expressed as functions of the porosity increment. As shown in the figure, all predicted data points are closely distributed near the y = x baseline, with correlation coefficients of 0.9807, 0.9366, and 0.9144, respectively, indicating high prediction accuracy. The corresponding average relative errors are 3.67%, 4.77%, and 3.93%, further confirming that the model can effectively predict the macroscopic mechanical performance degradation of heterogeneous concrete structural surfaces under freeze–thaw action through the micro-damage variable of pore-structure evolution. This offers a theoretical foundation and a practical method for assessing the shear performance of interfaces from a microscopic damage-mechanism perspective.
Figure 20.
Comparison between fitting values and experimental values of peak shear strength, residual shear strength, and pre-peak shear stiffness expressions based on porosity increment.
6. Four-Stage Segmented Shear Constitutive Model for Freeze–Thaw Damage
To describe the shear response of heterogeneous concrete structural surfaces under various freeze–thaw cycles and normal stress conditions within a unified framework, this paper presents a four-stage segmented shear constitutive model for freeze–thaw damage, based on degradation models, peak shear strength, pre-peak shear stiffness, and residual shear strength. According to the characteristics of the shear stress shear displacement curve, the shear process is divided into four stages: compaction stage, near-line elastic stage, post-peak softening stage, and residual stage, as shown in Figure 21.
Figure 21.
Schematic diagram of the four-stage division of the shear stress displacement process under freeze–thaw damage.
Where dc denotes the shear displacement at the end of the compaction stage; τc represents the shear stress at the end of the compaction stage; dp indicates the shear displacement at the peak shear stress; τp corresponds to the peak shear stress; ds signifies the shear displacement at the end of the softening stage; and τs denotes the shear stress at the end of the softening stage.
Under a fixed normal stress, the peak shear displacement associated with each freeze–thaw cycle shows a degree of random dispersion and does not follow a stable monotonic trend with increasing freeze–thaw cycles. Given that the characteristic displacement points of the direct shear curve are sensitive to the initial fit, local occlusion failure and peak point identification, and that the method of average value characterization of shear characteristic parameters is used in related studies, this paper uses the statistical mean of peak displacements under different freeze–thaw conditions at each normal stress level as the typical peak displacement for dimensionless and constitutive parameter calibration [57,58]; the freeze–thaw effect is primarily observed in the degradation of peak strength, pre-peak stiffness, and residual strength.
Using the peak shear displacement as the characteristic displacement, the dimensionless displacement ratio is introduced, as follows:
To make the compaction and post-peak softening sections smoother, two shape-control parameters are introduced: αc, the compaction curvature parameter, and βs, the softening attenuation parameter. These parameters are obtained by nonlinear least-squares regression of the corresponding segments of the experimental curve.
According to the statistics of all experimental curves, it can be seen that:
Under any number of freeze–thaw cycles and normal stress conditions, the four-stage segmented shear constitutive model can be expressed as:
In the above Equation (24), τc = τp − Ks(dp − dc), and by substituting λcave, λsave, αc, and βs, the final constitutive model is obtained, as follows:
Among these, τp is given by Equation (12), τr is given by Equation (15), and Ks is given by Equation (19).
Due to space constraints within the article, this study evaluates the reliability of the developed constitutive model by comparing the predicted results under selected operational conditions with empirical data, as depicted in Figure 22. The figure demonstrates that, under the specified representative conditions, the model’s predicted curves closely align with the experimental data, with correlation coefficients of 0.972, 0.962, 0.940, and 0.962, respectively. This indicates that the model reliably characterizes the shear mechanical behavior of heterogeneous concrete structural surfaces following freeze–thaw cycle damage.
Figure 22.
Comparison between predicted and experimental values of shear stress and shear displacement under different operating conditions.
Since Figure 22 only displays the comparison between the predicted and test curves under specific operational conditions, a more detailed evaluation of the model’s prediction accuracy is necessary. Therefore, additional statistical analysis was performed on all 25 sets of working conditions, including a total of 11,934 ‘test value-predicted value’ points. The overall MAE of the model is 0.199 MPa, the RMSE is 0.304 MPa, the MAPE is 10.37%, and the R2 is 0.920. MAE represents the mean absolute error; RMSE denotes the root mean square error; MAPE is the mean absolute percentage error; and R2 is the coefficient of determination. From the statistical results of the whole working conditions, the constructed model can not only better reflect the overall evolution trend of the shear stress-displacement process of the heterogeneous concrete structural plane, but also show a stable prediction ability under different freeze–thaw cycles and normal stress conditions, indicating that the model has good fitting accuracy and engineering applicability.
7. Conclusions and Discussion
The freeze–thaw cycle exerts a significant macroscopic influence on the shear performance of heterogeneous concrete structural planes. As the number of freeze–thaw cycles increases, the peak shear strength, pre-peak shear stiffness, and residual shear strength of structural planes all show a continuous downward trend, with decreases of 11.5% to 44.4%, 15.7% to 31.7%, and 14.5% to 38.5%, respectively. At the same time, the freeze–thaw cycle promotes a gradual increase in the sample’s porosity, with an increase of approximately 2.09% to 3.16%, and the growth rate decreases.
Normal stress inhibits freeze–thaw damage. Under the same number of freeze–thaw cycles, increasing normal stress can effectively enhance the strength and stiffness of structural planes; however, this strengthening effect gradually weakens with increasing freeze–thaw cycles. Increasing the normal constraint can delay early freeze–thaw damage to some extent; however, long-term service must still be considered alongside the design of antifreeze materials and waterproof measures.
In light of the experimental findings, a range of degradation models was established to encompass the effects of freeze–thaw cycles on peak shear strength, residual shear strength, and pre-peak shear stiffness. In addition, empirical expressions were derived from changes in porosity. The models exhibited strong predictive capability, with correlation coefficients exceeding 0.91, thereby validating their efficacy.
Furthermore, a four-stage piecewise constitutive model capable of fully describing the entire shear stress-displacement process was developed. Verification showed that the model’s predicted curves agreed well with the experimental curves, with R2 ranging from 0.940 to 0.972. The model effectively simulates the full response process of an anisotropic concrete surface following freeze–thaw damage, from compaction, near-linear elasticity, post-peak softening, to residual stability, and particularly reflects the “softening–stabilization” evolution characteristic during plastic failure. This provides a unified theoretical framework for analyzing the mechanism of plastic shear failure in anisotropic concrete surfaces.
In seasonal freezing regions, such as Heilongjiang, freeze–thaw cycles are a key factor in the long-term deterioration of hydraulic structures. The degradation model established in this paper quantitatively characterizes the decay patterns of strength and stiffness in heterogeneous concrete structural surfaces under different freeze–thaw cycle stages. As such, it provides a theoretical basis for assessing the durability of structural surface shear performance, conducting safety analyses over the service life, and selecting relevant design parameters.
The freeze–thaw degradation of heterogeneous concrete structural surfaces is not controlled by interface roughness peak wear, but rather by the combined effect of interface contact degradation and the internal damage of weak side materials. The cracks in Figure 14 were concentrated on one side of the sufflaminate rapid-setting concrete, indicating that under the condition of the mismatched material strength, pore structure, water absorption characteristics, and frost resistance on both sides, the weak side material damage may have a more significant control effect on the degradation of interfacial shear performance. This conclusion is primarily based on an interpretative analysis of macroscopic failure phenomena and material differences; the underlying microstructural mechanisms still require further verification. This feature is consistent with the overall degradation law observed in previous studies of heterogeneous interfaces under freeze–thaw conditions; however, because the objects of this article are two different concrete materials, the material difference effect is more pronounced. Although normal stress can enhance interface adhesion and the frictional bearing capacity to a certain extent, this inhibitory effect will weaken with the accumulation of freeze–thaw damage, indicating that increasing the normal constraint can only partially alleviate early degradation and that it is difficult to fundamentally offset the adverse effects of material damage development. Overall, the model developed in this paper is better suited for analyzing the plastic failure of heterogeneous concrete interfaces under shear loading, particularly for material combinations, roughness levels, normal stress ranges, and freeze–thaw cycle intervals similar to those in this study. Further validation is required through additional parallel experiments and microstructural testing for interfaces exhibiting stronger brittle failure characteristics and pronounced post-peak drops, as well as for long-term behavior under conditions involving actual construction joints, higher freeze–thaw cycle levels, and complex service environments.
Author Contributions
Conceptualization, M.T. and B.G.; methodology, M.T., B.G. and H.Y.; validation, M.T. and C.Z.; formal analysis, M.T. and Y.C.; investigation, C.Z. and H.Y.; resources, B.G.; data curation, M.T., C.Z. and H.Y.; writing—original draft preparation, M.T. and B.G.; writing—review and editing, B.G.; visualization, M.T. and C.Z.; supervision, C.Z., H.Y. and Y.C.; funding acquisition, Y.C. All authors have read and agreed to the published version of the manuscript.
Funding
This study is supported by the fund project of Henan Province: Henan Provincial Science and Technology Research Project (242102321163), Key Scientific Research Project of Higher Education Institutions in Henan Province (24A440004).
Data Availability Statement
The data generated or analyzed during this study are all included in the article. Under reasonable request conditions, the original data can be obtained from the corresponding author.
Acknowledgments
Thank you to Guo Baohua for the guidance and help in the successful completion of the paper. Furthermore, the authors wish to express their sincere appreciation to the reviewers for their invaluable comments and suggestions, which have significantly enhanced the quality of this paper. Additionally, we gratefully acknowledge the financial support provided by the funding agencies listed in the Funding section.
Conflicts of Interest
The authors declare that they have no known competing financial interests or personal relationships that could have appeared to influence the work reported in this paper.
References
- Wang, X.; Fan, Z. Research on “Construction Design of Water Conservancy Dam Engineering Based on Concrete Anti seepage Filling Technology. Sci. Innov. 2025, 14, 95–97. [Google Scholar]
- Zheng, X. Preliminary study on concrete construction technology of reservoir dam of water conservancy project. Res. Urban Constr. Theory 2025, 20, 190–192. [Google Scholar]
- Zhang, D. Discussion on Control Technology of Concrete Cracks in Water Conservancy Construction Engineering. Cement 2025, 7, 146–149. [Google Scholar]
- Xu, Q.; Lu, Y. Effect of Alternate Wetting and Drying on the Long Term Stabiity of Slope. Chin. J. Undergr. Space Eng. 2005, 1, 43–46. [Google Scholar]
- Yi, X. Numerical study on the deterioration law of shear strength of heterogeneous structural planes with different roughness. Gansu Water Resour. Hydropower Technol. 2022, 58, 16–18. [Google Scholar]
- Zhang, B.; Xu, J.; Shi, X.; Huang, X.; Xu, D. Study on shear performance of loess-mudstone weak structural plane under different water content. Water Conserv. Plan. Des. 2024, 12, 120–125. [Google Scholar]
- Shen, Y.; Wang, Y.; Yang, Y.; Sun, Q.; Luo, T.; Zhang, H. Influence of surface roughness and hydrophilicity on bonding strength of concrete-rock interface. Constr. Build. Mater. 2019, 213, 156–166. [Google Scholar] [CrossRef] [Scilit]
- Zhao, Y.; Zhang, M.; Tang, W.; Wu, Q.; Luo, R.; Li, T.; Luo, X.; Liu, Z. Mechanical properties and strength prediction model of anchored rock-mortar structural plane under triaxial compression. J. China Coal Soc. 2025, 50, 5313–5328. [Google Scholar]
- Zhang, Z.; Huang, M.; Tang, Z. Peak Shear Strength Criterion for Discontinuities with Different Rock Types Based on Revisiting Frictional Angle. Earth Sci. 2024, 49, 2826–2838. [Google Scholar]
- Liu, Y.; Luo, Y.; Sun, B.; Yan, X. Experimental study on shear characteristics of heterogeneous structural plane. Min. Res. Dev. 2024, 44, 87–93. [Google Scholar]
- Pan, Y.; Wang, B.; Zhang, Z.; Wang, Q. Analysis on mechanical properties of thawing soil-concrete interface. J. Henan Polytechinc Univ. (Nat. Sci.) 2022, 41, 167–173. [Google Scholar]
- Liu, J.; Cui, Y.; Wang, P.; Lv, P. Design and validation of a new dynamic direct shear apparatus for frozen soil. Cold Regions Sci. Technol. 2014, 106–107, 207–215. [Google Scholar] [CrossRef] [Scilit]
- Sun, H.; Yang, P.; Wang, G. Monotonic shear mechanical characteristics and affecting factors of interface layersbetween frozen soil and structure. Trans. Chin. Soc. Agric. Eng. 2015, 31, 57–62. [Google Scholar]
- Sun, W.; Wu, A.; Hou, K.; Yang, L.; Liu, L.; Wen, Y. Real-time observation of meso-fracture process in backfill body during mine subsidence using X-ray CT under uniaxial compressive conditions. Constr. Build. Mater. 2016, 113, 153–162. [Google Scholar] [CrossRef] [Scilit]
- Zhang, Y.; Lai, C.; Lei, D.; Liu, B.; Zhou, X. Improvement and Verification of Shear Strength Criterion for Non-Persistent Jointed Rock Mass Under Freeze-Thaw Cycles. Min. Res. Dev. 2025, 45, 146–157. [Google Scholar]
- Shi, Z.; Zhu, X.; Liu, M.; He, G.; Xia, Z. Research on Shear Resistance of Rooted Soil under Freeze-Thaw CyclesBased on DEM. Earth Sci. 2025, 50, 3761–3775. [Google Scholar]
- Liang, C.; Zhang, Y.; Ding, J.; Liu, H. Experimental Study on the Effects of Freeze-Thaw Cycles on the Shear Properties of Fly Ash-Amended Soil. J. Changchun Inst. Technol. (Nat. Sci. Ed.) 2025, 26, 7–14. [Google Scholar]
- Liu, Y.; Chen, Z.; Guo, L.; Li, N.; Li, G.; Li, J. Shear characteristics of frozen moraine soil under freeze-thaw cycle. China Sci. Pap. 2023, 18, 166–171+203. [Google Scholar]
- Quan, X.; Gong, Y.; Wang, B.; Zhong, G.; Zhou, S. Experimental study on the shear strength of Qinghai-Tibet clay under freeze-thaw cycles. J. Glaciol. Geocryol. 2023, 45, 1016–1025. [Google Scholar]
- Gu, J.; Ni, J.; Liu, S.; Chen, Y. Shear strength of biopolymer amended soil under freeze-thaw cycles: Experimental investigation and DEM modeling. Eng. Geol. 2025, 353, 108108. [Google Scholar] [CrossRef] [Scilit]
- Hou, Z.; Liu, B.; Yuan, R.; Chen, Y.; Sun, W.; Kuang, C. An experimental study on the shear strength and shear fracture evolution of freeze–thaw granite containing rock bridges based on digital image correlation. Environ. Earth Sci. 2024, 83, 669. [Google Scholar] [CrossRef] [Scilit]
- Han, X.; Hu, Z.; Li, H.; Yin, Y.; Zhang, B.; Zhang, L. Study on the mechanical properties and microstructural evolution of loess under different wet[sbnd]dry and freeze[sbnd]thaw coupled cycling paths. Case Stud. Constr. Mater. 2024, 21, e03924. [Google Scholar]
- Liu, Q.; Huang, J.; Zhang, Z.; Liu, G.; Jiang, Q.; Liu, L.; Khan, I. Effect of Freeze–Thaw Cycles on the Shear Strength of Root-Soil Composite. Materials 2024, 17, 285. [Google Scholar] [CrossRef] [Scilit] [PubMed]
- Zhang, S.; Xu, X.; Dong, X.; Lei, H.; Sun, X. Effects of Freeze–Thaw Cycles on the Mechanical Properties and Microstructure of a Dispersed Soil. Appl. Sci. 2023, 13, 9849. [Google Scholar] [CrossRef] [Scilit]
- Xue, L.; Lin, Z.; Jia, L.; Zheng, C.; Yi, X.; Fa, D. Fracture evolution and mechanical deterioration of granite under cyclic thermal and liquid nitrogen cryogenic impact. Phys. Fluids 2025, 37, 086652. [Google Scholar] [CrossRef] [Scilit]
- Teng, T.; Yu, W.; Yu, C.; Yi, L.; Xu, L. Permeability and Energy Evolution of Coal under Unloading Confining Pressure. Int. J. Geomech. 2026, 26, 04025341. [Google Scholar] [CrossRef] [Scilit]
- Wang, B.; Liu, J.; Wang, Q.; Ling, X. Study of meso-damage and macroscopic shear performance of silty clay-concreteinterface under freeze-thaw cycles. Chin. J. Rock Mech. Eng. 2023, 42, 3792–3800. [Google Scholar]
- Guo, K.; Mao, Q.; Zhou, Q.; Wang, S.; Fu, Y. Experimental study on shear mechanics of tower foundation concrete-rockinterface under freeze-thaw cycles. Geotech. Investig. Surv. 2025, 53, 36–42. [Google Scholar]
- Tang, L.; Huang, T.; Wang, W.; Jin, L.; Sun, Q.; Li, G.; Luo, T. Experimental study on shear characteristics and pore structureevolution characteristics of soil-rock mixture concrete interfaceduring freeze-thaw cycles. J. Cent. South Univ. (Sci. Technol.) 2023, 54, 1954–1969. [Google Scholar]
- Deng, L. Study on the variation law of shear strength of rock-concrete composite under freeze-thaw cycle. Water Conserv. Sci. Technol. Econ. 2024, 30, 38–41. [Google Scholar]
- Chou, Y.; Jia, S.; Zhang, Q. Mechanical Model of Unsaturated Loess-Concrete Interface Due to Freeze-Thaw Action. J. Eng. Geol. 2018, 26, 825–834. [Google Scholar]
- Long, Y.; Xiao, D.; Li, X.; Han, S.; Pei, G.; Jiang, J.; Zhang, M. Research on Degradation Law of Mechanical Properties of Granite-Concrete Compositesin Cold Regions. Mod. Min. 2025, 41, 192–199. [Google Scholar]
- Zhang, J.; Chen, Y.; Du, R.; Huang, Z.; Zhao, X. Experimental study and numerical simulation verification of the macro- and micromechanical properties of the sandstone–concrete interface under freeze–thaw cycles. Constr. Build. Mater. 2024, 432, 136584. [Google Scholar] [CrossRef] [Scilit]
- Shen, Y.; Yang, H.; Xi, J.; Yang, Y.; Wang, Y.; Wei, X. A novel shearing fracture morphology method to assess the influence of freeze–thaw actions on concrete–granite interface. Cold Reg. Sci. Technol. 2020, 169, 102900. [Google Scholar] [CrossRef] [Scilit]
- He, P.; Mu, Y.; Yang, Z.; Ma, W.; Dong, J. Freeze-thaw cycling impact on the shear behavior of frozen soil-concrete interface. Cold Reg. Sci. Technol. 2020, 173, 103024. [Google Scholar] [CrossRef] [Scilit]
- Wang, B.; Liu, J.; Wang, Q.; Ling, X.; Pan, J. Influence of freeze-thaw cycles on the shear performance of silty clay-concrete interface. Cold Reg. Sci. Technol. 2024, 219, 104120. [Google Scholar] [CrossRef] [Scilit]
- Pan, J.; Wang, B.; Wang, Q.; Ling, X.; Liu, J. Deformation characteristics of the shear band of silty clay–concrete interface under the influence of freeze–thaw. Cold Reg. Sci. Technol. 2023, 206, 103750. [Google Scholar] [CrossRef] [Scilit]
- Zhang, Z.; Guo, B.; Cheng, S.; Zhong, P.; Zhu, C. Experimental study on shear mechanical properties of concrete jointss under different unloading stress paths. PLoS ONE 2024, 19, e0310694. [Google Scholar]
- Guo, B.; Cheng, T.; Chen, Y.; Jiao, F. The seepage characteristics of marble fracture and the influence of filling sand soil. Shuili Xuebao 2019, 50, 463–474. [Google Scholar]
- Li, Y.; Zhang, Y. Quantitative estimation of joints roughness coefficient using statistical parameters. Int. J. Rock Mech. Min. Sci. 2015, 77, 27–35. [Google Scholar] [CrossRef] [Scilit]
- Yang, Z.; Lo, S.; Di, C. Reassessing the Joint Roughness Coefficient (JRC) Estimation Using Z2. Rock Mech. Rock Eng. 2001, 34, 243–251. [Google Scholar] [CrossRef] [Scilit]
- Cheng, T.; Guo, B.; Sun, J.; Tian, S.; Sun, C. Establishment of constitutive relation of shear deformation forirregular joints in sandstone. Rock Soil Mech. 2022, 43, 51–64. [Google Scholar]
- Leng, F.; Rong, J.; Ding, W.; Tian, G.; Zhou, Y. Introduction of Revised Standard for Test Methods of Longterm Performance and Durability of Ordinary Concrete GB/T 50082-2009. Constr. Technol. 2010, 39, 6–9. [Google Scholar]
- He, P.; Ma, W.; Mu, Y.; Dong, J.; Huang, Y. Experiment study on effects of freeze-thaw cycles on adfreezing strength atfrozen soil-concrete interface. Chin. J. Geotech. Eng. 2020, 42, 299–307. [Google Scholar]
- Wang, B.; Gao, Y.; Wang, Q.; Liu, J. Effect of Freeze-Thaw Cycles on Shear Properties of Seasonal Frozen Soil Area Silty Clay-Concrete Interface. J. Jilin Univ. (Earth Sci. Ed.) 2024, 54, 1592–1603. [Google Scholar]
- Xiong, M.; He, P.; Mu, Y.; Na, X. Modeling of Concrete-Frozen Soil Interface from Direct Shear Test Results. Adv. Civ. Eng. 2021, 2021, 7260598. [Google Scholar] [CrossRef] [Scilit]
- Xie, Q.; Ning, Y.; Wang, J.; Ban, N.; Fu, X. Study on shear mechanical properties of rock-like joints with regular roughness. Xi’an Univ. Arch. Tech. (Nat. Sci. Ed.) 2019, 51, 635–642. [Google Scholar]
- Gan, L.; Zou, Z.; Zhang, Z.; Zhang, H.; Gu, H. Investigation on the evolution of concrete pore structure under freeze-thaw and fatigue loads. J. Build. Eng. 2024, 97, 110914. [Google Scholar] [CrossRef] [Scilit]
- Zhao, N.; Lian, S. Study of Damage Mechanism and Evolution Model of Concrete under Freeze–Thaw Cycles. Appl. Sci. 2024, 14, 7693. [Google Scholar] [CrossRef] [Scilit]
- Jaskulski, R.; Jóźwiak-Niedźwiedzka, D.; Banach, M. Comprehensive Investigation of the Mechanical and Durability Properties of High-Performance Concretes Containing CSA Cement. Appl. Sci. 2025, 15, 13227. [Google Scholar] [CrossRef] [Scilit]
- Zhu, X.; Zhao, R.; Lu, C.; Zhang, Y.; Deng, G. Ultra-early performance and hydration characteristics of sulfoaluminate cement paste under negative temperatures. Mater. Struct. 2025, 58, 233. [Google Scholar] [CrossRef] [Scilit]
- Ghazvinian, A.H.; Taghichian, A.; Hashemi, M.; Mar, S. The Shear Behavior of Bedding Planes of Weakness Between Two Different Rock Types with High Strength Difference. Rock Mech. Rock Eng. 2010, 43, 69–87. [Google Scholar] [CrossRef] [Scilit]
- Shen, Y.; Wei, X.; Yang, G.; Wang, Y.; Jia, H. Freeze-thaw degradation model and experimental analysis ofrock-concrete interface bond strength. Chin. J. Rock Mech. Eng. 2020, 39, 480–490. [Google Scholar]
- Yang, C. Analysis of the Selection of Coefficient of Variation in the Analysis of Rock and Soil Parameters. Sci. Technol. Wind 2019, 2, 111–116. [Google Scholar]
- Wu, F.; Zhao, B.; Cao, J.; Wang, Y.; Li, Q. Investigations on the shear performance degradation of ECC-NC grooved interface under salt freeze-thaw cycles. J. Build. Eng. 2024, 94, 109961. [Google Scholar] [CrossRef] [Scilit]
- Wang, X.; Li, L.; Mu, W.; Yang, T.; Du, Y. Damage characteristics and mechanisms of shear strength at the interface between fiber-reinforced concrete and rock under freeze-thaw cycles. J. Build. Eng. 2024, 98, 111191. [Google Scholar] [CrossRef] [Scilit]
- Guo, B.; Cheng, T.; Sun, J.; Tian, S.; Chen, Y. Evolution of Peak Shear Strength of Rock Fractures Under Conditions of Repetitive Dry and Wet Cycling. Front. Earth Sci. 2022, 10, 848440. [Google Scholar] [CrossRef] [Scilit]
- Xie, S.; Lin, H.; Chen, Y.; Wang, Y.; Cao, R. Statistical Damage Shear Constitutive Model of Rock Jointss Under Seepage Pressure. Front. Earth Sci. 2020, 8, 32. [Google Scholar] [CrossRef] [Scilit]
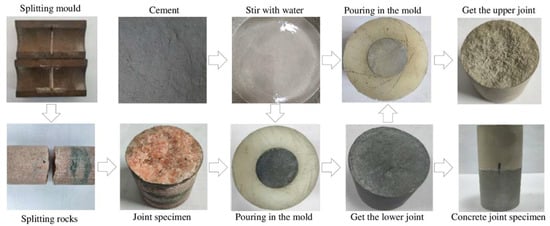
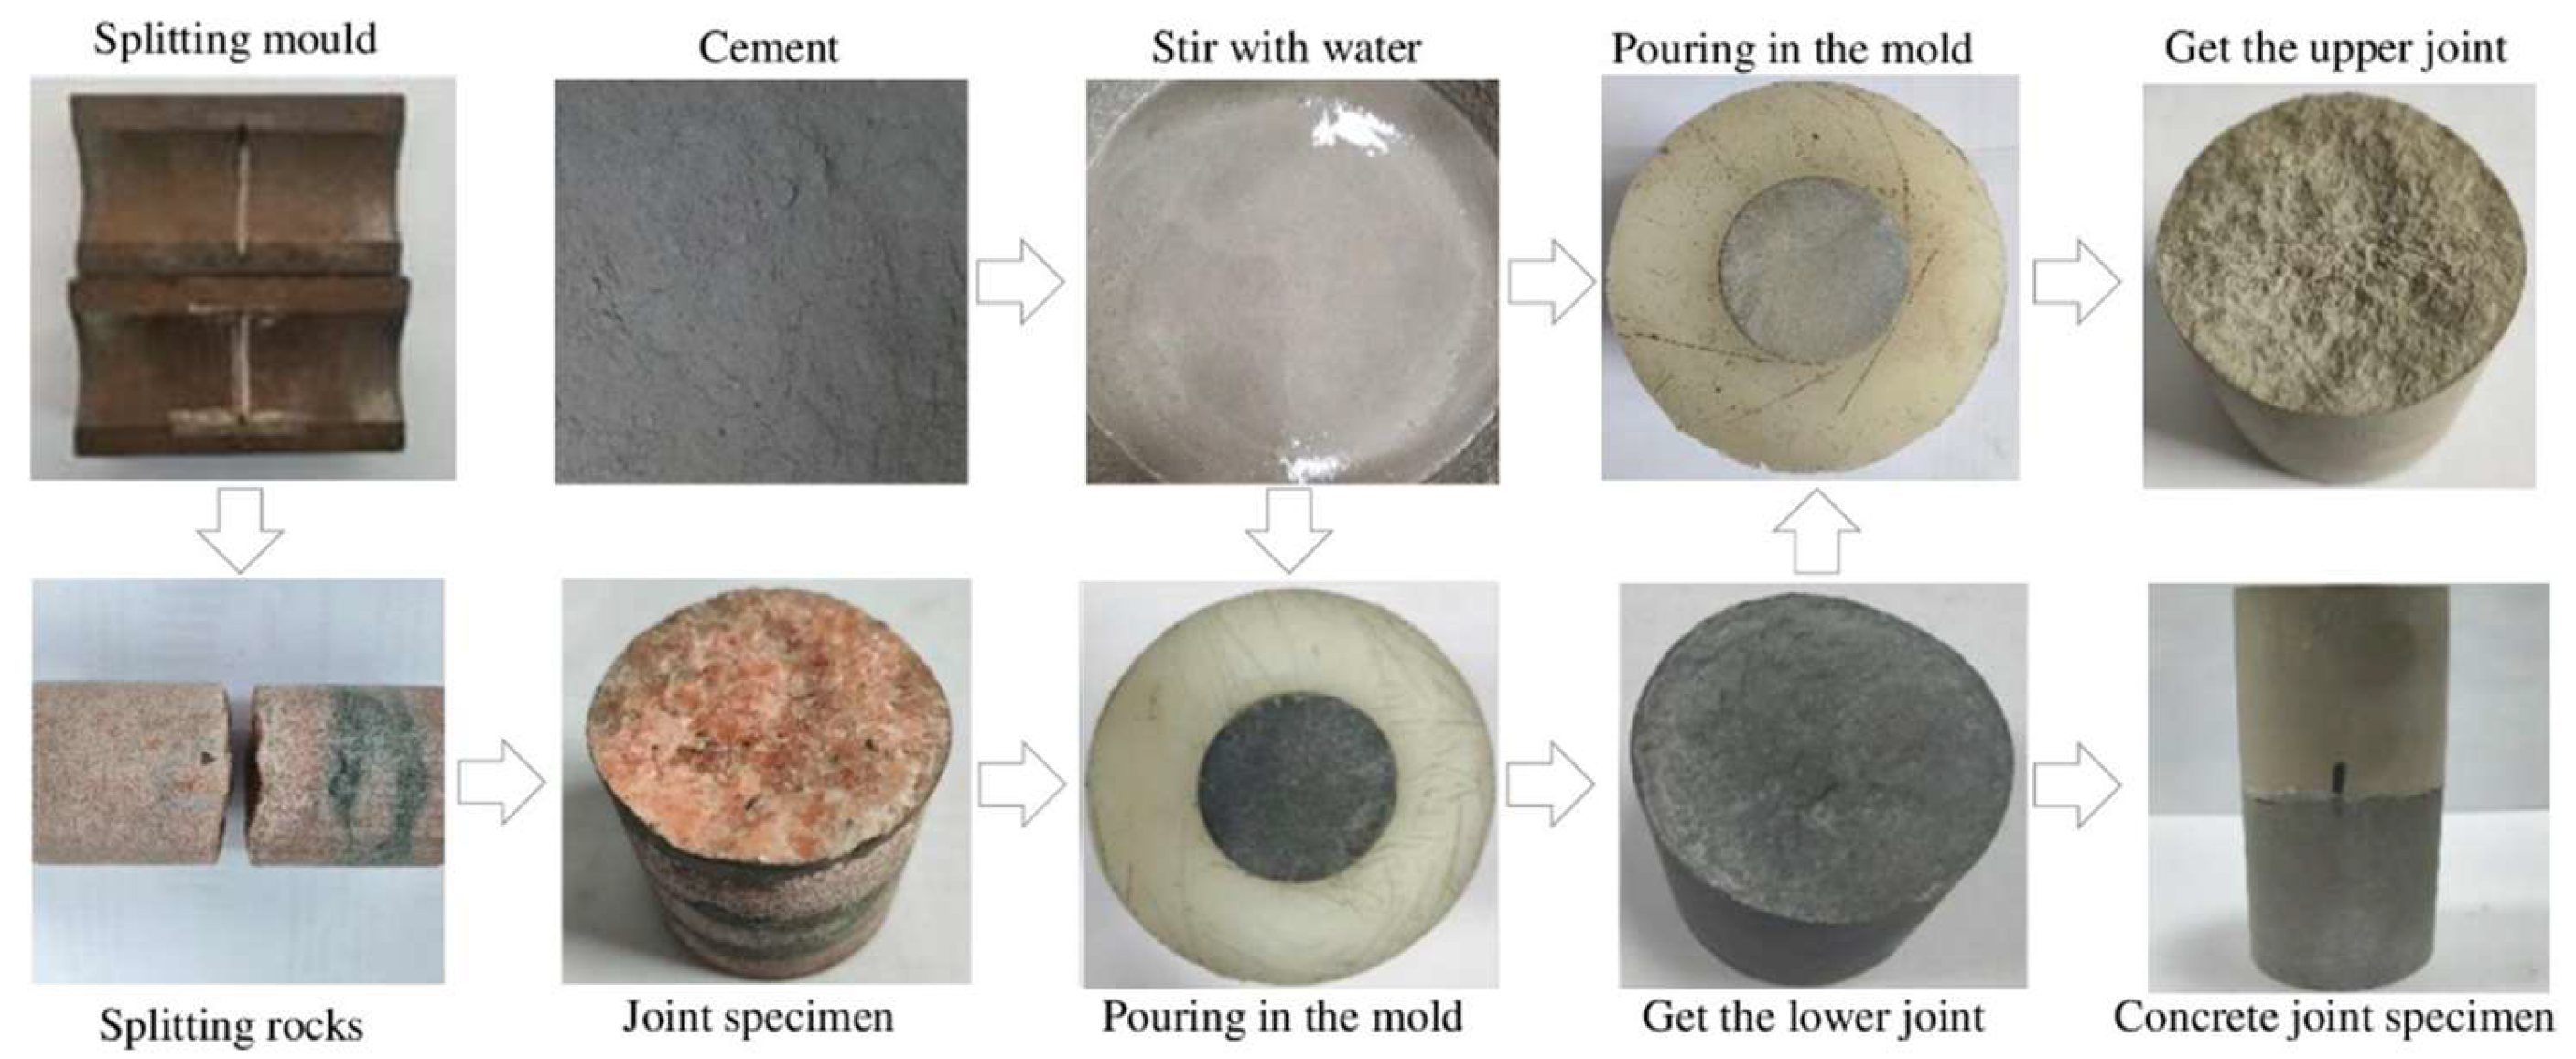
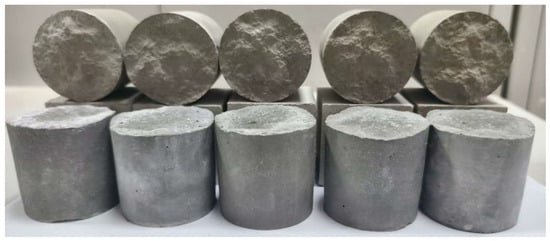
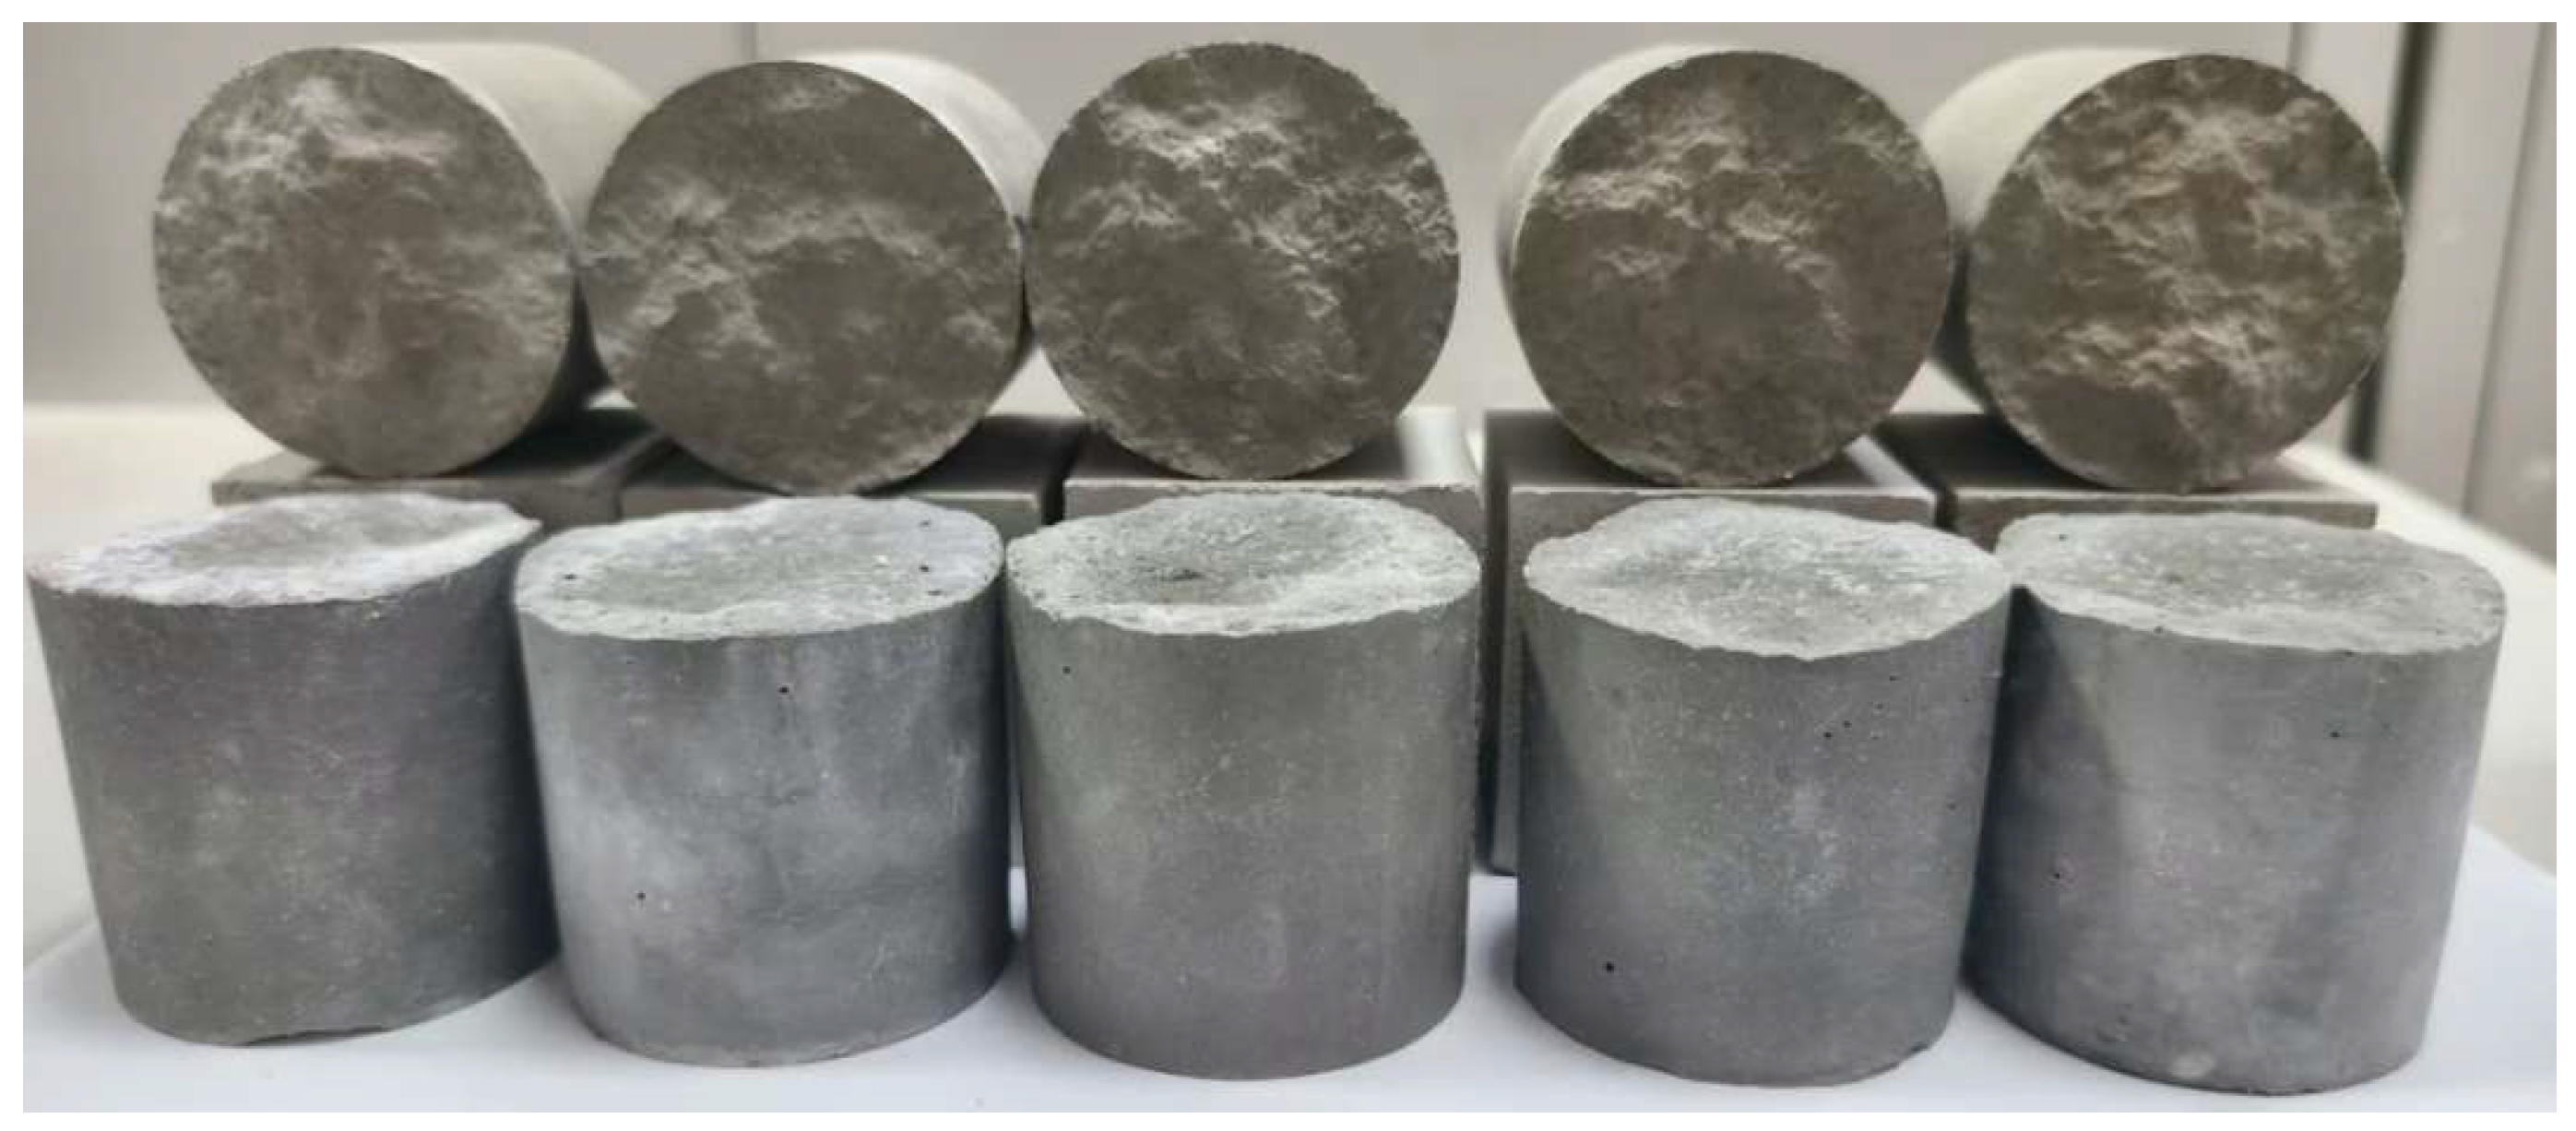
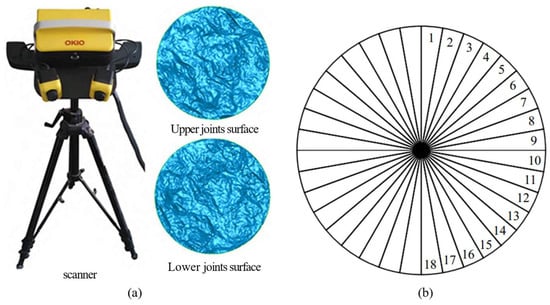
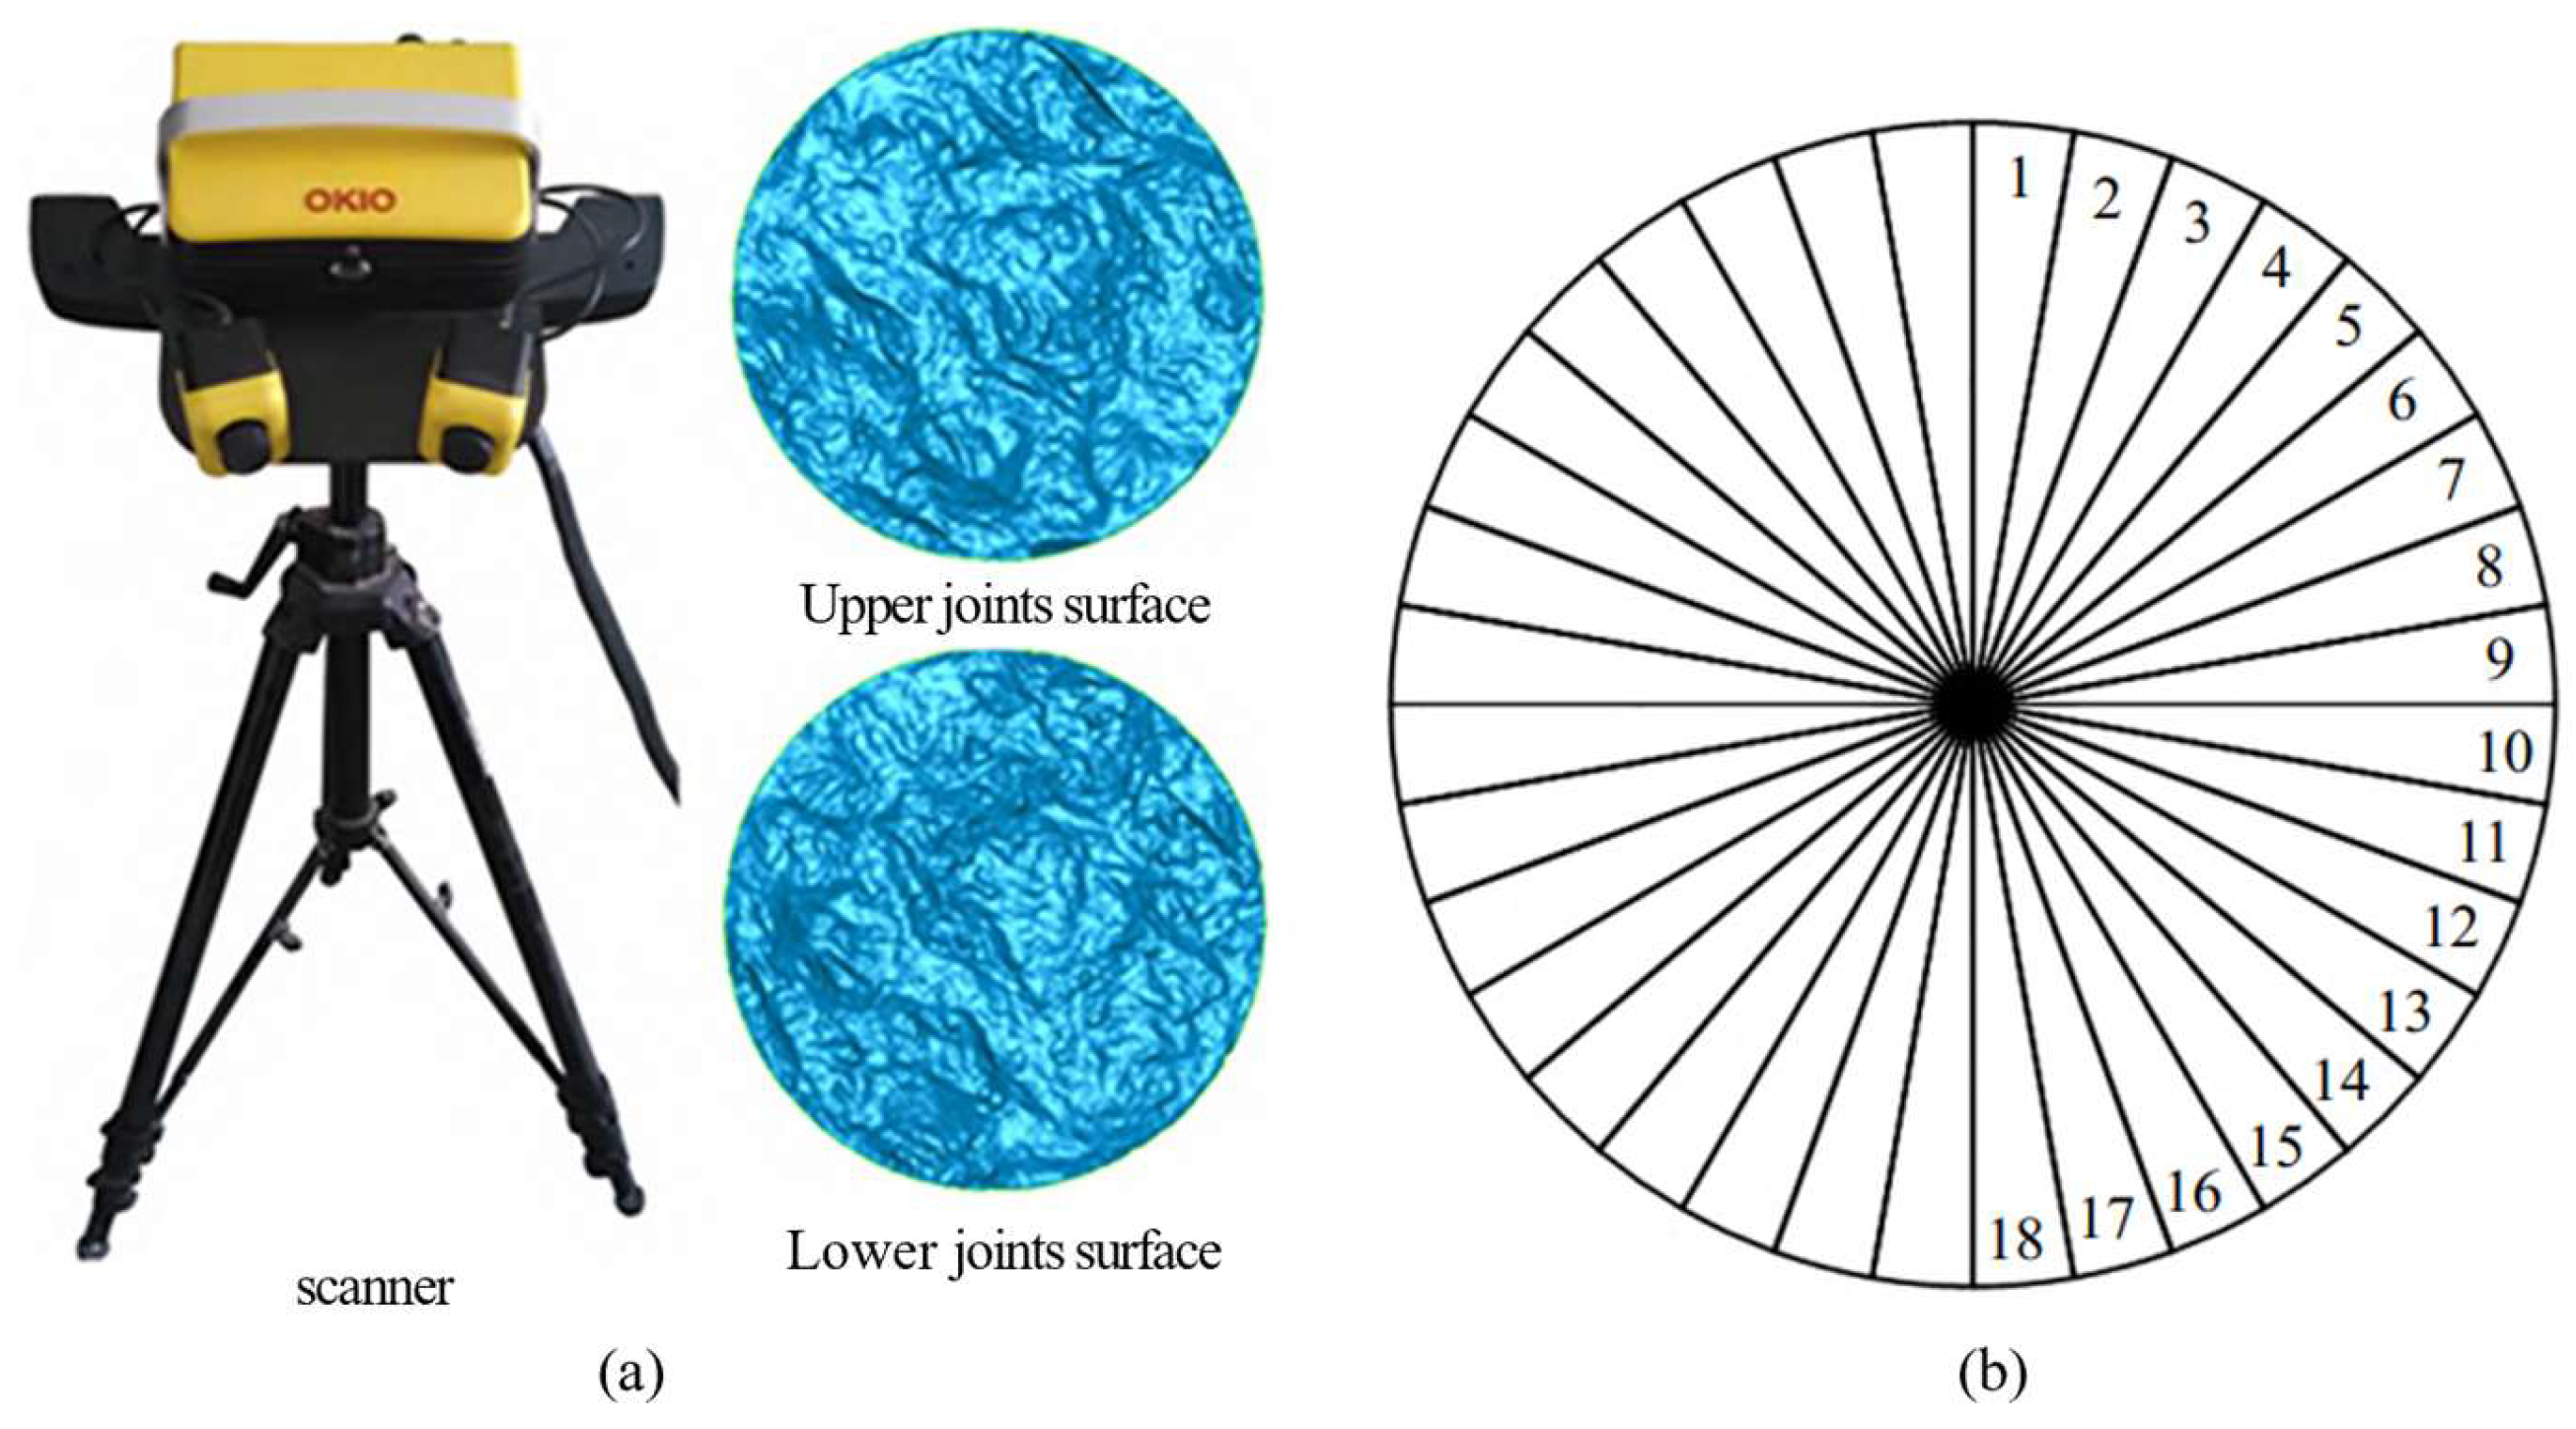
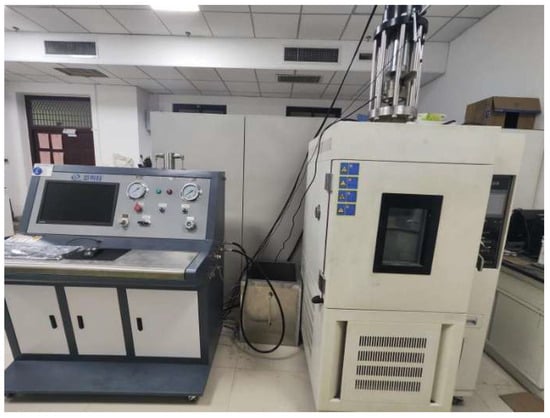
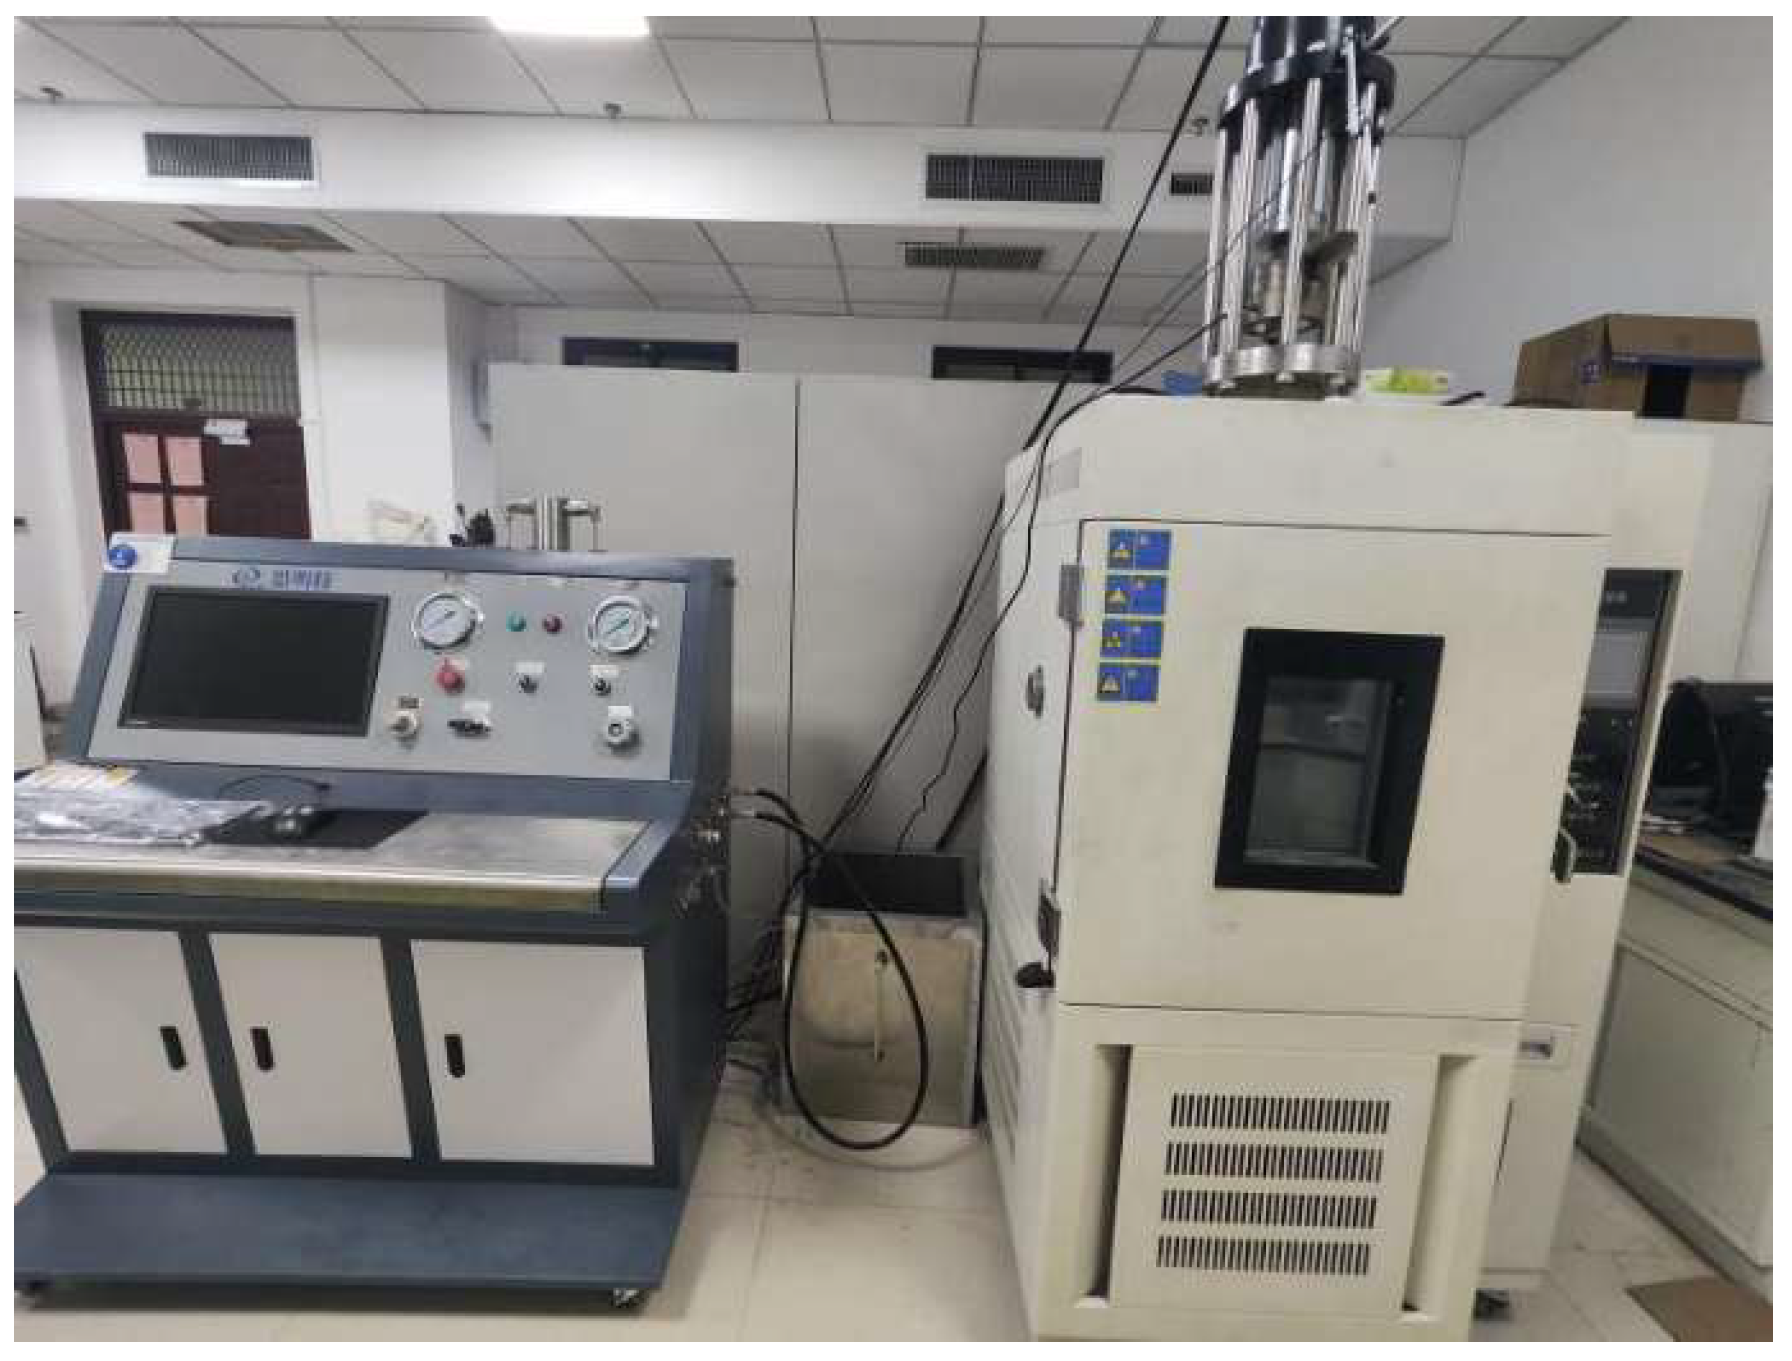
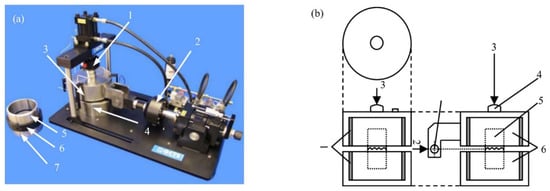
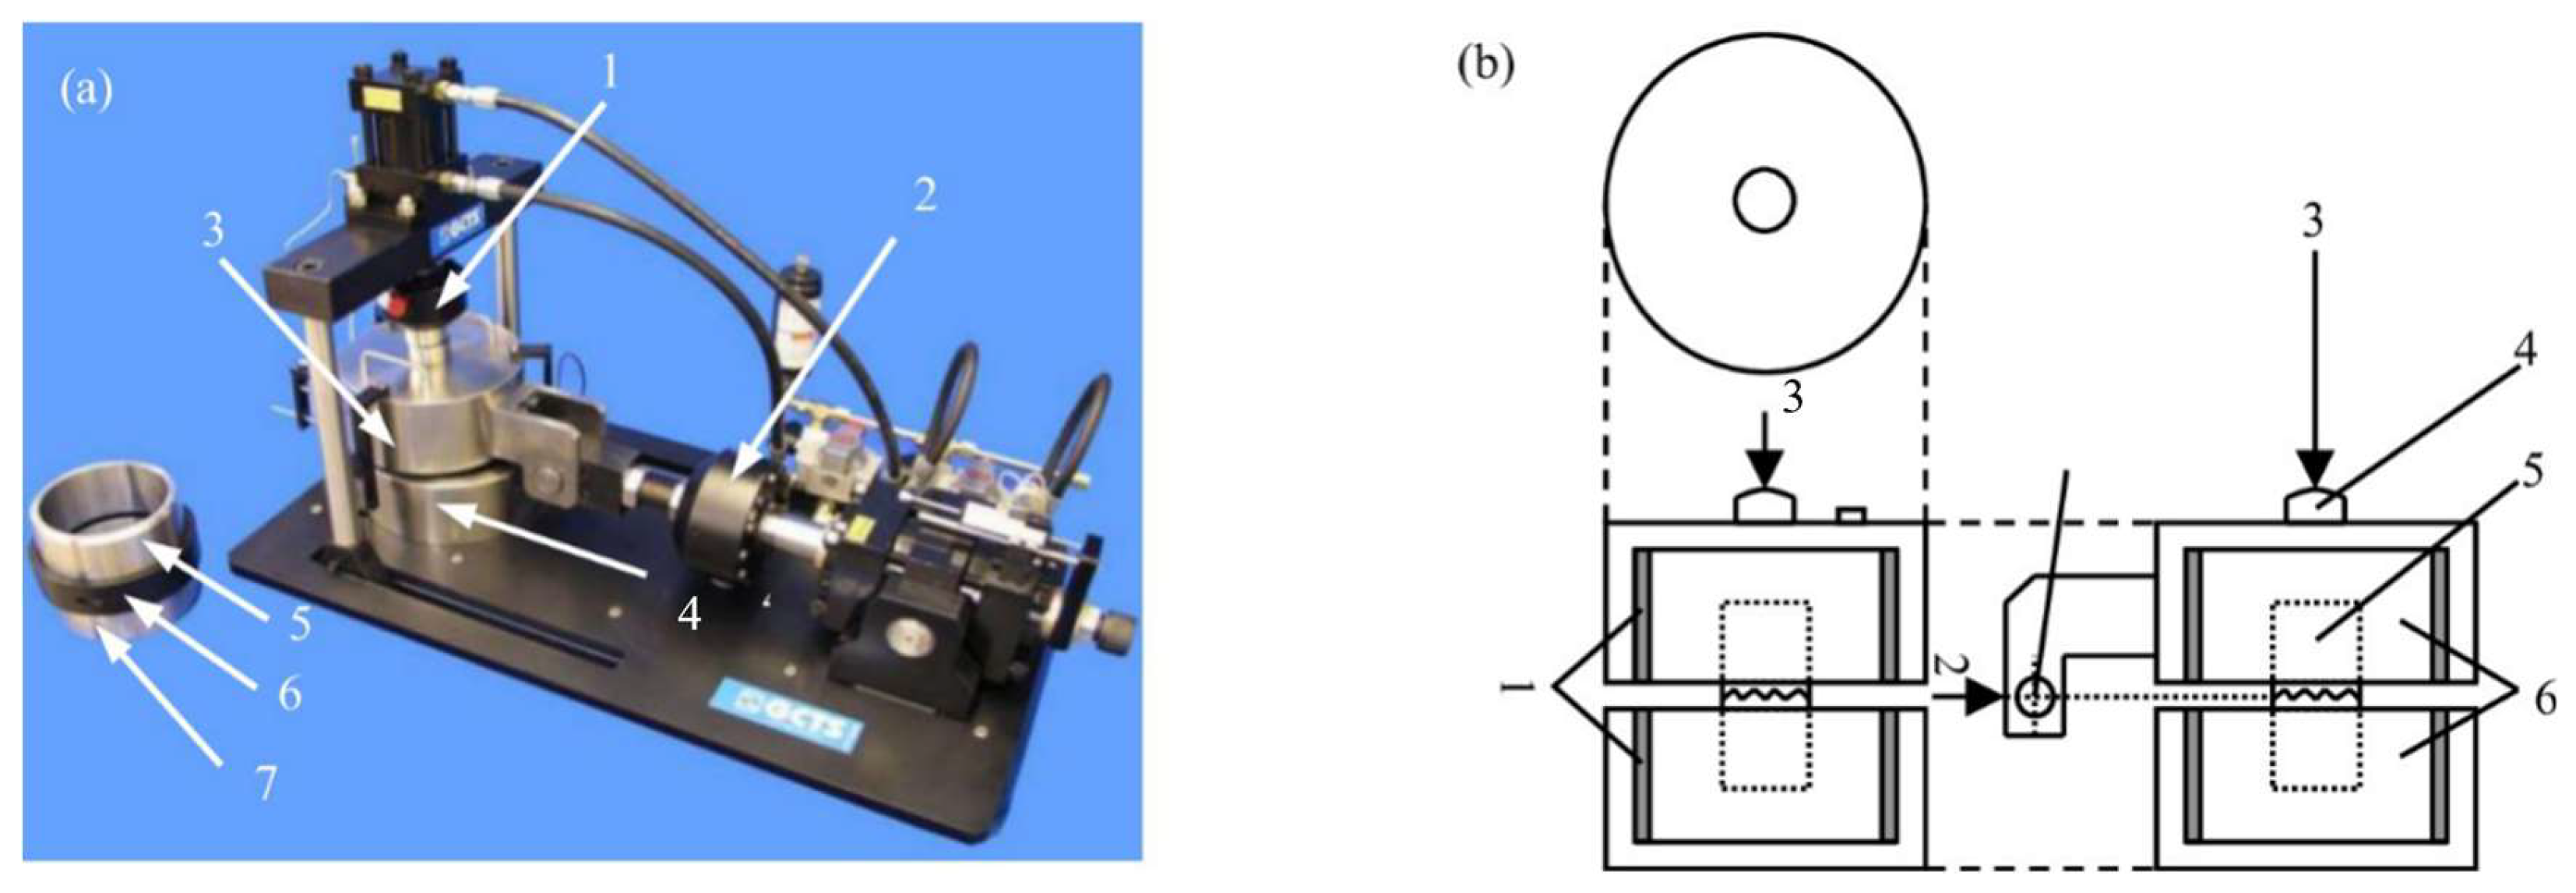
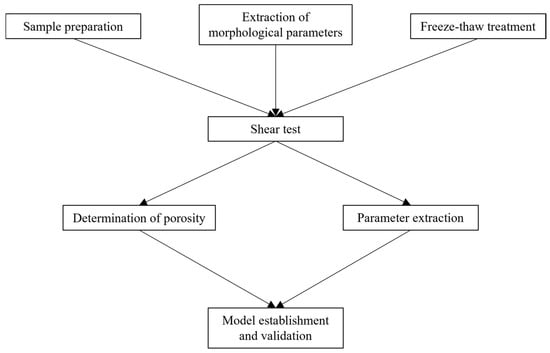
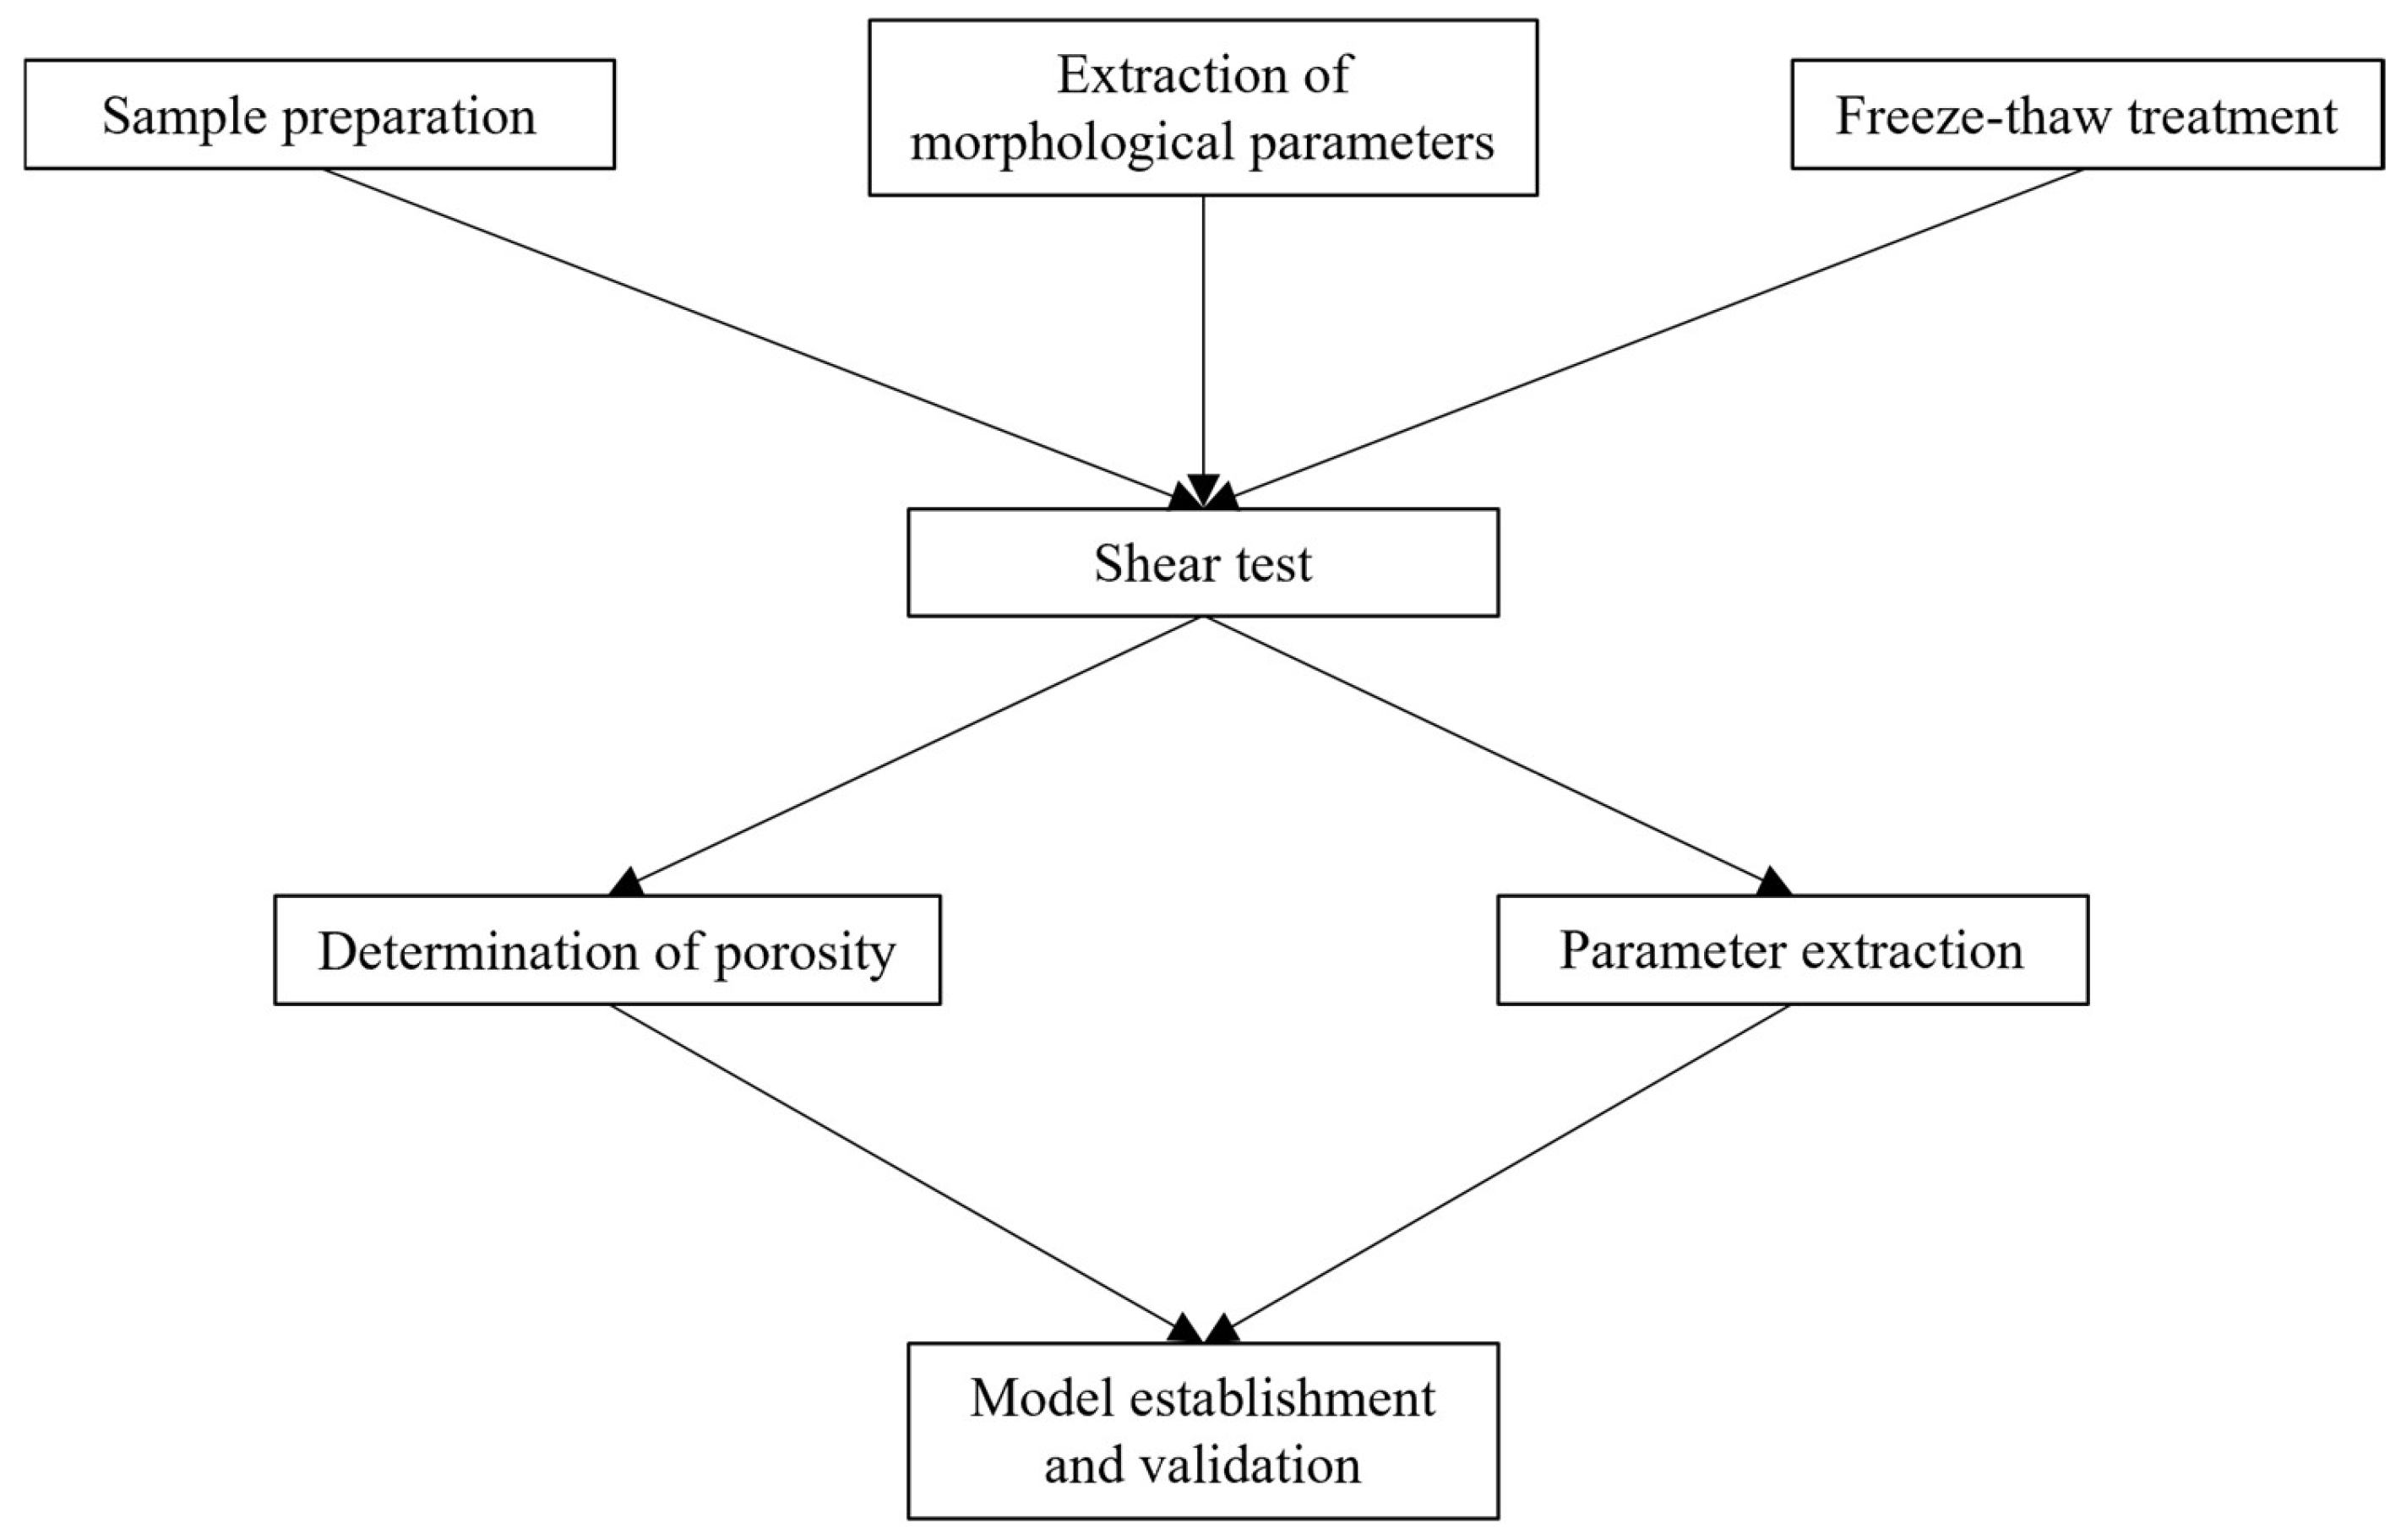
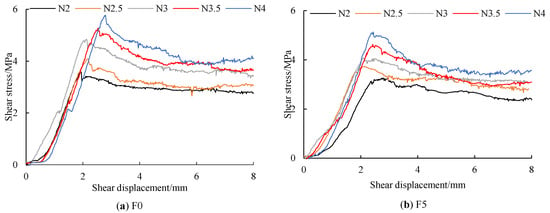
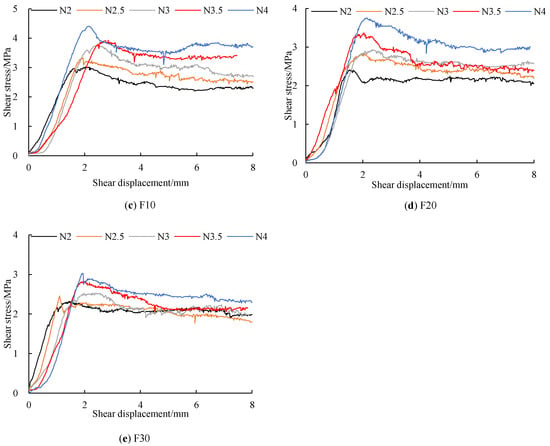
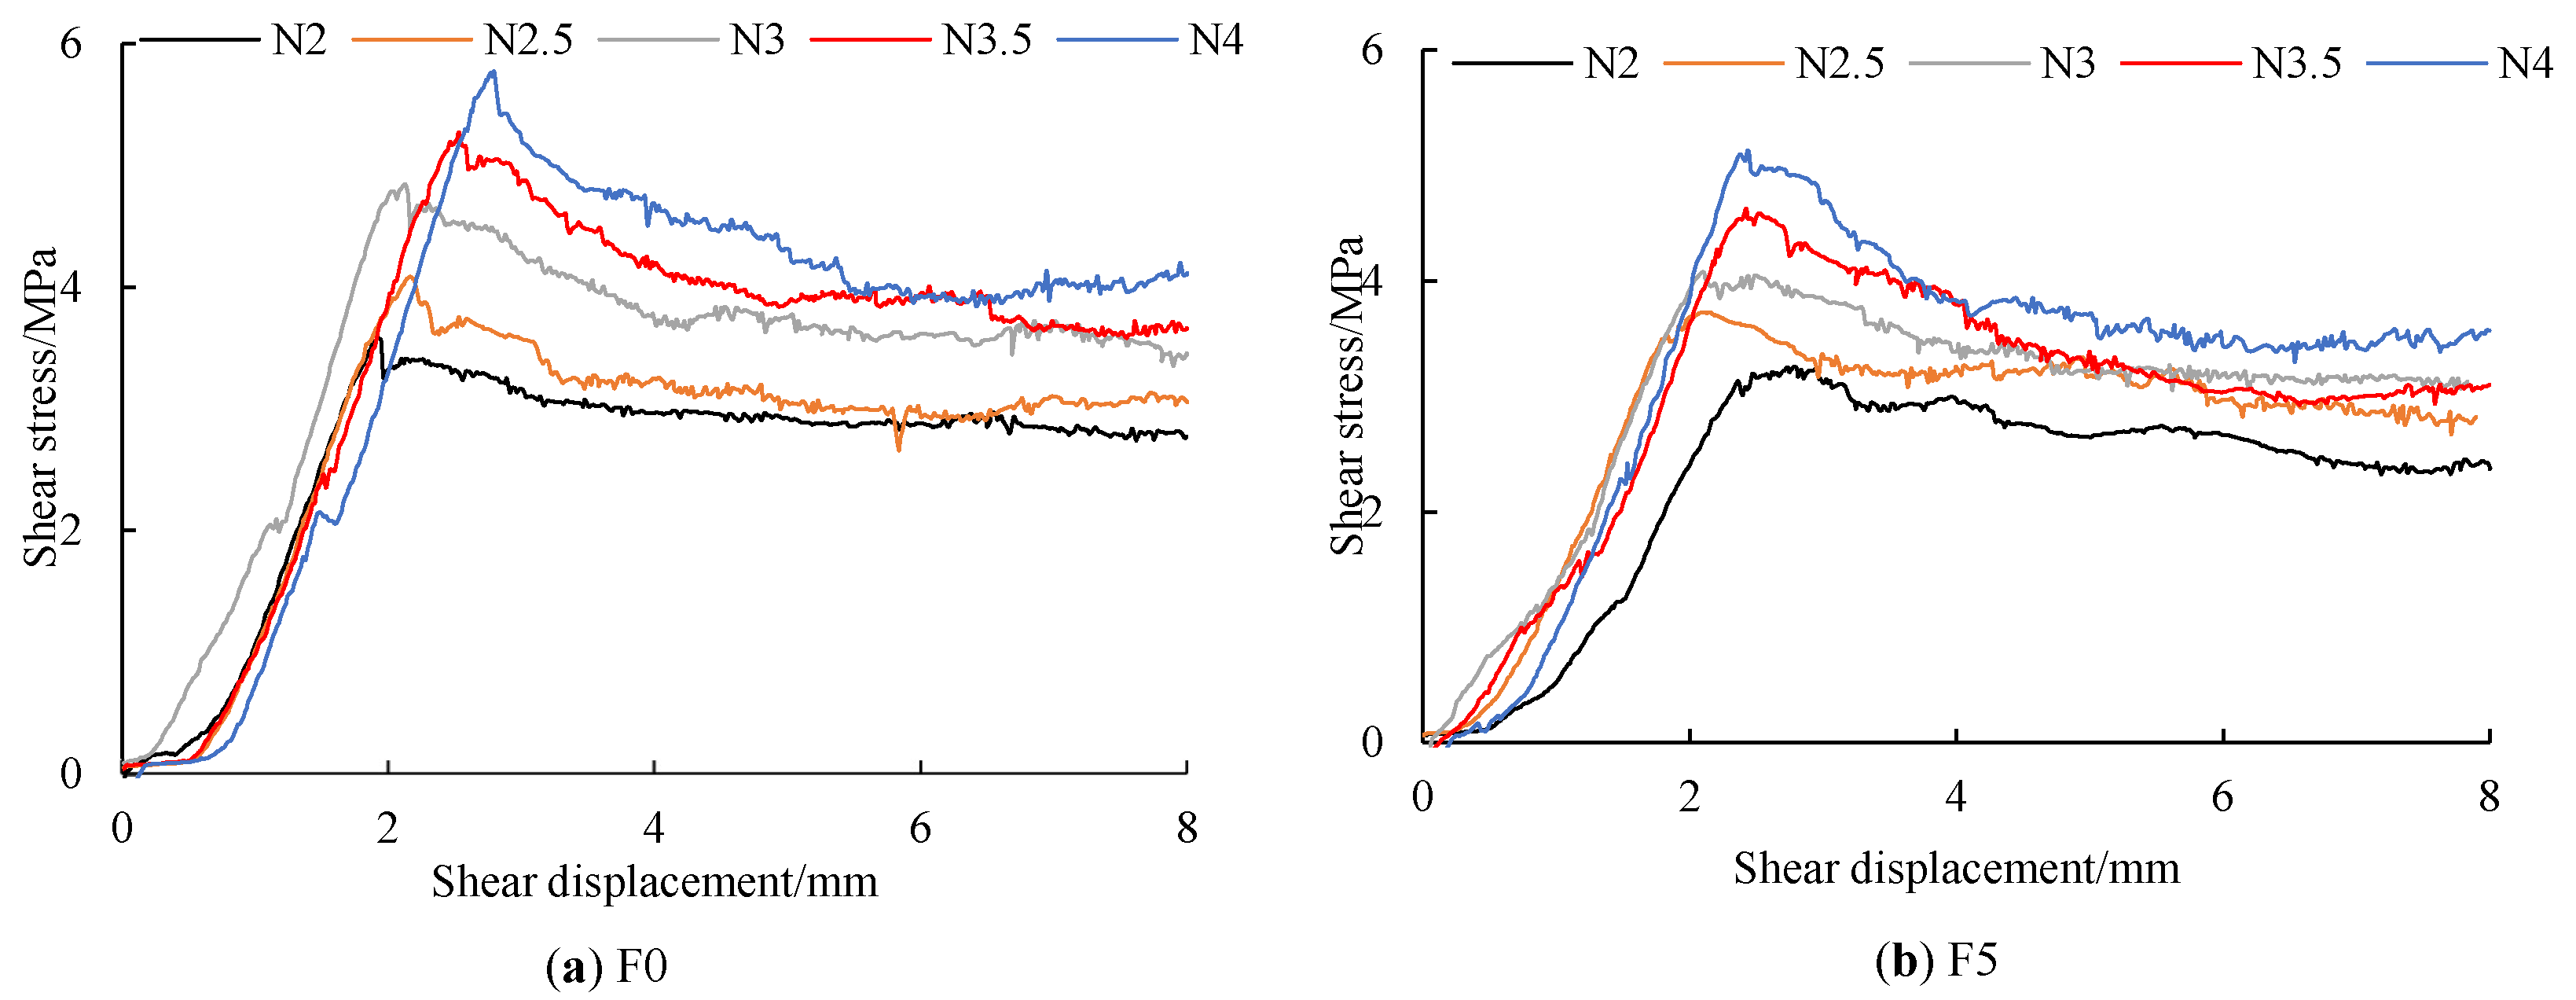
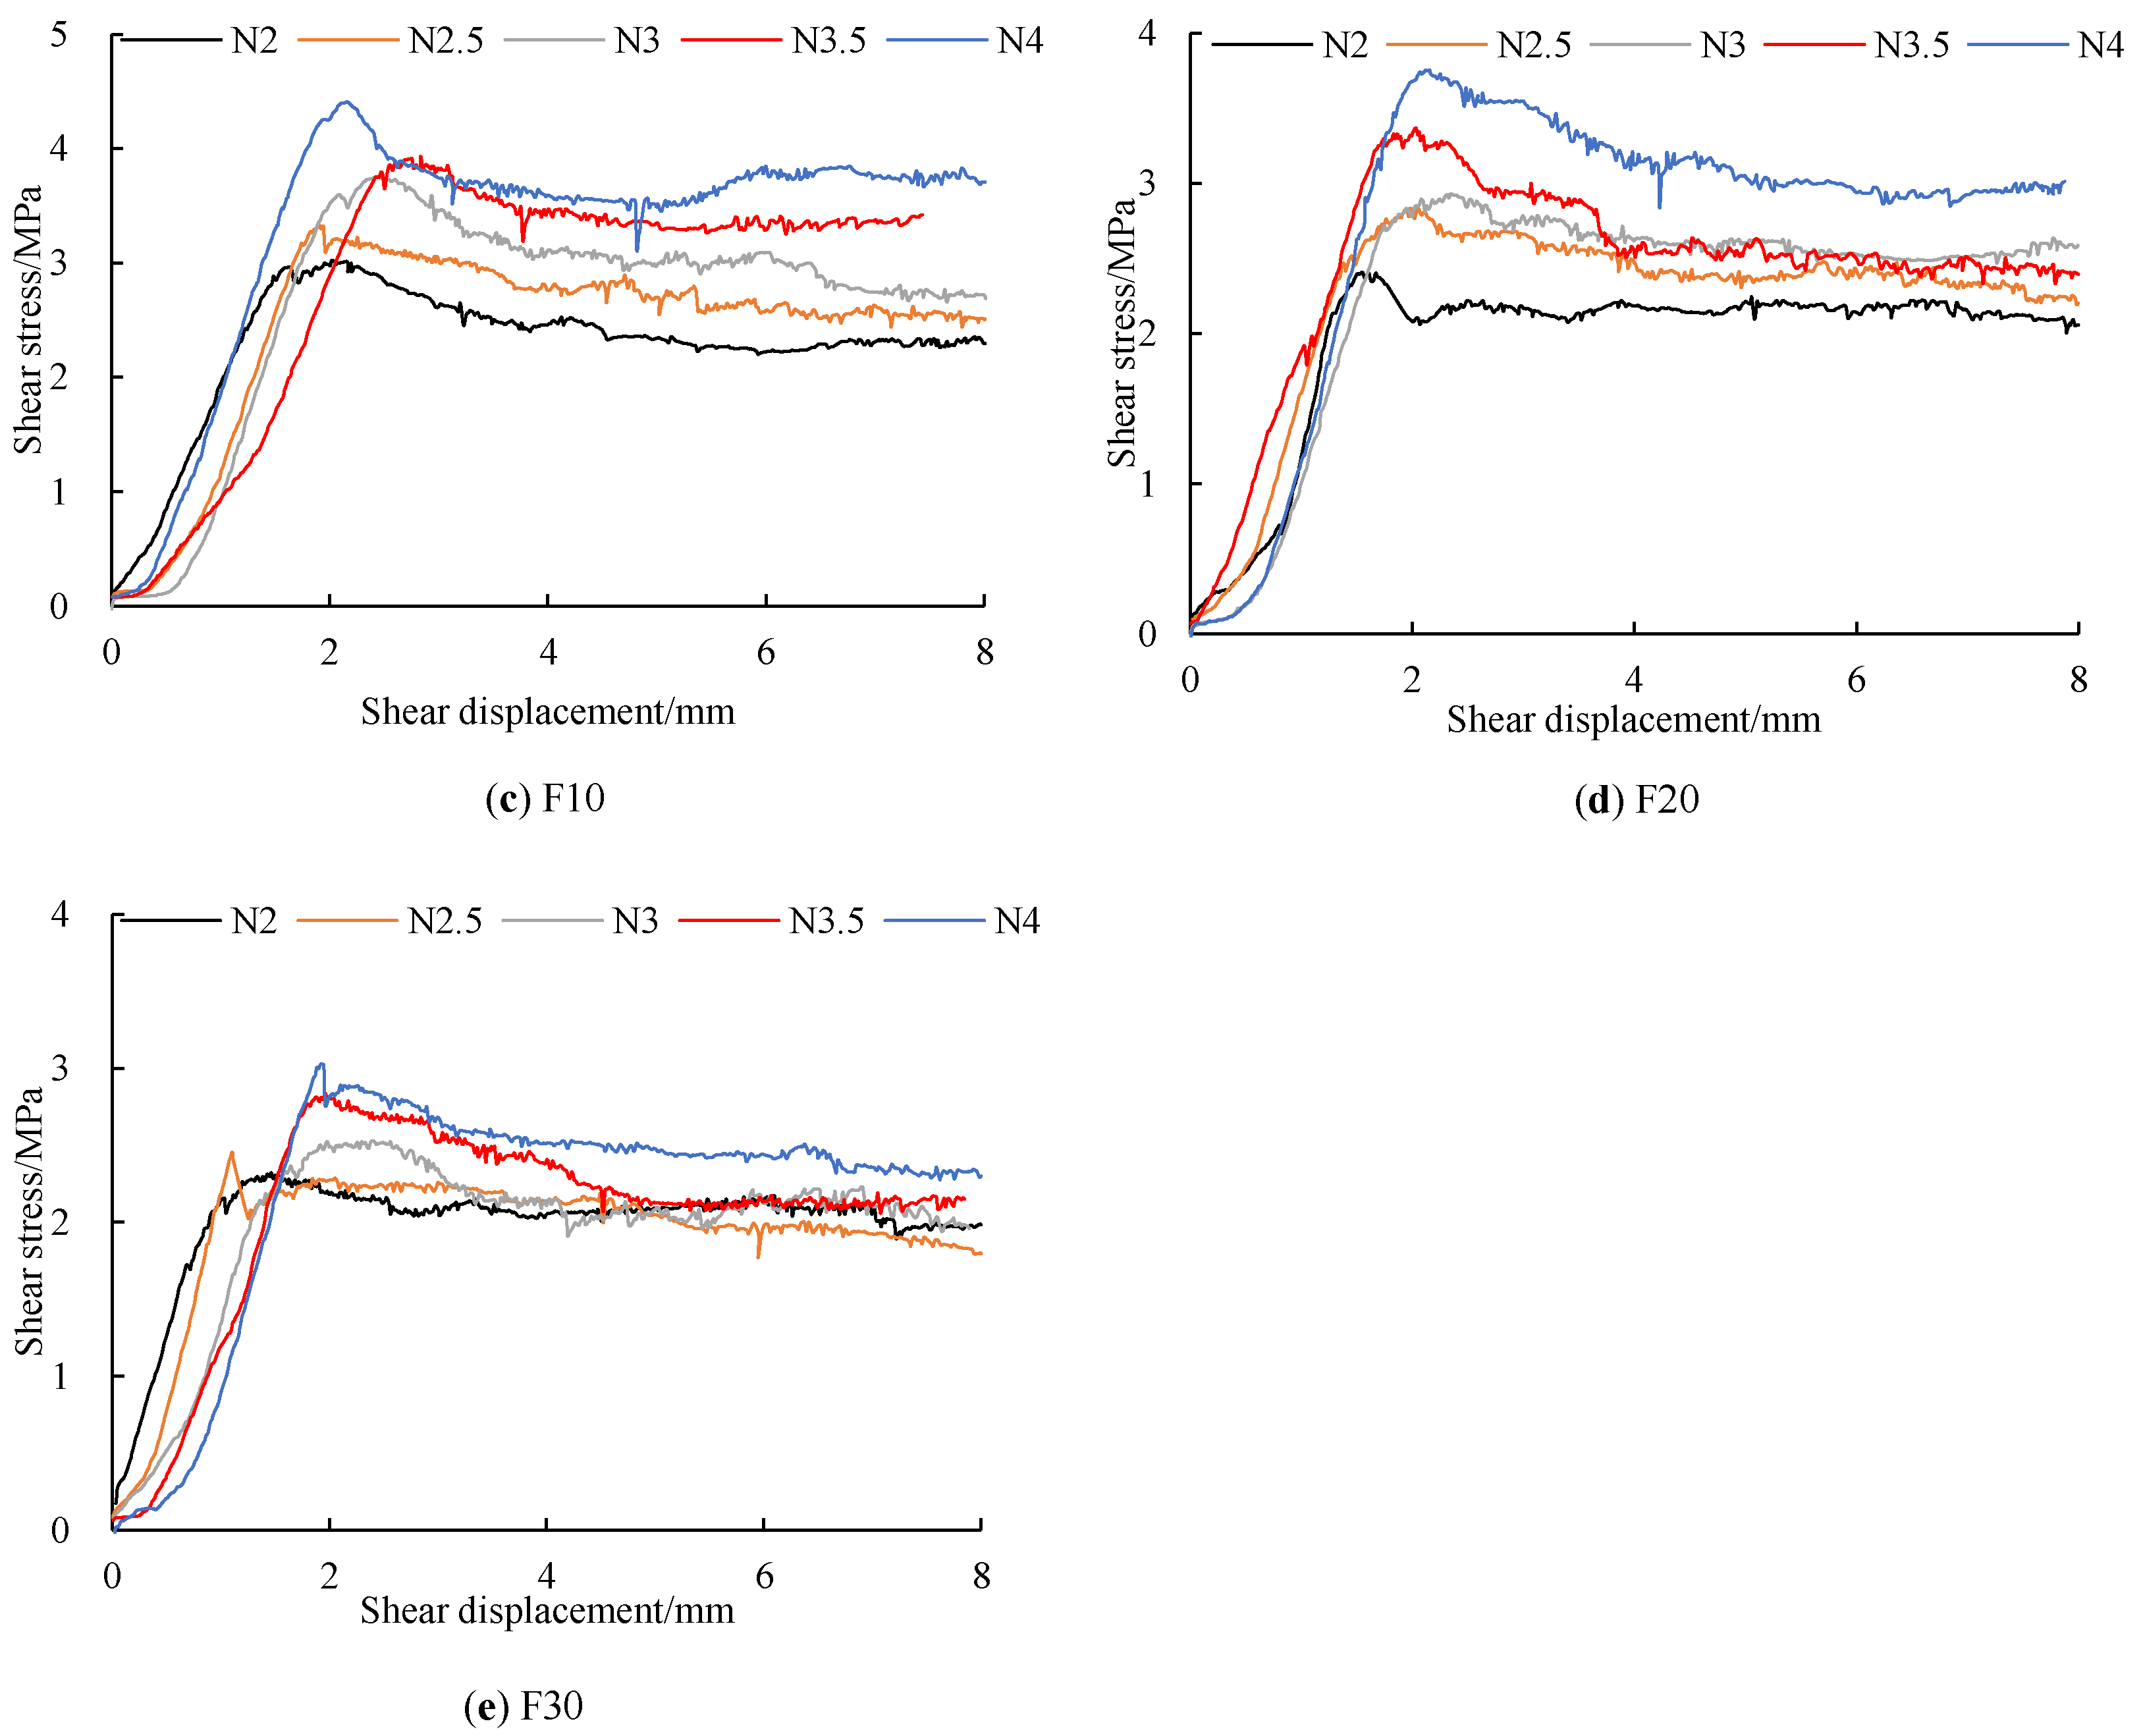
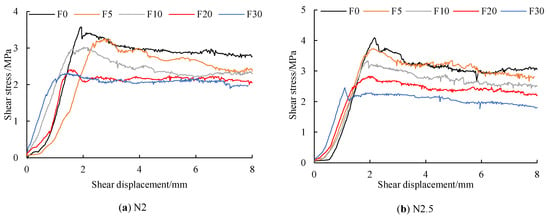
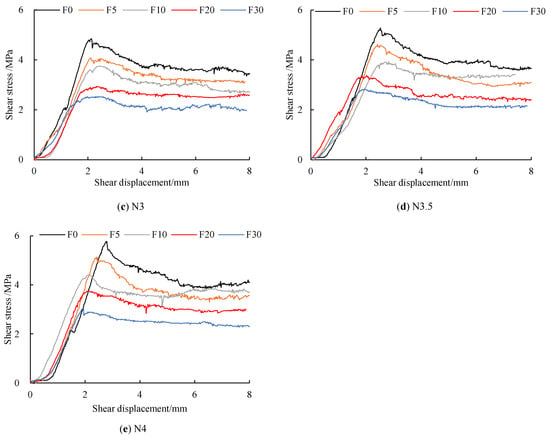
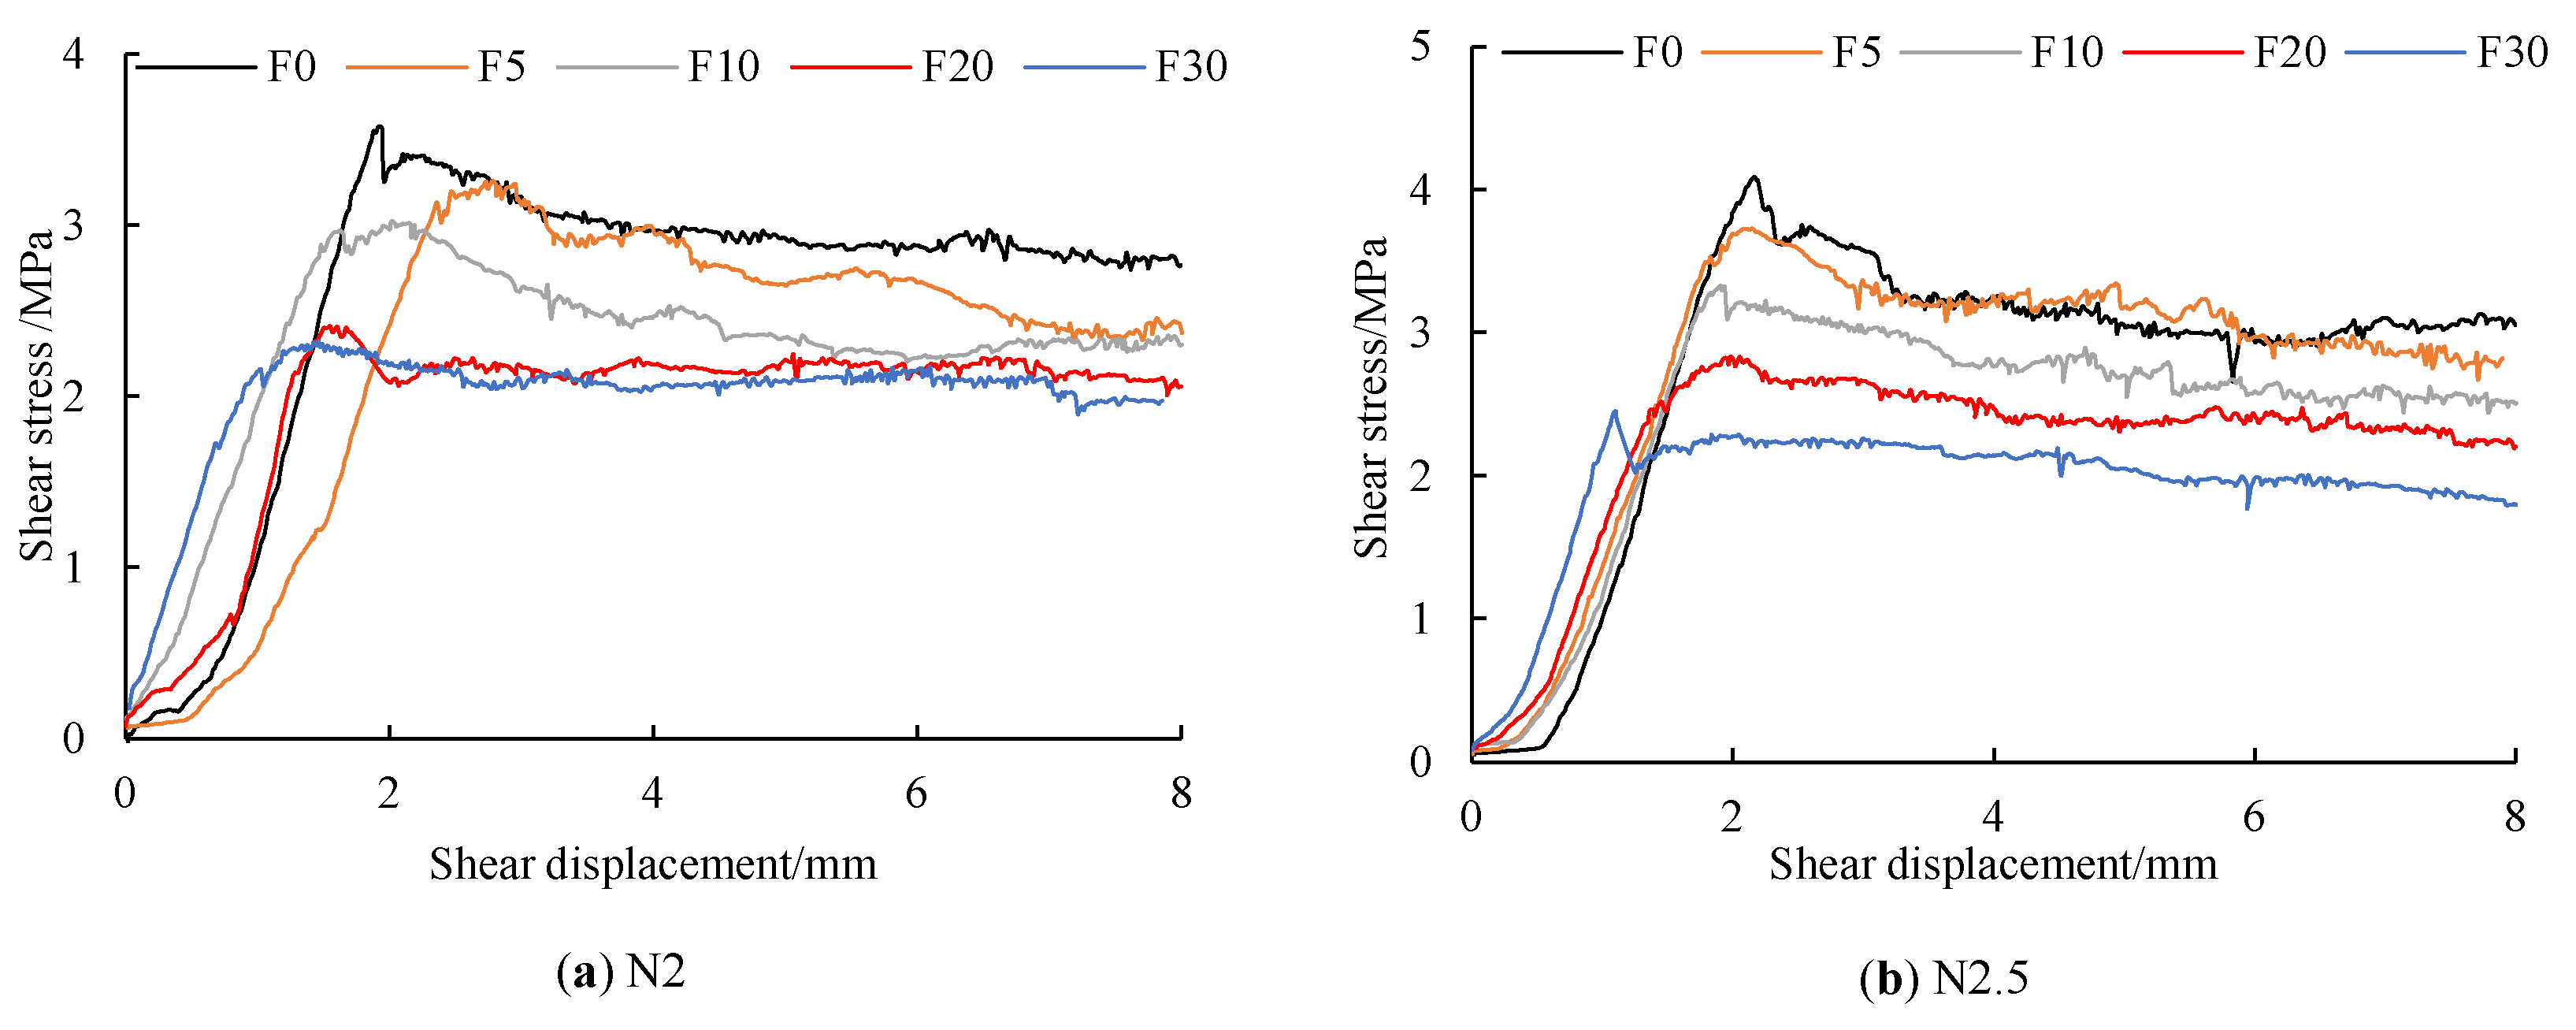
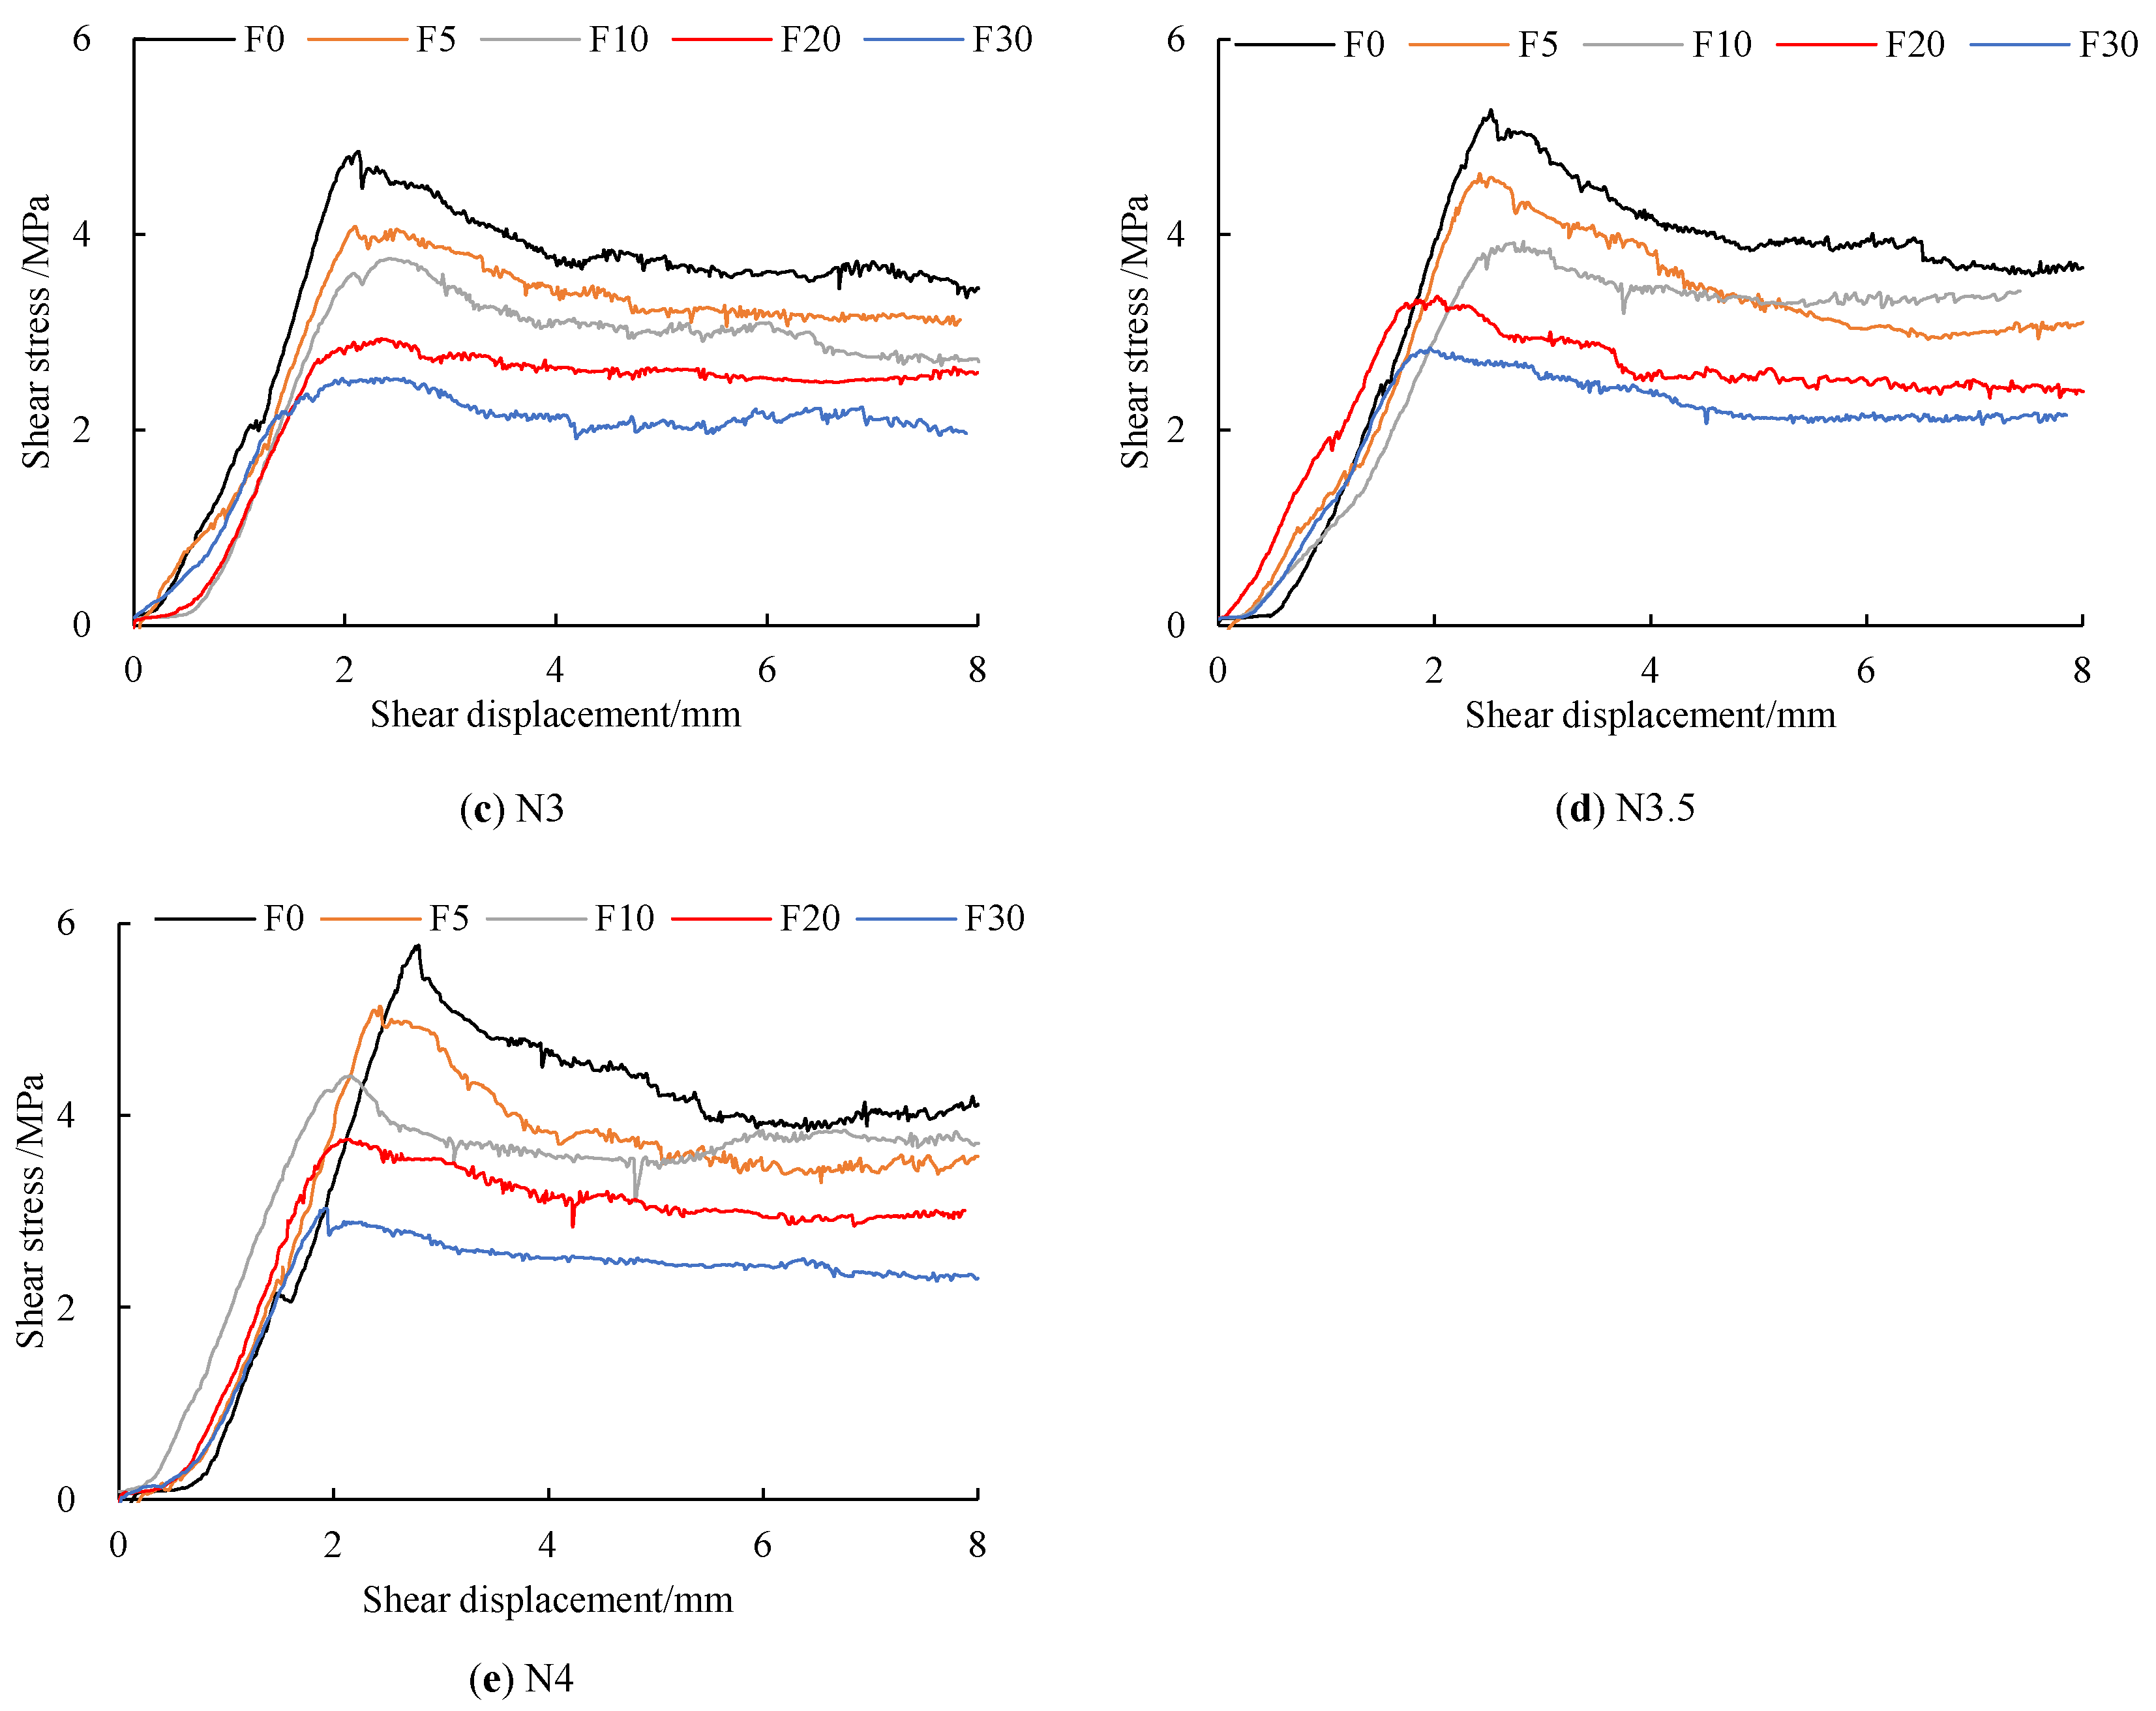
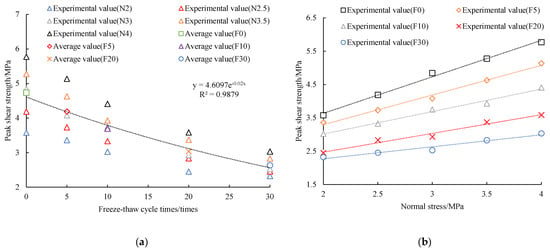
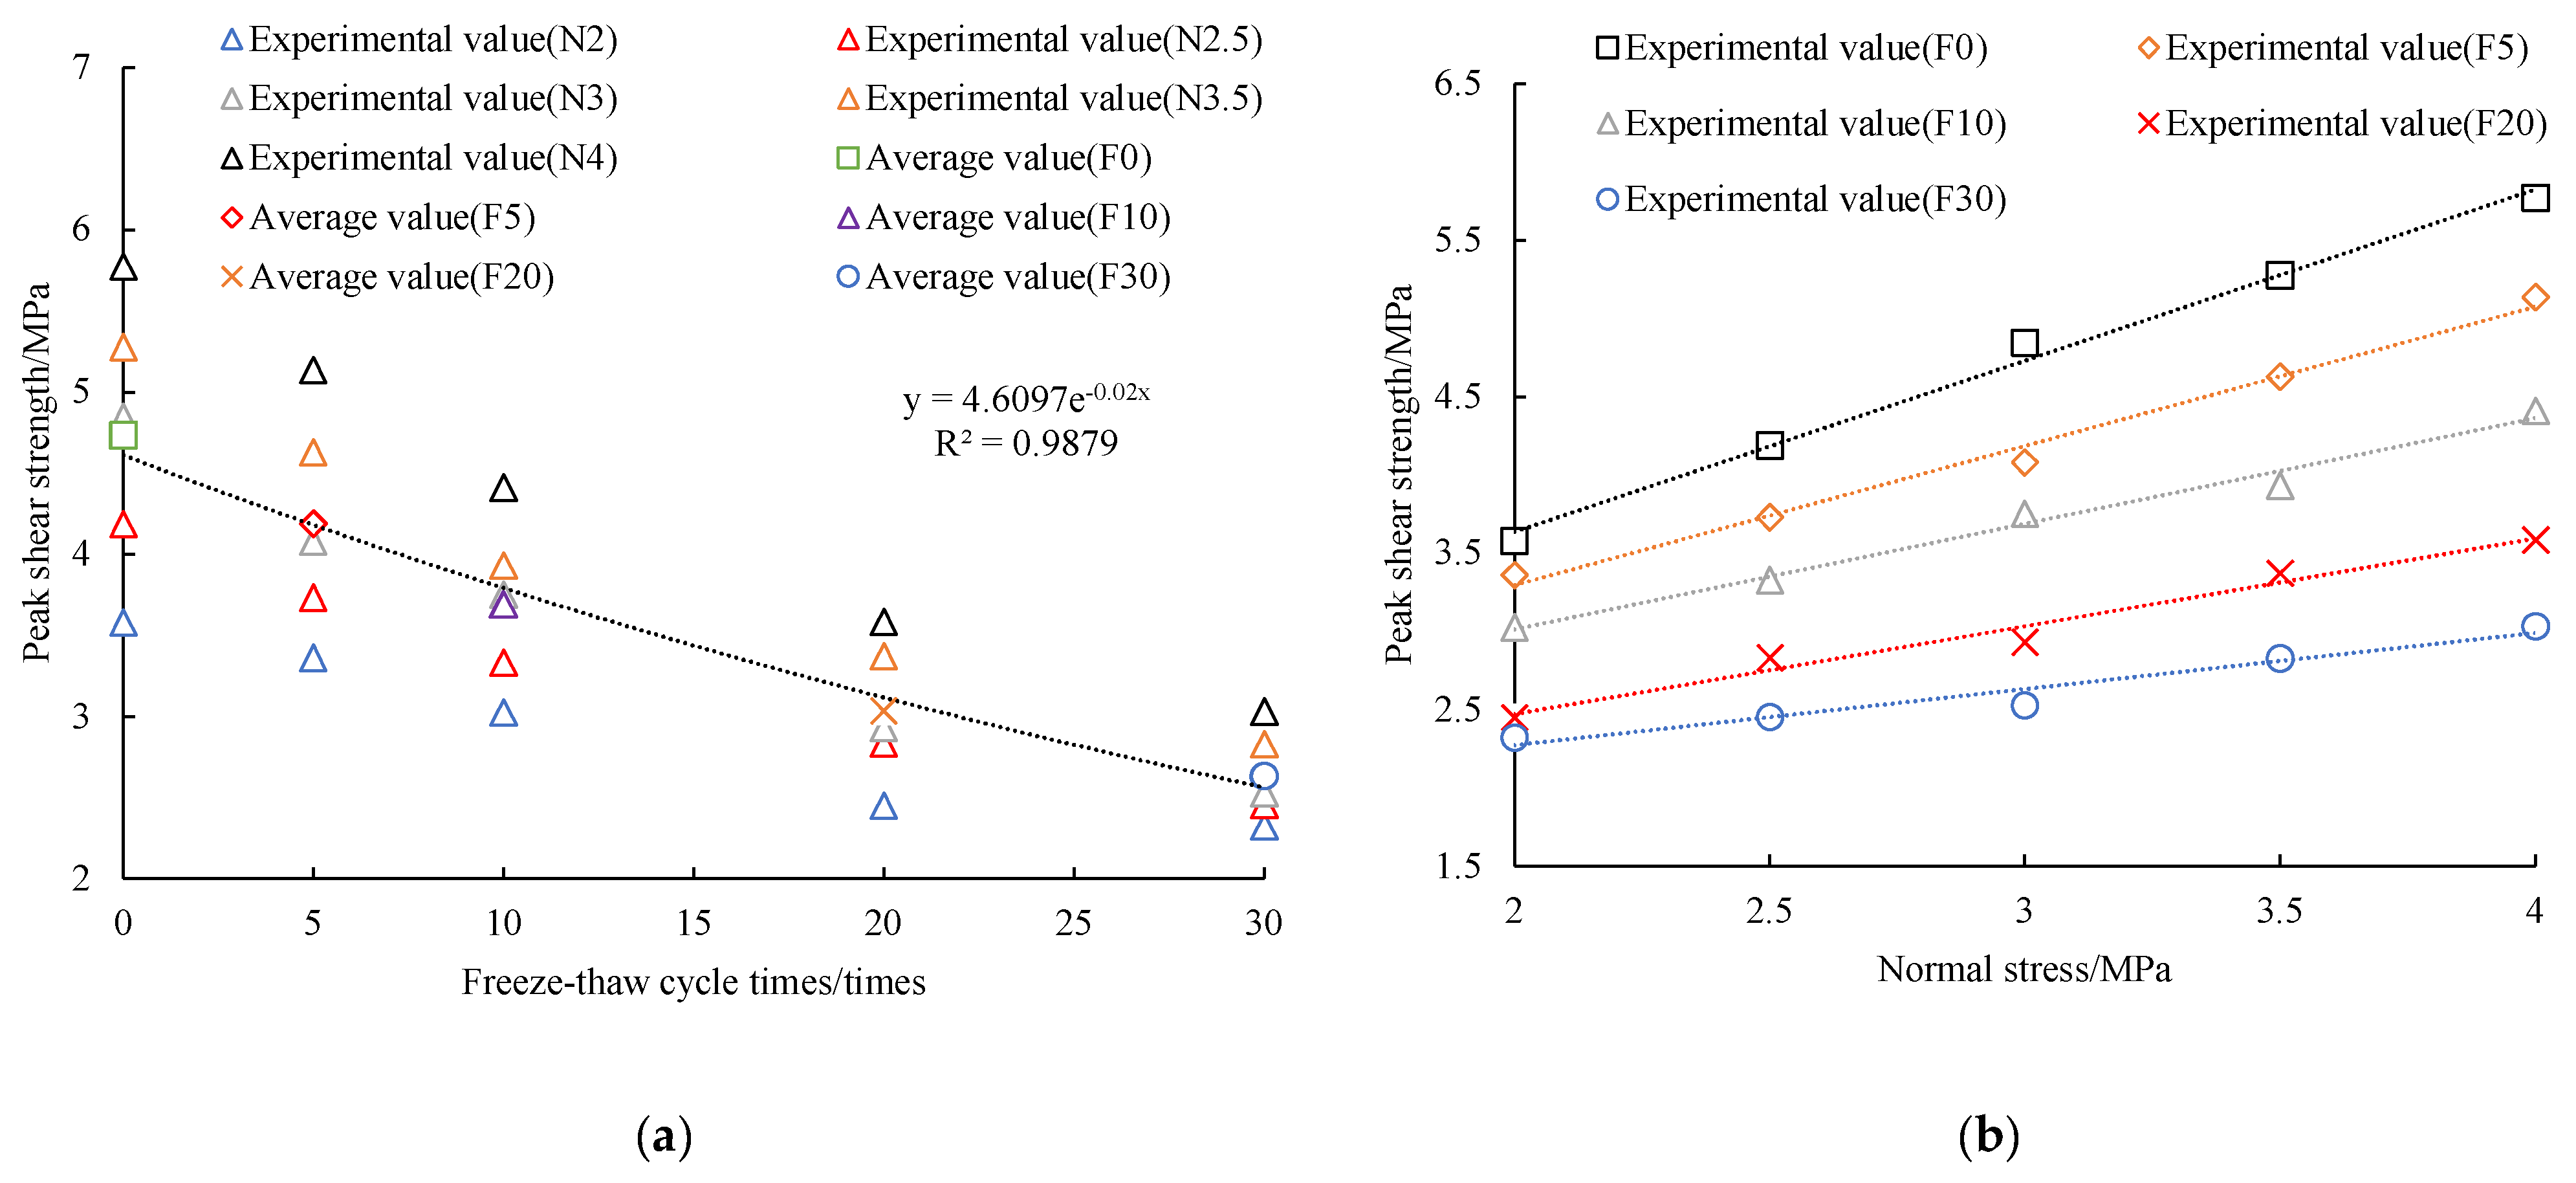
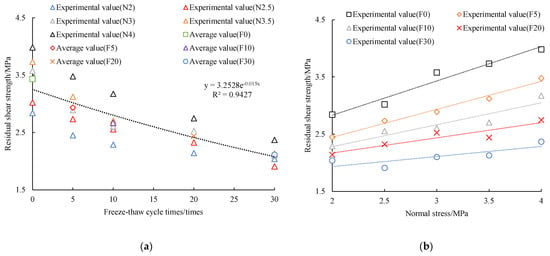
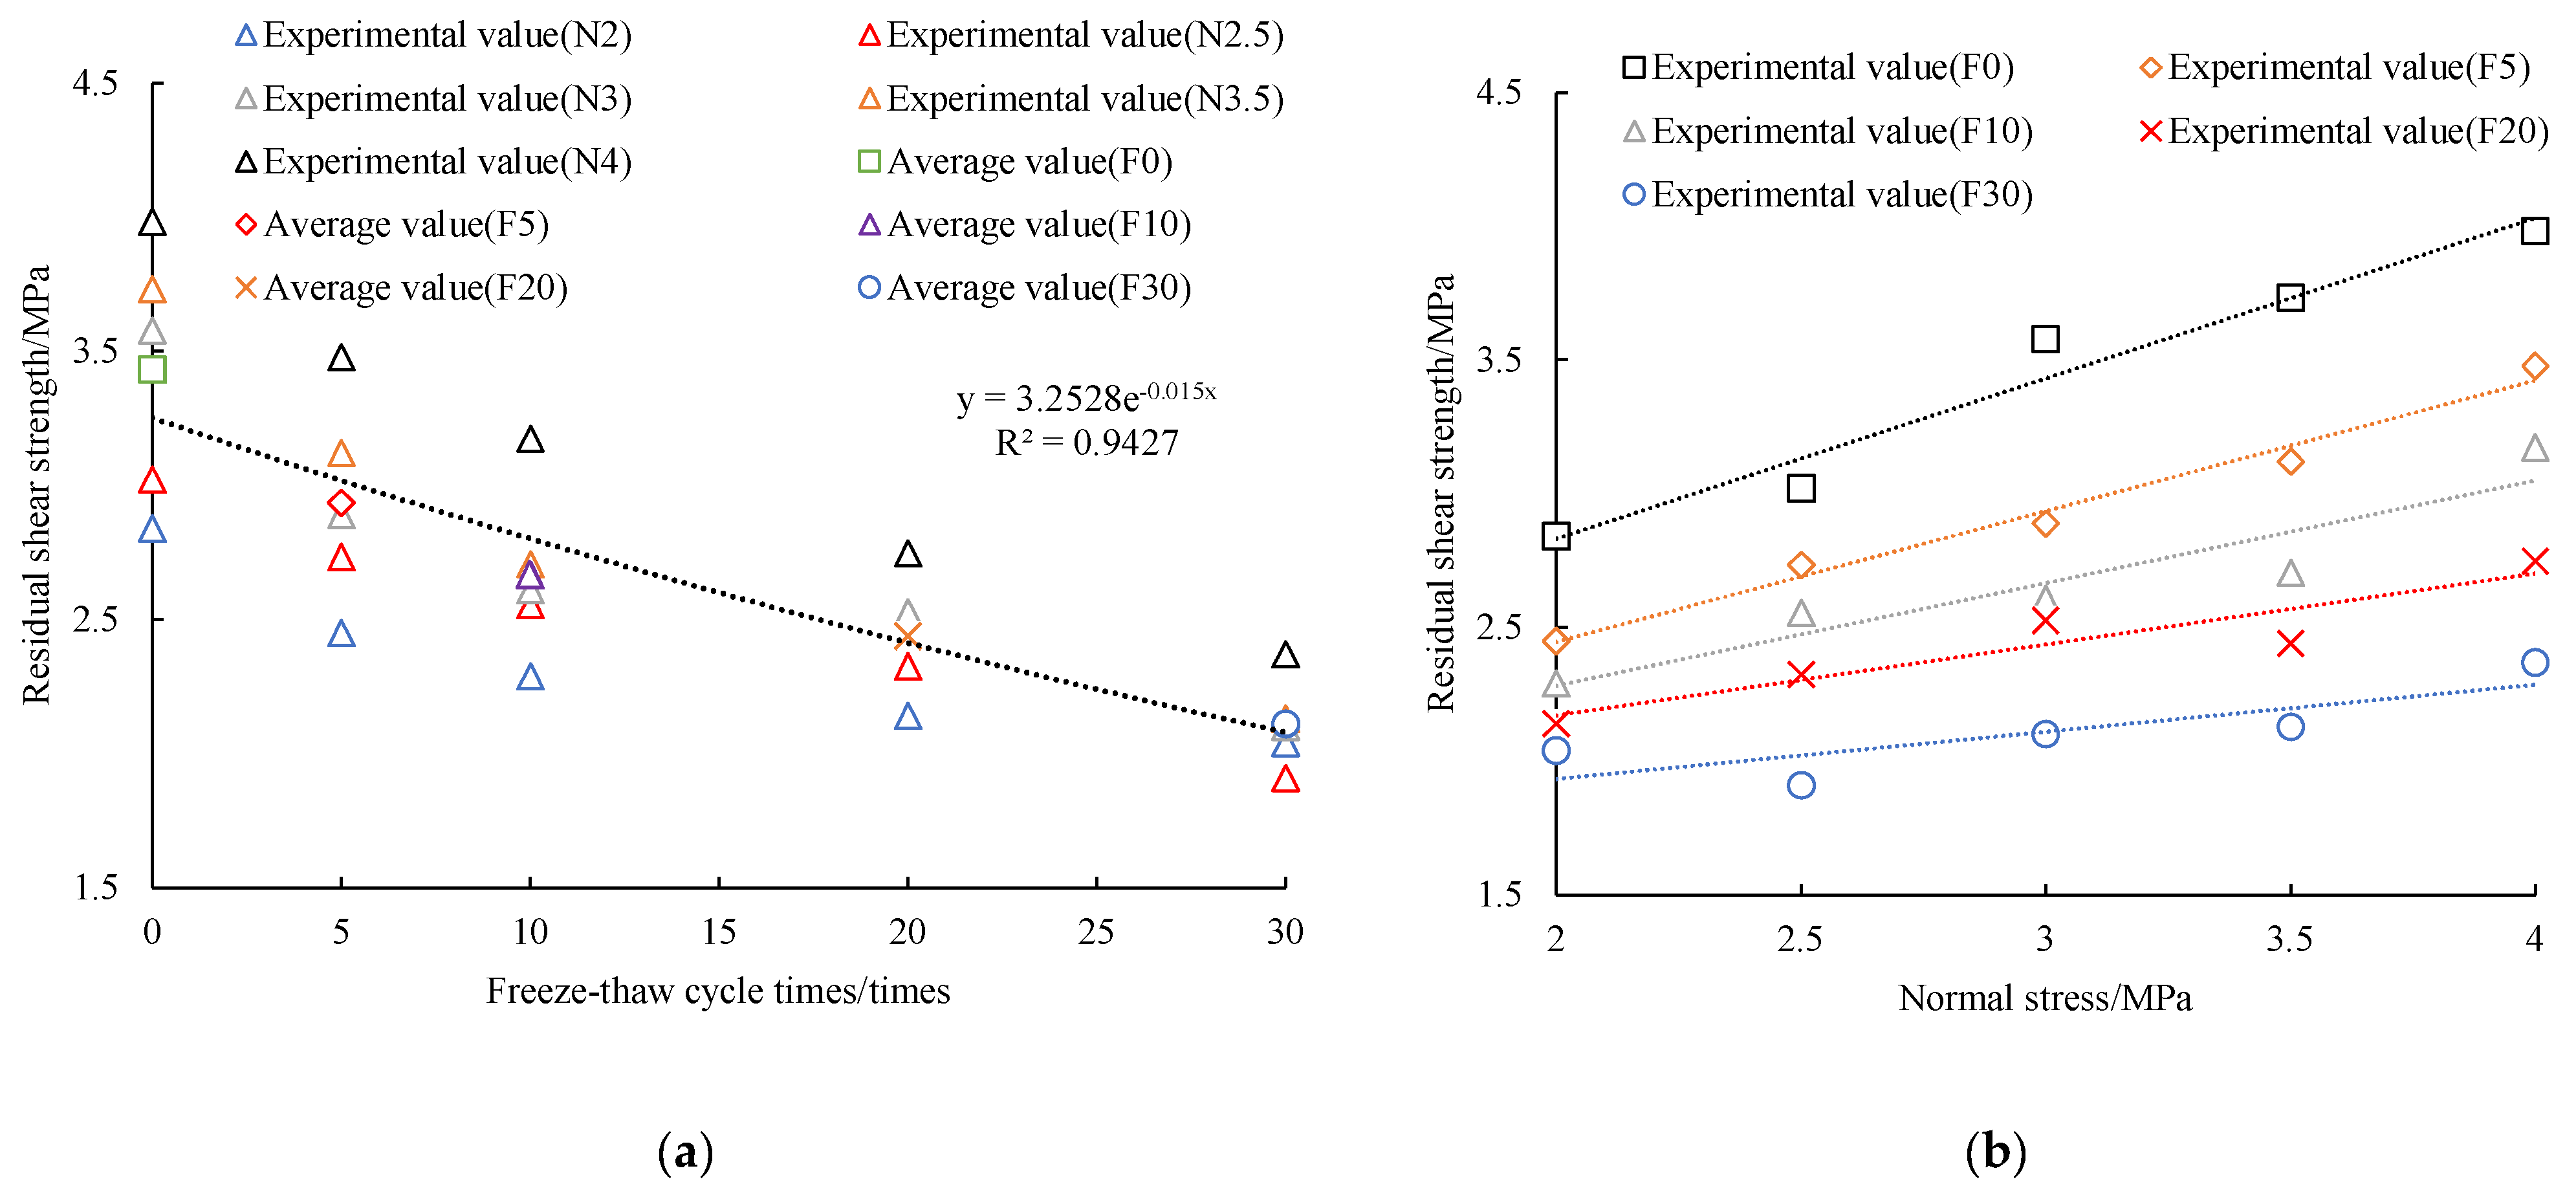
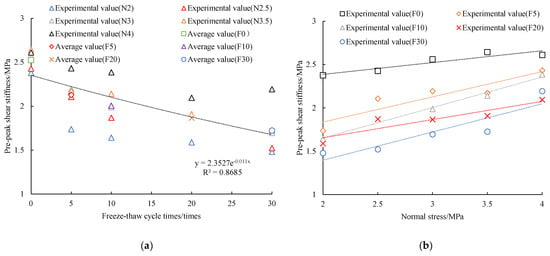
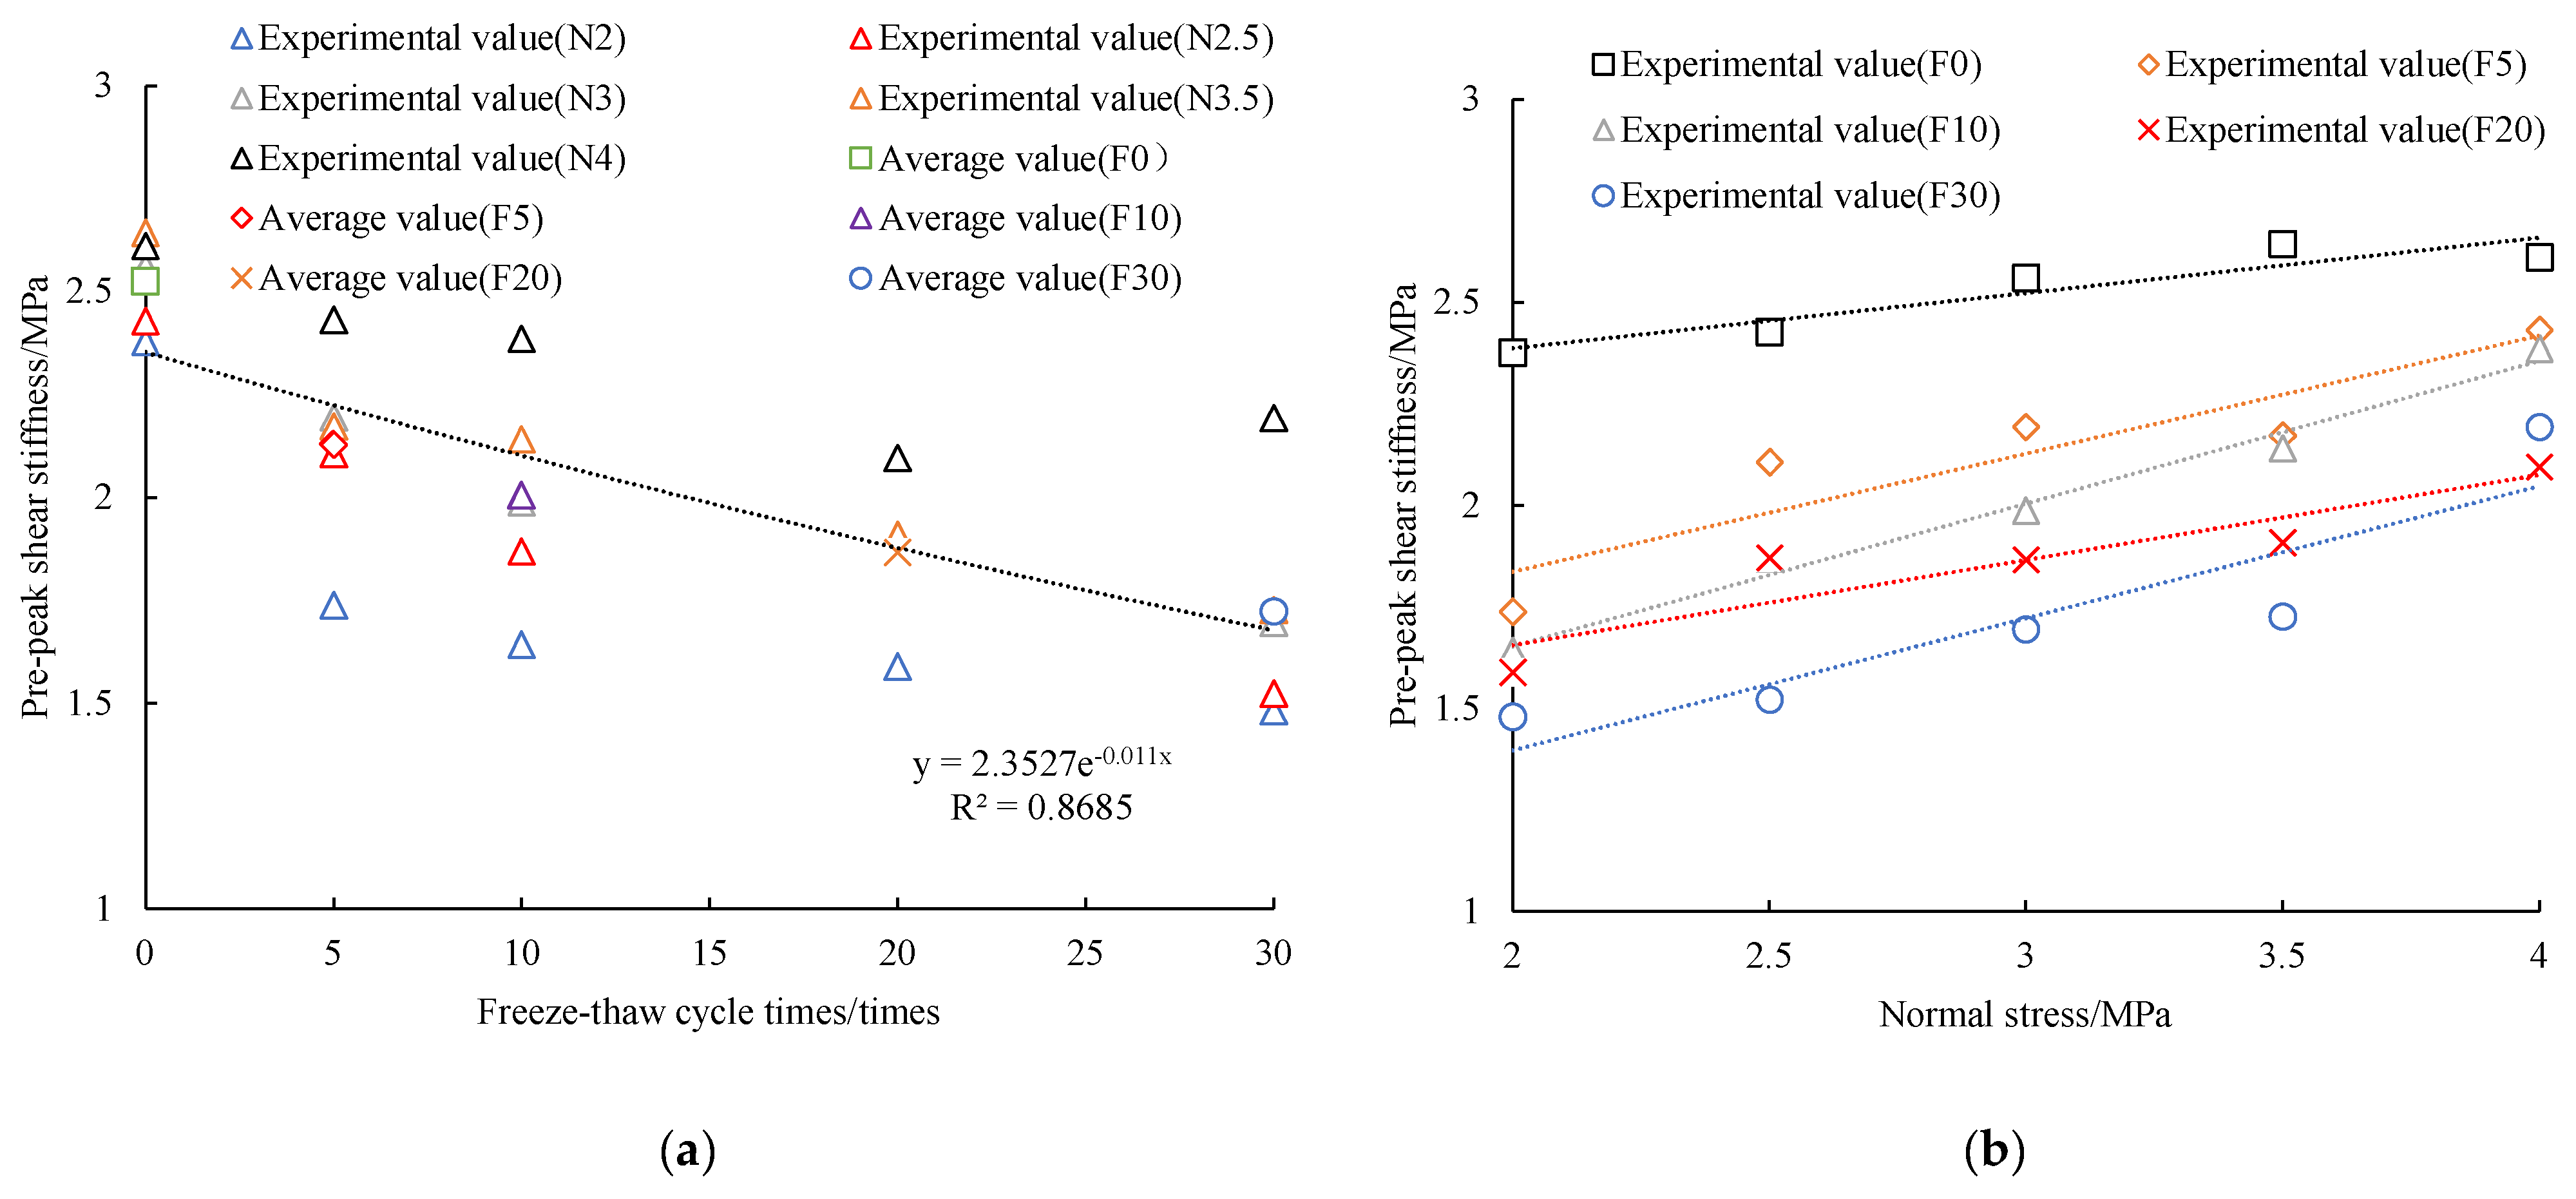
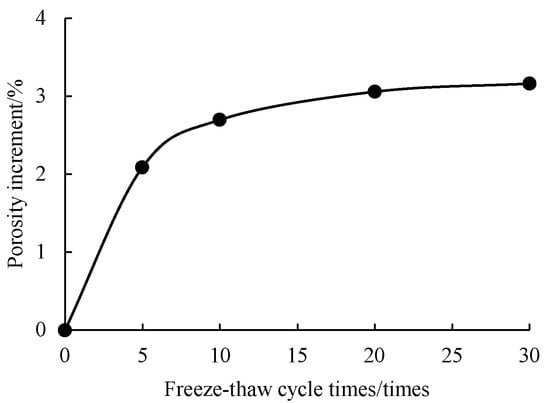
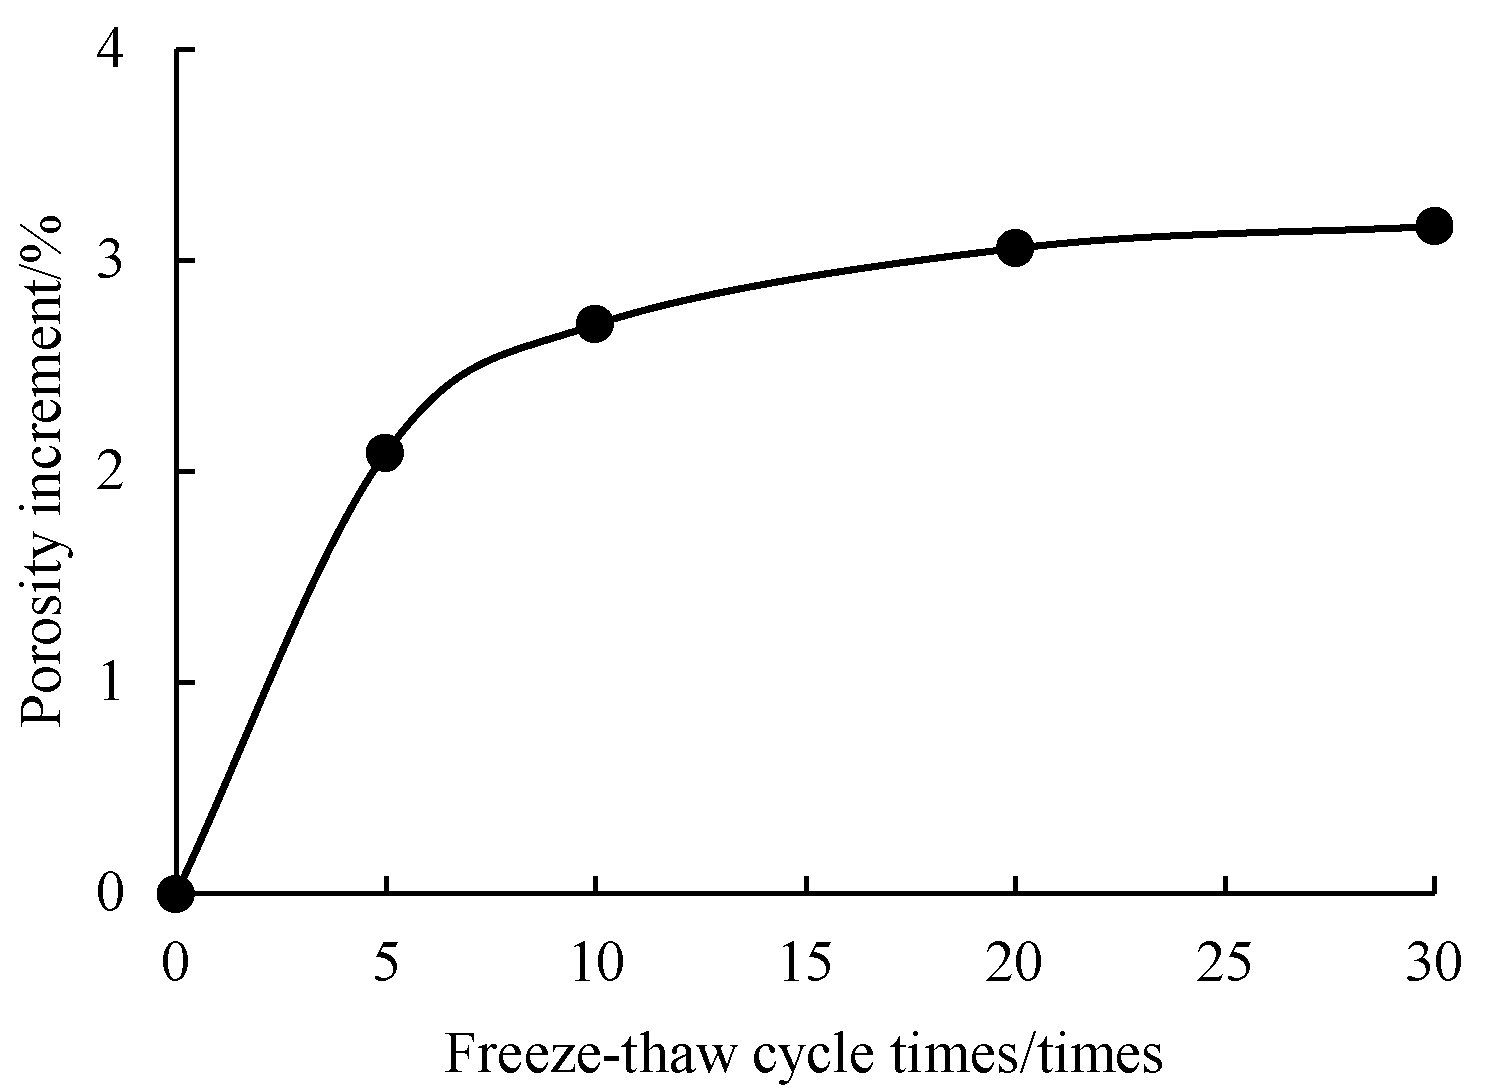
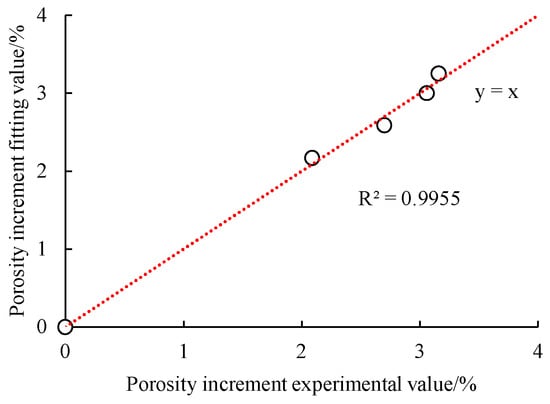
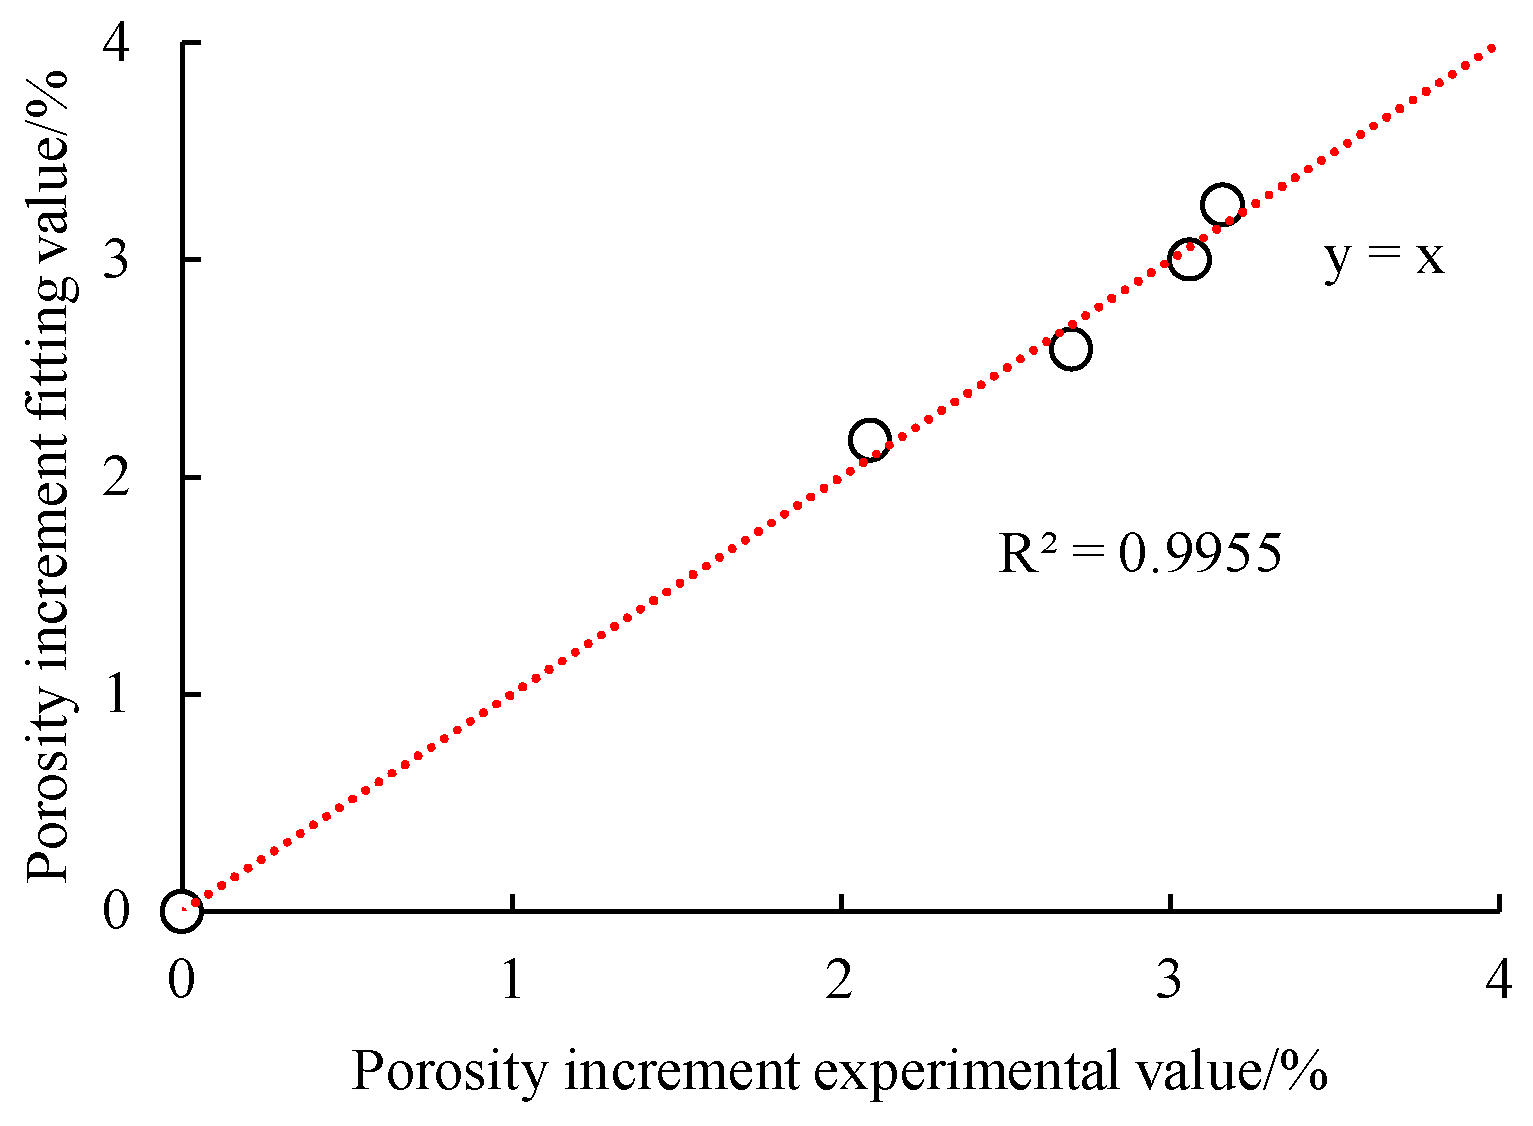
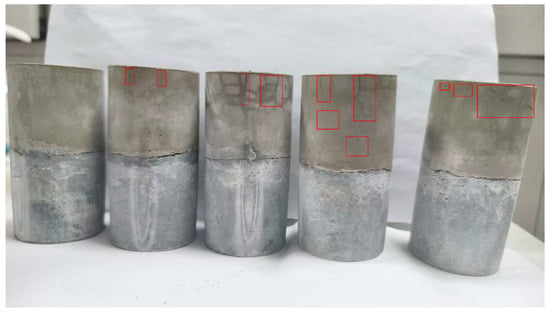
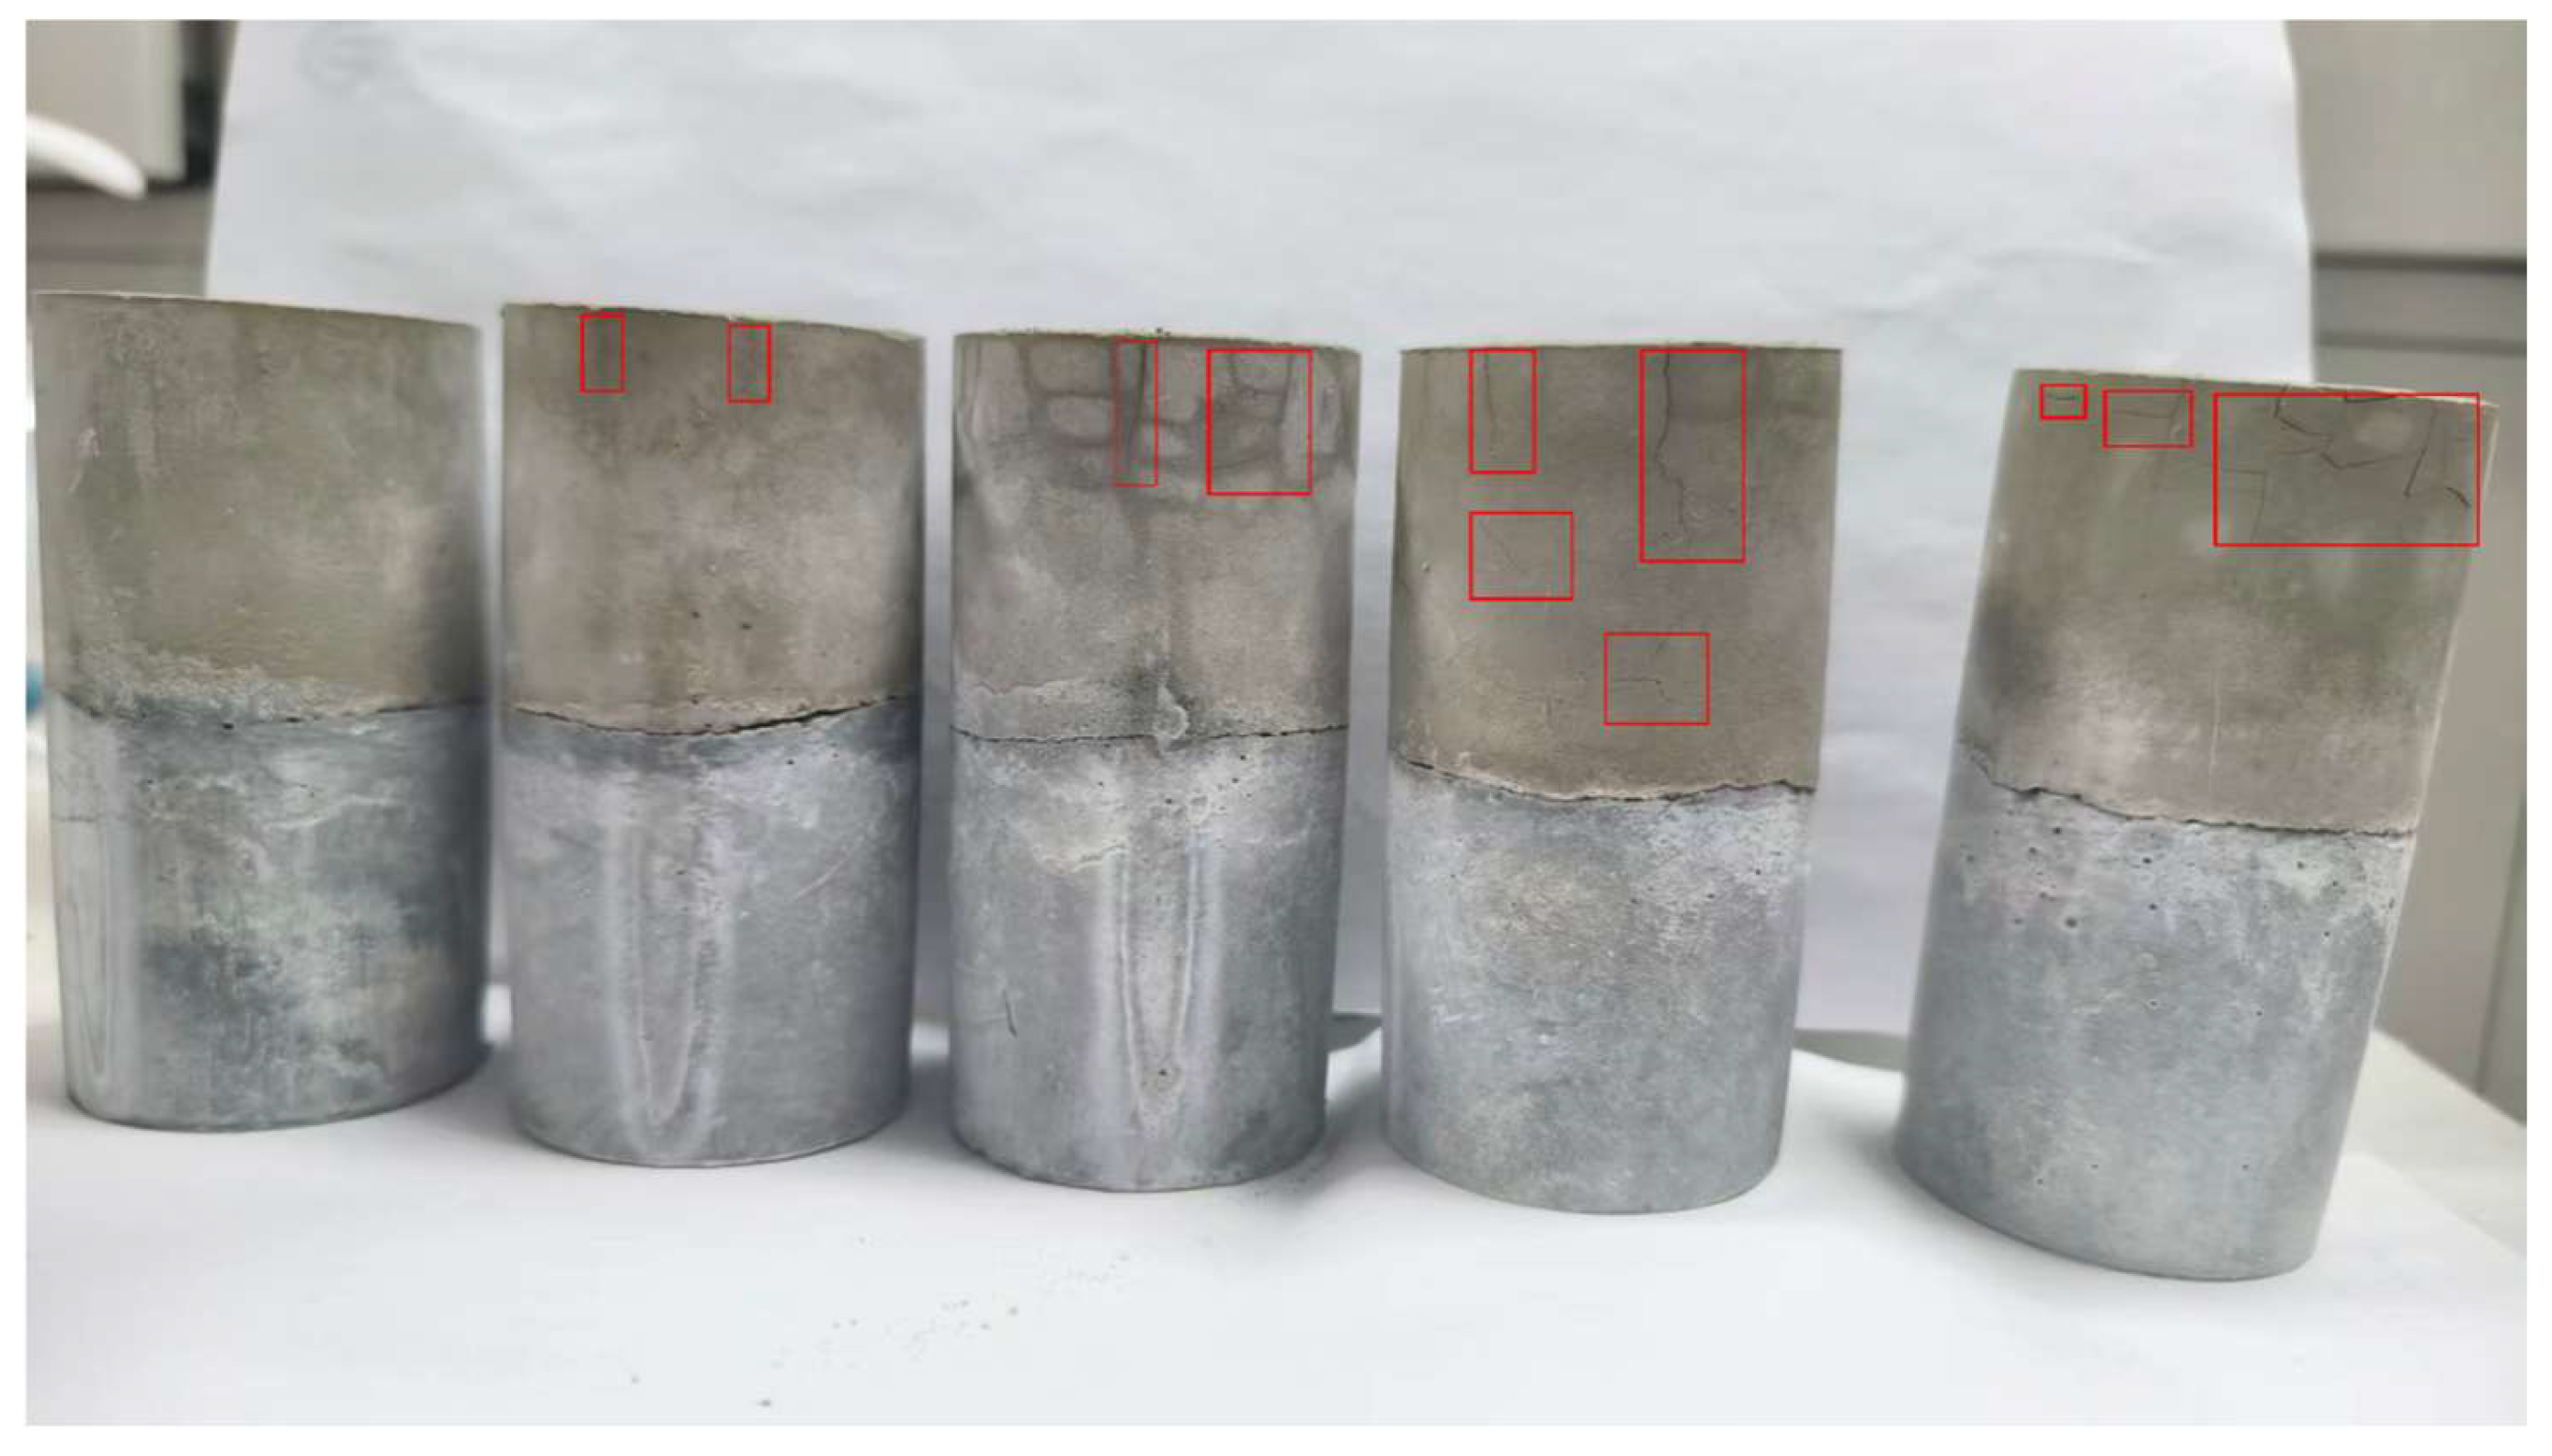
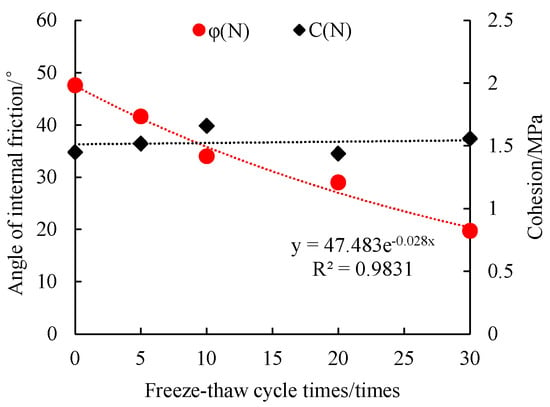
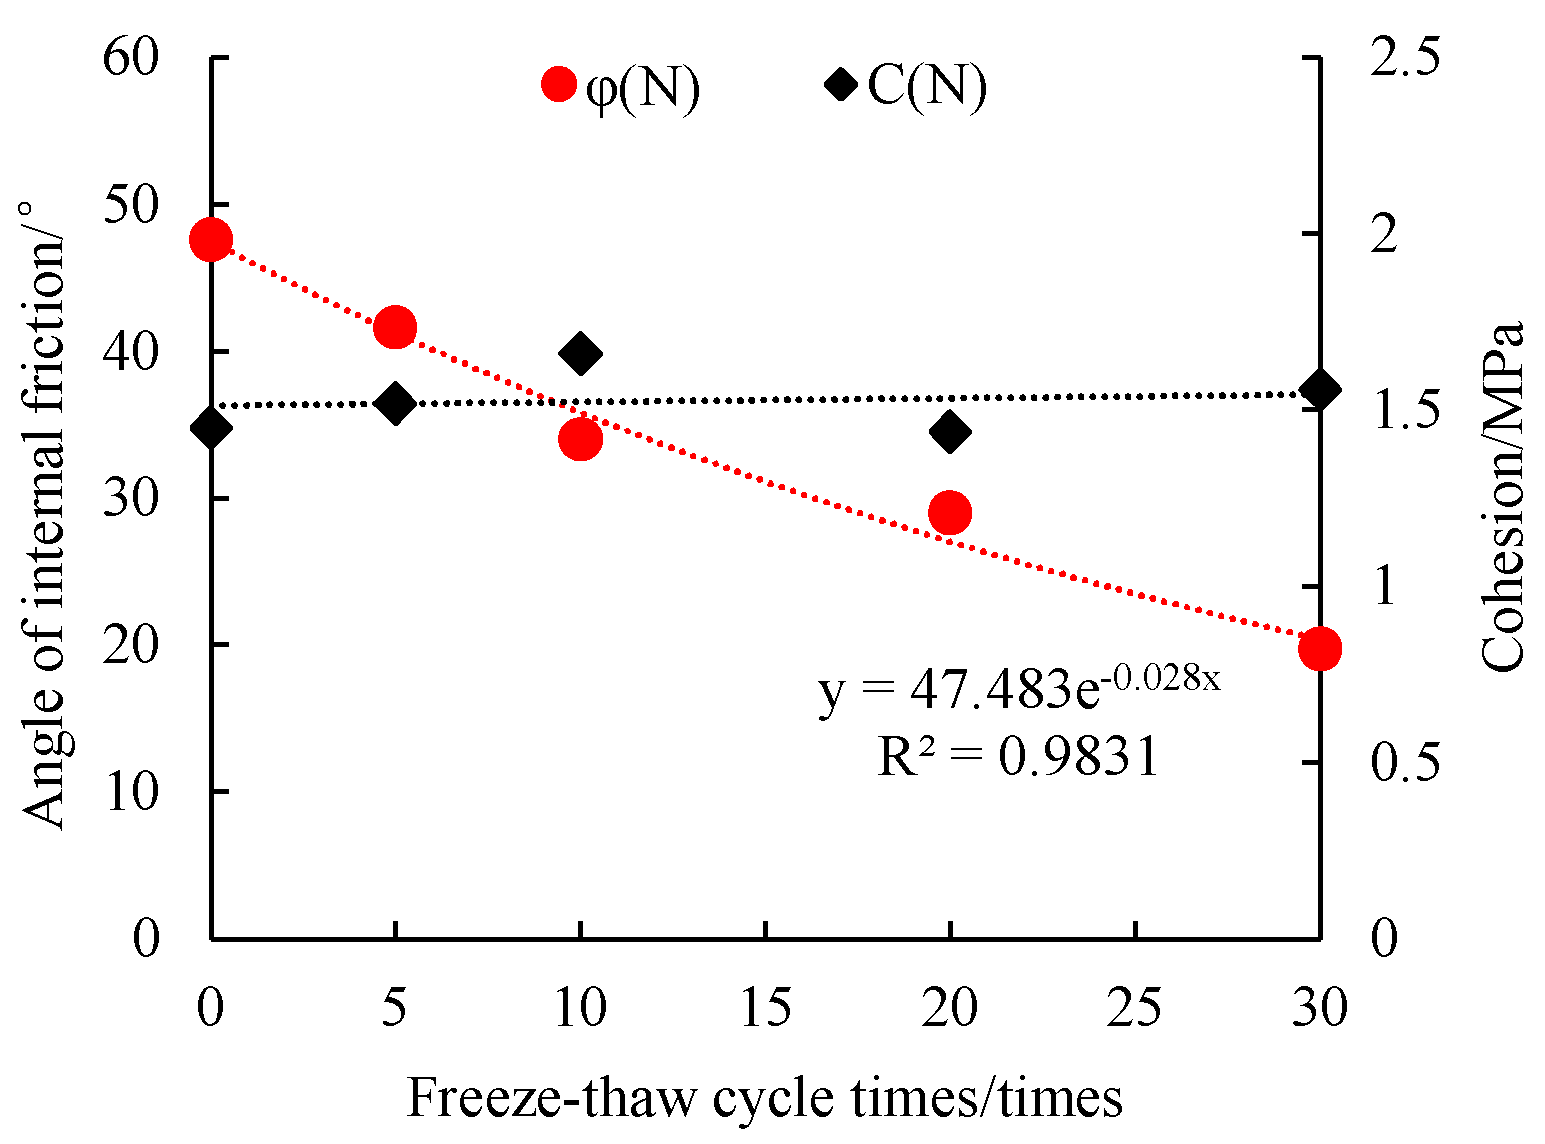
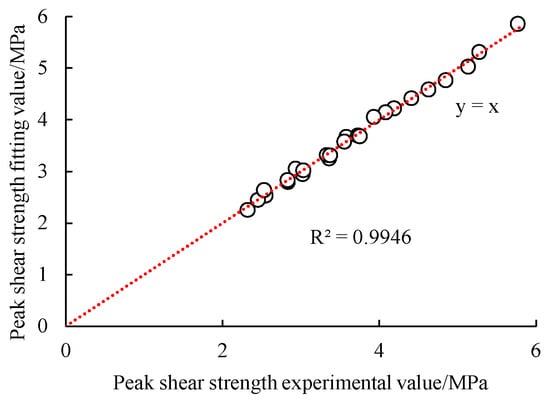
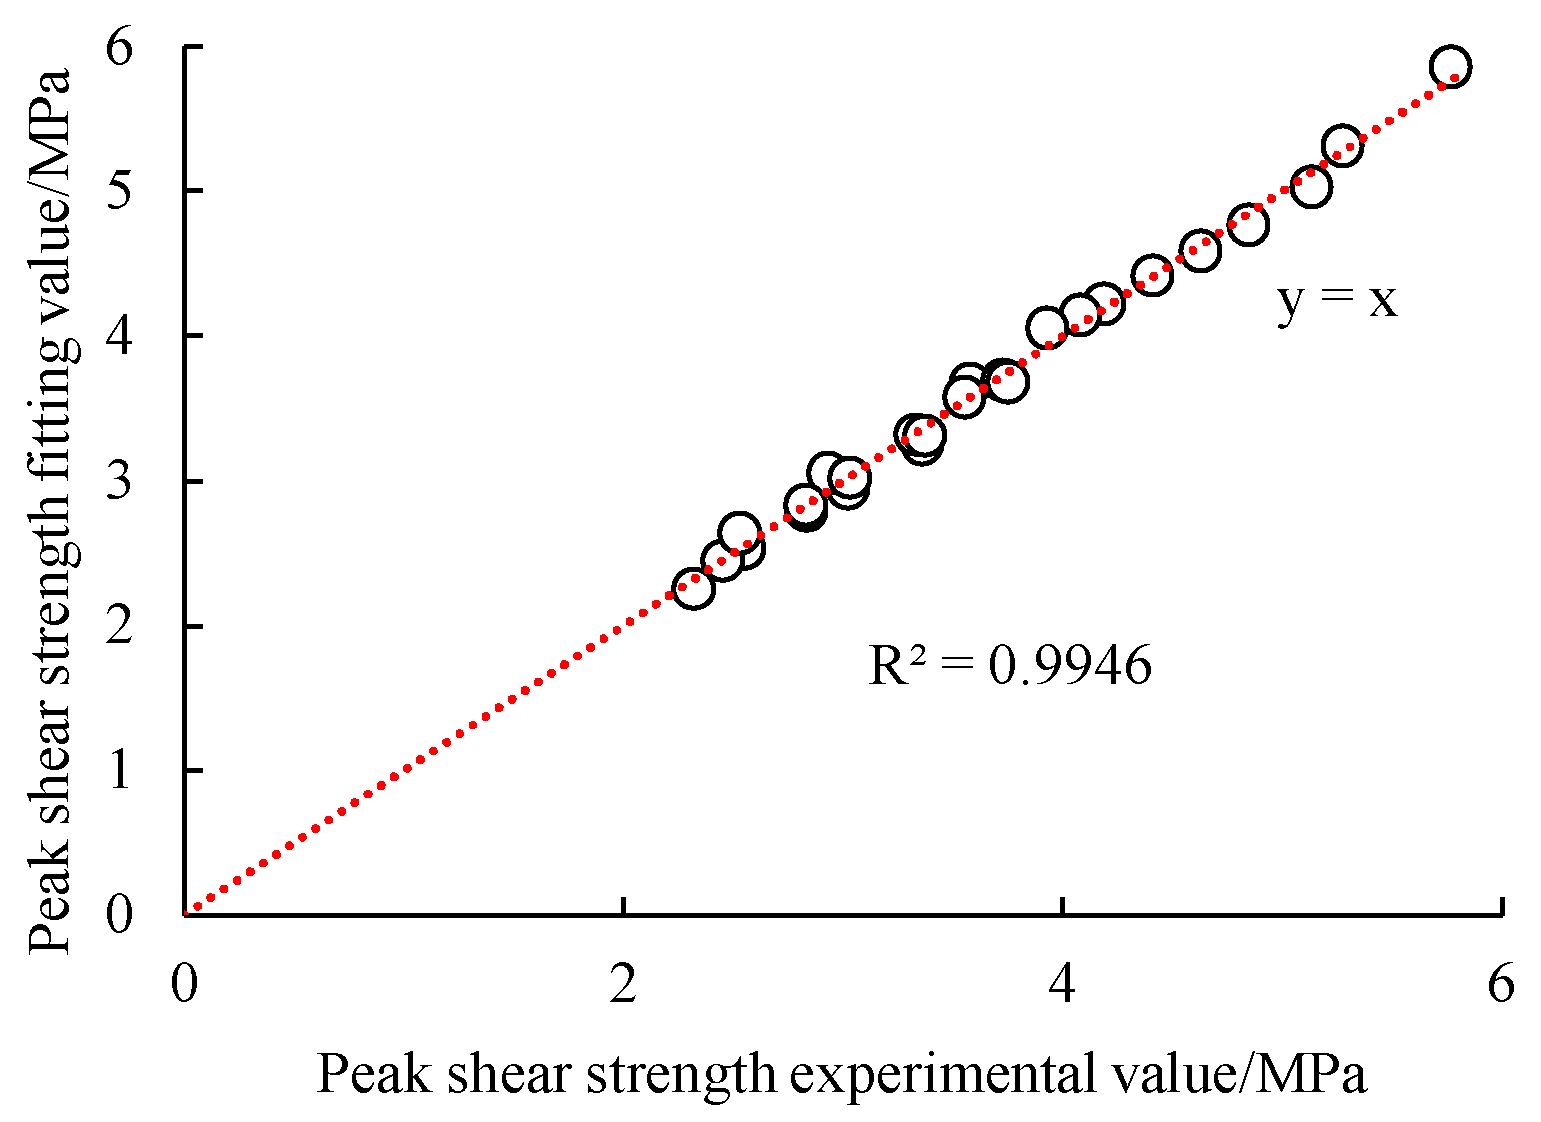
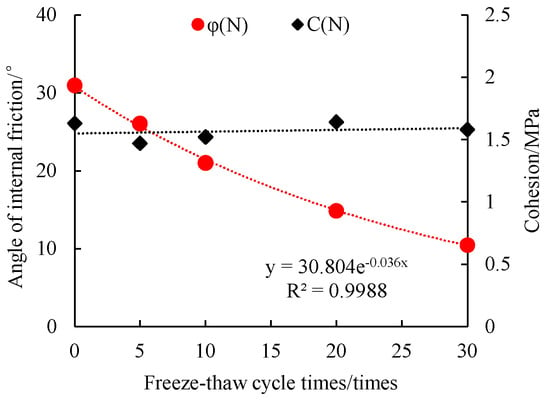
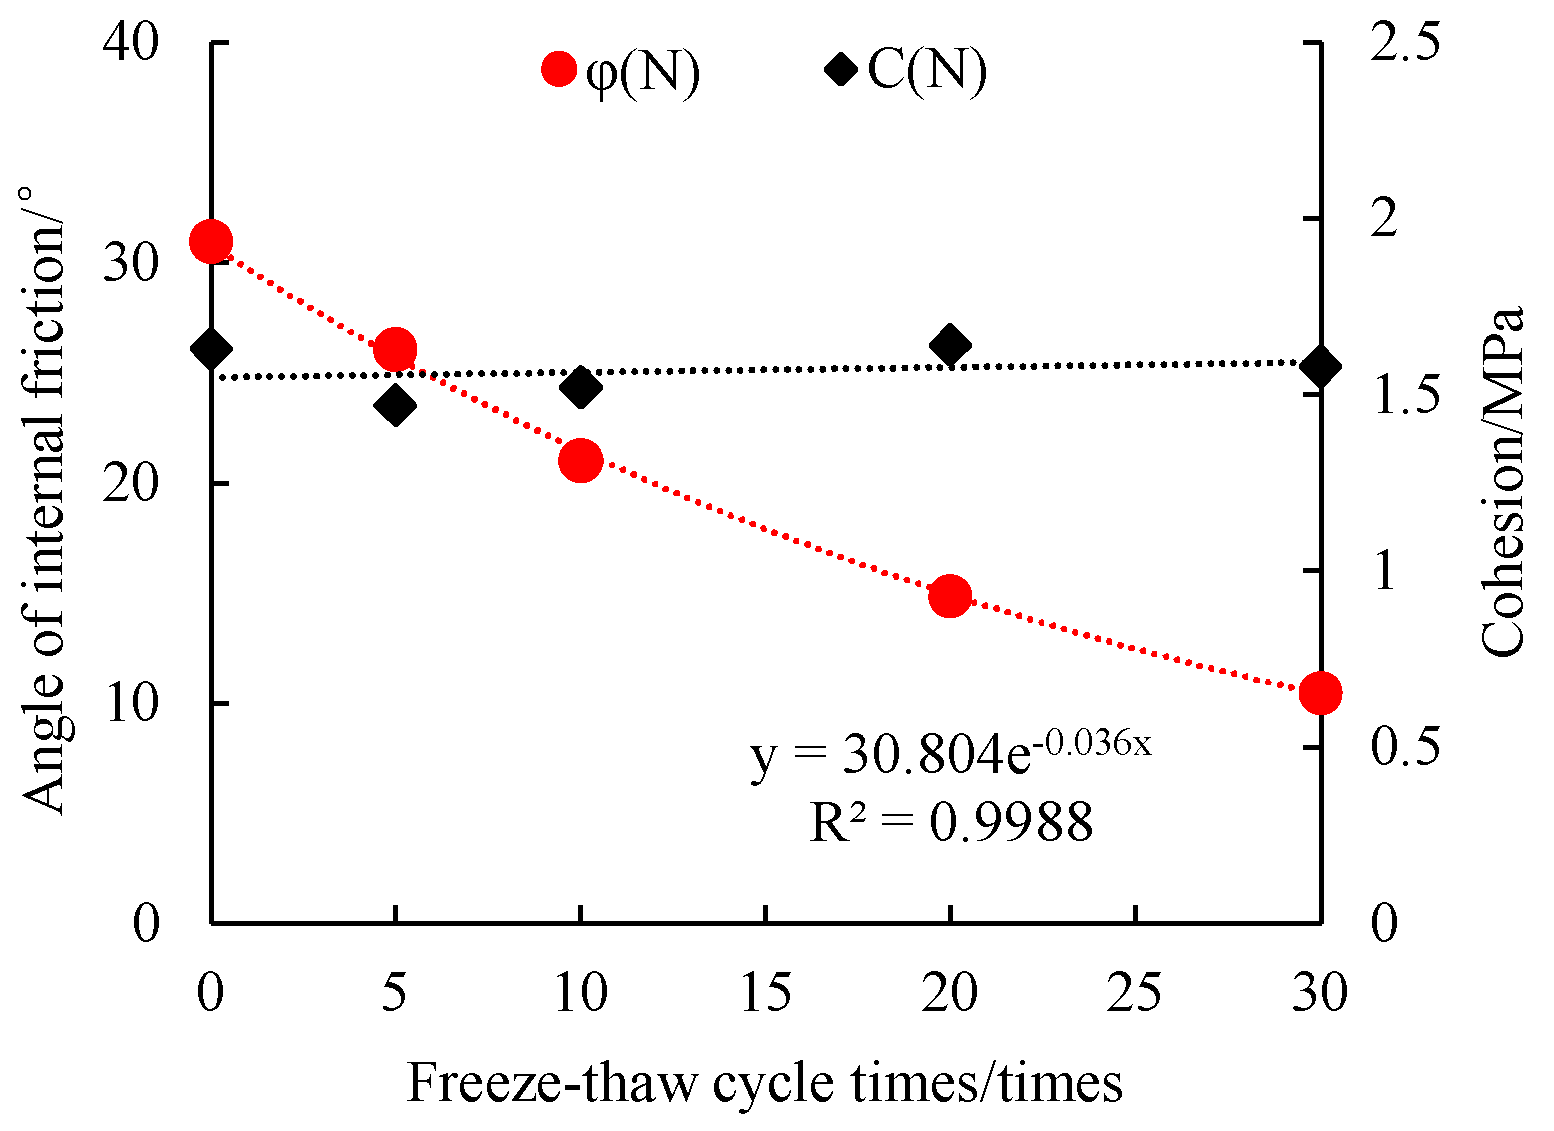
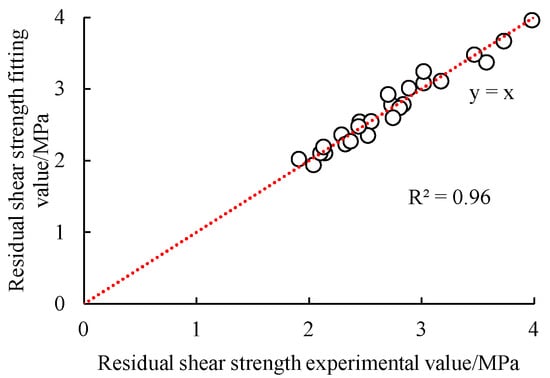
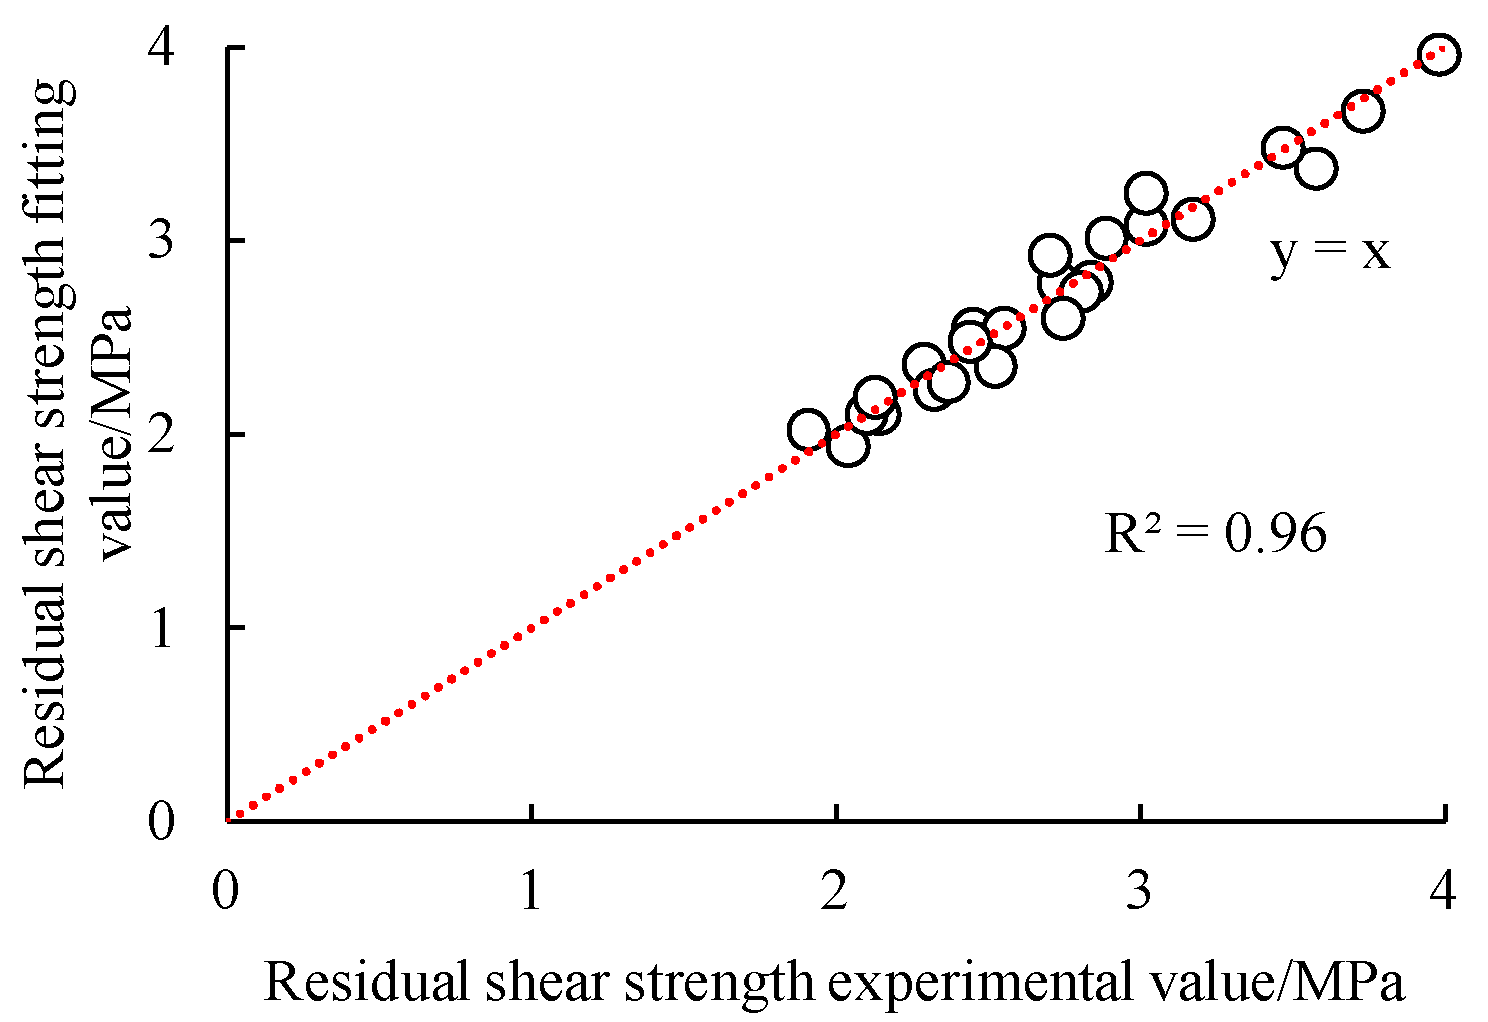
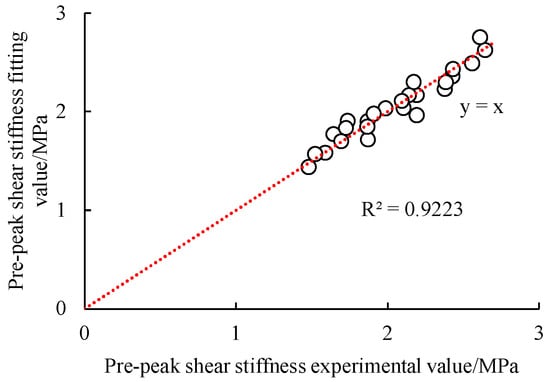
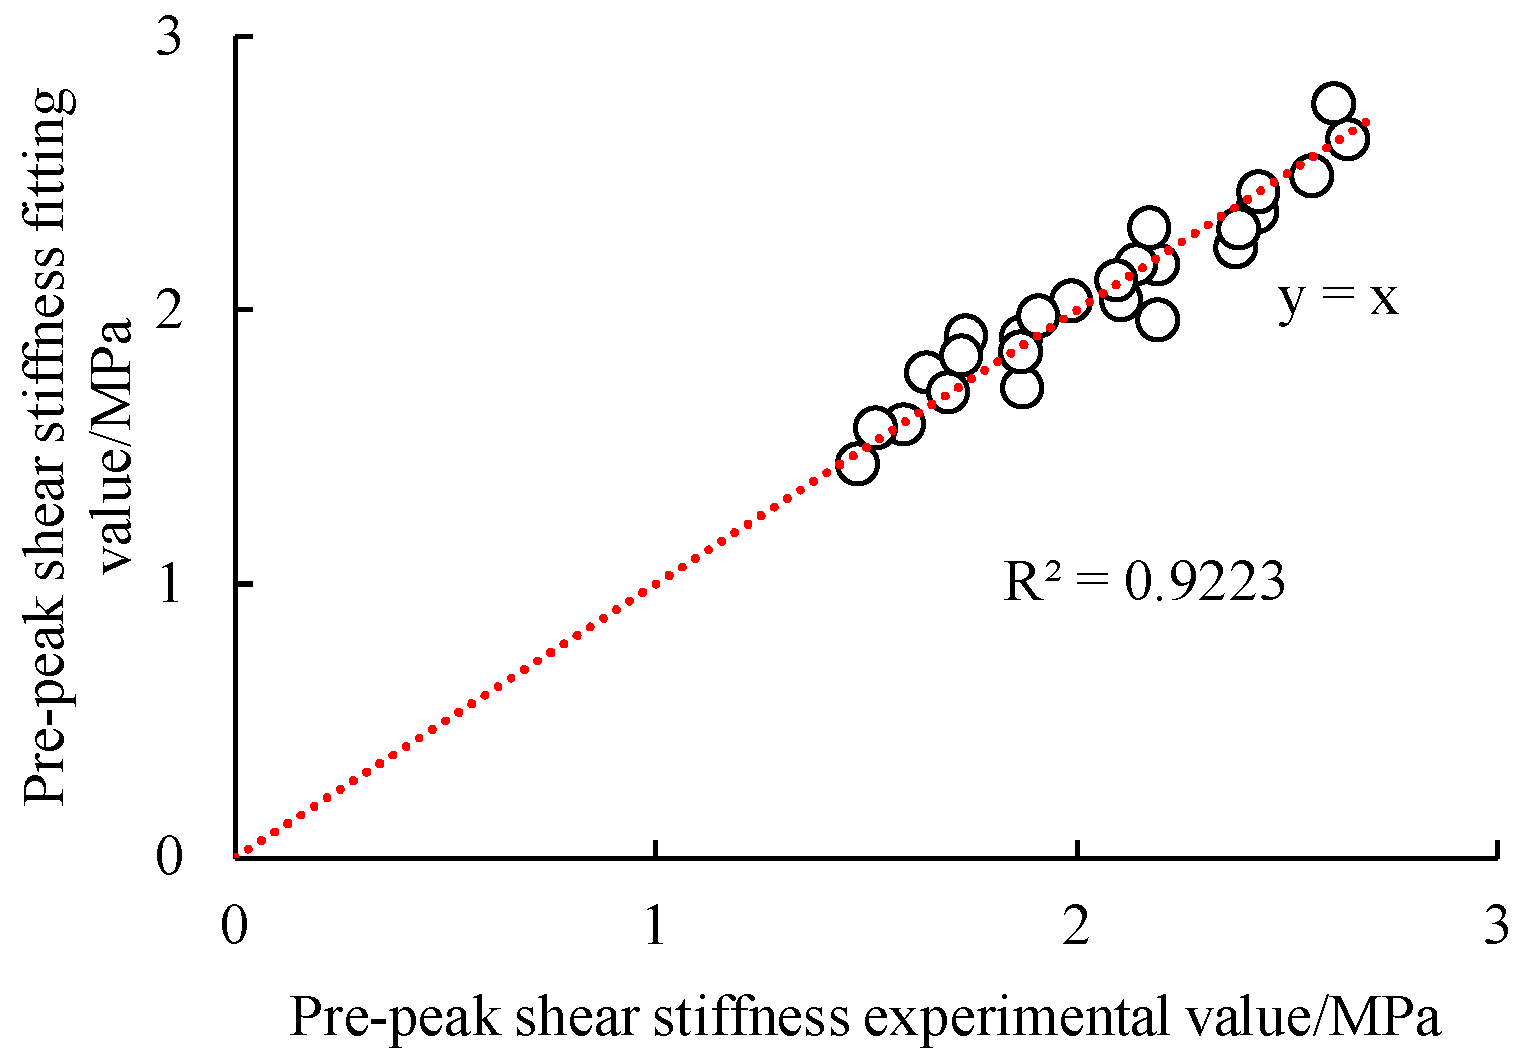
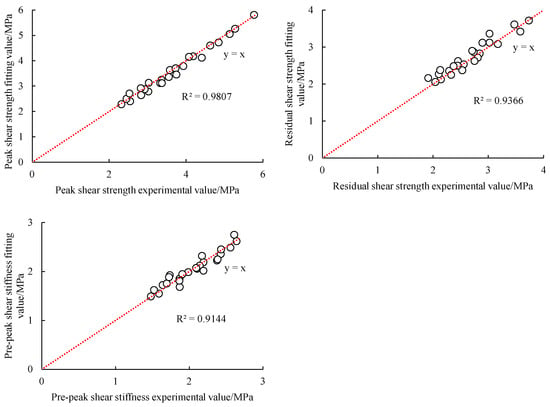
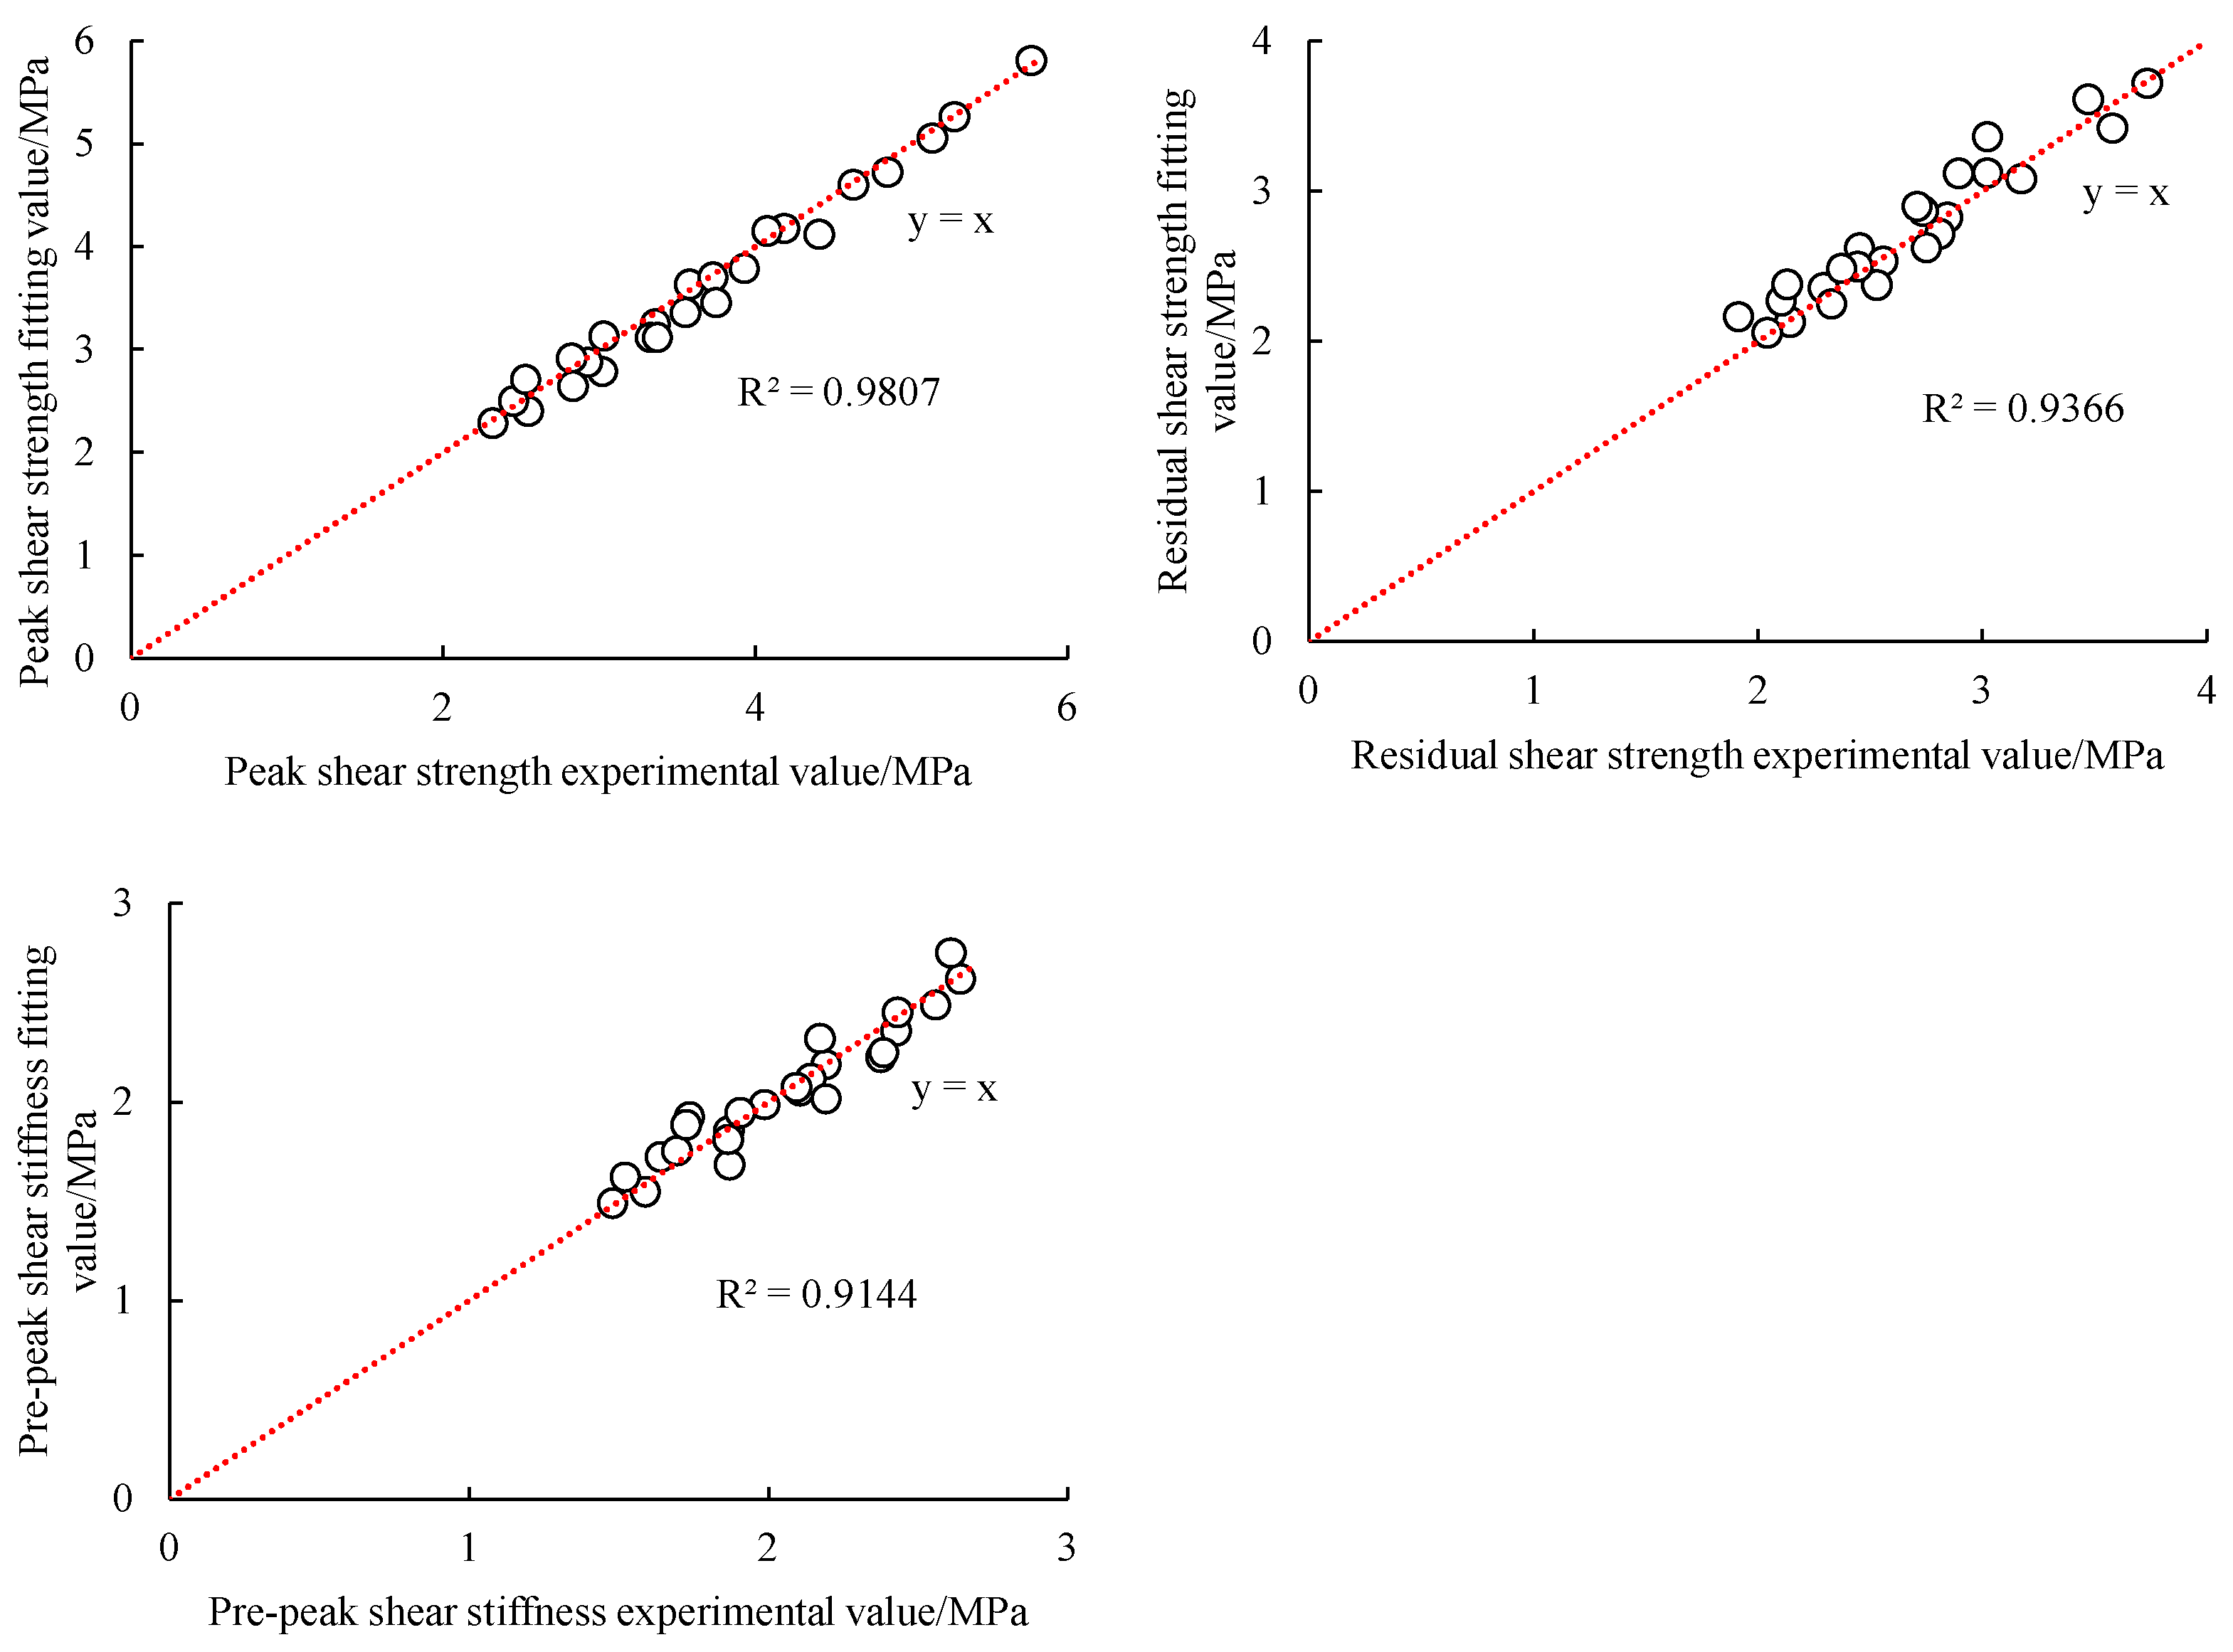
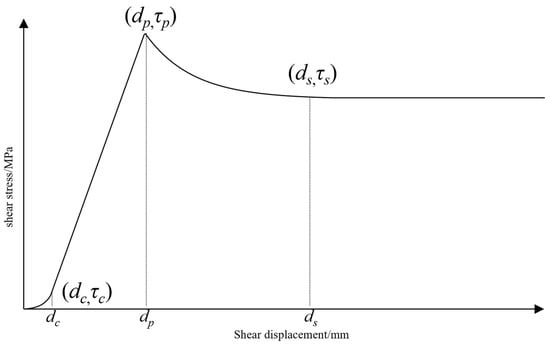
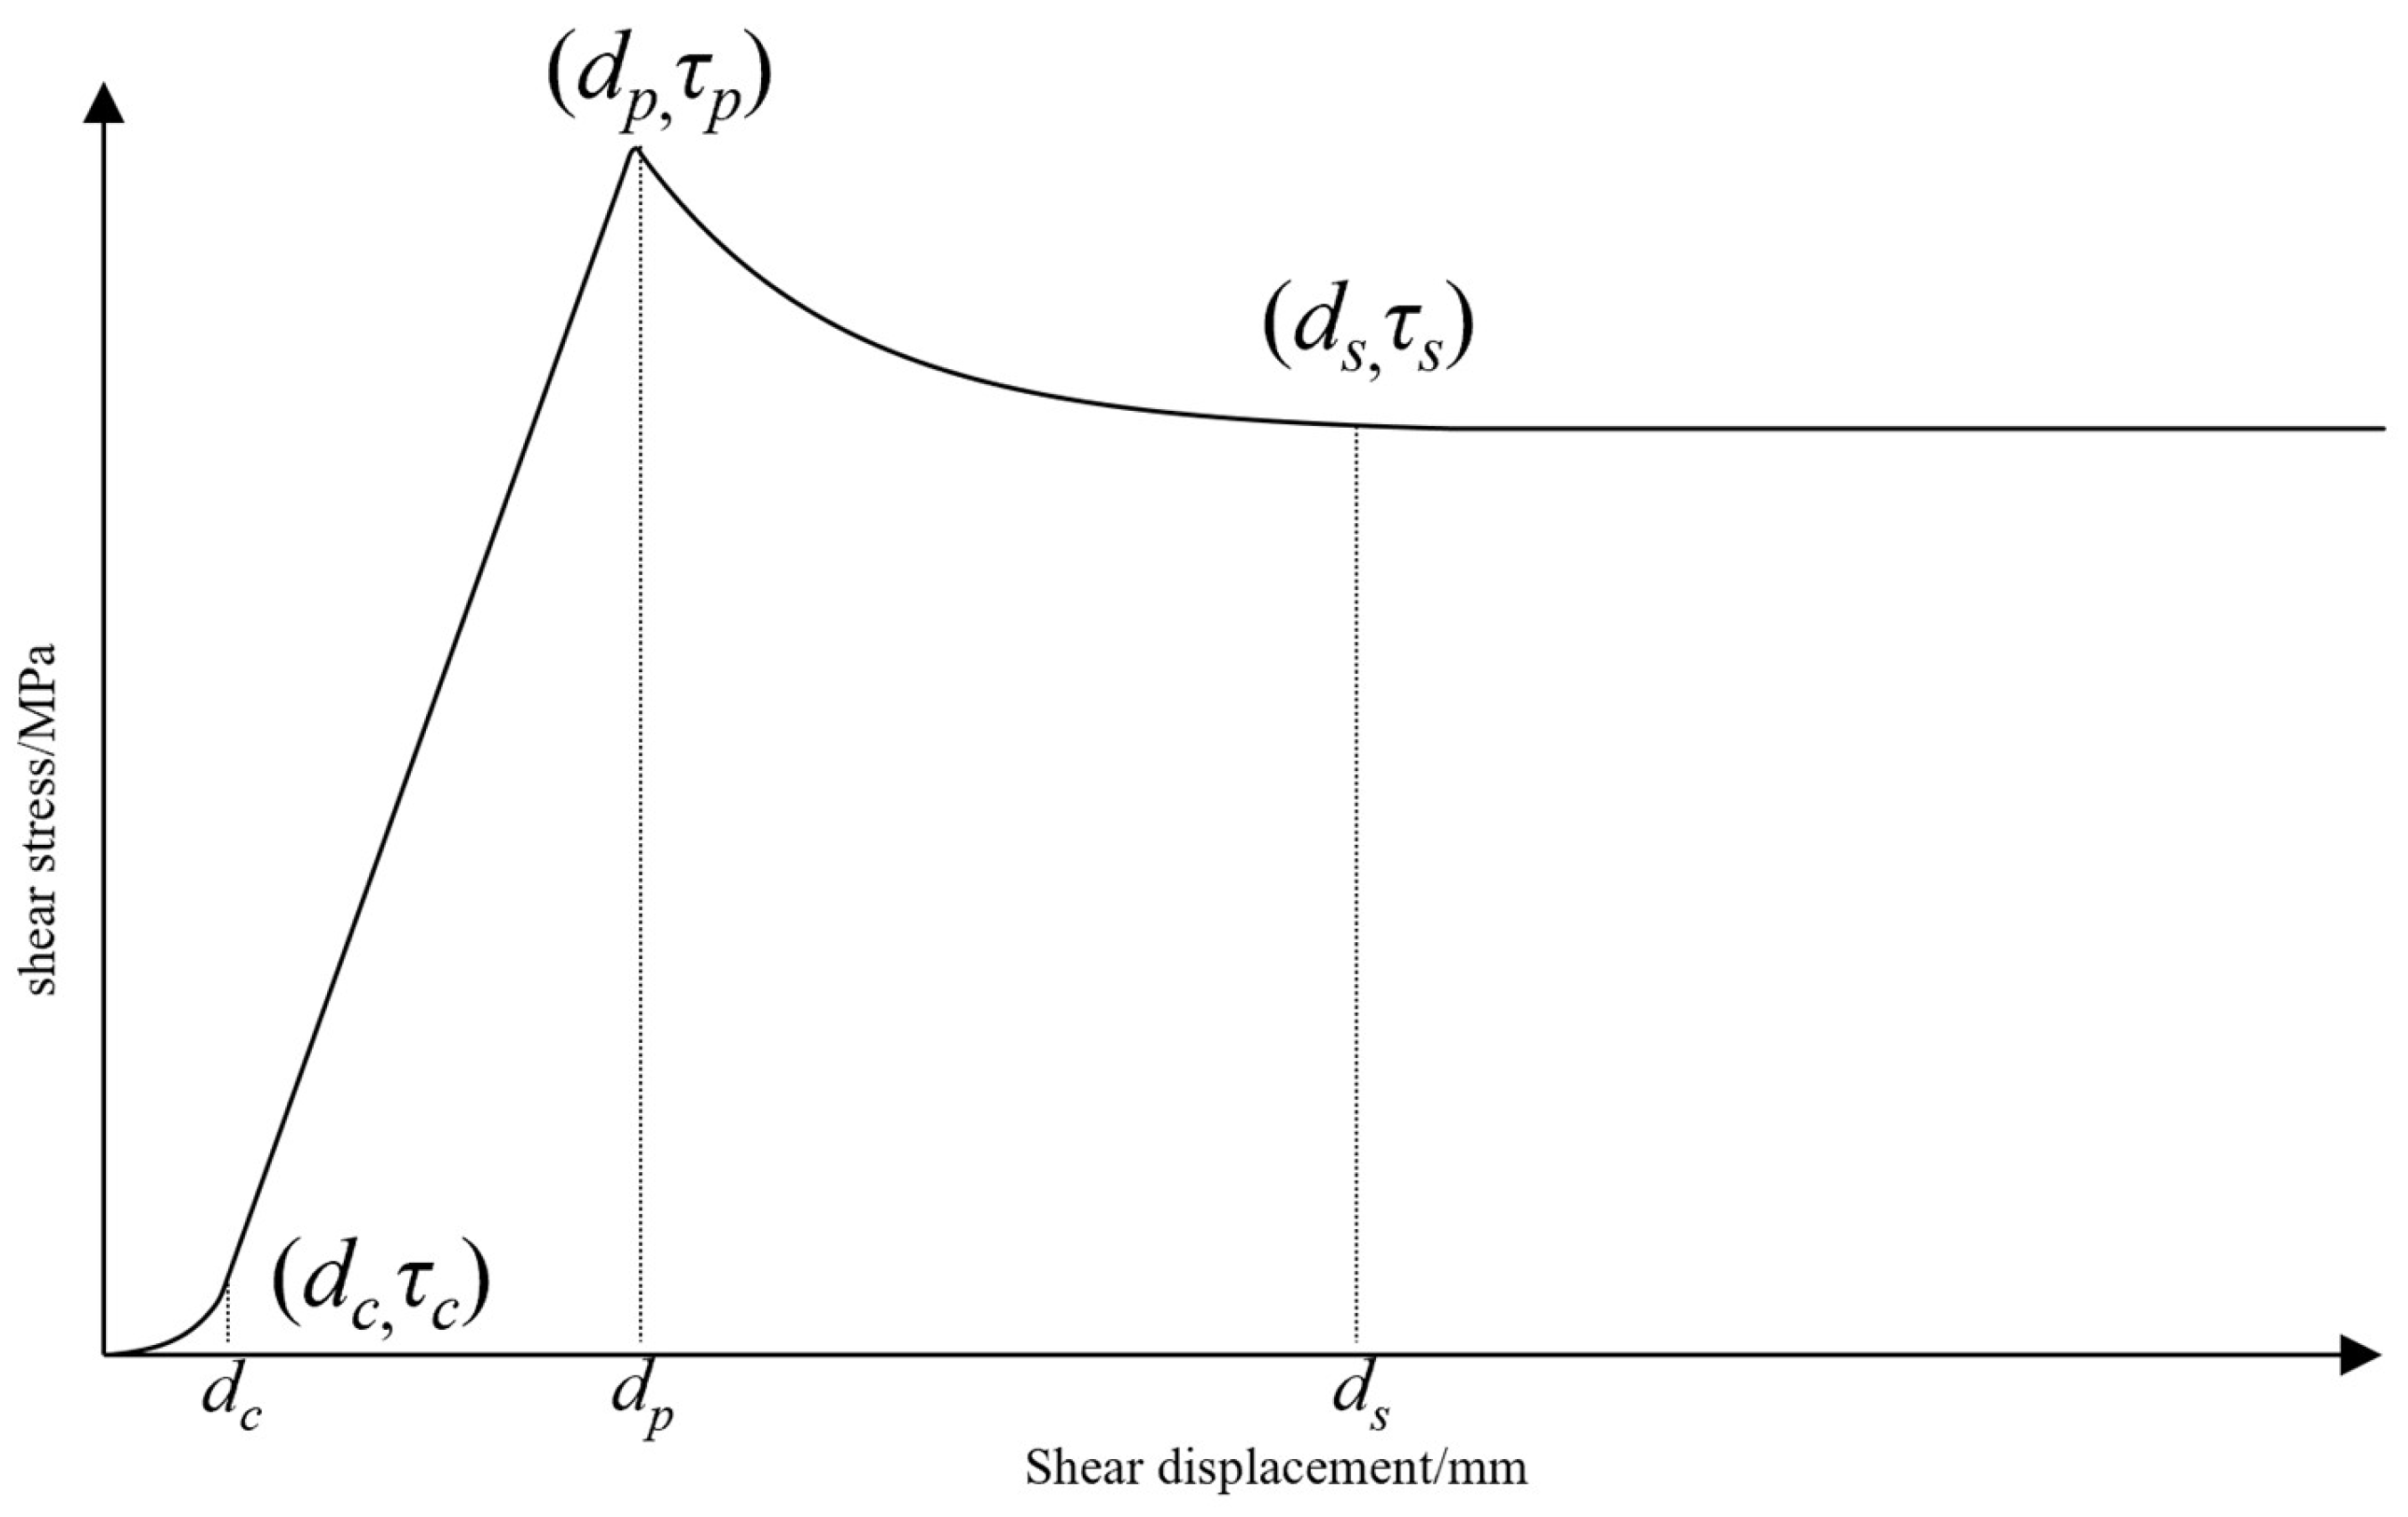
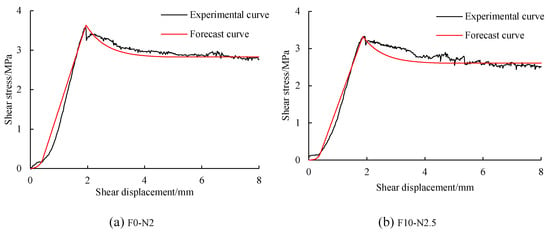
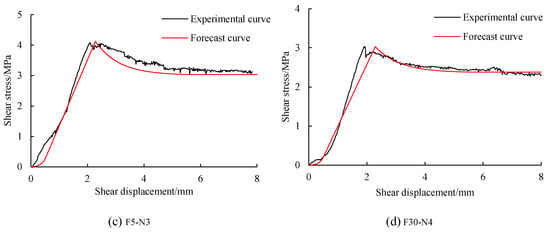
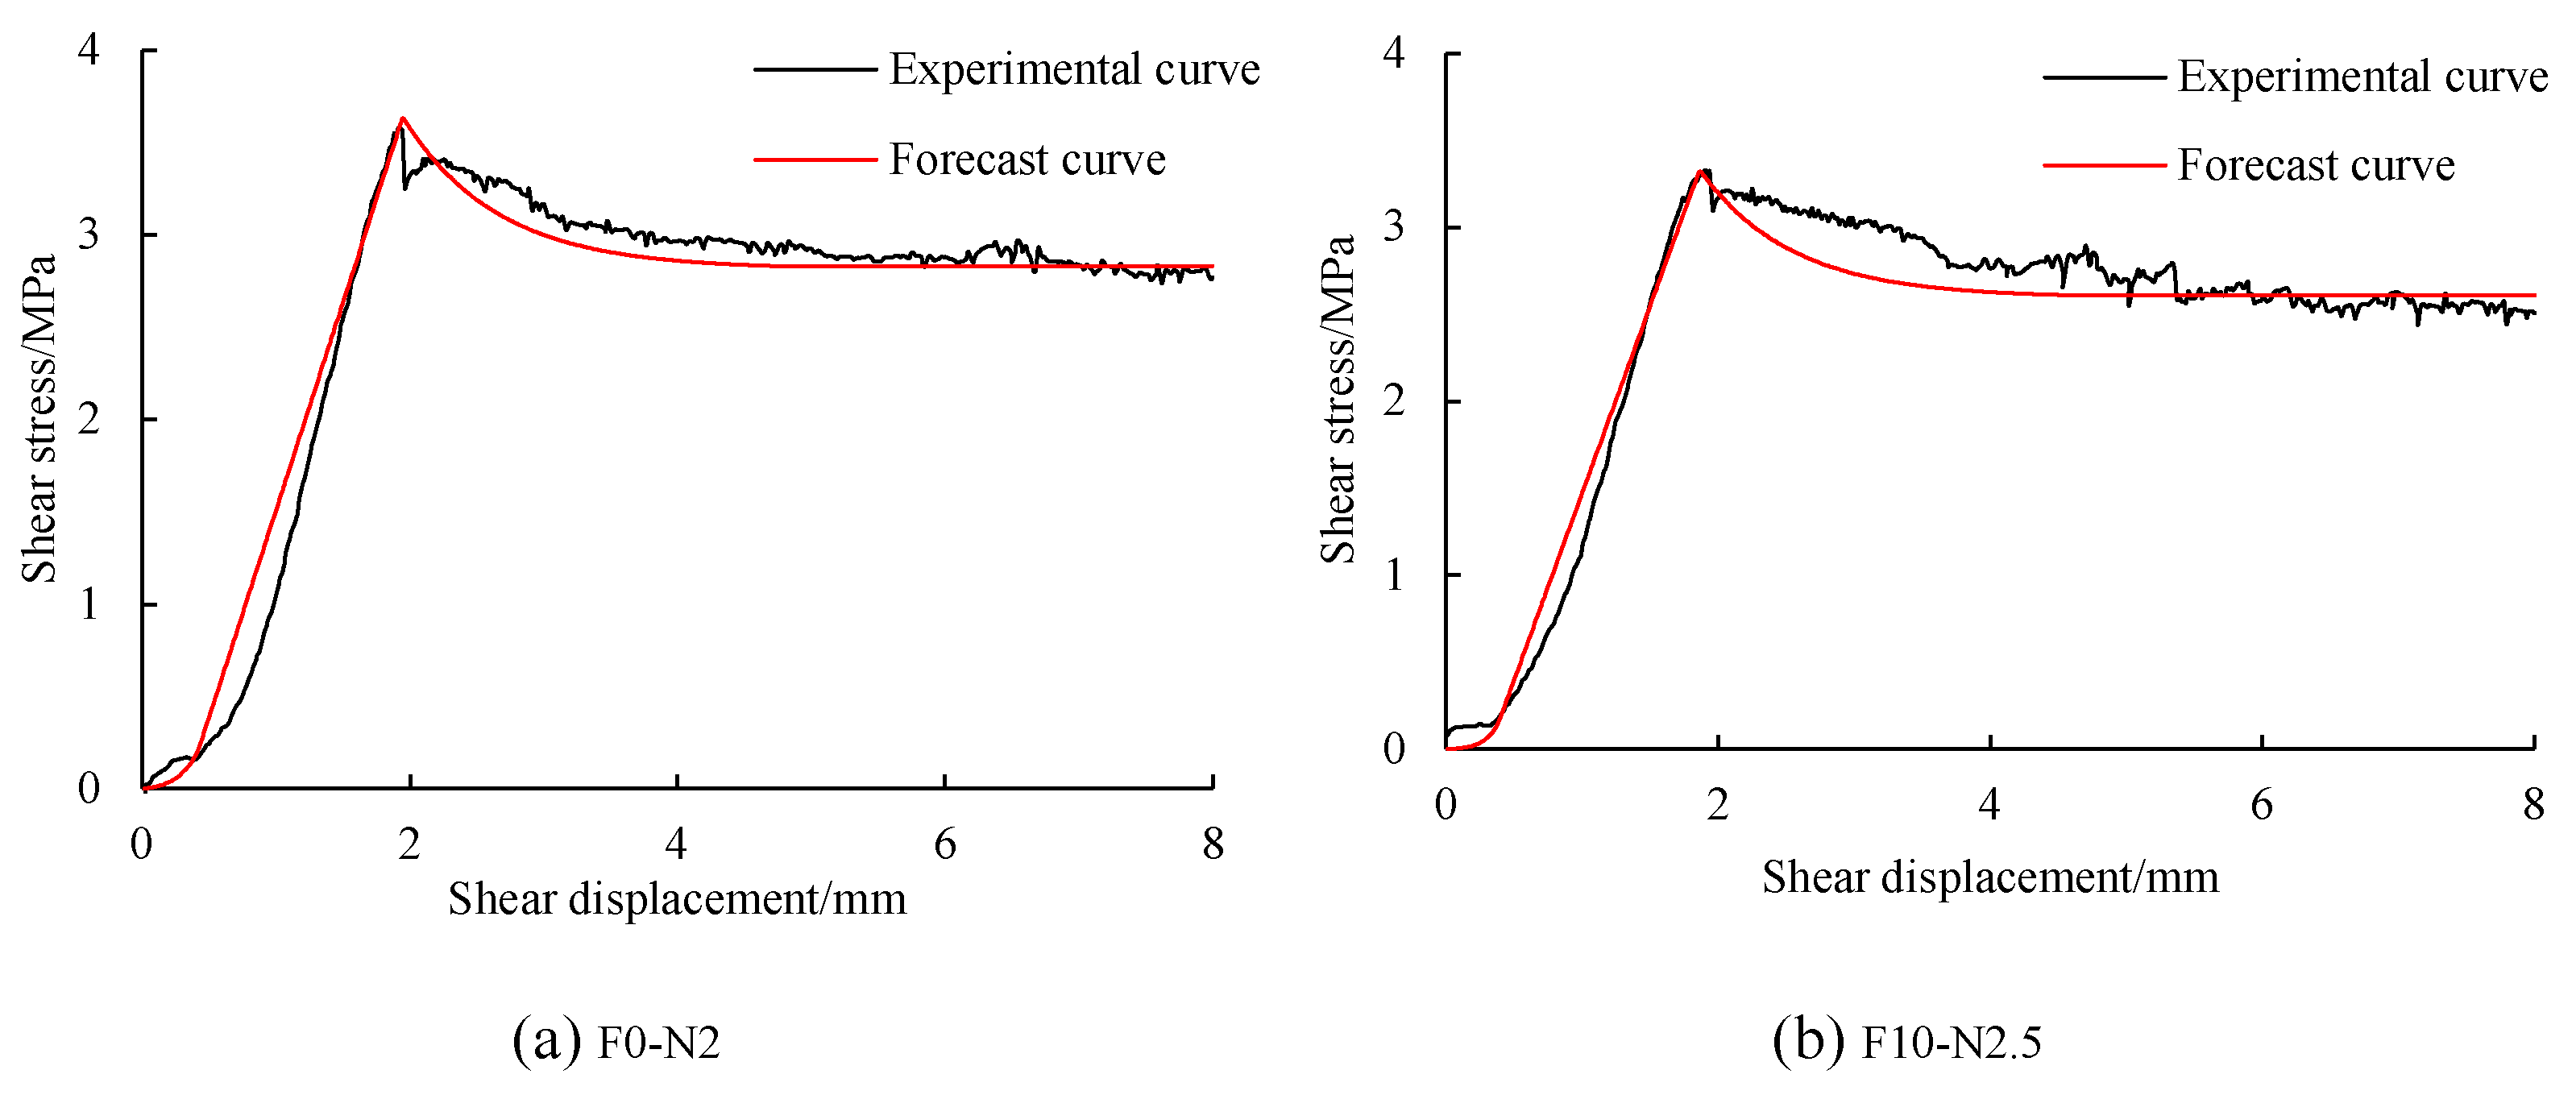
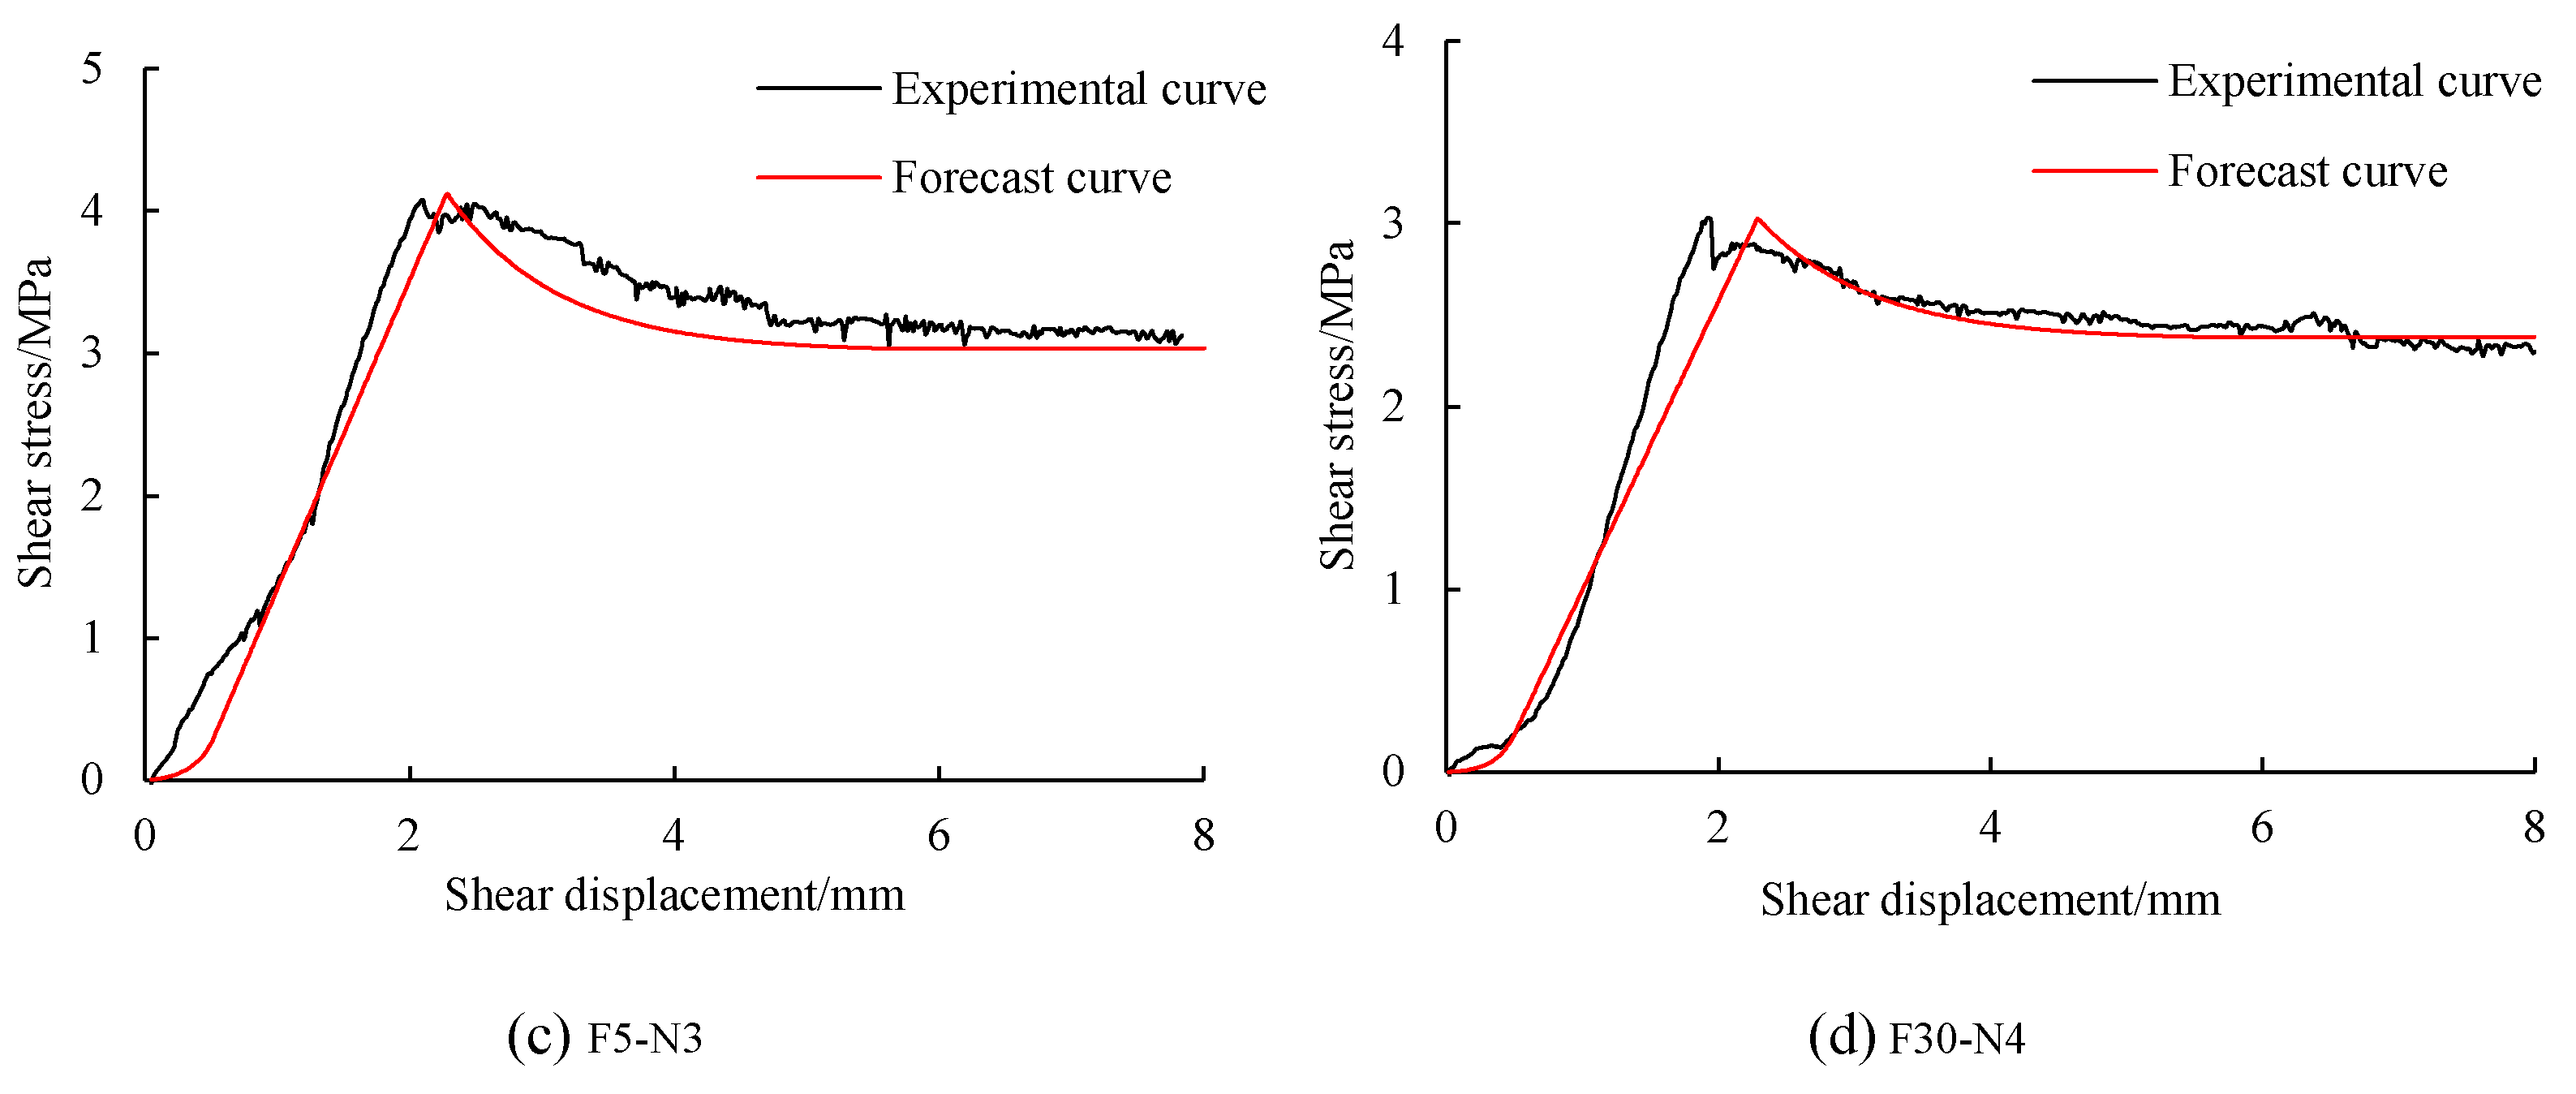

Disclaimer/Publisher’s Note: The statements, opinions and data contained in all publications are solely those of the individual author(s) and contributor(s) and not of MDPI and/or the editor(s). MDPI and/or the editor(s) disclaim responsibility for any injury to people or property resulting from any ideas, methods, instructions or products referred to in the content. |
© 2026 by the authors. Licensee MDPI, Basel, Switzerland. This article is an open access article distributed under the terms and conditions of the Creative Commons Attribution (CC BY) license.