


Abstract
Taking the Daliang Tunnel of the Lanzhou–Xinjiang High-speed Railway crossing a reverse strike-slip fault as the engineering background, seismic damage investigations of the Daliang Tunnel and other cross-fault tunnels under earthquake action were conducted. Using 1:50 meso-scale model tests, experimental analyses were carried out on the lining strain response, internal crack development and failure, and surrounding rock pressure variation during fault dislocation. The failure modes and mechanisms of tunnels crossing reverse strike-slip faults were thoroughly explored. Meanwhile, a three-dimensional numerical model of the Daliang Tunnel was established to investigate the influence of dislocation modes with structural zonation within the fault zone on the surrounding rock response. The results indicate that the damage and strain response of the tunnel lining are mainly distributed within the fracture zone, predominantly characterized by combined oblique shear and compression failure. Due to the displacement of the lining induced by strong surrounding rock movement, surrounding rock pressure exhibits considerable variation at the boundaries of the fracture zone, accompanied by certain void detachment phenomena. The overall deformation of the tunnel crossing the reverse strike-slip fault presents an “S”-shaped pattern, which is consistent with the numerical simulations. The compression and dislocation morphology of the sidewalls within the rupture surface is in good agreement with the point cloud plan view. The compressive deformation and strain of the surrounding rock are most significant within the rupture surface. Meanwhile, the soft-to-hard transition segments between the new fracture zone and the rupture surface, as well as between the rupture surface and the influence zone, exhibit a trend of first decreasing and then increasing.
1. Introduction
With the continuous development of China’s economy and transportation infrastructure, transportation construction projects have extended into the western regions characterized by complex geological conditions and frequent seismic activity. These areas are characterized by well-developed active faults and high seismic intensity. Key national projects such as the Sichuan-Tibet Railway, the Lanzhou-Xinjiang High-Speed Railway, and the Jakarta-Bandung High-Speed Railway inevitably involve tunneling through active faults. Seismic damage investigations indicate that the most severe damage to tunnels occurs precisely in sections crossing active fault zones. Therefore, understanding the failure characteristics of tunnels traversing active faults and ensuring the safety of cross-fault tunnels represent critical issues in tunnel seismic resistance.
In response to earthquake-induced tunnel damage, numerous scholars domestically and internationally have conducted seismic damage investigations and studied the mechanical response characteristics and failure mechanisms of tunnels crossing active faults through theoretical analysis, numerical simulation, and model testing.
Roy and Sarkar conducted a review of seismic damage cases of tunnels in China and Japan, summarized the failure characteristics of tunnel structures, and discussed the main factors influencing the seismic damage of mountain tunnels [1]. Based on the seismic damage survey data of the Shaohuoping Tunnel from the Wenchuan earthquake, Yu et al. summarized its failure modes and conducted damage simulations on key sections such as the tunnel portal and the tunnel body [2]. M. Kiani et al. investigated the influence of tunnel burial depth and fault dip angle on segmented tunnel structures under normal fault dislocation via model tests, finding that the length of tunnel affected by faulting decreases with increasing overburden depth [3]. Cilingir investigated the seismic dynamic response of tunnel surrounding rock under the influence of different parameters, including lining stiffness and tunnel burial depth [4]. Baziar et al. simulated the interaction between the tunnel and surrounding rock under reverse fault dislocation using the finite element method, investigating the influence of parameters such as lining stiffness on crack propagation in the surrounding rock, and validated the numerical results through centrifuge model tests [5]. Demirci et al. investigated the failure modes of buried pipelines crossing reverse faults through model tests and numerical simulations, analyzing the influence of pipeline relative stiffness and burial depth on the mechanical response patterns of pipeline failure [6]. Li et al. investigated the deformation and failure characteristics of shield tunnels located in soil under normal fault dislocation. It was found that segment failure exhibits a composite mode of ring joint tension and longitudinal joint bending, with significant opening of the ring joints [7]. Cai et al. investigated the coseismic rupture patterns of soil layers induced by normal fault dislocation and their impact on tunnel deformation using a geotechnical centrifuge. The results indicate that under normal fault action, the tunnel experiences vertical compression and transverse tension, with concrete cracking primarily occurring at the tunnel haunch area [8]. Wang et al. designed a large-scale quasi-static test at a 1:40 scale to reveal the failure mechanism of tunnels under normal fault dislocation. The study shows that during normal fault displacement, a triangular shear zone gradually forms within the fractured surrounding rock, and the tunnel located within this shear zone is primarily subjected to combined bending-shear action [9,10]. Gao et al. conducted a systematic study on the deformation characteristics and failure mechanisms of tunnels under strike-slip fault displacement through a large-scale model test at a 1:35 ratio. It was found that the tunnel primarily undergoes shear failure at the fault zone, with bending failure occurring on both sides, and the influence on the hanging wall is significantly greater than that on the footwall [11]. Li et al., focusing on the shield tunnel of Jinan Metro Line 4 crossing the Qianfo Mountain Fault, established a detailed three-dimensional model reflecting the tunnel’s structural details (lining segments, transverse and longitudinal bolts) to study the failure modes of shield metro tunnels under normal and reverse fault actions. The results indicate that under fault displacement, initial damage in the tunnel appears at the segment ring joints, as well as at the tunnel shoulder and invert [12]. An et al. taking a metro tunnel crossing a fault as the engineering background, established an integrated three-dimensional model comprising the soil layer, tunnel, and fault bedrock to investigate the damage and failure modes of the tunnel under reverse fault motion. The results indicate that under strike-slip fault dislocation, the damage to the lining structure is most severe at the haunch area, followed by the tunnel invert, while the damage at the crown is relatively minor [13]. Qiao et al. established a three-dimensional finite element model to investigate the failure mechanism of tunnels under normal fault action. The study found that the longitudinal mechanical response of the tunnel under normal fault dislocation is primarily governed by the combined effects of bending, tension, and shear. Among these, the bending effect is controlled by the vertical component of the fault displacement, the tensile effect is influenced by the magnitude of displacement and the fault dip angle, and the shear effect is jointly controlled by both the dip angle and the fault displacement [14]. Hassan Jafarian proposed a novel orthonormal polynomial series expansion method to analyze the vibration of bottom hull panels under moving impacting fluid loads. The model employs an Euler–Bernoulli beam to simulate the initial phase of slamming, suppresses the Gibbs phenomenon, and directly solves for beam deflection, bending moment, and shear force through integration. Compared with traditional methods, the proposed approach requires fewer shape functions and achieves faster convergence [15]. Mohsen Bagheri conducted a comparative study of 30-story high-rise buildings with moment-resisting frames and dual systems incorporating shear walls, explicitly considering soil–structure interaction effects. Utilizing a composite piled raft foundation and nonlinear dynamic analysis, his study revealed that the dual system reduced the fundamental period by 40% and peak interstory drifts by up to 56%, enhanced fragility PGA capacity by 1.4–1.6 times, optimized hybrid pile configurations to limit shear strain below 1.3%, and exhibited SSI-induced displacement amplification of 48%. These findings provide a foundation for the seismic design of high-rise structures in soft soil regions [16].
Although numerical simulations and model tests on the failure mechanisms of tunnels crossing active faults, as well as studies on anti-dislocation and dislocation mitigation measures, are well-established, current model tests primarily simulate single fault types—either normal/reverse faults or strike-slip faults separately. They fail to account for the failure modes of tunnels under complex coupled fault actions. Therefore, based on the engineering background of the Menyuan Ms 6.8 earthquake and the Daliang Tunnel on the Lanzhou–Xinjiang High-Speed Railway, this paper conducted seismic damage investigations of the Daliang Tunnel and other typical cross-fault tunnels. A medium-scale physical model test, taking the Daliang Tunnel as the prototype, was carried out to study the failure patterns and mechanical response laws of tunnels under complex reverse strike-slip fault dislocation. Additionally, a numerical model of the Daliang Tunnel crossing the Lenglongling Fault was established to discuss the influence of different structural zonations within the fracture zone on the tunnel surrounding rock response. The findings may provide a reference for the design of tunnels crossing active faults.
2. Seismic Damage Analysis of Tunnel Structures Traversing Fault Zones
2.1. Geological Conditions of the Daliang Tunnel
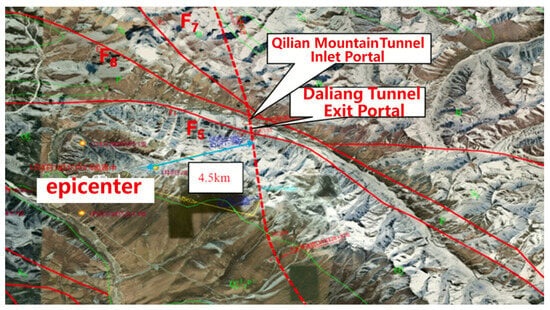
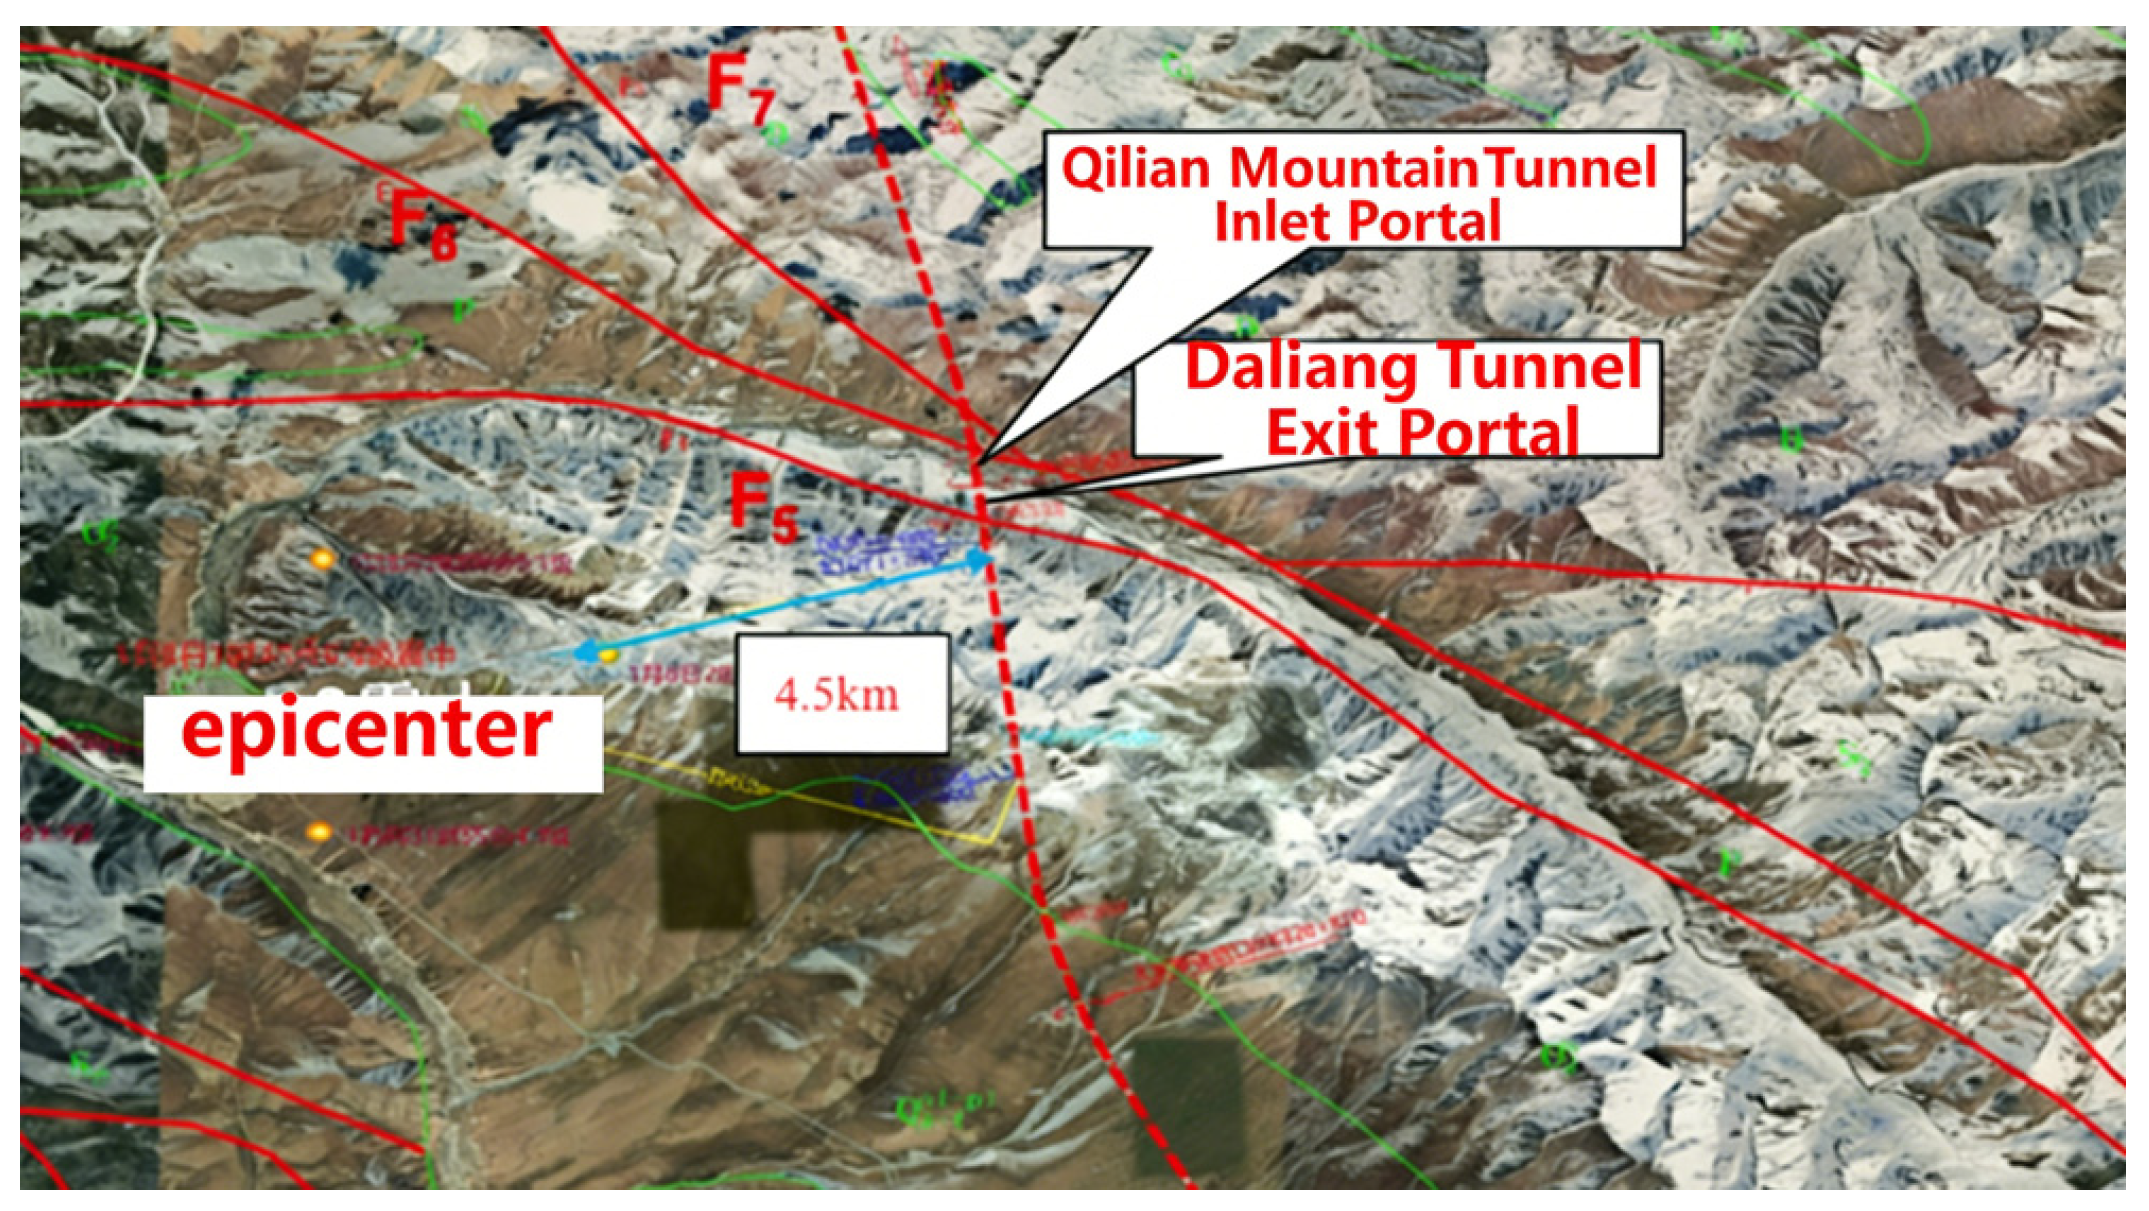
On 8 January 2022, an earthquake of magnitude 6.9 occurred in Menyuan County, Qinghai Province, with a focal depth of 10 km. The seismogenic fault was the Lenglongling Fault (F5), a segment of the central-western part of the Qilian-Haiyuan Fault located on the northeastern margin of the Tibetan Plateau. This fault exhibits left-lateral strike-slip characteristics. The epicenter was located approximately 3–4 km south of the F5 Fault, with the closest distance to the Daliang Tunnel on the Lanzhou–Xinjiang High-Speed Railway being about 4.5 km, as shown in Figure 1. The Daliang Tunnel is situated at an elevation of 4430 m, with a maximum burial depth of approximately 800 m. It crosses the F5 Lenglongling Fault within its exit section. The F5 Fault is a Holocene active fault with an average left-lateral slip rate of 3.5–6.6 mm/a and an average vertical slip rate of 0.4 mm/a. Its displacement mechanism is characterized by left-lateral strike-slip combined with reverse faulting (southern block uplift, northern block subsidence). The maximum potential horizontal displacement over the next century is estimated to be about 5.3 m, with a vertical displacement of approximately 0.5 m. The overall fault strike ranges from N60°W to EW, with the fault plane attitude being N75°W/79°S, dipping to the south. The angle between the fault and the tunnel alignment is 70°. The strata south of the southern boundary consist of Middle Ordovician Daliang Formation (O2d) crystalline limestone interbedded with slate. The fault zone itself is composed of a fault fracture zone containing fault gouge and cataclasite. North of the northern boundary, the surface geology comprises colluvial deposits of slate and limestone, while deep borehole data reveal the presence of Early Silurian Angzanggou Formation (S1a) slate interbedded with sandstone.
Figure 1.
Location relationship between the Daliang Tunnel and the F5 Fault.
2.2. Seismic Damage Analysis of the Daliang Tunnel
The Daliang Tunnel primarily experienced overall offset, twist, tensile deformation, and compression deformation. The severely damaged areas were mainly concentrated within a zone approximately 350 m long crossing the Lenglongling fault fracture zone and its influence zone. Within this range, extensive concrete spalling, structural cracking, and exposed reinforcement were observed in the tunnel lining. Significant seismic damage was primarily concentrated within a 1.8 km section extending from the active fault zone toward the downchain direction.
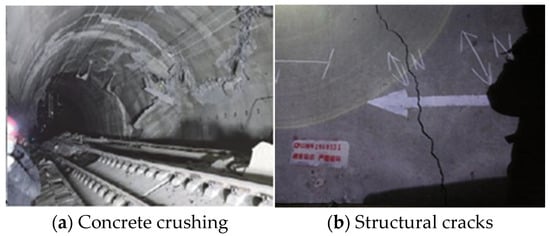
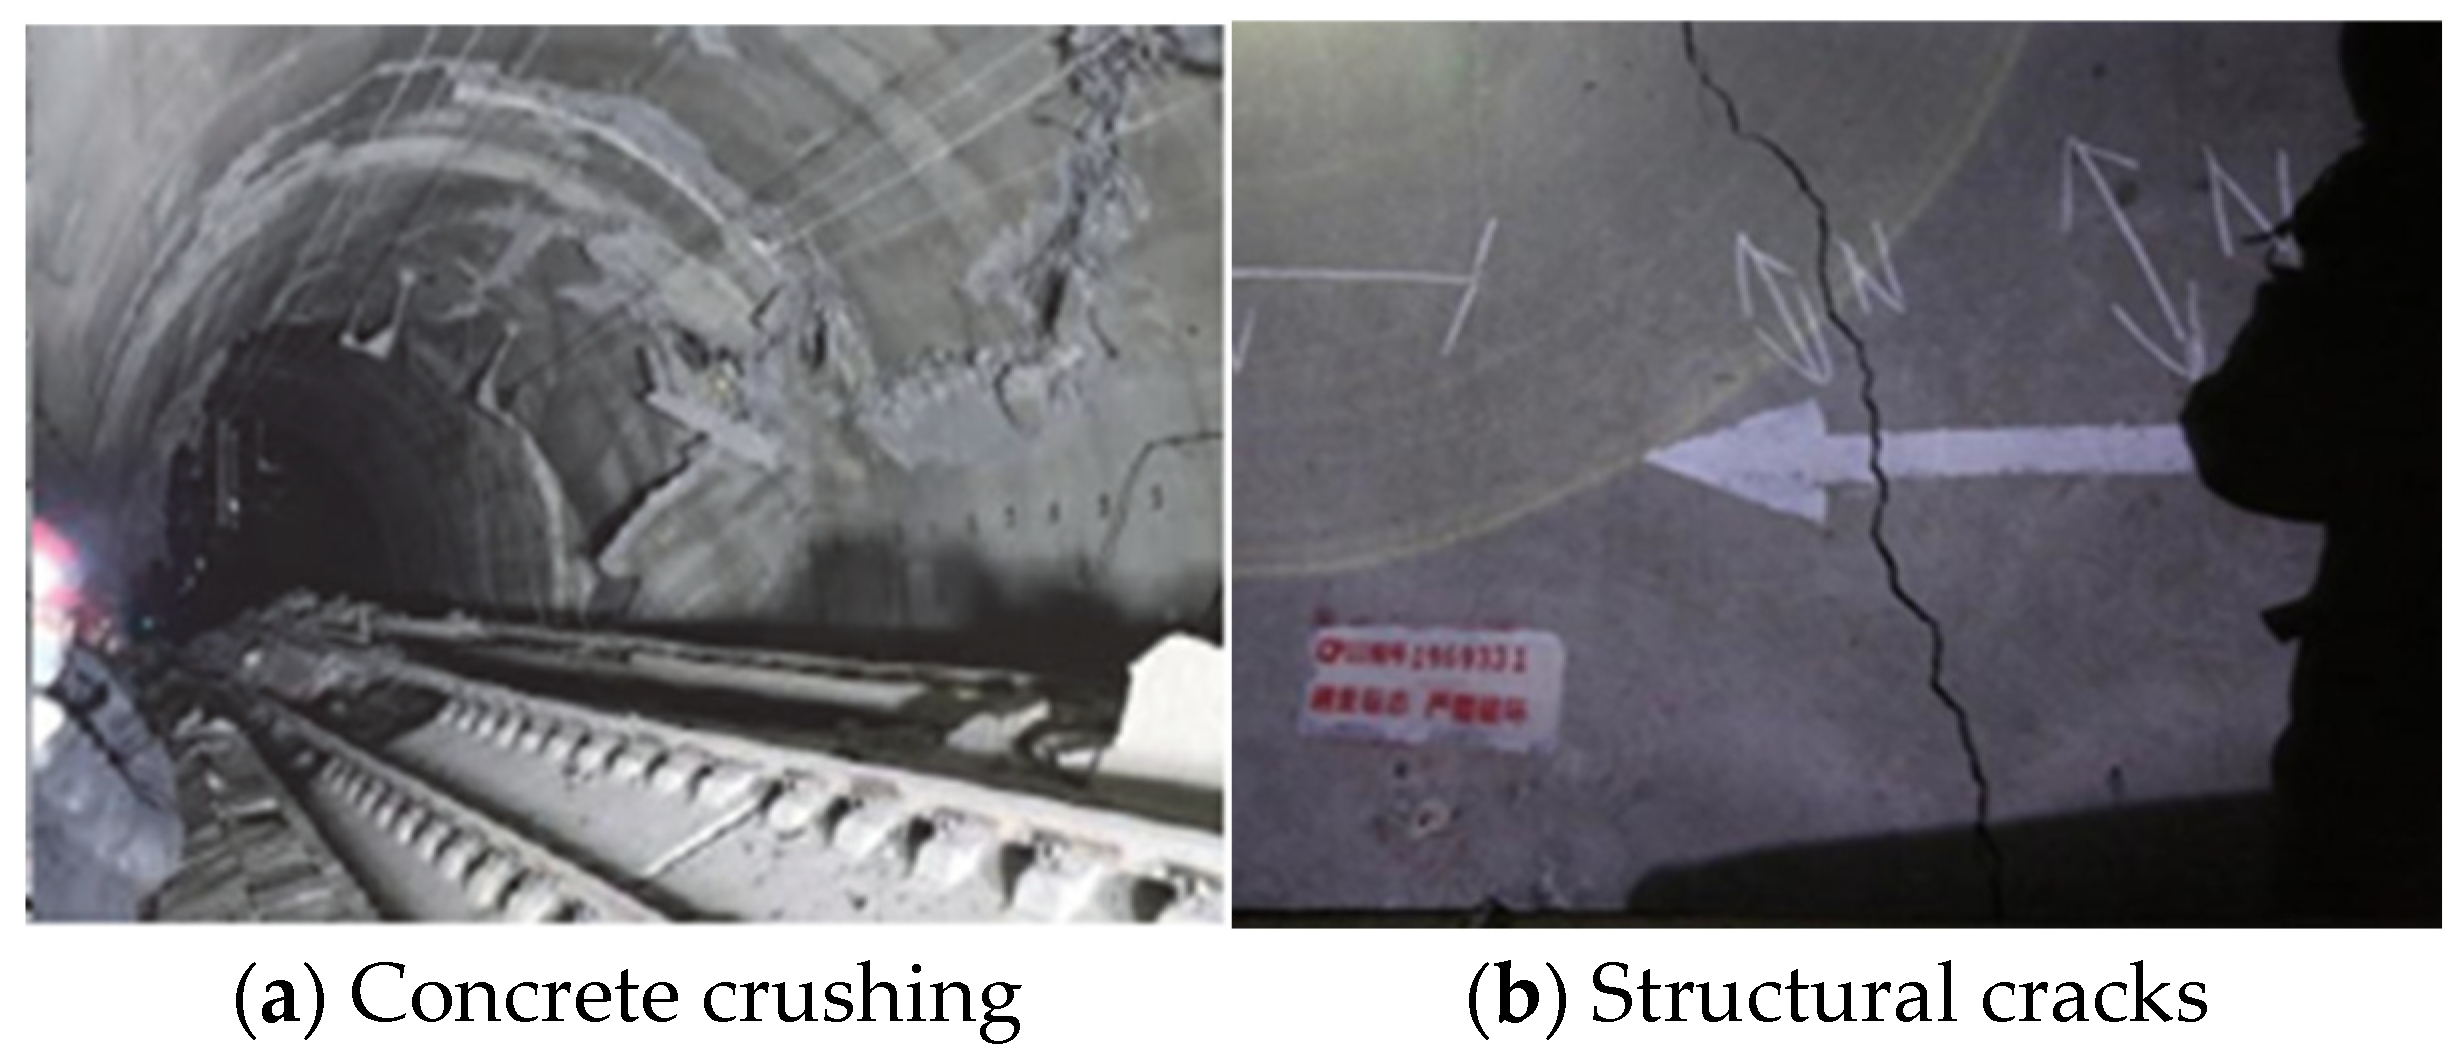
Specifically, a total of 10 severely spalled sections were identified, each ranging from 1.5 m to 10 m in length, with spalled areas varying between 0.5 m2 and 15 m2. In some sections, the exposed reinforcement was bent and deformed. Additionally, 14 sections exhibited severe cracking damage, including diagonally or circumferentially penetrating cracks, multiple parallel cracks, or intersecting cracks forming a reticulated pattern. In some areas, the lining showed noticeable compressive deformation, accompanied by cracking and dislocation. The lining experienced hoop compression failure, with the reinforcement layer exposed and extensive spalling of the arch, as shown in Figure 2.
Figure 2.
Damage condition of the Daliang Tunnel crossing the active fault [17].
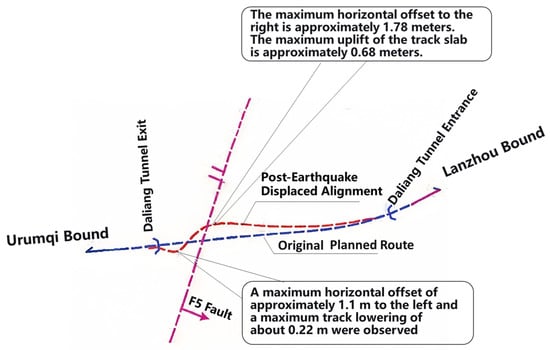
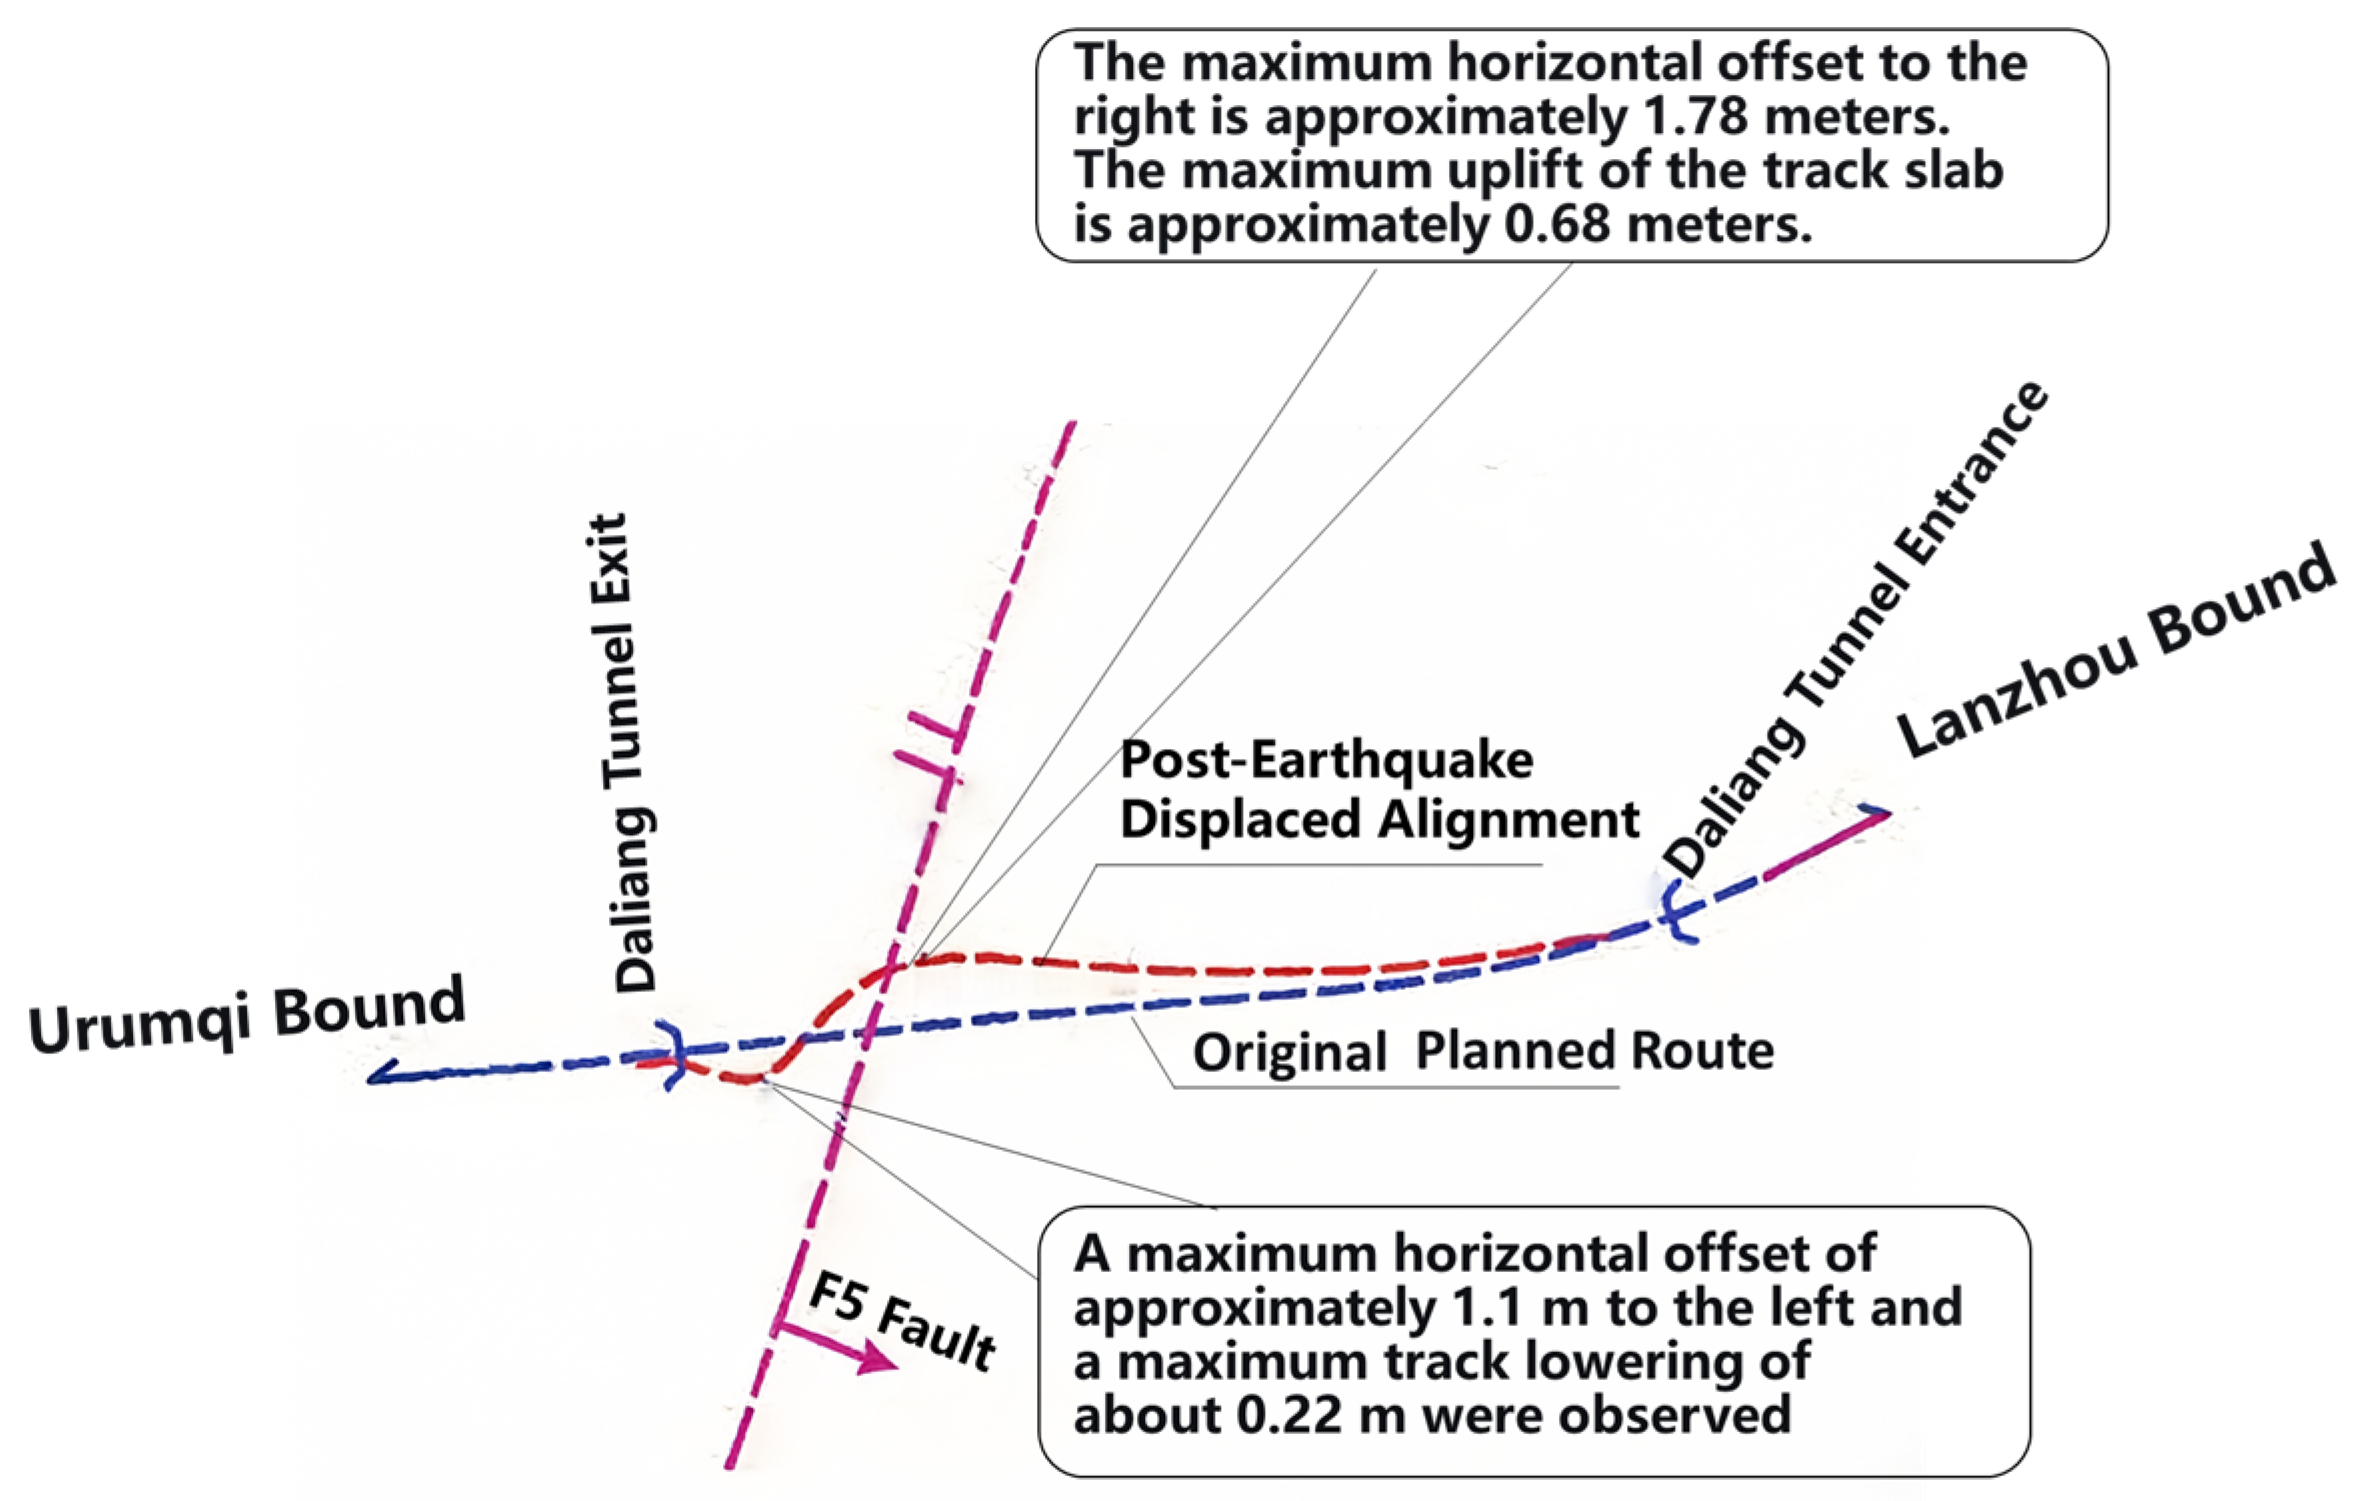
Based on post-earthquake measurement and analysis of the Daliang Tunnel, the tunnel structure exhibited multi-directional spatial deformations, including lateral offset and torsion, vertical dislocation, and longitudinal elongation. Compared with the pre-earthquake alignment, and taking the F5 fault zone as the boundary, the southern section of the tunnel shifted eastward by approximately 1776–1781 mm, while the northern section shifted westward by 620–1101 mm. The displacement reached its maximum at the dislocation zone of the fault and gradually decreased toward both ends. Figure 3 illustrates the overall lateral offset and torsion of the tunnel.
Figure 3.
Schematic diagram of the overall lateral offset and torsion of the tunnel [18].
2.3. Statistical Analysis of Seismic Damage in Other Typical Cross-Fault Tunnels
The 2016 Kumamoto earthquake (Mw 7.3) was caused by right-lateral strike-slip faulting along the Futagawa-hinagu fault zone. Geological surveys indicated a maximum slip of approximately 7.9 m on the fault plane near its northern section. The Tawarayama Tunnel experienced ground settlement of up to 0.5 m at its portal, with severe internal dislocation, including a maximum horizontal displacement of about 1.15 m. During the 1952 Kern County earthquake (Mw 7.6) in California, USA, four railway tunnels crossing the White Wolf fault zone suffered varying degrees of damage, exhibiting significant internal dislocation. Among them, Tunnel No. 4, with a burial depth of 38 m, showed a horizontal offset of approximately 50 cm in its sidewall. Table 1 summarizes the seismic damage statistics for tunnels crossing active faults.
Table 1.
Seismic Damage Statistics of Tunnels Crossing Active Faults [19,20,21,22].
2.4. Patterns and Characteristics of Tunnel Seismic Damage
Fault stick-slip displacement and earthquakes induced by active faults pose severe threats to the stable and safe operation of tunnels crossing fault zones. Based on statistical analysis of typical seismic damage cases in tunnels traversing active faults and the locations of damage occurrence, the following patterns can be summarized regarding the failure characteristics. Under strong seismic action, not only is the structural safety of tunnels crossing fracture zones and geologically unfavorable sections seriously threatened, but tunnels in the vicinity of fault zones are also affected to varying degrees. For example, the severely damaged area of the Daliang Tunnel extended approximately 350 m near the Lenglongling Fault. Tunnel linings are highly susceptible to cracking under strong earthquakes, primarily manifesting as circumferential and longitudinal cracks. Moreover, under fault-induced compression, cracks propagate from the sidewalls to the crown. The dislocation direction of circumferential shear cracks is consistent with the fault movement. In cases of severe seismic damage, extensive concrete spalling, block fallout, and exposed reinforcement also occur. Strong earthquakes can simultaneously induce regional surface deformation, leading to dislocation and seismic damage within the tunnel structure, as well as overall offset and torsion. The aforementioned damage phenomena account for the majority of cases in the statistics and represent the most common types of seismic damage.
The influence of active faults on tunnel seismic damage primarily lies in the in situ stress field and the kinematic mode of the active fault. The impact on the tunnel structure is mainly concentrated where displacement occurs along the fault plane and within the fault fracture zone. Additionally, the properties of the surrounding rock are one of the key factors affecting tunnel seismic damage. For instance, Tang et al. simulated the seismic response of tunnels under different surrounding rock grades and concluded that the internal forces reached their maximum when the tunnel crossed the interface of fracture zones. This indicates that the degree of tunnel seismic damage is not determined by a single factor but is the result of the combined action of multiple factors [23].
3. Model Test of the Daliang Tunnel Crossing a Reverse Strike-Slip Fault
Tunnels crossing active faults face complex geological and mechanical environments during seismic events. To investigate the impact of fault movement on tunnel structures, in addition to statistical analysis of tunnel damage cases, which provides essential data for understanding failure mechanisms, conducting model tests on tunnels traversing active faults is an indispensable research approach. Since the Daliang Tunnel crosses a reverse strike-slip fault—and unlike other model tests that only consider normal/reverse or strike-slip faults separately—this model test enables an in-depth study of the dislocation response characteristics of the Daliang Tunnel under seismic action by simulating complex coupled fault movements. The findings aim to provide a scientific basis for the safe design and construction of tunnel engineering, thereby ensuring the stability and reliability of tunnels.
3.1. Test Scheme
3.1.1. Test Setup and Materials
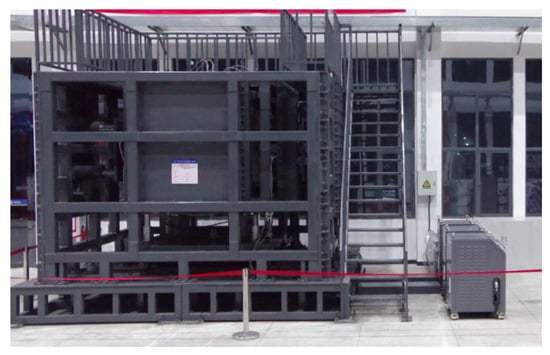
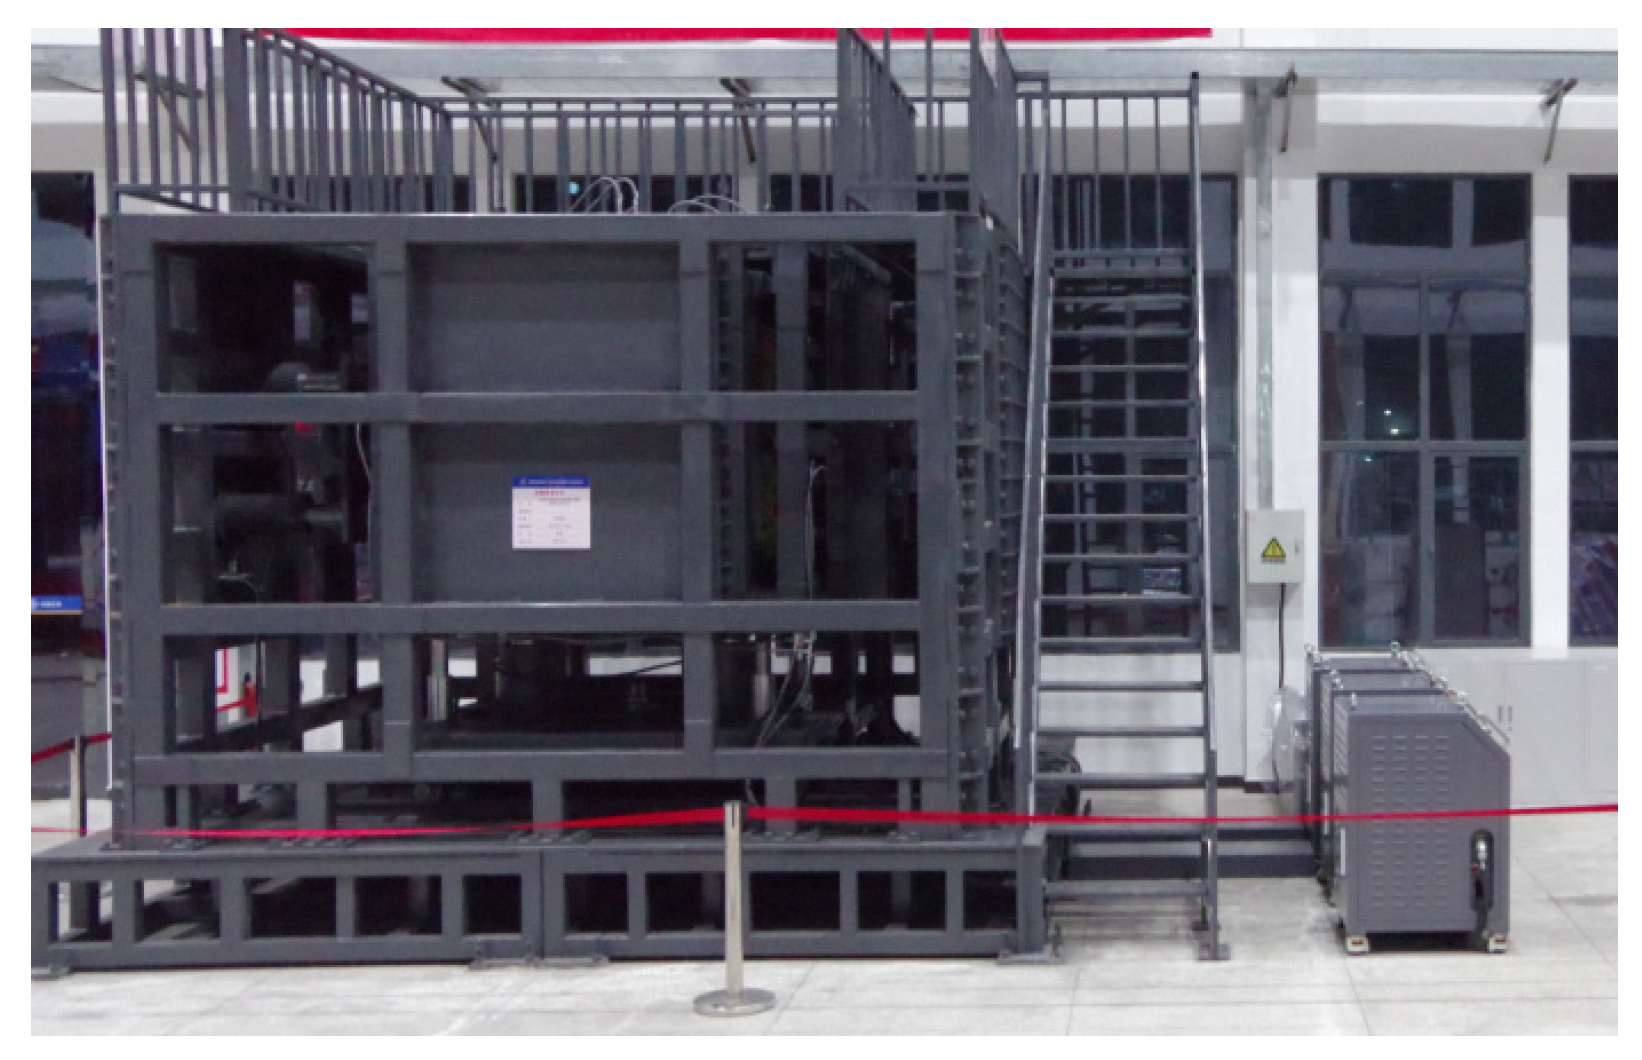
This test employed a self-developed model test box, as shown in Figure 4. The model box consists of inner and outer containers. The inner container is a rectangular shear box measuring 2000 mm × 1250 mm × 1250 mm, comprising a movable side and a fixed side. The movable side section can achieve a displacement stroke of 20 cm in the horizontal direction and 10 cm in the vertical direction. Through horizontal and vertical shearing of the active side of the model box, the movement of the fault under coupled normal/reverse and strike-slip conditions can be simulated.
Figure 4.
Model test box.
Due to limitations in test equipment and site dimensions, the geometric similarity ratio adopted for this scaled model test was determined as CL = 50. The density similarity ratio of the tunnel lining model was Cρ = 1.5, and the elastic modulus similarity ratio was CE = 50. Based on these fundamental similarity ratios and applying the similarity theory, the π-term equations were formulated to derive the similarity ratios for other relevant mechanical parameters. The similarity ratios for each mechanical parameter are listed in Table 2.
Table 2.
Similarity Relationships and Ratios of Materials.
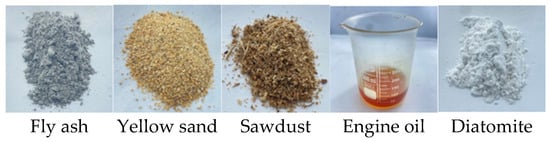
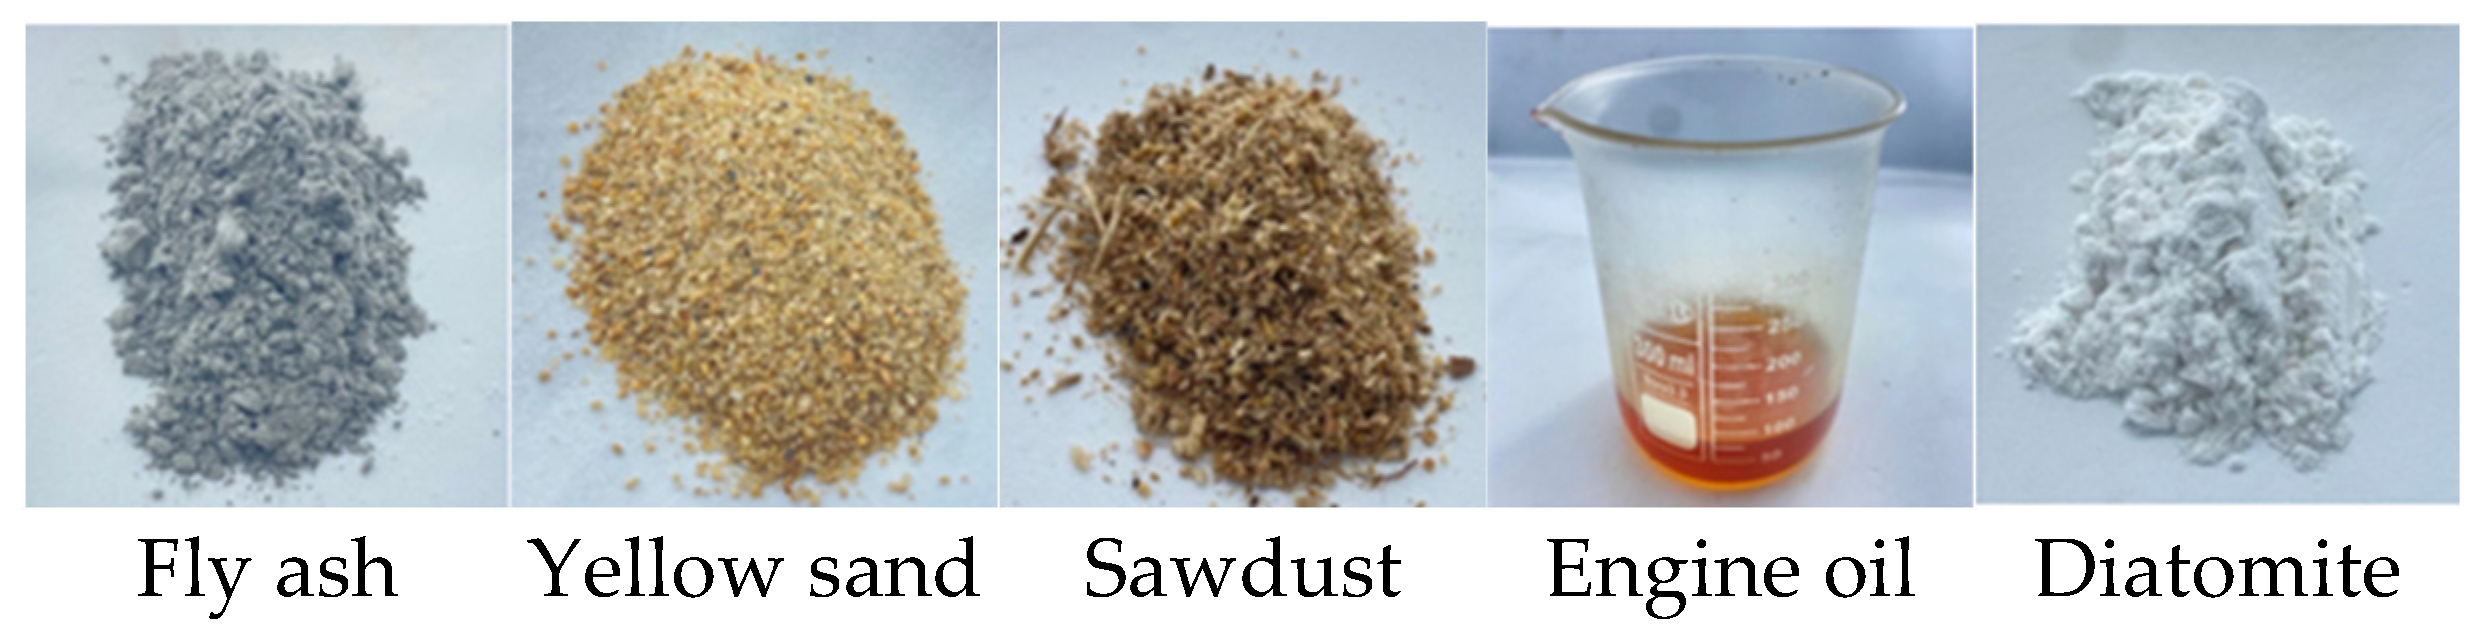
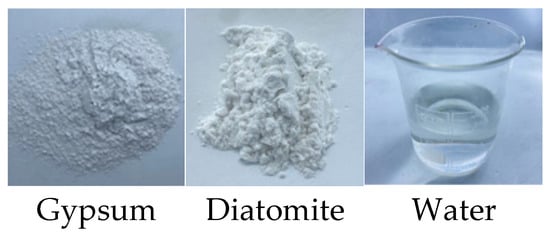
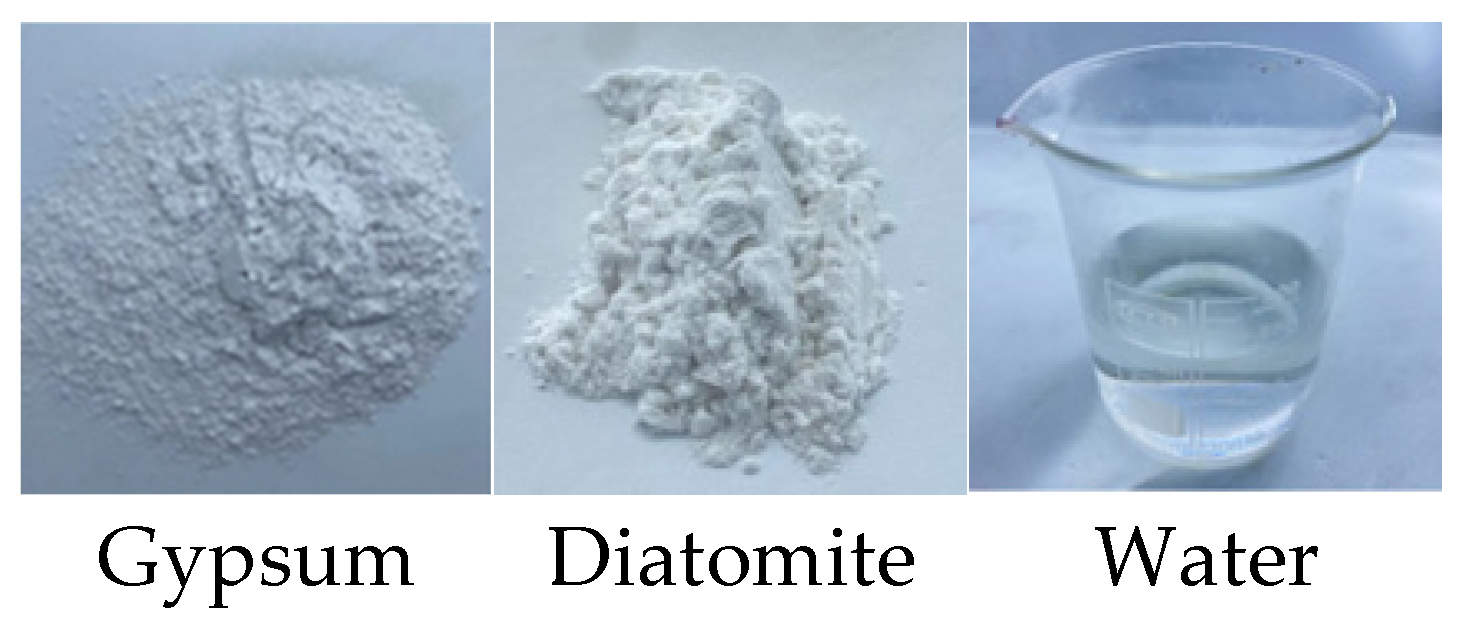
According to the geological survey and geophysical exploration results of the Daliang Tunnel, the fracture zone grade in the engineering area crossing the Lenglongling Fault is Class V, and the surrounding rock grade of the fault zone is Class IV. As a crucial preliminary step in model testing, similitude materials were developed by first identifying their basic components through a review of relevant literature. Different mix ratios of these components were then systematically adjusted. Standard specimens were fabricated and subjected to uniaxial compression, triaxial compression, and direct shear tests to determine the corresponding mechanical parameters. The optimal mix ratio was ultimately selected based on its closest match to the target values. Ultimately, the simulative materials for the fault zone in the model test were selected as fly ash, yellow sand, engine oil, and diatomite in a ratio of 1:0.60:0.25:0.47. The simulative materials for the fracture zone were selected as fly ash, yellow sand, sawdust, engine oil, and diatomite in a ratio of 1:0.65:0.35:0.3:0.47, as shown in Figure 5. The simulative material for the lining was prepared by mixing gypsum, diatomite, and water in a ratio of 0.7:0.3:0.9, as shown in Figure 6. The physical and mechanical parameters of the surrounding rock and lining are listed in Table 3 and Table 4, respectively.
Figure 5.
Similitude materials for the surrounding rock.
Figure 6.
Similitude materials for the lining.
Table 3.
Physical parameters of the simulative materials for surrounding rock.
Table 4.
Physical parameters of the similitude materials for the lining.
In this test, the lining model was fabricated using a gypsum-based composite mate rial, with a wire mesh (1 cm × 1 cm spacing, 0.5 cm diameter) employed as an equivalent substitute for the reinforcement skeleton in the prototype reinforced concrete structure. This simplification, within the framework of similarity theory, adequately satisfied the similitude requirements for elastic modulus and bending stiffness. However, the following limitations remain: (1) The gypsum material exhibits high brittleness, with lower tensile strength and fracture energy compared to the prototype concrete. This may render the model more susceptible to localized spalling and early cracking during dislocation, thereby introducing a certain “amplification effect” in the representation of crack propagation paths and cracking patterns. (2) The equivalent wire mesh differs from actual reinforcement in terms of spatial arrangement, bond and anchorage performance, and nonlinear deformation characteristics. Consequently, it is challenging to fully replicate the synergistic working mechanism of steel reinforcement and concrete in the prototype structure, particularly regarding ductility behavior and damage evolution during large deformations. Therefore, when analyzing crack patterns, strain amplitudes, and failure modes, a comprehensive interpretation should be conducted that accounts for the differences in mechanical behavior arising from the aforementioned material simplifications, so as to avoid directly extrapolating model phenomena to the prototype structure.
3.1.2. Test Conditions and Monitoring
Based on the cross-sectional shape and dimensions of the Daliang Tunnel, the tunnel lining model was designed with a horse-shoe-shaped section, measuring 20 cm in height, 24 cm in width, 2 cm in thickness, and 140 cm in length, as shown in Figure 7. The reinforcement in the original concrete lining was replaced by a wire mesh with a spacing of 1 cm × 1 cm and a wire diameter of 0.5 cm. The width of the fracture zone was set to 30 cm. Based on a comprehensive consideration of the monitoring analysis of displacement values from the Daliang Tunnel site—where the southern section of the tunnel shifted eastward by approximately 1776–1781 mm and the northern section shifted westward by 620–1101 mm—along with the stroke limit of the test equipment, the horizontal and vertical dislocation displacements for the test were determined to be 5 cm and 10 cm. Ultimately, the specific parameter settings for this model test are listed in Table 5.
Figure 7.
Tunnel lining model.
Table 5.
Parameters of Model Test Cases.
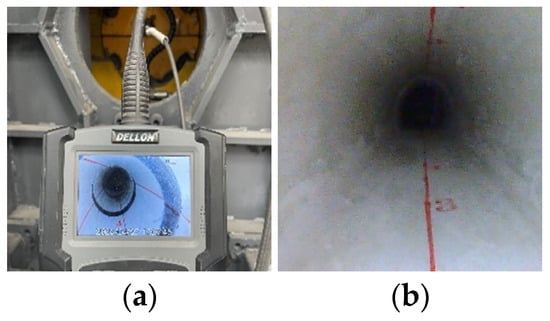
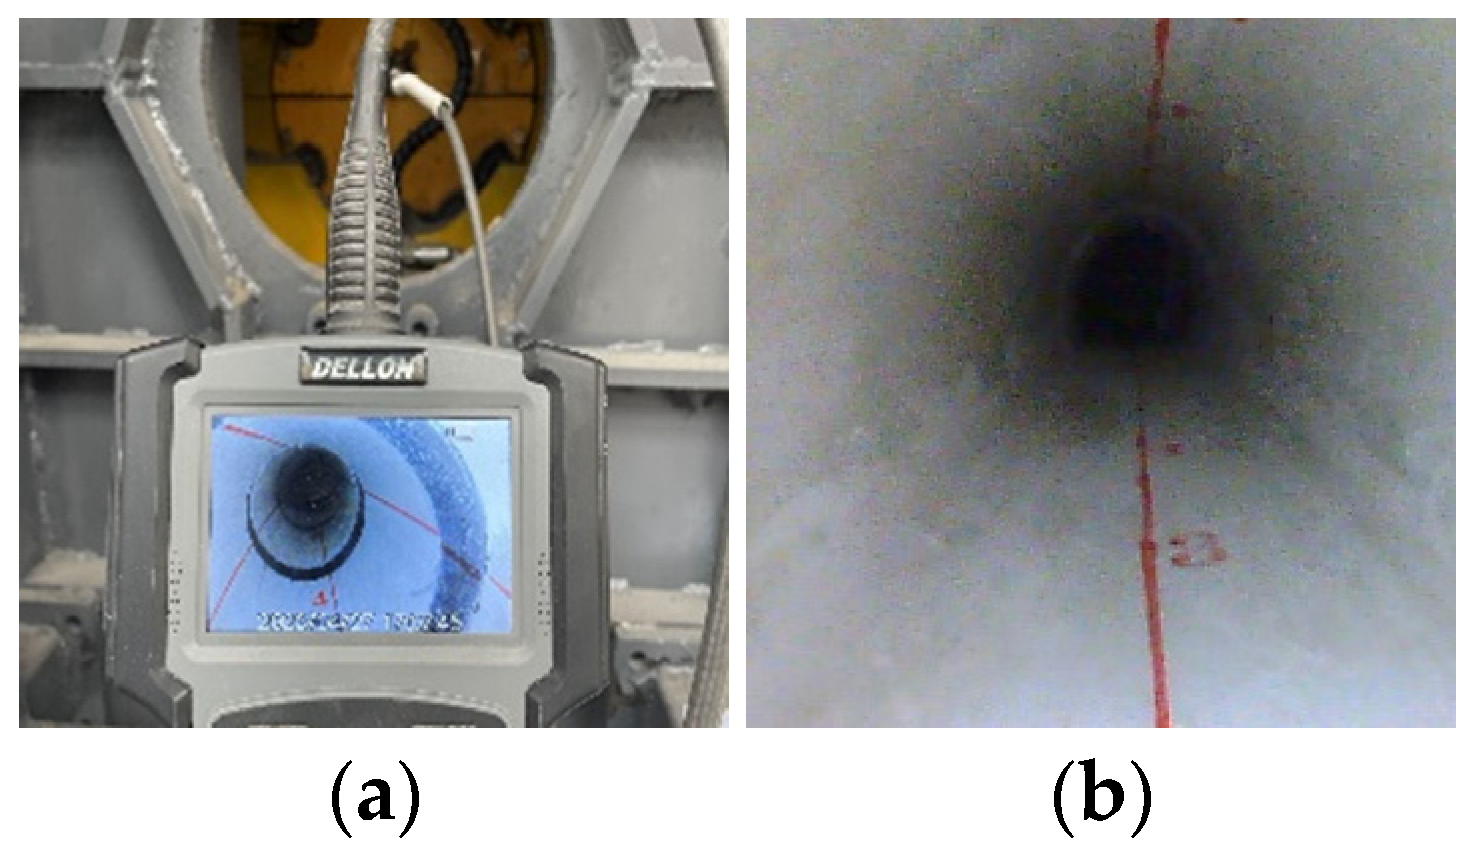
The monitoring program for this model test included the following components: 1. Controlling the loading of each displacement step via a hydraulic thrust system; 2. Recording the development and pattern of internal lining cracks during the dislocation process using an industrial borescope; 3. Recording the strain response of the lining during dislocation using a dynamic data acquisition unit; 4. Monitoring the variation in surrounding rock pressure during dislocation by embedded earth pressure cells.
To monitor the development and failure of internal tunnel cracks, red inspection lines were marked along the longitudinal direction on both the surface and inside the tunnel. Key monitoring cross-sections of the lining were marked using a numbering stamp. The development and patterns of internal lining cracks were recorded by rotating and extending the borescope line, as shown in Figure 8.
Figure 8.
Layout of tunnel monitoring instrumentation. (a) Borescope; (b) Internal markings of the tunnel.
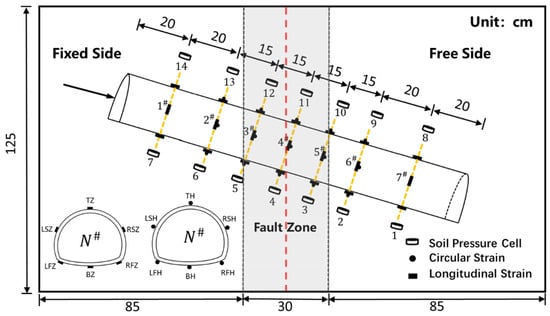
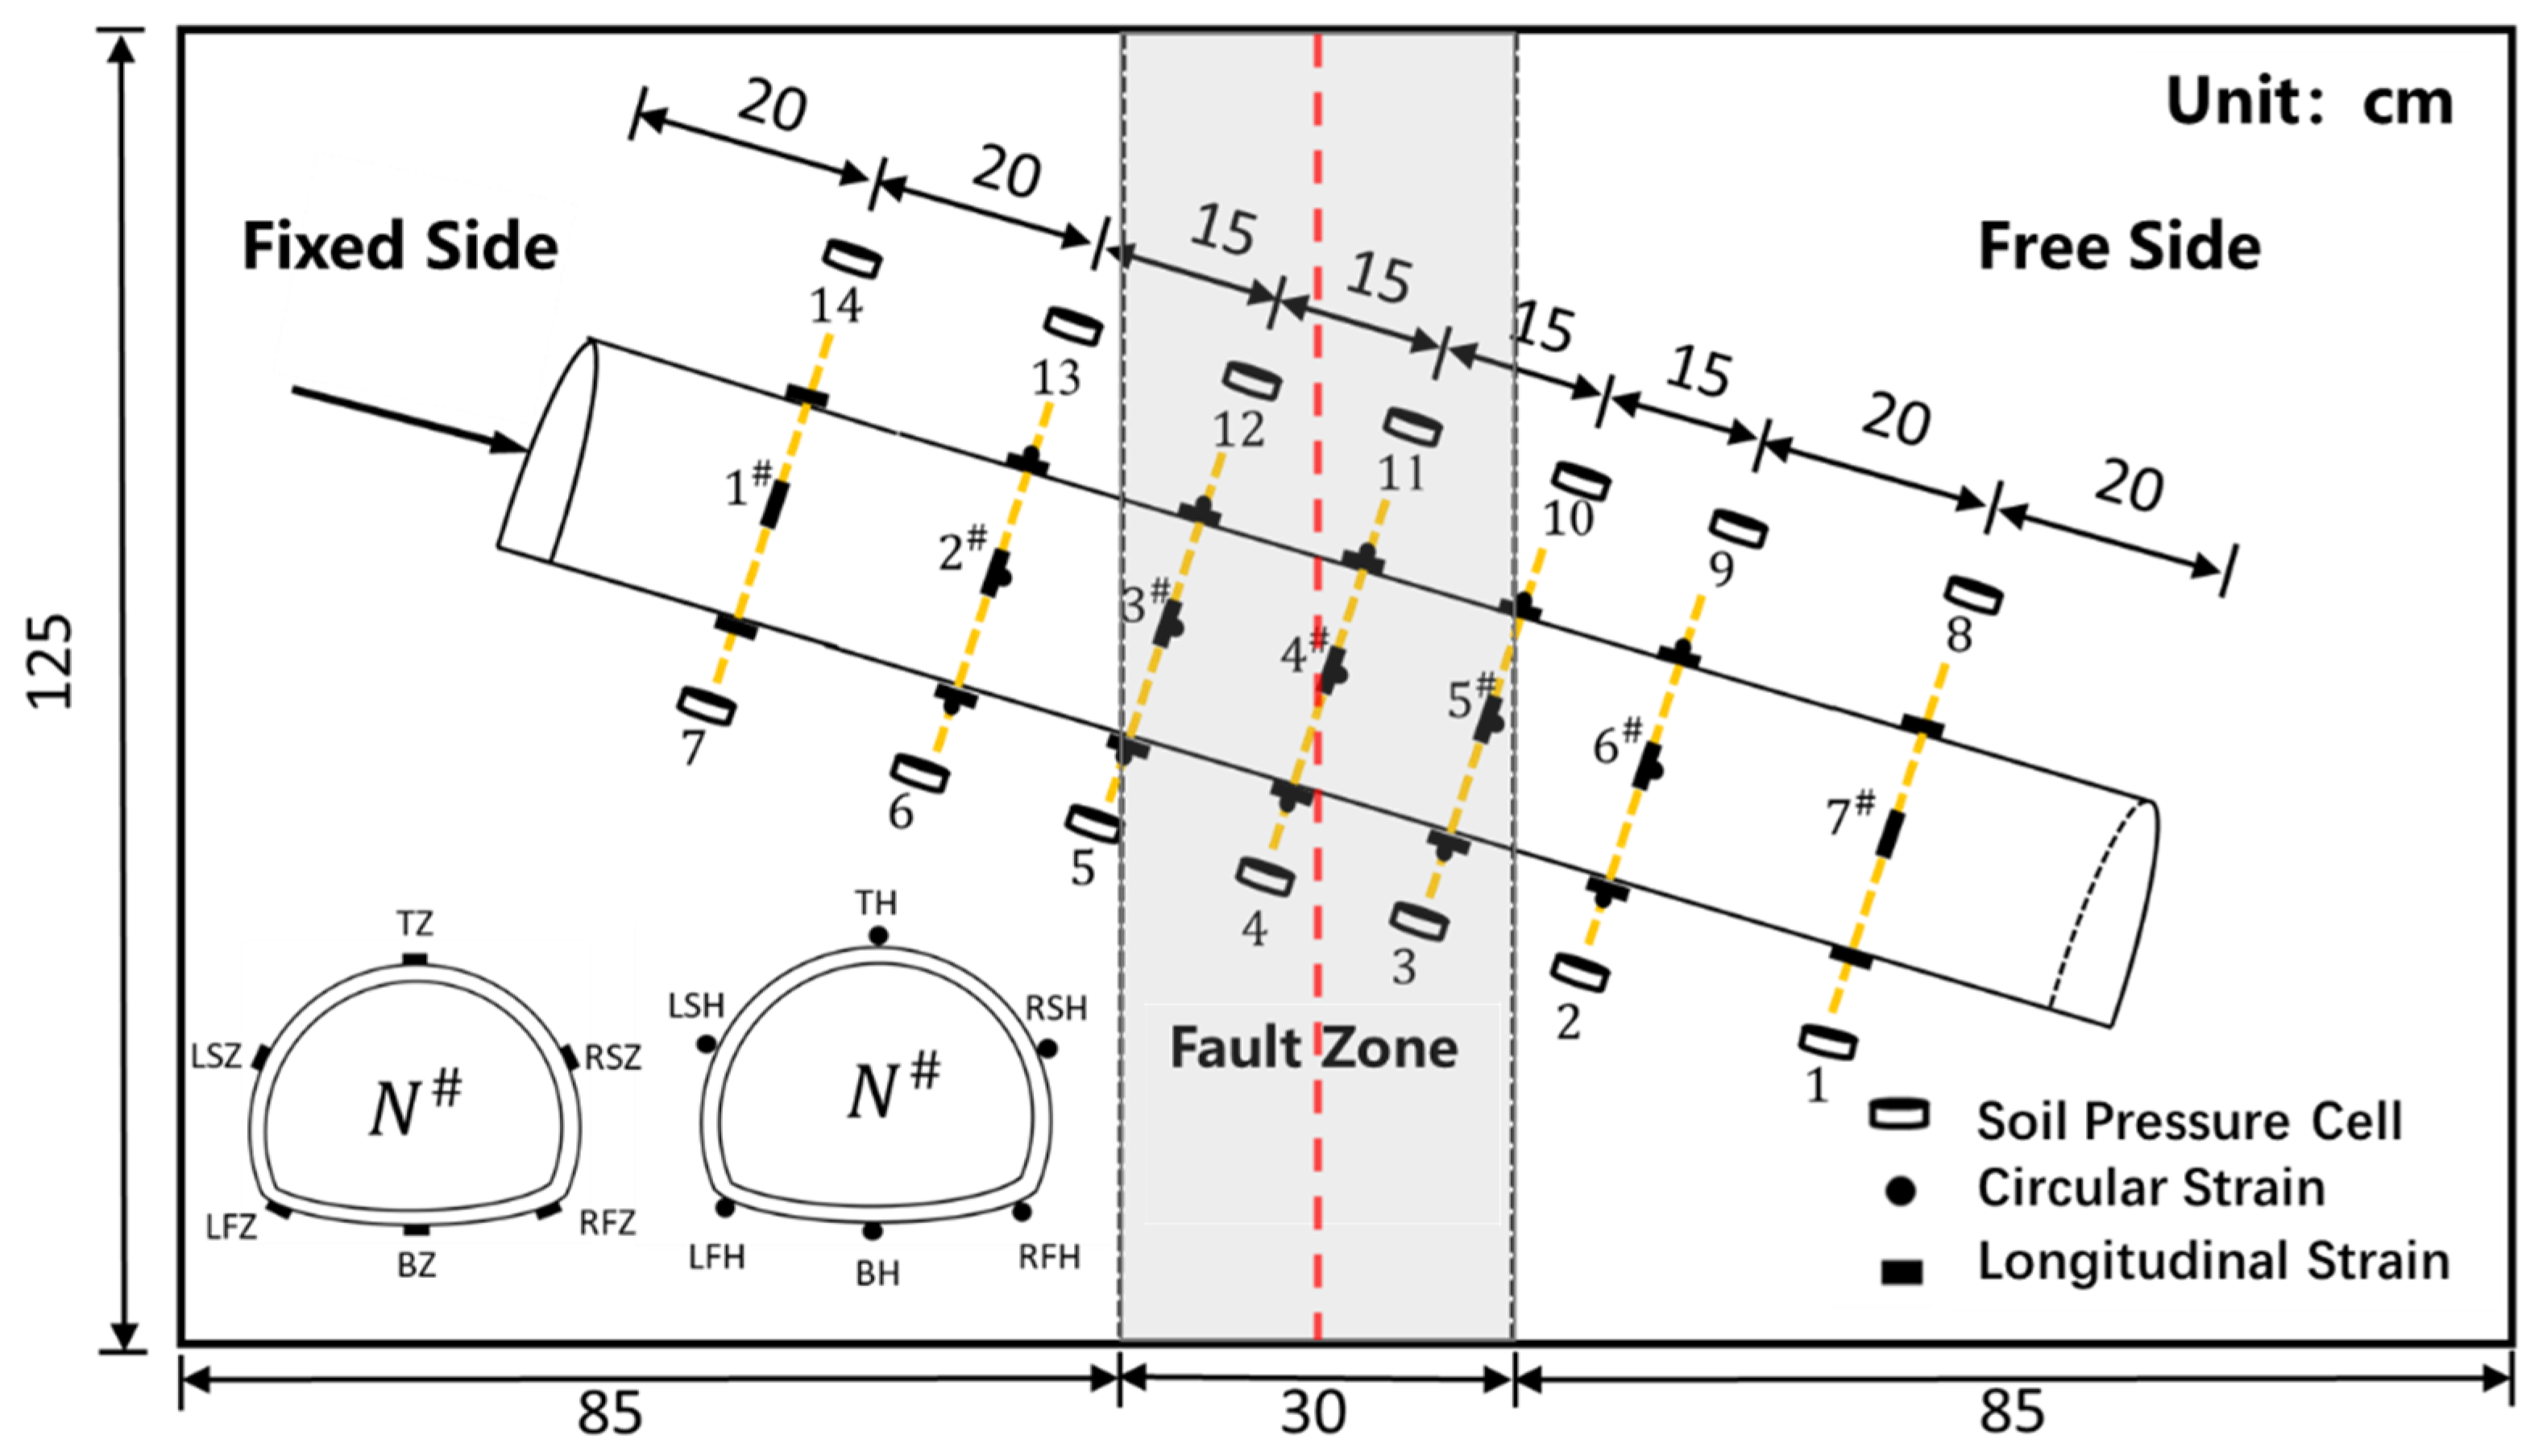
Based on the lining dimensions, seven monitoring cross-sections were arranged along the longitudinal direction, numbered as sections 1# to 7#. Each cross-section was equipped with six monitoring points, where T represents the tunnel crown, B represents the invert, RS represents the right shoulder, LS represents the left shoulder, RF represents the right springline, and LF represents the left springline. H denotes hoop strain, while Z denotes longitudinal strain. In accordance with the intersection angle between the Daliang Tunnel alignment and the Lenglongling Fault, the orientation of the lining model was adjusted so that its axis intersected the fault zone at an angle of 70°.
Embedment of earth pressure cells: Seven earth pressure cells were installed at the crown and invert positions corresponding to each of the seven monitoring cross-sections. The layout for strain and earth pressure monitoring is illustrated in Figure 9.
Figure 9.
Layout of monitoring points for Test Case 1.
3.1.3. Test Procedure
- Cast the lining according to the specified material proportions, cure and demold it. Mark key monitoring lines and points on both the external and internal surfaces of the lining. Attach strain gauges as per the monitoring plan.
- Fill and compact the similitude materials for the fracture zone and fault zone in layers to form a 20° slope. Check the compaction degree using a cutting ring. Embed the earth pressure cells at the invert of the lining.
- Position the lining model, connect the strain gauges to the data acquisition unit, embed the earth pressure cells at the crown, and then completely fill the model box with the surrounding rock similitude material.
- Commence the test. Apply displacement in increments of 1 cm vertically and 0.5 cm horizontally. Each primary displacement increment is subdivided into ten control steps. During earthquakes, fault movement occurs virtually instantaneously. To better simulate the damage inflicted on the tunnel during seismic events, each increment of displacement in this test was applied instantaneously. Internal cracks and damage in the lining were recorded shortly after each loading step. Upon test completion, excavate the tunnel lining and document the external damage and deformation patterns.
3.2. Analysis of Test Results
3.2.1. Comparative Analysis of Internal Tunnel Damage and Field Damage
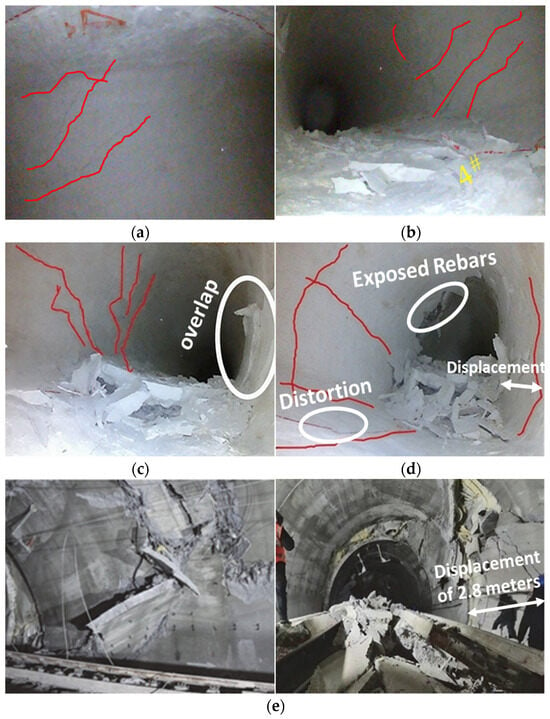
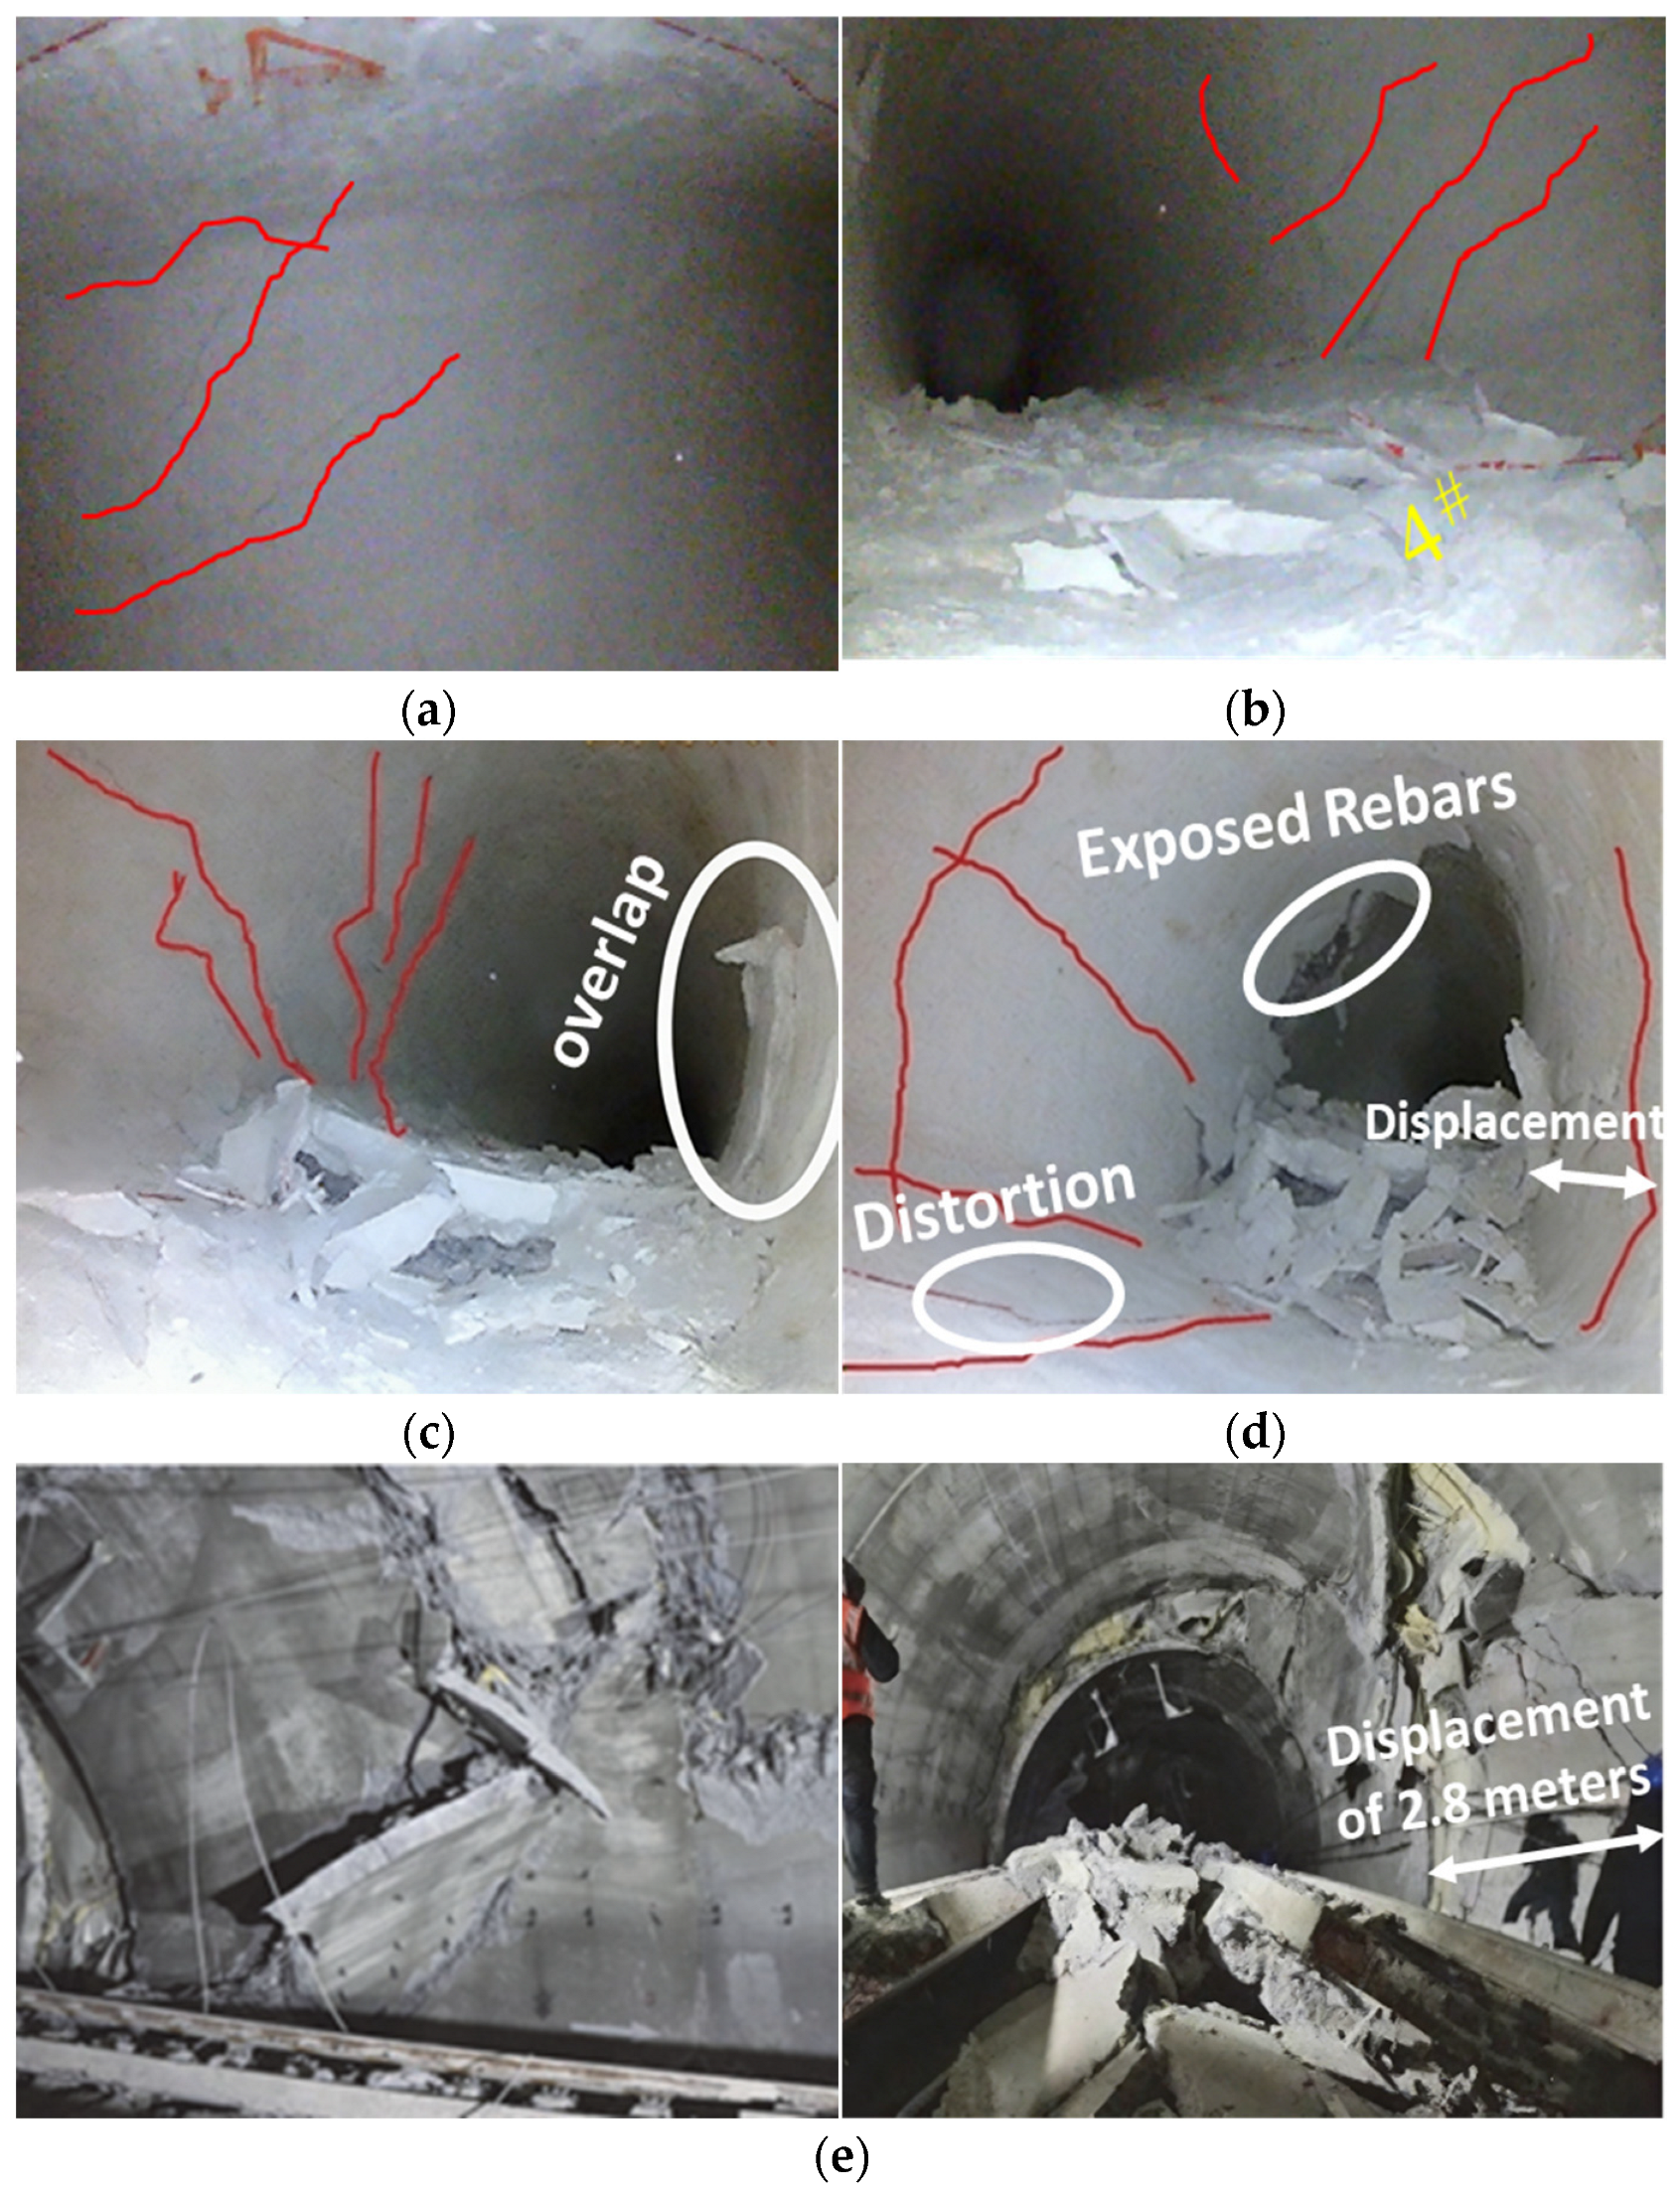
The internal crack development and failure of the tunnel under reverse strike-slip fault displacement, along with the field damage of the Daliang Tunnel, are shown in Figure 10. When the horizontal displacement reached 3.5 cm and the vertical displacement reached 7 cm, the diagonal cracks continued to propagate between monitoring sections 3# and 4#, and heaving occurred at the invert. Due to the high compressive stress at the right haunch, localized buckling of the lining was observed at this location, accompanied by spalling. At a horizontal displacement of 5 cm and a vertical displacement of 10 cm, exposed reinforcement appeared at the right haunch of section 4#, along with long and wide longitudinal tensile cracks and circumferential cracks. Extensive lining spalling occurred. Based on the red reference lines at the invert, twisting and dislocation of the tunnel were evident. Under the squeezing action of the surrounding rock, the cross-sectional shape had deformed inward due to compression.
Figure 10.
Comparison of internal damage in the model test tunnel and field damage. (a) Horizontal displacement 1 cm, vertical displacement 2 cm. (b) Horizontal displacement 2.5 cm, vertical displacement 5 cm. (c) Horizontal displacement 3.5 cm, vertical displacement 7 cm. (d) Horizontal displacement 5 cm, vertical displacement 10 cm. (e) Damage to the Daliang Tunnel within the F5 fault crossing zone.
According to the field damage, within the fault-crossing zone, the tunnel crown was subjected to oblique compression from the fault, crushing the reinforced concrete and bending the reinforcement. At chainage K1971+381, the compressive failure progressed from the left sidewall towards the crown, resulting in extensive roof collapse and bent reinforcement, indicating significant compressive action accompanied by a large amount of concrete debris. Floor heaving was also observed. Field measurements indicated a heave of 0.687 m at chainage K1970+378, and dislocation occurred at K1971+378, with the tunnel shifting westward by up to 2.8 m.
Comparative analysis shows that the model test successfully reproduced the primary failure modes observed in the field. The tunnel damage was characterized mainly by lining spalling, floor heaving, and dislocation/twisting.
3.2.2. Strain Response Characteristics of the Lining
- (1)
- Longitudinal Strain
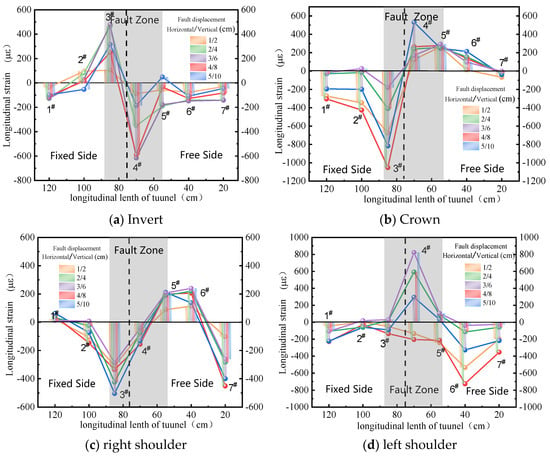
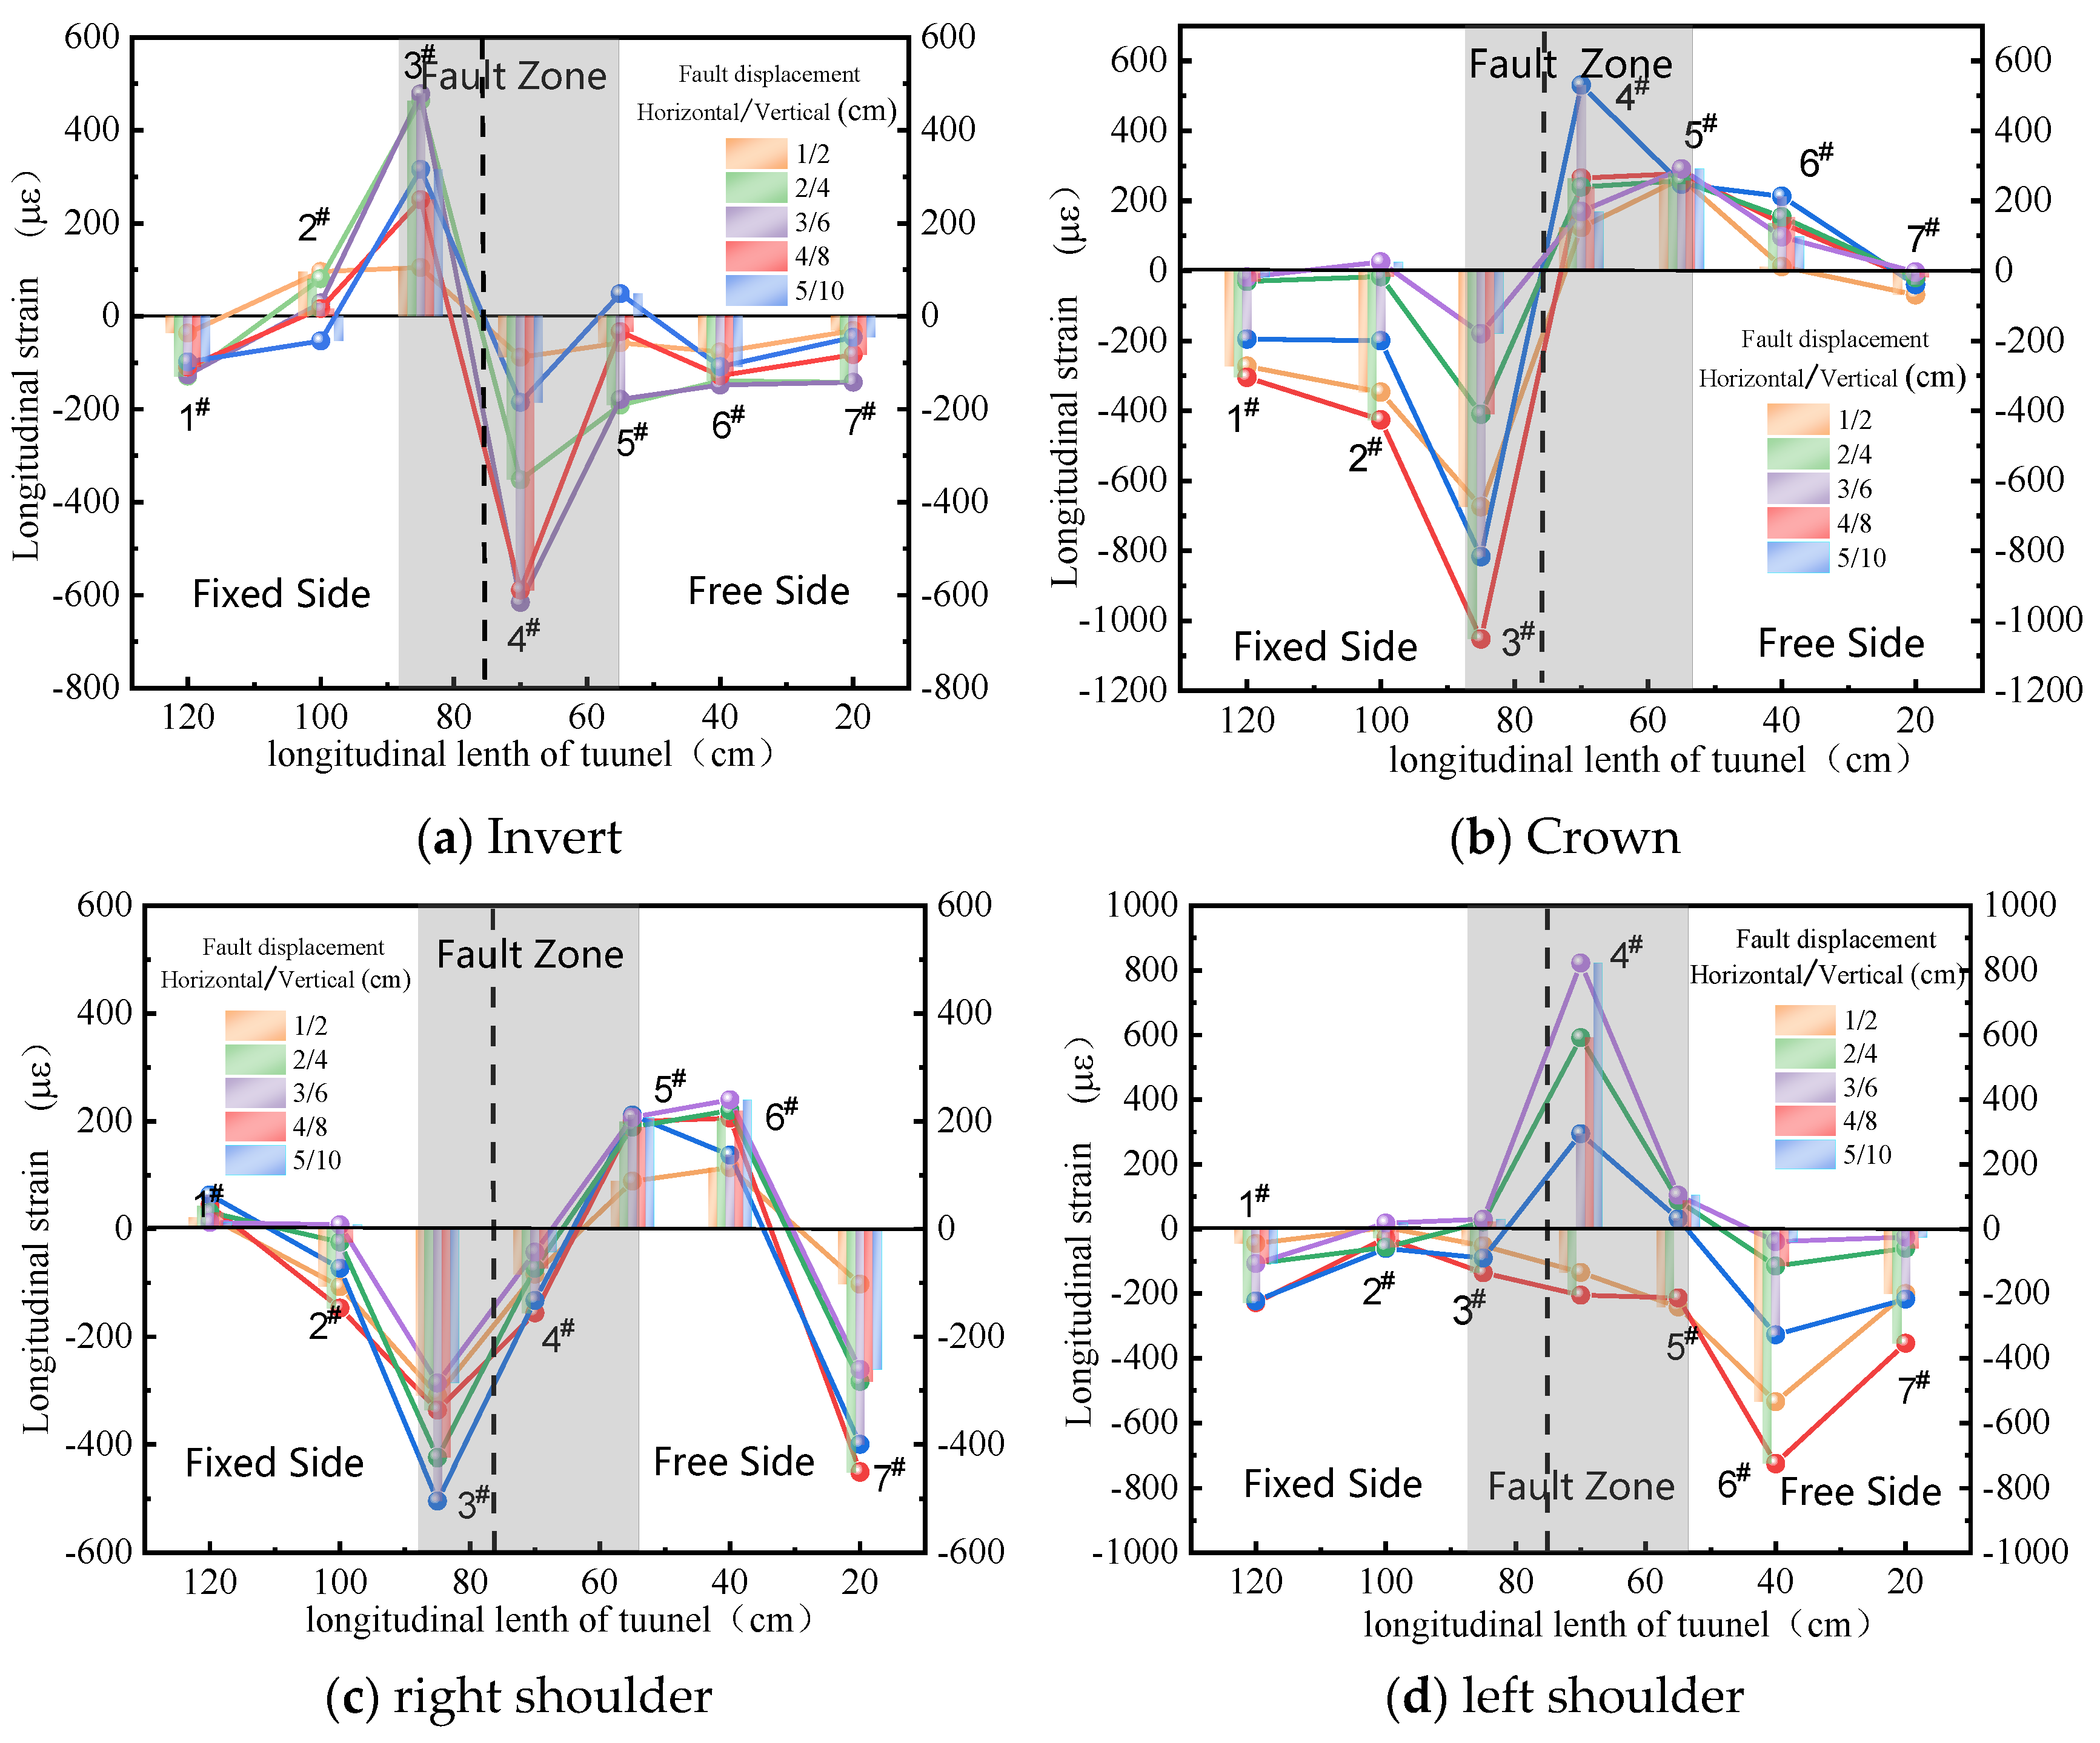
Figure 11 illustrates the variation pattern of longitudinal strain in the tunnel under reverse strike-slip fault action. In the figure, tensile strain is defined as positive and compressive strain as negative.
Figure 11.
Variation in longitudinal strain pattern under reverse strike-slip fault action.
From Figure 11a, it can be observed that the longitudinal strains at the invert of sections 1#, 6#, 4#, and 7# are all compressive, while section 3# exhibits tensile strain. The strain at section 2# transitions from an initial tensile state to a compressive state with increasing displacement magnitude, though the change is relatively small. Section 3# shows a pronounced tensile state, reaching a maximum tensile strain of 489 με (indicating yielding) at the fifth displacement step. Subsequently, the tensile strain gradually decreases with further displacement. Similarly, section 4# is under significant compression, reaching a compressive yield strain of −722 με at the fifth displacement step. As displacement continues, the compressive strain gradually reduces to −185 με. This phenomenon is attributed to the progressive accumulation of strain energy in the surrounding rock during displacement. Upon reaching a critical state, the fracture of the surrounding rock leads to a sudden release of this energy, causing the strains near the fracture zone to subsequently decrease.
From Figure 11b, it is evident that the crown of sections 1# and 3# remains under compression throughout the test, while sections 5# and 6# are also under compression. The compressive strains at sections 1# and 2# gradually increase during initial displacement, reaching maximum values of −304 με and −425 με (yielding state) at the fourth displacement step, after which they gradually decrease. Section 3# shows very pronounced compression, contrary to the stress state at its invert, reaching yield at the fourth step. Its compressive strain then gradually decreases to −179 με with further displacement. Section 4# initially shows compression but undergoes a sudden transition at the sixth displacement step, changing from −44 με (compression) to 217 με (tension). This tensile strain peaks at the seventh step before gradually declining. The tensile strain at section 5# remains relatively stable with minor fluctuations. The tensile strain at section 6# gradually increases with displacement, reaching a peak of 414 με at the tenth displacement step.
From Figure 11c,d, it can be observed that within the fault zone at sections 3# and 4#, the right haunch exhibits pronounced compressive strain. This is because the right haunch is located on the active loading side, and the compressive strain gradually increases with the magnitude of dislocation. For the left haunch, section 4# near the rupture surface shows tensile strain, which reaches its maximum when the dislocation magnitude is at its peak. The left haunch is in a tensile state due to its position on the passive loading side.
- (2)
- Hoop Strain
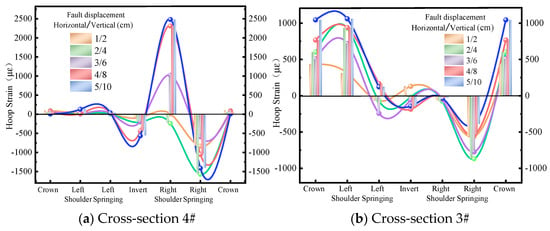
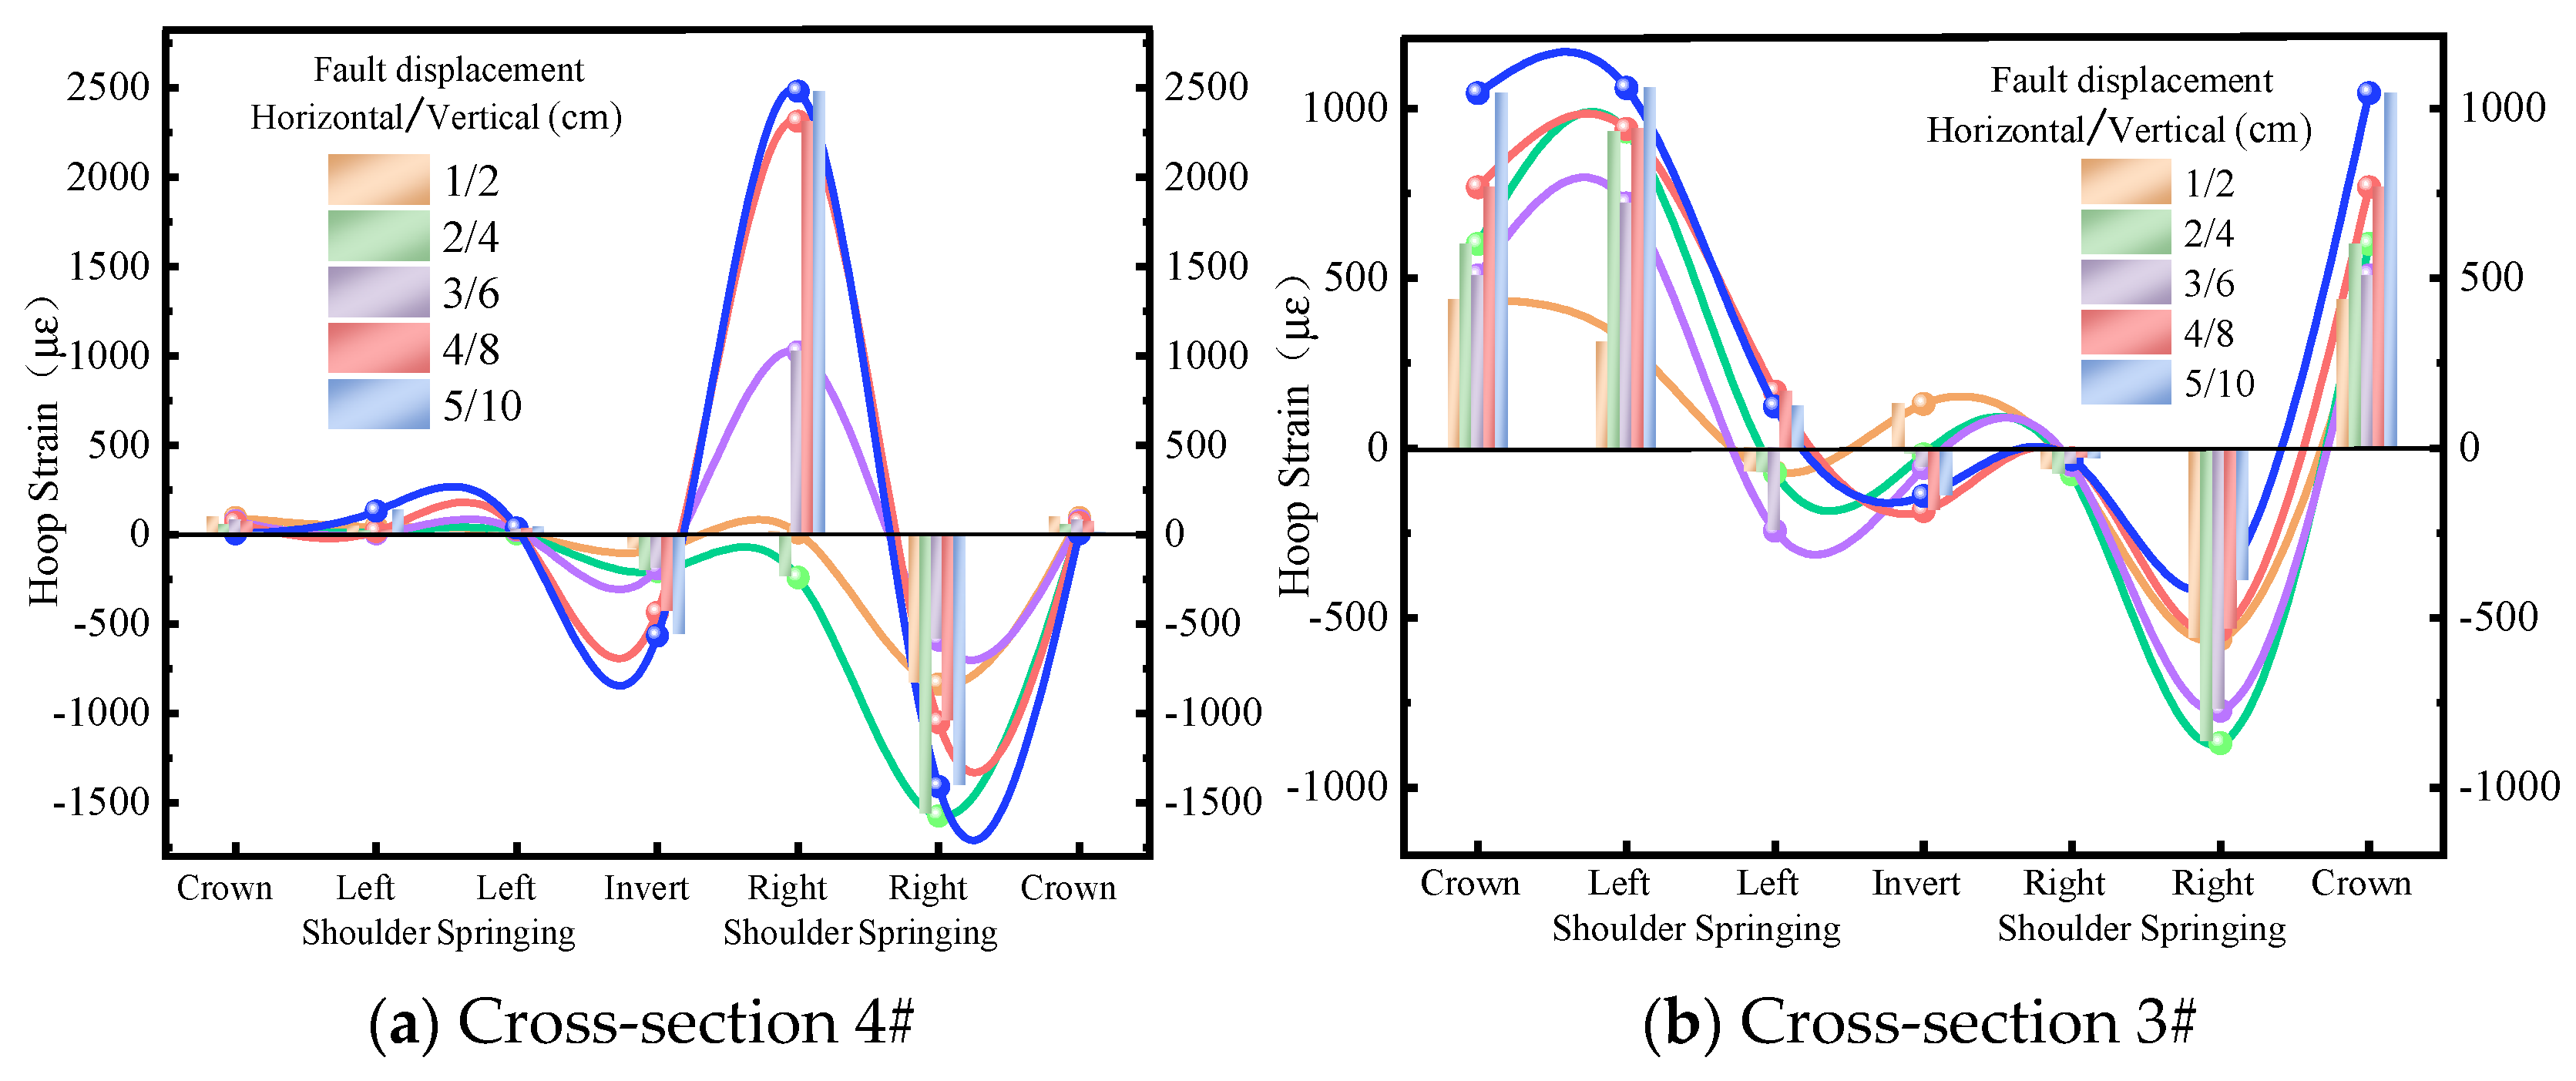
Figure 12 shows the hoop strain curves of section 3# and section 4#. For cross-section 3#, the hoop strains at the crown (T) and left haunch (LS) are tensile, while the strain at the right haunch (RS) is compressive. As the dislocation magnitude increases, the tensile strain at the crown gradually rises but does not reach yield, peaking at 1045 με at the 10th dislocation step. The right haunch begins to yield at the 5th dislocation step, with the compressive strain reaching a peak of −1045 με. At the 7th dislocation step, the left springline (LF) transitions from a compressive to a tensile state, with the hoop strain changing from −18 με to 166 με. The strain at the invert (B) shifts from an initial tensile state to a compressive state at the 5th dislocation step. With further increase in dislocation, the compressive strain shows a growing trend, reaching yield at the 8th dislocation step with a value of −185 με.
Figure 12.
Variation in hoop strain pattern in cross-sections 3# and 4#.
For cross-section 4#, the hoop strains at the crown (T), left haunch (LS), and left springline (LF) remain relatively stable. The invert (B) exhibits a distinctly compressive state throughout the entire dislocation process. The right springline (RF) initially shows compressive strain, which gradually increases until the 5th dislocation step. At the 6th dislocation step, the compressive strain transitions to tensile strain, and the tensile strain increases sharply to a peak of 2801 με. The right haunch (RS) is under compression and begins to yield at the 6th dislocation step, with the peak compressive strain reaching −1747 με.
3.2.3. Variation in Surrounding Rock Pressure
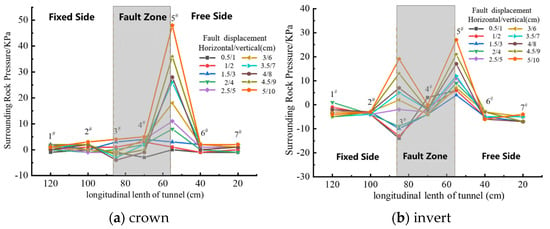
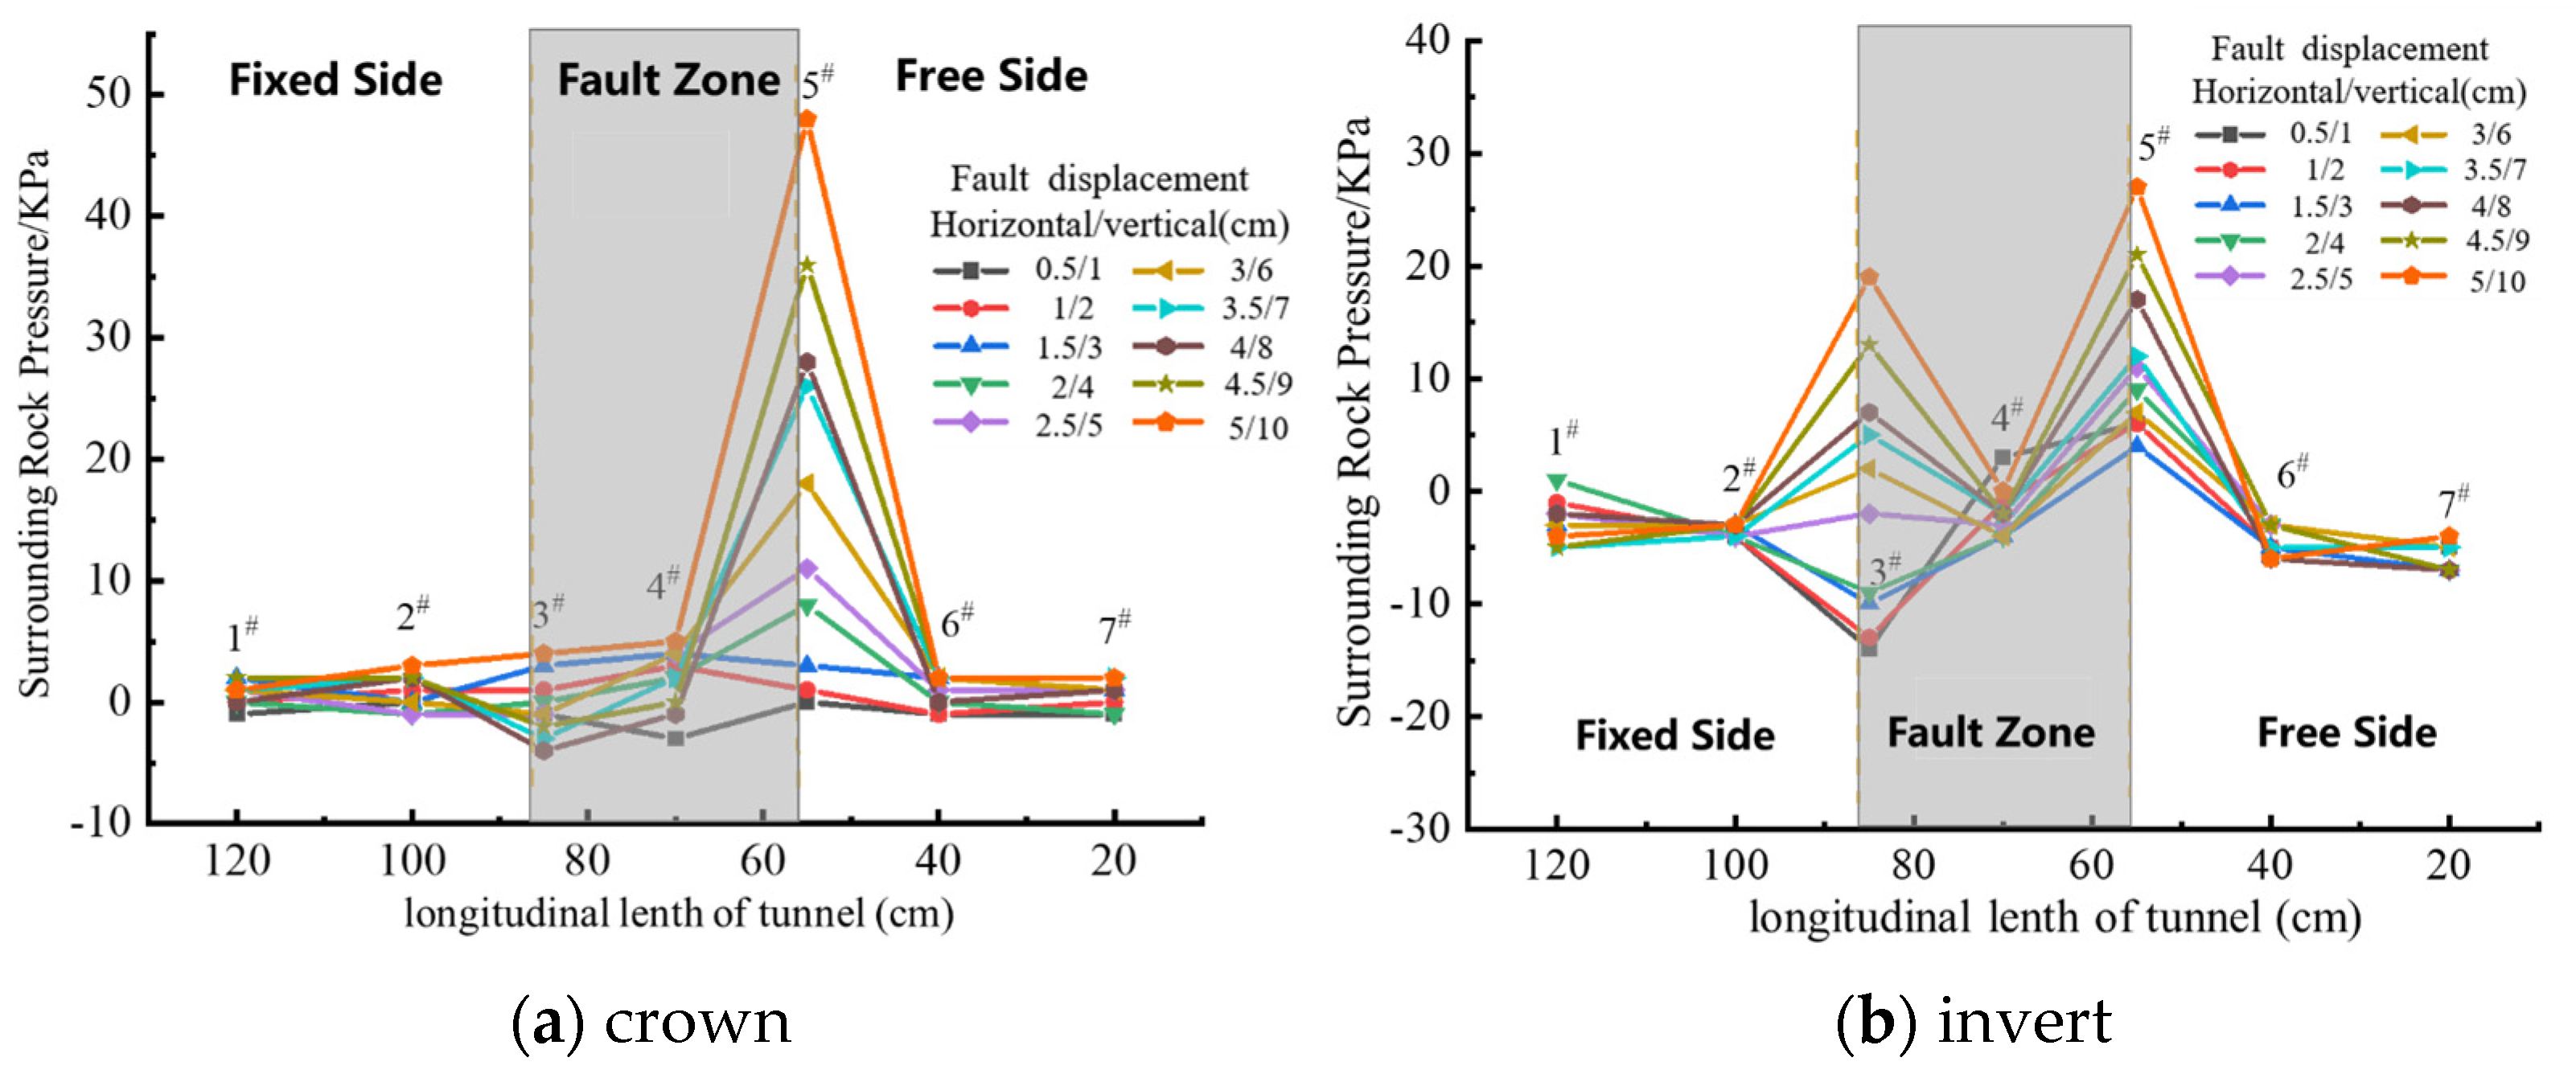
During the dislocation process, the variations in surrounding rock pressure at the crown and invert of the tunnel lining were monitored, as shown in Figure 13.
Figure 13.
Longitudinal variation curve of tunnel surrounding rock pressure.
According to the earth pressure variation curve at the crown, the earth pressure around the fracture zone within the moving box section changes drastically, while the pressure increase in areas farther from the fracture zone is relatively slow. As the dislocation magnitude continuously increases, the surrounding rock pressure at cross-section 5# rises significantly, reaching a peak of 48 kPa. This is because during the dislocation process, the tunnel lining within the fracture zone of the moving box is subjected to strong surrounding rock displacement, causing the overlying rock mass to be affected by imposed deformation and gradually compacted by active earth pressure, leading to a gradual increase in surrounding rock pressure. Based on the pressure variations at the crown and invert, the earth pressure at the invert of cross-section 3# exhibits negative values. This is due to the presence of a void beneath section 3#, likely influenced by insufficient compaction of the fill material. As the dislocation magnitude increases, the void at the invert of section 3# is gradually compacted, turning the earth pressure positive and progressively increasing. At section 5#, located within the moving box section, the tunnel lining structure restrains the upward movement of the surrounding rock beneath the invert relative to the lining. Simultaneously, the surrounding rock on both sides of the tunnel exerts a certain upward dragging effect on the rock mass below the lining invert, thereby increasing the vertical pressure at the lining invert. As the dislocation magnitude continues to increase, this dragging effect intensifies, causing the surrounding rock pressure to rise accordingly, reaching a peak of 27 kPa at the tenth dislocation step.
3.2.4. Failure Pattern of the Tunnel
After the test was completed, the surrounding rock was excavated, revealing the overall deformation and failure of the tunnel as shown in Figure 14.
Figure 14.
Failure pattern of the tunnel.
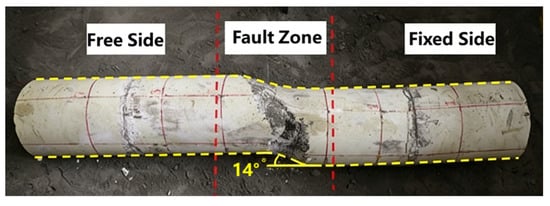
Compared to the tunnel model before the test, the lining within the fracture zone suffered severe shear failure. Specifically, the lining in the fracture zone exhibited extensive spalling, exposing the wire mesh, with spalling trajectories oriented at approximately 45°, indicating significant diagonal shear deformation of the lining in this zone. Observations of the tunnel axis and the marked yellow reference lines show that the lining in the moving box section underwent both horizontal and vertical offsets. Vertically, the angle between the lining in the moving box and the fixed box sections is about 20°, with a vertical uplift of approximately 41 mm. Horizontally, the angle is about 14°, with a horizontal offset of 31 mm. Both the horizontal and vertical directions exhibit an “S”-shaped deformation, resulting in an overall spatial “S”-shaped failure pattern of the tunnel.
4. Numerical Analysis of Seismic Damage in the Daliang Tunnel
In contrast to the conditions of the model test presented in this paper, the in situ geological environment of the Daliang Tunnel crossing the Lenglongling Fault is far more complex. Factors such as the tunnel burial depth, the differing geological conditions on either side of the fault, and the fault strike, among others, cannot be fully captured by the model test alone. Therefore, to more accurately simulate the geological setting of the Daliang Tunnel, a numerical model was established that incorporates structural zonation within the fault zone. By comparing the results from this numerical model with those from the physical model test, this study aims to elucidate the failure mechanisms of the Daliang Tunnel.
4.1. Numerical Model
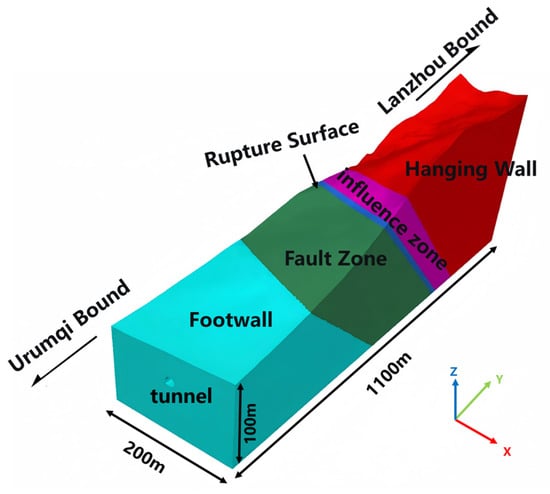
A three-dimensional analysis model of the Daliang Tunnel crossing the F5 Lenglongling fault zone was established in FLAC3D 6.0 software, as shown in Figure 15. The tunnel axis direction was defined as the y-axis, and the vertical direction as the z-axis. In the numerical model, the x-direction extends ±100 m from the tunnel center point, the y-direction (along the tunnel axis) spans 1100 m centered on the fault rupture surface, and the z-direction ranges from the ground surface above the left tunnel centerline downward to a depth of 75 m.
Figure 15.
Three-dimensional analysis model of the tunnel crossing the F5 Lenglongling fault zone.
4.2. Calculation Parameters
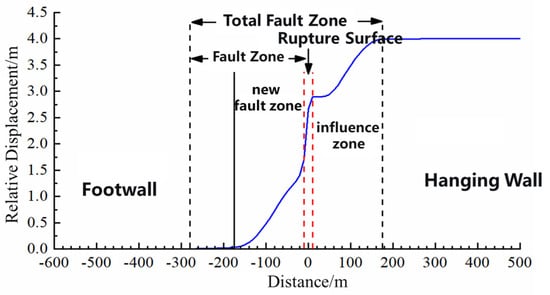
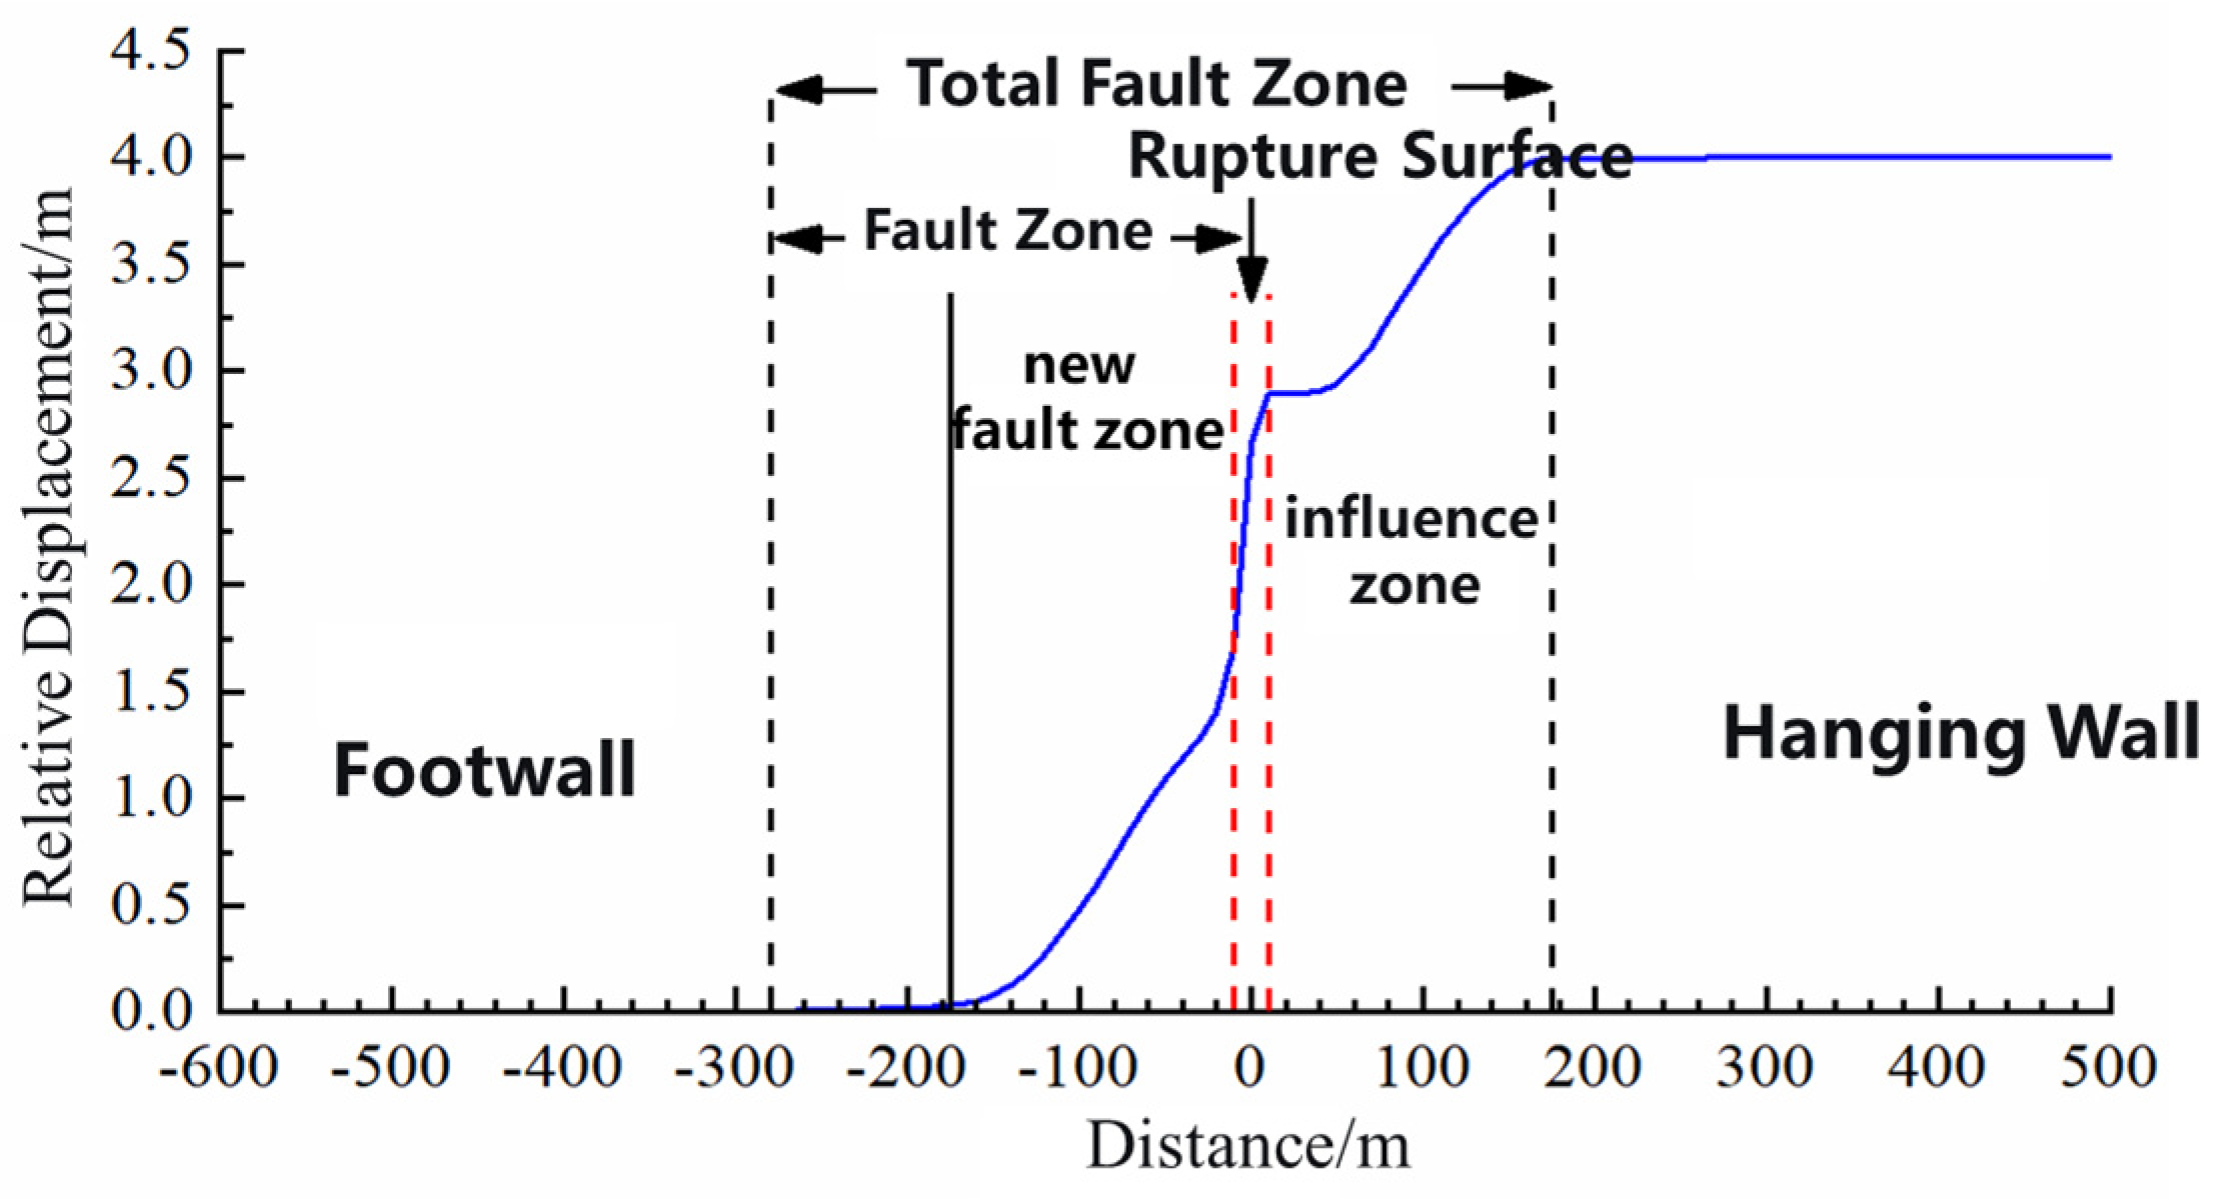
To more accurately characterize the rock mass conditions of the Daliang Tunnel, internal structural zonation within the fault zone was considered. A rupture surface was incorporated at the boundary between the fault zone and the influence zone. The displacement pattern within the fault zone adopted an S-shaped mode, as represented by Equation 1, applied over a range twice the width of the influence zone. The boundaries of the S-shaped displacement pattern were set at the interface between the influence zone and the hanging wall rock mass, and within the fault zone at a distance equal to the influence zone width from the interface between the fault zone and the rupture surface/influence zone. The rupture surface corresponds to the chainage range K1971+391 to K1974+410. The fault zone dip angle was assumed to be 40°, and the angle between the fault strike and the tunnel axis is 70°. The total fault zone width (including the influence zone) is 455 m, comprising a fault core width of 270 m and an influence zone width of 165 m, with a rupture surface width of 20 m. The relative dislocation magnitude was set to 4 m. The boundary between the new fracture zone and the fault zone is located 105 m from the interface between the fault zone and the footwall rock mass. The boundary conditions were set as follows: the lowermost boundary in the z-direction at the model base was assigned a fixed displacement constraint to simulate the rigid restraint of the deep rock mass; the left and right boundaries in the x-direction, and the front and rear boundaries in the y-direction were subjected to normal displacement constraints to represent the lateral confinement of the rock mass, while ensuring effective transmission of displacement induced by fault dislocation within the model; the uppermost boundary in the z-direction was set as a free boundary. The tunnel cross-section, considered for the active fault crossing, is a horseshoe shape. The relevant physical and mechanical parameters of the surrounding rock are listed in Table 6.
where ω is the displacement at a given point of the tunnel, a corresponds to the equivalent vertical dislocation magnitude, l represents the equivalent beam length analogous to the tunnel length, t is the position of a point along the y-direction within the fault fracture zone in the coordinate system.
Table 6.
Mechanical parameters of the numerical model.
4.3. Analysis of Numerical Results
4.3.1. Displacement Variation
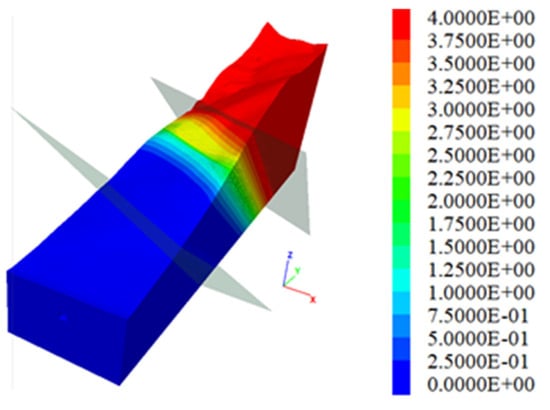
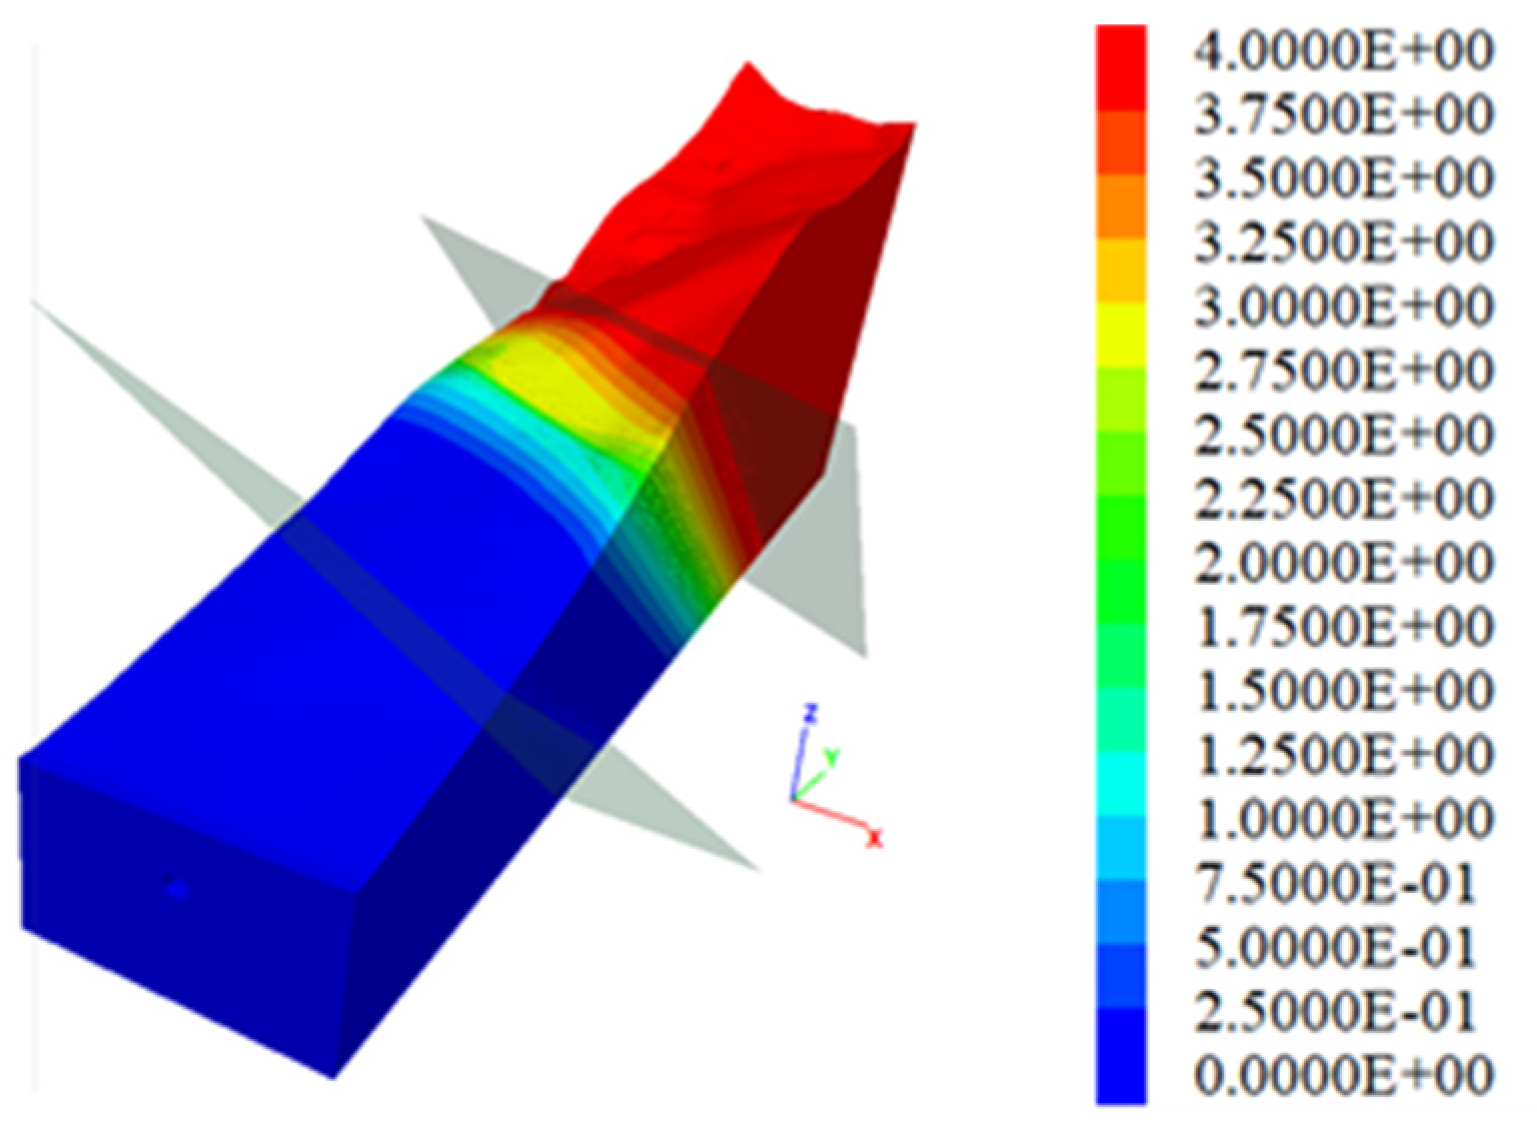
Figure 16 and Figure 17 show the horizontal displacement contour map of the tunnel surrounding rock after fault dislocation and the horizontal displacement curve of the surrounding rock in the crown area, respectively. It can be observed that the horizontal strike-slip displacement is distributed across the fracture zone. Within the rupture surface, the rate of change of relative displacement is the highest. In the transition zones between the rupture surface and the new fracture zone, and between the rupture surface and the influence zone, the rate of relative displacement change initially slows down before increasing again. Subsequently, the rate gradually decreases in the transition zones between the new fracture zone and the fracture zone, and between the influence zone and the hanging wall rock mass.
Figure 16.
Displacement contour map of tunnel surrounding rock.
Figure 17.
Relative displacement curve of the rock mass in the crown area of the Daliang Tunnel.
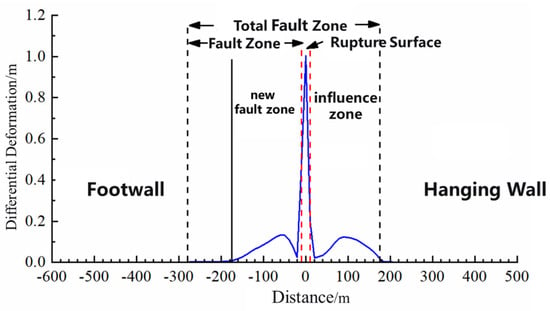
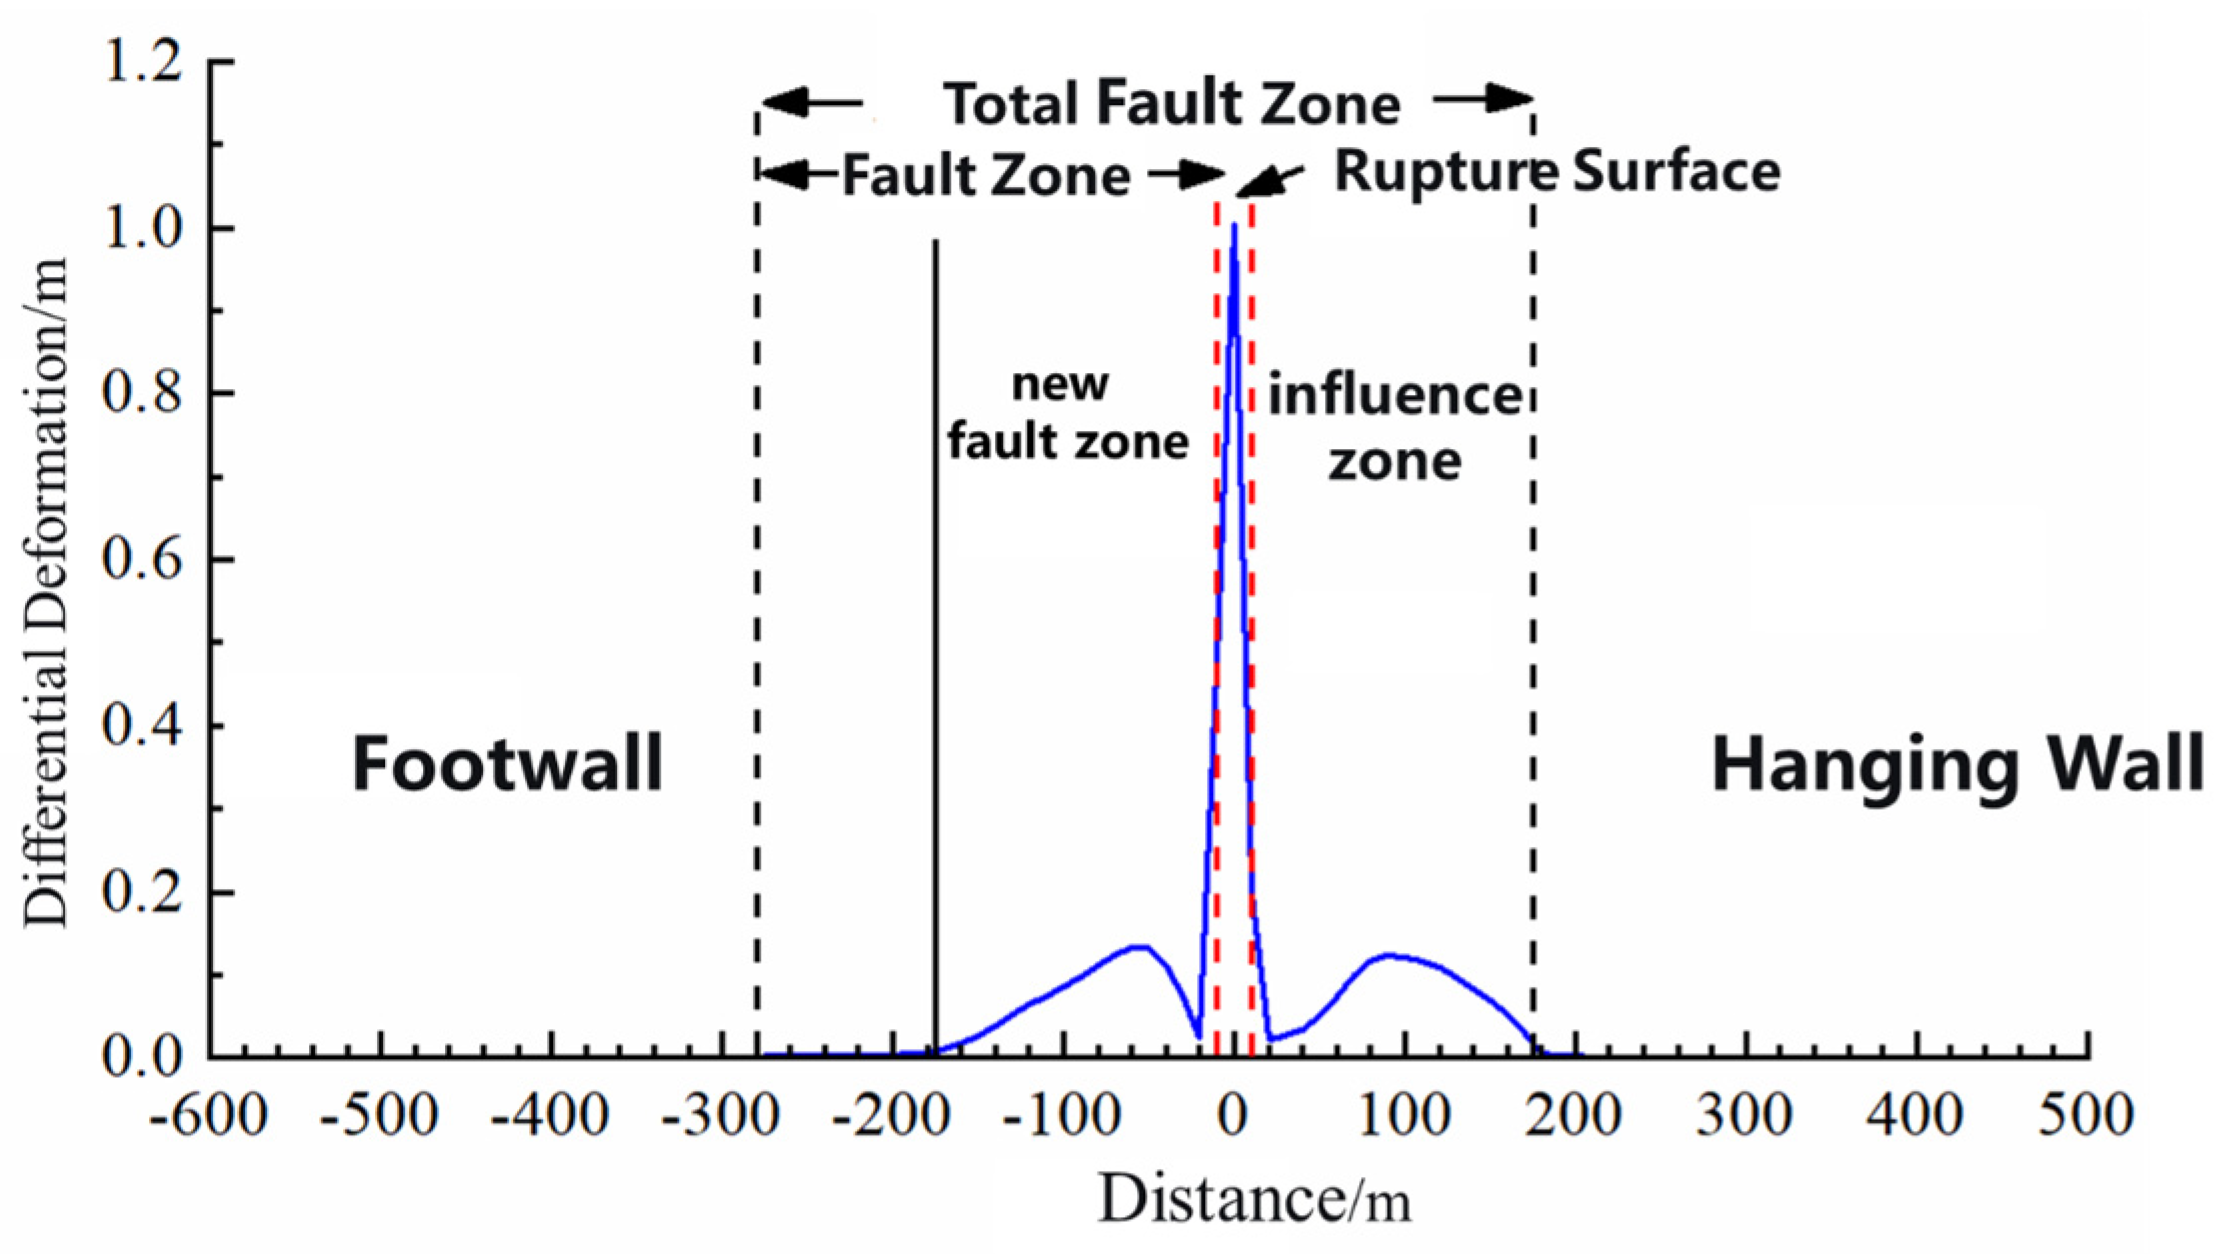
Figure 18 presents the horizontal relative deformation curves of the tunnel surrounding rock excavation under different dislocation magnitudes. It can be observed that, due to the presence of internal structural zonation within the fault zone, the distribution of relative deformation of the tunnel surrounding rock excavation within the fault zone is relatively complex. Significant relative compression occurs at the rupture surface, and the soft-to-hard transition segments between the rupture surface and the new fracture zone, as well as between the rupture surface and the influence zone, exhibit a trend of first decreasing and then increasing.
Figure 18.
Horizontal relative deformation curves of the left and right sidewalls of the Daliang Tunnel.
4.3.2. Failure Pattern of the Tunnel
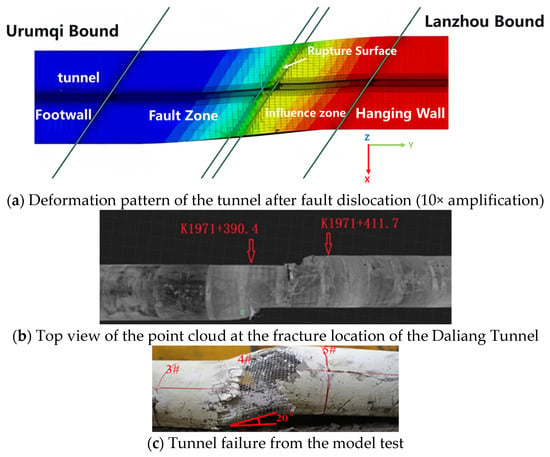
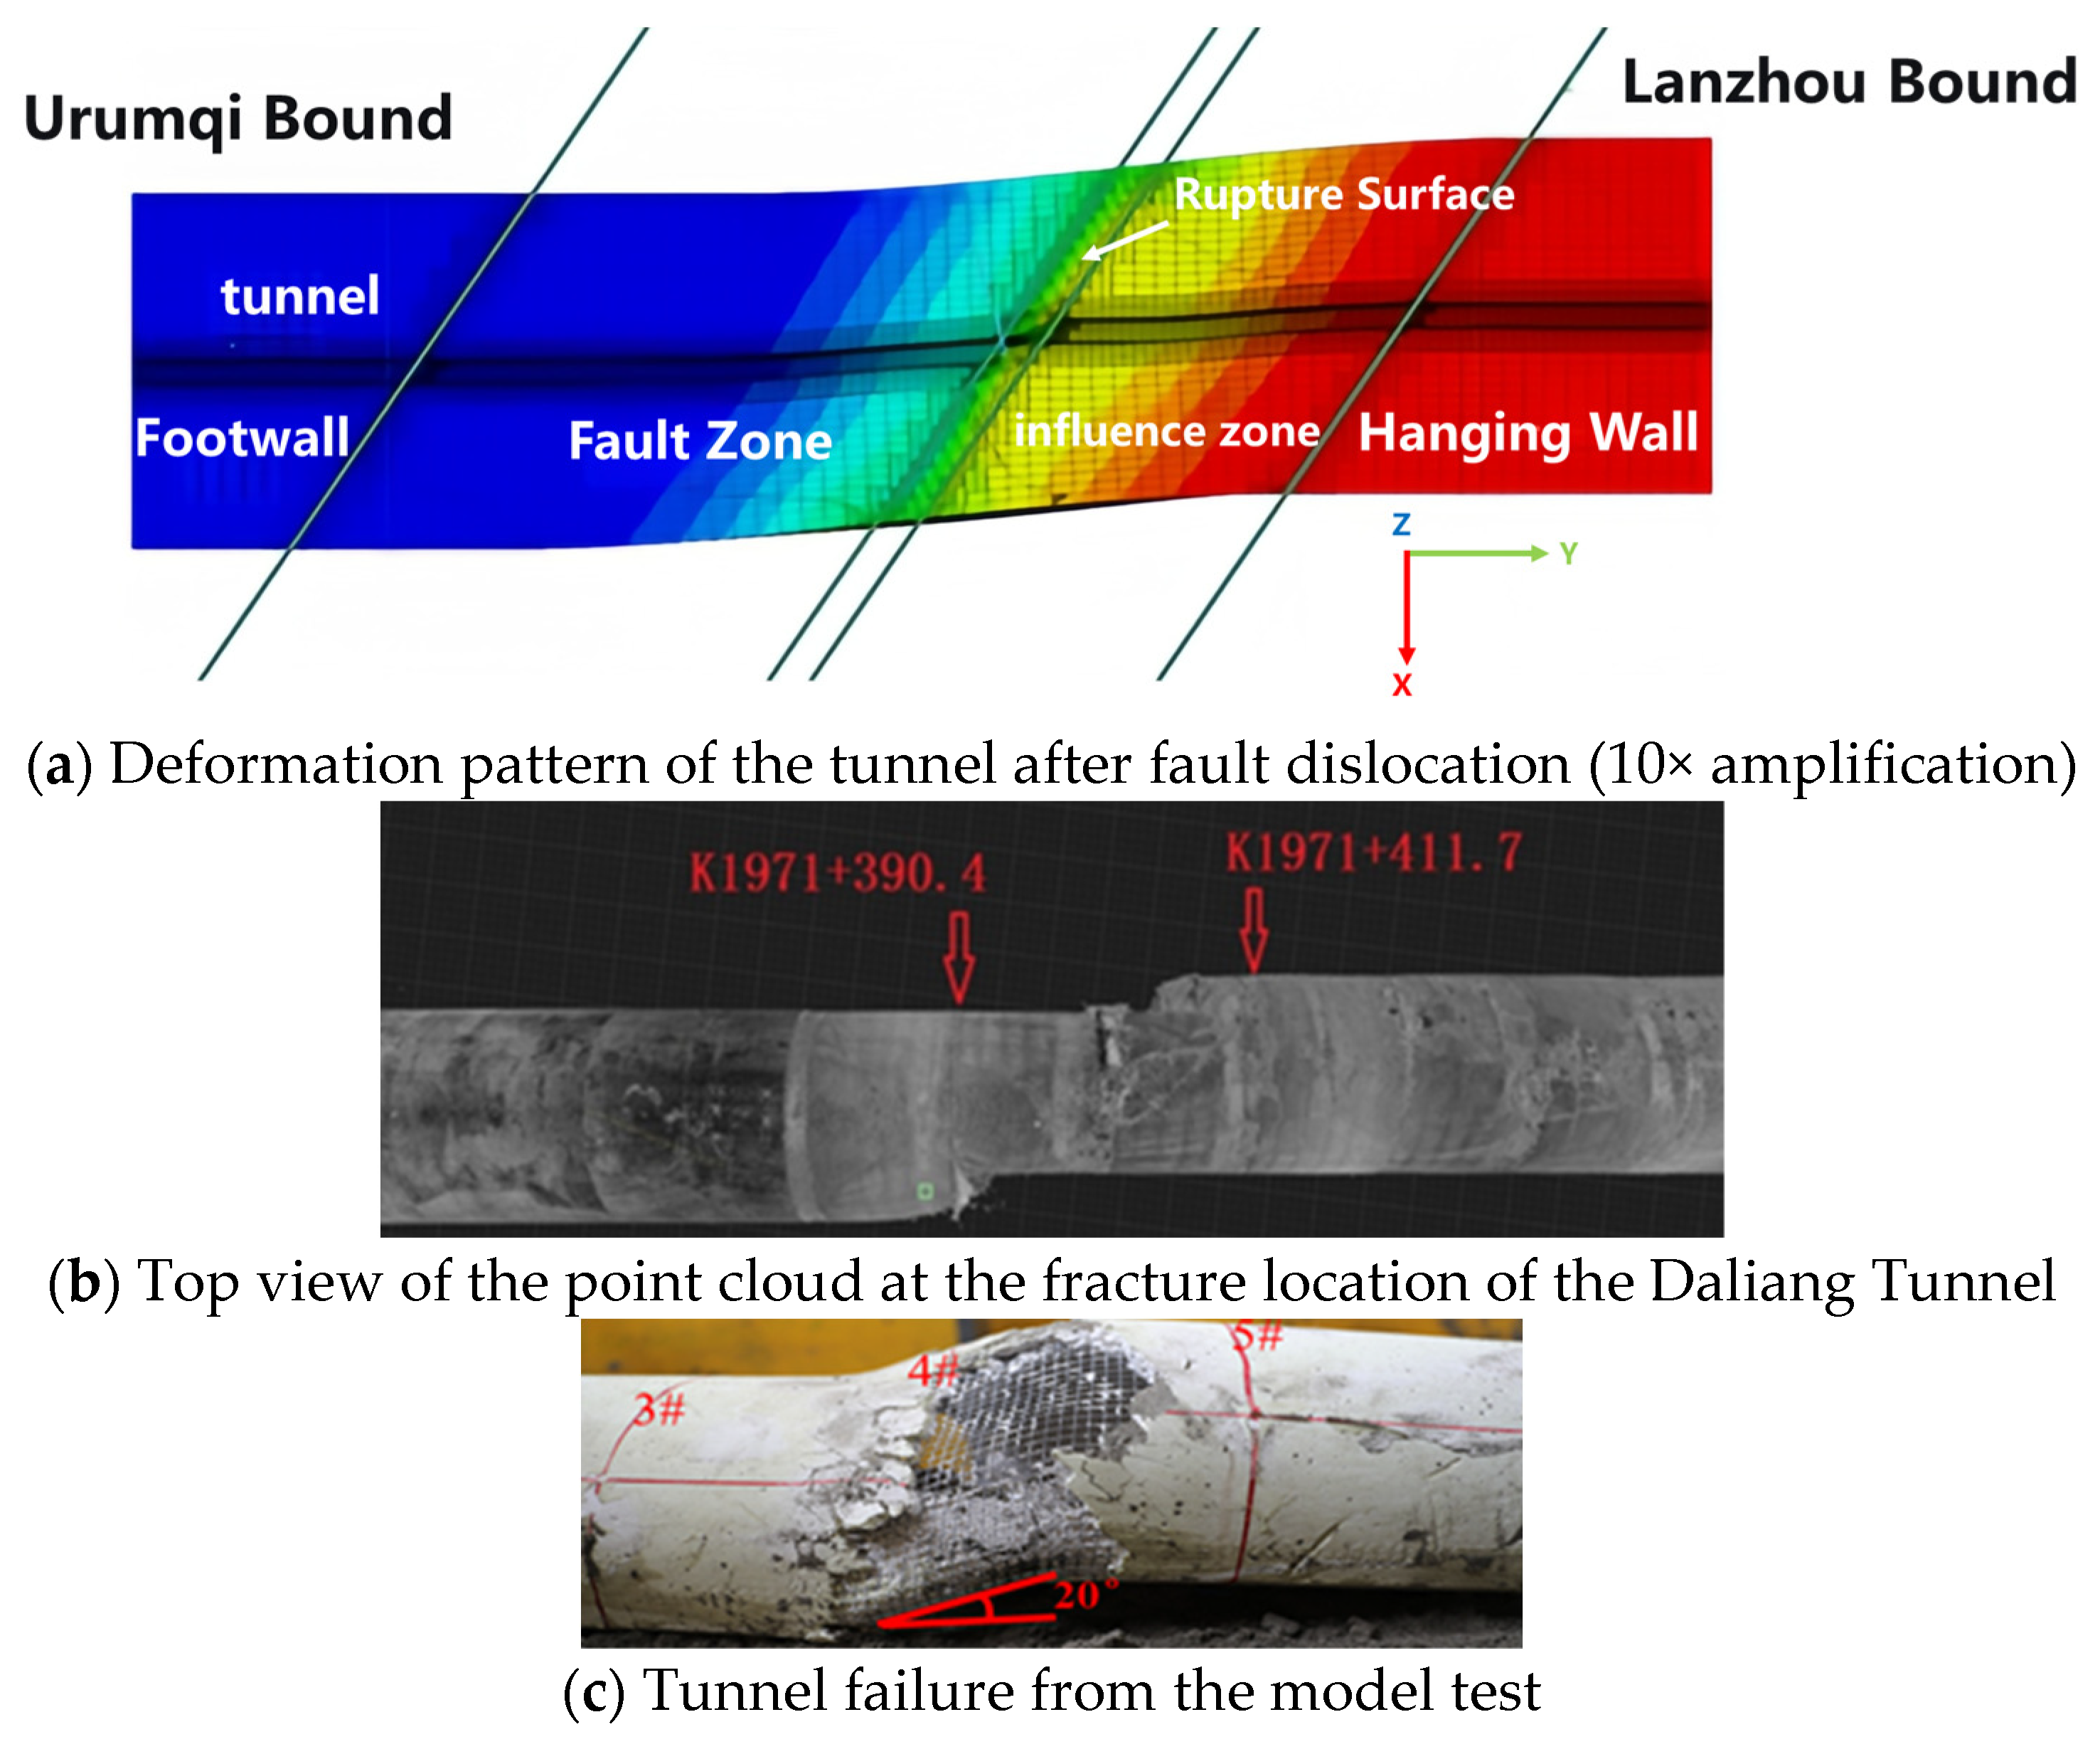
Figure 19 presents a comparative analysis of three results: the numerical simulation outcome of the Daliang Tunnel (with displacement amplified tenfold), the top view of the point cloud data from the on-site scan of the tunnel fracture zone, and the failure morphology from the model test.
Figure 19.
Comparative analysis of failure morphology of the Daliang Tunnel: field investigation, model test, and numerical simulation.
From Figure 19a, it can be seen that under the action of reverse strike-slip fault dislocation, the tunnel sidewalls underwent significant horizontal relative deformation due to compressive forces from the fault. The relative deformation within the rupture surface is greater than that within the influence zone and the fracture zone, and is the most pronounced. According to the failure morphology observed in the model test, between monitoring cross-sections 4# and 5#, the lining exhibited both horizontal and vertical offsets. Spalling occurred on both the inner and outer sides of the wire mesh in the lining within the fracture zone, primarily concentrated at the haunch areas, indicating significant compression and shear effects in this region. Numerous diagonal cracks appeared in the vicinity of the lining spalling. Furthermore, the compressive deformation pattern of the sidewalls within the rupture surface, the top view of the point cloud data at the tunnel fracture location, and the failure morphology from the model test all exhibit an “S”-shaped deformation.
These findings indicate that both the model test and the numerical simulation results effectively reproduced the failure morphology of the Daliang Tunnel during the seismic event, thereby validating the rationality of the numerical model and the physical model test.
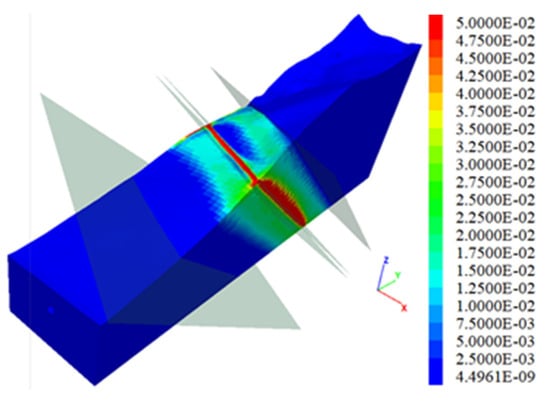
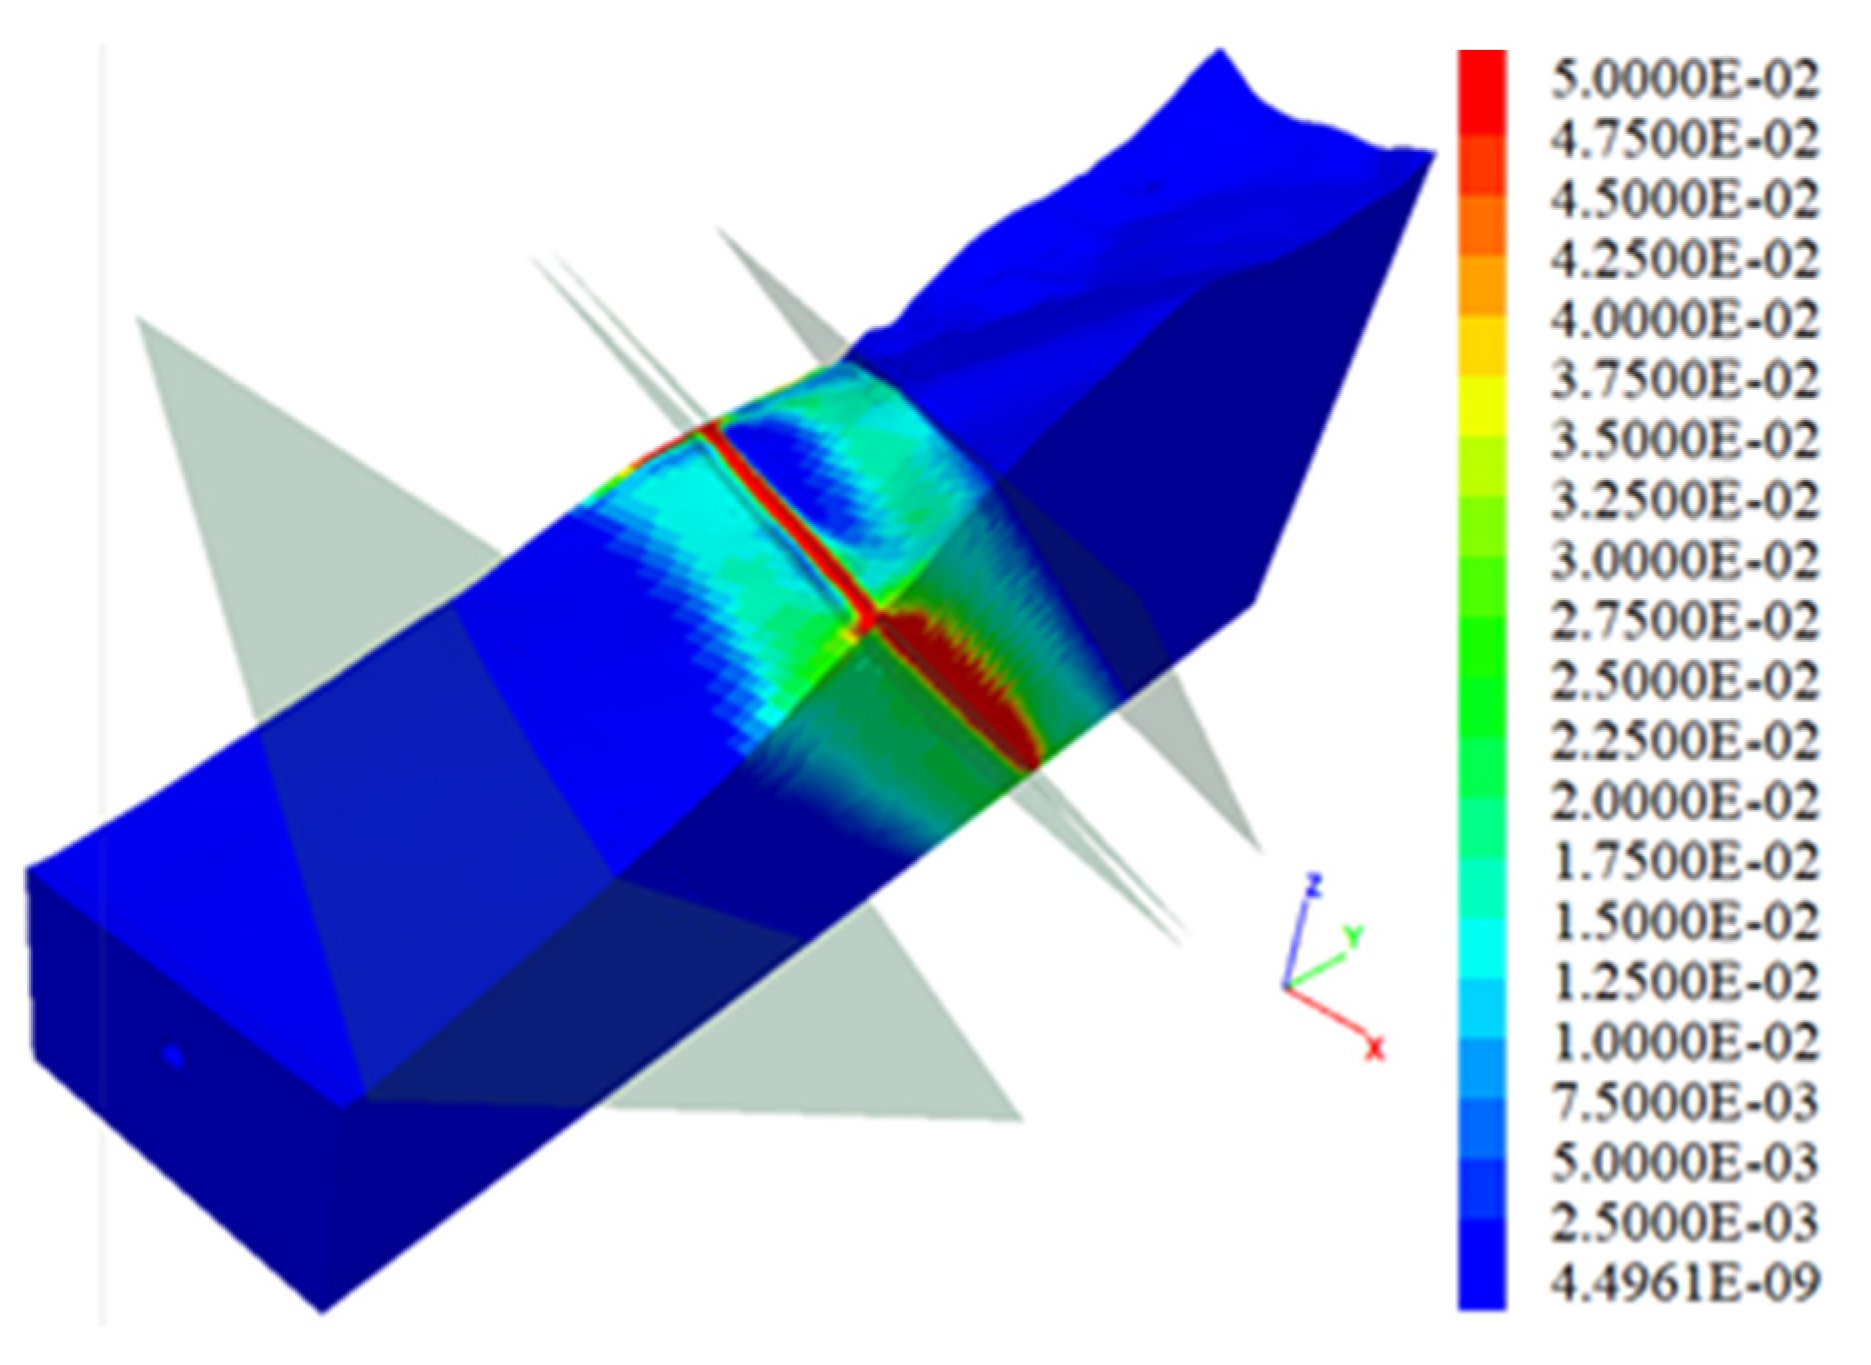
4.3.3. Shear Strain of Rock Mass
The strain results of the rock mass exhibit good correspondence with its deformation results. Figure 20 presents the contour map of the horizontal shear strain in the surrounding rock. It can be observed that the distribution of horizontal shear strain in the rock mass aligns with the trend of relative deformation in the surrounding rock of the tunnel excavation body. Specifically, intense shear strain is generated within the rupture surface range. Furthermore, the soft-to-hard transition segments between the new fracture zone and the rupture surface/influence zone, as well as between the influence zone and the hanging wall rock mass, also show a trend of first decreasing and then increasing strain.
Figure 20.
Shear strain contour map of the surrounding rock of the Daliang Tunnel.
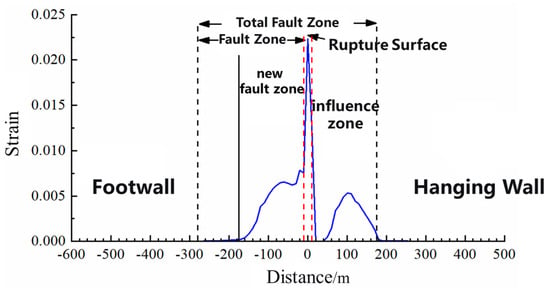
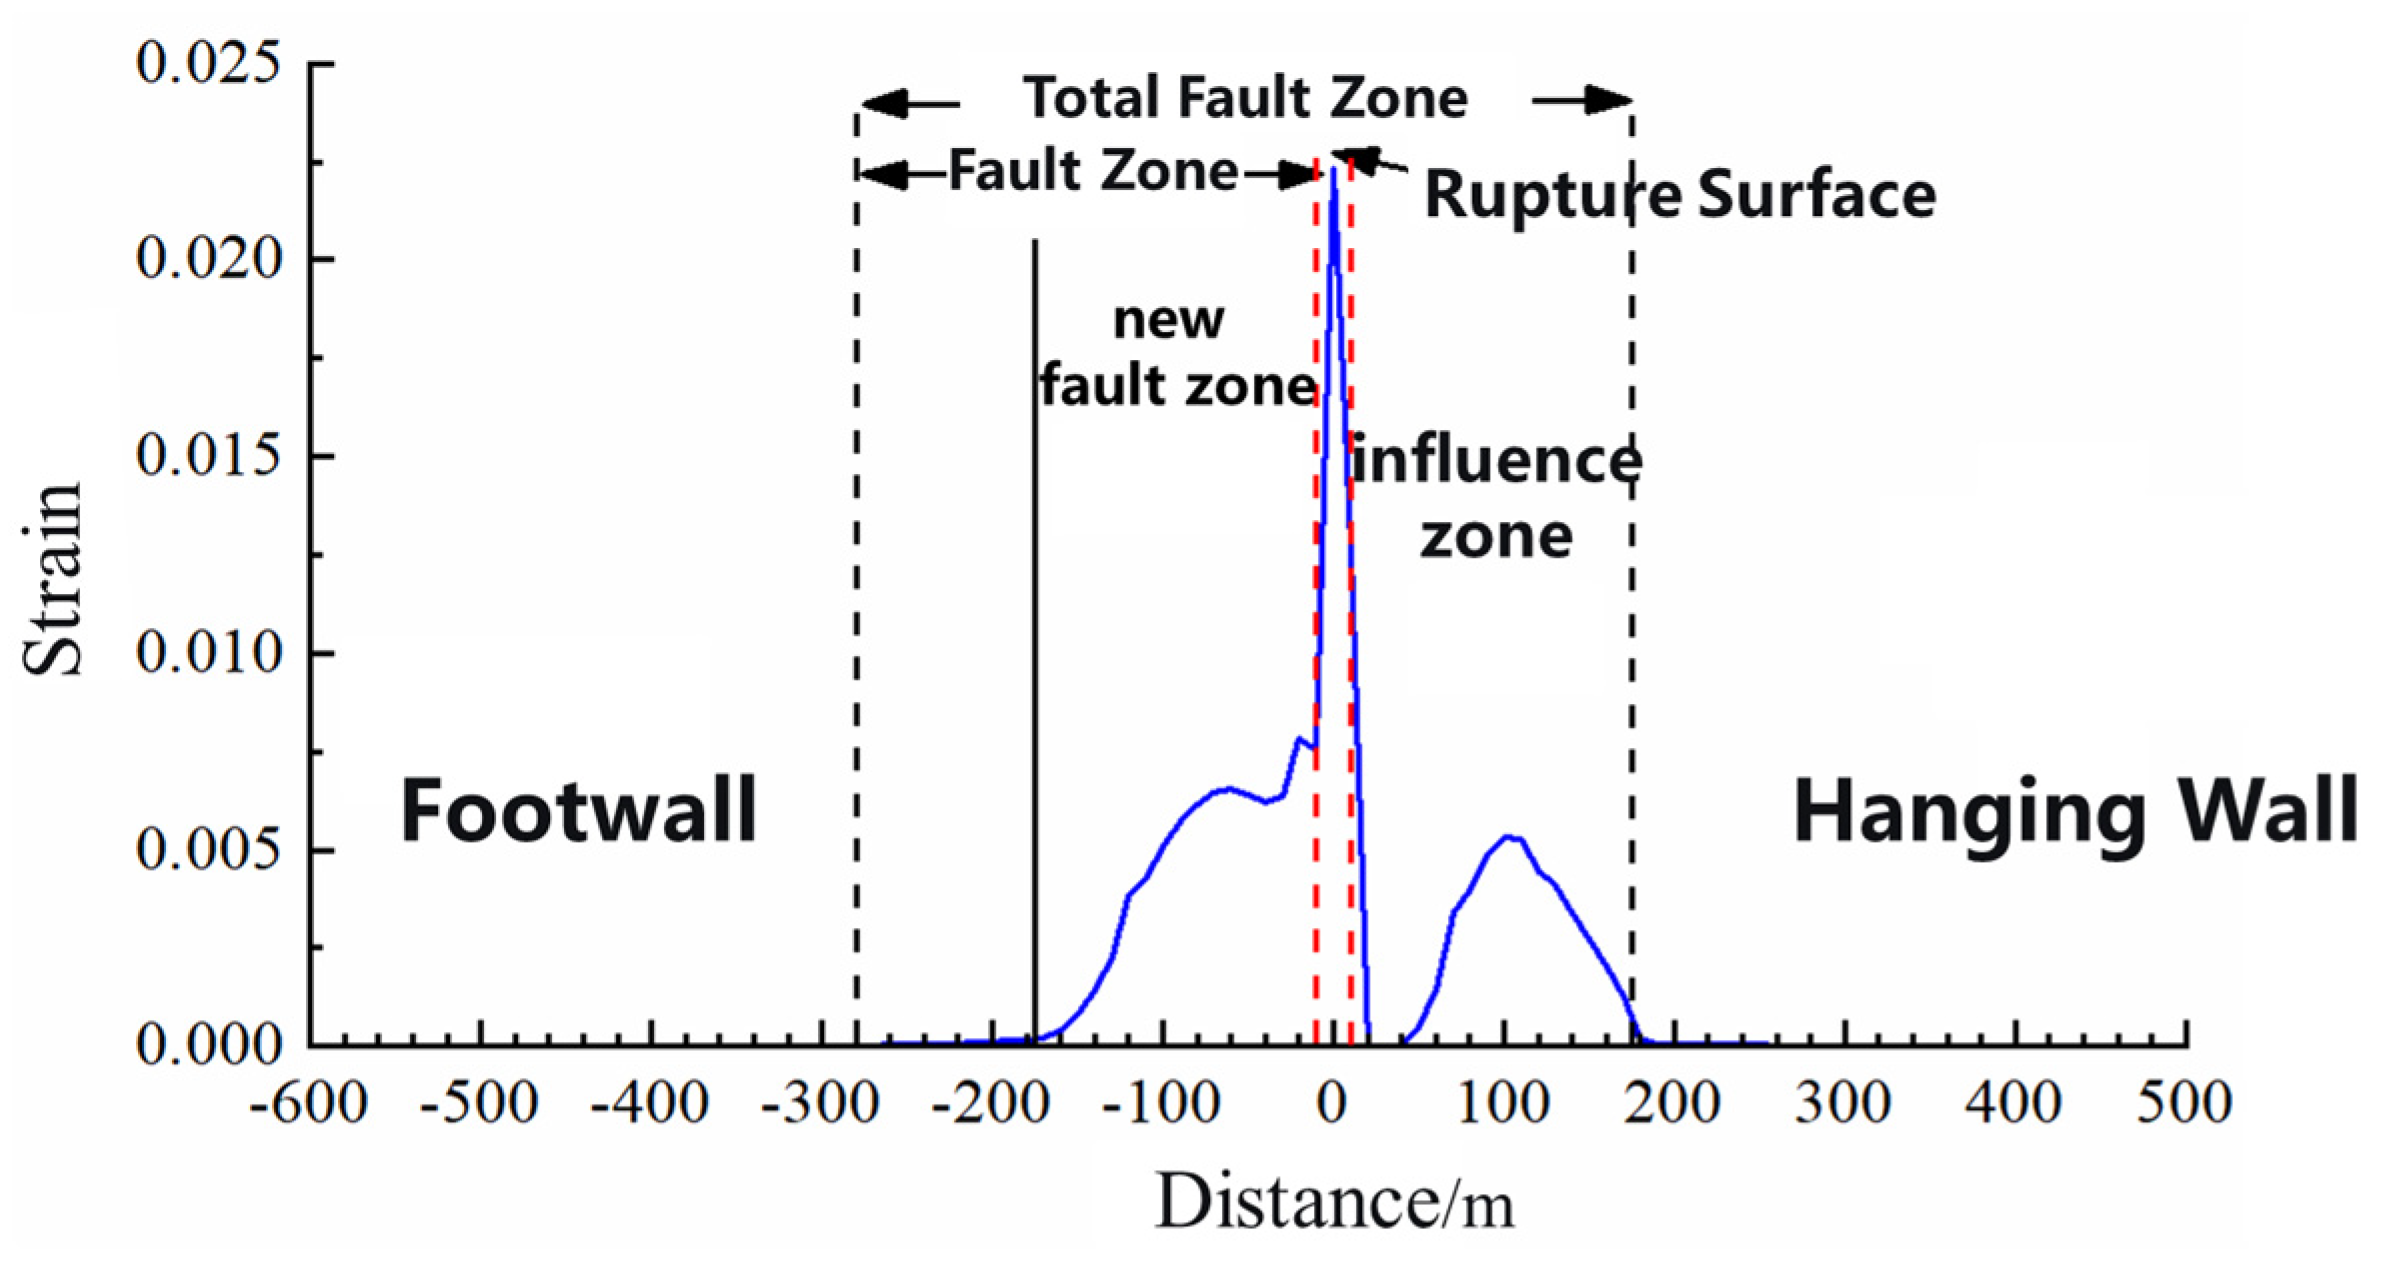
Figure 21 presents the horizontal shear strain curves of the surrounding rock in the tunnel crown area under different dislocation magnitudes. The characteristics of the strain curves are consistent with the trend of relative deformation in the surrounding rock. The strain distribution of the tunnel surrounding rock excavation body within the fault zone is relatively complex, with significant shear strain occurring at the rupture surface. Furthermore, the soft-to-hard transition segments between the new fracture zone and the rupture surface, as well as between the influence zone and the hanging wall rock mass, also exhibit a trend of initially decreasing and then increasing strain, which aligns with observations and understanding of soft-hard interfaces in surrounding rock from general seismic investigations.
Figure 21.
Horizontal shear strain curve of the surrounding rock in the crown area of the Daliang Tunnel.
4.3.4. Comparative Analysis
To further quantitatively assess the consistency between the model test and numer ical simulation results, a quantitative comparison was conducted focusing on lining strain peaks and structural deformation. In terms of strain response, the model test measured a peak longitudinal tensile strain of 489 με at the invert of section 3# and a peak longitudinal compressive strain of –722 με at the invert of section 4# during reverse strike-slip fault dislocation, both located at the interface between the fault fracture zone and the intact surrounding rock. In the numerical simulation, the peak horizontal shear strain of the surrounding rock near the rupture surface reached 0.35% (3500 με). Although the numerical values differ due to the distinct measurement objects (lining surface strain vs. surrounding rock shear strain), both approaches exhibited pronounced strain concentration within the fault zone, with peak strain positions consistently located at or adjacent to the rupture surface, demonstrating a high degree of spatial coincidence.
Regarding structural deformation, the model test recorded a vertical uplift of 41 mm and a horizontal offset of 31 mm in the tunnel lining, exhibiting an overall “S”-shaped distortion. The horizontal relative deformation curve of the tunnel sidewall in the numerical simulation indicated a deformation gradient of approximately 0.8 ‰ at the rupture surface, corresponding well to the segment with the highest deformation rate observed in the model test. Furthermore, the planar offset pattern at the tunnel fracture location depicted by the point-cloud top view was highly consistent with the “S”-shaped distortion trend shown in the numerical displacement contour. The deviation in the magnitude of sidewall compressive deformation between the two approaches remained below 15%.
The above quantitative comparisons demonstrate good agreement between the model test and numerical simulation in terms of key mechanical indicators, further validating the scientific rigor and reliability of the experimental method, numerical model, and failure mechanism analysis presented in this study.
5. Conclusions
This study, taking the Daliang Tunnel of the Lanzhou–Xinjiang High-Speed Railway subjected to the Menyuan earthquake as the engineering context, carried out seismic damage investigations of tunnels crossing active faults. By employing meso-scale physical model testing and numerical simulation, the failure modes and mechanical responses of the Daliang Tunnel under reverse strike-slip fault dislocation were systematically examined. The main conclusions are as follows:
- (1)
- With respect to the failure patterns and strain response characteristics of the tunnel structure, damage is primarily concentrated within the fault fracture zone, where extensive lining spalling occurs mainly along an orientation of approximately 45°. This failure mode results from the combined effect of horizontal and vertical dislocations, inducing oblique shear and compression in the lining. The presence of significant shear strain at the rupture surface is confirmed by numerical results.
- (2)
- The distribution of surrounding rock pressure exhibits pronounced variations at the boundaries of the fracture zone. This is attributed to the dislocation-induced displacement of the tunnel lining within the active segment of the fracture zone, which imposes deformation on the adjacent surrounding rock, leading to progressive compaction under active earth pressure, albeit accompanied by localized void formation.
- (3)
- The model test reveals that the tunnel experienced both vertical uplift and horizontal offset, exhibiting an “S”-shaped deformation pattern. This pattern aligns well with the “S”-shaped distortion obtained from numerical simulations. Moreover, the compression morphology of the sidewalls within the rupture surface closely corresponds to the plan-view point cloud data acquired from the actual tunnel rupture site.
- (4)
- By introducing a rupture surface at the interface between the fault zone and its influence zone, the dislocation mode and seismic damage characteristics of the Daliang Tunnel during the Menyuan earthquake are effectively reproduced. Within the rupture surface, the surrounding rock exhibits the most pronounced compressive deformation and strain. Furthermore, the soft-to-hard transition segments—between the new fracture zone and the rupture surface, and between the rupture surface and the influence zone—demonstrate a distinct trend of initially decreasing followed by increasing values.
- (5)
- The influence of composite reverse strike-slip fault dislocation on tunnels is not merely characterized by single shear failure, but rather induces a multi-scale damage mechanism driven by the coupling effect of spatial “S”-shaped torsional deformation and surrounding rock-lining detachment. Tunnel safety risks primarily arise from three aspects: the combined oblique shear-compression failure of the lining within the fracture zone (spalling along 45° trajectories), stress redistribution caused by void detachment at the interface, and the nonlinear strain response—characterized by an initial decrease followed by an increase—induced by structural zonation (i.e., rupture surface, influence zone, transition segment) within the fault zone.
Through the research presented in this paper, key mechanical response laws and design references are established for tunnel engineering in reverse strike-slip fault zones. In practical engineering, priority should be given to the enhanced design of the fault fracture zone and the core area of the rupture surface. It is recommended to adopt lining structures with superior shear resistance and optimize support parameters accordingly. Meanwhile, in consideration of the “S”-shaped dislocation deformation characteristics of the fault, mitigation measures such as hinged structures, buffer layers, and flexible anti-dislocation structures should be implemented to effectively release displacement and alleviate shear and compression effects. In addition, the cooperative deformation between the surrounding rock and the lining must be fully considered in the design to avoid stress concentration induced by void detachment at fracture zone interfaces. By integrating fault slip rates and dislocation magnitudes to pre-assess structural damage, targeted seismic retrofitting and post-construction maintenance strategies can be developed, thereby ensuring the long-term operational safety of cross-fault tunnels.
Author Contributions
Methodology, C.S.; Software, A.A.; Investigation, L.W.; Resources, G.Y.; Data curation, M.M.; Writing—original draft, X.Z.; Writing—review & editing, Q.H.; Funding acquisition, Q.H. All authors have read and agreed to the published version of the manuscript.
Funding
This research received no external funding.
Data Availability Statement
The original contributions presented in this study are included in the article. Further inquiries can be directed to the corresponding author.
Conflicts of Interest
The authors declare no conflict of interest.
References
- Roy, N.; Sarkar, R. A review of seismic damage of mountain tunnels and probable failure mechanisms. Geotech. Geol. Eng. 2017, 35, 1–28. [Google Scholar] [CrossRef] [Scilit]
- Yu, H.T.; Yuan, Y.; Liu, X.; Li, Y.W.; Ji, S.W. Damages of the Shaohuoping road tunnel near the epicentre. Struct. Infrastruct. Eng. 2013, 9, 935–951. [Google Scholar] [CrossRef] [Scilit]
- Kiani, M.; Akhlaghi, T.; Ghalandarzadeh, A. Experimental modeling of segmental shallow tunnels in alluvial affected by normal faults. Tunn. Undergr. Space Technol. 2016, 51, 108–119. [Google Scholar] [CrossRef] [Scilit]
- Cilingir, U.; Madabhushi, S.P.G. Effect of depth on the seismic response of square tunnels. Soils Found. 2011, 51, 449–457. [Google Scholar] [CrossRef] [Scilit]
- Baziar, M.H.; Nabizadeh, A.; Mehrabi, R.; Lee, C.J.; Hung, W.Y. Evaluation of underground tunnel response to reverse fault rupture using numerical approach. Soil Dyn. Earthq. Eng. 2016, 83, 1–17. [Google Scholar] [CrossRef] [Scilit]
- Demirci, H.E.; Bhattacharya, S.; Karamitros, D.; Alexander, N. Experimental and numerical modelling of buried pipelines crossing reverse faults. Soil Dyn. Earthq. Eng. 2018, 114, 198–214. [Google Scholar] [CrossRef] [Scilit]
- Li, H.; Li, X.; Liu, H. Deformation and failure mechanism of metro shield tunnel subjected to buried fault dislocation. Eng. Fail. Anal. 2023, 153, 107551. [Google Scholar] [CrossRef] [Scilit]
- Cai, Q.P.; Peng, J.M.; Ng, C.W.W.; Shi, J.W.; Chen, X.X. Centrifuge and numerical modelling of tunnel intersected by normal fault rupture in sand. Comput. Geotech. 2019, 111, 137–146. [Google Scholar] [CrossRef] [Scilit]
- Wang, Q.; Geng, P.; Li, P.; Wang, T.; Sun, W. Failure analysis and dislocation-resistant design parameters of mining tunnel under normal faulting. Eng. Fail. Anal. 2023, 143, 106902. [Google Scholar] [CrossRef] [Scilit]
- Wang, T.; Geng, P.; Liu, G.; Chen, C.; Gu, W. Performance-based three-level fortification goal and its application in anti-dislocation countermeasures: A case study of Shantou Submarine tunnel. Undergr. Space 2023, 12, 251–270. [Google Scholar] [CrossRef] [Scilit]
- Gao, J.; Wang, Q.; Wang, R.; Yang, J.; Yang, Y. Model test study on the deformation and failure characteristics of mountain tunnel under a strike-slip fault dislocation. Structures 2024, 60, 105903. [Google Scholar] [CrossRef] [Scilit]
- Li, H.; Li, X.; Yang, Y.; Liu, Y.; Ma, M. Structural stress characteristics and joint deformation of shield tunnels crossing active faults. Appl. Sci. 2022, 12, 3229. [Google Scholar] [CrossRef] [Scilit]
- An, S.; Tao, L.J.; Han, X.C.; Zhang, Y. Application of two-level design method on subway tunnel crossing active fault: A case study on Urumqi subway tunnel intersected by reverse fault dislocation. Bull. Eng. Geol. Environ. 2021, 80, 3871–3884. [Google Scholar] [CrossRef] [Scilit]
- Qiao, Y.; Tang, J.; Liu, G.; He, M. Longitudinal mechanical response of tunnels under active normal faulting. Undergr. Space 2022, 7, 662–679. [Google Scholar] [CrossRef] [Scilit]
- Zhang, Y.F.; Yuan, K.; Zhou, W.J.; Fan, J. Study on structural deformation characteristics and surface crack distribution ofgirder tunnel across Lenglongling fault caused by Menyuan earthquake. Chin. J. Rock Mech. Eng. 2023, 42, 1055–1069. [Google Scholar]
- Zhang, W.; Li, M.; Ji, Y.; Li, G.; Zhao, L.; Li, S. Analysis and enlightenment of typical failure characteristics of tunnels caused by the Menyuan M6.9 earthquake in Qinghai Province. China Earthq. Eng. J. 2022, 44, 661–669. [Google Scholar]
- Lee, J.C.; Angelier, J.; Chu, H.T.; Hu, J.C.; Jeng, F.S.; Rau, R.J. Active fault creep variations at Chihshang, Taiwan, revealed by creep meter monitoring, 1998–2001. J. Geophys. Res. Solid Earth 2003, 108, 2528. [Google Scholar] [CrossRef] [Scilit]
- Kawakami, H. Evaluation of deformation of tunnel structure due to Izu-Oshima-Kinkai earthquake of 1978. Earthq. Eng. Struct. Dyn. 1984, 12, 369–383. [Google Scholar] [CrossRef] [Scilit]
- Prentice, C.S.; Ponti, D.J. Coseismic deformation of the Wrights tunnel during the 1906 San Francisco earthquake: A key to understanding 1906 fault slip and 1989 surface ruptures in the southern Santa Cruz Mountains, California. J. Geophys. Res. 1997, 102, 635–648. [Google Scholar] [CrossRef] [Scilit]
- Horikawa, H.; Hirahara, K.; Umeda, Y.; Hashimoto, M.; Kusano, F. Simultaneous inversion of geodetic and strong-motion data for the source process of the Hyogo-ken Nanbu, Japan, Earthquake. J. Phys. Earth 1996, 44, 455–471. [Google Scholar] [CrossRef] [Scilit]
- Tang, J.; He, M.; Bian, H.; Qiao, Y. A novel numerical framework to simulate mechanical response and damage characteristics of mountain tunnels under faulting. Eng. Fail. Anal. 2024, 158, 108030. [Google Scholar] [CrossRef] [Scilit]
- Kafshgarkolaei, H.J.; Lotfollahi-Yaghin, M.A.; Mojtahedi, A. A modified orthonormal polynomial series expansion tailored to thin beams undergoing slamming loads. Ocean Eng. 2019, 182, 38–47. [Google Scholar] [CrossRef] [Scilit]
- Bagheri, M.; Malidarreh, N.R.; Ghaseminejad, V.; Asgari, A. Seismic resilience assessment of RC superstructures on long–short combined piled raft foundations: 3D SSI modeling with pounding effects. Structures 2025, 81, 110176. [Google Scholar] [CrossRef] [Scilit]



Disclaimer/Publisher’s Note: The statements, opinions and data contained in all publications are solely those of the individual author(s) and contributor(s) and not of MDPI and/or the editor(s). MDPI and/or the editor(s) disclaim responsibility for any injury to people or property resulting from any ideas, methods, instructions or products referred to in the content. |
© 2026 by the authors. Licensee MDPI, Basel, Switzerland. This article is an open access article distributed under the terms and conditions of the Creative Commons Attribution (CC BY) license.