


Abstract
The reinforced concrete (RC) Diaojiao frame structure is a widely used building form in the Luding red bed area. A large area of damage occurred in the Luding earthquake in 2022. It is very important to carry out seismic fragility research for damage evaluation and post-earthquake emergency management. Based on the incremental dynamic analysis (IDA), this paper explores the dynamic response law of the structure: the structural damage is distributed in Floor 1 > Floor 2 > Floor 3, and the damage of the C1_1 component is the most serious. Through the quantitative analysis of the structural damage matrix, the probability of structural damage under frequent earthquakes of 7 degrees and 8 degrees can be ignored. The probability of severe damage (SD) of Floor 1, Floor 2, Floor 3 and the building under maximum considered earthquakes of 9 degrees is 58.25%, 53.03%, 2.71% and 36.79%, respectively. In this paper, PGA is used as an index to divide the damage state into four categories: elastic state, elastic-plastic state, plastic state and large deformation state. Based on the actual earthquake PGA, the structural damage can be determined quickly and accurately, which provides scientific support for the formulation of emergency measures.
1. Introduction
China is an earthquake-prone country. Since 2008, there have been many earthquake events that have caused a large number of casualties in China, including the Wenchuan earthquake, the Yushu earthquake, the Lushan earthquake, the Ludian earthquake, the Jiuzhaigou earthquake, the Maduo earthquake, the Luding earthquake, and the Jishishan earthquake. According to the relevant statistical results, it is found that the casualties caused by the above earthquakes are mainly attributed to secondary disasters such as building collapse [1]. Therefore, many scholars have carried out a lot of research on seismic performance of different building structures, such as frame structure [2,3], shear wall structure [4,5], frame-shear wall structure [6,7], tube structure [8,9], truss structure [10,11], slab-column structure [12] and so on. At the same time, with the in-depth implementation of disaster prevention and mitigation policies, the seismic fragility analysis of building structures has also received extensive attention [13].
Seismic fragility assessment of building structures is the probabilistic and quantitative expression of seismic performance of structures, and it is the core engineering technology link connecting earthquake science and social disaster reduction decision-making. It mainly studies the conditional probability that the structure reaches or exceeds a certain damage state (such as slight damage, serious damage, collapse) under earthquakes of different intensities. Cui [14] proposed a freeze–thaw damage deterioration model for C30 concrete, and developed a seismic fragility analysis framework for aging reinforced concrete columns considering the impact of freeze–thaw damage. Wang [15] proposed a deep learning-assisted seismic fragility analysis method to improve computational efficiency. Wu [16] used the incremental dynamic analysis method to analyze the seismic fragility of cable trays, and generated the seismic fragility curves of two typical cable trays. Xu [17] proposed a fuzzy seismic fragility analysis method for underground structures considering multiple failure criteria by combining fuzzy random theory and Copula theory. Jin [18] proposed an innovative seismic fragility analysis method for engineering structures by combining the traditional Cloud analysis method and the Bayesian framework, which improved the accuracy of seismic fragility analysis. Yan [19] proposed a hierarchical uncertainty quantification (UQ) framework based on simulation-based seismic fragility assessment, and verified its practicability and reliability through a three-span reinforced concrete continuous girder bridge. Yan [20] proposed a new design of double concrete-filled steel tubular column-RC beam joints with self-centering and friction energy dissipation and studied the seismic fragility, which provides a reference for seismic design and application. Zhang [21] studied the seismic performance of a double-tower structure large podium (DTS) based on the IDA seismic fragility analysis method, which provides a theoretical basis for pre-earthquake disaster prevention and post-earthquake damage assessment of DTSs. Jin [22] developed a MATLAB script for the seismic fragility analysis method based on a Bayesian logistic regression model, and obtained the seismic fragility curve of nuclear containment structures. Zhang [23] studied the seismic fragility of masonry structures considering the influence of aftershocks, and found that the number of stories had the greatest influence on the seismic fragility of masonry structures. In order to solve the problem of selecting the best seismic intensity measurement (IM), Wang [24] proposed a new method for generating seismic fragility curves based on recurrence period by using probabilistic seismic hazard analysis (PSHA). Ruggieri [25] proposed a multi-dimensional discrete sampling method to derive a framework for seismic fragility and direct economic losses in reinforced concrete building areas.
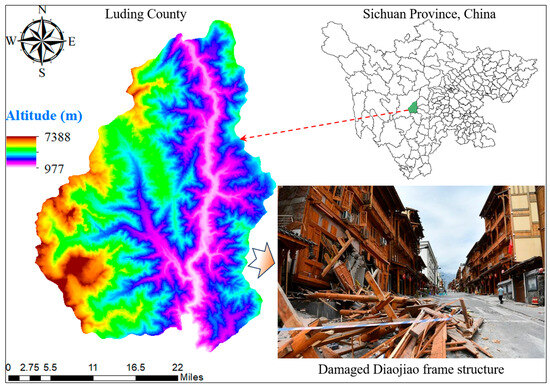
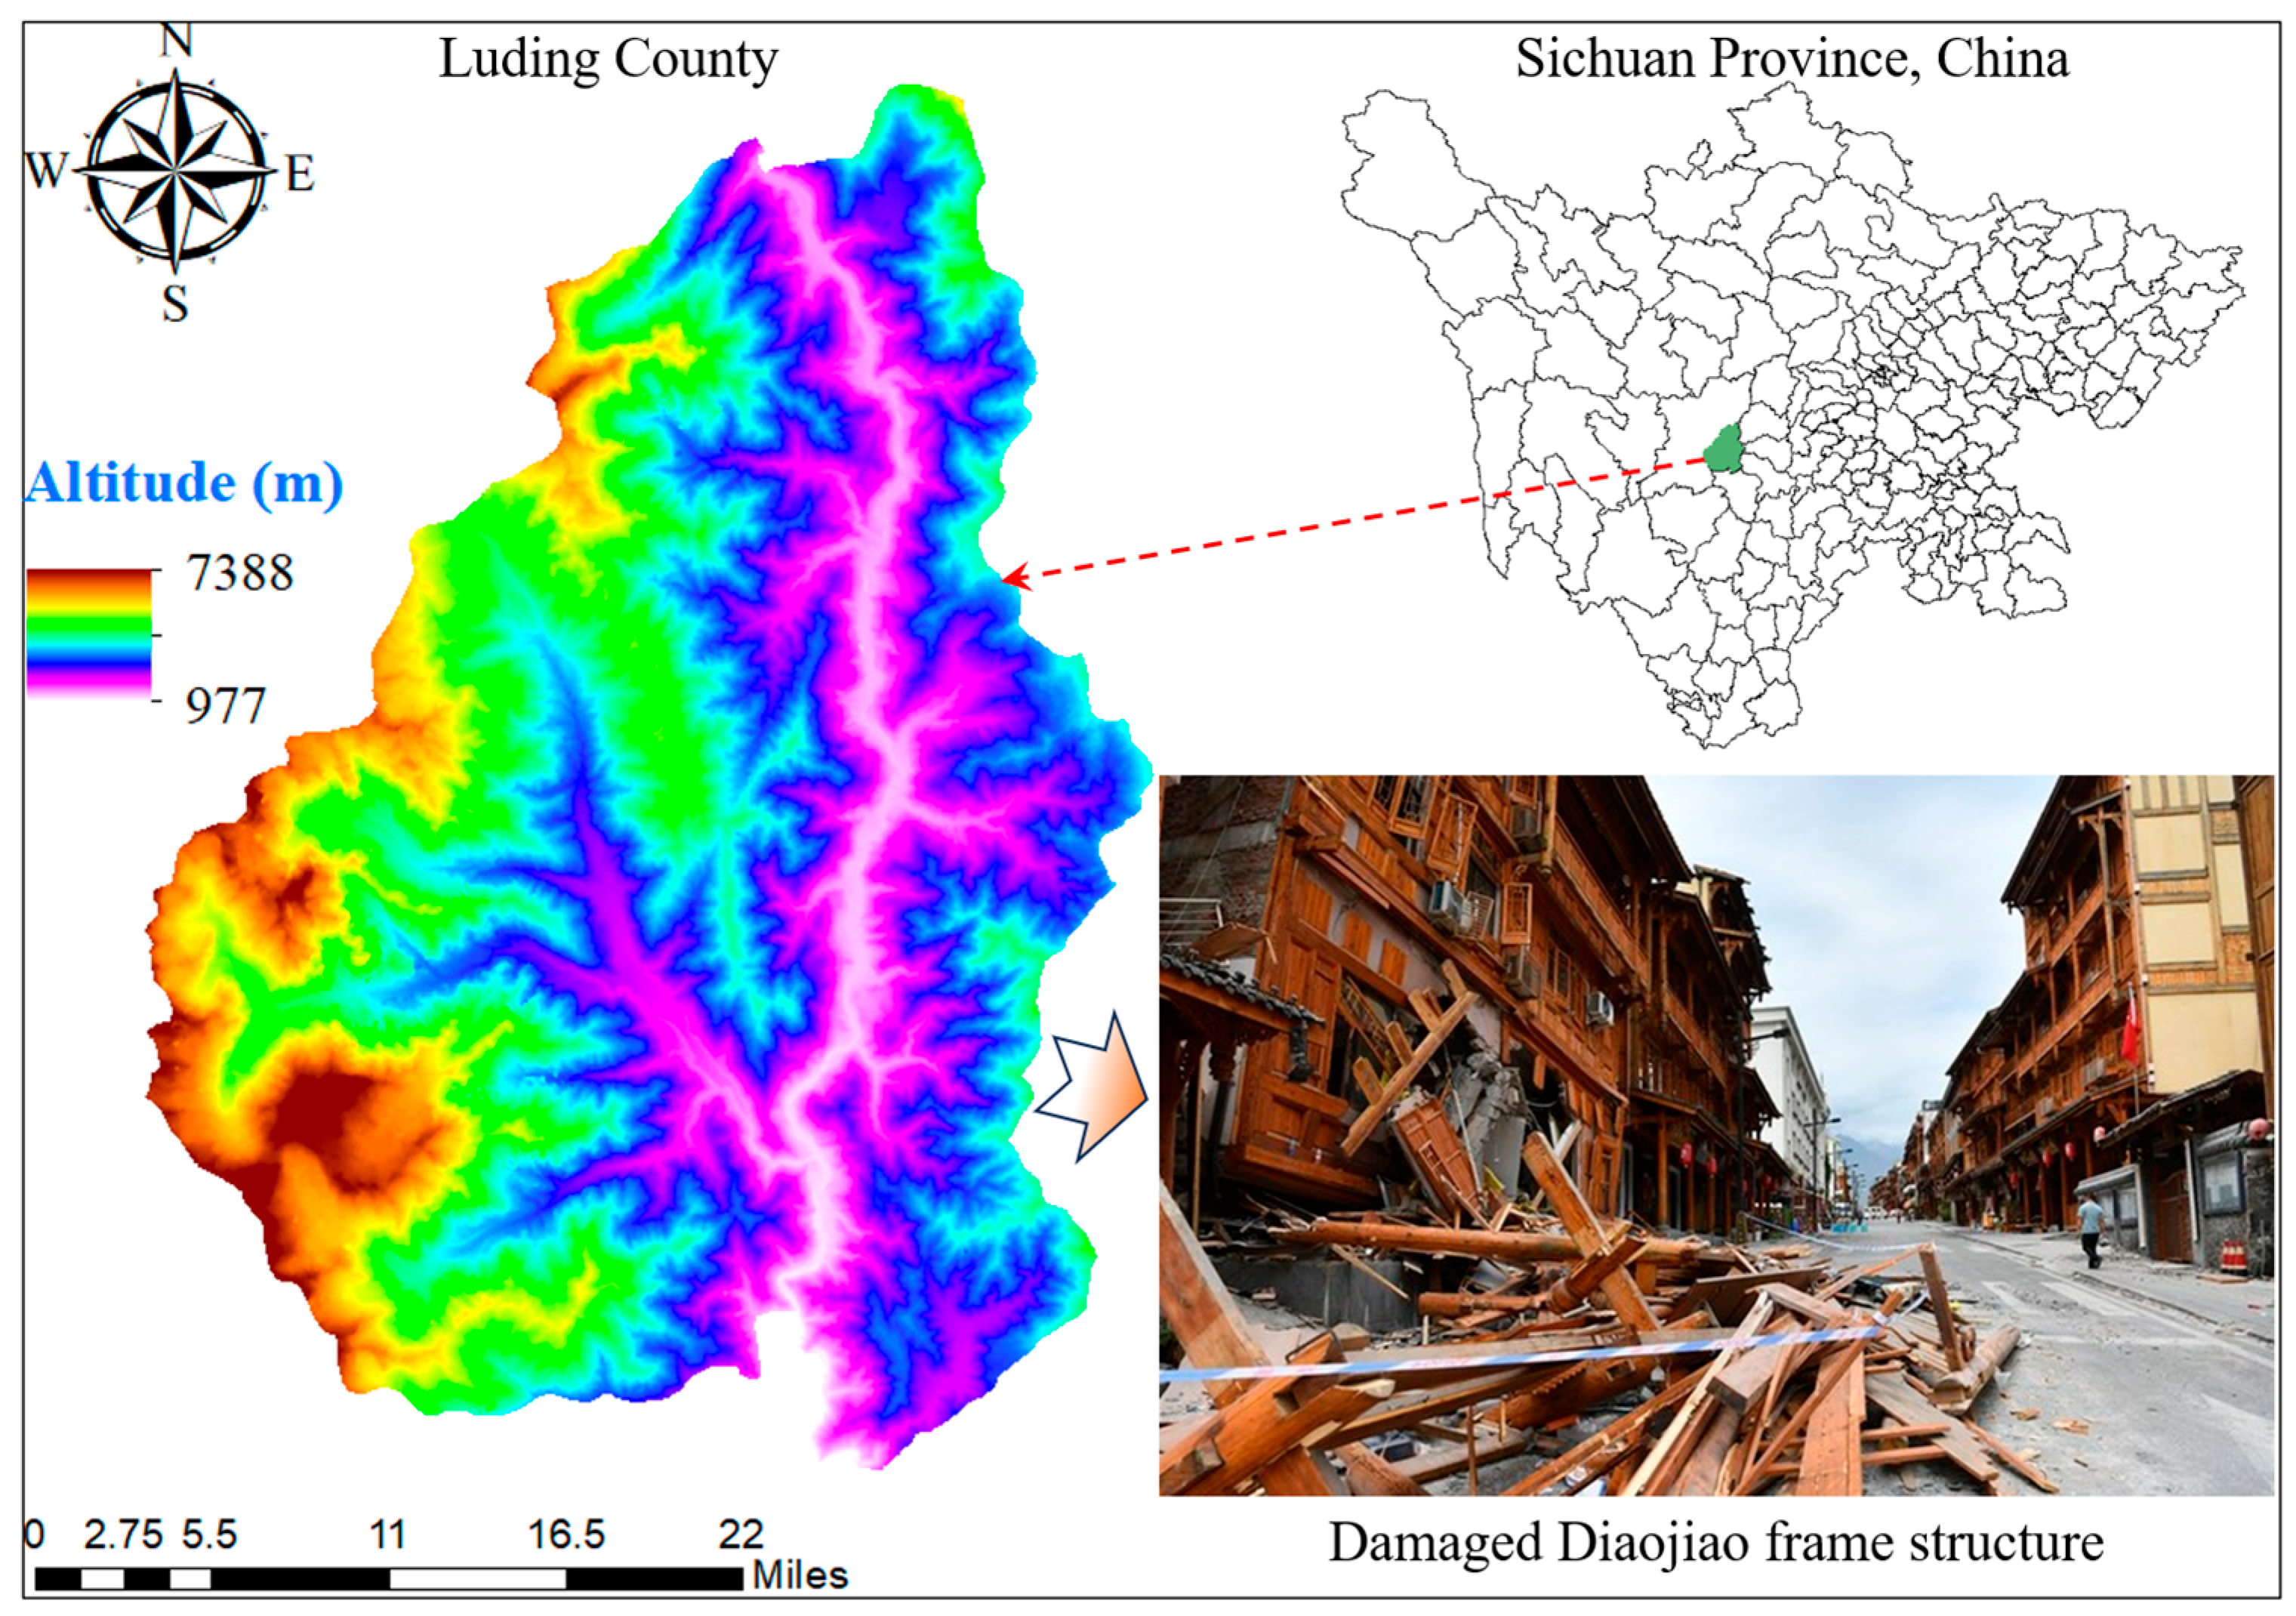
In summary, many scholars have carried out a lot of research on the seismic fragility of different structures. However, it is mainly based on middle and high-rise buildings, commercial buildings and public buildings in cities, and rarely involves rural self-built houses in mountainous areas. In the 2022 Sichuan Luding earthquake, damage occurred in a large area of rural self-built houses dominated by RC Diaojiao frame structures (see Figure 1). This brought serious casualties and property losses to the local people. Compared with the traditional RC frame structure, the remarkable feature of the RC Diaojiao frame structure is that the bottom vertical members are discontinuous and form a large local overhead space, which belongs to a typical vertical stiffness non-uniform structure. There are essential differences between the two in stiffness distribution, weak layer characteristics, damage evolution law and seismic control focus, which are also the structural forms that need to be focused on in the seismic research of slope buildings in mountainous areas. Therefore, it is very important to carry out the seismic fragility analysis of the RC Diaojiao frame structure. The red bed is widely distributed in Luding County and is one of the main foundations [26], which has a great influence on the transmission of seismic waves. Therefore, this paper takes the red sandstone of Luding County as the foundation, and carries out the mechanical response research and seismic fragility analysis of the RC Diaojiao frame structure under the influence of ground motion.
Figure 1.
Research area and post-earthquake site.
2. Overview of the Test
2.1. Mechanical Test of Red Sandstone
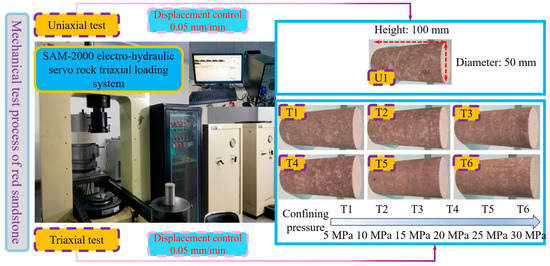
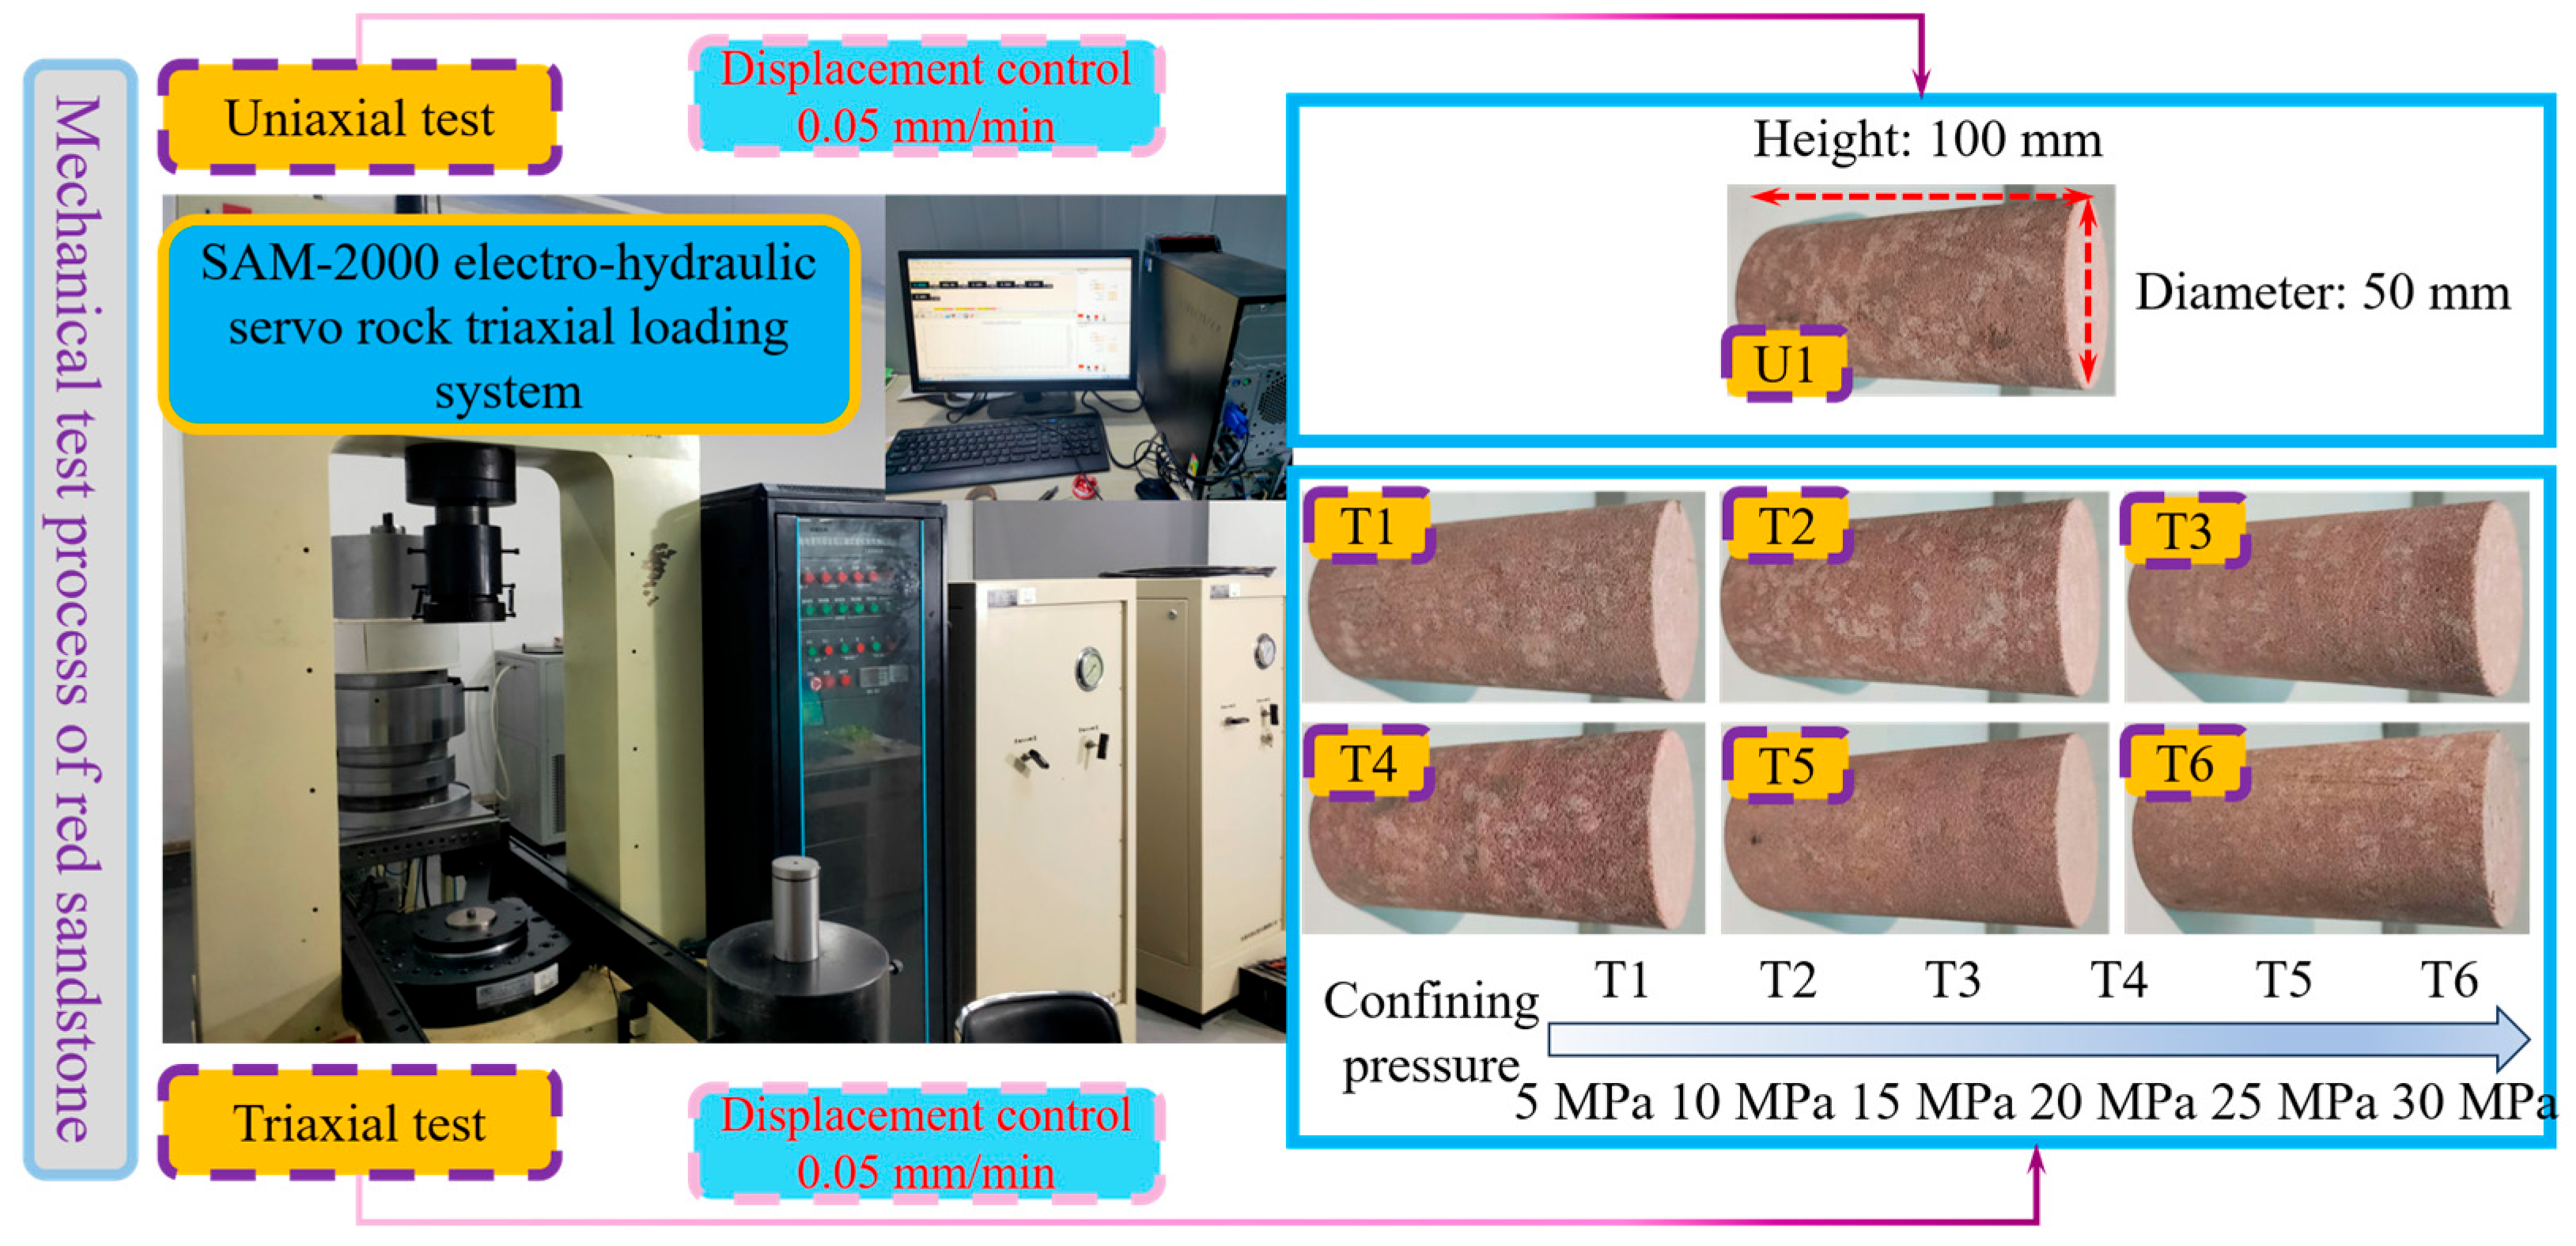
In this paper, the red sandstone in the red bed area of Luding County, Sichuan Province, China is used as the foundation, and the physical and mechanical properties of the red sandstone are explored. In order to reduce the difference between the samples, all the test samples were drilled from the same core. The processing of the test samples conforms to the production standards stipulated by the International Society of Rock Mechanics [27]. The sample size is a 50 mm × 100 mm cylinder. The compression test equipment adopts the SAM-2000 electro-hydraulic servo rock triaxial loading system (productive year, 2018; manufacturer, Kexin; Changchun City, China). The loading method of the test is displacement control, and the loading rate is 0.05 mm/min. The specific test method is shown in Figure 2.
Figure 2.
Mechanical test method of red sandstone.
2.2. Analysis of Mechanical Test Results of Red Sandstone
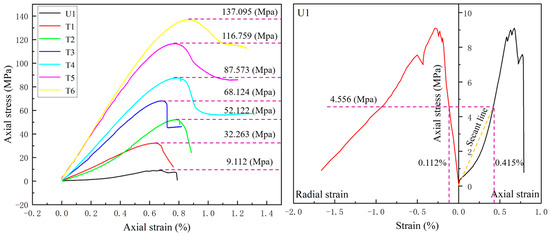
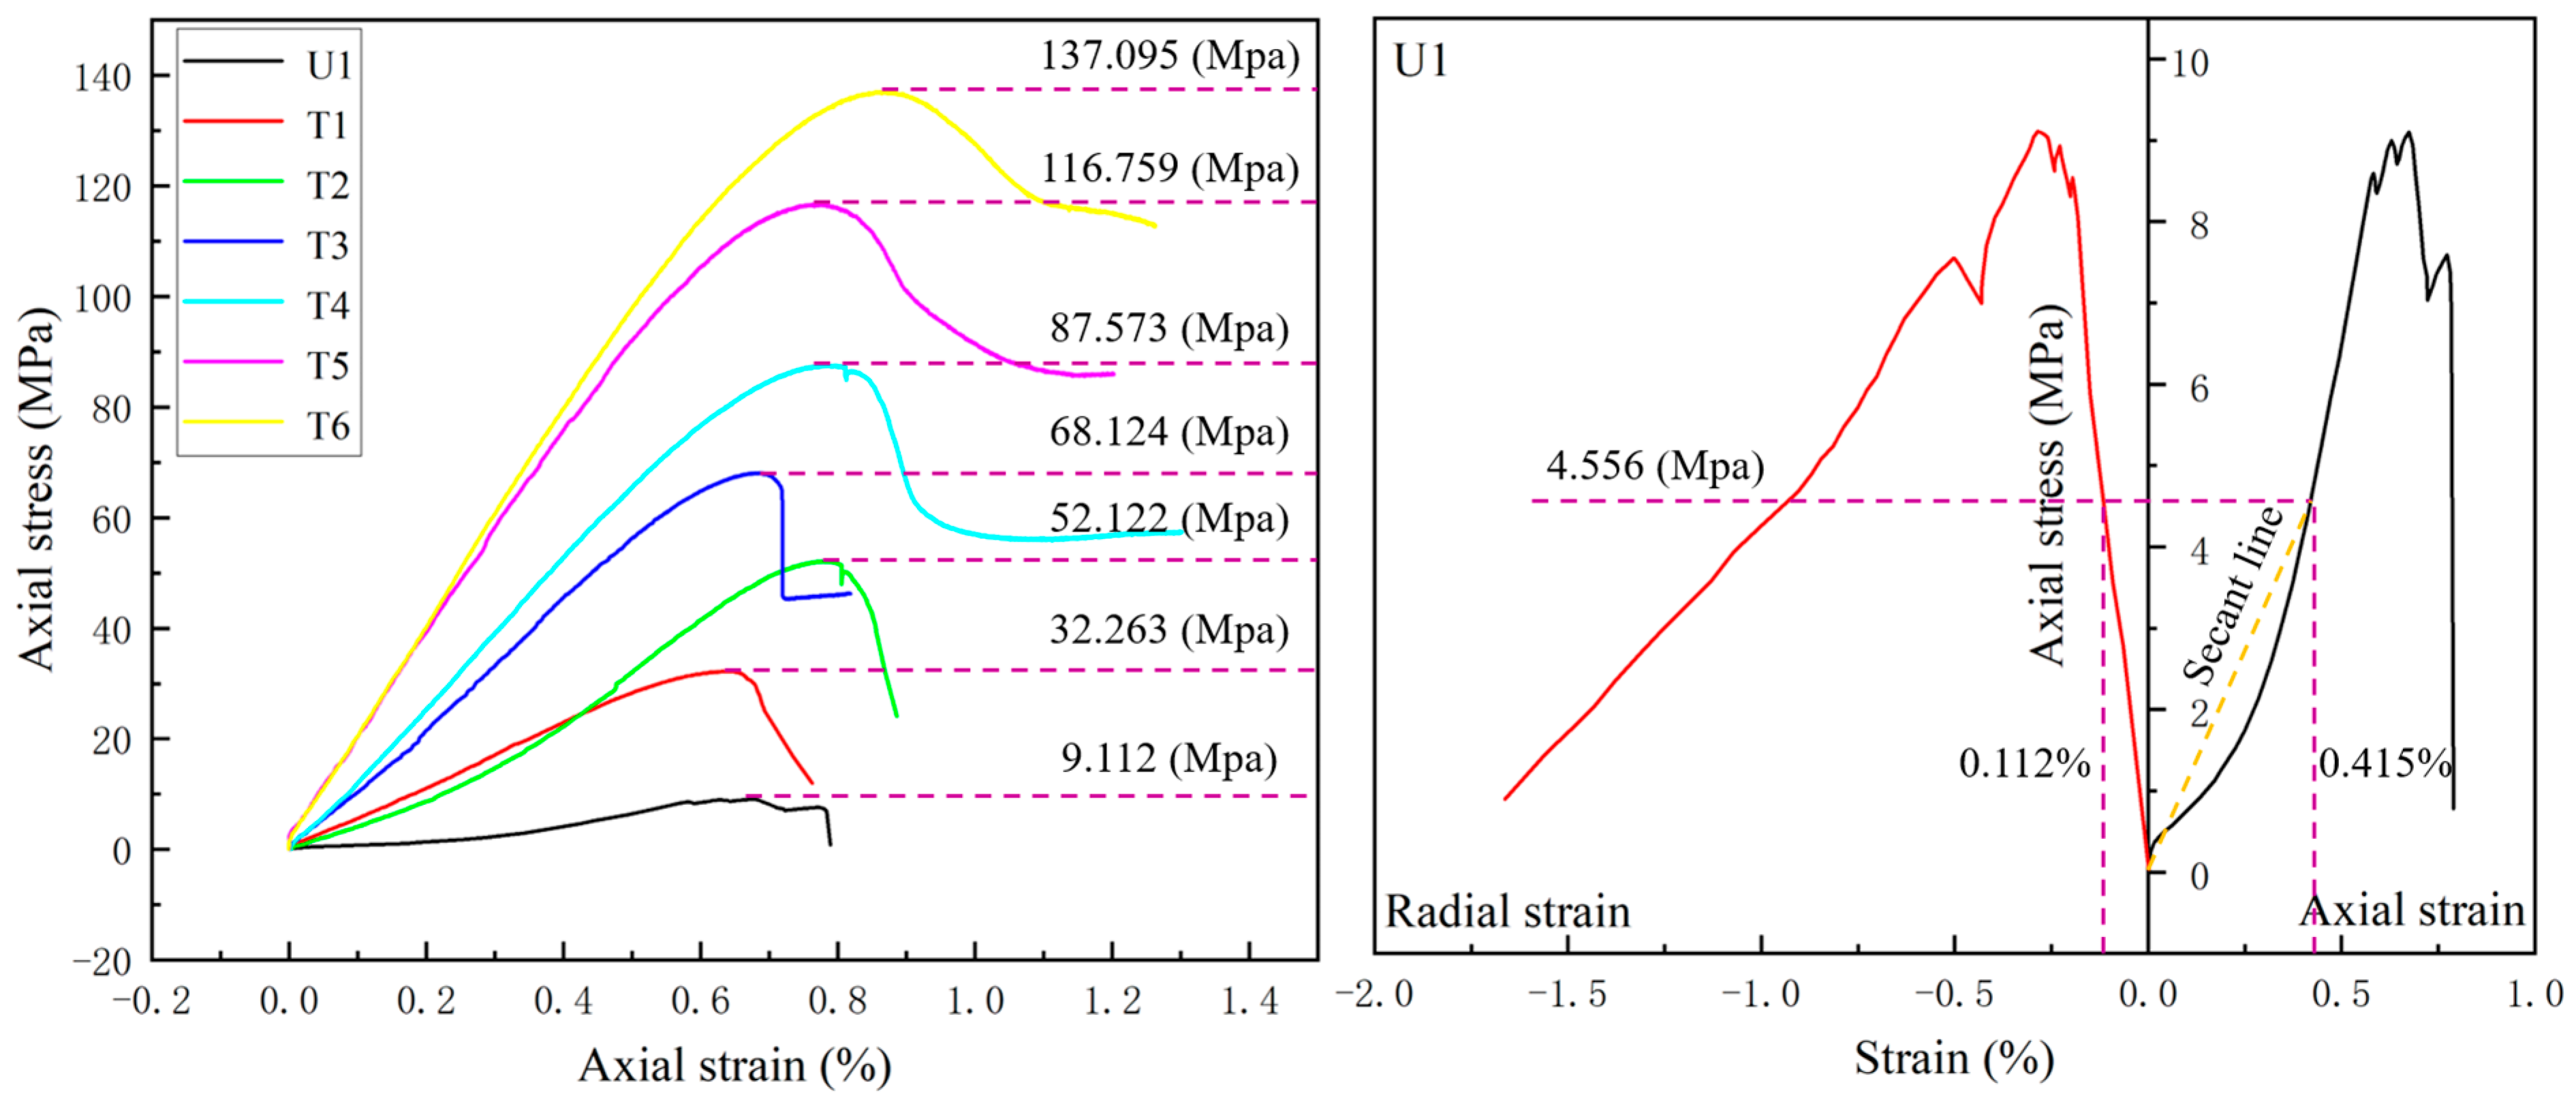
The mechanical test results obtained by the above test method are shown in Figure 3.
Figure 3.
Conventional single-triaxial compression test results.
Based on the above test results, the elastic modulus () of red sandstone in this paper is calculated by the secant method. The calculation methods of elastic modulus and Poisson’s ratio () are as follows:
In the formula, is elastic modulus; is Poisson‘s ratio; is the uniaxial compressive strength of 50%; is the axial strain when the stress is ; is the radial strain when the stress is .
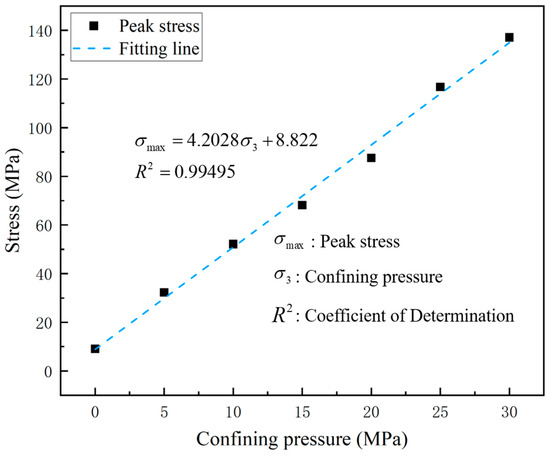
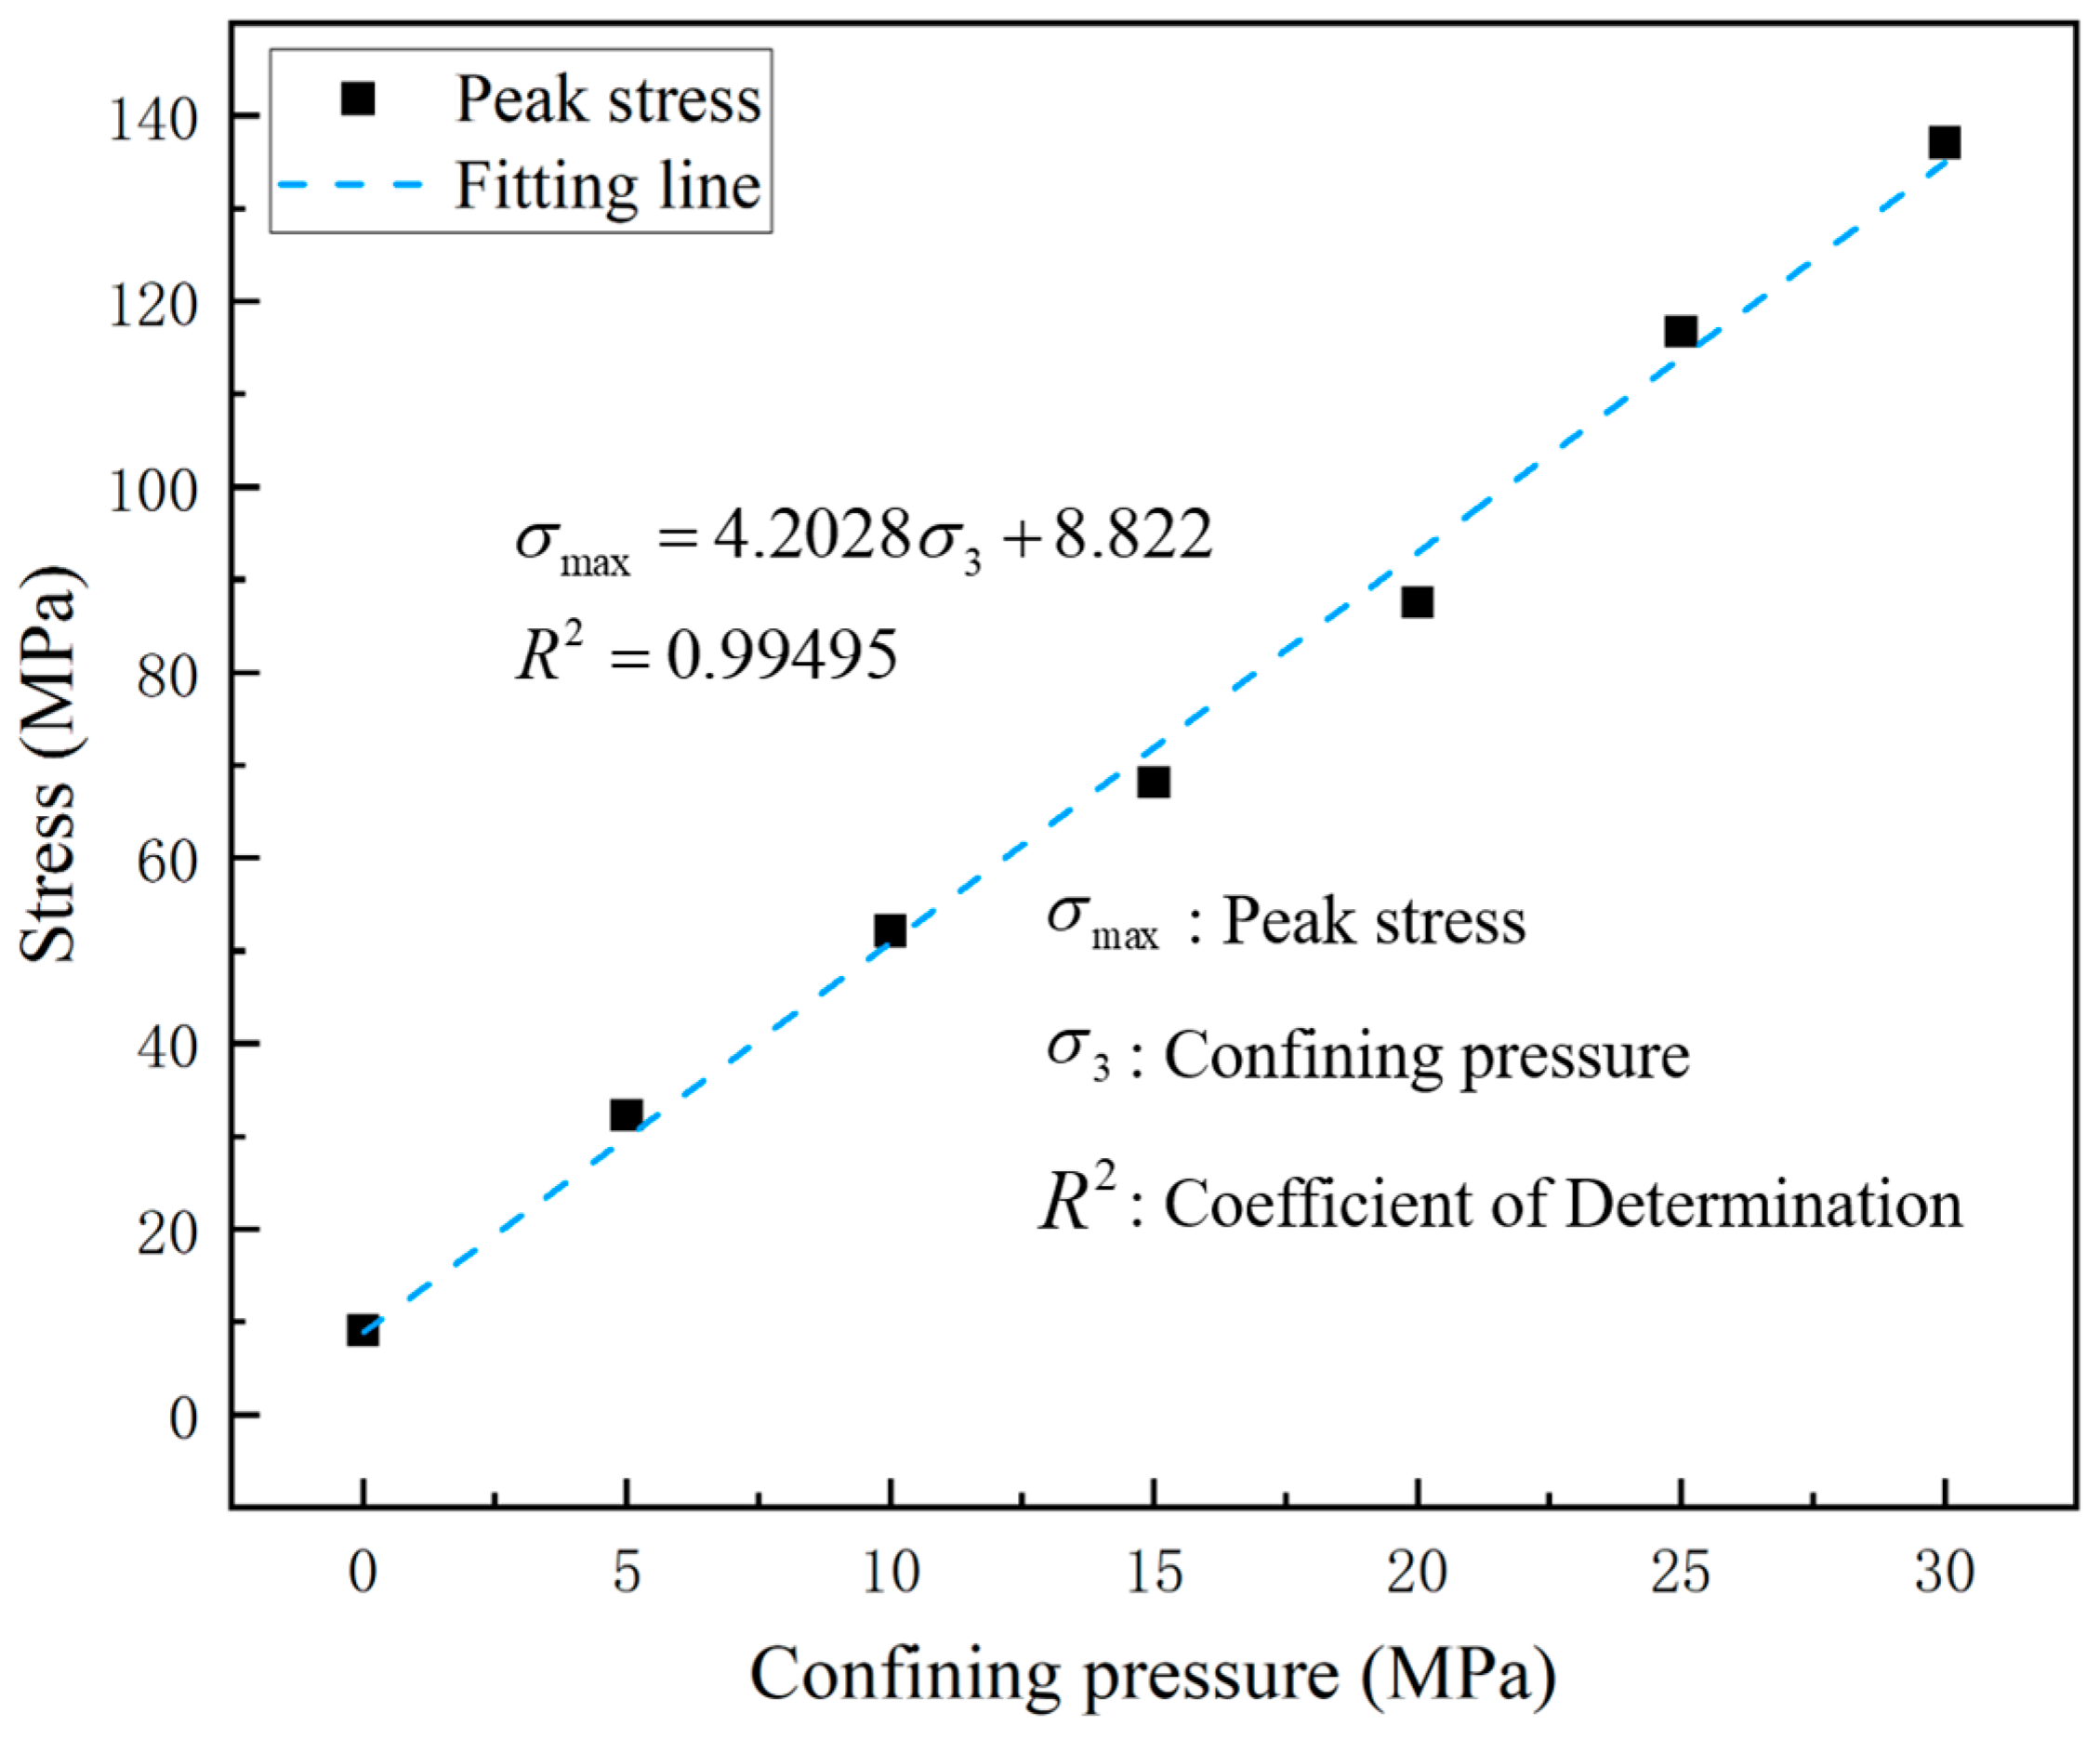
Based on the Mohr–Coulomb strength criterion, it is known that the maximum principal stress () and confining pressure () have the following linear relationship:
According to the expression (3), the expression of internal friction angle () and cohesion () of red sandstone can be obtained as follows:
Based on the above test results, the linear relationship between red sandstone and is obtained. The fitting results are shown in Figure 4.
Figure 4.
Fitting result.
It can be seen from Figure 4 that , . Bring the above results into expressions (4) and expressions (5), and calculate , . Therefore, the physical and mechanical parameters of red sandstone in this paper are shown in Table 1.
Table 1.
Physical and mechanical parameters of red sandstone.
2.3. Calculation Model and Parameters
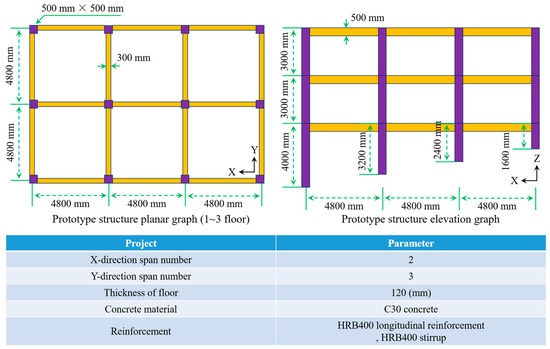
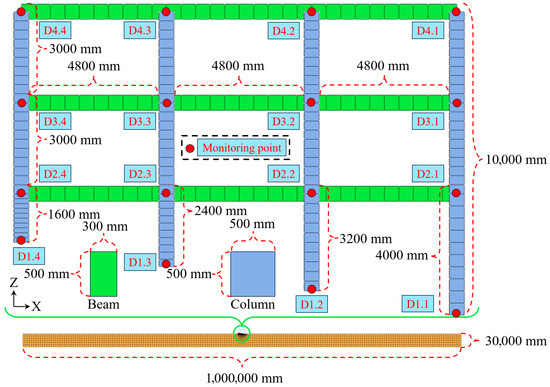
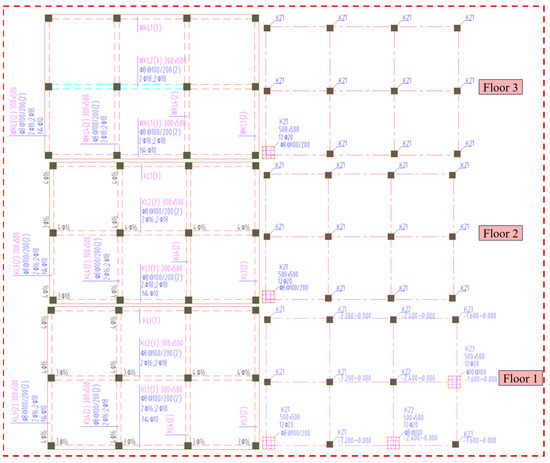
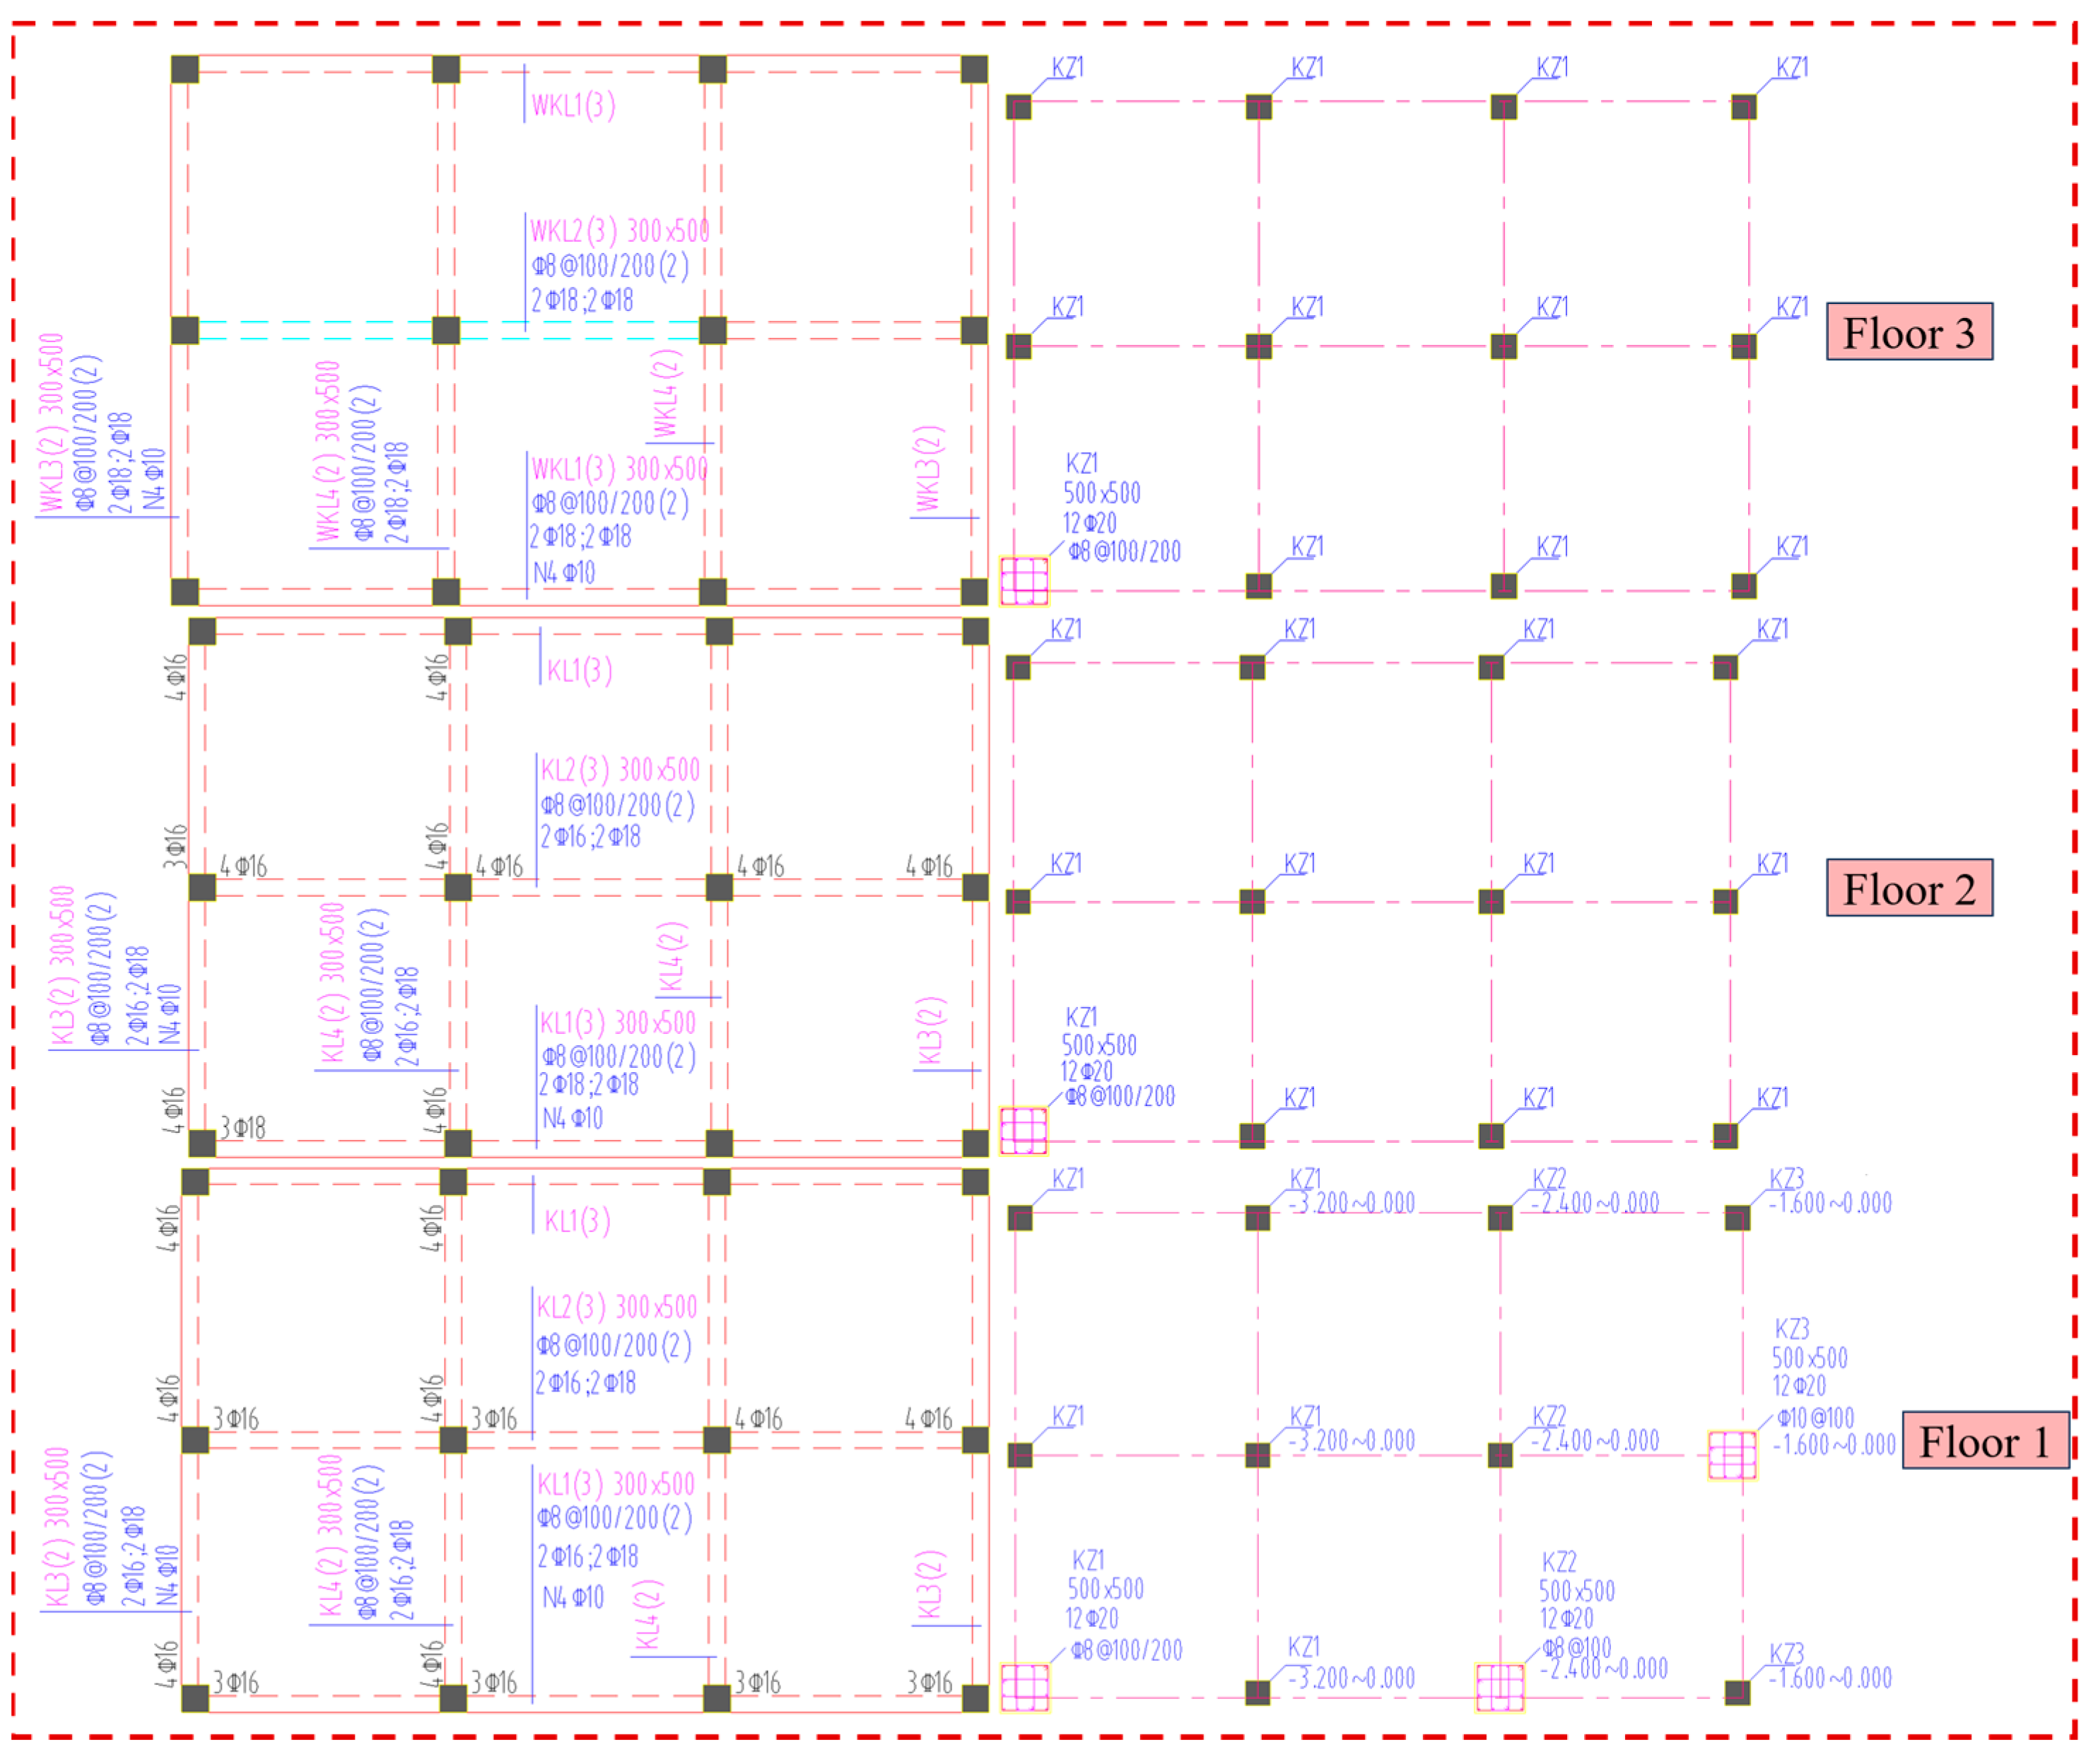
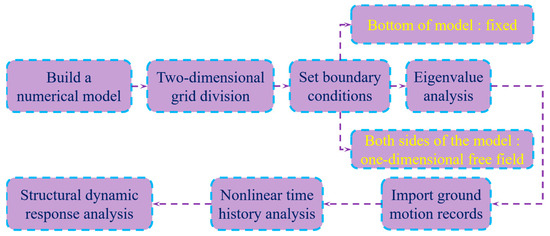
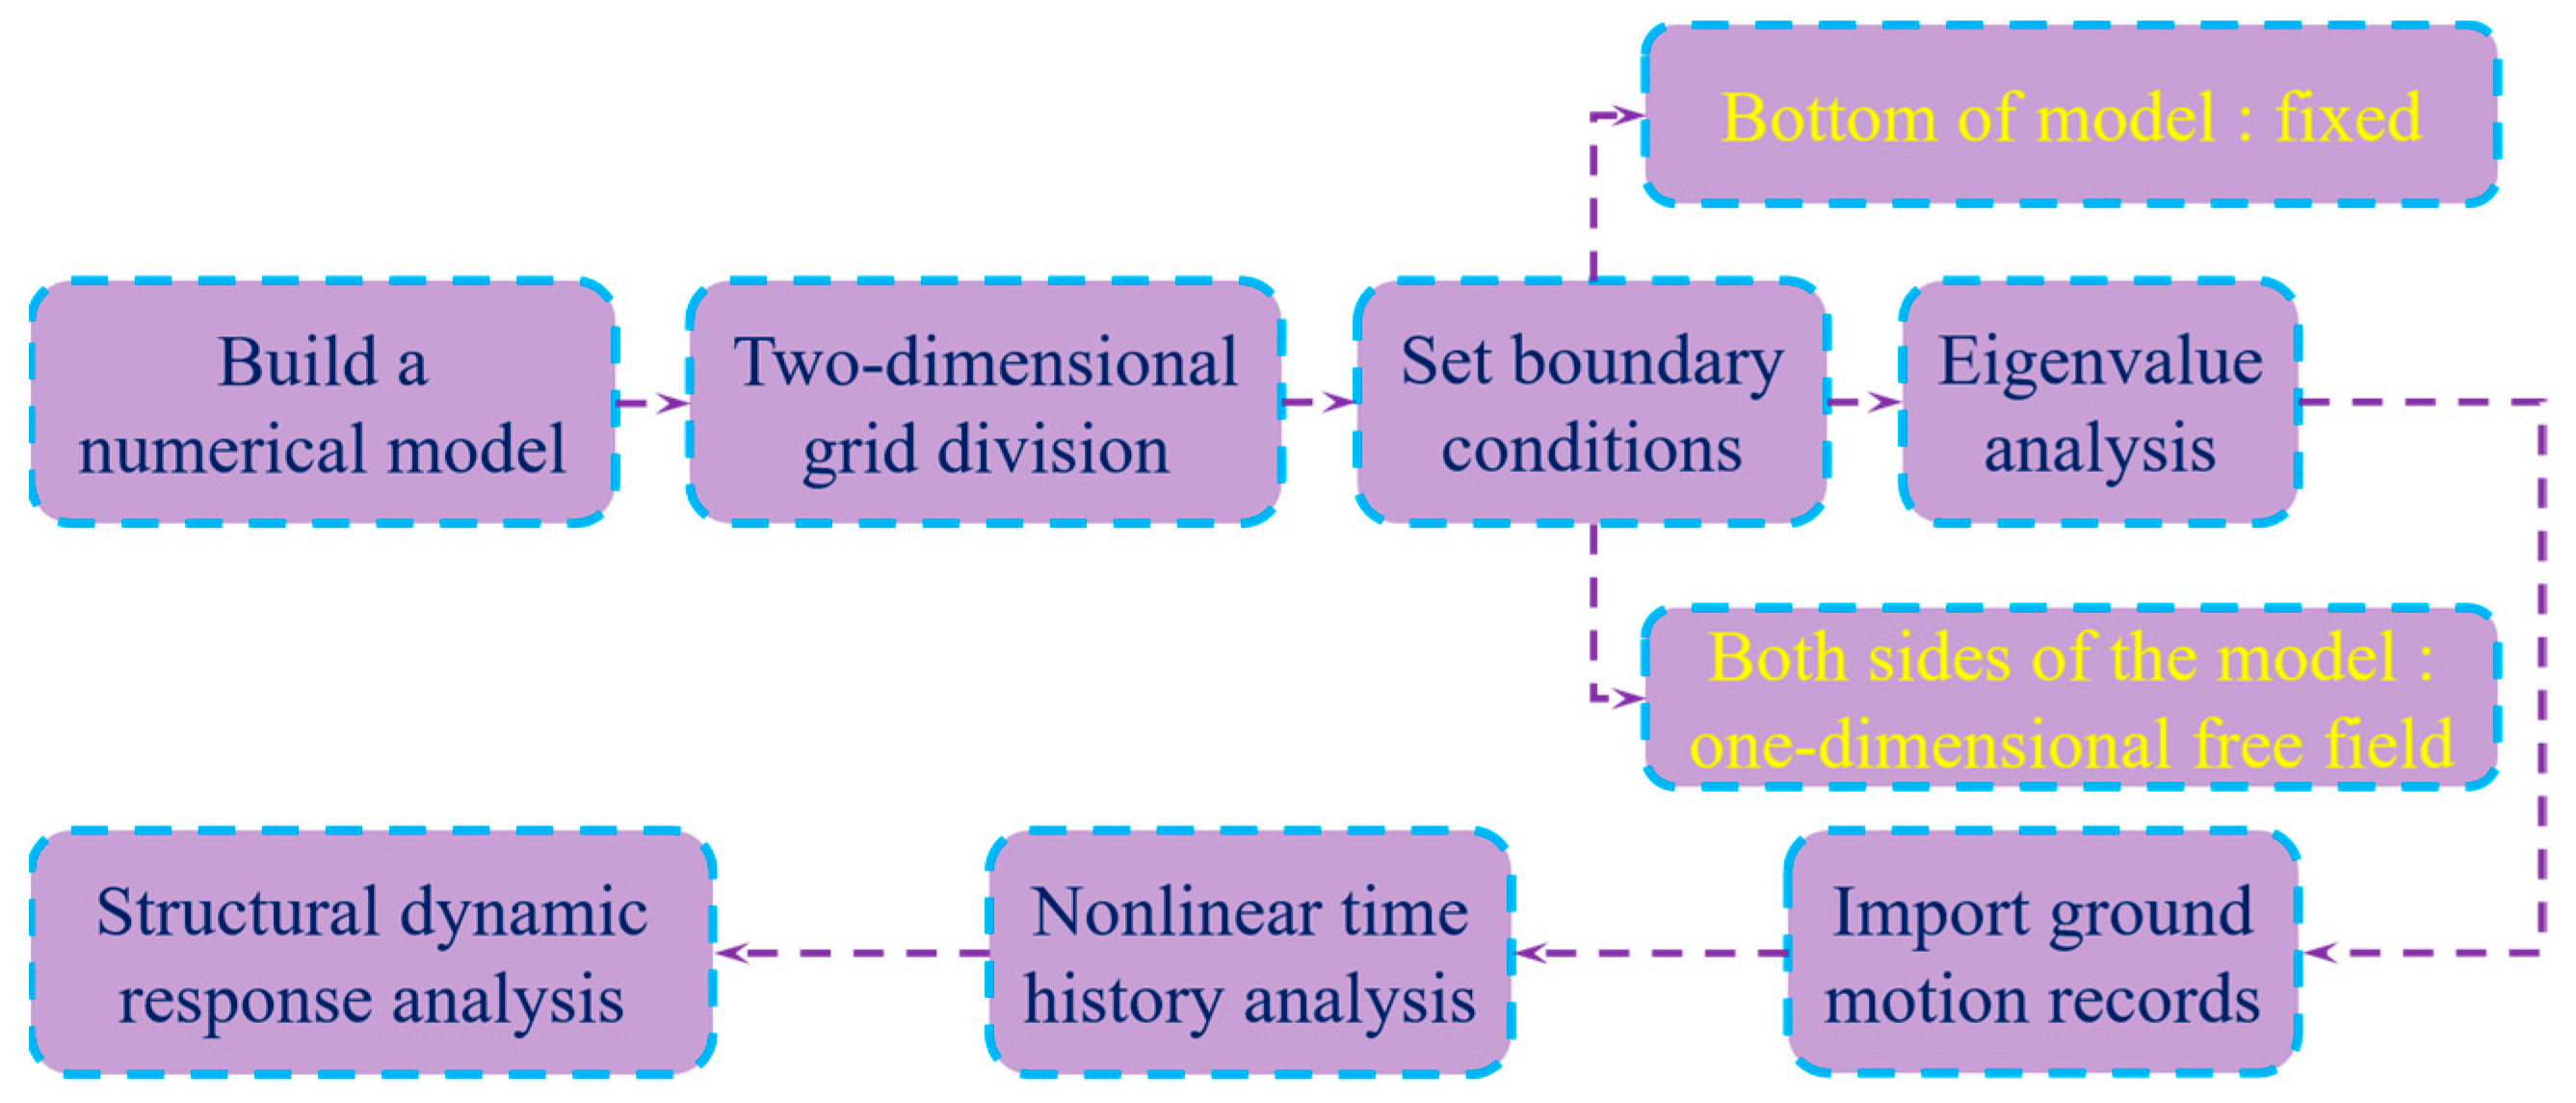
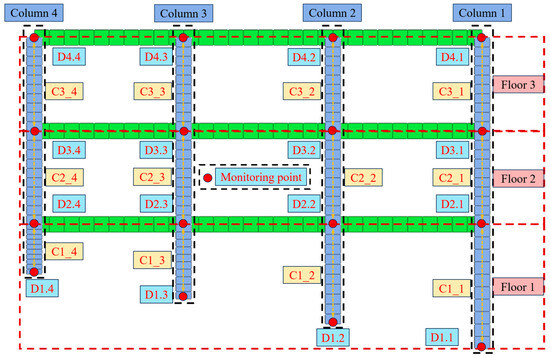
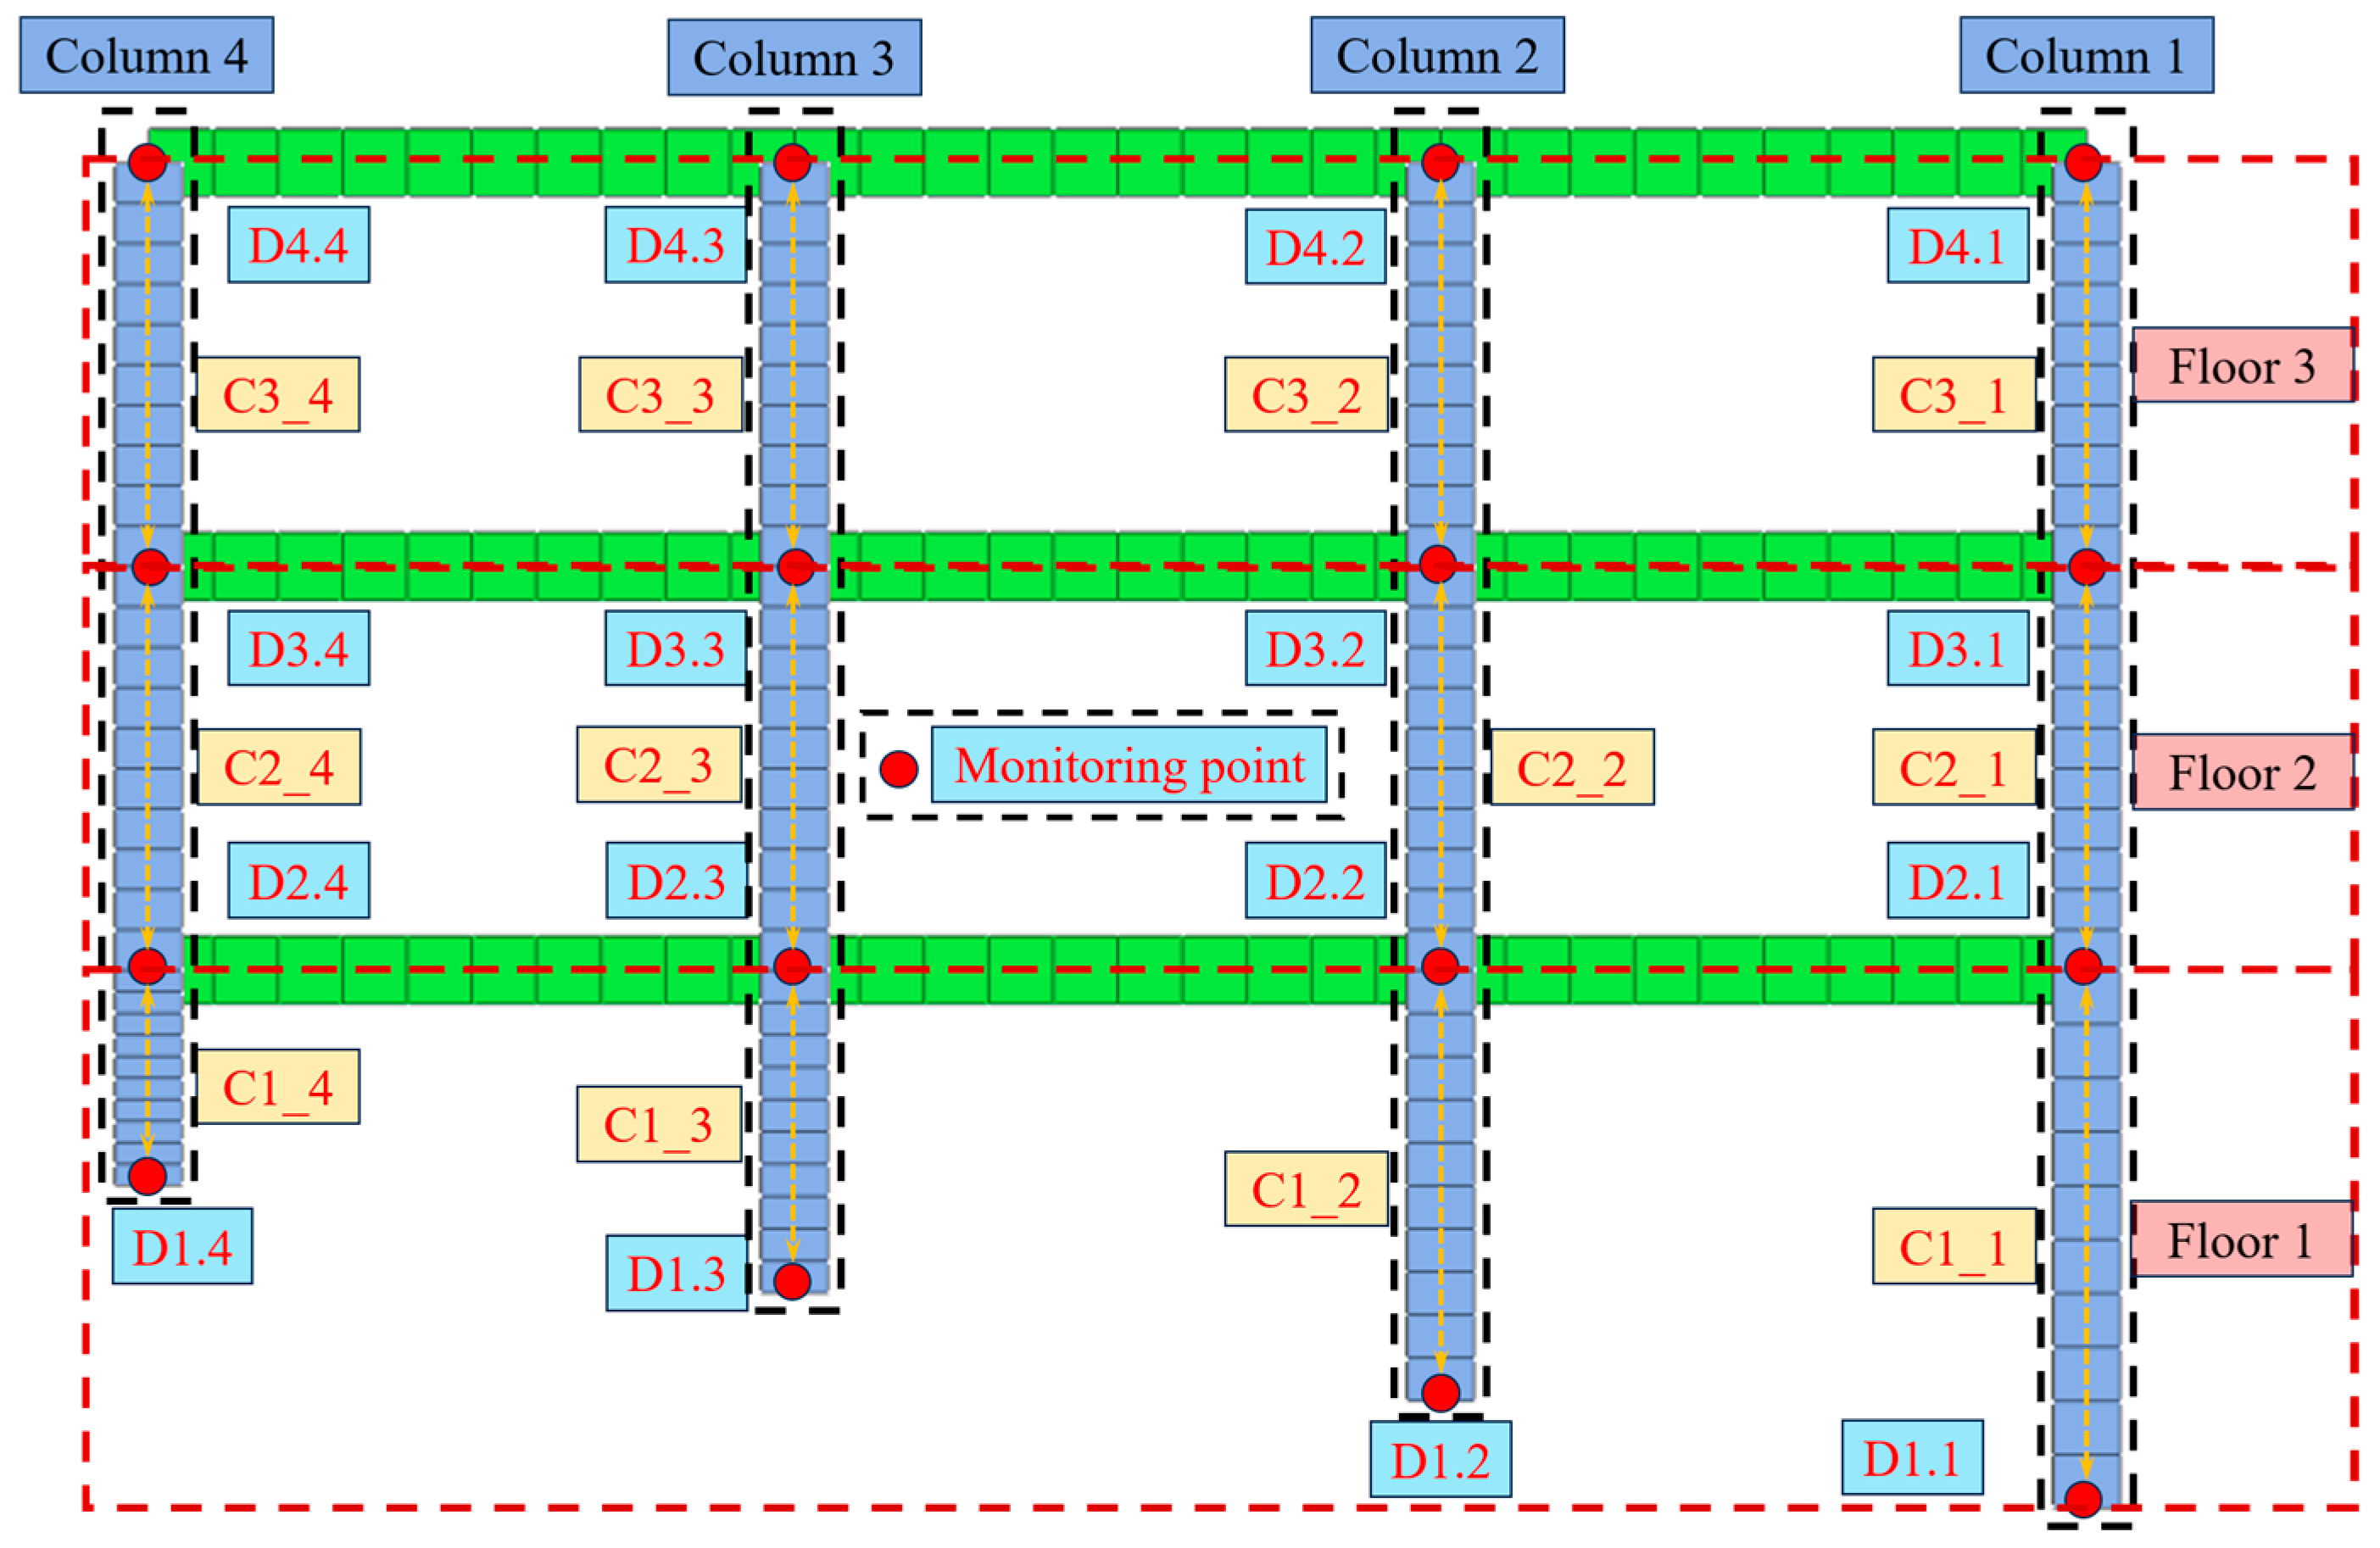
According to the requirements of ‘Code for design of concrete structures’ [28], ‘Technical specification for concrete structures of tall building’ [29], ‘Code for seismic design of buildings’ [30] and the actual construction of the RC Diaojiao frame structure, the design of the RC Diaojiao frame structure is carried out (see Figure 5). The seismic fortification intensity of the project is 7 degrees, the site category is Class II, the seismic grade of the structure is Grade II, the characteristic period is 0.4 s, and the period reduction coefficient is 0.8. Due to the regular symmetry of the structural plane, in order to improve the computational efficiency, this paper studies the dynamic response of the Diaojiao frame structure by constructing a two-dimensional finite element model of the Diaojiao frame structure-bedrock system (see Figure 6). At the same time, it is assumed that the connection between the column and the red sandstone is a fixed connection. The node displacement of the Diaojiao frame structure was monitored, and the monitoring points were D1.1, D2.1, D3.1, D4.1, D1.2, D2.2, D3.2, D4.2, D1.3, D2.3, D3.3, D4.3, D1.4, D2.4, D3.4, D4.4 (see Figure 6). The model is 1000 m long and 40 m wide. The design strength of structural concrete is C30, and HRB400 is used for longitudinal reinforcement and stirrup (see Figure 5). The reinforcement of the beam and column is shown in Figure 7. The parameters of concrete and reinforcement refer to ‘Code for design of concrete structures’ (GB 50010-2010) [28]. In this paper, the dynamic response calculation of the Diaojiao frame structure is carried out by Midas GTS finite element calculation. In the numerical calculation, the setting of the boundary conditions is shown in Figure 8 [30]. In the finite element calculation, the structural member adopts the concrete plastic damage model (CDP) [31,32,33], and the bedrock adopts the Mohr–Coulomb calculation model. The elastic modulus of the structural member adopts the equivalent elastic modulus. The calculation method of the equivalent elastic modulus of the axially loaded member () and the equivalent elastic modulus of the flexural member () is shown below [34].
Figure 5.
RC Diaojiao frame structure (Three-dimensional).
Figure 6.
Two-dimensional finite element model.
Figure 7.
Beam-column reinforcement diagram (Φ: Diameter of reinforcement (mm); @: Stirrup spacing (mm)).
Figure 8.
Numerical calculation process.
The calculation expression of the equivalent elastic modulus of the axially loaded member () is:
In the formula, is the equivalent elastic modulus of the axially loaded member; is the elastic modulus of concrete; is the elastic modulus of reinforcement; is the reinforcement ratio of the section.
The calculation expression of the equivalent elastic modulus of the flexural member () is:
In the formula, is the equivalent elastic modulus of the flexural member; is the elastic modulus of concrete; is the length of rectangular section; is the ratio of the elastic modulus of steel bar and concrete, namely ; is the longitudinal reinforcement ratio of the most edge of the tensile zone; is the longitudinal reinforcement ratio of the most edge of the compression zone; is the reinforcement ratio of the remaining uniformly distributed reinforcement; is the section reinforcement ratio; is the length of the rectangular cross section; is the thickness of concrete cover in the compression zone.
2.4. Ground Motion Selection and Index Determination
The ground motion is sudden and random, and the building structure has different dynamic responses under different ground motions. The research shows that 10 to 20 ground motions can fully evaluate the seismic response of the structure when carrying out seismic fragility analysis [35]. Therefore, this paper selects 20 ground motions from PEER (Pacific Earthquake Engineering Research Center) to carry out seismic fragility analysis of Diaojiao frame structures (see Table 2) [36]. Each selected seismic wave was amplitude-modulated for 13 times, and the PGA after amplitude modulation was 0.05 g, 0.1 g, 0.2 g, 0.3 g, 0.4 g, 0.6 g, 0.8 g, 1.0 g, 1.2 g, 1.4 g, 1.6 g, 1.8 g, 2.0 g, respectively [37]. Therefore, this paper completed a total of 260 cases of RC Diaojiao frame structure seismic response calculation.
Table 2.
Ground motion records.
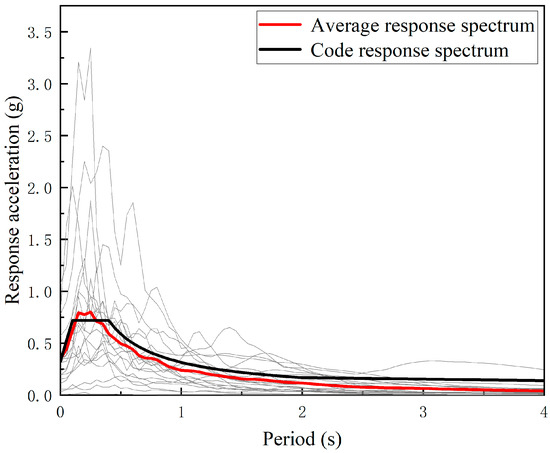
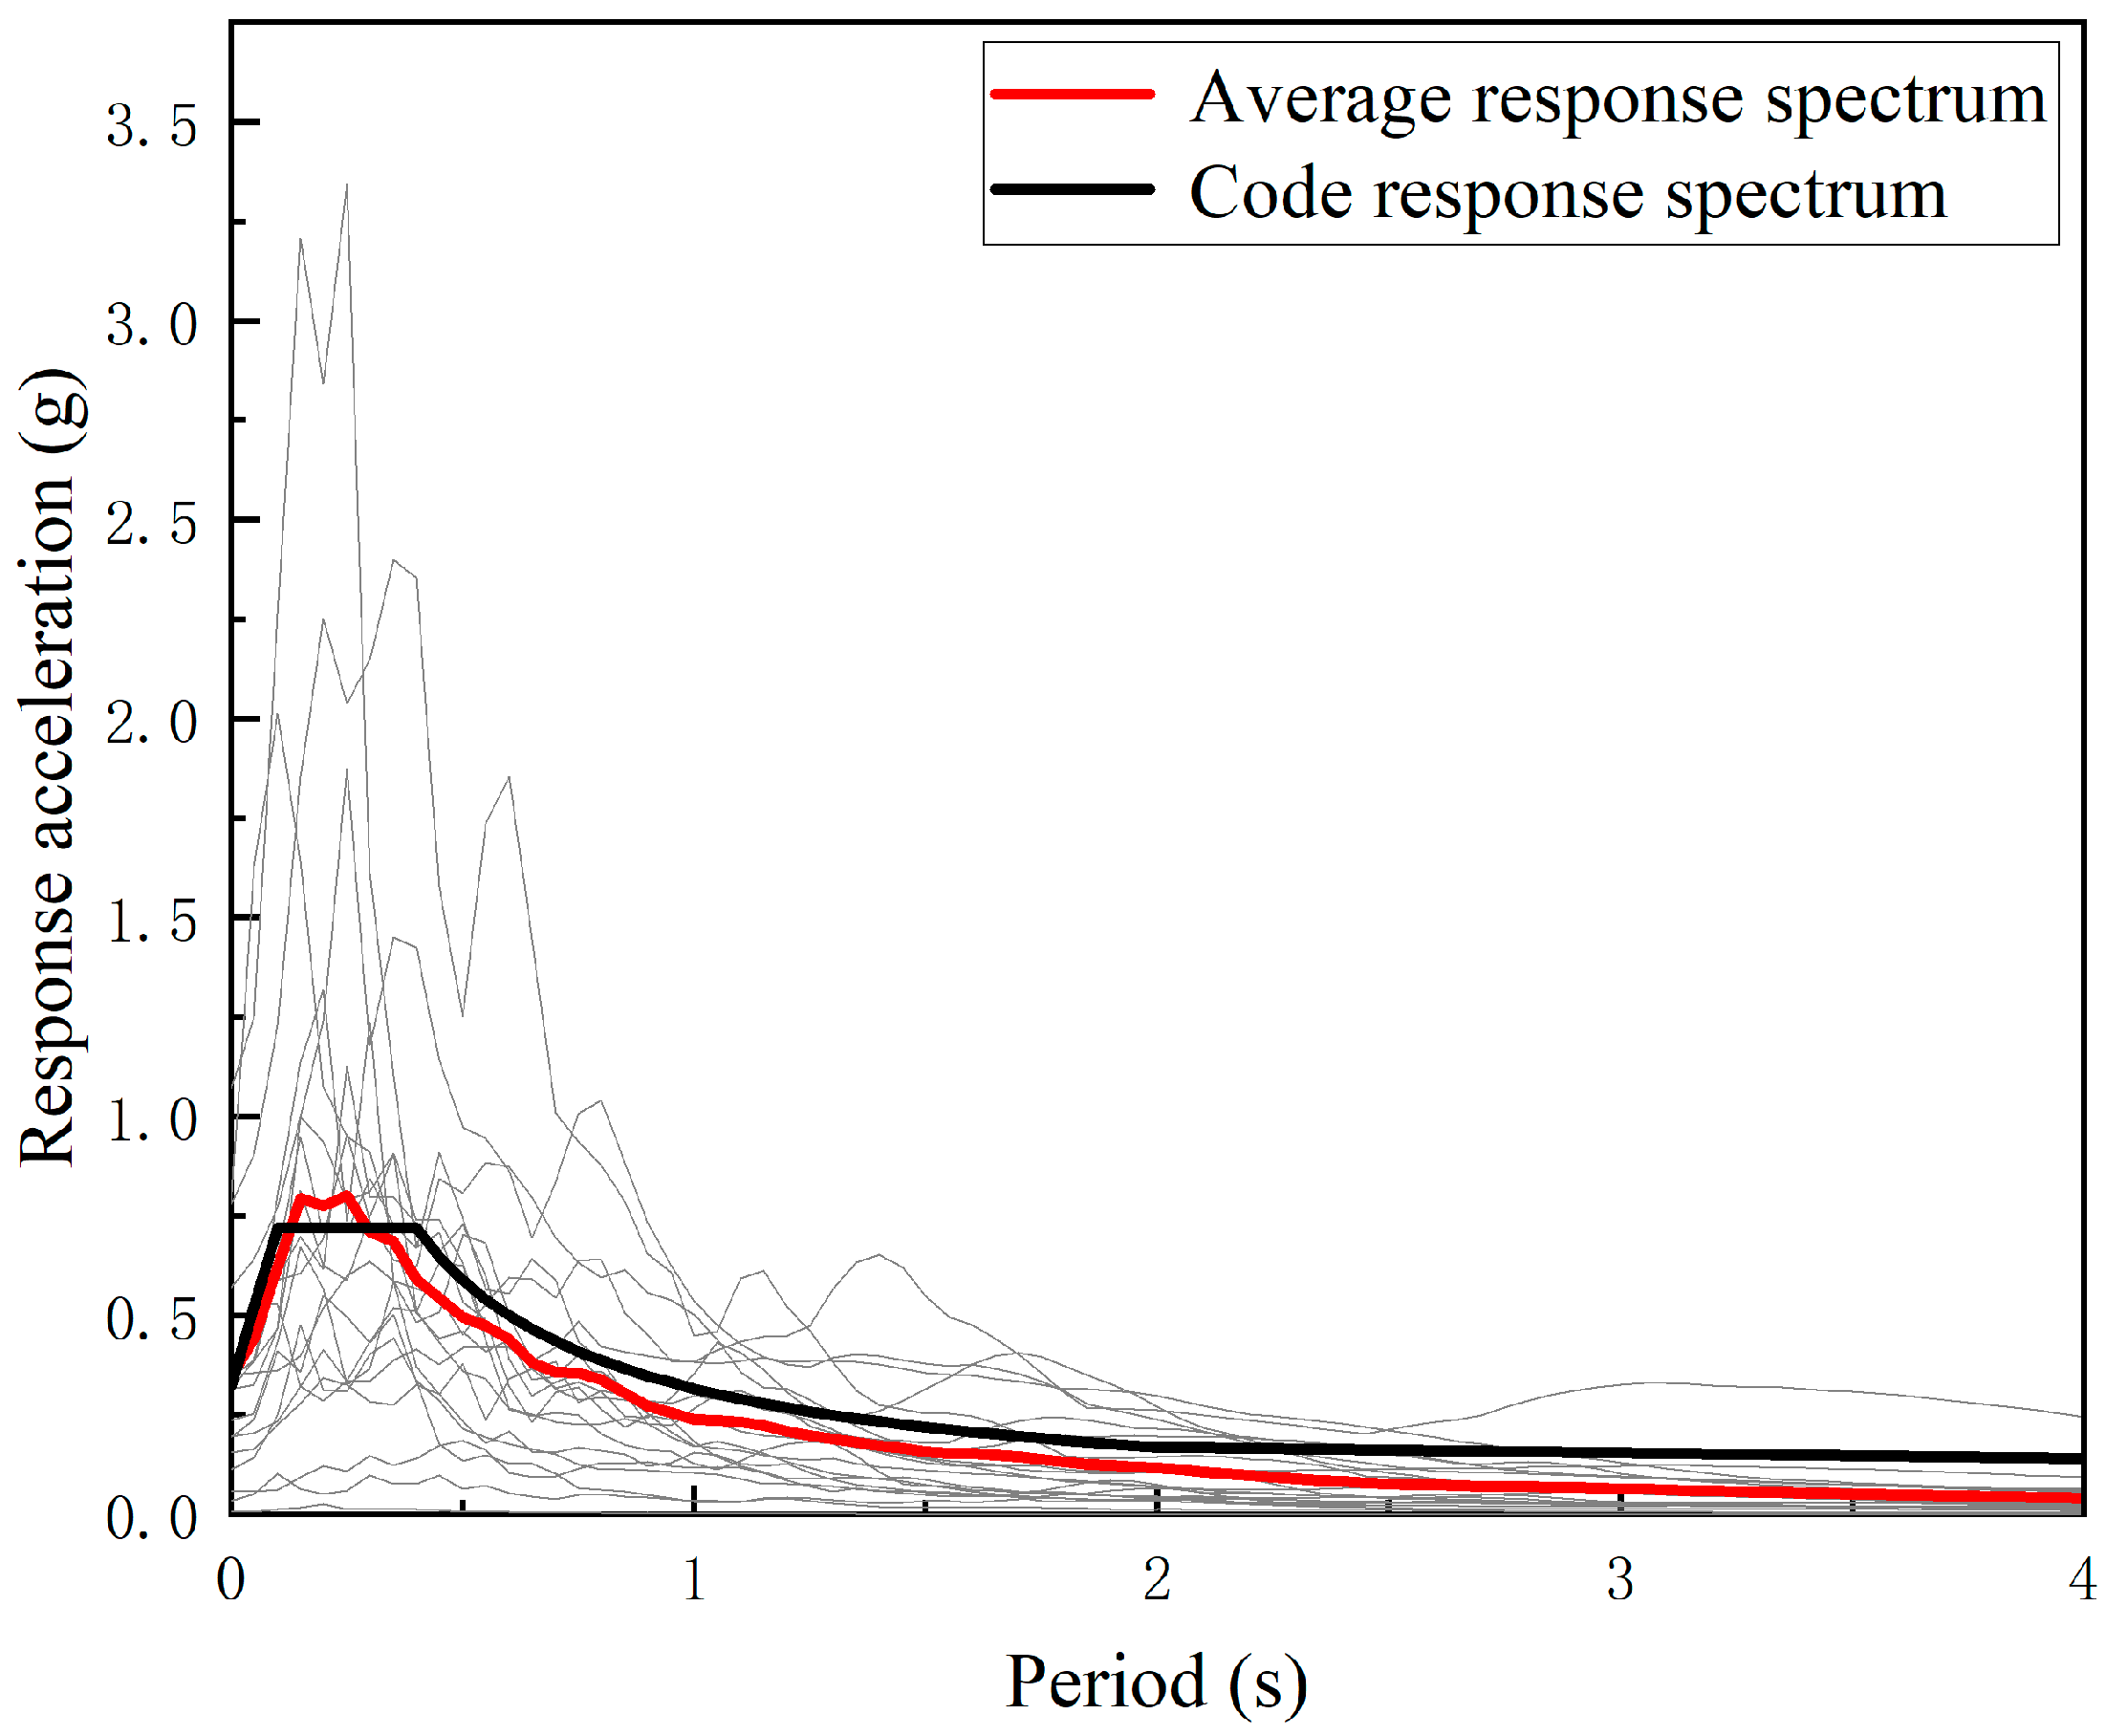
The average response spectrum is obtained by the acceleration response spectrum of 20 seismic waves in Table 2. The comparison between the average response spectrum and the standard response spectrum is shown in Figure 9 (damping ratio is 0.05). The first three-order vibration modes of the RC Diaojiao frame structure are calculated by PKPM (see Table 3). Combined with Figure 9, it can be seen that the difference between the average response spectrum and the standard response spectrum is not more than 20% at the first three-order periodic points of the Diaojiao frame structure, which meets the requirements of the specification on the statistical significance of the selected seismic wave and the standard spectrum [30].
Figure 9.
Average response spectrum and standard response spectrum.
Table 3.
Vibration mode calculation results of Diaojiao frame structure.
Based on the existing research results [38] and the requirements of the specification [30], this paper takes the interlayer displacement angle () as an index to evaluate the damage state of the structure. The relationship between the damage state and the interlayer displacement angle is shown in Table 4. The calculation method of interlayer displacement angle is shown in expression (11).
In the formula, is the horizontal displacement of the roof slab of the i-th story; is the horizontal displacement of the floor slab of the i-th story; is the story height of the i-th story (the period values of and are the same).
Table 4.
Relationship between damage state and interlayer displacement angle.
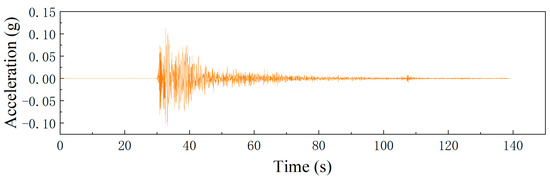
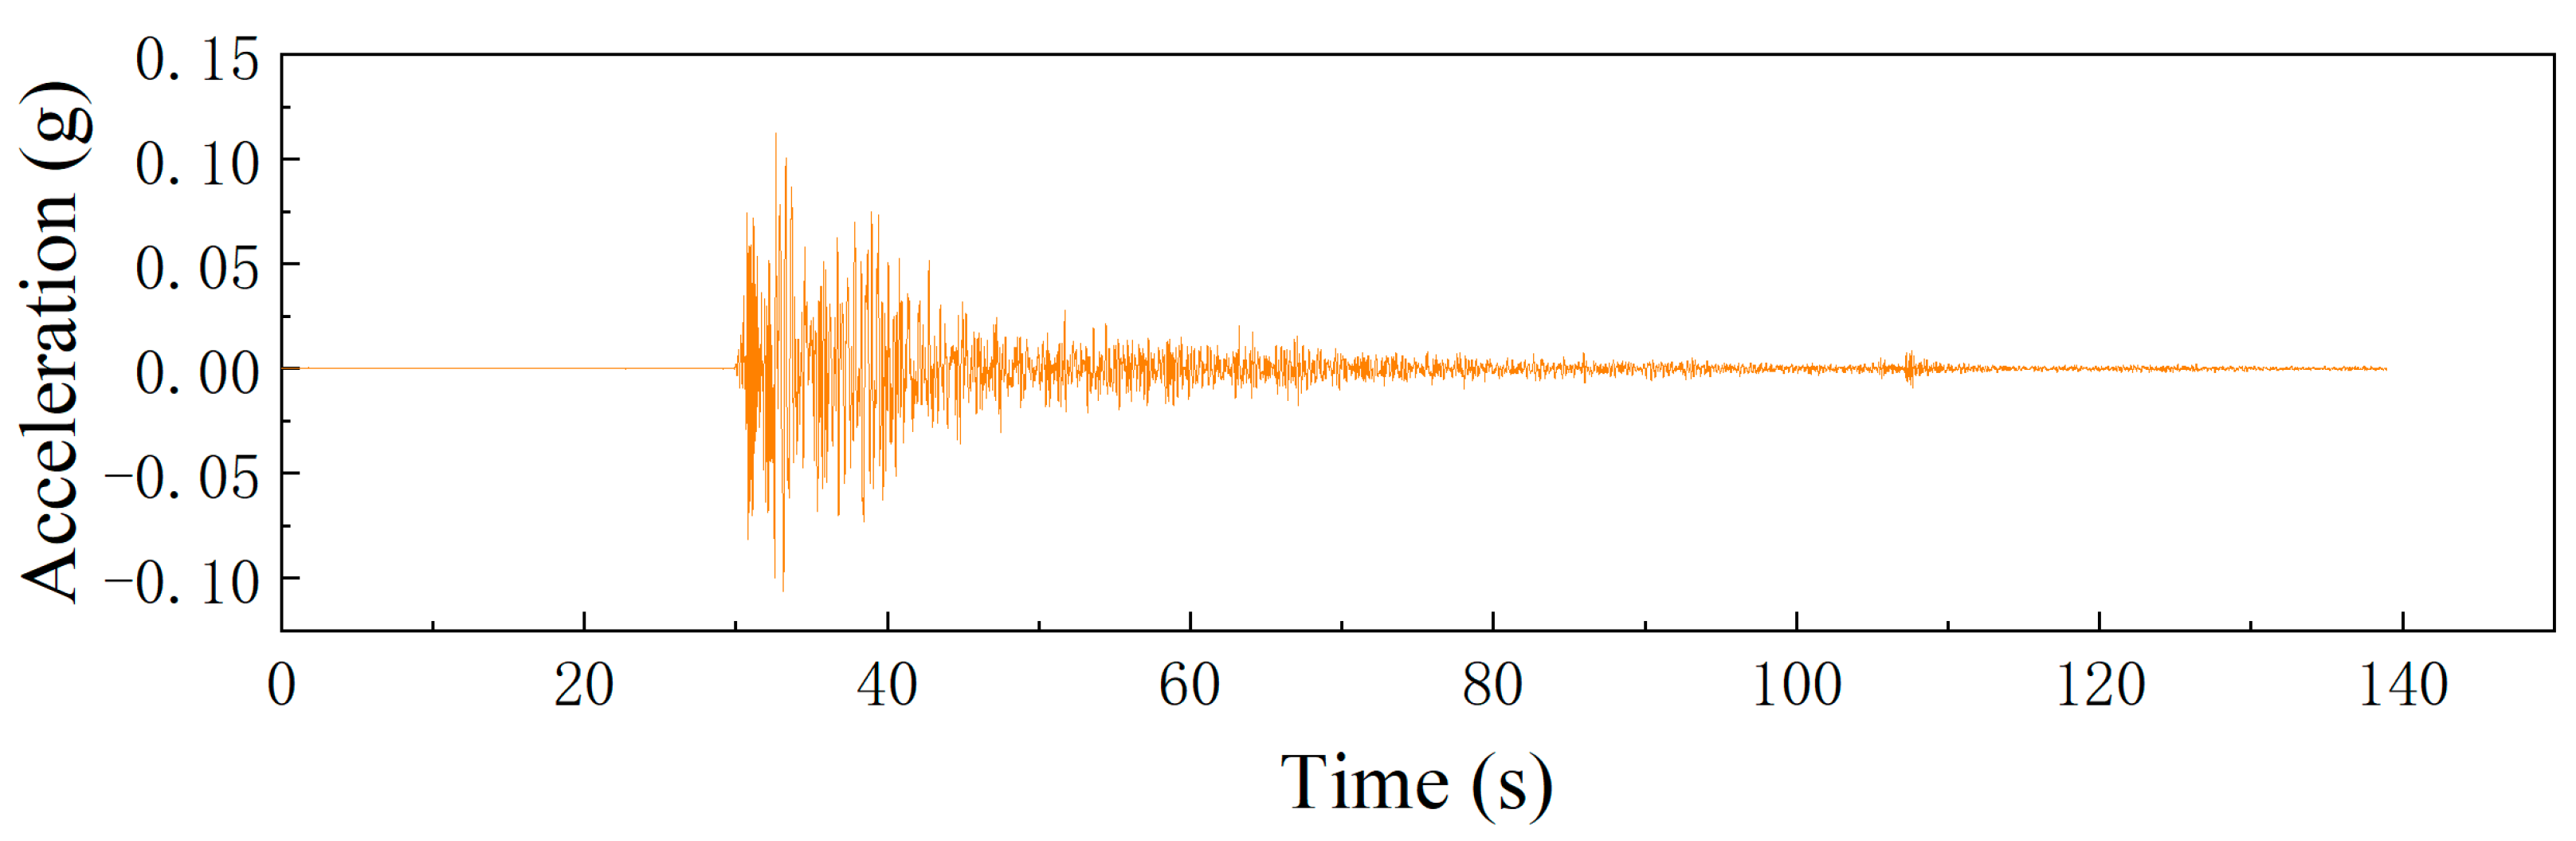
When exploring the dynamic response characteristics of the Diaojiao frame structure, this paper uses the Luding ground motion record as the seismic input. The PGAs of the calculated working conditions are 0.05 g, 0.1 g, 0.2 g, 0.3 g, 0.4 g, 0.6 g, 0.8 g, 1.0 g, 1.2 g, 1.4 g, 1.6 g, 1.8 g, 2.0 g, respectively. The Luding ground motion record is shown in Figure 10.
Figure 10.
Luding ground motion records.
2.5. Seismic Fragility Analysis Method
Incremental Dynamic Analysis (IDA) is a parametric dynamic analysis method used to evaluate the seismic performance of structures. By applying a series of step-by-step amplified ground motion records to the structure, nonlinear time-history analysis is performed to fully reveal the response evolution of the structure under earthquakes of different intensities. The seismic fragility () of the structure refers to the probability that the structure reaches or exceeds a certain damage level under the action of ground motions of different intensities. The specific expression is shown below (see expression (12)).
In the formula, is the seismic fragility function of the structure; is the ground motion intensity index; is the probability that the structure reaches or exceeds a certain damage state; is the seismic demand of the structure; is the seismic capacity of the structure.
The relationship between the ground motion intensity index () and the structural seismic demand parameter () satisfies the following relationship.
Based on the expression (13), the seismic demand probability function can be obtained (see expression (14)).
In the formula, and are the fitting parameters.
The exceedance probability () of the structure under various limit states can be calculated by the expression (15).
In the formula, is the standard normal distribution cumulative function; is the ground motion intensity; is the median value of the structural seismic capacity parameter; is the logarithmic standard deviation of the seismic capacity of the structure, which generally takes 0.3 [38]; is the logarithmic standard deviation of structural seismic demand ().
3. Dynamic Response Characteristics of Diaojiao Frame Structure
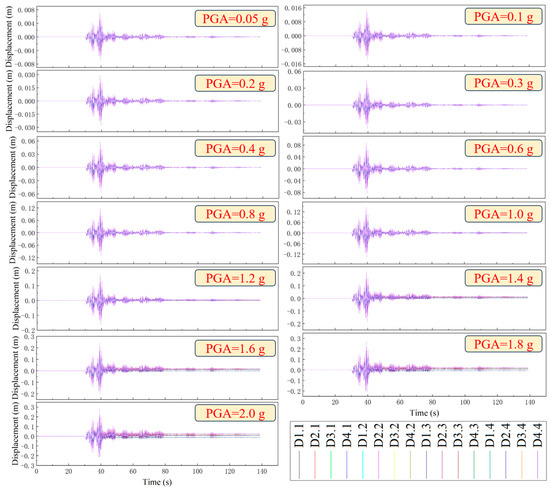
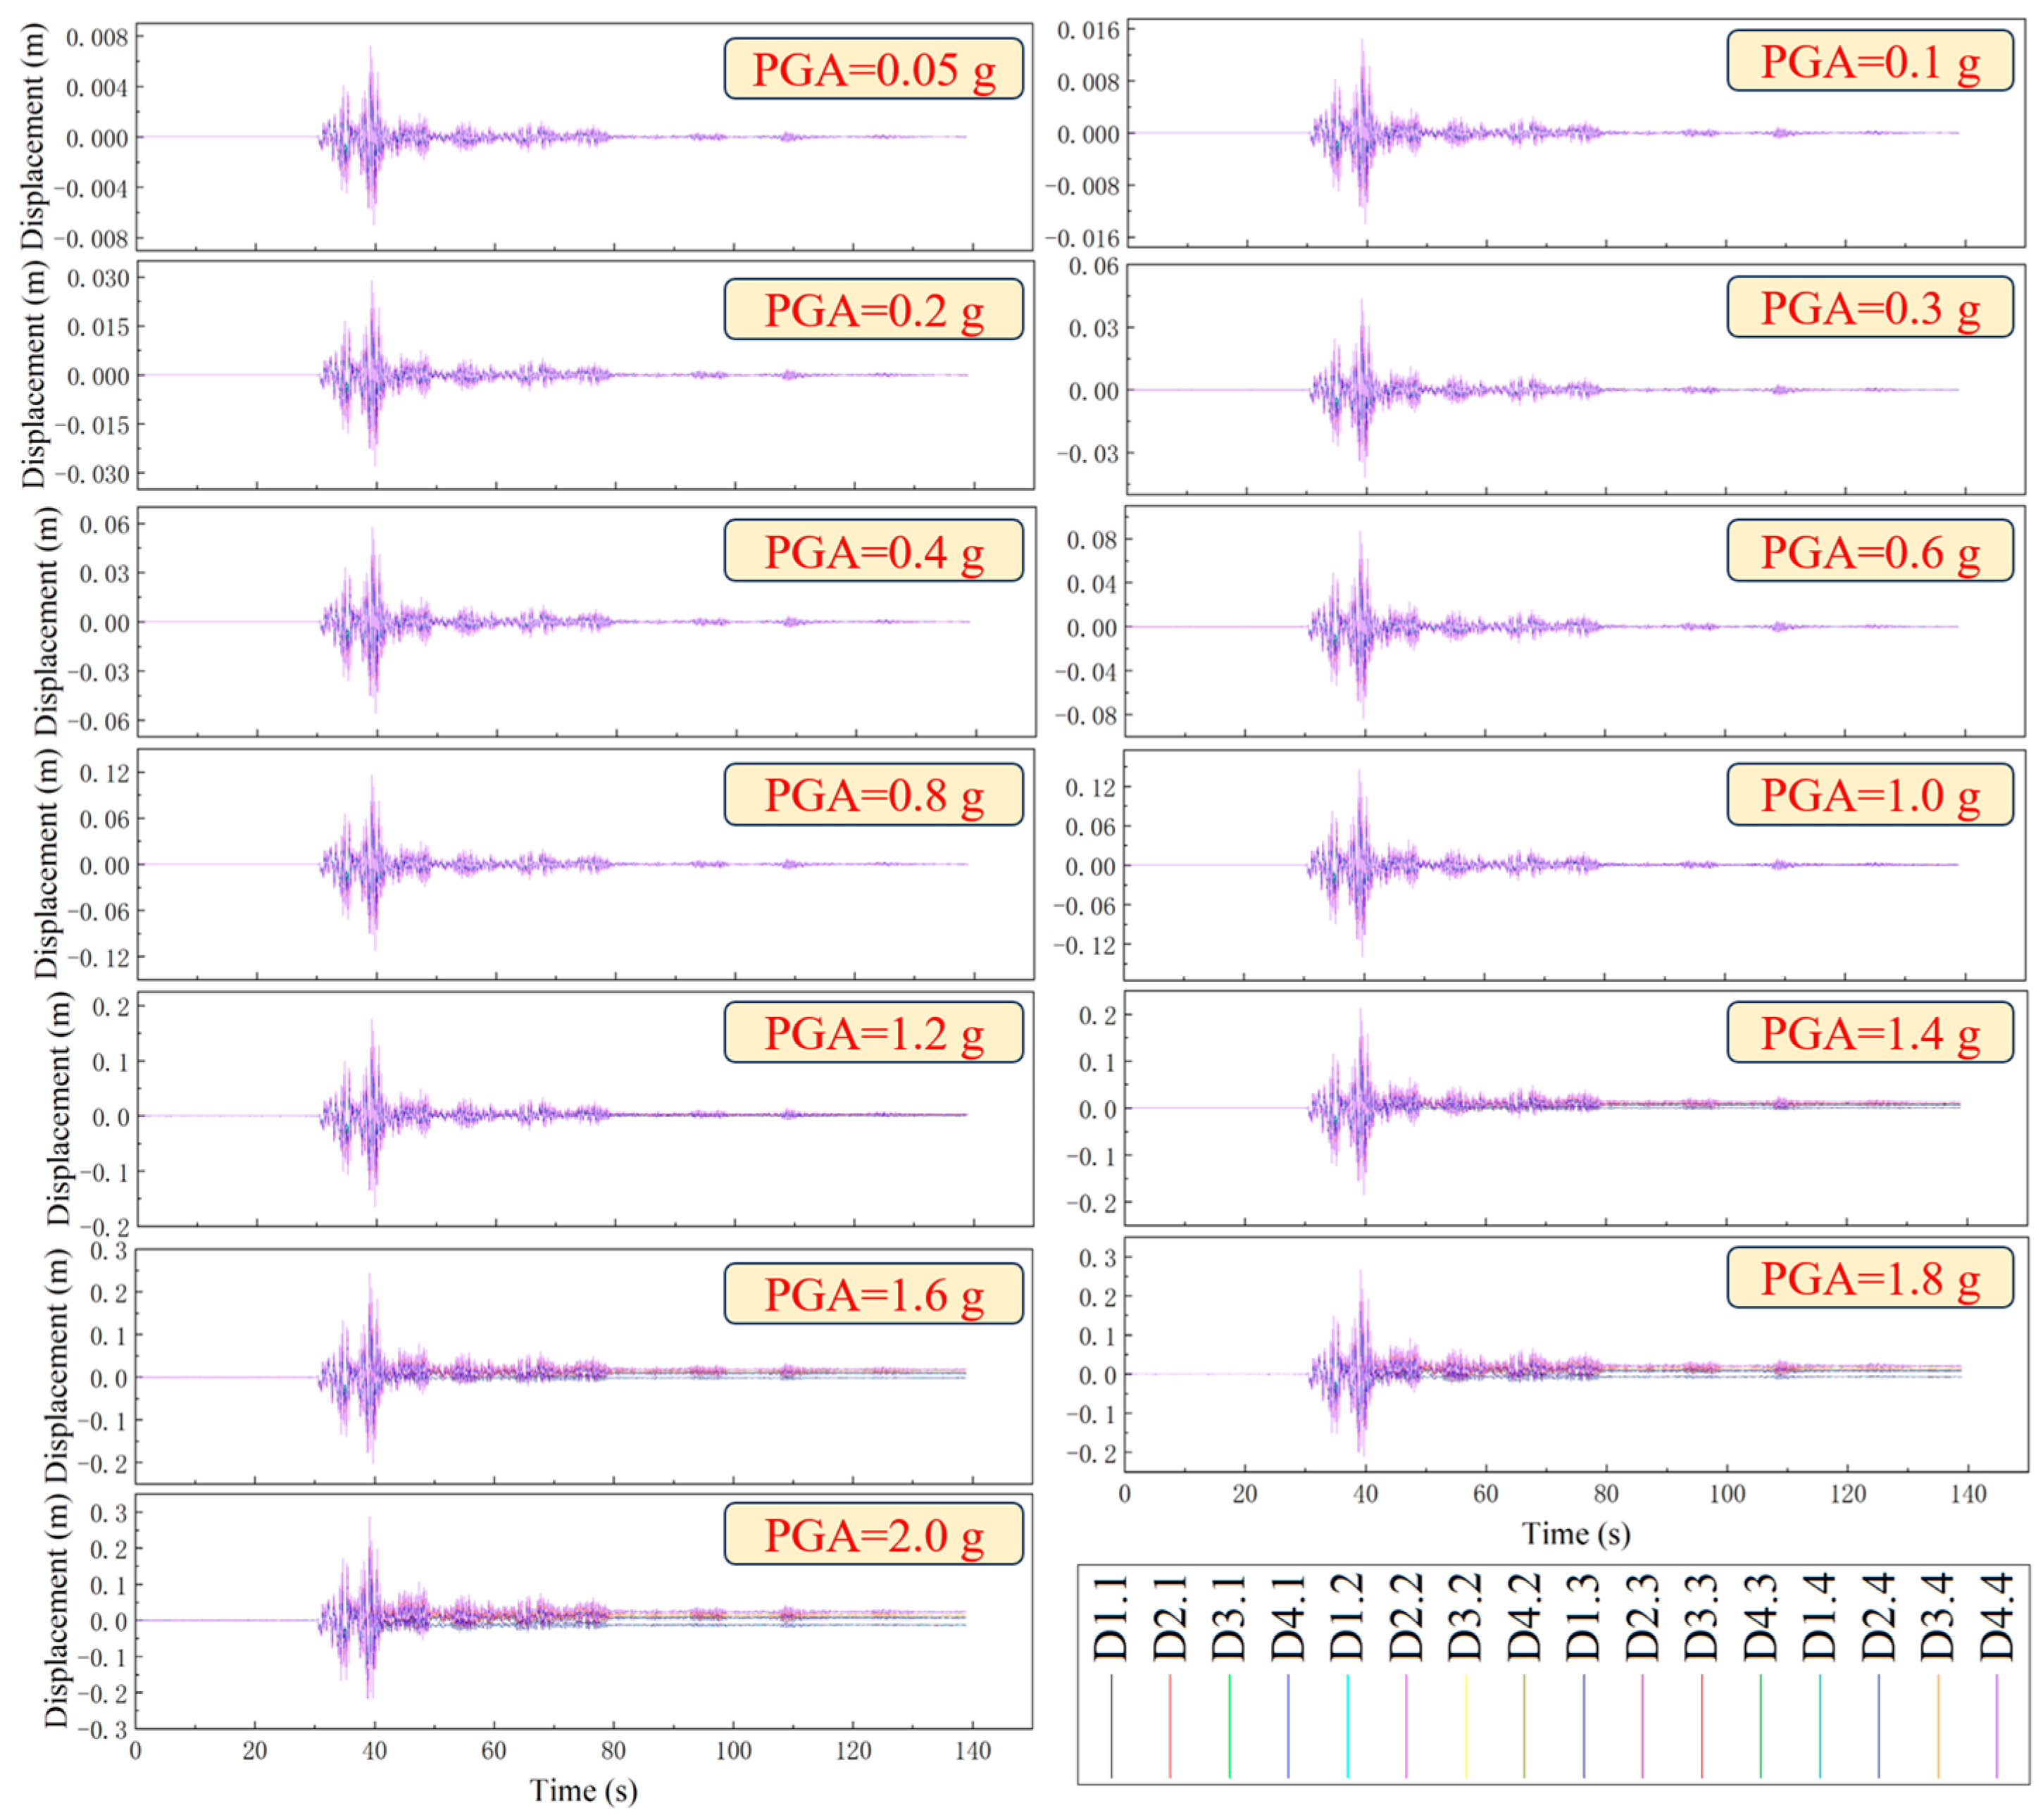
The displacement data of all monitoring points are obtained by numerical calculation (see Figure 11), and the interlayer displacement angle of the Diaojiao frame structure is obtained based on the expression (11). The floor structure numbers are C1_1, C2_1, C3_1, C1_2, C2_2, C3_2, C1_3, C2_3, C3_3, C1_4, C2_4, C3_4 (see Figure 12).
Figure 11.
Monitoring point displacement record.
Figure 12.
Building structure number.
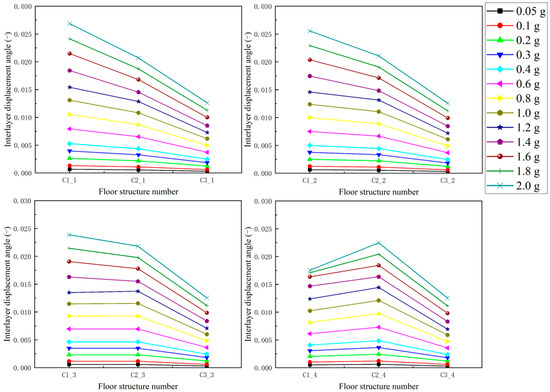
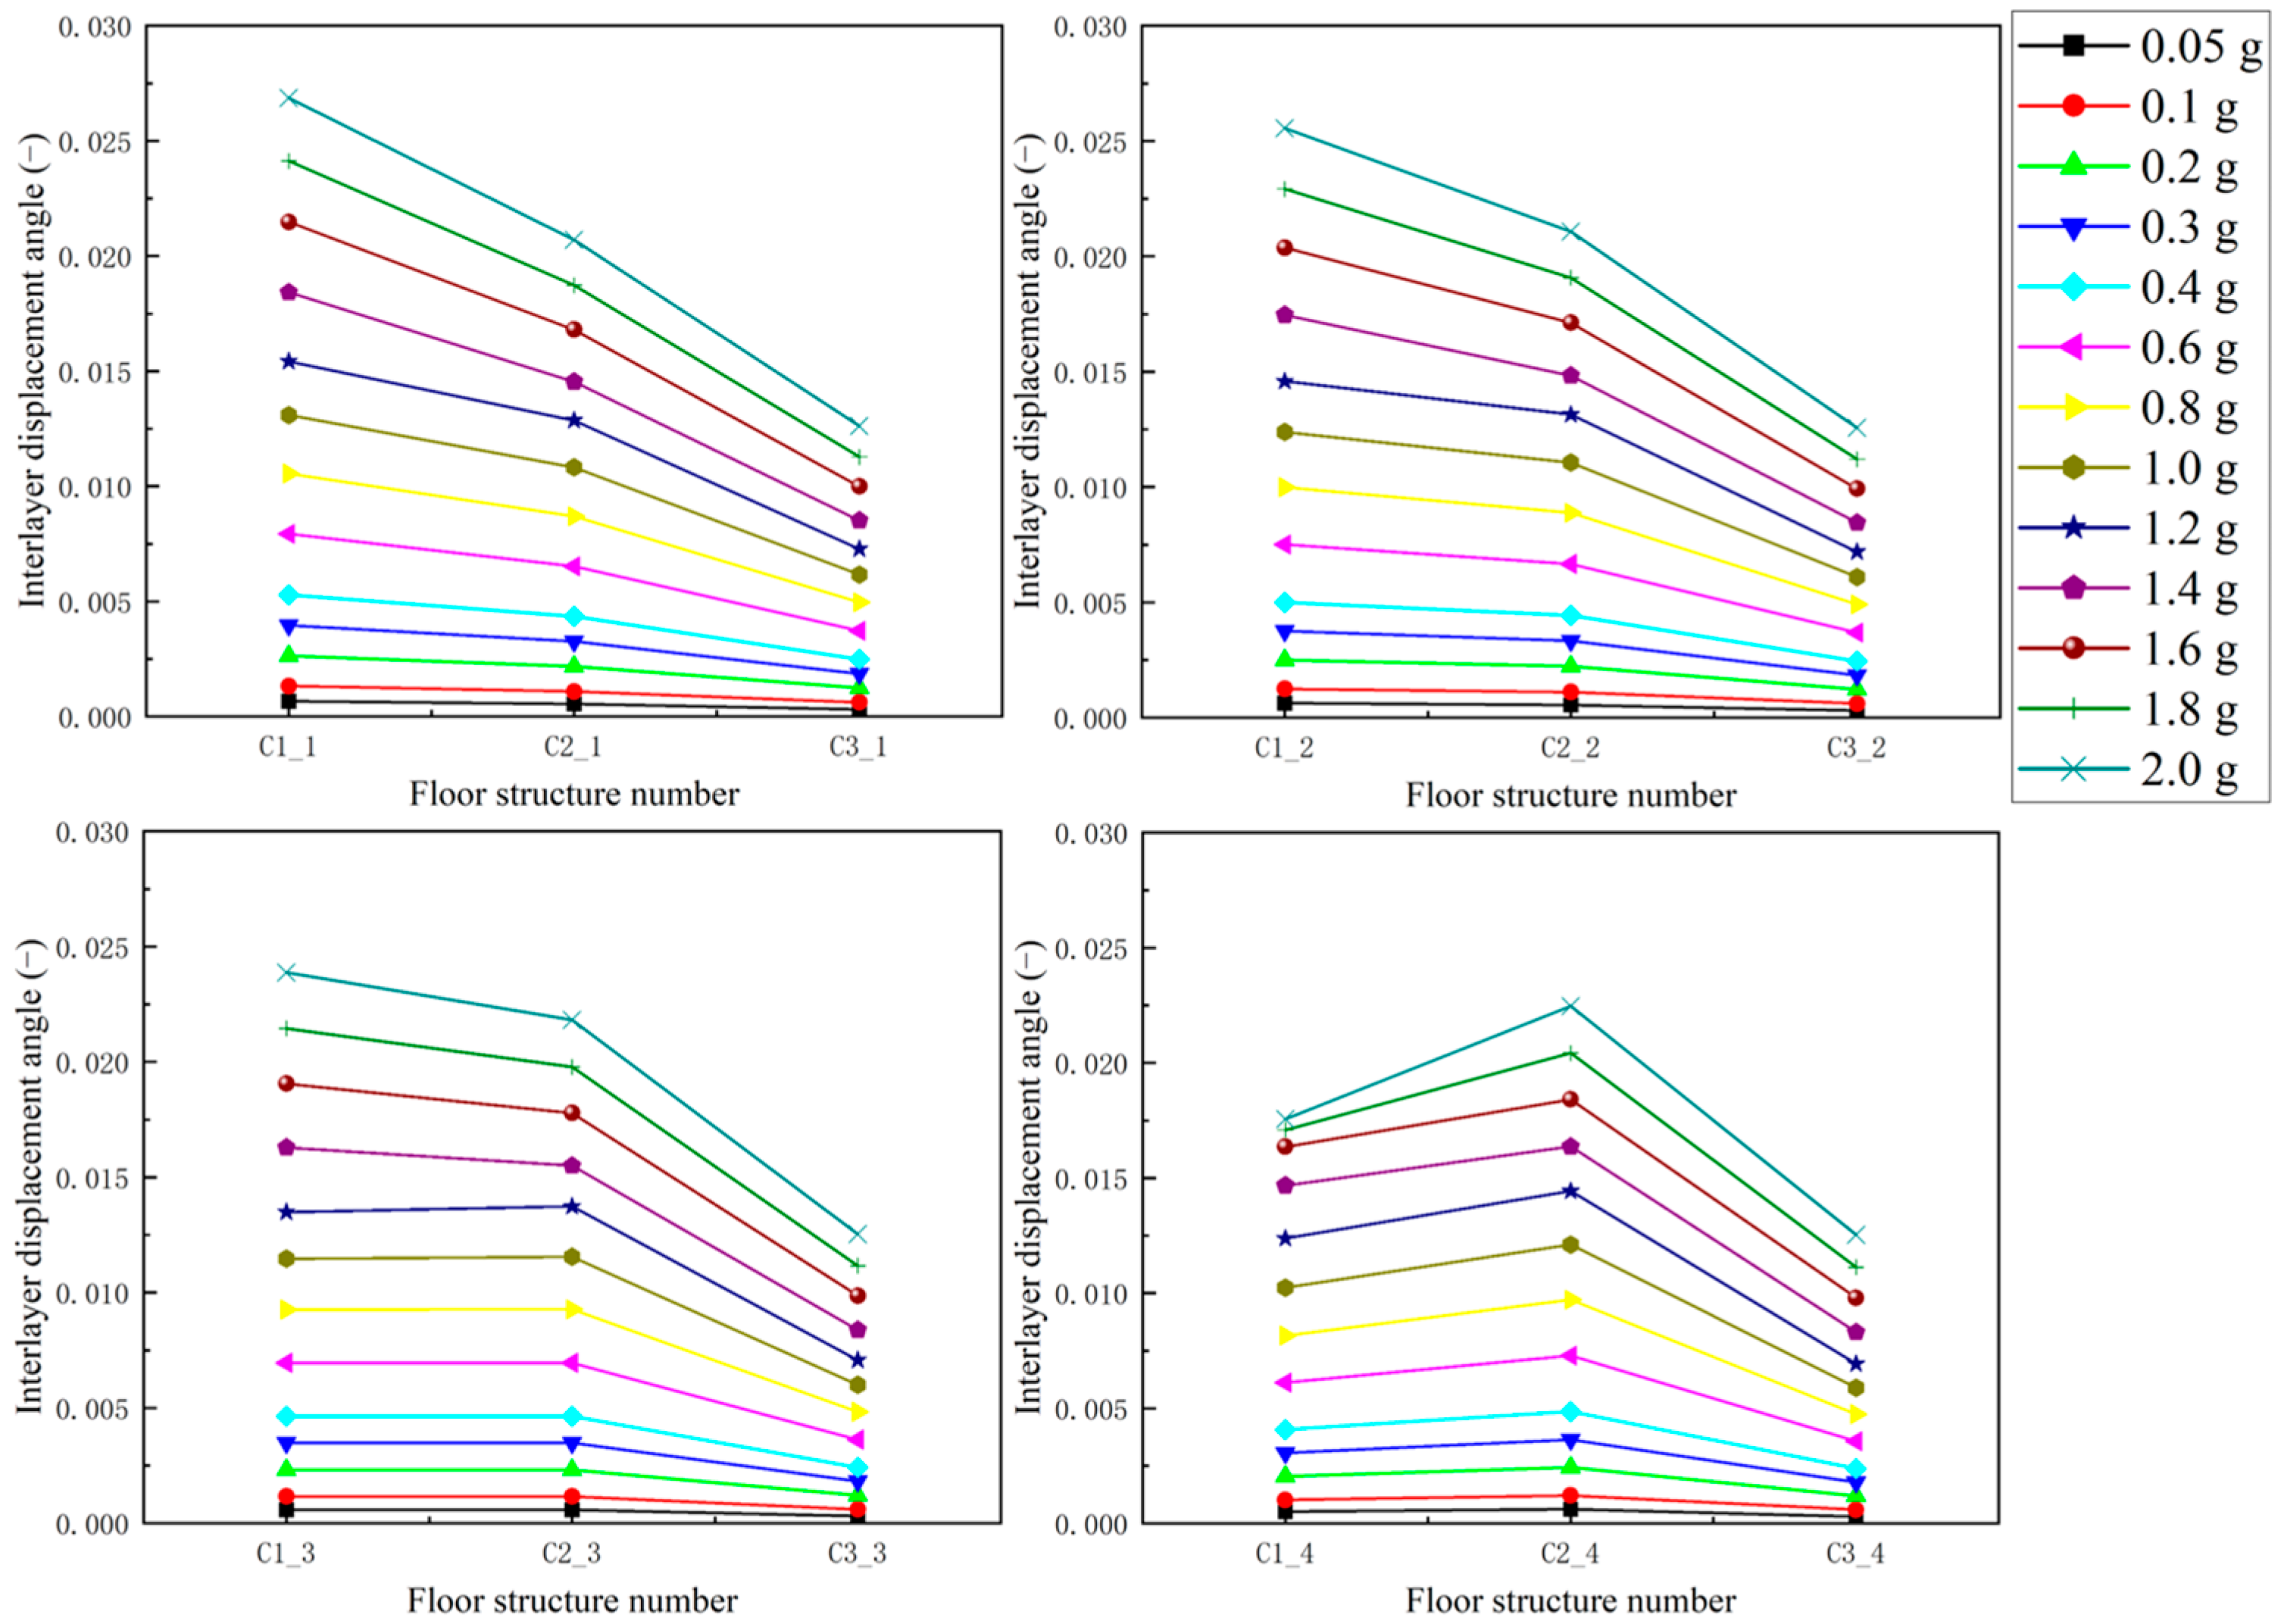
It can be seen from Figure 13 that in the Diaojiao frame structure, due to the different lengths of the columns on Floor 1, the interlayer displacement angle shows different development laws with the change in floor height. In columns 1 and 2, the interlayer displacement angle shows a linear decrease. This shows that under the influence of ground motion, the damage law of column 1 is C1_1 > C2_1 > C3_1, and the damage law of column 2 is C1_2 > C2_2 > C3_2. In column 3, when PGA is less than or equal to 1.2 g, the interlayer displacement angle shows a nonlinear development law of increasing first and then decreasing. When PGA is greater than 1.2 g, the interlayer displacement angle shows a linear decrease. This shows that under the influence of ground motion, the damage development law of column 3 will change with the change in PGA. When PGA is less than or equal to 1.2 g, the damage law of column 3 is C1_3 < C2_3 > C3_3. When PGA is greater than 1.2 g, the damage law of column 3 is C1_3 > C2_3 > C3_3. In column 4, the interlayer displacement angle shows a nonlinear development law of increasing first and then decreasing. This shows that under the influence of ground motion, the damage law of column 4 is C1_4 < C2_4 > C3_4.
Figure 13.
Z-direction interlayer displacement angle of structure.
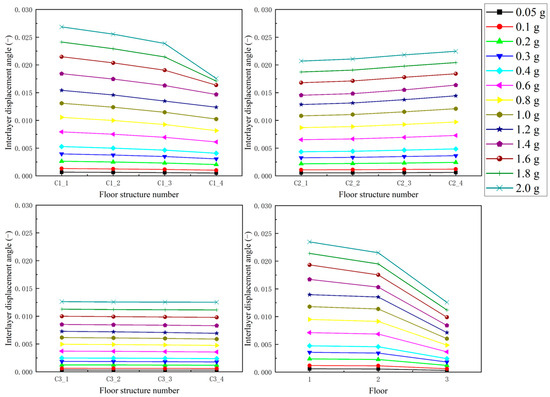
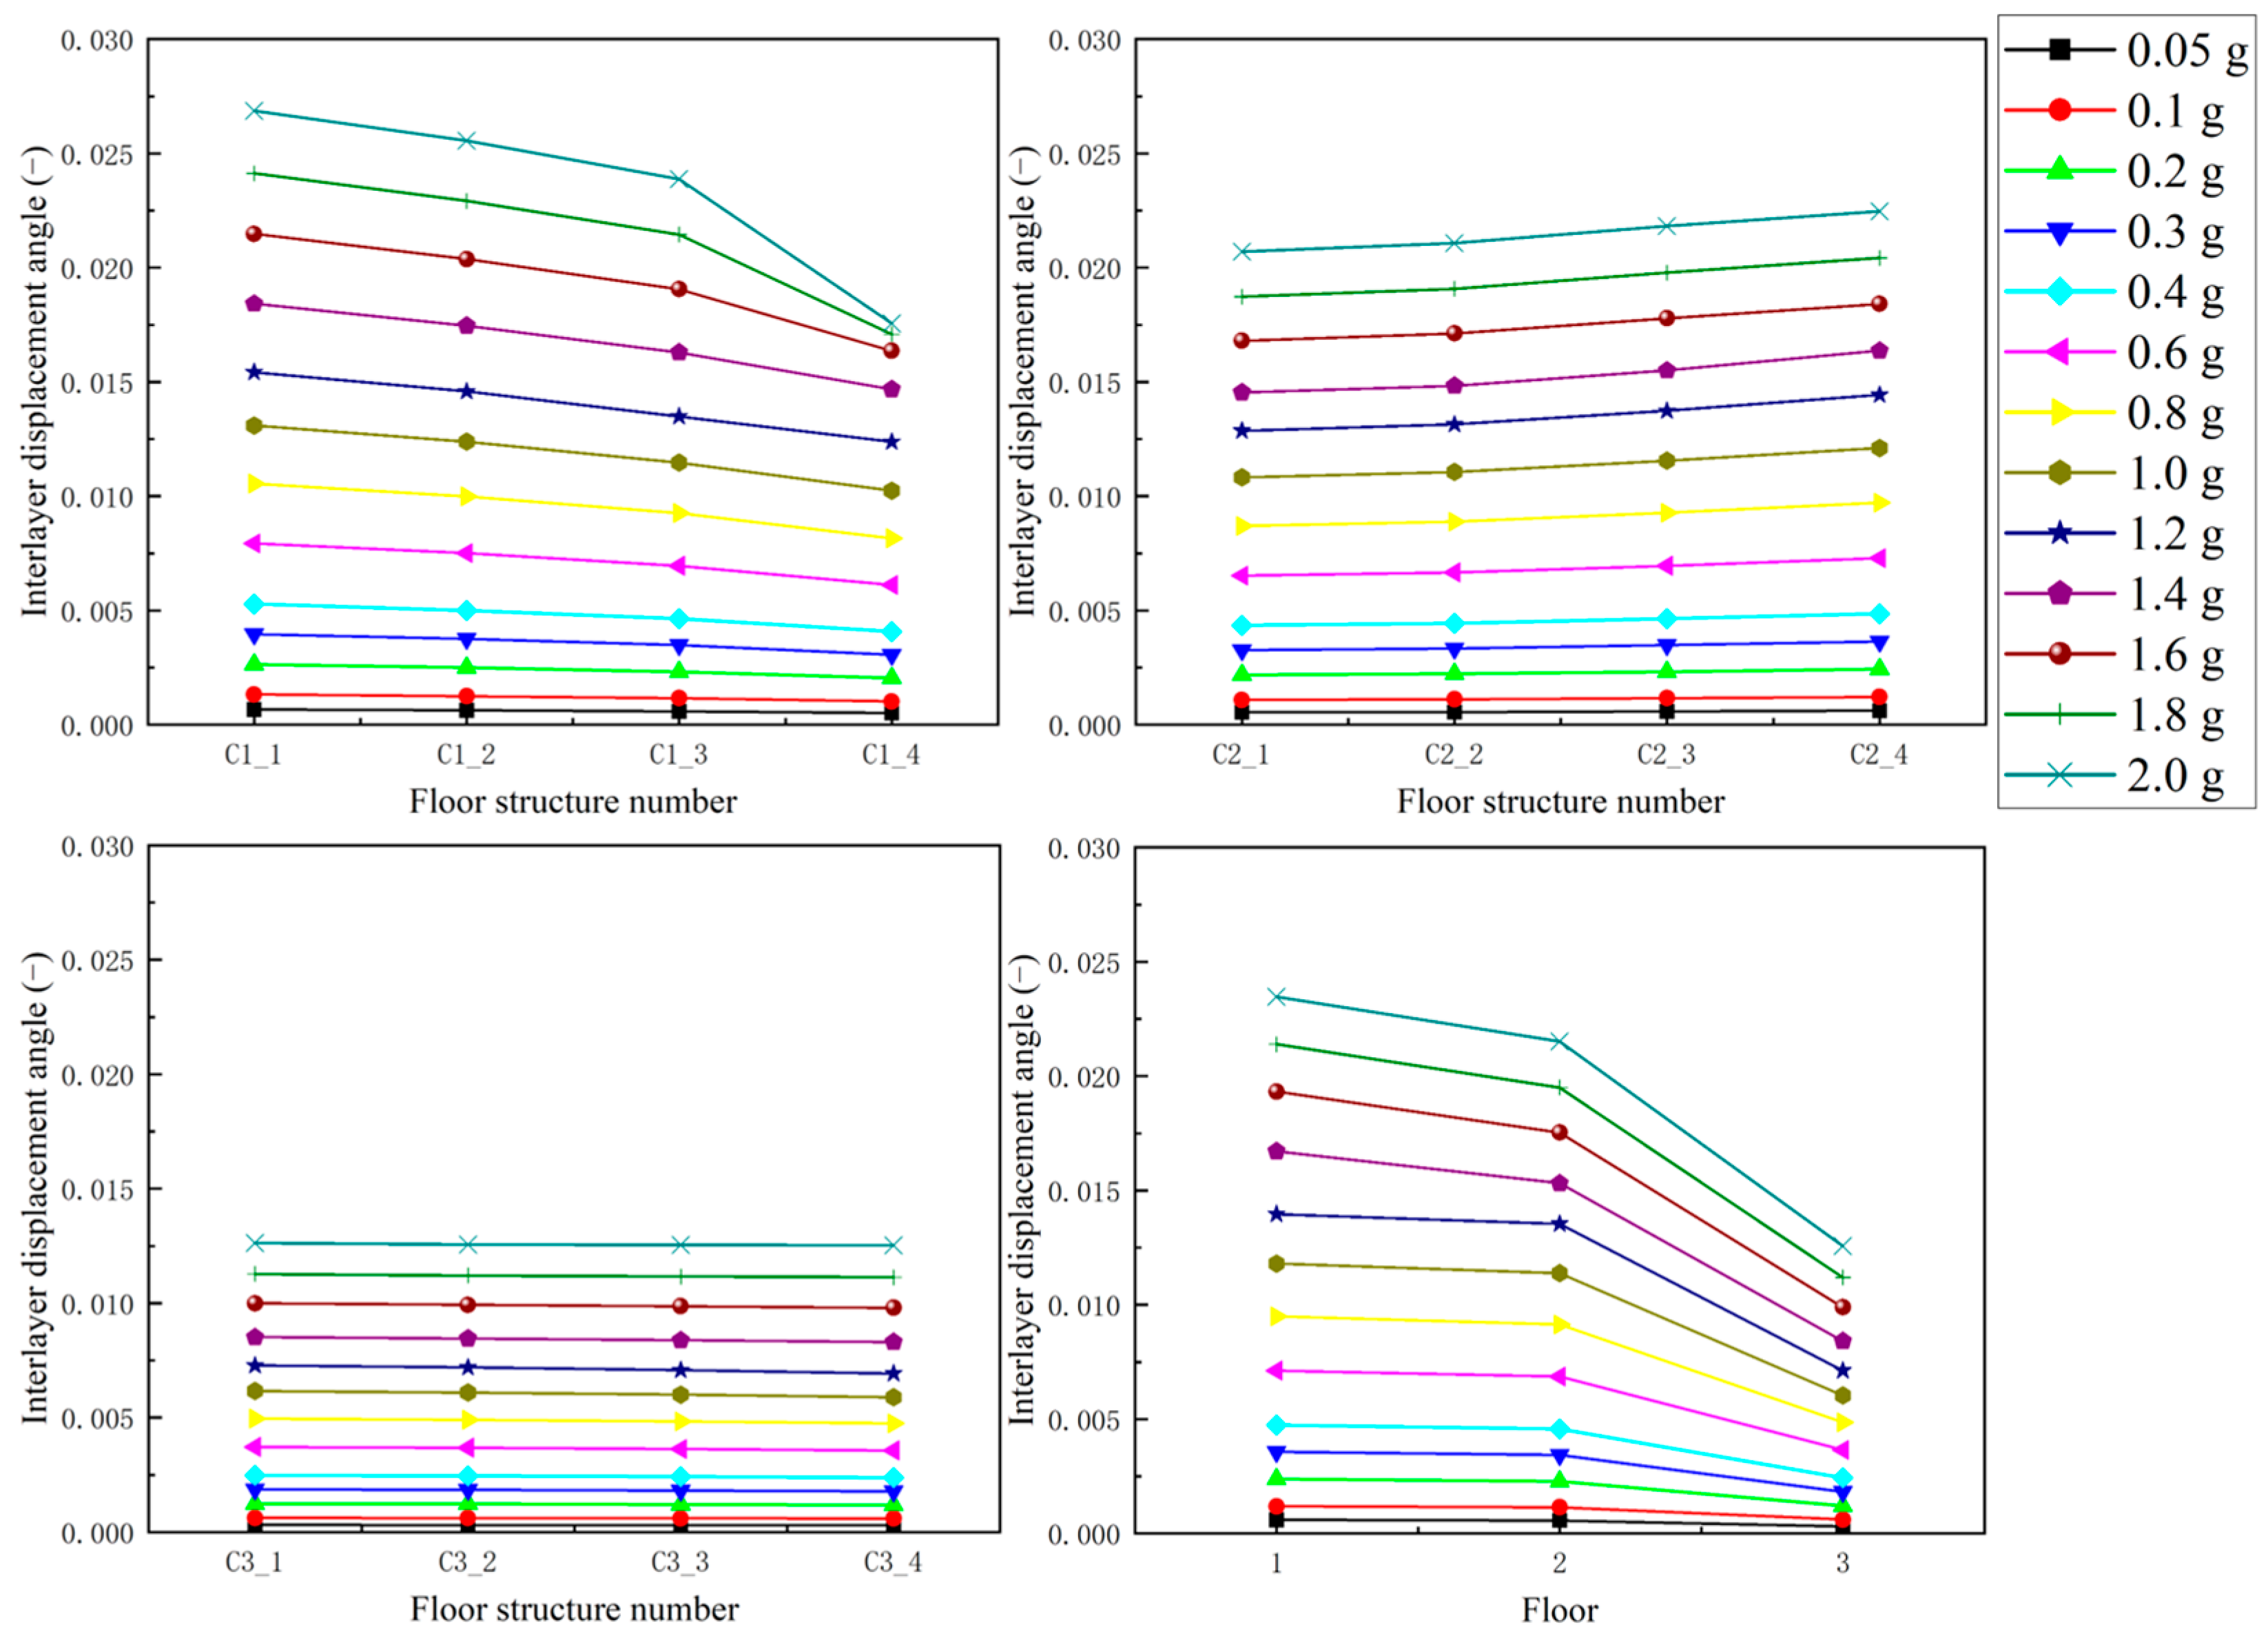
It can be seen from Figure 14 that the interlayer displacement angles of Floor 1, Floor 2 and Floor 3 all show a linear development law. In Floor 1, with the decrease in column height, the interlayer displacement angle shows a linear decrease. This shows that under the influence of ground motion, the damage law of Floor 1 of the Diaojiao frame structure is C1_1 > C1_2 > C1_3 > C1_4. In Floor 2 and Floor 3, the column height is the same, so the linear development trend of the interlayer displacement angle is relatively flat. This shows that the difference between the damage of the columns in Floor 2 and Floor 3 is smaller. Under the influence of ground motion, the damage law of Floor 2 is C2_4 > C2_3 > C2_2 > C2_1, and the damage law of Floor 3 is C3_1 > C3_2 > C3_3 > C3_4. And it can be seen from Figure 14 that with the increase in floor height, the interlayer displacement angle shows a linear decline as a whole. This shows that under the influence of ground motion, the damage law of the Diaojiao frame structure is Floor 1 > Floor 2 > Floor 3.
Figure 14.
X-direction interlayer displacement angle of structure.
In summary, under the influence of ground motion, the damage of Floor 1 of the Diaojiao frame structure is the largest, and the damage of Floor 3 is the smallest. And under the influence of ground motion, the C1_1 of the Diaojiao frame structure will have the maximum damage state. The maximum damage state of column 3 will transfer from C2_3 to C1_3 with the increase in PGA. The C2_4 of column 4 will have the maximum damage state.
4. Seismic Fragility Analysis
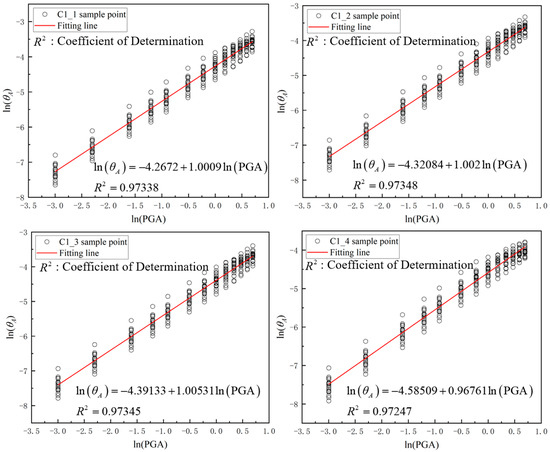
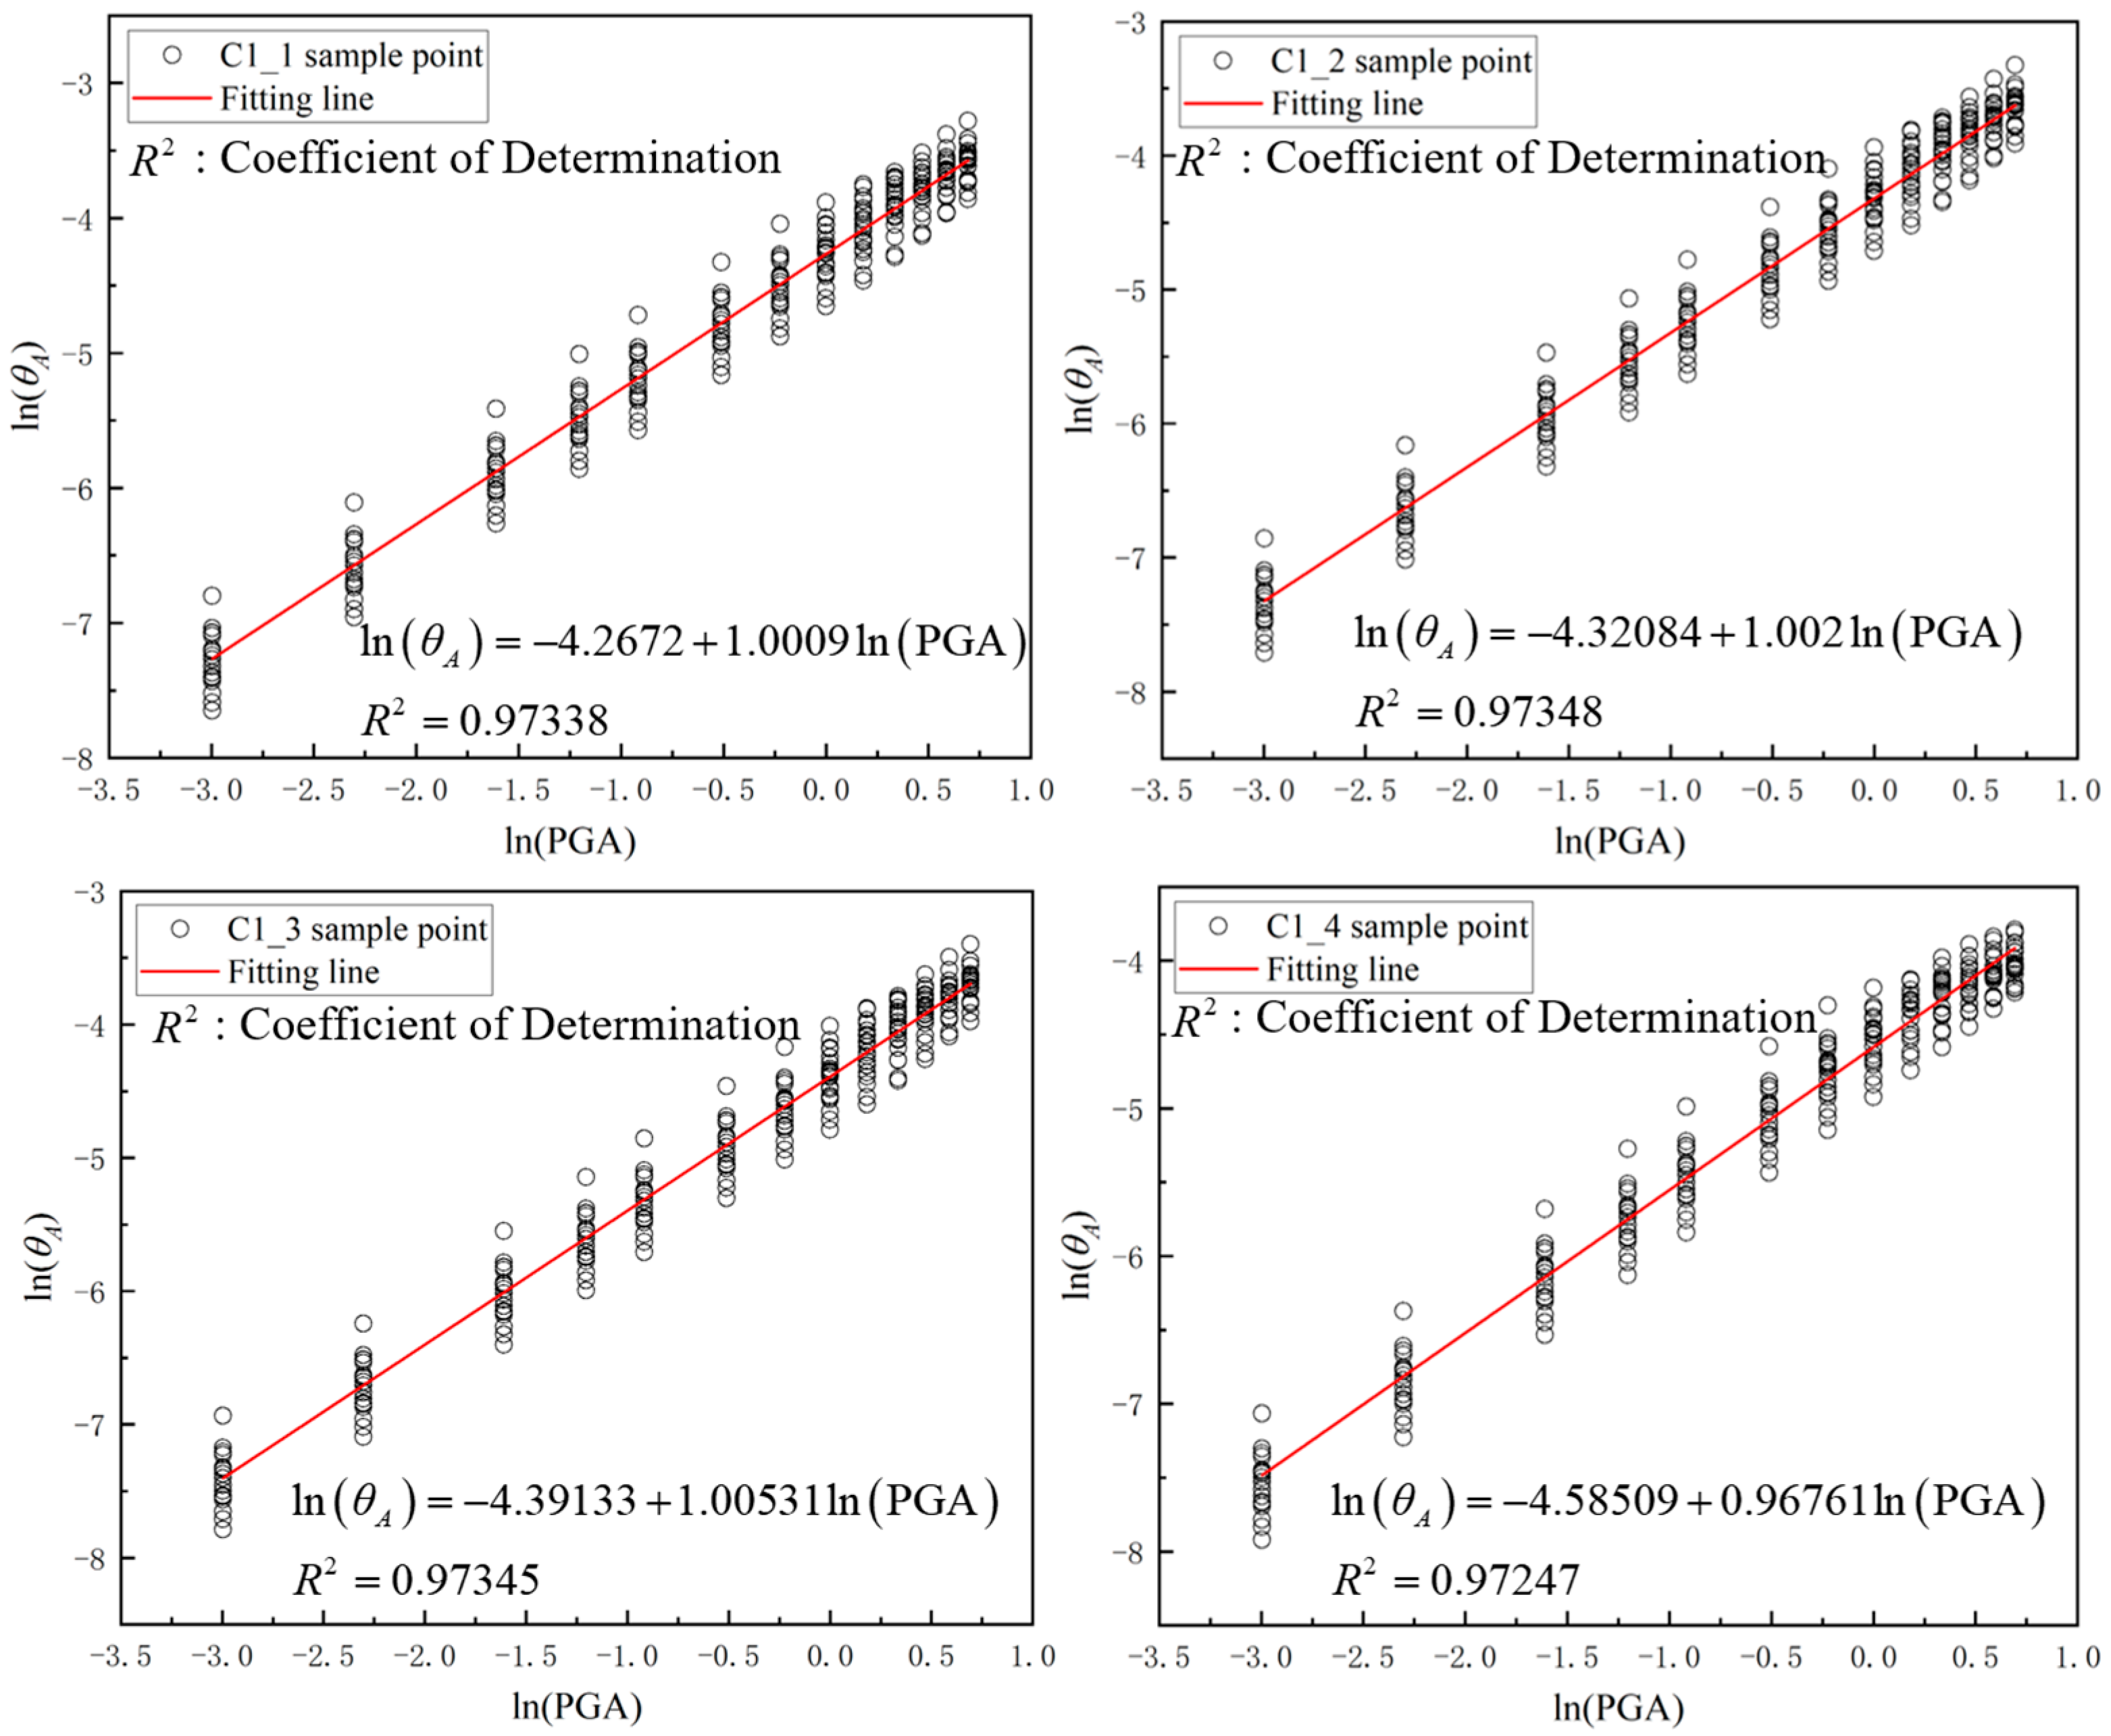
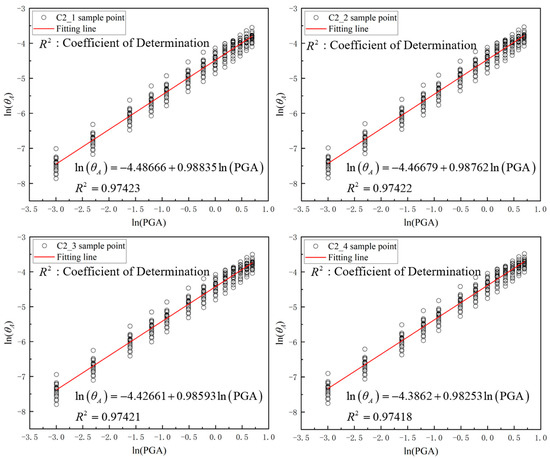
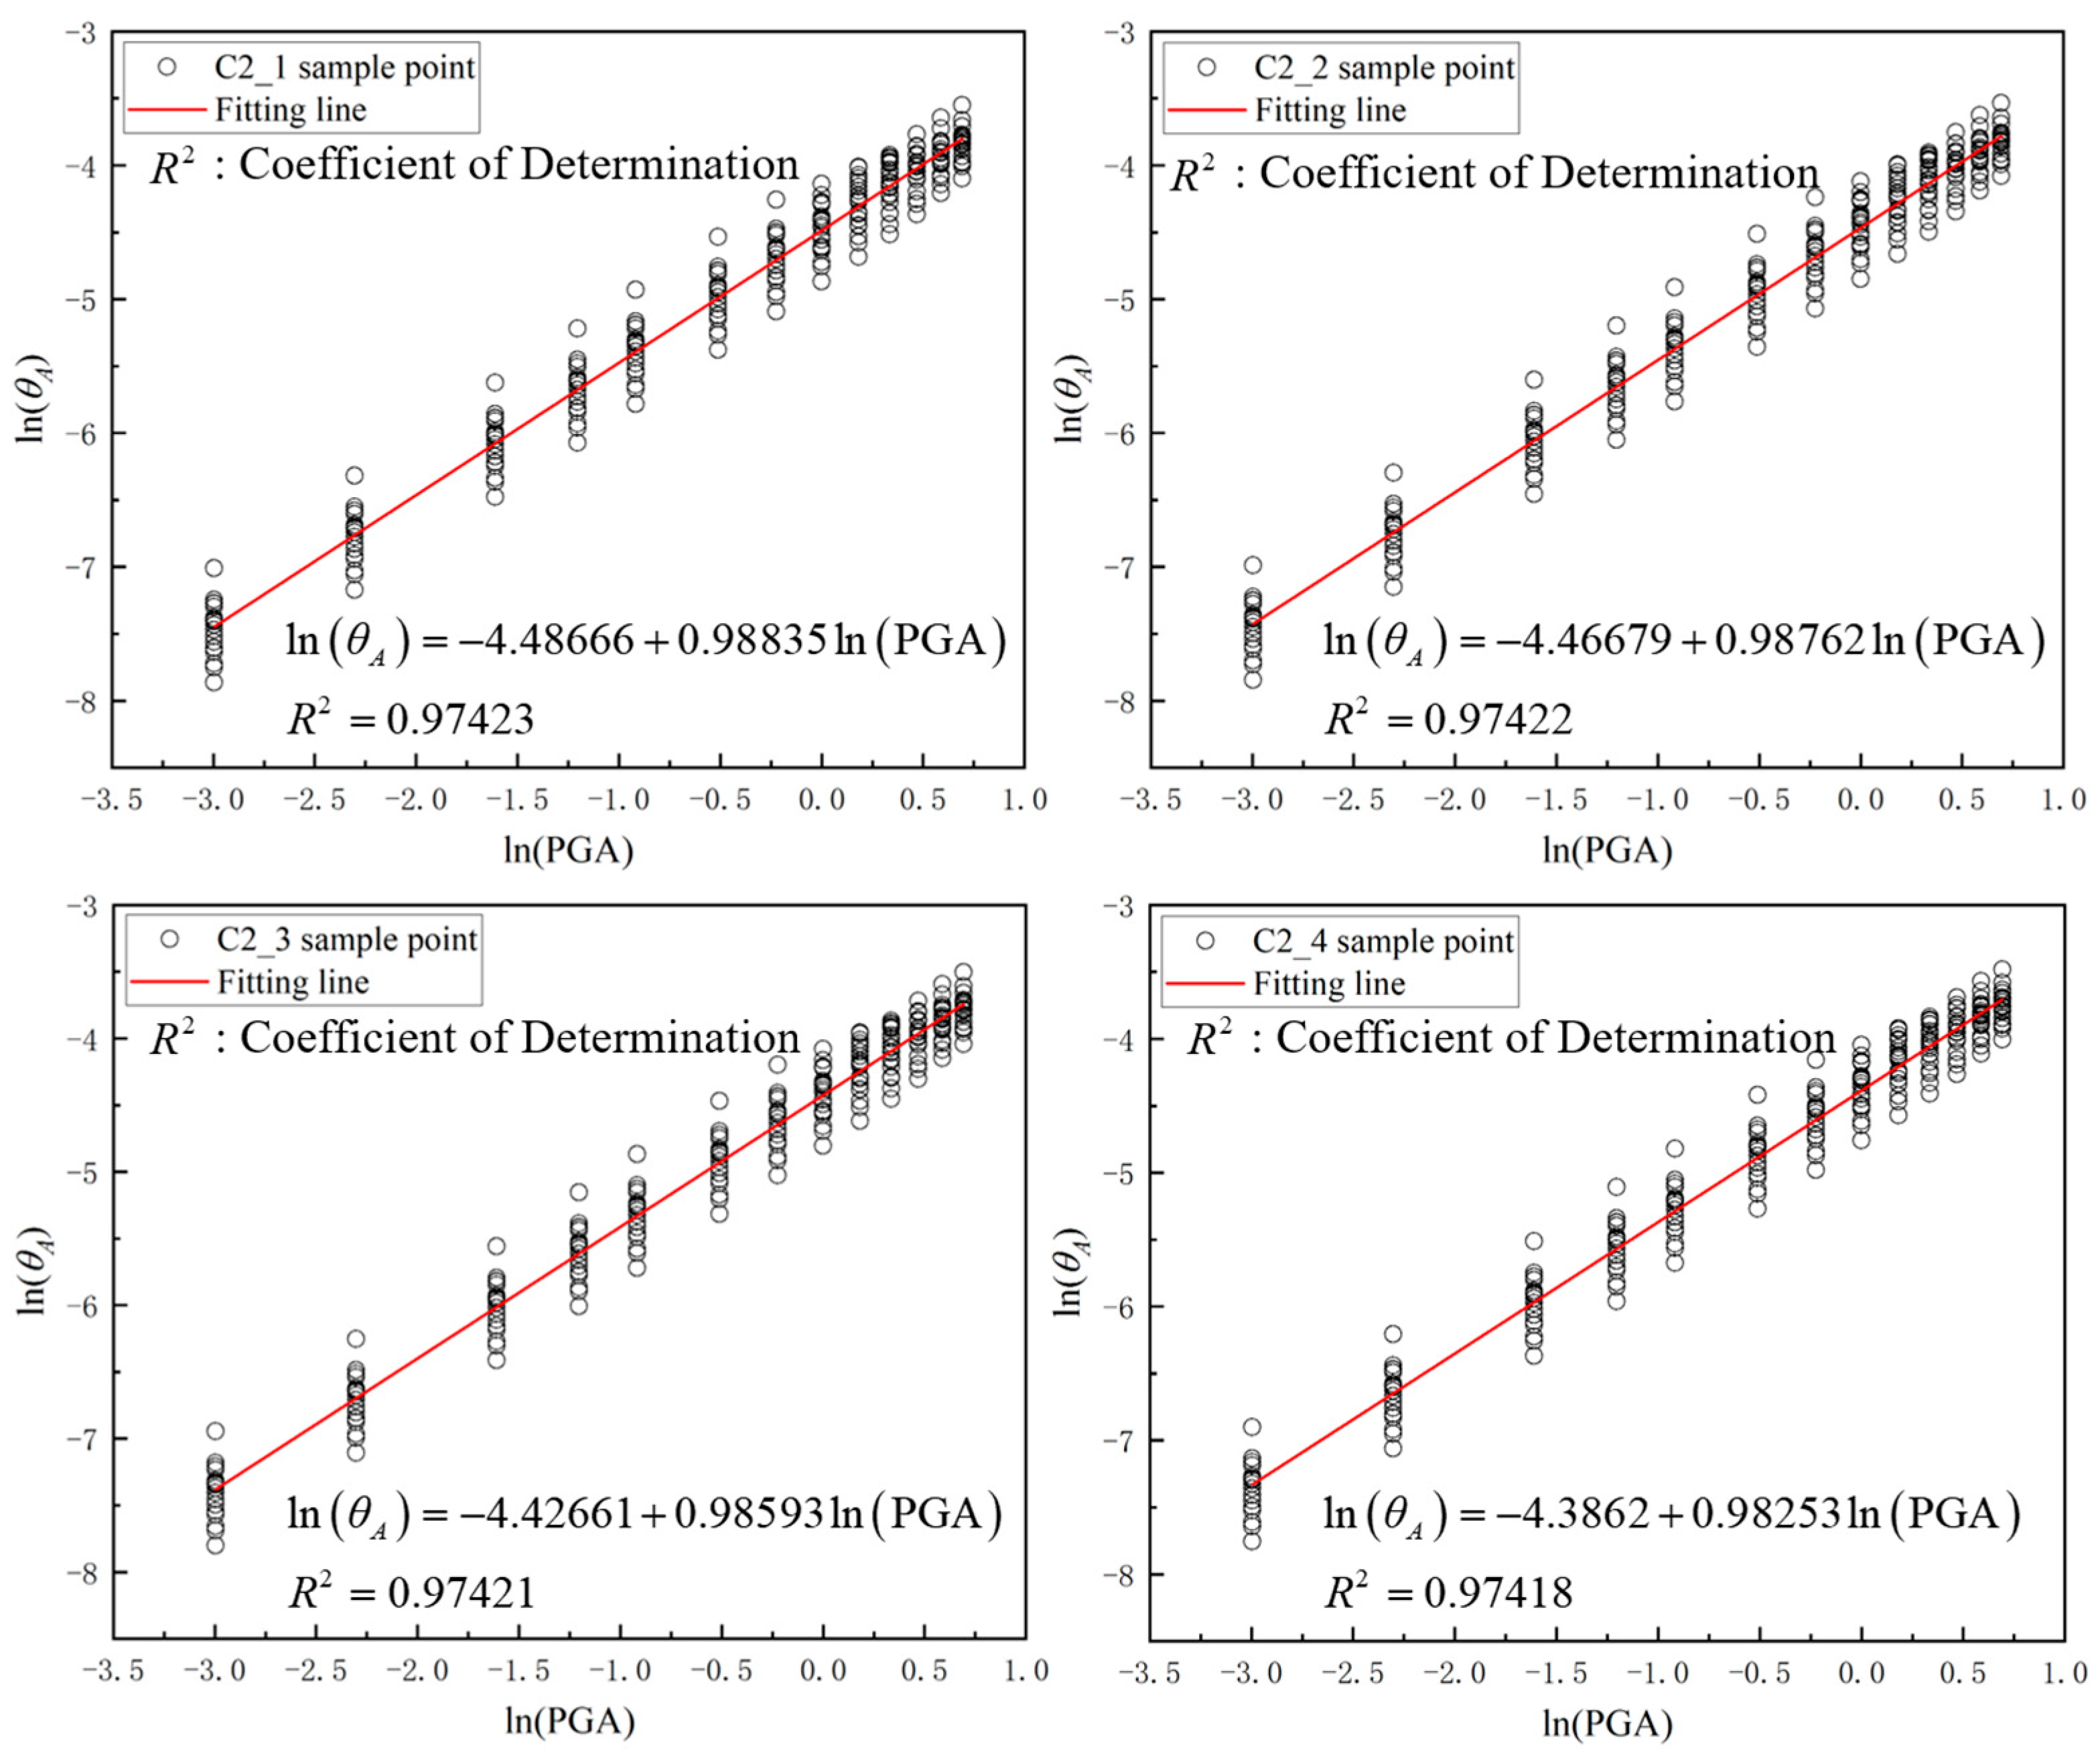
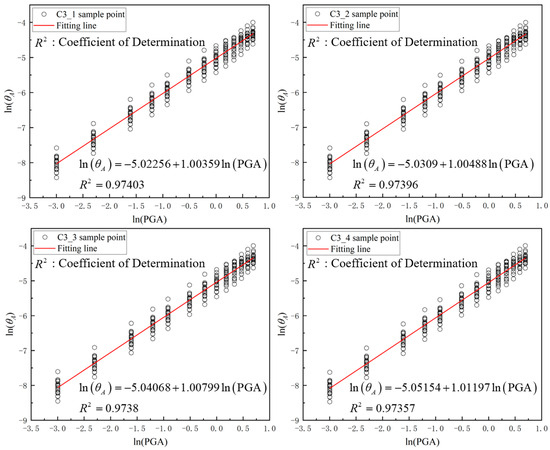
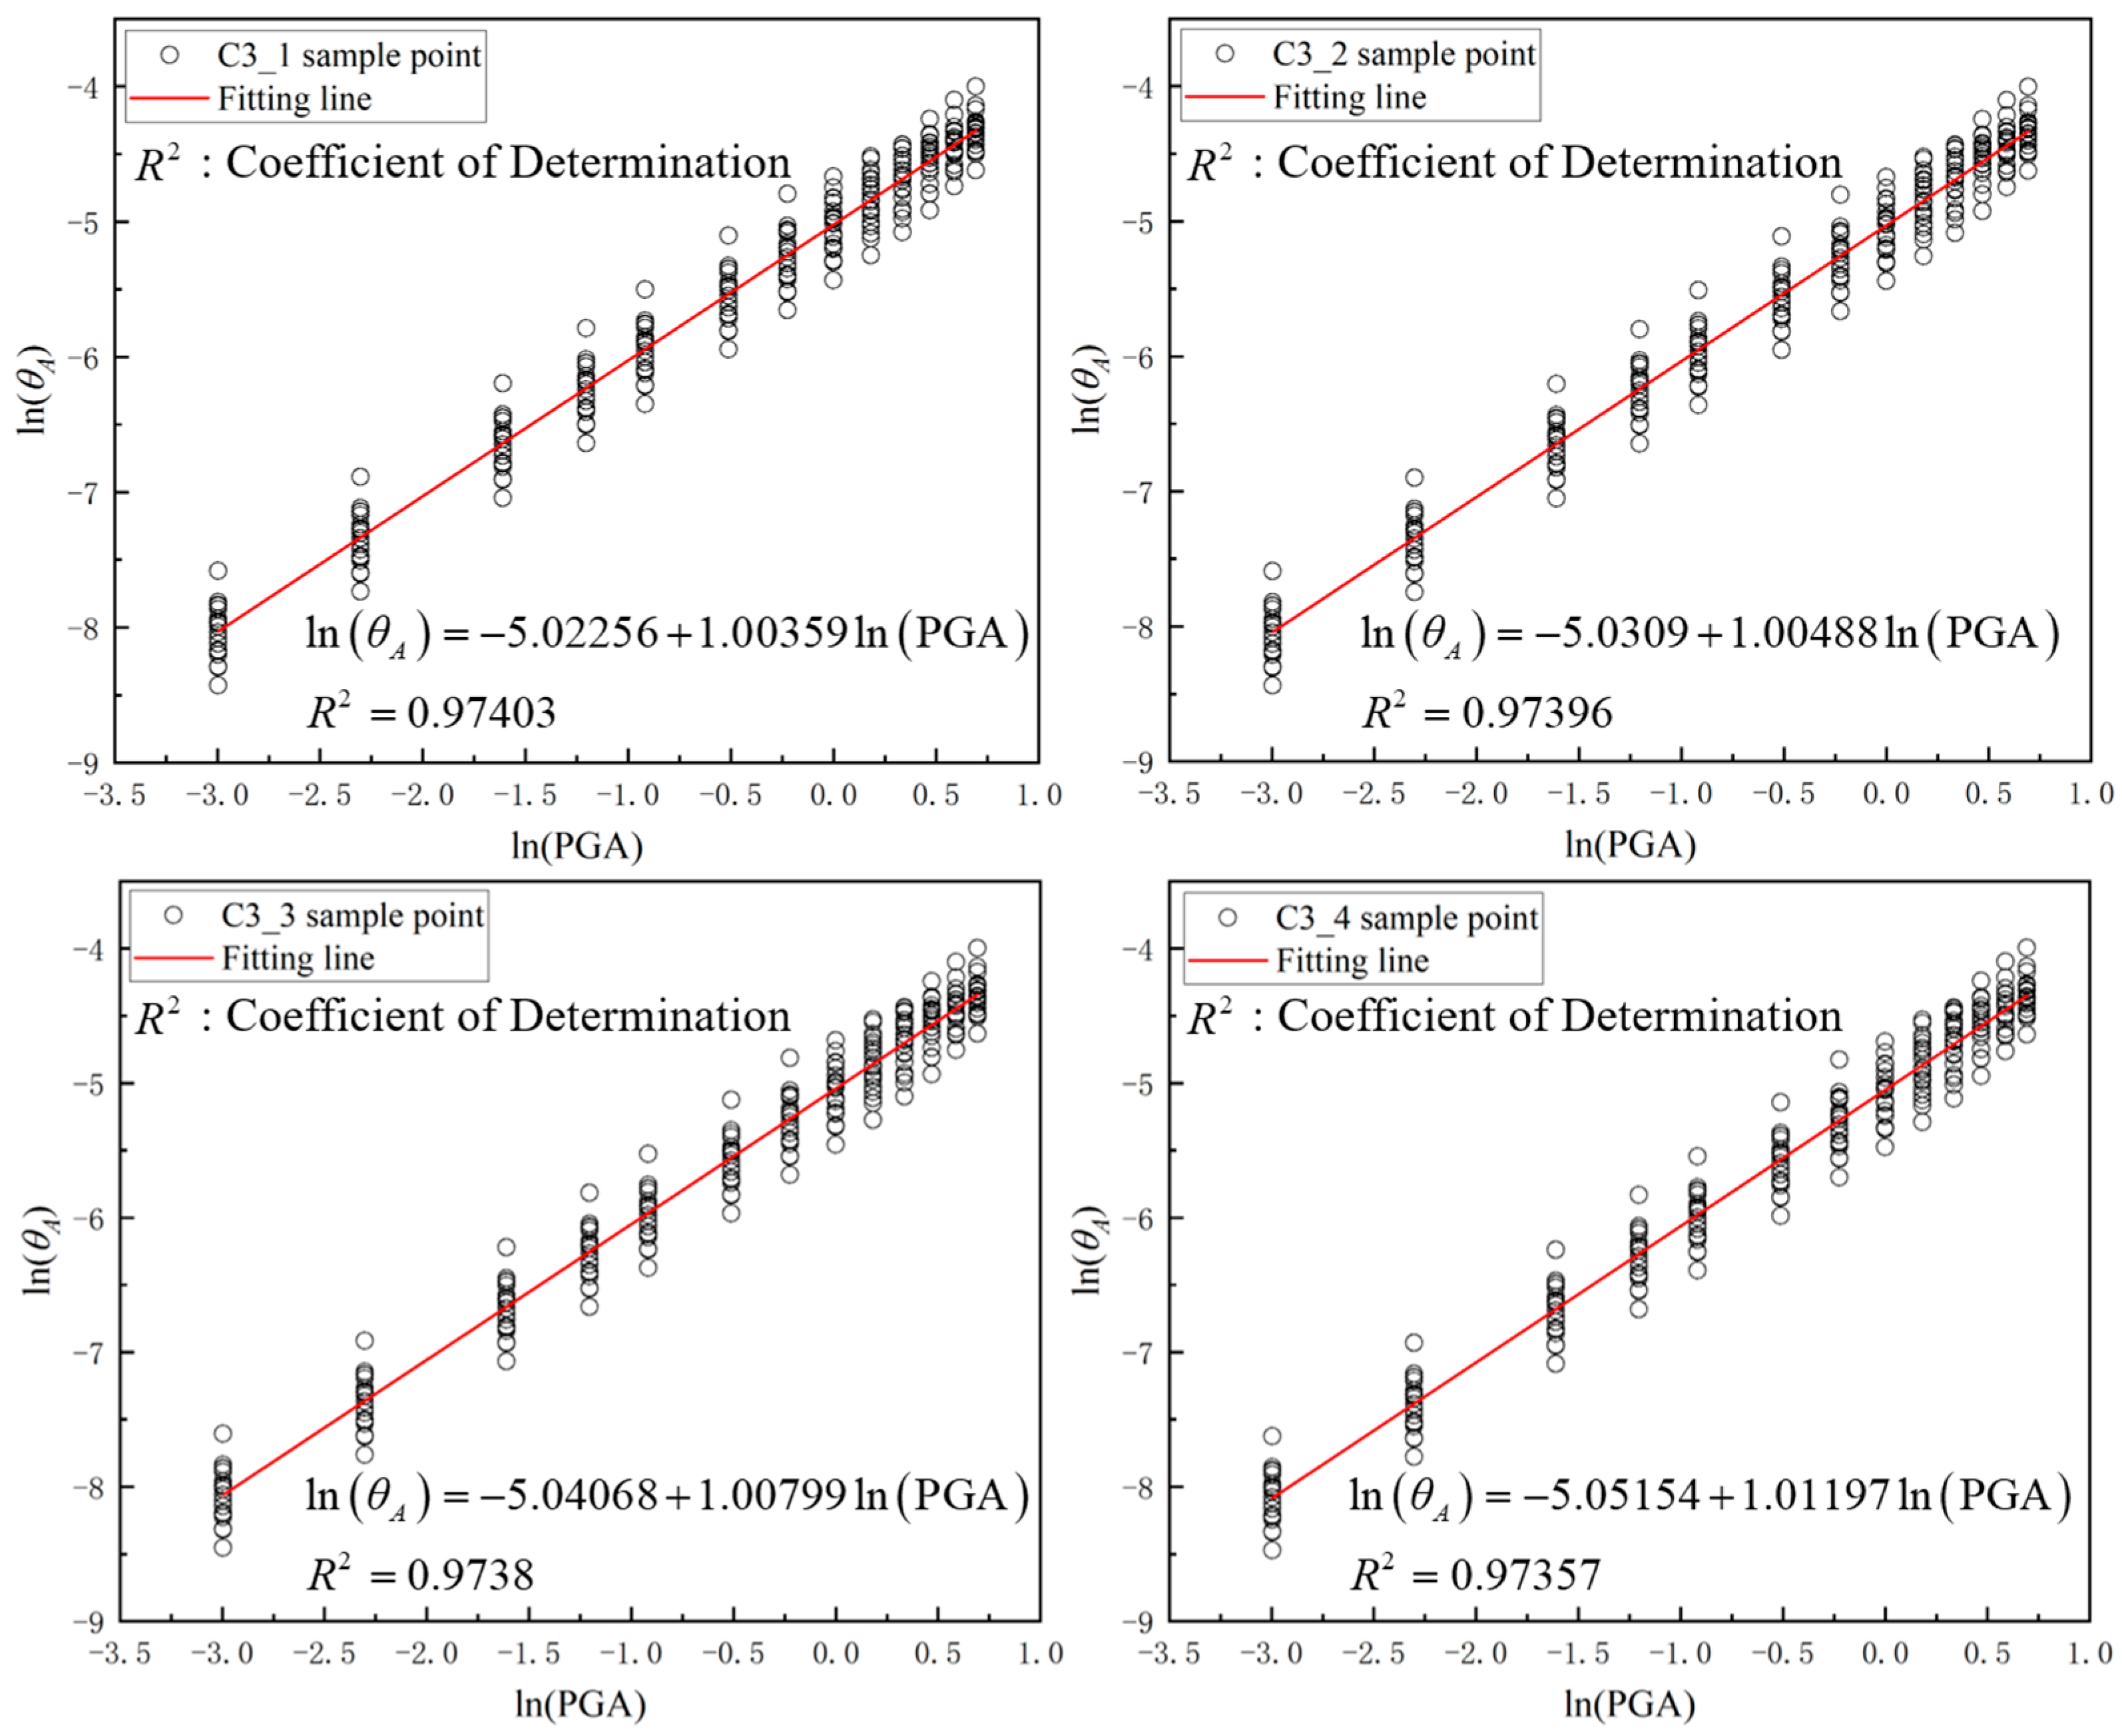
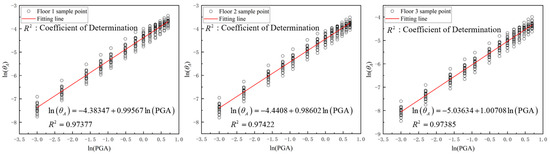
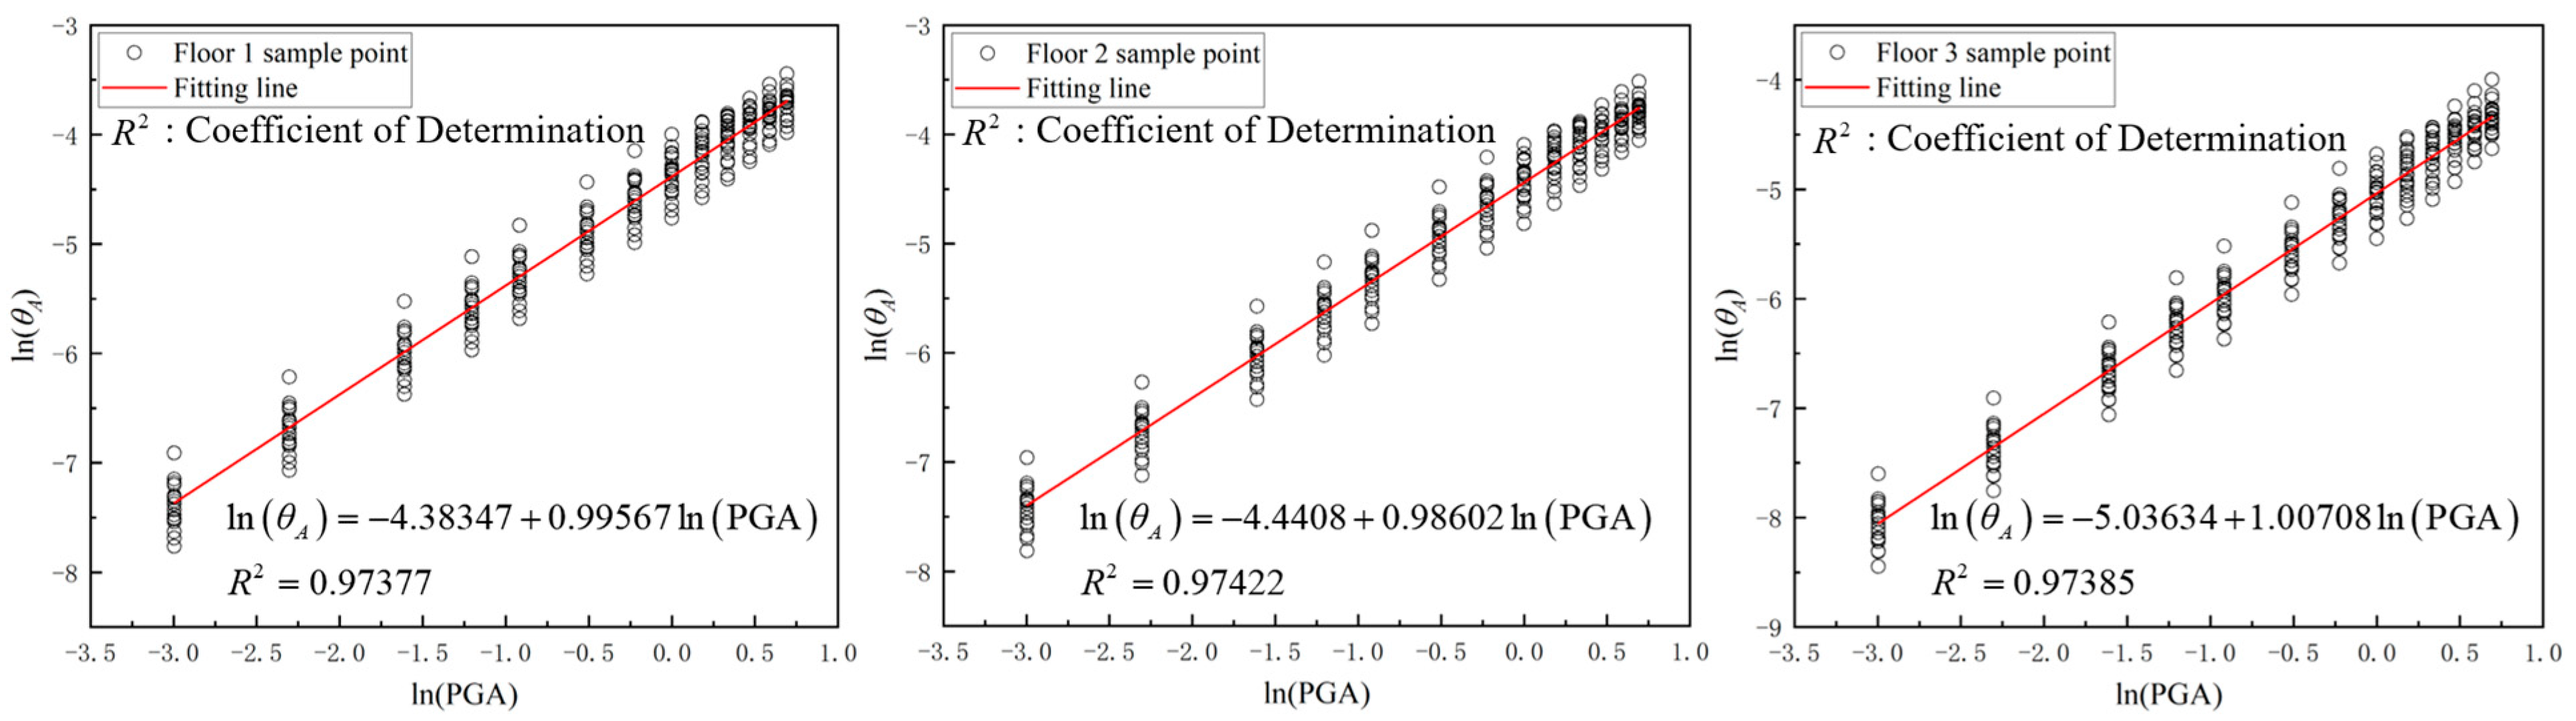
In this part, the seismic fragility analysis of the Diaojiao frame structure is carried out based on the seismic response calculation results of 260 working conditions of the Diaojiao frame structure. The linear regression fitting of probabilistic seismic demand analysis (PSDA) was carried out on C1_1, C1_2, C1_3, C1_4, C2_1, C2_2, C2_3, C2_4, C3_1, C3_2, C3_3, C3_4, Floor 1, Floor 2 and Floor 3 respectively by IDA results, so as to obtain the probability function of seismic demand value and ground motion parameters of the structure. The linear regression fitting results are shown in Figure 15, Figure 16, Figure 17 and Figure 18.
Figure 15.
Seismic demand model (C1_1, C1_2, C1_3, C1_4).
Figure 16.
Seismic demand model (C2_1, C2_2, C2_3, C2_4).
Figure 17.
Seismic demand model (C3_1, C3_2, C3_3, C3_4).
Figure 18.
Seismic demand model (Floor 1, Floor 2, Floor 3).
It can be seen from Figure 15, Figure 16, Figure 17 and Figure 18 that the determination coefficients in the fitting results are all greater than 0.9, which indicates that the fitting results are highly feasible. According to Table 4, the boundary value between BI and PD is 0.18%, the boundary value between PD and MD is 0.36%, the boundary value between MD and SD is 0.73%, and the boundary value between SD and ED is 2%. At the same time, the value and value of Floor 1 of the Diaojiao frame structure can be obtained by combining the expression (16), and then the seismic fragility curve of Floor 1 can be obtained. The seismic fragility curves of Floor 2, Floor 3 and the Diaojiao frame structure are obtained in the same way as above. Figure 15 is the seismic demand model for calculating the seismic fragility curve of Floor 1 of the structure. Figure 16 is the seismic demand model for calculating the seismic fragility curve of Floor 2 of the structure. Figure 17 is the seismic demand model for calculating the seismic fragility curve of Floor 3 of the structure. Figure 18 is the seismic demand model for calculating the seismic fragility curve of the Diaojiao frame structure. Based on the above conditions, the values of and are shown in Table 5.
Table 5.
value and value.
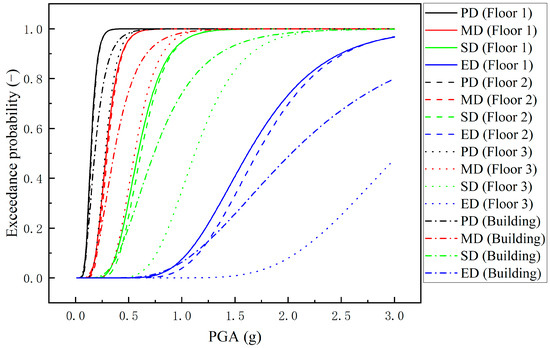
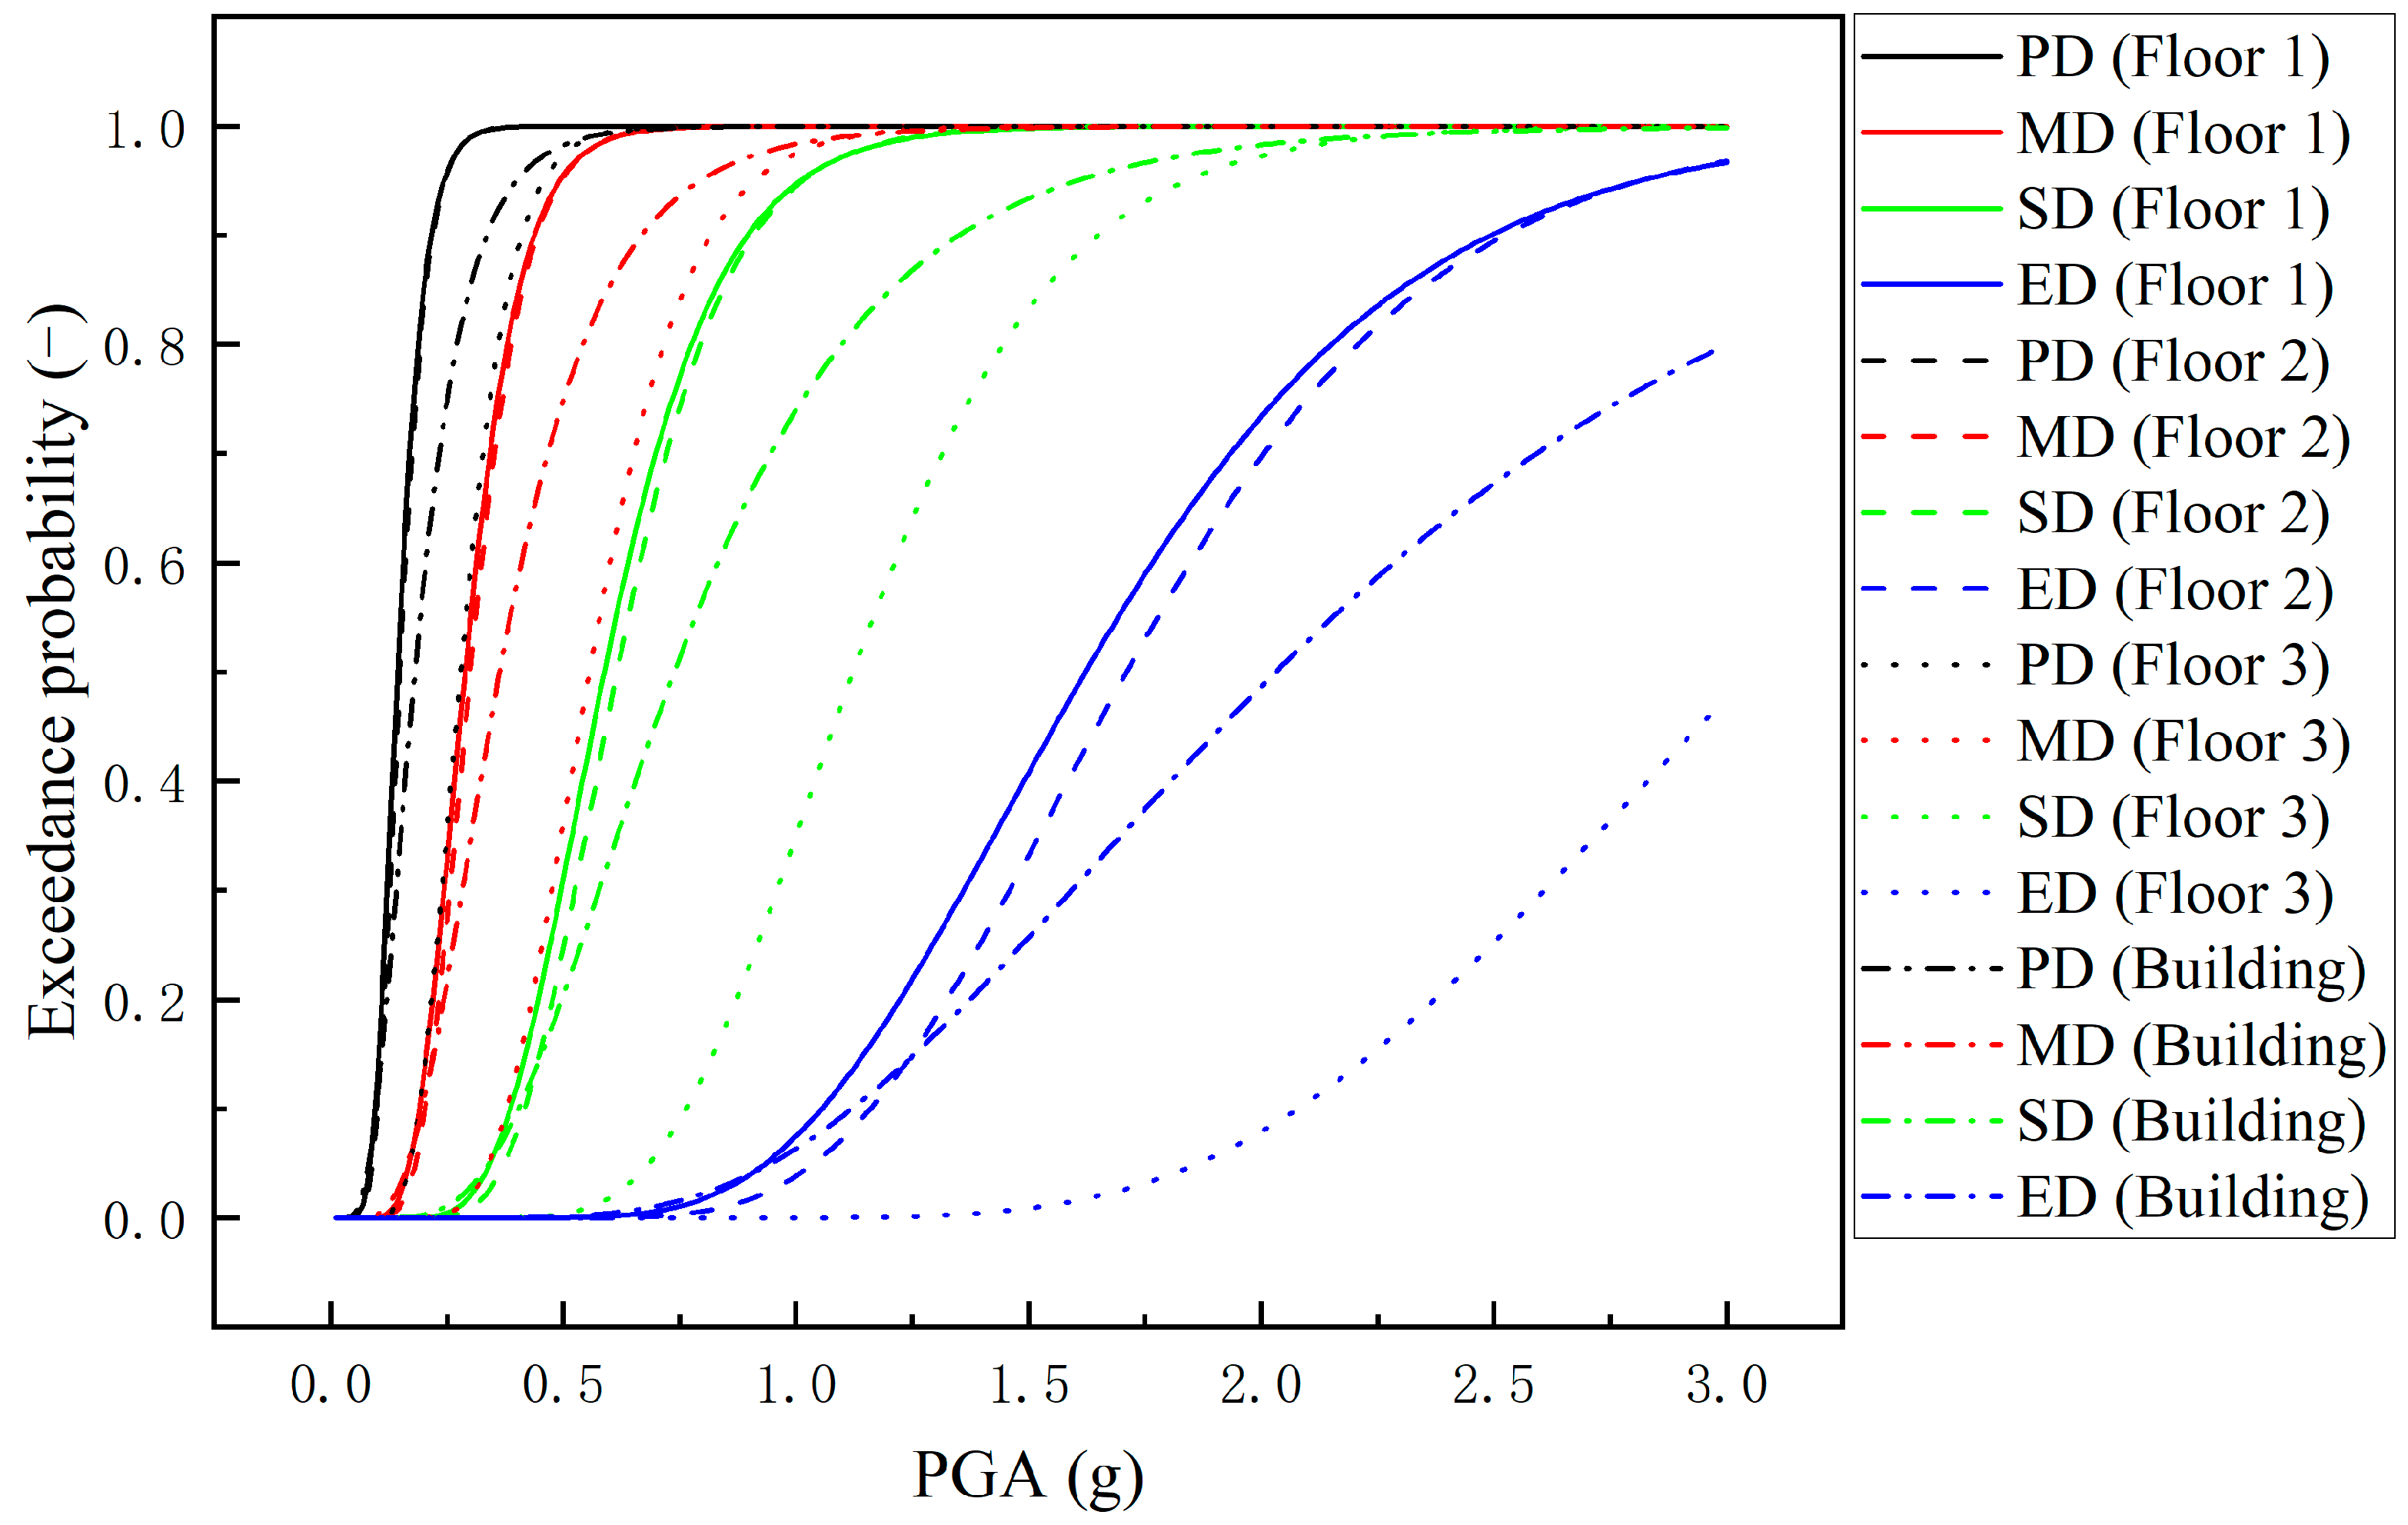
Based on the expression (15) and Table 5, the seismic fragility curves of Floor 1, Floor 2, Floor 3 and the Diaojiao frame structure are obtained (see Figure 19). According to ‘Code for seismic design of buildings’ (GB 50011-2010) [30], the peak acceleration of seismic waves under different seismic conditions is obtained (see Table 6). Based on Table 4 and Table 6 and Figure 19, the structural damage matrix of the structure under each limit state is obtained (see Table 7, Table 8, Table 9 and Table 10).
Figure 19.
Comparison of seismic fragility curves.
Table 6.
Peak acceleration of seismic waves under different seismic conditions (g).
Table 7.
Structural damage matrix (Floor 1).
Table 8.
Structural damage matrix (Floor 2).
Table 9.
Structural damage matrix (Floor 3).
Table 10.
Structural damage matrix (Building).
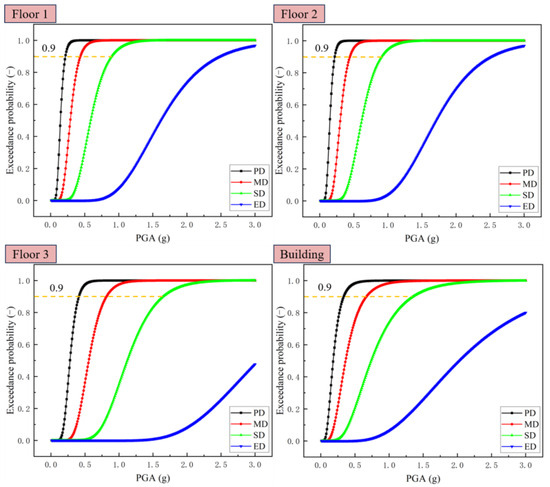
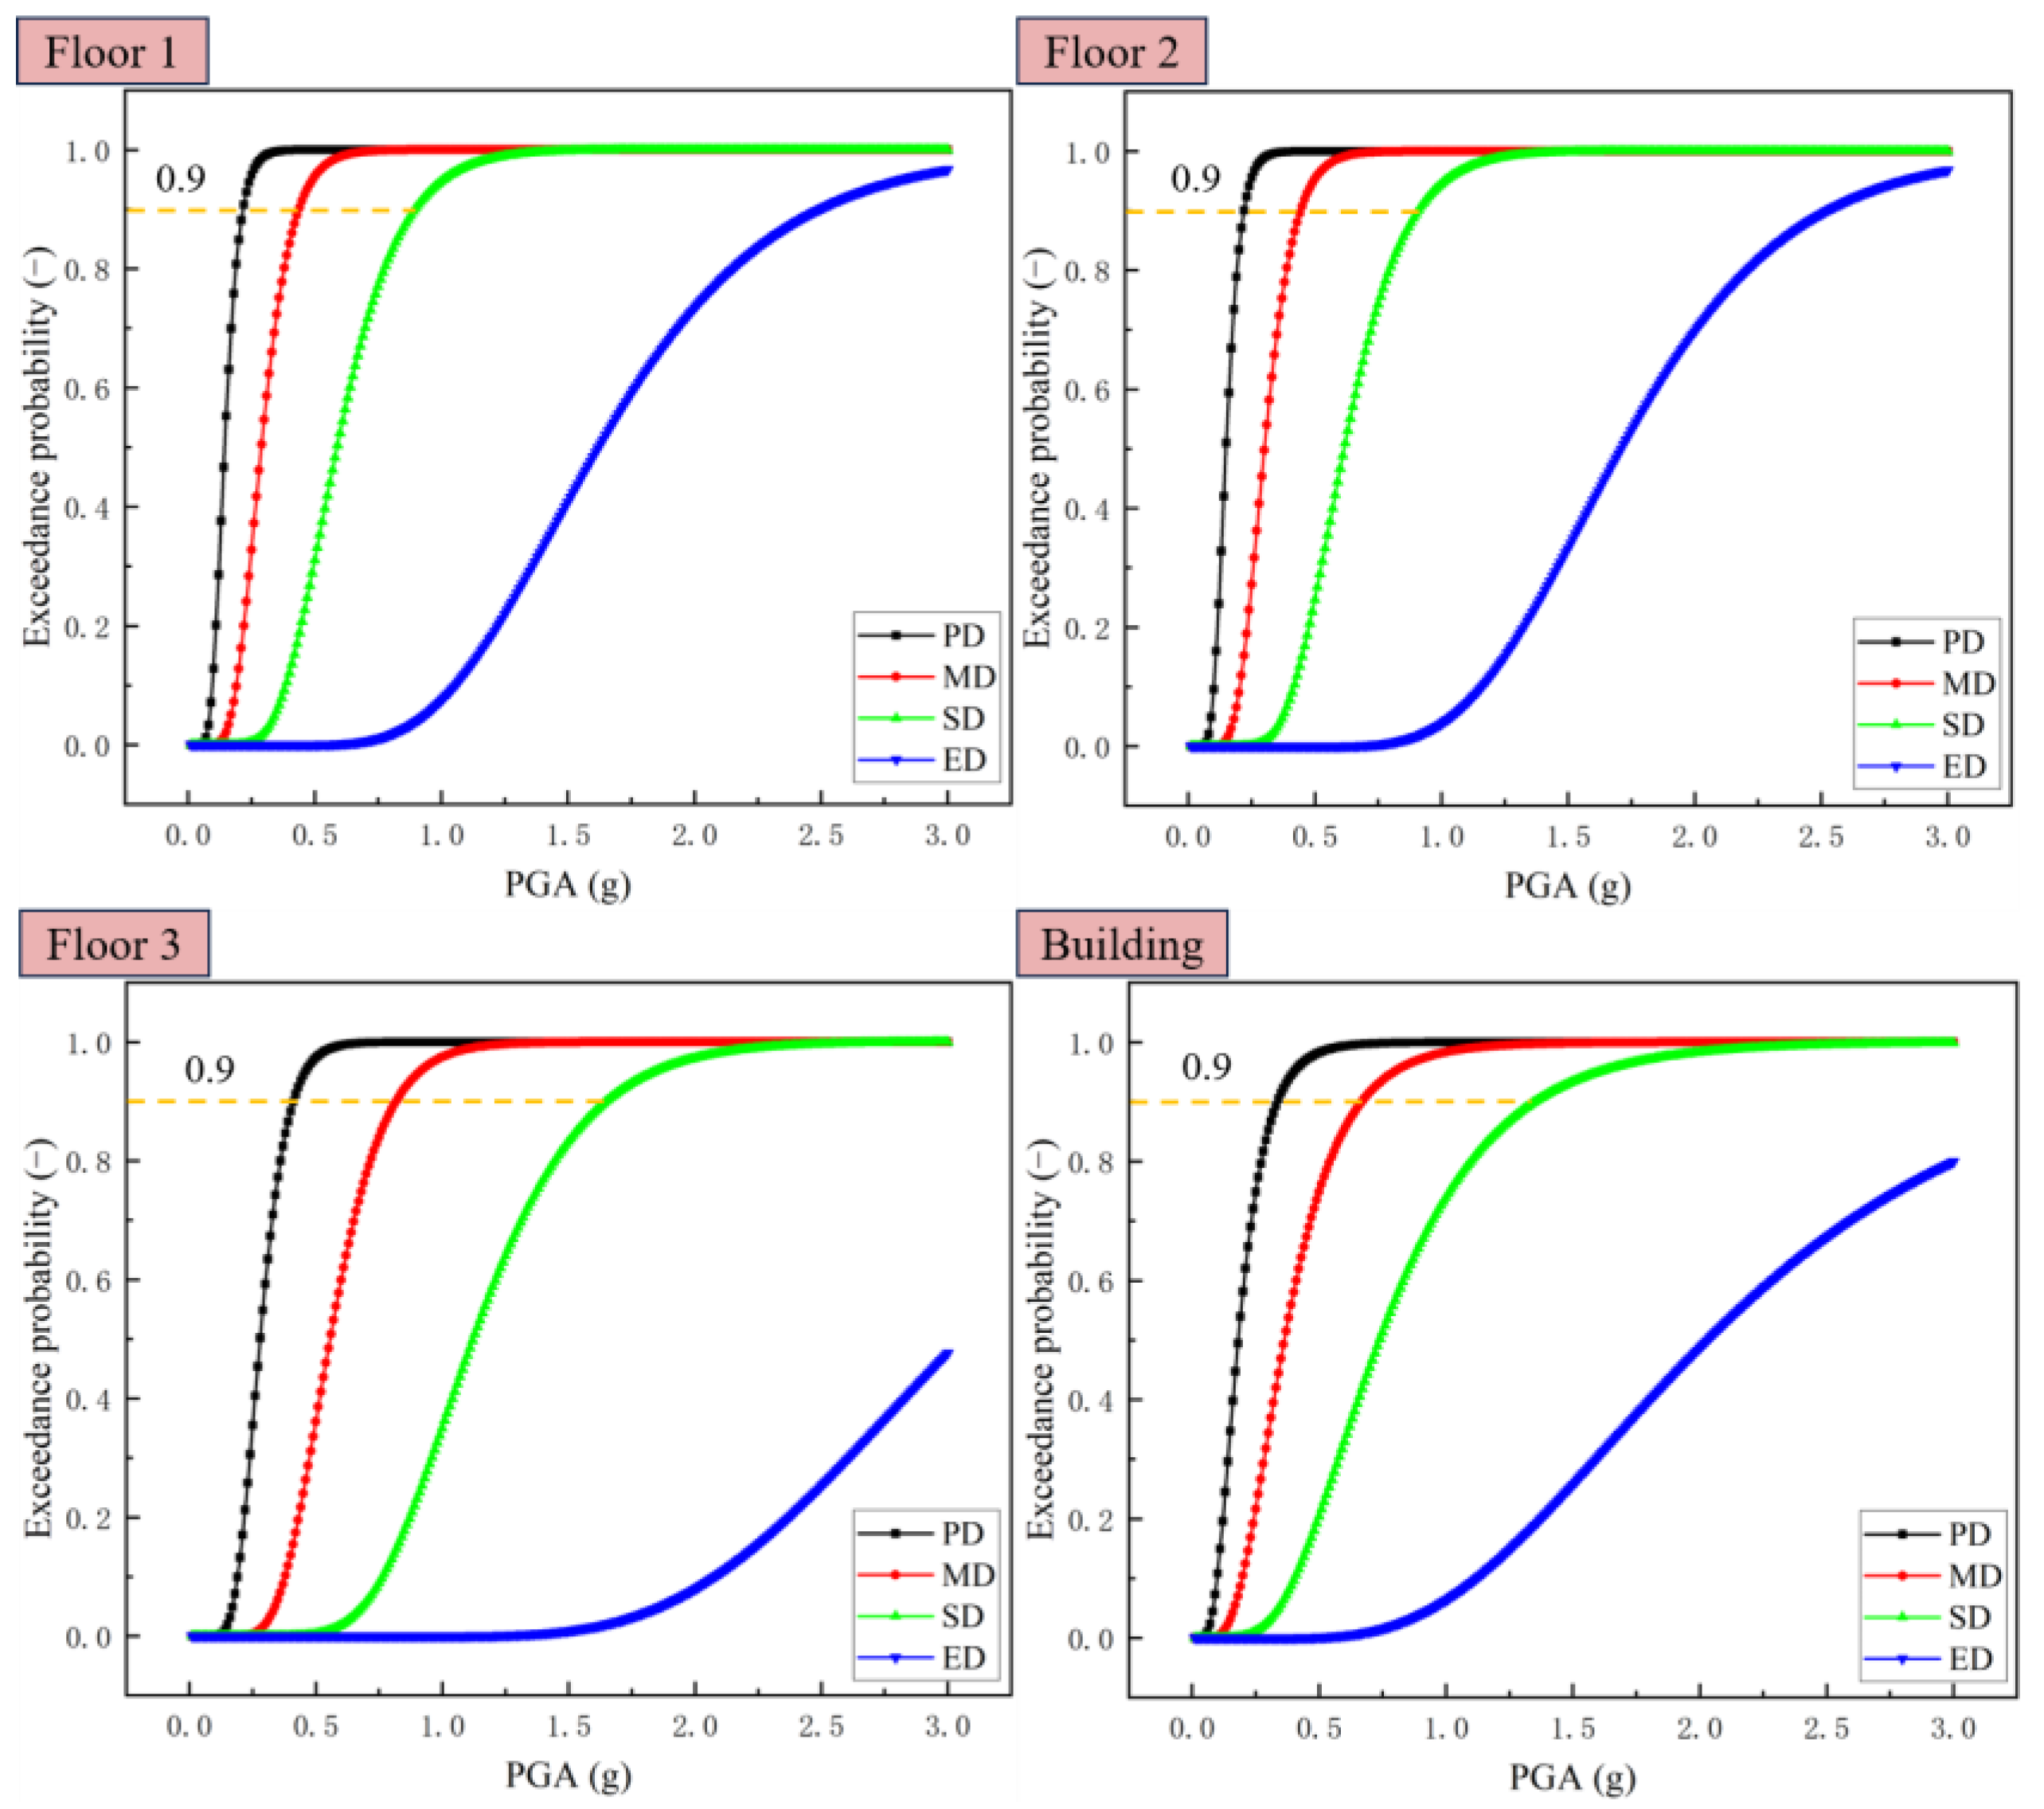
It can be seen from Figure 20 that with the increase in PGA, the exceedance probability shows a slow increase-straight rise-slow increase. And when the exceedance probability reaches 0.9, the seismic fragility curve gradually changes from a straight rise to a slow increase. In the real environment, it is difficult to monitor the interlayer displacement angle of the Diaojiao frame structure under the influence of ground motion. Therefore, in order to increase the damage evaluation accuracy of the Diaojiao frame structure after the earthquake, in this paper, the exceedance probability reaches 0.9 as the ordinate limit value, and the PGA is used to reclassify the damage state. The specific results are shown in Table 11. In the actual earthquake, the damage state of the RC Diaojiao frame structure can be quickly evaluated based on the PGA value of the earthquake site and Table 11, so as to take more effective emergency measures for the earthquake.
Figure 20.
Seismic fragility curve.
Table 11.
The relationship between damage state and PGA.
5. Conclusions
In this paper, the IDA method is used to explore the dynamic response characteristics and seismic fragility of the RC Diaojiao frame structure in the red bed area. The specific research results are as follows.
- (1)
- Under the influence of the Luding seismic wave, the damage law of the Diaojiao frame structure is Floor 1 > Floor 2 > Floor 3. The damage law of column 1 is C1_1 > C2_1 > C3_1, and the damage law of column 2 is C1_2 > C2_2 > C3_2. When PGA is less than or equal to 1.2 g, the damage law of column 3 is C1_3 < C2_3 > C3_3. When PGA is greater than 1.2 g, the damage law of column 3 is C1_3 > C2_3 > C3_3. The damage law of column 4 is C1_4 < C2_4 > C3_4. The damage law of Floor 1 is C1_1 > C1_2 > C1_3 > C1_4. The damage law of Floor 2 is C2_4 > C2_3 > C2_2 > C2_1. The damage law of Floor 3 is C3_1 > C3_2 > C3_3 > C3_4.
- (2)
- Through the structural damage matrix, it can be found that the probability of structural damage is very small when 7-degree frequent earthquakes and 8-degree frequent earthquakes occur, so the influence of the above seismic intensity can be ignored. The maximum probabilities of Floor 1, Floor 2, Floor 3 and the building in the ED state are 0.24%, 0.05%, 0.00%, and 0.58%, respectively. This shows that the Diaojiao frame structure built on red sandstone is difficult to collapse in a large area even if it is affected by a 9-degree maximum considered earthquake. In the SD state, the high probability events of Floor 1, Floor 2, Floor 3 and the building mainly occur with the 9-degree maximum considered earthquake, and the probability is 58.25%, 53.03%, 2.71%, 36.79%, respectively. This shows that when a maximum considered earthquake of 9 degrees occurs, the SD state mainly occurs on Floor 1 and Floor 2, and the probability of the SD state of the building is relatively small.
- (3)
- Based on the development law of seismic fragility curves, the PGA is used to reclassify the damage state. The damage states are elastic state, elastic-plastic state, plastic state and large deformation state. When the structure is in the elastic state, the structure can be used normally without repair. When the structure is in the elastic-plastic state, the structure needs to be repaired before it can be used. When the structure is in the plastic state and large deformation state, the structure is not repairable and needs to be removed as soon as possible to reduce the probability of secondary damage after the earthquake. In the actual earthquake, the damage evaluation of the Diaojiao frame structure can be carried out quickly and accurately by the PGA value of the earthquake site. And then more effective emergency measures can be taken.
- (4)
- This paper explores the seismic fragility characteristics of the Diaojiao frame structure in the red bed area of the Luding area, and provides some reference for the initial damage evaluation of the Diaojiao frame structure and the selection of emergency measures. However, the structural type of this study is relatively rare, and there is no research on various types of Diaojiao frame structures, and only deterministic research has been carried out. In the follow-up study, uncertainty research will be carried out on various types of Diaojiao frame structures. At the same time, machine learning is used to establish the seismic fragility database of the Diaojiao frame structure in the Luding area, and the intelligent damage evaluation and emergency management are constructed.
Author Contributions
All authors contributed to the study conception and design. Formal analysis, A.L., C.Y., X.Z. and K.X.; Investigation, A.L., C.Y., X.Z. and K.X.; Validation, A.L., C.Y., X.Z. and K.X.; Writing—original draft, W.Z. All authors have read and agreed to the published version of the manuscript.
Funding
This work was financially supported by the Sichuan Education Informatization Application and Development Research Center (Grant No. JYXX202503), the Sichuan Provincial Education Development Research Center (Grant Nos. CJF25101 and CJF24050), and the Scientific Research Fund Project of Chengdu Agricultural College (Grant No. 25BS09).
Data Availability Statement
The original contributions presented in the study are included in the article; further inquiries can be directed to the corresponding author.
Conflicts of Interest
We, the authors, declare that there are no conflicts of interest associated with this manuscript. We confirm that the research was conducted independently and free from any commercial or financial relationships that could be construed as potential conflicts of interest.
References
- Li, M.; Feng, W.; Wang, W.; Qian, G. Global overview of earthquake disasters in 2024. China Earthq. Eng. J. 2025, 47, 1149–1157. [Google Scholar] [CrossRef]
- Li, Y.H.; Zheng, S.S.; Dong, L.G.; Wang, D.L.; Sang, Z.W. Seismic capacity evaluation of corroded reinforced concrete frame structures. Arch. Civ. Mech. Eng. 2024, 25, 21. [Google Scholar] [CrossRef] [Scilit]
- Qiu, D.P.; Chen, J.Y.; Cao, X.Y. Study on the seismic control measure of the underground large-scale frame structure. Structures 2022, 40, 328–343. [Google Scholar] [CrossRef] [Scilit]
- He, Z.R.; Zhang, X.H.; Yang, H.L.; Li, S.; Cai, J.G.; Satyanaga, A.; Zhang, R.Z.; Dai, G.L. Numerical Simulation of Cluster-Connected Shear Wall Structures under Seismic Loading. Buildings 2024, 14, 2247. [Google Scholar] [CrossRef] [Scilit]
- Sun, X.F.; He, M.J.; Li, Z.; Lam, F. Seismic performance assessment of conventional CLT shear wall structures and post-tensioned CLT shear wall structures. Eng. Struct. 2019, 196, 109285. [Google Scholar] [CrossRef] [Scilit]
- Deng, X.S.; Li, Z.K.; Wang, Y.; Zhou, Z.J.; Zhu, Y.L. Seismic risk assessment for precast RC frame-shear wall structures subject to mainshock-aftershock sequences. Structures 2025, 76, 108977. [Google Scholar] [CrossRef] [Scilit]
- Pang, R.; Sun, Y.Y.; Xu, Z.; Xu, K.; Cui, J.; Dang, L.J. Shaking table test and numerical simulation of a precast frame-shear wall structure with innovative untopped precast concrete floors. Eng. Struct. 2024, 300, 117162. [Google Scholar] [CrossRef] [Scilit]
- Bu, G.B.; Chen, K.X.Y.; Zhou, J.; Ma, X.Y.; Xu, C.; Liu, F.C.; He, A. Seismic fragility assessment of eccentric gravity column-core tube structures subjected to pulse-like ground motions. Structures 2024, 69, 107406. [Google Scholar] [CrossRef] [Scilit]
- Li, Z.H.; Chen, L.; Teng, J. A Comparative Test Study on the Seismic Damage Sustained by Frame-Core Tube Structures. Adv. Civ. Eng. 2019, 2019, 3202959. [Google Scholar] [CrossRef] [Scilit]
- Gong, J.; Shao, Y.B. Seismic response and joint fragility of UHV long-span truss structures with PGA and duration as variables. Structures 2024, 64, 106550. [Google Scholar] [CrossRef] [Scilit]
- Wang, D.W.; Shang, M.F.; Sun, P.X. Quantitative Evaluation of Seismic Performance for Truss Structures Based on the Condition Number of Dynamic Matrix. Int. J. Struct. Stab. Dynamics 2023, 23, 2350153. [Google Scholar] [CrossRef] [Scilit]
- Yang, J.; Liang, S.T.; Zhu, X.J.; Dang, L.J. Shaking table testing of the reinforced concrete staggered slab-column structure. Adv. Struct. Eng. 2022, 25, 1943–1958. [Google Scholar] [CrossRef] [Scilit]
- Ministry of Emergency Management of the People’s Republic of China. Available online: https://www.mem.gov.cn/gk/zfxxgkpt/fdzdgknr/202207/t20220721_418698.shtml (accessed on 11 February 2026).
- Cui, F.K.; Guan, G.Z.; Cui, L.; Li, M.; Deng, S.W.; Li, H.H. Seismic Fragility Assessment of RC Columns Exposed to the Freeze-Thaw Damage. Buildings 2023, 13, 126. [Google Scholar] [CrossRef] [Scilit]
- Wang, M.G.; Zhang, H.; Dai, H.Z.; Shen, L.M. A deep learning-aided seismic fragility analysis method for bridges. Structures 2022, 40, 1056–1064. [Google Scholar] [CrossRef] [Scilit]
- Wu, C.; Huang, S.M.; Jiang, H.J.; Wu, S.Y. Seismic fragility analysis of suspended cable trays in civil buildings. Eng. Struct. 2023, 290, 116424. [Google Scholar] [CrossRef] [Scilit]
- Xu, M.Z.; Cui, C.Y.; Zhao, J.T.; Xu, C.S.; Zhang, P.; Su, J. Fuzzy seismic fragility analysis of underground structures considering multiple failure criteria. Tunn. Undergr. Space Technol. 2024, 145, 105614. [Google Scholar] [CrossRef] [Scilit]
- Jin, S.; Jiang, D.; Zhai, C.H.; Cao, X.Y.; Yao, Q.Q.; Xu, W.L. Seismic fragility analysis of nuclear containment structure with Bayesian cloud analysis framework. Structures 2024, 69, 107519. [Google Scholar] [CrossRef] [Scilit]
- Yan, Y.X.; Xia, Y.; Sun, L.M. Hierarchical and mixed uncertainty quantification for simulation-based structural seismic. Eng. Struct. 2024, 316, 118579. [Google Scholar] [CrossRef] [Scilit]
- Yan, X.Y.; Shi, S.; Wang, F.X.; Mao, H.M. Seismic fragility analysis of prefabricated self-centering frame structure. J. Constr. Steel Res. 2024, 220, 108843. [Google Scholar] [CrossRef] [Scilit]
- Zhang, S.R.; Tan, J.B.; Li, S.H.; Hu, Y.C. Performance-Based Seismic Fragility Analysis of a Double-Tower Structure with a Large Podium. J. Vib. Eng. Technol. 2024, 12, 2353–2369. [Google Scholar] [CrossRef] [Scilit]
- Jin, S.; Zhai, C.H.; Liu, J.; Jiang, D.; Wang, D.M.; Wang, S.J.; Zhou, Y.K. Seismic fragility analysis of nuclear containment structure using Bayesian logistic regression model. Soil Dyn. Earthq. Eng. 2024, 178, 108435. [Google Scholar] [CrossRef] [Scilit]
- Zhang, Y.Q.; Wang, Z.L.; Jiang, L.X.; Skalomenos, K.; Zhang, D.B. Seismic fragility analysis of masonry structures considering the effect of mainshock-aftershock sequences. Eng. Struct. 2023, 275, 115287. [Google Scholar] [CrossRef] [Scilit]
- Wang, M.; Gao, X.L.; Ning, C.L. Seismic fragility analysis method of building structures integrated with probabilistic seismic hazard analysis. J. Build. Eng. 2025, 107, 112753. [Google Scholar] [CrossRef] [Scilit]
- Ruggieri, S.; Nettis, A.; Calò, M.; Uva, G. A multidimensional discrete sampling method for deriving regional level seismic fragility and losses of RC existing buildings. Int. J. Disaster Risk Reduct. 2025, 129, 105788. [Google Scholar] [CrossRef] [Scilit]
- Lu Ding Xian Zhi. Available online: https://www.scfzg.cn/#/list?id=e6bff03dfb4f4378b7c7a7a92ad5d907 (accessed on 11 February 2026).
- Culshaw, M.G.; Ulusay, R. (Eds.) The ISRM suggested methods for rock characterization, testing and monitoring: 2007–2014. Bull. Eng. Geol. Environ. 2015, 74, 1499–1500. [Google Scholar] [CrossRef] [Scilit]
- GB 50010-2010; Code for Design of Concrete Structures. China Architecture & Building Press (CABP): Beijing, China, 2010.
- JGJ3-2010; Technical Specification for Concrete Structures of Tall Building. China Architecture & Building Press (CABP): Beijing, China, 2010.
- GB 50011-2010; Code for Seismic Design of Buildings. China Architecture & Building Press (CABP): Beijing, China, 2010.
- Dong, Y.; Wang, G.; Wang, J.; Du, X. Strain rate effect in seismic nonlinear responses of concrete arch dam. J. Vib. Shock. 2023, 42, 71–80+118. [Google Scholar] [CrossRef]
- Gui, B.; Zhang, L. Analysis of Seismic Capacity of Concrete Gravity Dam Based on P-D-ε Curve. Water Resour. Power 2020, 38, 95–97. [Google Scholar] [CrossRef]
- Liu, P.; Zhao, Q. Numerical Model Study of Concrete Under Cyclic Load. Mater. Rep. 2025, 39, 261–265. [Google Scholar]
- Wu, D.; Lu, Y.; Wang, Y.; Xu, S.; Wang, W.; Peng, X. Study on equivalent elastic modulus of reinforced tenon precast shear walls. J. Jiangsu Univ. Sci. Technol. (Nat. Sci. Ed.) 2023, 37, 115–122. [Google Scholar] [CrossRef]
- Su, L.; Huang, J.; Meng, Q.; Zheng, Y.; Chen, W. Seismic Fragility Analysis of Immersed Tunnel based on IDA Method. Highway 2025, 70, 314–321. [Google Scholar]
- Pacific Earthquake Engineering Research Center. Available online: https://peer.berkeley.edu/ (accessed on 2 March 2026).
- Shi, J.; Ren, Z.; Chen, C.; Kong, H.; Cui, M. Seismic vulnerability analysis of a proposed 636m super high-rise building. Build. Struct. 2026, 56, 32–39. [Google Scholar] [CrossRef]
- Huang, J.; Tian, S.; Gu, Q.; Chen, J. Seismic fragility analysis of precast concrete frame structure considering nonlinear joint behavior. Build. Sci. 2025, 41, 11–20. [Google Scholar] [CrossRef]

Disclaimer/Publisher’s Note: The statements, opinions and data contained in all publications are solely those of the individual author(s) and contributor(s) and not of MDPI and/or the editor(s). MDPI and/or the editor(s) disclaim responsibility for any injury to people or property resulting from any ideas, methods, instructions or products referred to in the content. |
© 2026 by the authors. Licensee MDPI, Basel, Switzerland. This article is an open access article distributed under the terms and conditions of the Creative Commons Attribution (CC BY) license.